Article

Transient Numerical Simulation of the Melting and Solidification Behavior of NaNO3 Using a Wire Matrix for Enhancing the Heat Transfer

Institute for Energy Systems and Thermodynamics, Technische Universität Wien, Getreidemarkt 9, 1060 Vienna, Austria
*
Author to whom correspondence should be addressed.
Energies 2016, 9(3), 205; https://doi.org/10.3390/en9030205
Submission received: 19 January 2016 / Revised: 26 February 2016 / Accepted: 8 March 2016 / Published: 16 March 2016

Abstract

:
The paper presents the results of a transient numerical investigation of the melting and solidification process of sodium nitrate (NaNO3), which is used as phase change material. For enhancing the heat transfer to the sodium nitrate an aluminum wire matrix is used. The numerical simulation of the melting and solidification process was done with the enthalpy-porosity approach. The numerical analysis of the melting process has shown that apart from the first period of the charging process, where heat conduction is the main heat transfer mechanism, natural convection is the dominant heat transfer mechanism. The numerical investigation of the solidification process has shown that the dominant heat transfer mechanism is heat conduction. Based on the numerical results, the discharging process has been slower than the charging process. The performance of the charged and discharged power has shown that the wire matrix is an alternative method to enhance the heat transfer into the phase change material.

1. Introduction

The aim of the European Union is a reduction of the greenhouse gas emissions (referred to 1990) as well as an increase of the energy efficiency of 20% till 2020. To achieve this ambitious goal, it is necessary to increase the target share of renewable energies in the energy consumption as well as the energy efficiency. This relates to the situation that renewable energies, energy storage and energy distribution will be the most important and strongly growing markets for the next decades and hence also key topics for research and development.
The storage of thermal energy is a special form of energy storage. Beside the simple storage and release of heat, thermal energy storage systems can play an important role in electricity production in case of an integration into a thermodynamic cycle (Rankine, Brayton, etc.). To store thermal energy from, e.g., superheated steam, a storage system based on latent heat is necessary to store the heat of condensation in an exergetically optimal way. In such a system, the thermal energy transfer occurs when a so called phase change material (PCM) changes the aggregate state (phase) from, e.g., solid to solid, solid to liquid, liquid to gas, or solid to gas and vice versa. Initially, the temperature of PCMs increases like a conventional sensible storage material as they absorb heat until it reaches the melting point. Compared to sensible storage materials, a PCM absorbs and releases heat at a nearly constant temperature during the phase change and they can store 5–14 times more heat per unit volume than sensible storage materials such as water, sand, or rock [1]. This results in a significant reduction of the storage volume using PCMs as storage material compared to sensible heat storage. That means that the latent heat thermal energy storage system (LHTES) has a higher energy density compared to sensible storage systems. A further advantage of the latent heat thermal energy storage system is that the charging and discharging process takes place at small temperature differences.
The selection of the PCM material used in an application depends on the process parameters as well as the thermodynamic, physical, chemical, and economic aspects. By selecting a PCM material for a specific application the melting temperature must be selected close to the operation temperature. The volume based latent heat should also be as high as possible to reduce the size of the storage device. A further important specification on phase change materials is given to the thermal conductivity in both states, solid and liquid, which is desirable to improve the heat transfer into the phase change material. To maintain convenient container design for the phase change device the density variation during phase change from solid to liquid and vice versa as well as the vapor pressure at operation temperature should be low.
For the use in power cycles as well as industrial applications phase change materials in the medium and high temperature range are required. In these temperature ranges, a high number of materials are available like metals and metal alloys or inorganic salts and saline compounds. However, the most discussed storage materials for LHTES are salts and their eutectics. These materials are characterized by the low heat conductivity [2,3,4]. A widely used method to overcome this heat transport limitation in LHTES is to increase the specific surface of the heat exchanger tubes. Various techniques, like fins [4,5,6,7,8,9,10,11], dispersed high-conductivity particles inside the PCM [12,13], metal and graphite-compound matrices [14,15,16], micro-encapsulation [17,18,19] as well as a combination of metal foam made of copper and sandwich structure fins [20] have been suggested and were analyzed.
Based on the low thermal conductivity of the PCMs the details of heat transfer and phase change in the presence of heat transfer enhancing techniques has become of interest. To analyze the melting and freezing process of a material under the influence of gravity, a higher number of analytical [21,22,23,24,25] as well as numerical methods [26,27,28] were developed in the last decades. The change with time of the position of the phase interface during the melting and/or solidification process is the main problem concerning the numerical simulation. As reported in [29], more than half of all investigations done on latent heat thermal storage systems were numerically and most of the used models are 2D (see e.g., [28,30]). The very slow laminar flow (natural convection) and the variation of the physical properties of the PCM during the phase change result in difficulties for the numerical simulation. But the main challenge of such problems is the presence of a moving liquid–solid interface involving a strong coupling of mass and heat transfer. To get accurate results, very small time steps as well as a fine structured computational grid is necessary. Therefore long computation time can be expected even for small 3D models [10].
In the present work the results of a transient numerical analysis on the melting and solidification behavior of sodium nitrate (NaNO3), which is used as phase change material in a LHTES, will be presented. The heat transfer fluid flows inside a steel tube of the heat exchanger. The steel tube is surrounded by an aluminum wire matrix for enhancing the heat transfer into the PCM. The material aluminum was chosen based on the high thermal conductivity, which is approximately 10 times higher compared to steel, the low material density of approximately 2700 kg/m3 and the applicable temperature range up to 330 °C. A further advantage of the selected material combination is that galvanic corrosion between aluminum, carbon steel and sodium nitrate is not critical, as mentioned in [31]. Parts of the present study are presented in [32].

2. Mathematical Model of the Heat Exchanger Tube

In the next paragraphs, the physical and mathematical model as well as the thermo-physical properties for the materials will be presented.

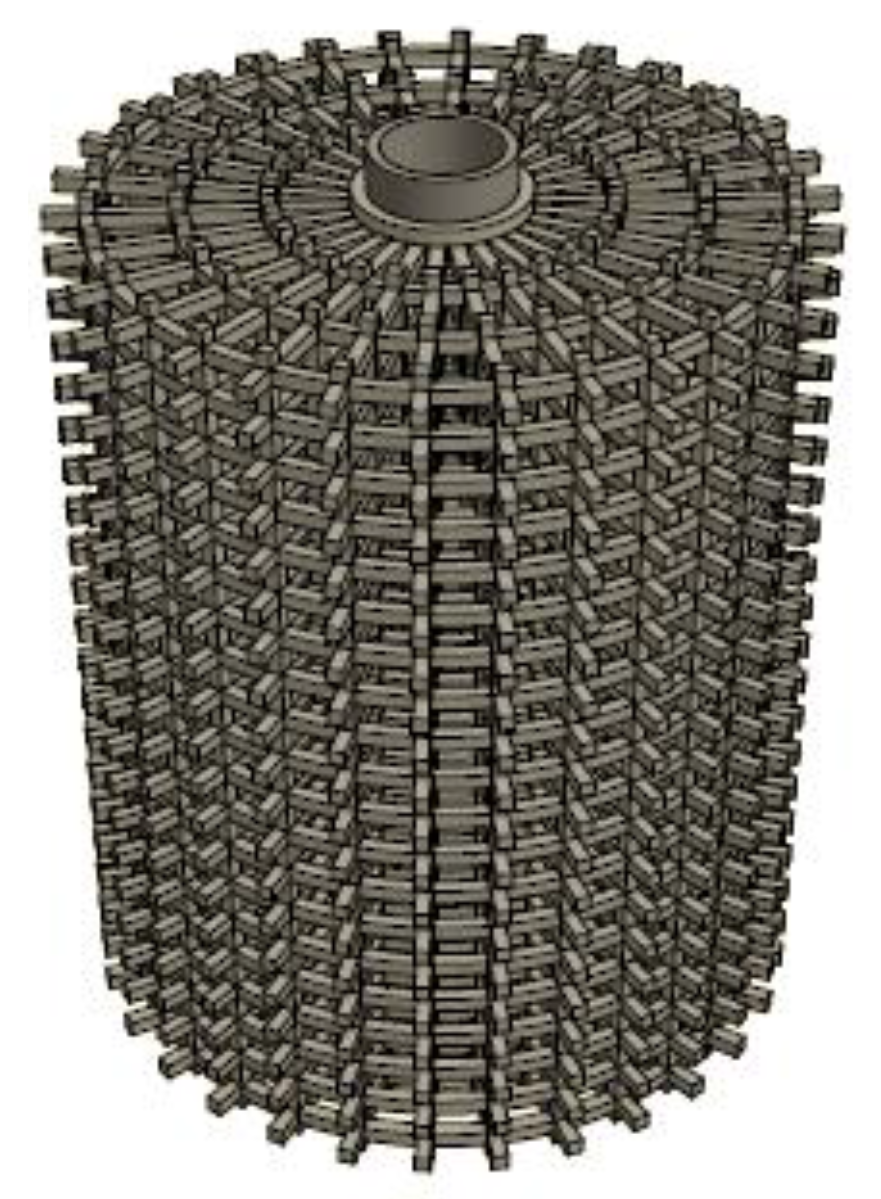
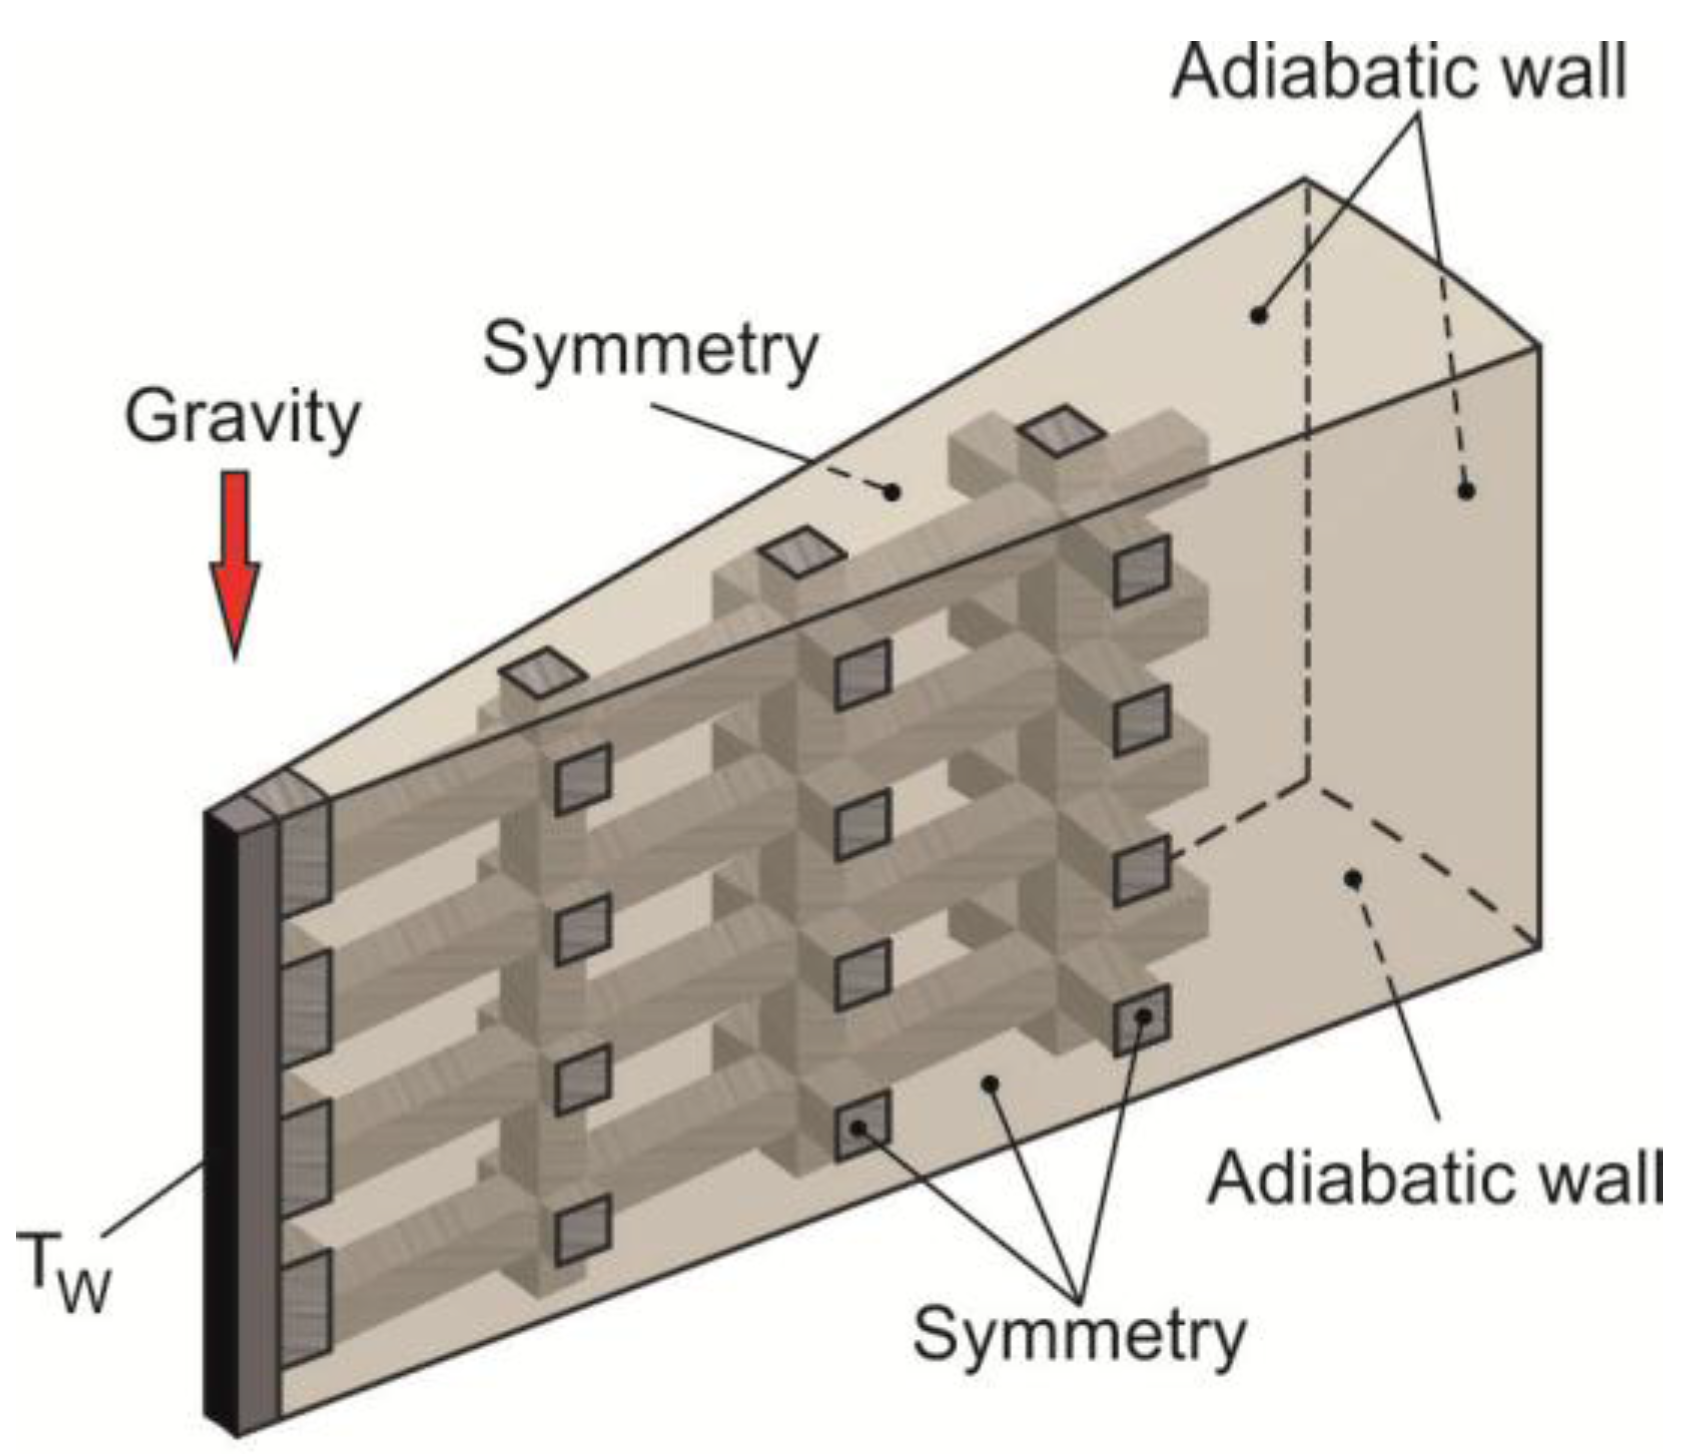
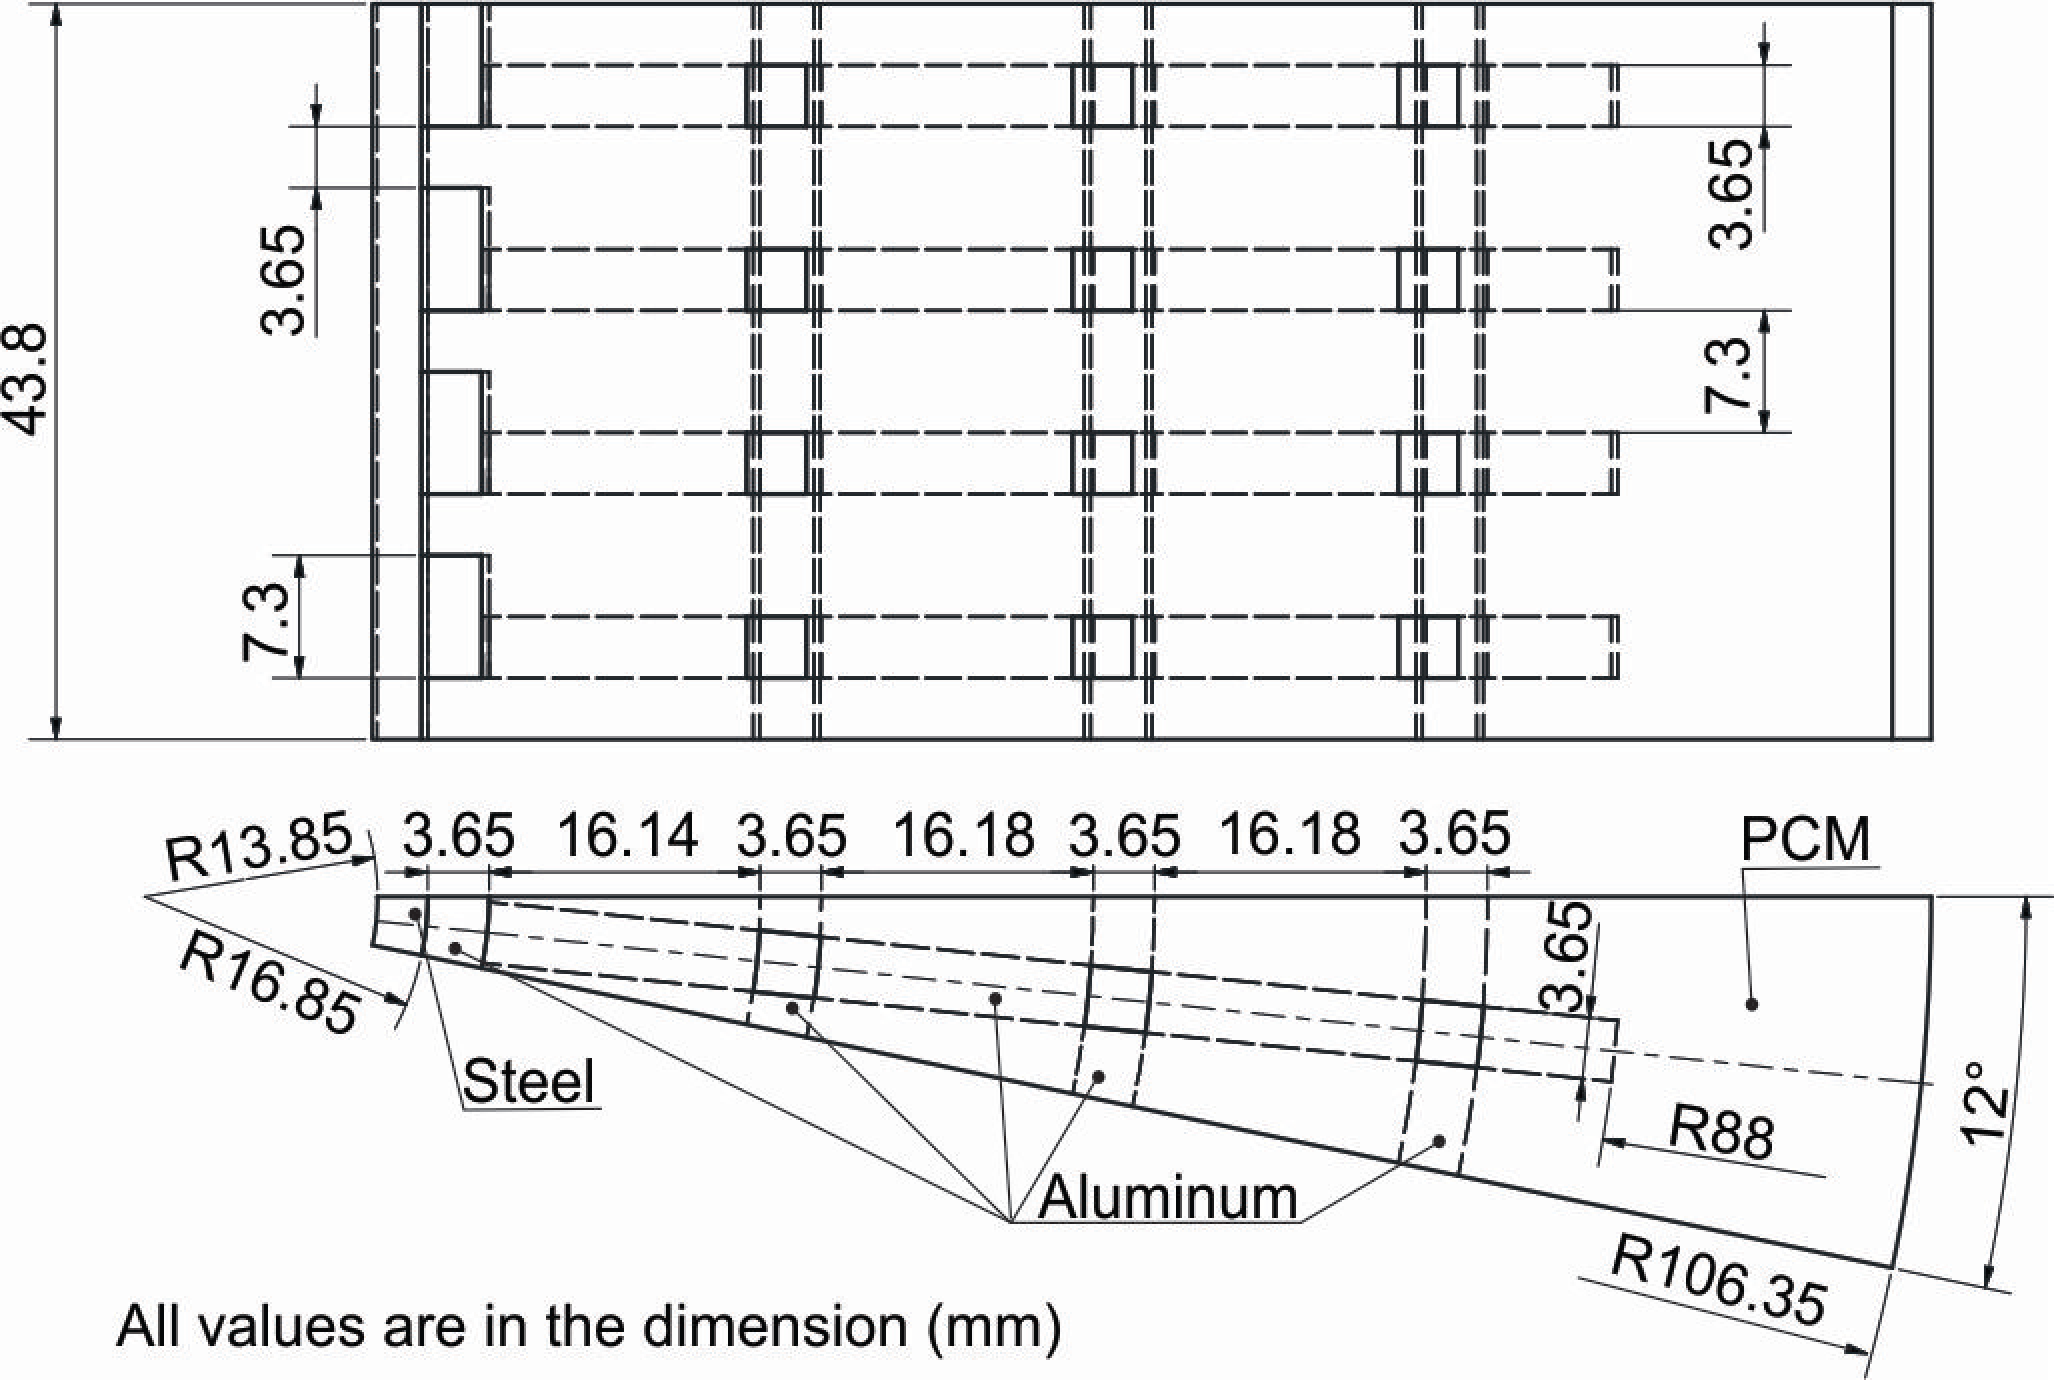
2.1. Physical Model of the Wired Matrix

Figure 1 shows a sketch of the analyzed heat exchanger tube used in the present study for the heat transfer from the heat transfer fluid, which flows inside the tube, to the surrounding sodium nitrate (NaNO3), which is used as phase change material. The heat exchanger tube consists of a plain steel tube surrounded by an aluminum wire matrix. The analysis was done for a vertical arrangement of the heat exchanger tube. The main advantage of using a wire matrix for enhancing the heat transfer to the phase change material is the simple geometry as well as the simple assembling of the tube by inserting and pre-stressing of the wires, which are connected to the steel tube. Under operation temperature (up to 330 °C), the wire matrix is highly flexible and therefore the different linear expansion between steel tube and wire matrix can be easily compensated.

2.2. Mathematical Model

To obtain the numerical solution for the phase change problem the commercial computer code ANSYS FLUENT (ANSYS Inc., Canonsburg, PA, USA) was used. In ANSYS FLUENT the enthalpy-porosity approach [33,34] is used to calculate the melting and/or solidification process.
The enthalpy-porosity method depends on the liquid volume fraction γ which denotes the ratio of volume of liquid to the total volume in each cell. Therefore, the liquid fraction γ describes the fraction of a cell volume which is filled with liquid. For the calculation the computational domain in the PCM will be divided into three regions: solid, liquid, and mushy zone. With this technique the melting front is not calculated explicitly. Instead, the quantity liquid fraction γ is computed at each time step for every cell based on the enthalpy balance [33]. Computational cells, where the phase of the material changes, are modeled as a pseudo porous medium with liquid fraction γ ranging between 0 and 1, for solid and liquid respectively, while 0 < γ < 1 denotes the mushy zone. Thus, the energy equation used here for the PCM system yields to:
t ( ρ H ) + ( ρ v H ) = ( k T ) + S E
with the total enthalpy
H = H s + H l a t
and the sensible enthalpy
H s = H s r e f + T r e f T c p d T
The enthalpy change during the phase change (latent heat) can be written as a function of the liquid fraction and the latent heat of fusion Hlat = γL. Based on a method proposed by [34], the liquid fraction γ can be determined by temperature.
[ γ = 0 if T < T s o l γ = 1 if T > T l i q γ = T T s o l T l i q T s o l if T s o l < T < T l i q ]
with Tsol = 578.65 K and Tliq = 579.65 K. The temperatures Tsol and Tliq determine the size of the mushy zone. As described in [35], an iteration between the energy balance Equation (1) and the liquid fraction Equation (4) is done for the calculation of the temperature. This method was suggested by [34] because a direct calculation of Equation (4) to update the liquid fractions results in poor convergence of the energy balance Equation (1). The continuity equation used can be written as:
ρ t + ( ρ v ) = 0
and the momentum equation for the enthalpy-porosity equation is given in Equation (6).
t ( ρ v ) + ρ v ( v ) = p + ( 2 η γ ˙ v ) + A C ( γ ) v + S M
with
A C ( γ ) = C ( 1 γ ) 2 γ 3 + b
the porosity function AC(γ) to reduce gradually the velocities from a finite value in the liquid to zero in the solid. The value b in Equation (7) is a small computational constant (b = 0.001) used to avoid division by zero while the mushy zone constant C is supposed to reflect the structure of the melting front.
For the mushy zone constant the standard value of ANSYS FLUENT with C = 105 was used. The higher the value of the mushy zone constant, the steeper the damping term becomes, and the faster the velocity drops to zero as the material solidifies, see also [36].
The basic conservation equations of continuity, momentum, and energy were solved numerically, using the ANSYS FLUENT 14.5 software. For the pressure-velocity coupling, the COUPLED scheme, which is implemented in ANSYS FLUENT, was used for the present study.
The following assumptions are made for the numerical investigation:
  • Both the solid as well as the liquid phase is homogeneous and isotropic, and the melting process is symmetric within a segment.
  • NaNO3 in the liquid phase is considered to be an incompressible and Newtonian fluid.
  • The volume change upon phase change is ignored.
  • For the molten PCM laminar flow as Newtonian fluid is assumed.
  • The solid is homogeneously distributed in the mushy region.
  • It is assumed that the PCM has an ideal solidification behavior. Therefore, the subcooling effects are neglected and the solidification temperature is constant.
  • A perfect contact between the surfaces of the single wires and also to the steel tube is assumed.
A normal downward-directed gravity field with the corresponding gravitational acceleration of 9.81 m/s2 is considered.

2.3. Thermo-Physical Properties

The thermo-physical properties for the tube and wire matrix are taken from the ANSYS FLUENT properties data base. For the properties of the phase change material NaNO3 a user defined function (UDF) was programmed.
Important values for the numerical simulation of phase change problems are the melting temperature, heat of fusion, specific heat capacity, heat conduction, dynamic viscosity and density. In the literature, different data for the melting temperature of the sodium nitrate are available. In the present work a constant melting temperature of T = 579.15 K was used for NaNO3, which is based on the references [37,38]. The heat of fusion with L = 176.256 kJ/kg is taken from [38]. It can be seen in the references [37,38], which have made a comparison with a higher number of published data, that the gradient of the specific heat capacity in the liquid region of NaNO3 is approximately constant. In the solid region of the sodium nitrate, the specific heat capacity shows a slight upward trend starting from the environment temperature up to the melting temperature. At temperature levels of 523.15 K < T < 573.15 K, which is close to the phase change temperature, the specific heat shows a local maximum (at approximately 543.15 K) as a result of a change of the crystal structure. In the region between approximately 573.15 K < T ≤ 579.15 K the specific heat capacity is approximately constant and has a value close to the specific heat capacity of the liquid sodium nitrate. However, the local maximum of the specific heat capacity is not within the temperature region of the numerical simulation. Therefore, the specific heat capacity for the solid as well as liquid NaNO3 was modeled within the present study with the constant value of cp = 1635 J/kgK (this is the value of the liquid NaNO3) based on the references [37,38].
For the density of the sodium nitrate in the solid phase, the value of 2119.6 kg/m3 was used according to [3,37,39], while for the liquid region the equation
ρ l i q = 1890 0.6 ( T 593.15 )
which is based on the data of [40], was developed. A comparison with available data in the literature shows that the polynomial used for the liquid density of NaNO3 in this work is located between the data of [41,42]. Following [43], the dynamic viscosity of the liquid PCM has been expressed as
η l i q = 0.0251 6.054 10 5 T + 3.871 10 8 T 2
For the thermal conductivity in the liquid phase the correlation of [44]
λ l i q = 0.62 1.787 10 4 T
was used in the UDF. Based on the measurement data of [37], an equation for the thermal conductivity in the solid phase was derived.
λ s o l = 1.2 9.067 10 4 T
If different values for a physical property at the solidus and the liquidus line are given, then a linear interpolation between these values is done to get the thermo-physical properties in the mushy zone.

2.4. Numerical Model of the Heat Exchanger Tube

The numerical simulation of the melting and solidification behavior of a material must be done in such a way that the grid size used in the computational domain as well as the used time step is very small. Otherwise, it is not possible to get realistic solutions for the problem under investigation. Therefore it is not possible to simulate the total heat exchanger tube of a LHTES with a three dimensional domain, because for large storage devices the single tube length in the heat exchanger can be up to several meters which will consume enormous computing resources. However, for a basic understanding of the physical mechanism small sized computational domains can be used. Therefore, for the three dimensional simulations made for the present study a height of 43.8 mm was used for the computational domain of the vertical arranged heat exchanger tube with wire matrix, which is presented in Figure 2.
The computational domain consists of the steel tube (outer diameter is 33.7 mm) with an aluminum wire matrix and the PCM sodium nitrate. The cross section of the wire is a square with the dimension 3.65 mm × 3.65 mm.
In Figure 3, the boundary conditions and the direction of the gravity used for the numerical simulations are depicted. At the top and the bottom surfaces as well as at the outer shell of the NaNO3 an adiabatic wall is defined. The adiabatic boundary conditions avoid a heat exchange with the surrounding through these surfaces. The consequence of the adiabatic boundary condition is that during the charging process no dissipation of the heat coming from the heat transfer fluid through the steel tube is given. In real thermal heat storage devices the container is completely insulated against the environment. The thickness of this insulation is chosen in such a way that the thermal loss is as low as economically feasible. Thus, nearly adiabatic conditions are given for such a storage unit. Therefore the assumption of an adiabatic wall is justified.
At the side walls of the computational domain the symmetry boundary condition was used. For the numerical simulations, the initial temperature of the whole system (tube, wire and NaNO3) was 569.15 K for the melting and 589.15 K for the solidification process. The tube wall surface temperature Tw, which represents the boundary condition at the inner tube diameter surface, was 599.15 K for the melting and 559.15 K for the solidification process. The tube wall surface temperature was kept constant during the whole simulation.
The grid size used for the discretization of the computational grid was determined after a careful examination of the results of a grid refinement process. As a time step for the numerical simulation, a value of 0.05 s was used, which is also a result of preliminary tests [45]. A further decrease of the time step size as well as of the size of control volumes of the computational grid did not show noticeable changes in the results. For the computational domain shown in Figure 2 and Figure 3 a total number of 65,624 control volumes is used. The value for the volume ratio, which is defined as:
ϕ = Volume of the​ wire matrix Volume of the PCM 
is 0.149 and the surface to volume ratio
ε = Surface area of the​ wire matrix Volume of the wire matrix 
is 0.965 m−1.
The numerical simulations presented in the present article are done on an 8 core computer and the computation time for the melting process was approximately two weeks while for the solidification process the computation time was about three weeks.

3. Numerical Results and Discussion

In the following, the results of the numerical simulation of the melting process will be presented.

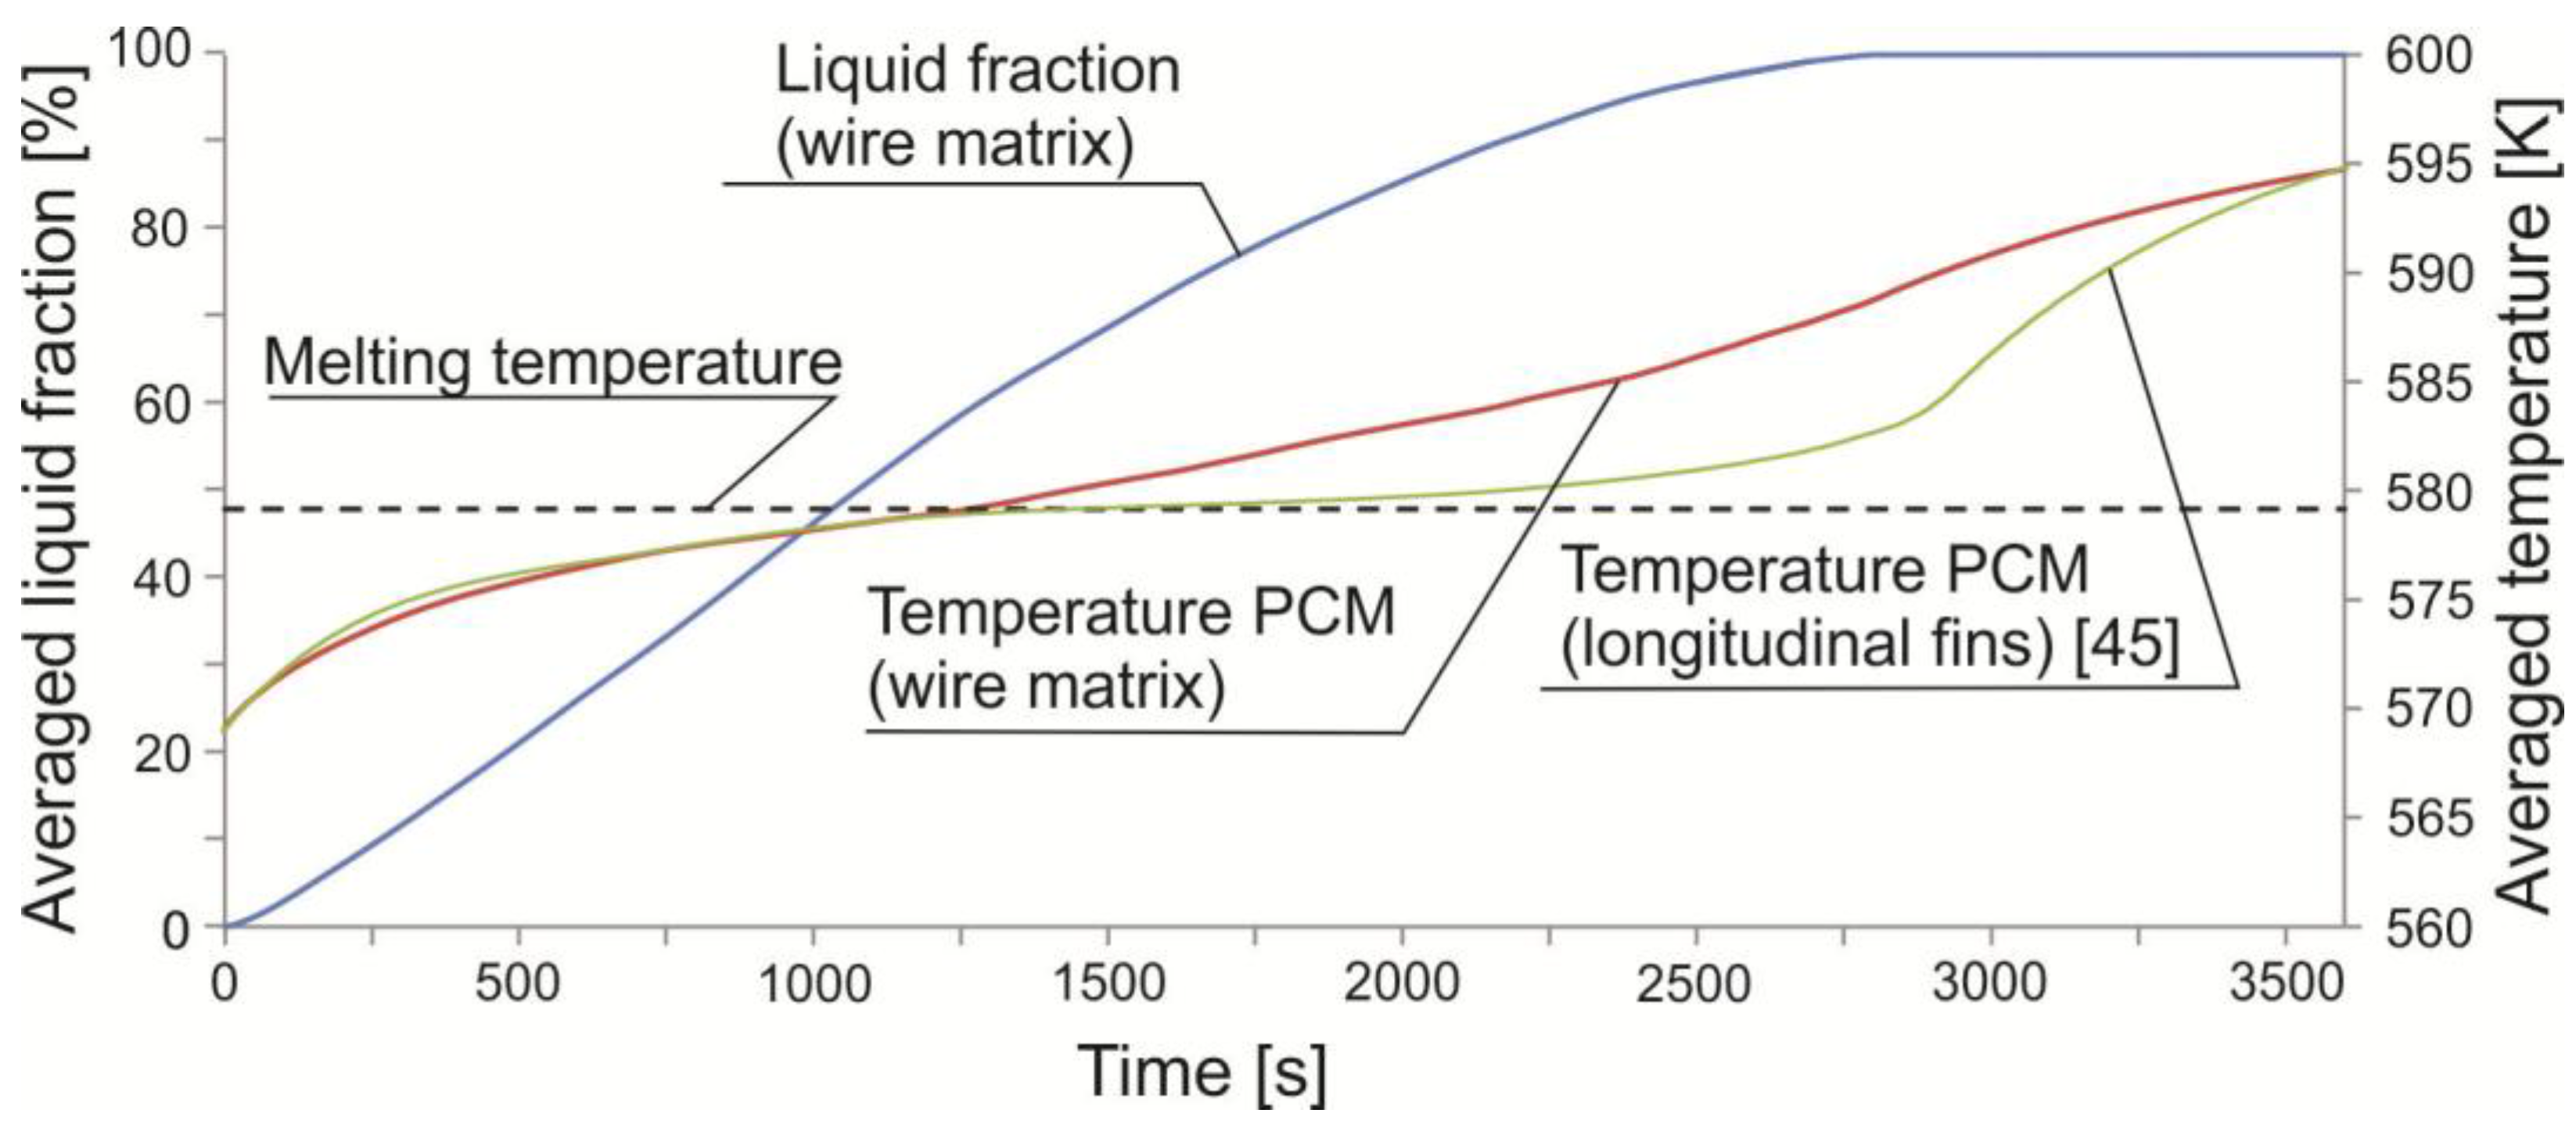
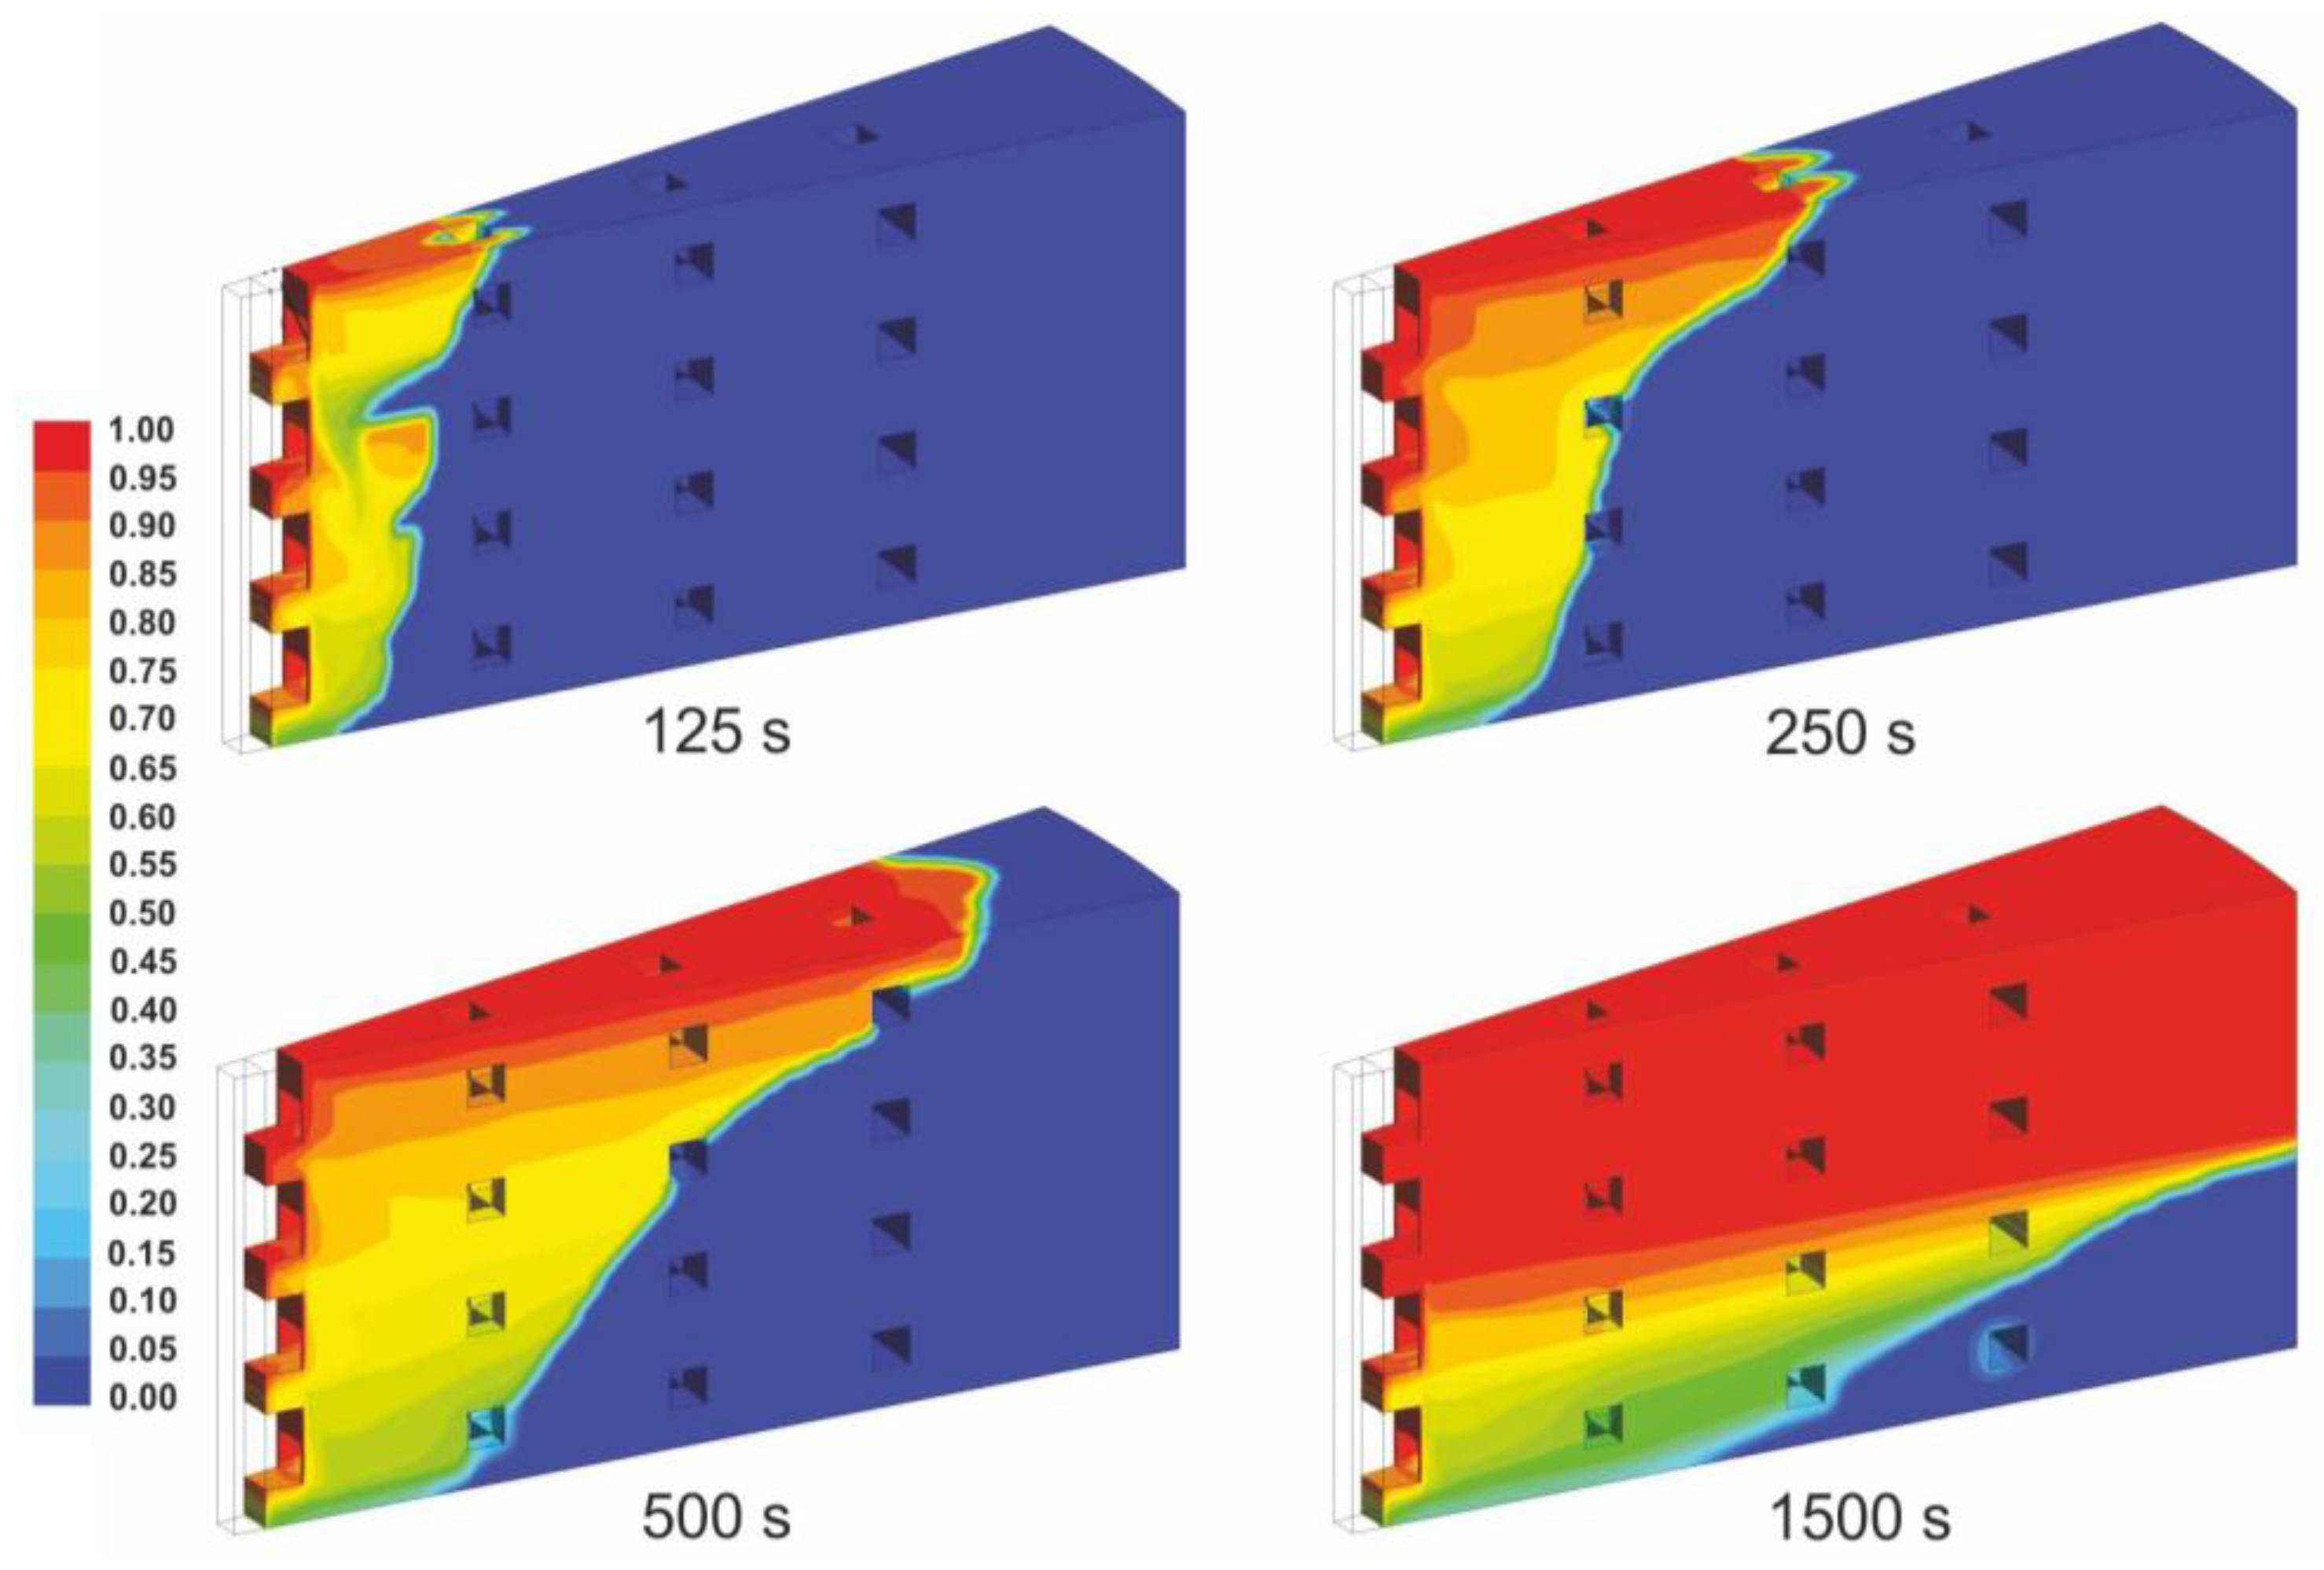
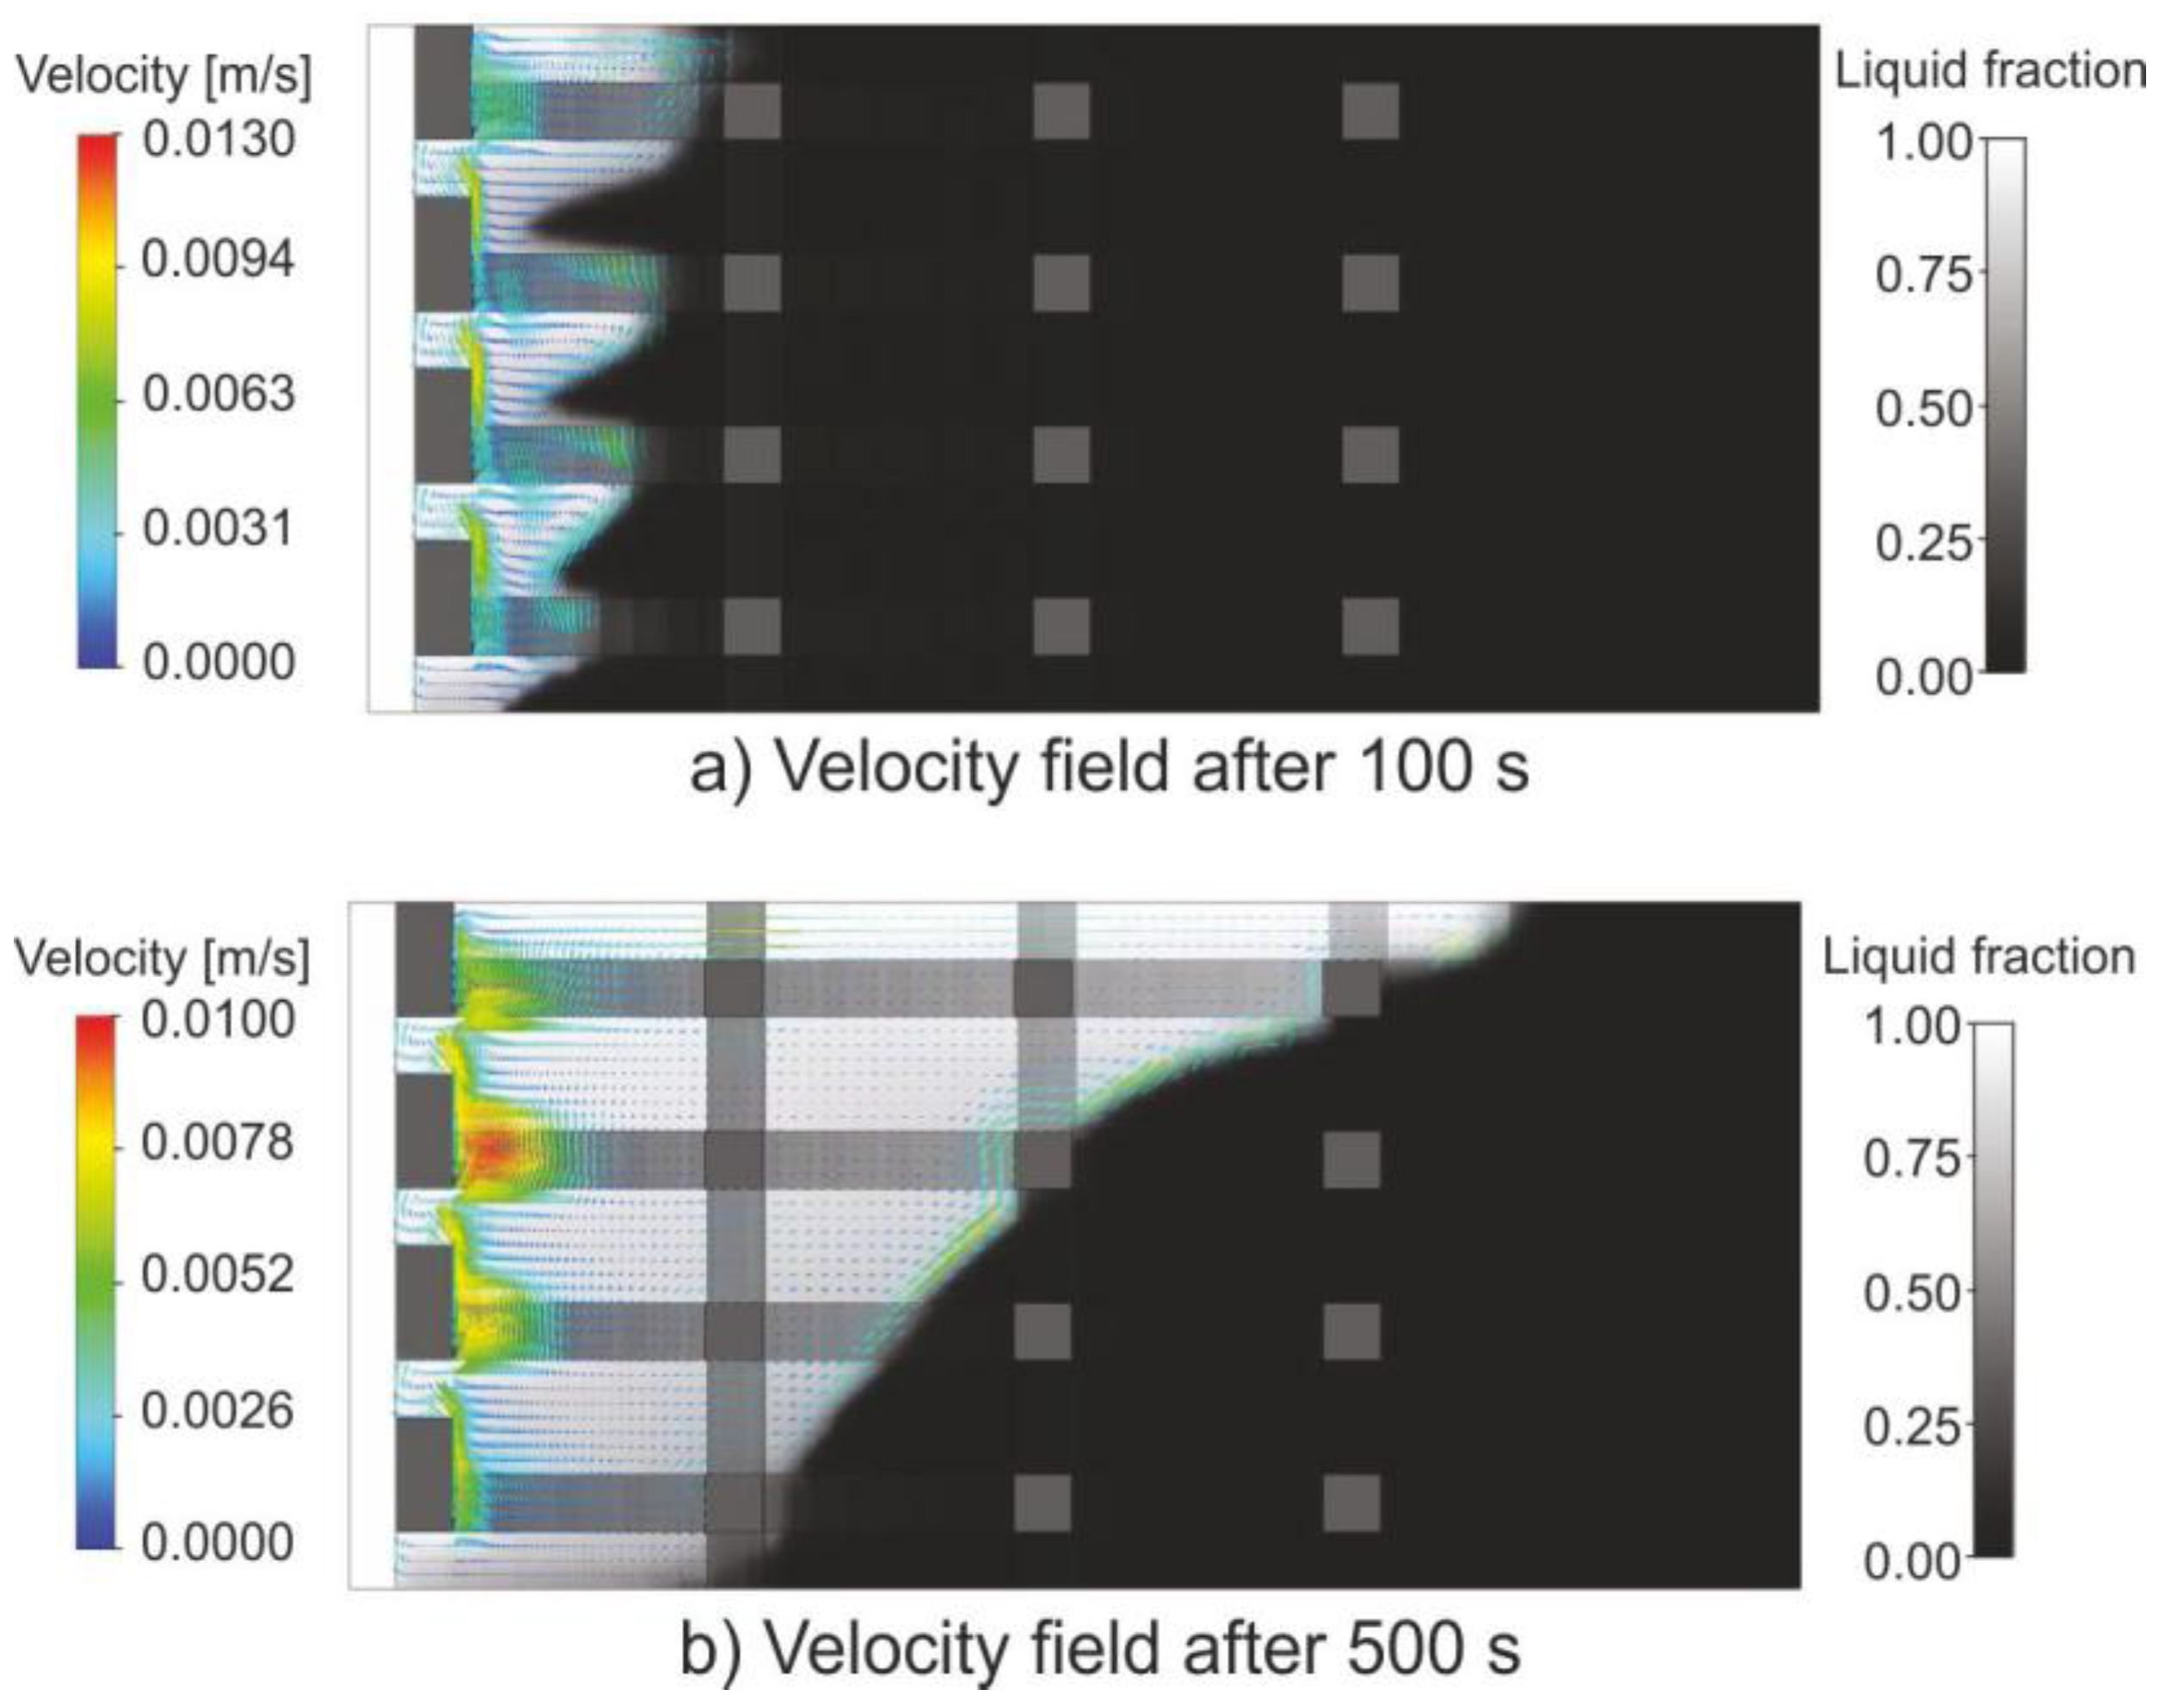
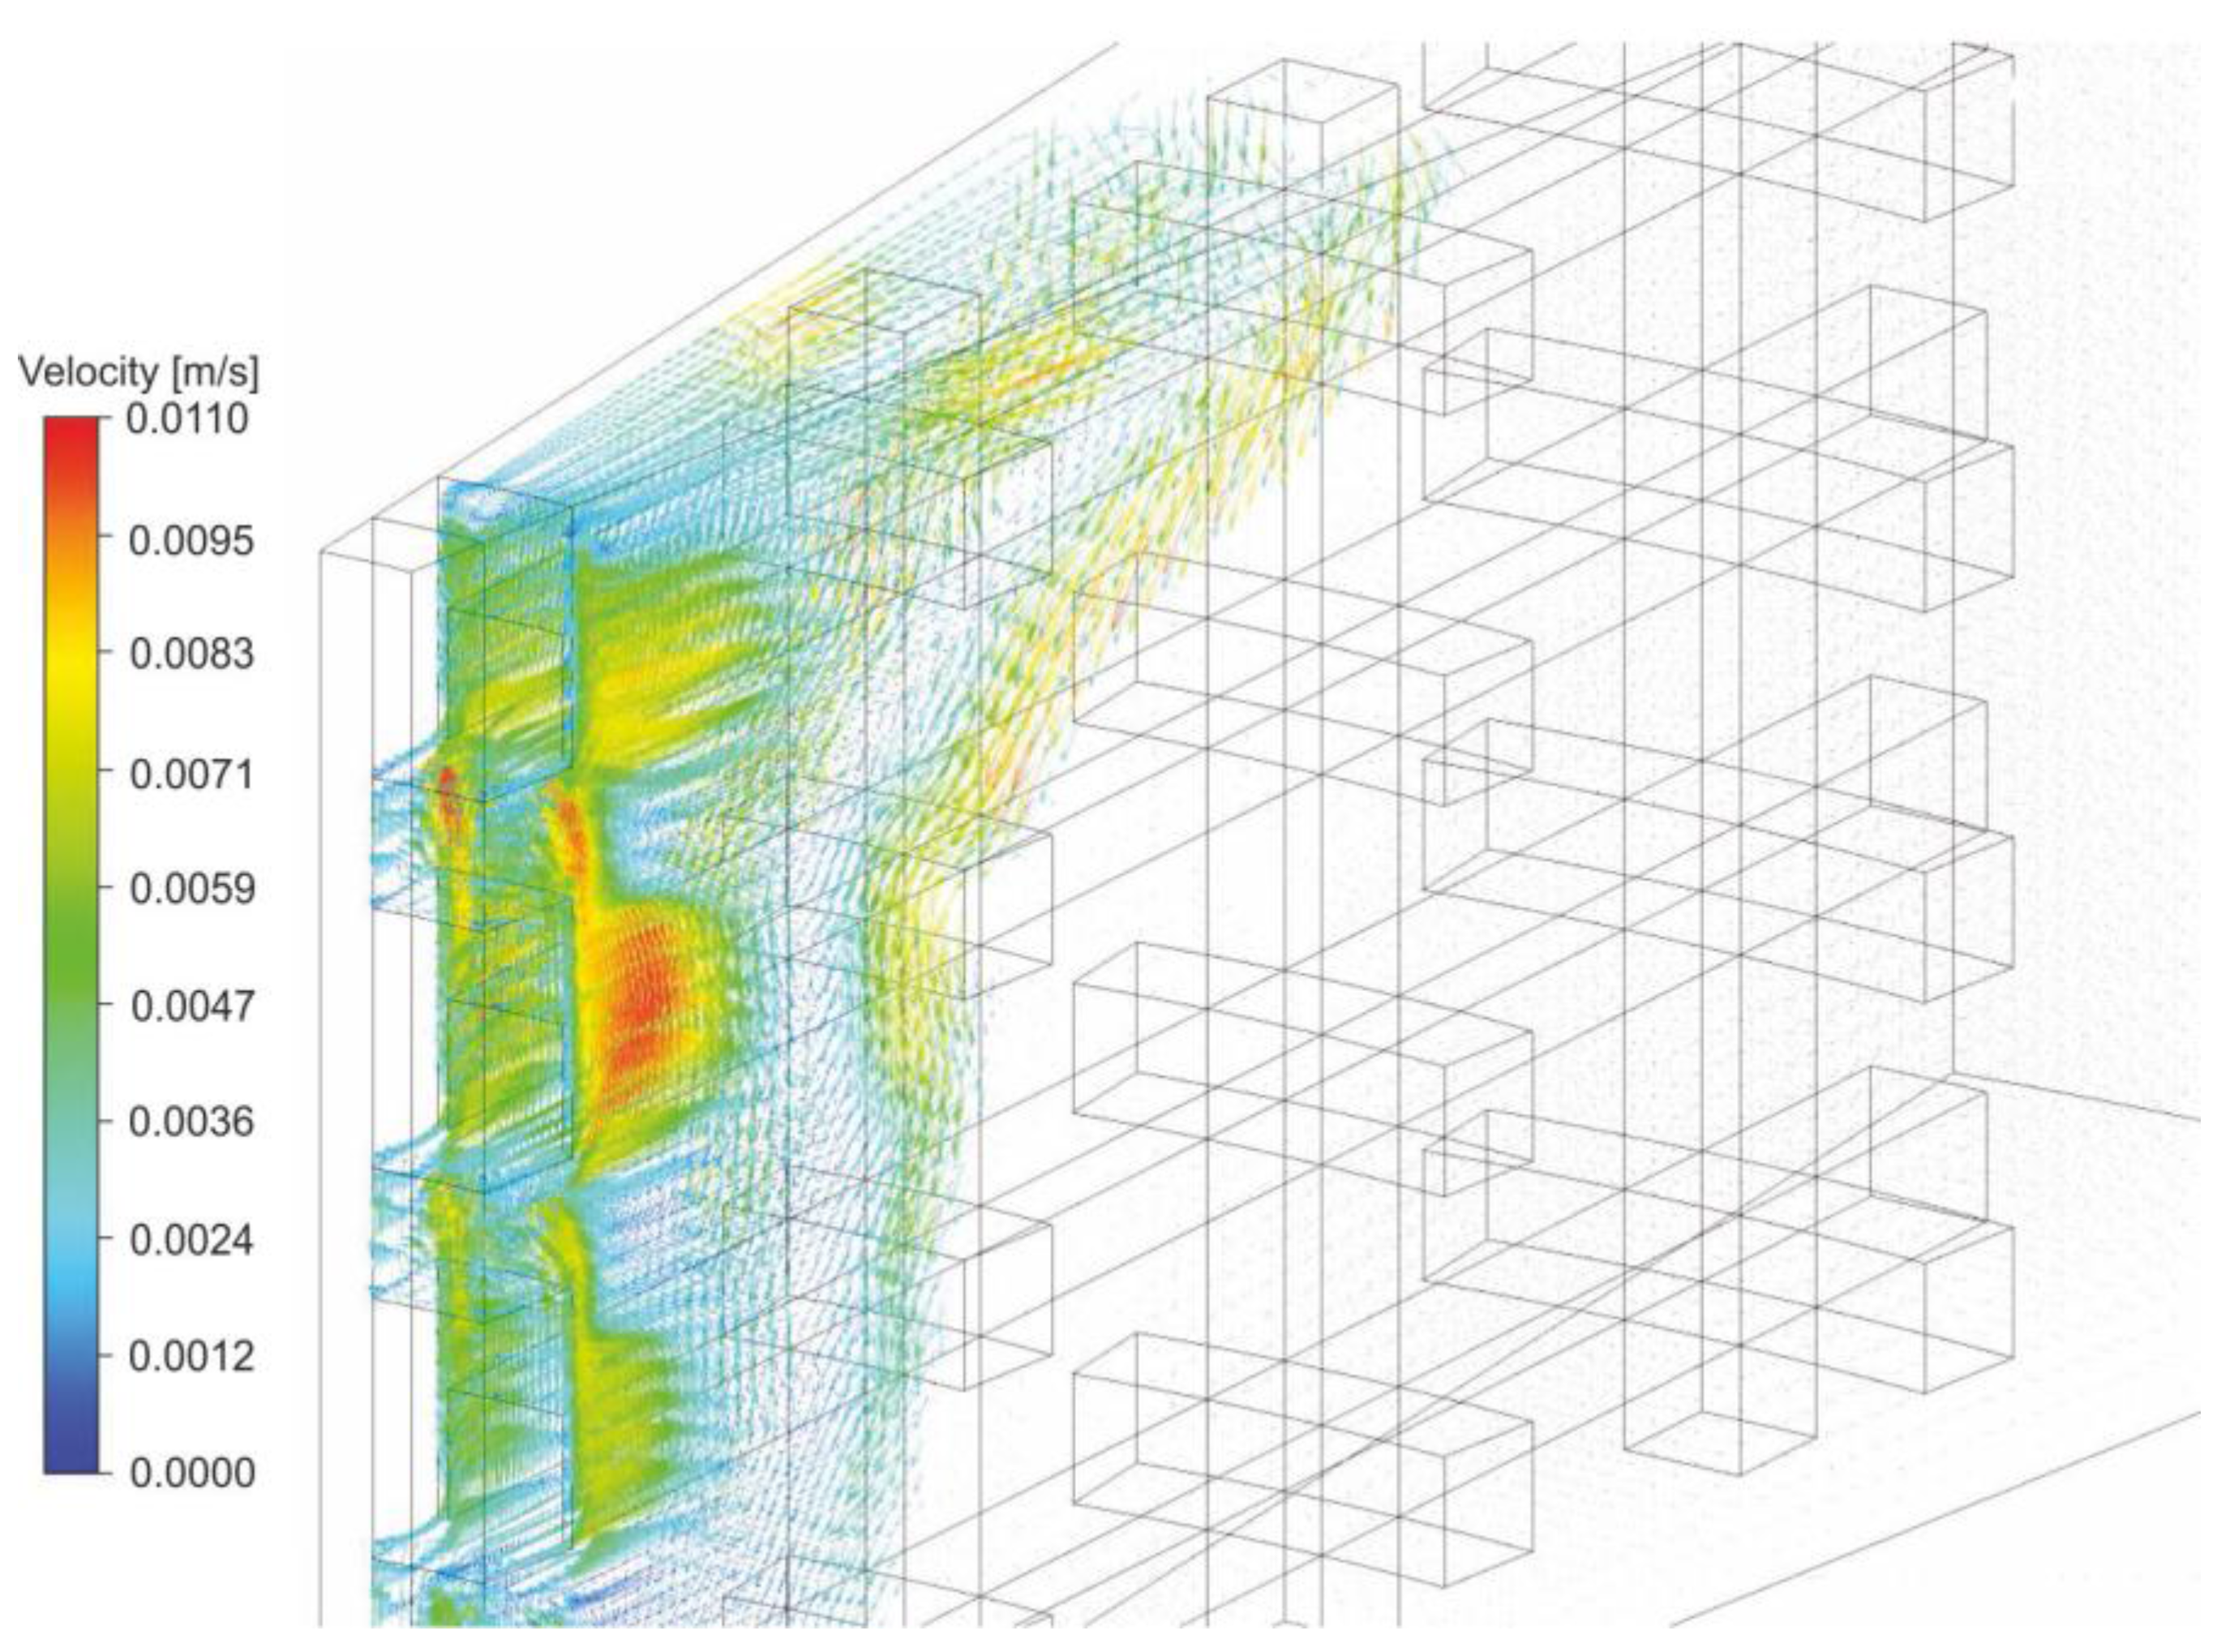
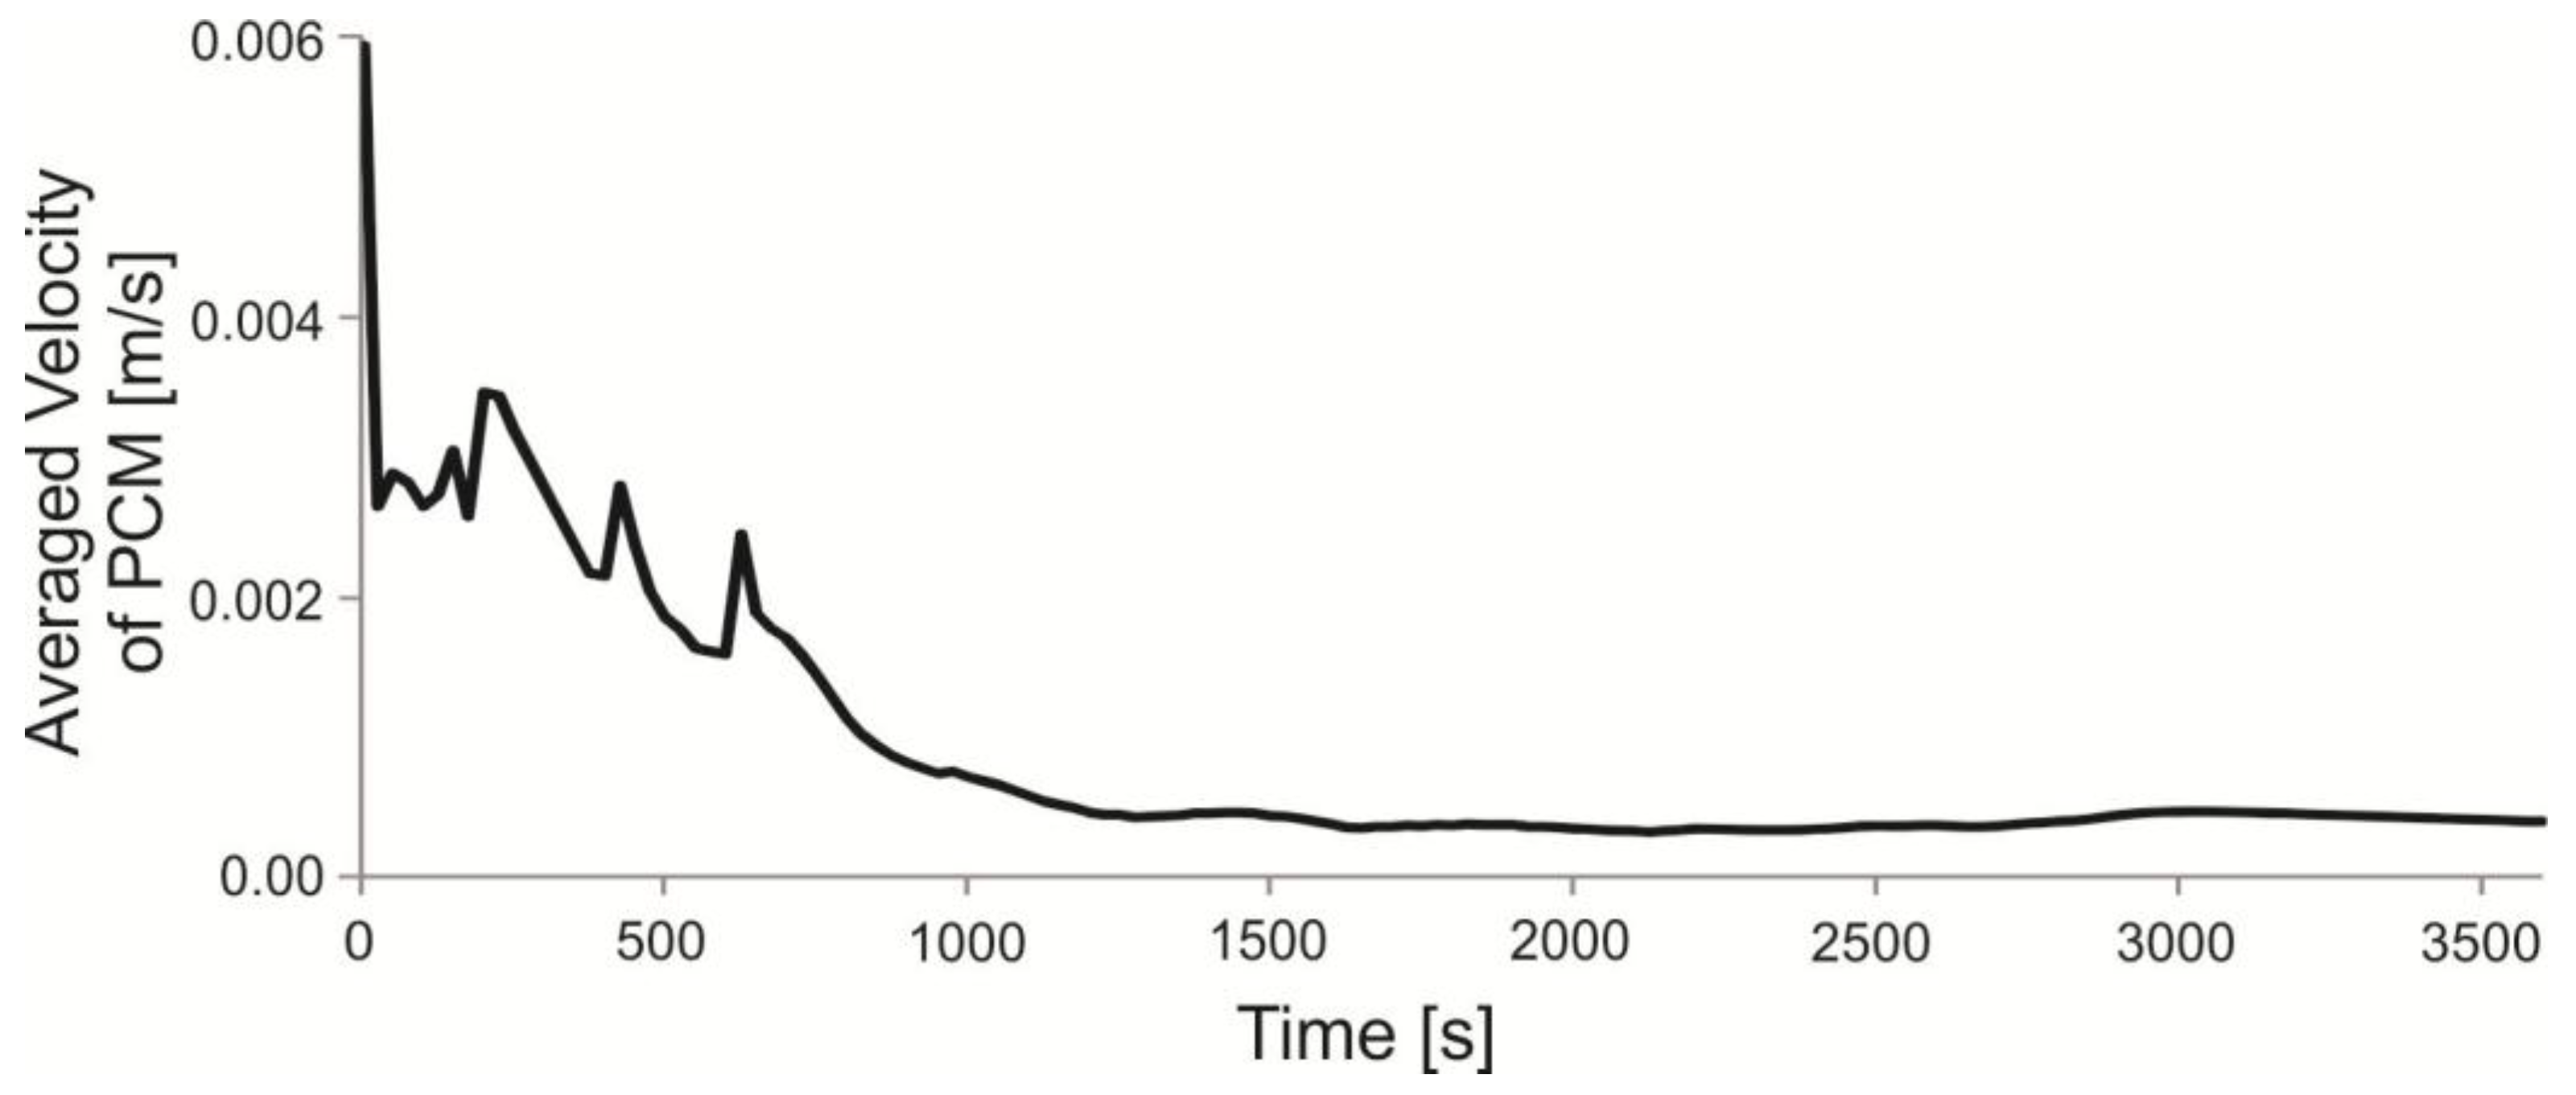
3.1. Results for the Charging Process

In Figure 4 the chronological sequence of the volume averaged temperature (red curve) and volume averaged liquid fraction (blue curve) for the PCM during the charging process using a wire matrix for improving the heat transfer is presented. The black dashed line in Figure 4 shows the melting temperature of the PCM. For comparison reasons a further time sequence of a volume averaged NaNO3 temperature of a heat exchanger tube design with longitudinal fins (green colored) is included in Figure 4.
The numerical simulation for the heat exchanger tube with longitudinal fins was done under the same conditions and with approximately same ratios φ and ε as for the wire matrix. The data for this curve is taken from [45]. It can be seen in Figure 4 that the volume averaged temperature shows no distinct flattening in the curve around the melting temperature compared to the tube with longitudinal fins. This behavior is a result of the aluminum wire matrix.
The development of the liquid fraction of the PCM over the time is depicted in Figure 5. During the first phase of the charging process (the melted region is small) the heat conduction is the main heat transfer mechanism. Furthermore, it can be seen that the melting process starts at the top of the computational domain and grows synchronously towards the outer shell and the bottom. Therefore, an asymmetric melting behavior over the height is given. This asymmetric melting process is a result of the increasing influence of the natural convection (buoyancy-driven currents) on the charging process. The molten PCM rises up along the tube wall as it gets heated and flows downwards along the solid NaNO3 where it cools down by transferring heat to the solid region. Thus, a vortex flow arises in the melted zone, which helps to enhance the heat transfer to the solid–liquid layer of the NaNO3. This effect is increased by the adiabatic boundary condition on the top of the computational domain. As mentioned above, no loss of heat to the environment during the charging process is given. Thus the natural convection flow in the melted region of the PCM forces heat transfer to the upper part of the computational domain. This intensifies the described asymmetric melting process. However, the results of experimental investigations, e.g., [46,47], show the same effect. The measured temperature at the top of the storage device with vertical heat exchanger tubes increases faster compared to the temperature at the bottom. This indicates that the melting front moves from the top to the bottom. This behavior was also observed experimentally by [46,47] as well as numerically by [9,10,48].
A vector plot of the velocity including the liquid fraction of the PCM is represented in Figure 6. It can be seen that the velocity profile within the melted zone is complex based on the wire matrix. At the beginning of the charging process (see Figure 6a), where the melted region is small, we find a steep gradient of the phase front. This is, on the one hand, a result of the small distance to the steel tube and, on the other hand, a result of the heat conduction which is the main heat transfer mechanism during this period of the melting process. We can also see in Figure 6a that during this first phase of melting the radial directed wires restrict the start of natural convection. Therefore the melting process of the PCM on top of each wire is slower compared to the region beside the radial wire, where the buoyancy-driven flow is unrestricted and accelerated. This effect loses its importance with increasing liquid region of the PCM, see Figure 6b.
A detailed three-dimensional view of the velocity field around the wire matrix is shown in Figure 7. Based on the flow restriction of the wire matrix the liquid PCM flows around the wire and increases locally its velocity.
If the downward flow of the PCM along the solid–liquid layer is restricted by a tangential wire (a part of the tangential wire is surrounded by the solid PCM, see Figure 6 and Figure 7) then the melting process is slowed down locally in the solid region behind the tangential wire. This is a result of a lower heat transfer from the wire to the solid region behind the tangential wire based on a small temperature difference between wire and solid material.
The time evolution of the averaged velocity of the molten PCM is presented in Figure 8. In Figure 8 it can be seen that during the first period of the charging process the buoyancy-driven velocity of the molten PCM is high. This is a result of the small liquid layer and the relatively high temperature difference between the solid PCM and the tube wall. With increasing thickness of the liquid layer and solid temperature the temperature difference and consequently the velocity decreases. In the time period between approximately 200 s up to 800 s the graph for the wired matrix shows some velocity peaks. These peaks are a result of the transversal arranged wires which represent an obstacle during the charging process for the fluid flow of the melted PCM. With the development of a small melted PCM layer between the wire and the solid PCM, the downward moving flow of the liquid PCM is divided and flows through the small liquid layer and crosses the tangential arranged wire. This fluid flow through the layer shows a high velocity which results in the velocity peak. This behavior is intensified if two or more tangential arranged wires are in the same state. With increasing liquid layer behind the tangential wire the averaged velocity decreases.
Such velocity peaks cannot be observed after approximately 800 s after simulation start. The circumstance for this behavior is given by a general lowering of the averaged PCM velocity and the flattening of the melting front. When the melting front becomes more and more flat the number of transversal arranged wires which restrain the fluid flow decreases.
With increasing of liquid volume fraction the temperature difference within the molten region decreases. This results in a further decrease of the volume averaged velocity of the PCM.
The charged power per volume PCM is depicted in Figure 9. The curve shows the typical behavior of a LHTES during the charging process. During the first phase of the melting process the charged power is very high, based on the high temperature difference between the heat transfer fluid and the solid PCM. With the development of the first small liquid layer of PCM along the outer tube surface the temperature difference between the heat transfer fluid and the liquid PCM decreases and therefore, also the heat flux decreases. After this typical rapid decrease of power (see also measurement data in [46,47]), the charged power is approximately constant up to about 1000 s after simulation start (in this analyzed case). During this period of time the volume averaged temperature increases close to the melting temperature (see Figure 4). When the volume averaged temperature of the PCM achieves approximately the melting temperature, the charged power decreases.

3.2. Results for the Discharging Process

In the following the results of the numerical simulation of the solidification process will be presented. The boundary and initial conditions used for the numerical investigations are described in detail in Section 2.4.
At the beginning of the discharging process the complete sodium nitrate is in the state of liquid and the circulation of the NaNO3 starts along the whole external shell of the computational domain with an averaged velocity close to zero (see Figure 10). This circulation is a result of the natural convection which is based on the temperature difference between the sodium nitrate (initial temperature is 589.15 K) and the heat transfer fluid (represented by the boundary condition of the inner tube wall surface temperature Tw = 559.15 K). Based on the large temperature difference during this period of solidification the buoyancy-driven velocity increases rapidly. With decreasing temperature difference within the molten region and increasing thickness of the solid PCM the averaged velocity of the sodium nitrate decreases.
In Figure 11, the development of the liquid fraction of the sodium nitrate during the solidification process at different time steps is depicted. As we can see from Figure 11 the solidification process starts at the bottom of the computational domain and along the outer tube surface. This result is in good agreement with numerical results presented in [9,10,48,49] and experimental work in [46,47]. In all references a single vertical arranged shell-and-tube heat exchanger is investigated. For improving the heat transfer longitudinal [9,10,46,47,49] and transversal [48,49] fins are used. The numerical investigations are done three-dimensionally, except [48], which was two-dimensionally. In all numerical simulations, the volume change of the PCM during phase change due to density changes is neglected, the outer shell of the computational region is considered as adiabatic, and the mushy zone constant used for the calculations is C = 105. The numerical simulation presented in [9,10,49] are done for the same boundary conditions and with approximately the same ratios φ (between 0.164 and 0.098) and ε (between 1.19 and 0.79 m−1) as for the present study. In [48] the supply temperature and the outlet pressure for the heat transfer fluid are used as boundary condition for the heat transfer fluid. The analyzed heat exchanger tube in [48] shows with a volume ratio of φ = 0.016 and a surface to volume ratio of ε = 1.58 m−1 a larger deviation compared to the wire matrix.
The numerical simulations presented in [10] are done for the same heat exchanger tube design as used for the experimental work in [46,47]. The experimental work was done at approximately constant heat transfer fluid temperature (difference between supply and return temperature of the heat transfer fluid is approximately 2 K). The length of the heat exchanger tube is 3 m.
With progress of the discharging process the solidified layer of the NaNO3 increases and the region for the buoyancy driven flow will be restricted by the growing solid sodium nitrate layer. The decreasing buoyancy-driven fluid flow takes place between the outer shell and the solid NaNO3. Based on the solidified NaNO3 layer an additional heat resistance is given. Thus heat conduction takes place within the solidified NaNO3 region. The heat conduction will be the significant heat transfer mechanism during the solidification process and the natural convection gets less relevant.
In Figure 12 the time evolution of the volume averaged liquid fraction as well as temperature of the sodium nitrate for the analyzed heat exchanger design is illustrated. The black dashed line in Figure 12 shows the melting temperature of the PCM. From Figure 12 it can be seen that during the first phase of solidification the volume averaged temperature drops rapidly down close to the melting temperature (first approximately 250 s after simulation start). During this time the volume averaged liquid fraction decreases only by approximately 8%. This overall behavior was also observed by experimental measuring, see e.g., [46,47]. After that first solidification phase, the averaged NaNO3 temperature is approximately constant around the melting temperature for a longer period of time. This is also characteristic for the solidification process of vertical arranged heat exchanger tubes, see e.g., [46,47,49], and is in contrast to the melting behavior of the wire matrix.
With decreasing volume averaged liquid fraction the volume averaged temperature of the NaNO3 is also decreasing.
If we compare Figure 4 and Figure 12, then it can be seen that the melting process is faster than the solidification process. This shows the great importance of the natural convection during the melting process. Based on this behavior, it can be concluded that the heat exchanger tube must be designed in such a way that no restriction should be given for the natural convection flow, see also [10].
The time evolution of the averaged discharged power per m3 NaNO3 during the solidification process is depicted in Figure 13. For reasons of comparison a further time sequence of a volume averaged NaNO3 temperature of a heat exchanger tube design with longitudinal fins (green colored) is included in Figure 13.
Apart from the very first phase of the solidification process (first approximately 30 s), where the discharged power shows a maximum based on the high temperature difference between the tube wall and the sodium nitrate, the discharged power decreases approximately linear between 200 and 100 kW/m3. During this period the volume averaged liquid fraction reaches the value of approximately 40%. Compared to a heat exchanger tube with longitudinal fins, the discharged power per volume is higher during the first 750 s.
The study presented in this paper was done with a small computational height. The following question needs to be evaluated: how is the influence of the computational domain height on the numerical results?
The influence of the computational height on the simulation result depends upon whether a charging or discharging process is analyzed. The simulation results of the present study as well as other studies (experimental [46,47] and numerical [9,10,48,49]) have shown, that heat conduction is the main heat transfer mechanism during the discharging process. Therefore the height of the computational domain had no significant impact on the numerical results, especially with a constant temperature boundary condition at the tube wall. The main heat transfer takes place in this case in horizontal direction and only a smaller heat flux is given in the vertical direction. In contrast to the charging process the heat is not transferred to the upper part of the computational domain.
In case of the charging process the situation is different. The main heat transfer mechanism during the charging process is natural convection. As we have seen in the results of the numerical study the natural convection flow in the molten region of the PCM shifts heat to the upper part of the computational domain (this process is intensified by the adiabatic boundary condition as discussed above). The consequence of this behavior is that a larger tube (computational domain) height results in a decrease of the heat flux from the HTF to the PCM in the upper part of the tube based on the decreasing temperature difference between HTF and PCM in this region. Thus, non-uniform heat flux distribution along the vertical heat exchanger tube dimension in direction to the outer shell is given with passing time. With increasing charging time the heat flux to the phase change material decreases. The impact of this behavior is given in the overall melting time. With other words, an increase of the tube (computational domain) height by keeping constant all other (boundary and geometrical) conditions will result in a larger melting time. But, and that is the most important knowledge, the basic physical behavior will not be effected.
The performance of the charged and discharged energy has shown that under the analyzed conditions the wire matrix is an alternative method to enhance the heat transfer to the PCM. But for the numerical analysis an ideal contact between the surfaces of the single wire as well as to the steel tube was assumed. This cannot be guaranteed in a real storage application. Therefore a higher contact resistance between the single wires must be taken into account. Especially in case of changing the cross section of the wire from quadratic to circular will increase the contact resistance. This will result in a decrease of the charging/discharging power and in an increase of the charging/discharging time.
Considering the complexity of the problem, including the multi-dimensionality of the melting and solidification process, the non-uniform heating along the heat exchanger tube (based on the temperature decrease of the heat transfer fluid in case of a single phase flow), the transient character of the process, the irregular melting patterns, the subcooling of the PCM during solidification and the heat transfer to the surroundings, further investigations must be done in future for a better understanding of the complex overall processes. In a next step, the change in volume of the PCM will be included to the mathematical models for the simulation of the melting and solidification process and these results will be validated with measurements made with the test rig at IET. Additionally, the influence of the model height on the numerical results will be investigated for a better understanding of the buoyancy-driven flow. But all these measure will lead to a considerable increase of the used CPU time.

4. Conclusions

In the present work, a transient numerical analysis of the melting process of sodium nitrate for a heat exchanger tube design, which consists of a steel tube and an aluminum wire matrix, has been performed. For the numerical analysis, the enthalpy-porosity formulation was used to get quantitative information about the time evolution of the melting front within the phase change material.
The numerical analysis of the melting process has shown that during the first period of the charging process, where the melted region is very small, the heat conduction is the dominant heat transfer mechanism. With increasing melted region natural convection plays the key role for the melting process. This results in a faster melting progress at the top of a storage device compared to the bottom. The analysis of the heat exchanger tube design with wired matrix indicates that no flattening is given for the volume averaged temperature of the PCM around the melting temperature.
The numerical results of the solidification process have pointed out that the dominant heat transfer mechanism during solidification is heat conduction. The investigation has also shown that the discharging process has been slower than the charging process.
For the numerical analysis, an ideal contact between the surfaces of the single wire as well as to the steel tube was assumed, but this cannot be guaranteed in a real application. Therefore, a higher contact resistance between the single wires must be taken into account which results in a larger charging and discharging time.

Acknowledgments

The K-Project GSG—GreenStorageGrid (grand number 836636) is funded in the framework of COMET—Competence Centers for Excellent Technologies by the Federal Ministry of Transport, Innovation and Technology, the Federal Ministry of Science, Research and Economy, the Vienna Business Agency, the Federal Province of Lower Austria and by the Federal Province of Upper Austria. The program line COMET is administrated by the Austrian Research Promotion Agency (FFG (Österreichische Forschungsförderungsgesellschaft)).
The authors would also like to thank the project partners Valmet GesmbH., EVN AG, ENRAG GmbH. and Primetals Technologies GmbH. for the pleasant and constructive working relationship.

Author Contributions

Martin Koller has conducted the numerical simulations and result analysis; Michael Hameter supported the numerical simulations and the result analysis; and Heimo Walter contributed to the study design, result analysis, the coordination of the whole project and wrote the manuscript.

Conflicts of Interest

The authors declare no conflicts of interest.

Nomenclature

AcPorosity function (kg/m3s)
bComputational constant (-)
CMushy zone constant (kg/m3s)
cpSpecific heat at constant pressure (J/kgK)
HTotal enthalpy (J/kg)
HsSensible enthalpy (J/kg)
HlatLatent enthalpy for the phase change in a numerical control volume (J/kg)
kThermal conductivity (W/mK)
LLatent heat of fusion (J/kg)
pPressure (N/m2)
SMSource term momentum equation (N/m3)
SESource term energy equation (J/m3s)
tTime (s)
TTemperature (K)
vVelocity (m/s)
Greek letters
εSurface to volume ratio (1/m)
γLiquid fraction (-)
φVolume ratio (-)
λThermal conductivity (W/mK)
ρDensity (kg/m3)
ηDynamic viscosity (kg/ms)
Subscripts
EEnergy balance
latLatent
liqLiquidus
MMomentum balance
refReference
sSensible
solSolidus
WWall

References

  1. Sharma, A.; Tyagi, V.V.; Chen, C.R.; Buddhi, D. Review on thermal energy storage with phase change materials and applications. Renew. Sustain. Energy Rev. 2009, 13, 318–345. [Google Scholar] [CrossRef]
  2. Laing, D.; Bauer, T.; Breidenbach, N.; Hachmann, B.; Johnson, M. Development of high temperature phase-change-material storages. Appl. Energy 2013, 109, 497–504. [Google Scholar] [CrossRef]
  3. Gil, A.; Medrano, M.; Martorell, I.; Lazaro, A.; Dolado, P.; Zalba, B.; Cabeza, L.F. State of the art on high temperature thermal energy storage for power generation. Part 1—Concepts, materials and modellization. Renew. Sustain. Energy 2010, 14, 31–55. [Google Scholar] [CrossRef]
  4. Cárdenas, B.; León, N. High temperature latent heat thermal energy storage: Phase change materials, design considerations and performance enhancement techniques. Renew. Sustain. Energy Rev. 2013, 27, 724–737. [Google Scholar] [CrossRef]
  5. Shatikian, V.; Ziskind, G.; Letan, R. Numerical investigation of a PCM-based heat sink with internal fins: Constant heat flux. Int. J. Heat Mass Transf. 2008, 51, 1488–1493. [Google Scholar] [CrossRef]
  6. Seeniraj, R.V.; Lakshmi Narasimhan, N. Performance enhancement of a solar dynamic LHTS module having both fins and multiple PCMs. Sol. Energy 2008, 82, 535–542. [Google Scholar] [CrossRef]
  7. Sharifi, N.; Bergman, T.L.; Faghri, A. Enhancement of PCM melting in enclosures with horizontally-finned internal surfaces. Int. J. Heat Mass Transf. 2011, 54, 4182–4192. [Google Scholar] [CrossRef]
  8. Agyenim, F.; Eames, P.; Smyth, M. Heat transfer enhancement in medium temperature thermal energy storage system using a multitube heat transfer array. Renew. Energy 2010, 35, 198–207. [Google Scholar] [CrossRef]
  9. Beck, A.; Koller, M.; Walter, H.; Hameter, M. Transient numerical analysis of different finned tube designs for the use in latent heat thermal energy storage devices. In Proceedings of the ASME 2015 Power and Energy, San Diego, CA, USA, 28 June–2 July 2015.
  10. Walter, H.; Beck, A.; Hameter, M. Transient analysis of an improved finned tube heat exchanger for thermal energy storage system. In Proceedings of the ASME 2015 Power and Energy, San Diego, CA, USA, 28 June–2 July 2015.
  11. Urschitz, G.; Brier, J.; Walter, H.; Mertz, R.; Bleicher, F.; Haider, M. New design of a bimetallic finned tube for the use in a latent heat thermal energy storage units. In Proceedings of the ASME 2015 Power and Energy, San Diego, CA, USA, 28 June–2 July 2015.
  12. Elgafy, A.; Lafdi, K. Effect of carbon nanofiber additives on thermal behavior of phase change materials. Carbon 2005, 43, 3067–3074. [Google Scholar] [CrossRef]
  13. Mettawee, E.; Assassa, G. Thermal conductivity enhancement in a latent heat storage system. Sol. Energy 2007, 81, 839–845. [Google Scholar] [CrossRef]
  14. Zhang, P.; Song, L.; Lu, H.; Wang, J.; Hu, Y. The influence of expanded graphite on thermal properties for paraffin/high density polyethylene/chlorinated paraffin/antimony trioxide as a flame retardant phase change material. Energy Convers. Manag. 2010, 51, 2733–2737. [Google Scholar] [CrossRef]
  15. Lopez, J.; Caceres, G.; Palomo Del Barrio, E.; Jomaa, W. Confined melting in deformable porous media: A first attempt to explain the graphite/salt composites behaviour. Int. J. Heat Mass Transf. 2010, 53, 1195–1207. [Google Scholar] [CrossRef]
  16. Pincemin, S.; Olives, R.; Py, X.; Christ, M. Highly conductive composites made of phase change material sand graphite for thermal storage. Sol. Energy Mater. Sol. Cells 2008, 92, 603–613. [Google Scholar] [CrossRef]
  17. Salunkhe, P.B.; Shembekar, P.S. A review on effect of phase change material encapsulation on the thermal performance of a system. Renew. Sustain. Energy Rev. 2012, 16, 5603–5616. [Google Scholar] [CrossRef]
  18. Lenert, A.; Nam, Y.; Yilbas, B.S.; Wang, E.N. Focusing of phase change microparticles for local heat transfer enhancement in laminar flows. Int. J. Heat Mass Transf. 2013, 56, 380–389. [Google Scholar] [CrossRef]
  19. Seyf, H.R.; Zhou, Z.; Ma, H.B.; Zhang, Y. Three dimensional numerical study of heat-transfer enhancement by nano-encapsulated phase change material slurry in microtube heat sinks with tangential impingement. Int. J. Heat Mass Transf. 2013, 56, 561–573. [Google Scholar] [CrossRef]
  20. Yang, J.; Du, X.; Yang, L.; Yang, Y. Numerical analysis on the thermal behavior of high temperature latent heat thermal storage system. Sol. Energy 2013, 98, 543–552. [Google Scholar] [CrossRef]
  21. Ermis, K.; Erek, A.; Dincer, I. Heat transfer analysis of phase change process in a finned-tube thermal energy storage system using artificial neural network. Int. J. Heat Mass Transf. 2007, 50, 3163–3175. [Google Scholar] [CrossRef]
  22. Chen, W.Z.; Yang, Q.S.; Dai, M.Q.; Cheng, M. An analytical solution of the heat transfer process during contact melting of phase change material inside a horizontal elliptical tube. Int. J. Energy Res. 1998, 22, 131–140. [Google Scholar] [CrossRef]
  23. Mosaffa, A.H.; Talati, F.; Basirat Tabrizi, H.; Rosen, M.A. Analytical modelling of PCM solidification in a shell and tube finned thermal storage for air conditioning systems. Energy Build. 2012, 49, 356–361. [Google Scholar] [CrossRef]
  24. Tay, N.H.S.; Belusko, M.; Bruno, F. An effectiveness-NTU technique for characterising tube-in-tank phase change thermal energy storage systems. Appl. Energy 2012, 91, 309–319. [Google Scholar] [CrossRef]
  25. Tay, N.H.S.; Bruno, F.; Belusko, M. Experimental validation of a CFD and an ε-NTU model for a large tube-in-tank PCM system. Int. J. Heat Mass Transf. 2012, 55, 5931–5940. [Google Scholar] [CrossRef]
  26. Belhamadia, Y.; Kane, A.S.; Fortin, A. An enhanced mathematical model for phase change problems with natural convection. Numer. Anal. Model. 2012, 3, 192–206. [Google Scholar]
  27. Bellan, S.; Gonzalez-Aguilar, J.; Romero, M.; Rahman, M.M.; Goswami, Y.D.; Stefanakos, E.K.; Couling, D. Numerical analysis of charging and discharging performance of a thermal energy storage system with encapsulated phase change material. Appl. Therm. Eng. 2014, 71, 481–500. [Google Scholar] [CrossRef]
  28. Gupta, S.C. A moving grid numerical scheme for multi-dimensional solidification with transition temperature range. Comput. Methods Appl. Mech. Eng. 2000, 189, 525–544. [Google Scholar] [CrossRef]
  29. Lamberg, P.; Siren, K. Analytical model for solidification in a finite PCM storage with internal fins. Heat Mass Transf. 2003, 39, 167–176. [Google Scholar] [CrossRef]
  30. Florez, W.F.; Power, H.; Chejne, F. Numerical solution of thermal convection problems using the multidomain boundary element method. Numer. Methods Partial Differ. Equ. 2002, 18, 469–489. [Google Scholar] [CrossRef]
  31. Laing, D.; Bauer, T.; Steinmann, W.-D.; Lehmann, D. Advanced high temperature latent heat storage system—Design and test results. In Proceedings of the 11th International Conference on Thermal Energy Storage, Stockholm, Sweden, 14–17 June 2009.
  32. Koller, M.; Walter, H.; Hameter, M. Transient numerical simulation of the melting behavior of NaNO3 in a latent thermal energy storage device using a wire matrix for enhancing the heat transfer. In Proceedings of the 11th International Conference on Heat and Mass Transfer, Budapest, Hungary, 12–14 December 2015.
  33. Voller, V.R.; Cross, M.; Markatos, N.C. An enthalpy method for convection/diffusion phase change. Int. J. Numer. Methods Eng. 1987, 24, 271–284. [Google Scholar] [CrossRef]
  34. Voller, V.R.; Prakash, A. A fixed grid numerical modelling methodology for convection-diffusion mushy region phase-change problems. Int. J. Heat Mass Transf. 1987, 30, 1709–1719. [Google Scholar] [CrossRef]
  35. FLUENT Manual, Chapter 21: Modeling Solidification and Melting; ANSYS, Inc.: Canonsburg, PA, USA, 2001.
  36. Hameter, M.; Walter, H. Influence of the mushy parameter on the numerical simulation of the melting and solidification process of phase change materials. In Proceedings of the 26th European Symposium on Computer Aided Process Engineering, Portorož, Slovenia, 12–15 June 2016.
  37. Bauer, T.; Laing, D.; Tamme, R. Characterization of sodium nitrate as a phase change material. Int. J. Thermophys. 2012, 33, 91–104. [Google Scholar] [CrossRef]
  38. Jriri, T.; Rogez, J.; Bergman, C.; Mathieu, J.C. Thermodynamic study of the condensed phases of NaNO3, KNO3, CsNO3 and their transitions. Thermochim. Acta 1995, 266, 147–161. [Google Scholar] [CrossRef]
  39. Liu, M.; Saman, W.; Bruno, F. Review on storage materials and thermal performance enhancement techniques for high temperature phase change thermal storage systems. Renew. Sustain. Energy Rev. 2012, 16, 2118–2132. [Google Scholar] [CrossRef]
  40. Polyakov, V.D.; Beruli, S.H. Specific weight of alloys from nitrate and nitrite systems of potassium and sodium. Izvest. Siktora Fiz.-Khim. Anal. 1955, 26, 164–172. (In Russian) [Google Scholar]
  41. Janz, G.J.; Krebs, U.; Siegenthaler, H.F.; Tomkins, R.P.T. Molten salts: Volume 3 nitrates, nitrites, and mixtures: electrical conductance, density, viscosity, and surface tension data. J. Phys. Chem. Ref. Data 1972, 1, 581–746. [Google Scholar] [CrossRef]
  42. Bloom, H.; Knaggs, I.W.; Molloy, J.J.; Welch, D. Molten salt mixtures. Part 1: Electrical conductivities, activation energies of ionic migration and molar volumes of molten binary halide mixtures. Trans. Faraday Soc. 1953, 49, 1458–1465. [Google Scholar] [CrossRef]
  43. Janz, G.J.; Allen, C.B.; Bansal, N.P.; Murphy, R.M.; Tomkins, R.P.T. Physical Properties Data Compilations Relevant to Energy Storage, Part II: Molten Salts: Data on Single and Multi-Component Salt Systems; National Bureau of Standards: New York, NY, USA, 1979. [Google Scholar]
  44. Kitade, S.; Kobayashi, Y.; Nagasaka, Y.; Nagashima, A. Measurement of the thermal conductivity of molten KNO3 and NaNO3 by the transient hot-wire method with ceramic coated probes. High Temp. High Press. 1989, 21, 219–224. [Google Scholar]
  45. Koller, M. Numerical Simulation of the Melting and Solidification Process of a Latent Thermal Energy Storage System with Different Methods to Improve the Heat Transfer Surface. Master’s Thesis, Vienna University of Technology, Vienna, Austria, 2015. [Google Scholar]
  46. Urschitz, G.; Walter, H.; Hameter, M. Experimental investigation of a finned mono tube—Latent heat thermal energy storage (LHTES). In Proceedings of the ASME 2014 8th International Conference on Energy Sustainability, Boston, MA, USA, 30 June–2 July 2014. ASME Paper No. ES-FuelCell2014-6338.
  47. Urschitz, G.; Walter, H.; Hameter, M. Laboratory test rig of a LHTES (Latent Heat Thermal Energy Storage): Construction and first experimental results. J. Energy Power Eng. 2014, 8, 1838–1847. [Google Scholar]
  48. Sciacovelli, A.; Verda, V.; Colella, F. Numerical investigation on the thermal performance enhancement in a latent heat thermal storage unit, Nantes, France. In Proceedings of the ASME 2012 11th Biennial Conference on Engineering Systems Design and Analysis, Nantes, France, 2–4 July 2012.
  49. Walter, H.; Beck, A.; Hameter, M. Influence of the fin design on the melting and solidification process of NaNO3 in a thermal energy storage system. J. Energy Power Eng. 2015, 9, 913–928. [Google Scholar]
Figure 1. Heat exchanger tube with wire.
Energies 09 00205 g001
Figure 2. Computational domain and geometry data of the analyzed heat exchanger tube with wired matrix.
Energies 09 00205 g002
Figure 3. Boundary conditions used for the analyzed heat exchanger configuration.
Energies 09 00205 g003
Figure 4. Chronological sequence of the volume averaged temperature and liquid fraction for the phase change material during the melting process.
Energies 09 00205 g004
Figure 5. Contours of the liquid fraction of the PCM during the melting process at different time steps.
Energies 09 00205 g005
Figure 6. Vector plot of the liquid velocity of the molten PCM at different time steps.
Energies 09 00205 g006
Figure 7. Vector plot of the liquid velocity of the PCM 225 s after simulation start.
Energies 09 00205 g007
Figure 8. Chronological sequence of the volume averaged velocity during the charging process.
Energies 09 00205 g008
Figure 9. Chronological sequence of the volume averaged charged power during the melting process.
Energies 09 00205 g009
Figure 10. Chronological sequence of the volume averaged velocity during the discharging process.
Energies 09 00205 g010
Figure 11. Contours of the liquid fraction of the PCM during the discharging process at different time steps.
Energies 09 00205 g011
Figure 12. Chronological sequence of the volume averaged temperature and liquid fraction for the PCM during the discharging process.
Energies 09 00205 g012
Figure 13. Chronological sequence of the volume averaged discharged power per m3 NaNO3 during the solidification process.
Energies 09 00205 g013

