Article

Evaluating Internal Technological Capabilities in Energy Companies

Department of Industrial Engineering, Ajou University, San 5, Woncheon-dong, Yeongtong-gu, Suwon 443-749, Korea
*
Author to whom correspondence should be addressed.
Energies 2016, 9(3), 145; https://doi.org/10.3390/en9030145
Submission received: 5 November 2015 / Revised: 19 February 2016 / Accepted: 19 February 2016 / Published: 1 March 2016
(This article belongs to the Special Issue Multi-Disciplinary Perspectives on Energy and Sustainable Development)

Abstract

:
As global competition increases, technological capability must be evaluated objectively as one of the most important factors for predominance in technological competition and to ensure sustainable business excellence. Most existing capability evaluation models utilize either quantitative methods, such as patent analysis, or qualitative methods, such as expert panels. Accordingly, they may be in danger of reflecting only fragmentary aspects of technological capabilities, and produce inconsistent results when different models are used. To solve these problems, this paper proposes a comprehensive framework for evaluating technological capabilities in energy companies by considering the complex properties of technological knowledge. For this purpose, we first explored various factors affecting technological capabilities and divided the factors into three categories: individual, organizational, and technology competitiveness. Second, we identified appropriate evaluation items for each category to measure the technological capability. Finally, by using a hybrid approach of qualitative and quantitative methods, we developed an evaluation method for each item and suggested a method to combine the results. The proposed framework was then verified with an energy generation and supply company to investigate its practicality. As one of the earliest attempts to evaluate multi-faceted technological capabilities, the suggested model can support technology and strategic planning.

1. Introduction

In an environment of fierce technology competition where firms’ technological capabilities largely determine leading positions [1], it is important to enhance firm capabilities through constant development. For successful technology development, the establishment of a technology strategy is vital [2] and can improve the quality of the technology that is directly related to the continuous growth of firms. Therefore, an exact evaluation of a firm’s technology level should be first implemented [3]. In this context, firms have estimated their technological capabilities in contrast to competitors for a long time as a way to reinforce a company’s competitiveness and seek future growth opportunities [4]. The relevant attempts have been made in the energy sector as well. For example, Panda and Ramanathan [5] presented the technological capability assessment indicators for the electric utility companies, whose field of investigation is composed of strategic, tactical and supplementary capabilities. Moreover, due to the significance of the energy sector to the national economy, the evaluation of technological capability has also been made at the national level, where the capabilities of organizations in the sector can be regarded as the capabilities of the sector. For example, Moghaddam et al. [6] tried to identify technological shortcomings of wind energy sector in Iran by comparing its current capability level with its ideal condition. However, despite that technological innovation and R&D activities in the energy sector are attracting much interest as a way to increase energy efficiency and face the challenges of climate change, the sector showed a relatively low level of R&D expenditure [7,8]. At the same time, the sector has been undergoing significant changes in technology due to the emergence of new and renewable energy sources, necessitating the continuous investment in R&D to cope with the environmental changes in technologies and markets. In order to survive and further grow in this highly uncertain environment, it is becoming increasingly important for a firm to understand its strengths as well as weaknesses in term of its technological capabilities and strengthen its competitive position based on the understanding.
Existing methods to evaluate the level of technological capability can be largely distinguished between quantitative approaches (e.g., patent-based evaluation) and qualitative approaches (e.g., Analytic Hierarchy Process (AHP)). Of these two methods, most firms have used the former through patent information, which has characterized “the nature of the technological environment in which firms operate” [9]. On the other hand, the latter have been used to determine a firm’s technology level by experts [10]. However, both approaches have limitations when only one type of approach is adopted. One is the “restricted results”. For example, patent analysis only estimates the explicit knowledge of patents and so it cannot consider the knowhow embodied in experts. Another is the “robustness of the evaluation results”. Since expert judgments are subjective, the evaluation result can change depending on experts. Especially, as technological knowledge has become complicated, it can be difficult to measure a firm’s capabilities using these current methods.
These problems are more severe when evaluating energy industry firms. As the technologies in these industries include embodied technologies (e.g., infrastructure), they are difficult to measure by using a simple patent analysis method. Additionally, identifying and comparing organization processes may be difficult when external experts perform evaluation tasks. This is due to the wide range of technologies that are applied during processes and the existence of hidden processes. To overcome these limitations, various components that reflect a firm’s technological capabilities should be evaluated collectively. Then, according to the characteristics of the subjects of evaluation, qualitative or quantitative approaches can be applied on a case-by-case basis. Of course, previous studies have suggested a number of approaches to evaluate internal technological capability, but they focus only a part of capability. Hence, a holistic approach is needed to combine the existing approaches to consider the complex multi-faceted technological capabilities in energy companies.
Therefore, this paper proposes a methodology for a multi-faceted, internal technological capability evaluation that reflects the complex properties of technological knowledge, which enables to evaluate the current quality of technology assets and ultimately help increase business excellence. The proposed approach is useful particularly in energy industries that are in need of multi-faceted technological capability evaluations. Thus, it was applied to a natural gas generation and supply company in Korea to identify the company’s strengths and weaknesses in terms of technological capabilities during the strategic roadmapping processes and verified its utility. To achieve the aim of this study, we first divided the internal technological capabilities into three categories (individual, organizational, and technology competitiveness), and then identified appropriate evaluation items of technological capability in each category. Next, we developed an evaluation model by applying a hybrid approach of both qualitative and quantitative methods. Lastly, we synthesized the final evaluation by measuring the weights through AHP, and using the weighted average per item for evaluation. Additionally, as one of the earliest attempts to expand the scope of the evaluation in theory, the suggested model supports technology planning and strategic planning in practice. In other words, the model’s ability to plan improvement strategies for the lacking capabilities of firms will realize business excellence in the long run.
The remainder of this paper is organized as follows: Section 2 briefly reviews the relevant literature for the development of the evaluation model; Section 3 explains the proposed model; Section 4 presents a case of the proposed model; and, Section 5 describes the contributions, limitations, and future directions of this study.

2. Literature Review

2.1. Existing Approaches to Evaluate Technological Capabilities

2.1.1. Definition of Technology

Technology refers to a type of knowledge, technological knowledge, and is defined very diversely [11]. Phaal et al. [12] found that technology is applied with a focus on the knowledge of a company but it is different from normal knowledge: technology should not be considered an exogenous variable that is developed simply by a person’s creativity or a specific event, but as an endogenous variable that affects a system within a system [13]. Thus, a series of processes that enable the successful application of technology is important. Meanwhile, technology is generally provided in a package composed of hardware, software, blueprints, designs, specifications, support services, technical and managerial expertise, exchange of personnel, training, information on use and maintenance, and rights and privileges regarding the use of technology [14]. This can be divided largely into two key components: (1) physical components consisting of products, tools, equipment, blueprints, techniques, and processes; and (2) informational components consisting of management, marketing, production, quality management, reliability, skilled labor, and knowledge within a functional area [15]. Therefore technology that has such structural characteristics has high complexity.
Moreover, as mentioned earlier, as technology falls under the category of knowledge, technology and its effects or impacts are hard to understand accurately. Technology has tacitness, which makes it difficult to be tracked only by pure capital, and, thus, difficult to verify statistically [16]. Therefore, technological knowledge has been measured through the “activities” (e.g., research development, educational training, and various systems related to knowledge circulation) by which knowledge is created and expands, or “outputs” (e.g., science technology papers, number of patent applications or registrations, software related equipment) in which knowledge is contained [17].
The ability to make effective use of such technological knowledge by assimilating, using, adapting and changing existing technologies is called technological capability [18]. It affects process innovation and product innovation [19] and thus can be a basis of competitive advantage. Firms have different level of capabilities, which is determined by their levels of technological knowledge. As technological capability can be acquired through the complex process of technological learning, it must be understood structurally from multi-faceted perspectives rather than from one perspective [20]. A number of previous studies have argued that technological capability is accumulated and embodied in various ways, such as in skills, knowledge, experience and organizational systems [21,22,23,24,25].
Accordingly, this study considers analyzing the following three aspects to determine the overall technological capability of a company. The first one is from the input perspective; we examine how the resources for securing technological capability within an organization are inputted. An important part of technological capability has been regarded as the acquisition of knowledge so as to introduce diversity, and distinctiveness in the organization in comparison to the competitors in the market [26]. The second one is from the process perspective; we consider the process that is needed to integrate the knowledge into different levels of the organization. Firms have various processes of accumulation of technology, such as personnel routines, acquisition of manuals, and the use of training programs, which result in differences in technological capabilities [27]. Finally, the output/outcome perspective is taken into account, which relates to the outputs and/or outcomes that are produced from the knowledge. Technological capability enables a firm to develop new technology, products or processes in response to changing environment by understanding and utilizing technological knowledge [18], which is an essential role of technological knowledge at the firm level. Therefore, this paper presents a reference model of technological capability evaluation based on the input-output model.

2.1.2. Evaluating Technological Capabilities

The evaluation of technological capability should examine the status of a company’s effective technological learning. Therefore, an evaluator should fundamentally determine whether a company has the ability to absorb information, which is important for productive learning, and should focus on the two elements of prior knowledge base and an intensity of effort [28]. Firms should combine both in- and out-flow information through the absorption of new external information in order to be more responsive to their changing competitive environments [29]. Previous studies have found that this absorptive capacity has a positive impact on firm performance [30] and further product innovation [31]. Thus, absorptive capacity needs to be considered as one of the most critical attributes of technological capability. In addition to absorptive capacity, internal technological knowledge can also affect technological capability. Accumulated knowledge enables employees to understand and apply new technology easily. As employees experience trial and error to solve problems, they internalize technological knowledge easily. To reflect this aspect, various evaluation attempts, including focusing on technology assets [32], utilizing patent statistics [33], and measuring job capabilities [34], were conducted.
In methodological terms, existing studies apply a resource-based performance index [35] or quantitative techniques, such as patent-focused derivative techniques [36] or learning curve-based approaches [37], to fields, which are relatively easy to quantify and have clear criteria (e.g., R&D expenditure/sales, number of patents a firm has been granted over a specified period of time). On the other hand, other existing studies determine the degree of technological capabilities by applying professional-oriented qualitative techniques, including the Delphi method, to fields in which subjective factors are likely to be involved (e.g., self-motivation, decision making) instead of accurately measuring the value from the objective perspectives [24]. Therefore, when only one of the techniques is applied to the evaluation of a company’s complex and tacit technological learning process, such as technological capability, the results will be limited [38]. Accordingly, there is a need for a multi-faceted evaluation model that simultaneously uses quantitative and qualitative techniques. This study addresses technological knowledge by adopting a perspective that managing technology through the concept of knowledge management is useful [39], and thus, aims to refine the technological capability assessment model on the basis of the following two perspectives.
(a)
Explicit/Implicit: Technology can be diversely classified by the purpose of the knowledge. Overall, this is classified as explicit knowledge and implicit knowledge [40]. In the view of efficient selection, some may prioritize the evaluation of technological capability by selecting only one form of the knowledge. However, Archibugi and Coco [41] stated that codified knowledge, such as manuals and patents, are as important as knowledge obtained by implicit learning, and suggested that a partial evaluation can overlook a fundamental part of technological capability. Meanwhile, Nonaka [39] argued that knowledge is created through a conversion process of tacit knowledge and explicit knowledge. This process consists of (1) socialization (e.g., an artisans’ technology transfer), which creates more tacit knowledge from tacit knowledge; (2) externalization (e.g., writing, writing patents), which converts tacit knowledge to implicit knowledge; (3) internalization (e.g., experience), which converts implicit knowledge to tacit knowledge; and (4) combination (e.g., general educational practice of creating knowledge by classifying, combining, and categorizing implicit knowledge), which creates more implicit knowledge from implicit knowledge. In this context, Nonaka [42] emphasized the balanced creation of explicit and implicit knowledge and the continuous interaction based on the knowledge of rationality. Ultimately, the evaluation of technological capability should encompass explicit and implicit knowledge.
(b)
Embodied/Dis-embodied: Technological knowledge can be divided into embodied knowledge and dis-embodied knowledge [17]. Embodied technology, as a concept of the embodiment hypothesis, means that technology with a function of “knowledge that is applied to production” becomes embodied into machinery equipment [43]. It can be used as a measurement of production technology. In addition, embodied technology has an important meaning to countries, industries, technological fields, and companies as a “secret of success.” As its level has an impact on the success of technology development in the short term and on potential technology, which comes from technological development results and patents, in the long term [44], the evaluation of technological capability in embodied knowledge is valuable. Meanwhile, if embodied technology expands to the specific knowledge that is dissolved in a series of manufacturing processes and the ideas or knowledge necessary for the improvement of future production and individual technological capability, it can expand to equipment and employee capabilities. This perspective is supported by numerous studies that claim that the knowledge embodied in employees is a core capability of a company, an asset for strategy, and a determinant of competitiveness [45]. Unlike the embodied knowledge of a person or in a form such as equipment, dis-embodied knowledge represents separate efforts to improve technology. At the individual level, dis-embodied knowledge is represented by an exchange between researchers and engineers through individual contact, meeting, and symposia, or an exchange through reading related technological books, papers, and patents. Human mobility [46] and strategic alliance [47] are used as an index for measuring dis-embodied knowledge flows. At an organizational level, dis-embodied knowledge is an element that affects Total Quality Management (TQM), which is employed to achieve business excellence. As shown in a study on the relationship between TQM and a broader field of management theory (see, for example Bauer et al. [48]), the quality of existing products and services, work processes, and the work environment fall under the TQM category of assessment and management. Therefore, the present study aims to measure embodied and dis-embodied knowledge simultaneously.

2.2. Internal Technological Capabilities in Energy Generation and Supply Firms

Most energy generation and supply firms are characterized by process-based industries, in which the structure of work processes is emphasized [49]. They prioritize continuously adapting and improving processes over quickly responding to changing business environments [50]. These industries can be divided into continuous systems industries and batch production systems industries. Continuous systems, which conduct mass production of relatively limited numbers of products, utilize special purpose equipment as found in such industries as textiles, food and beverage, and steel and aluminum processing. Batch production systems, which produce small amounts of a variety of products, use multi-purpose equipment [51]. For firms in these process-based industries, their technological capabilities are seldom revealed by only the products/services they offer. These industries are capital- and know-how intensive and thus multi-facet analysis considering more factors including products/services-related ones is needed to accurately evaluate their technological capabilities.
Therefore, the characteristics of process-based industries should be considered to develop an evaluation model for corporate technological capabilities in energy generation and supply firms. First, the most distinguishing characteristic is that the patenting may not be active in process-based industries, which has long been a representative index to evaluate technological capability and measure the outcomes of organizational capability [52]. Previous studies showed that patent applications are quite a reliable indicator for evaluating technology capabilities and patent-related indices are one of the most commonly approaches to measure organizational technology capabilities [53]. However, patent protection is often weak in many process innovations; it is difficult for rights-holders to prove infringement of process patents and thus adequately protect such patents given lack of access to evidence of infringement by other firms [54]. Due to these difficulties, other mechanisms are used together with patents to protect innovation in process-based industries, meaning that relying only on patent-based indices may lead to biased evaluation of technological capabilities. Existing findings also showed that the outputs of technological knowledge are difficult to grasp through patent statistics [55]. Ultimately, focusing only on process-based industries’ explicit knowledge, such as patents, can generate limited results.
Considering the lack of patenting in process-based industries, we need to establish other criteria than patent-based one to measure technology capabilities in energy firms. For example, what is more critical for quality outputs in process-based industries may be employee’s know-how and prior experiences, which are commonly protected by secrecy. The relevant criteria should be adopted. Moreover, the stable operation of the process is directly linked to business profits in process-based industries and is used as a measure of competitiveness for the equipment industry conducting large-scale production [56]. Thus, it is essential to evaluate the scale and excellence of the assets in possession to measure the technological capabilities of firms in process-based industries.
Another characteristic of process-based industry is that there are a great number of sub-processes and diverse technological factors exist in these industries [57]. Accordingly, it is difficult to secure external experts who can be entrusted to conduct a comprehensive evaluation for such complex sub-processes. Moreover, these processes are often confidential to others and relative evaluation by external experts is likely to be infeasible. Considering the challenges for effective external evaluation, we suggested the use of internal evaluation as a main method and external evaluation as a complementary method. Consequently, both internal and external evaluations are applied to evaluate technological capabilities due to the characteristics of process-based industries. Pursuing objective evaluation metrics, index-based evaluation or evaluation by external experts is adopted when comparative analysis with competitors is feasible. If internal evaluation is required, we tried to get feedbacks from as many sources as possible to reduce subjectivity bias.

3. Development of an Evaluation Model

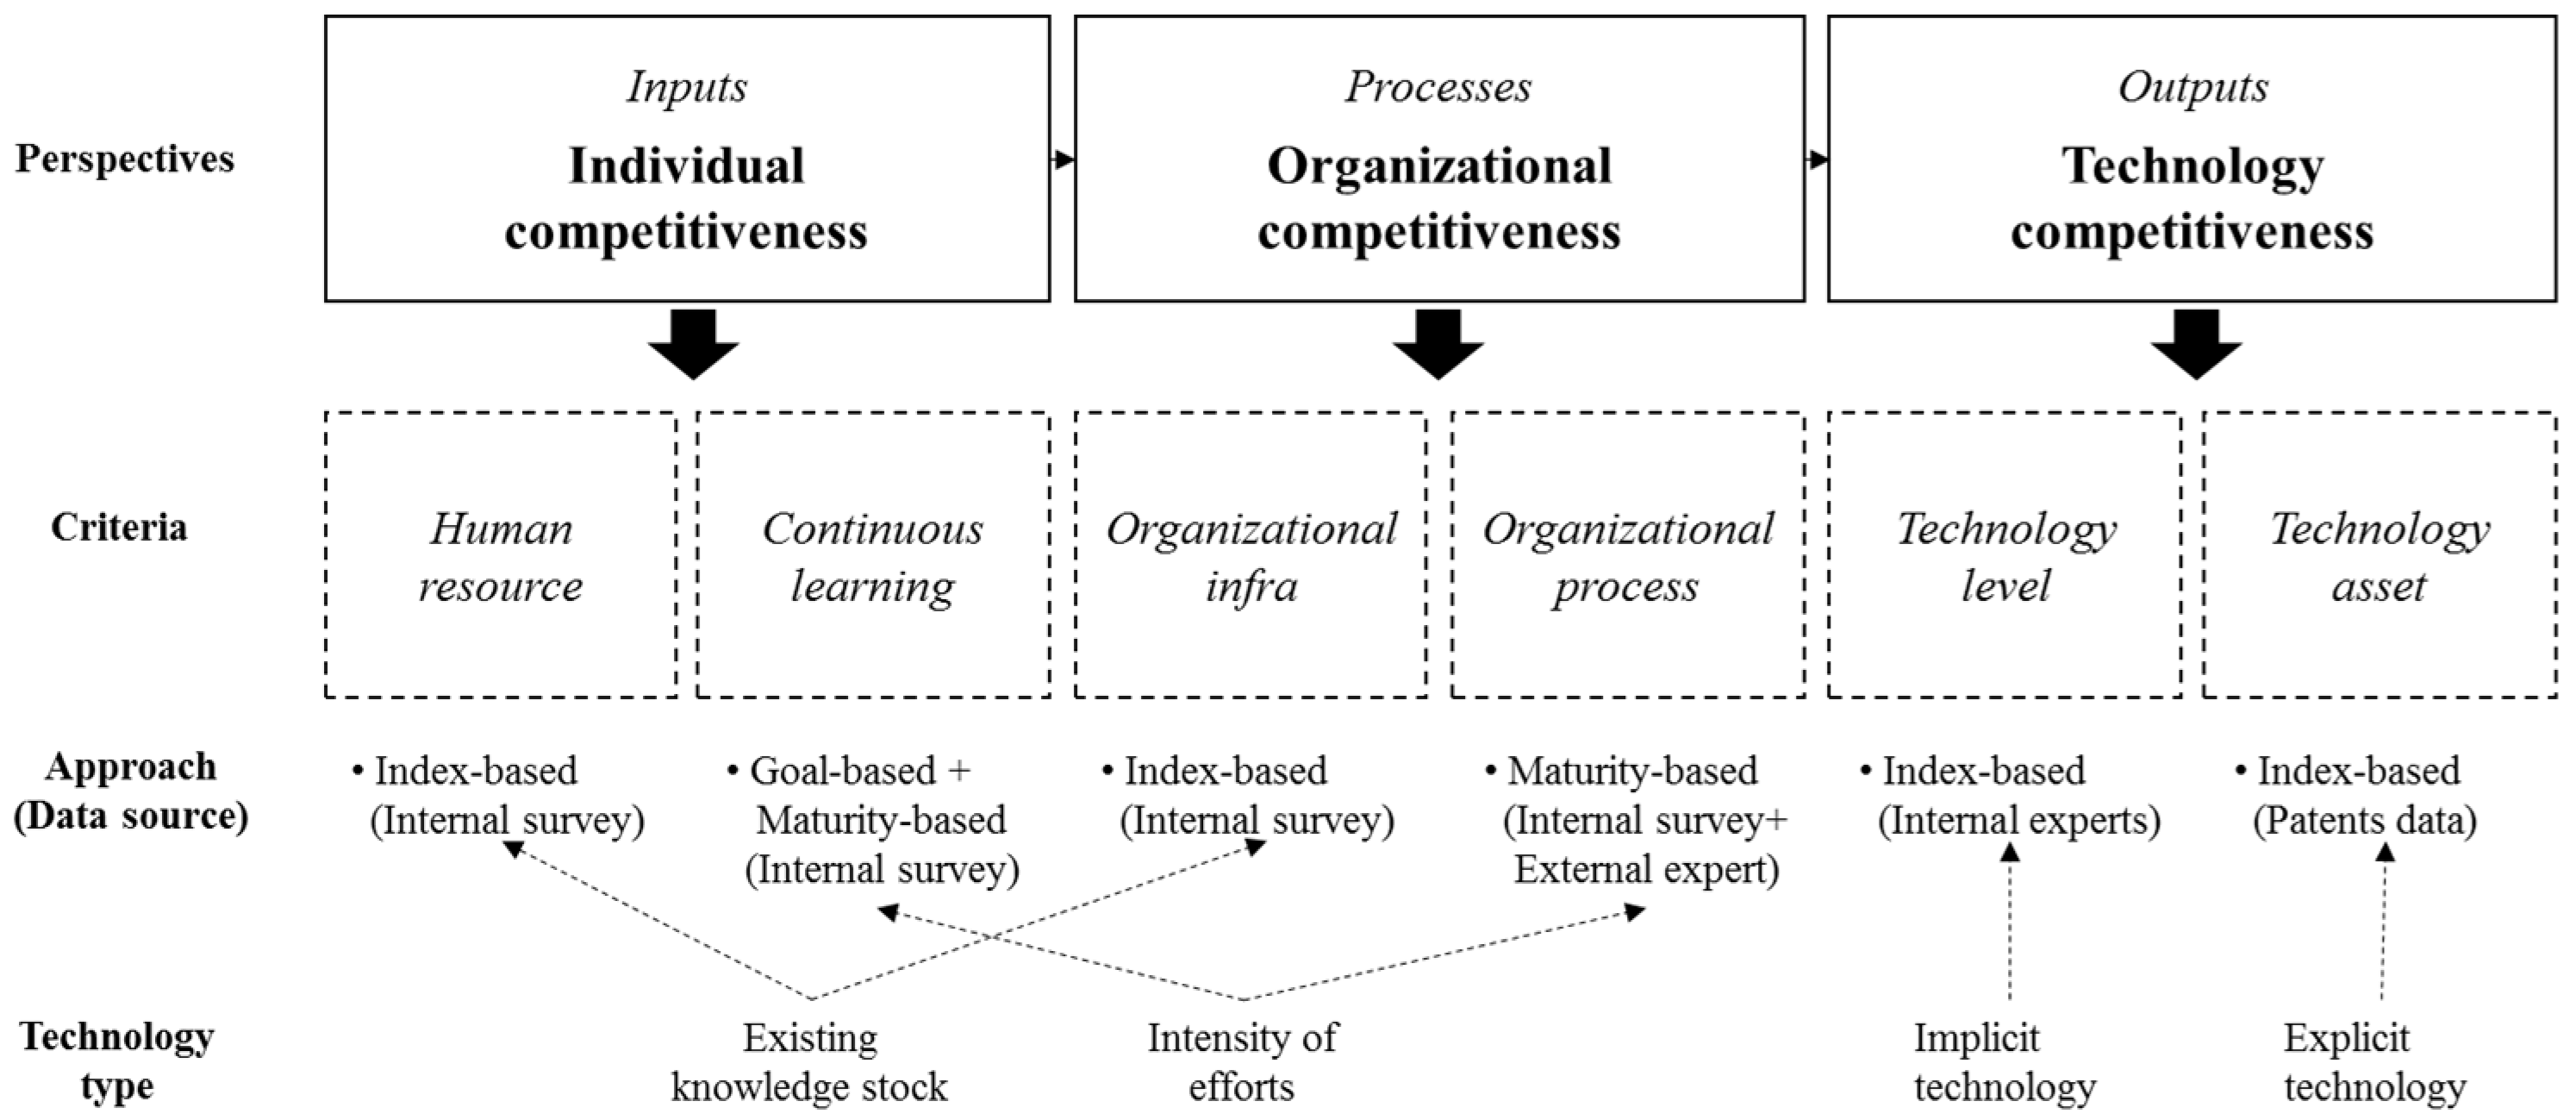
3.1. A Conceptual Framework to Evaluate Internal Technological Capabilities

Technology should be evaluated structurally by its inherent tacitness and complexity. As such, it is desirable to reflect the causality that states “each technological knowledge grows through learning process” in the evaluation of capability. Consequently, a technological capability model must be designed with a focus on “technological learning.” Kim [16] claimed that technological learning occurs at the individual level and at the organizational level, and emphasized that only an effective organization can convert individual learning into organizational learning. An individual is the smallest unit, and the size of organizational learning is not simply a sum of individual learning. Furthermore, Nonaka [42] stated that a source of organizational knowledge creation is the accumulated knowledge of an individual and its quality is determined by the variety of an individual’s knowledge and experience. Further, an environment that can provide an opportunity to grow is important in addition to the quantity of accumulated knowledge. In such context, this study assumes that a larger quantity of technological knowledge and a more supportive environment of a technology-oriented organization are associated with better outputs. This study addresses internal technological capability to focus on the process-based industries that are difficult to evaluate. In summary, based on the input-output model, a model for evaluating the overall internal technological capability is proposed, as shown in Figure 1.
The basic idea is to determine how to insert inputs (individual capabilities) through any process (organizational capabilities), and to assess what outputs (technological results) are produced for the organization’s technological competencies. As a result, when individual competitiveness expands according to the internal environment of the organization and the system, the firm will develop technical excellence. Furthermore, in consideration of the quantity and flow of knowledge, the evaluation of each category of competitiveness is distinguished depending on the type of technological knowledge (explicit vs. implicit), and the kind of knowledge flow (embodied vs. disembodied).
Knowledge that an individual employee has and the quantity of process knowledge that an organization has are measured by a quantitative performance index focused on “existing knowledge stock”. Each performance index evaluates a rate and excellence of knowledge stock by the applicable area. Additionally, from a perspective of technological learning based on the absorptive capability, the acquired knowledge needs to be examined and the “intensity of effort” of converting or creating new knowledge must be measured (e.g., knowledge exchange and knowledge management). This consists of a willingness to strengthen individual and management capabilities and improve processes. As the effort of creating knowledge does not have a specific form, it is evaluated through a survey. A survey of applicable areas consists of goal-based and maturity-based questions. Goal-based evaluation questions determine the status of achievements compared to the absolute goals set by a subject, while maturity-based evaluation questions reflect the level of the Capability Maturity Model Integration (CMMI) of a process. The maturity concept is a systematized comparison that divides goal achievement into five stages (Level 1: Initial; Level 2: Managed; Level 3: Defined; Level 4: Quantitatively Managed; Level 5: Optimizing), and has the prerequisite that one can only move to a next stage after fulfilling the previous stage. This CMMI concept is also applied to the evaluation of processes.
The outputs created through the technological learning of individuals and an organization are divided into “implicit technology” and “explicit technology” in accordance with their degree of tacitness. This is because the technology used in process-based industries is often expressed as explicit knowledge, including patents, as well as tacit knowledge, including procedures and knowledge across a whole process. For tacit knowledge, technology possessed by a subject is measured at the lowest level of element technology rather than the lowest level of final comprehensive technology. For this process, a technology tree is constructed and an analysis of the technology level of a subject compared to domestic and foreign competitors is conducted. For explicit knowledge, the technological assets of a subject are analyzed by using an evaluation index that was developed based on information contained in patent documents. This is also conducted by targeting subjects and competitors in applicable industries.
Lastly, the calculation of the weight of each category of competition is required for the synthesis of the diagnostic results. To this end, the weight of the technological competitiveness is determined by evaluating prior technology asset status and technology levels. The weight of the individual and organizational competitiveness is determined by using the AHP results for internal professionals. Finally, based on the results of this evaluation, the final technological capability level and each respective sphere of competitiveness can be compared through the synthesized evaluation results for the various sub-departments evaluated.

3.2. Evaluation Areas and Criteria

The technological capability evaluation model designed in consideration of the learning capability of individuals and organizations, which drive excellent technology outputs and technological capability, is divided into the three areas of individual, organizational, and technological competitiveness. It is supported by the sub-evaluation area and standards for re-explaining and determining each field, as shown in Table 1.

3.2.1. Individual Competitiveness

Of the capabilities required to carry out assigned tasks within an organization, individual competitiveness measures an individual’s efforts of continuously developing and improving their level of capability within an organization. First, the level of individual capability verifies whether employees fundamentally meet an employee standard and the capabilities required to perform work. This is quantitatively evaluated through the number of employees, related technological certificates, education, and years of service. Meanwhile, the level of effort to improve acquired capabilities and knowledge is also determined. This includes performing self-evaluation. Self-development and cooperation aim to improve acquired capabilities and knowledge through education and self-development activities. However, this is difficult to examine, whereas the effort of employees to achieve and set goals by themselves can be observed. Lastly, through knowledge management, the sharing and managing of the information and knowledge that each individual has at a departmental and corporate level is conducted.

3.2.2. Organizational Competitiveness

Organizational capabilities are recognized as having a significant role to play in development of technological capabilities, though their nature and role are differ by their types [75]. Organizational competitiveness in this study evaluates whether an organization has the work processes and infrastructure that support employees to maximize their abilities at an organizational level. A subject with superior organizational capability has an excellent infrastructure for creating outcomes and a capability to respond to unexpected events by managing such infrastructure. The evaluation of organizational capability is composed of the technological knowledge inherent in the infrastructure, and the standardization, quality management, and issue management, which are activities for managing such knowledge. Here, infrastructure refers to the hardware (HW), software (SW), database (DB), and equipment for carrying out the process. If an applicable organization has high quality infrastructure, extensive technological knowledge is inherent in the organization as well as in each organizational member. To successfully use such infrastructure, work procedures should be standardized by each sub-process. This is because process operation and related work should be systematized at an organizational level. Additionally, monitoring the standardized work (daily work) is verified through quality management, and responding to sudden events is managed through issue management. Absorptive capacity, which is a core element of technological capabilities, has been positioned as a dynamic capability regarding the transformation of organizational routines and resources for organizational improvement [76]. Hence those management activities, focusing on continuous improvement of organizational process, are essential to achieve high level of technological capabilities. Through each of the three elements, an organization that carries out process management well will provide an environment in which an individual’s technological knowledge of processes can be converted into the technological outputs required on site.

3.2.3. Technology Competitiveness

In accordance with the classification of technology outputs as tacit or explicit knowledge, technological competitiveness is evaluated separately for areas where qualitative evaluation techniques are appropriate and areas where qualitative evaluation techniques are not appropriate: (1) evaluation of technology level; and (2) evaluation of technological assets. The evaluation of the technology level is a technique that qualitatively evaluates the element technology owned by a corporate subject by building a technology tree in the research model. A technology tree is an effective bottom-up tool through which all engineers can participate in the technology management process. A technology tree is used as a medium to express and share the technological knowledge that personnel have. Particularly, a technology tree obtains robust results unlike a technology roadmap where results vary by writer and circumstances because it employs static data that analyzes the hierarchical structure of technology in a unit of element technology at a given point. In this context, this evaluation, which seeks to understand the level of the developed core technology functionally, can confirm the level of tacit characteristics of internal technological capability reliably through the creation of a technology tree.
Meanwhile, patents, which are a representative technological asset, are a useful tool to analyze the explicit knowledge of technological capability. As many derivative values are calculated through the collection of patent information, if an evaluation index is used, the results of quantitative analysis can be obtained in line with a particular perspective. For an applicable evaluation, an index focusing on patent activity, patent effect, patent competitiveness, and patent profitability is developed and applied to evaluate technological assets.

3.3. Evaluation Methods

3.3.1. Area-Wise Evaluation

This evaluation model evaluates technological capability, which consists of individual, organizational, and technological competitiveness, by collecting basic data through pre-activities and extracting element technology. The detailed explanation and item-specific evaluation method are as follows.
First, the level of individual and organizational capability is measured by targeting business-specific practitioners of the subject areas. Each assessment was conducted fundamentally through an internal survey, and an evaluation of organizational competitiveness strengthens the objectivity of the results through one-on-one interviews with external professionals in parallel. Human resources and organizational infrastructures are calculated based on the employees’ satisfaction on their quantities and quality. For the continuous learning and organizational process levels, which are evaluated qualitatively, the evaluation method is divided based on the evaluation item. The items of knowledge management, issue management, quality management, and standardization, for which a maturity based relative evaluation is appropriate, conform to a CMMI based evaluation. The CMMI model aims at organization-wise process improvement, although it was initially developed to describe the characteristics of effective processes in the field of software engineering. It is an approach to diagnose and improve the maturity of the process by evaluating the competence level of the current process. The model consists of 22 process areas, for which the objectives, working procedures and core competencies are defined. As the process areas and evaluation criteria are applicable to other areas, it has been widely used as a reference model for process improvement in the field of knowledge management, R&D process management, and organizational energy efficiency management. By the same token, we also adopted the model as a guide to develop the evaluation criteria for the four items. On the other hand, a standard set is important for the items of self-development and cooperation, so the assessment was conducted as a goal-based evaluation, which is also known as an objective-based evaluation. In the goal-based evaluation, the actual outcome of a process is compared to the goal originally stated. In case of self-development and cooperation, it is not easy to set the ideal level of the process or to define their best practices; it is more rational to measure whether the goal has been achieved or not for these two items.
The following is the rating method of the maturity and goal-based evaluations, as shown in Table 2 and Table 3. In this research, we developed our own criteria to evaluate the relevant items referencing the CMMI, which is one of the most widely used models for process maturity evaluation, as was mentioned before. The evaluation acknowledges achievement of the next stage only when the previous stage is achieved, in accordance with the CMMI. Contrary to this, the goal-based evaluation provides a score for achieving an absolute proportion. In Table 2, the upper part shows the conceptual criteria to assess the levels of capability, which need to be customized to evaluation items; the lower part presents how the criteria can be applied to the case of “issue management”. For example, if a firm conducts basic activities to analyze and address causes of an issue, when it occurs, but do not have manuals on the relevant activities, it will achieve maturity level 2 for the item of “issue management”. Similarly, Table 3 indicates the general rule to divide capability of goal-based items into five levels, which can be adjusted to be suitable for the case of “cooperation”. For evaluating the level for this item, all or randomly selected employees in the firm are involved in a survey to answer for a set of questions asking the degree of cooperation. Here, seven questions were designed to be measured by the 5 point-Likert scale in accordance with the 5 level, are designed. The average of all the respondents for the seven items is used as a reference value to assign the final level. For example, if the average value is calculated to be 2.4, Level 2 is assigned to the firm with respect to the item of cooperation.
The evaluation of technology level for the analysis of technological competitiveness is conducted from a perspective of “element technology” evaluation. For this, technologies that are currently being developed or planned are identified by interviewing internal professionals. Based on these technologies, a technology tree, which is a branching diagram that expresses the relationships among processes and technologies, are organized. For this purpose, a technology committee can be operated. Then, for each core technology, the internally assessed technology level of the subject, the information about domestic and foreign competitors together with their technology levels, and the relationship between each technology and the departments are analyzed, as detailed in Table 4. Through this, the levels of department-specific technology can be comparatively analyzed.
Technology level evaluation has the advantage of grasping a level of sub-component technology, which is difficult to approach quantitatively, but it may cause objectivity and reliability issues. To compensate for this, an index that utilizes patents, which represents technological assets, is developed. As a result, technological capability is analyzed by defining and applying patent indices including (1) patent activity; (2) patent effect; (3) patent competitiveness; and (4) patent profitability. The following is the explanation of each patent index.
First, patent activity of technology i for firm j is measured by the number of patents regarding the technology applied by the firm. As a quantitative index to evaluate patent activities, this index indicates that a greater number of patent applications by a company are associated with a greater interest in the technology and intensive R&D activities regarding the technology. Second, we calculated patent effect of technology i for firm j by taking the average value of citations for all patents regarding the technology applied by the firm. Patent citations provide information on the technological importance and effect of innovations. Unlike the amount of patents that show the “degree” of innovation activities, the frequency of patent citations can provide the “quality” of innovation activities, as it can be a proxy measure for technological effect of the innovation on the subsequent innovations. A patent being cited by other patents indicates that the original patent is making long-term, important contributions to future technological development. That is, the higher value of an applicable index is associated with a company that is likely to have high quality core patents or many original patents, and is also likely to have a competitive advantage. Third, patent competitiveness of technology i for firm j is determined by two factors: a share of patents the firm has regarding the technology; and an increase of its patenting activities on the technology in the past five years. The two factor values are multiplied to obtain the patent competitiveness index value. High share and growth rate of patents for a certain technology means that the technology is a priority in the patent portfolio of the firm. In this case, the firm is technologically competitive because the technological innovation is concentrated in it and the concentration is more likely to be high. Finally, patent profitability of technology i for firm j is measured by the average patent family size for all the patents the firm possess regarding the technology. A firm applies for a patent for commercial profit in several countries expecting to run business in the countries. A patent family occurs when a company applies for patents in advance of entering several overseas markets. As a patent is a territorial right, a company must apply for a patent for each country and register if an invention belongs to a country. As the cost of applying for patents in a foreign country is high, a company applies for a patent only when an invention is worth patenting, expecting commercial profits from the invention in the country. Accordingly, larger patent families are associated with greater expected profit from patents, justifying the use of patent family size as a proxy measure of patent profitability.
Here, different indexes have different units and so will produce different ranges of index values. As the weighted average values of the four index values are used to obtain the final capability level of each firm with respect to technological assets, we need to rescale the index values into the same range for all indexes. Thus the index values are then normalized by giving 5 to a maximum value and 1 to a minimum value for each index.

3.3.2. Overall Evaluation

When the evaluation of competitiveness is complete, benchmarking and plans for improvement must be explored by calculating the comprehensive technology of the subject. The values of the area-specific index are added by a weighted average approach after developing a single index that combines the results of the evaluation of the three areas. The AHP method is applied to determine the weight of each index. Developed by Saaty in the 1970s, it is one of the most frequently used multi-criteria decision-making models in various contexts, and has been a simple yet powerful tool in the management science area during the last 35 years [77]. Due to its ability to provide a rational framework for structuring a decision problem, it has been effectively used not only to prioritize alternatives but also to assign weights to decision-making criteria. In general, AHP is conducted in four-step processes. First, a decision problem is decomposed into a hierarchy of interrelated sub-problems. In our case, a decision problem is the assessment of technological capabilities, and the sub-problems correspond to the evaluation criteria and the relevant items. Second, after the hierarchy is built, that is, the evaluation criteria and the relevant items are defined, the decision-makers evaluate its elements by comparing them to one another, two at a time, in regard to their significance for an element above them in the hierarchy. For example, whether “quantity” is more critical than “superiority” to assess the capabilities in terms of “human resource” or not is judged and the relative importance is given by the decision-makers. In our case, managers in our case company were involved in these pair-wise comparisons. Thirdly, the evaluation results are converted to numerical values, based on which a weight value for each element of the hierarchy is estimated. Thus, we can obtain the relative weights of each index, criterion and perspective from the estimation. Lastly, the weights of the decision elements are synthesized to analyze the overall ranking for the various alternatives. However, in our case, the purpose of using the AHP is to derive the relative weights of criteria rather than to choose one best option among several alternatives; the final step is not required. As the required capabilities may vary by department, a different set of weights need to be generated by different departments; an internal manager of each department is engaged in the AHP application to develop a customized set of weights for its department. When several approaches to measure the same item are used, an average value of the levels produced by different approaches can be applied.

4. Application of the Suggested Model

4.1. Background

The internal technological capability evaluation model developed in this study was applied to a natural gas generation and supply company. The company was established in 1983 and hires more than 3500 employees in 2015. As a large scale, basic industry in which a state is directly and indirectly involved, the energy industry must supply stable energy in accordance with consumer demand. It is best for such a supply-oriented industry to efficiently operate production or switch equipment for profits. Accordingly, it is important to secure and manage high quality equipment. Furthermore, as the efforts to reduce global carbon emissions increase, the industry must manage new energy sources. Thus, there is a demand to increase the efficiency of the existing processes through technological innovation. In this respect, our case was an appropriate target company for the present evaluation model, which reflects the individual competitiveness of employees operating processes and process (organizational) competitiveness as well as technological competitiveness.
The case company applied the suggested method to six departments; (1) “production (A)” that takes and produces natural gas by operating LNG (Liquefied National Gas) terminals; (2) “supply (B)”, providing LNG with domestic markets; (3) “safety (C)” to ensure a safe working environment; (4) “exploration (D)” to seek for new energy sources; (5) “R&D (E)” to advance technologies for LNG, facilities, and new/renewable energy; (6) “maintenance (F)” that is in charge of maintenance and upkeep of facilities. Our evaluation results were used to understand the current technological capabilities of each department and further establish organizational long-term technology strategy.
For this purpose, a survey to analyze individual and organizational competitiveness, the construction of technology trees for technology competitiveness, and the collection of patent data were performed. The period in which these were conducted and the status of participants are shown in Table 5.
The survey questionnaire consists of four parts. The first part collects basic information about respondents. The second and third parts were designed to gather information about individual and organizational competitiveness respectively. Different survey questionnaires for different departments were developed considering the differences in processes and tasks. Respondents were required to choose three most relevant tasks on their current jobs. Appendix Table A1 shows a simplified version of the survey questionnaire used for Department B. It includes survey questions to evaluate the levels of goal-based and maturity-based evaluation items. A stratified sampling method was used to control the composition of the sample with respect to different ranks and departments of respondents in a company, ensuring the quality of responses. Considering the time and efforts collect the data, we set the sample size to 1/3 of the total employees. Then, the number of clusters that would be sampled in each strata, each rank and department, was determined, based on which we randomly selected a sample from a list of the employees in the strata. The survey questionnaires were examined by two employees and several feedbacks were received to clarify unclear meanings. Then the revised questionnaires were sent to 1248 employees via online. Among them, 712 were responded, indicating relatively a high response rate of 57.2%. Table 6 represents the information about number of respondents, the average ranks, response rates and year of employment.
To compensate for the survey results that may be a bit subjective, we also conducted an interview with department heads. The interview was driven by an external expert who has professional knowledge on organizational process maturity levels. The target interviewees were department heads who we believe have the most knowledge on their department but other department members were also involved in the interviews when necessary.

4.2. Preliminary Activities

To evaluate the capability of an evaluation subject, basic data must be collected by a sub-department. The basic data of analysis on individual and organizational competitiveness, departmental processes and service, process-specific service characteristics, department-specific key issues, and individual capabilities were collected, and the detailed content is shown in Table 7.
To collect basic technology data, a technology tree that includes the value chain of the energy industry, field of energy, and operation policy was developed. As a result, for 2013, 15 categories, 60 divisions, 160 sections, and 450 element technologies were defined. A structure of sample technology tree is shown in Table 8. For example, if the company has strong technology in T1, a degree of four is assigned to the field of R&D leadership—own company. Similarly, if a leading domestic competitor, DC1, has similar level of technological strength in the T1 field, a rating of four is again assigned to the field of R&D leadership—domestic competitor. On the other hand, if T1 is relevant only to Department C, a rating of five is given to the field of relevant departments—C, while a value of one is given to the fields of other departments.
On the basic level of the technology tree, a keyword for each technology was determined after examining the possibility of patent analysis on the element technologies. As a result, the element technologies of which patent analysis was possible were divided into 10 categories and 33 divisions. The Korean patent search and analysis system “WIPS ON,” and a patent database including the United States Patent and Trademark Office (USPTO), European Patent Office (EPO), Japan Patent Office (JPO), and Korea Institute of Patent Information (KIPO) were used, and a total of 14,924 patents were collected (based on an application date from 1 January 1969 to 31 December 2012).

4.3. Area-Wise Evaluation Results

First, the results of the evaluation of individual competitiveness for Department B are shown in Table 9. Here we presented only the results for Department B that achieved the greatest technology capability level because the main aim of this assessment is not inter-department comparison and thus it could be better to focus on only one department for illustrative example. The average value of responses, when asking the question regarding the satisfaction about the amount of labor inputs using five-point Likert scale, was in between 3 and 4; we assigned the level 3 to Quantity. Similarly, most the respondents for Department B answered that they have enough technological knowledge on their tasks, producing the average value between 4 and 5; we assigned the level 4 to Superiority. On the other hand, on Self-development and Cooperation, we developed several questions to measure the items and the degree of achievements was asked by five-point Likert Scale (see Table 3). Based on the average values of the answers for the questions regarding self-development and cooperation, the two items had the value of 3 and 1 respectively. In case of Knowledge Management, it was evaluated by a maturity-based approach. Seven questions, being asked by five-point Likert Scale, were designed to evaluate the five levels of the capability. If the average value for questions regarding a particular level is the same or greater than 4, we assume that the level was achieved. When several questions were used together to measure one level, the average value for the questions were used to evaluate the level. If lower levels were not achieved, higher levels could not be achieved. Based on these principles, the levels of self-development, cooperation and knowledge management were evaluated to be 3.0, 1.0 and 5.0. The statistics of the answers regarding the relevant survey questionnaires are summarized in Appendix Table A1. When giving the same weights to each of item, the individual competitiveness of employees was found to have an average of 3.2. In particular, the department had cooperation scores of 1, which requires urgent improvement. In addition, the operating personnel’s ability to perform service (quantity) and self-development efforts (self-development) could be improved (see Table 9).
Second, the measurement results of organizational competitiveness are shown in Table 10. The same approach as those for human resources in Table 9 was adopted to evaluate the Quantity and Superiority of organizational infrastructure. For the three items of organizational process, a maturity-based approach was utilized as in the similar way to evaluate knowledge management. The statistics of the answers regarding the relevant survey questionnaires are summarized in Appendix Table A2. However, as an evaluation by an external expert was added for the assessment of organizational process capability, an average of two levels determined by an employee survey and an expert assessment was produced to be used as a final value for the items as shown in Table 10. For standardization and quality management, the competitiveness of Departments B was very high, while it had had relatively low value for issue management. The total evaluation results of organizational competitiveness corresponded to 3.9, when the same weights were given to each item.
Finally, the evaluation of the technology level was conducted by applying an absolute level and an integrated level that considered a relative level comparing domestic and foreign companies, targeting the element technology grasped through the technology tree. If the value of R&D leadership of a particular technology in the company corresponds to 3, the absolute level for the technology becomes 3. On the contrary, if the value of R&D leadership of the same technology in leading competitors is the same as 3 with the case company, its integrated level becomes 5 (=(3/3) × 5). The technology level for each department is calculated by the average of absolute and relative levels (both domestic and foreign) of element technologies related to the department, where a weighted average method was used by giving a weight value of 5 to very highly relevant technologies, 4 to highly relevant technologies, and 3 to moderately relevant technologies. Accordingly, we could obtain the value of 2.81 for absolute level and 3.73 for integrated level. From the four perspectives of patent activity, patent effect, patent competitiveness, and patent profitability, an analysis of technological assets was conducted for each technological area for four patent offices (Korea, U.S., Japan, and Europe). After the patent index values were obtained for top 20 companies in the energy industry. Then, the index values were compared to calculate the level of item by setting the maximum score of each index as 5 points. As a result of the analysis on the capabilities between organizations shown in Table 11, Department B was found to have superior patent activity and competitiveness compared to other companies.

4.4. Overall Evaluation

The evaluation results for competitiveness were further integrated with weight. The results of AHP were used for individual and organizational competitiveness. The target respondents of AHP survey was again a department head, who is a top manager of the department.
On the other hand, a 25% weight of each expert-based evaluation and patent-based evaluation was reflected for technology competitiveness since all the four factors were expected to have the equal weights. As a result, the weights shown in Table 12 were obtained. Then the weights were used to calculate the final results of internal technological capabilities as shown in the table. According to the table, Departments B had a competitive level of 3.42. It had relatively high level of organizational competitiveness, while low level of technology competitiveness where continuous improvement is needed.

5. Conclusions

Due to the increased importance of evaluating technology capability with increased global competition, this study presents a methodology for diagnosing the current level of an organization’s internal technological capability by focusing on energy industries. To accomplish this, qualitative evaluations via interviews and surveys were conducted while classifying them by area. The satisfaction index was designed to evaluate the quantity and excellence of the corresponding capability. CMMI and goal-based evaluation were applied to qualitative evaluation. Although each interview and survey adopted CMMI, which is a representative process evaluation technique, an approach based on a goal-based evaluation technique, was also used for fields where CMMI is difficult to apply. In addition, we conducted patent analysis to ensure the reliability of evaluation results. This study extends existing technological capability evaluations by including individual and organizational capabilities that impact the technological capabilities. There is a need to focus on internal capability, which is difficult to compare with external capability given the characteristics of process-based industries such as energy industries. Accordingly, this study conducts a balanced evaluation based on the input-output model, which is carried out by “input (individual competitiveness) → process (organizational competitiveness) → output (technological competitiveness).” These three evaluation perspectives evaluate the process and technological knowledge across all inputs and outputs. The evaluation model suggested in this study was applied to a natural gas generation and supply company case, which is in a representative process-based industry. It was used to create a plan to improve technological capability through the development and operation of a program that complements the insufficient technological capability. Therefore, the usefulness and validity of the model were verified.
The contributions of this study are as follows. First, the suggested internal technological capability model can be used to reveal not only technology, but also the effects of an organization and individuals on technological capability. Unlike existing evaluation methods that focus on patents that are the technological outputs of processes or reflect the economic value of technological assets, this method differs in that it directly evaluates the capabilities of individuals who are a source of technology development, use, and improvement; Second, considering the characteristics of technological knowledge, the suggested evaluation model constructs the evaluation items through a consistent perspective, despite the expanded evaluation scope. This refers to the explicit knowledge represented by patents, which includes the tacit knowledge of the procedures and knowledge throughout the process, as well as the embodied and disembodied knowledge that spans individual employees and the whole organization. In other words, although evaluation subjects change, they support a balanced evaluation while not changing the basic evaluation framework. Accordingly, the results of this study can be used to evaluate the technological capability within process-based industries as they can easily be converted and applied according to the characteristics of an organization, while not changing the purpose of the evaluation; Third, this technological capability evaluation is a multi-faceted evaluation system that applies both quantitative and qualitative evaluation techniques. Previous evaluations have mostly adhered to quantitative evaluation techniques due to time and cost restrictions. However, this evaluation uses survey and interview methods to target technological knowledge, which are suitable for qualitative evaluation, and patent indices, which are suitable for quantitative evaluation. Accordingly, this is one of the earliest attempts to evaluate multi-faceted technological capabilities, expecting to contribute to the field of quality assessment.
Practically, the research output is expected to help understand the status of the technological capability of companies in the energy sector and further provides guidelines for technology development and capability improvement. In particular, we found that the technology capabilities in energy firms need to be evaluated from multiple perspectives as was indicted by the weights given to evaluation criteria in Table 12. According to the table, the most significant criteria influencing the technology capabilities of our case firm include “technology level judged by internal experts”, “quantity of infrastructure”, and “issue management of operational process”. These criteria were not considered adequately in the existing methods, which have commonly focused only on the outputs of process (e.g., patents, publications, and quality), whether they be products or services. Unlike the existing methods, the proposed method deliberated not only outputs but only inputs and processes that can have a direct effect on the outputs. By reflecting the technological characteristics of firms in the energy sector, the method can be used effectively to evaluate their technological capabilities and ultimately to help invest their limited R&D funding efficiently at the right place in the right order; it enables for evaluators to avoid fragmentary results and free themselves from producing biased results. Also, it should be noted that although the suggested approach was developed in response to the difficulties of applying the existing capability assessment approaches to energy firms, the approach can be used in any firms that want to evaluate their technological capabilities from multiple perspectives and improve their weakness.
Despite these contributions, this study has the following limitations and, thus, further study is needed. First, a guideline on pre-activities for the evaluation should be developed. For example, choosing an appropriate target for survey respondents is a significant issue. The time and cost of evaluations can be reduced if only appropriate personnel are extracted from industry rather than all personnel. And yet, different results can be obtained if different respondents are involved in the evaluation. How to select the most qualified person should be studied. Second, a plan for improving reliability of evaluation results is needed. Relying on internal experts or internal surveys may involve the subjectivity of evaluation results. The greatest challenge of the suggested approach is to reduce it. To prepare for them, we encouraged internal experts who evaluated the level of element technologies to provide the basis for their evaluation. We also introduced an external expert in the evaluation of organizational process. More external examiners or interview subjects should be used to increase the reliability of evaluation results. Third, the limitations of the internal evaluation of the technology tree for technological competitiveness should be presented. For process-based industries, as only a few members know about applicable sub-technology fields, a technology tree is developed by relying on internal subject matter experts. Moreover, the technology level index based on the technology tree is also scaled by these employees. Therefore, there is no process to verify the results. Further study is needed to address this issue.

Acknowledgments

This work was partially supported by the National Research Foundation of Korea (NRF) grant funded by the Korea government (MSIP) (NRF-2013R1A2A2A03016904).

Author Contributions

Lee, Mingook and Lee, Sungjoo conceived and designed the research; Lee, Mingook performed the research and analyzed the data; Lee, Sungjoo supervised the research; Lee, Mingook wrote the paper.

Conflicts of Interest

The authors declare no conflict of interest.

Appendix

Table A1. Survey results to assess individual competitiveness—Department B.
DivisionSectionSurvey ItemAverageStandard DeviationAssessmentLevel
Human resourceQuantity1 item3.541.08Less than 43.0
Superiority *139 tasks4.160.57Less than 54.0
Capacity building willingnessSelf-development *3 items3.181.04Less than 43.0
Cooperation *7 items1.981.08Less than 21.0
Knowledge managementLevel 2(a)4.140.78Fully achieved5.0
Level 2(b)4.140.84
Level 3(a)4.150.78Fully achieved
Level 3(b)4.050.88
Level 3(c)4.010.89
Level 44.010.87Fully achieved
Level 54.040.91Fully achieved
* The value was calculated as the average of values for all the relevant survey items.
Table A2. Survey results to assess organizational competitiveness—Department B.
DivisionSectionSurvey ItemAverageStandard DeviationAssessmentLevel
InfrastructureQuantity *2 items4.500.98Less than 54
Superiority *13 items4.050.87
Process capabilityStandardizationLevel 2(a)4.330.68Fully achieved5
Level 2(b)4.230.66
Level 3(a)4.280.73Fully achieved
Level 3(b)4.190.73
Level 44.180.77Fully achieved
Level 5(a)4.180.79Fully achieved
Level 5(b)4.070.81
Quality managementLevel 2(a)4.380.67Fully achieved5
Level 2(b)4.480.63
Level 3(a)4.520.58Fully achieved
Level 3(b)4.500.60
Level 3(c)4.390.73
Level 4(a)4.430.72Fully achieved
Level 4(b)4.450.64
Level 54.490.59Fully achieved
Issue managementLevel 2(a)4.480.61Fully achieved5
Level 2(b)4.530.59
Level 3(a)4.360.67Fully achieved
Level 3(b)4.500.62
Level 4(a)4.440.62Fully achieved
Level 4(b)4.430.64
Level 54.460.61Fully achieved
* The value was calculated as the average of values for all the relevant survey items.

References

  1. Figueiredo, P.N. Beyond technological catch-up: An empirical investigation of further innovative capability accumulation outcomes in latecomer firms with evidence from Brazil. J. Eng. Technol. Manag. 2014, 31, 73–102. [Google Scholar] [CrossRef]
  2. Zahra, S.A. Technology strategy and new venture performance: A study of corporate-sponsored and independent biotechnology ventures. J. Bus. Ventur. 1996, 11, 289–321. [Google Scholar] [CrossRef]
  3. Ford, D. Develop your technology strategy. Long Range Plan. 1988, 21, 85–95. [Google Scholar] [CrossRef]
  4. Lowe, A.; Ridgway, K.; Atkinson, H. QFD in new production technology evaluation. Int. J. Prod. Econ. 2000, 67, 103–112. [Google Scholar] [CrossRef]
  5. Panda, H.; Ramanathan, K. Technological capability assessment of a firm in the electricity sector. Technovation 1996, 16, 561–588. [Google Scholar] [CrossRef]
  6. Moghaddam, N.B.; Mousavi, S.M.; Moallemi, E.A.; Yousefdehi, H. Wind energy status of Iran: Evaluating Iran’s technological capability in manufacturing wind turbines. Renew. Sustain. Energy Rev. 2011, 15, 4200–4211. [Google Scholar] [CrossRef]
  7. Costa-Campi, M.T.; García-Quevedo, J.; Trujillo-Baute, E. Challenges for R&D and innovation in energy. Energy Policy 2015, 83, 193–196. [Google Scholar]
  8. Margolis, R.M.; Kammen, D.M. Underinvestment: the energy technology and R&D policy challenge. Science 1999, 285, 690–692. [Google Scholar] [PubMed]
  9. Jaffe, A.B. Characterizing the “technological position” of firms, with application to quantifying technological opportunity and research spillovers. Res. Policy 1989, 18, 87–97. [Google Scholar] [CrossRef]
  10. Chiu, Y.J.; Chen, Y.W. Using AHP in patent valuation. Math. Comput. Modell. 2007, 46, 1054–1062. [Google Scholar] [CrossRef]
  11. Steele, L.W. Managing Technology—The Strategic View; McGraw-Hill: New York, NY, USA, 1989. [Google Scholar]
  12. Phaal, R.; Farrukh, C.J.; Probert, D.R. Technology roadmapping—A planning framework for evolution and revolution. Technol. Forecst. Soc. 2004, 71, 5–26. [Google Scholar] [CrossRef]
  13. Dosi, G. Technological paradigms and technological trajectories: A suggested interpretation of the determinants and directions of technical change. Res. Policy 1982, 11, 147–162. [Google Scholar] [CrossRef]
  14. Mansfield, E.; Romeo, A. Technology transfer to overseas subsidiaries by US-based firms. Q. J. Econ. 1980, 737–750. [Google Scholar] [CrossRef]
  15. Kumar, V.; Kumar, U.; Persaud, A. Building technological capability through importing technology: The case of Indonesian manufacturing industry. J. Technol. Transf. 1999, 24, 81–96. [Google Scholar] [CrossRef]
  16. Kim, L. Building technological capability for industrialization: Analytical frameworks and Korea’s eperience. Ind. Corp. Chang. 1999, 8, 111–136. [Google Scholar] [CrossRef]
  17. Knowledge-Based Economy; OECD (Organisation for Economic Cooperation and Development): Paris, France, 1996.
  18. Kim, L. From Imitation to Innovation: Dynamics of Korea’s Technological Learning; Harvard University Press: Boston, MA, USA, 1997. [Google Scholar]
  19. Camison, C.; Villar-Lopez, A. Organizational innovation as an enabler of technological innovation capabilities and firm performance. J. Bus. Res. 2014, 67, 2891–2902. [Google Scholar] [CrossRef]
  20. Zahra, S.A.; Ireland, R.D.; Hitt, M.A. International expansion by new venture firms: International diversity, mode of market entry, technological learning, and performance. Acad. Manag. J. 2000, 43, 925–950. [Google Scholar] [CrossRef]
  21. Cortes de Castro, E.; Figueiredo, P.N. Does technological learning pay off? Inter-firm differences in technological capability-accumulation paths and operational performance improvement. Res. Policy 2005, 31, 73–94. [Google Scholar]
  22. Dutrénit, G. Building technological capabilities in latercomer firms: A review essay. Sci. Technol. Soc. 2004, 9, 209–214. [Google Scholar] [CrossRef]
  23. Figueiredo, P.N. Industrial policy changes and firm-level technological capability development: Evidence from Northern Brazil. World Dev. 2007, 36, 55–88. [Google Scholar] [CrossRef]
  24. Jonker, M.; Romijn, H.; Szirmai, A. Technological effort, technological capabilities and economic performance: A case study of the paper manufacturing sector in West Java. Technovation 2006, 26, 121–134. [Google Scholar] [CrossRef]
  25. Romijn, H.; Albaladejo, M. Determinants of innovation capability in small electronics and software firms in South East England. Res. Policy 2002, 31, 1053–1067. [Google Scholar] [CrossRef]
  26. Leonard-Barton, D. Wellsprings of Knowledge; Harvard University Press: Boston, MA, USA, 1995. [Google Scholar]
  27. Dosi, G. Sources, procedures and microeconomic effects of innovation. J. Econ. Lit. 1988, 26, 1120–1171. [Google Scholar]
  28. Cohen, W.M.; Levinthal, D.A. Absorptive capacity: A new perspective on learning and innovation. Adm. Sci. Q. 1990, 35, 128–152. [Google Scholar] [CrossRef]
  29. Camison, C.; Forés, B. Knowledge absorptive capacity: New Insights for its conceptualization and measurement. J. Bus. Res. 2010, 63, 707–715. [Google Scholar] [CrossRef]
  30. Cepeda-Carrión, G.; Cegarra-Navarro, J.G.; Jimenez, D. The effect of absorptive capacity on innovativeness: Context and information systems capability as catalysts. Brit. J. Manag. 2012, 23, 110–129. [Google Scholar] [CrossRef]
  31. Kocoglu, I.; Akgun, A.E.; Keskin, H. The differential relationship between absorptive capacity and product innovativeness: A theoretically derived framework. Int. Bus. Res. 2015, 8, 108–120. [Google Scholar] [CrossRef]
  32. Chiesa, V.; Frattini, F.; Gilardoni, E.; Manzini, R.; Pizzurno, E. Searching for factors influencing technological asset value. Eur. J. Inn. Manag. 2007, 10, 467–488. [Google Scholar] [CrossRef]
  33. Motohashi, K. Assessment of technological capability in science industry linkage in China by patent database. World Pat. Inf. 2008, 30, 225–232. [Google Scholar] [CrossRef]
  34. Golec, A.; Kahya, E. A fuzzy model for competency-based employee evaluation and selection. Comput. Ind. Eng. 2007, 52, 143–161. [Google Scholar] [CrossRef]
  35. Bharadwaj, A.S. A resource-based perspective on information technology capability and firm performance: An empirical investigation. MIS Q. 2000, 24, 169–196. [Google Scholar] [CrossRef]
  36. Park, J.; Lee, H.; Park, Y. Disembodied knowledge flows among industrial clusters: A patent analysis of the Korean manufacturing sector. Technol. Soc. 2009, 31, 73–84. [Google Scholar] [CrossRef]
  37. Takahashi, K.; Yamane, Y.; Hamada, K.; Morikawa, K.; Bahagia, S.; Diawati, L.; Cakravastia, A. Quantifying the technology level of production system for technology transfer. Ind. Eng. Manag. Syst. 2011, 10, 97–103. [Google Scholar]
  38. Creswell, J.W. Research Design: Qualitative, Quantitative, and Mixed Approaches, 4th ed.; SAGE: Thousand Oaks, CA, USA, 2013. [Google Scholar]
  39. Nonaka, I. The knowledge-creating company. Harv. Bus. Rev. 1991, 69, 96–104. [Google Scholar]
  40. Chen, C.J. The effects of knowledge attribute, alliance characteristics, and absorptive capacity on knowledge transfer performance. R&D Manag. 2004, 34, 311–321. [Google Scholar]
  41. Archibugi, D.; Coco, A. Measuring technological capabilities at the country level: A survey and a menu for choice. Res. Policy 2005, 34, 175–194. [Google Scholar] [CrossRef]
  42. Nonaka, I. A dynamic theory of organizational knowledge creation. Organ. Sci. 1994, 5, 14–37. [Google Scholar] [CrossRef]
  43. Jorgenson, D.W. The embodiment hypothesis. J. Political Econ. 1966, 74, 1–17. [Google Scholar] [CrossRef]
  44. Rubenstein, A.H. Managing Technology in the Decentralized Firm; John Wiley and Sons: New York, NY, USA, 1989. [Google Scholar]
  45. Hall, R. The strategic analysis of intangible resources. Strateg. Manag. J. 1992, 13, 135–144. [Google Scholar] [CrossRef]
  46. Criscuolo, P. On the road again: Researcher mobility inside the R&D network. Res. Policy 2005, 34, 1350–1365. [Google Scholar]
  47. Gay, B.; Dousset, B. Innovation and network structural dynamics: Study of the alliance network for a major sector of the biotechnology industry. Res. Policy 2005, 34, 1457–1475. [Google Scholar] [CrossRef]
  48. Bauer, J.; Falshaw, R.; Oakland, J.S. Implementing business excellence. Total Qual. Manag. Bus. Excell. 2005, 16, 543–553. [Google Scholar] [CrossRef]
  49. Larger, T. A new conceptual model for the development of process technology in process industry: A point of departure for the transformation of the “Process Development Process” into a formal work process? Int. J. Inn. Manag. 2000, 4, 319–346. [Google Scholar]
  50. Freeman, C. Technical innovation in the world chemical industry and changes of techno-economic paradigm. In New Explorations in the Economics of Technical Change; Freeman, C., Soete, L., Eds.; Frances Printer: London, UK, 1990. [Google Scholar]
  51. Kallrath, J. Planning and scheduling in the process industry. OR Spectr. 2002, 24, 219–250. [Google Scholar] [CrossRef]
  52. Griliches, Z. Patent statistics as economic indicators: A survey. J. Econ. Lit. 1990, 28, 1661–1707. [Google Scholar]
  53. Acs, Z.J.; Anselin, L.; Varga, A. Patents and innovation counts as measures of regional production of new knowledge. Res. Policy 2002, 31, 1069–1085. [Google Scholar] [CrossRef]
  54. Prud’homme, D. Dulling the Cutting Edge: How Patent-Related Policies and Practices Hamper Innovation in China. Available online: http://ssrn.com/abstract=2190293 (accessed on 23 February 2016).
  55. Acs, Z.J.; Audretsch, D.B. Patents as a measure of innovative activity. Kyklos 1989, 42, 171–180. [Google Scholar] [CrossRef]
  56. Pavitt, K. Sectoral patterns of technical change: Towards a taxonomy and a theory. Res. Policy 1984, 13, 343–373. [Google Scholar] [CrossRef]
  57. Shah, N. Process industry supply chains: Advances and challenges. Comput. Chem. Eng. 2005, 29, 1225–1235. [Google Scholar] [CrossRef]
  58. Holsapple, C.W.; Joshi, K.D. Organizational knowledge resources. Decis. Support. Syst. 2001, 31, 39–54. [Google Scholar] [CrossRef]
  59. MacDuffie, J.P. Human resource bundles and manufacturing performance: Organizational logic and flexible production systems in the World Auto Industry. ILR Rev. 1995, 48, 197–221. [Google Scholar] [CrossRef]
  60. Orvis, K.A.; Ratwani, K.L. Leader self-development: A contemporary context for leader development evaluation. Leadersh. Q. 2010, 21, 657–674. [Google Scholar] [CrossRef]
  61. Katz, J.S.; Martin, B.R. What is research collaboration? Res. Policy 1997, 26, 1–18. [Google Scholar] [CrossRef]
  62. Tyler, B.B. The complementarity of cooperative and technological competencies: A resource-based perspective. J. Eng. Technol. Manag. 2001, 18, 1–27. [Google Scholar] [CrossRef]
  63. Chuang, S.H. A resource-based perspective on knowledge management capability and competitive advantage: An empirical investigation. Expert Syst. Appl. 2004, 27, 459–465. [Google Scholar] [CrossRef]
  64. Kulkarni, U.; Freeze, R. Development and validation of a knowledge management capability assessment model. In Proceedings of the 25th International Conference on Information System, Washington, DC, USA, 12–15 December 2004.
  65. Byrd, T.A.; Turner, D.E. An exploratory examination of the relationship between flexible IT infrastructure and competitive advantage. Inf. Manag. 2001, 39, 41–52. [Google Scholar] [CrossRef]
  66. Rai, A.; Patnayakuni, R.; Seth, N. Firm performance impacts of digitally enabled supply chain integration capabilities. MIS Q. 2006, 30, 225–246. [Google Scholar]
  67. Münstermann, B.; Weitzel, T. What is process standardization? In Proceedings of the 2008 International Conference on Information Resources Management (Conf-IRM), Niagara Falls, ON, Canada, 18–20 May 2008.
  68. Lobo, S.R.; Matawie, K.M.; Samaranayake, P. Assessment and improvement of quality management capabilities for manufacturing industries in Australia. Total Qual. Manag. Bus. Excell. 2012, 23, 103–121. [Google Scholar] [CrossRef]
  69. Vergidis, K.; Turner, C.J.; Tiwari, A. Business process perspectives: Theoretical developments vs. real-world practice. Int. J. Prod. Econ. 2008, 114, 91–104. [Google Scholar] [CrossRef]
  70. Guglielmi, M.; Williams, E.; Groepper, P.; Lascar, S. The technology management process at the European space agency. Acta. Astronaut. 2010, 66, 883–889. [Google Scholar] [CrossRef]
  71. Ernst, H. Evaluation of Dynamic Technological Developments by Means of Patent Data; Springer: Berlin, Germany, 1999; pp. 103–132. [Google Scholar]
  72. Michel, J.; Bettels, B. Patent citation analysis. A closer look at the basic input data from patent search reports. Scientometrics 2001, 51, 185–201. [Google Scholar] [CrossRef]
  73. Chen, Y.S.; Chang, K.C. Exploring the nonlinear effects of patent citations, patent share and relative patent position on market value in the US pharmaceutical industry. Technol. Anal. Strateg. Manag. 2010, 22, 153–169. [Google Scholar] [CrossRef]
  74. Lall, S. Building Industrial Competitiveness in Developing Countries; OECD (Organisation for Economic Cooperation and Development): Paris, France, 1990. [Google Scholar]
  75. Rousseva, R. Classifying organisational capabilities by their nature and role for technological capability. In Proceedings of the British Academy of Management Conference, Brighton, UK, 15–17 September 2009.
  76. Vera, D.; Crossan, M.; Apaydin, M. A Framework for Integrating Organizational Learning, Knowledge, Capabilities, and Absorptive Capacity. In Handbook of Organizational Learning and Knowledge Management; Easterby-Smith, M., Lyles, M., Eds.; Wiley: Hoboken, NJ, USA, 2011. [Google Scholar]
  77. Saaty, T.L. The Analytical Hierarchy Process; McGraw-Hill: New York, NY, USA, 1980. [Google Scholar]
Figure 1. Technological capability evaluation model.
Energies 09 00145 g001
Table 1. Evaluation areas, criteria, and indexes for evaluating technological capabilities.
PerspectivesCriteriaIndexesDescriptionReferences
Individual competitivenessHuman resourceQuantityProvision of necessary human resources[58,59]
SuperiorityProfessionalism of staff
Continuous learningSelf-developmentConducting self-development activities[60]
CooperationParticipation in exchange and cooperation activities[61,62]
Knowledge managementDB operation and data management[63,64]
Organizational competitivenessOrganizational infrastructureQuantityEnsuring the necessary infrastructure[65,66]
SuperiorityExcellence of owned infrastructure
Organizational processStandardizationStandardization of operation processes[67]
Quality managementExcellence of process quality management[68]
Issue managementAbility to prevent and manage irregular work[69]
Technology competitivenessTechnology levelTechnology leadershipLevel of R&D leadership[70]
Technology assetPatent activityThe number of patent applications[71]
Patent effectThe average number of patent citations[72]
Patent competitivenessPatent share and growth rate of patents[73]
Patent profitabilityThe average size of the patent family[74]
Table 2. Maturity based rating criteria.
LevelDescriptionConceptual Criteria
5(Optimizing) Optimal stage at which a standard process is continuously improved.
4(Quantitatively Managed) Measuring and predicting step for quantitative control of the process.
3(Defined) Step at which the activity is planned and managed by standard processes.
2(Managed) Step at which the activity plan and planned activities are tracked and managed.
1(Initial) Incomplete step at which there is no output that can identify processes.
LevelDescription—A Case of “Issue Management”
5Effort of preventing a problem is continued based on data analysis and a support system.
4Data on issue management activity is collected and analysis is conducted.
3Manuals on handling issues and the support system are built and managed.
2Basic activity for analysis of and addressing causes of an issue is carried out.
1An issue was inadequately addressed or it was dependent on an individual worker’s skills.
Table 3. Goal based rating criteria.
LevelDescriptionConceptual Criteria
5Achieved more than 85% of target level.
4Achieved more than 70% of target level, but less than 85%.
3Achieved more than 60% of target level, but less than 70%.
2Achieved more than 50% of target level, but less than 60%.
1Achieved less than 50% of target level
LevelDescription—A Case of “Cooperation”
5Individual participation for cooperation and achievement of organization’s goals through cooperation is very high. (Planned vs. achieved: greater than and equal to 85%)
4Individual participation for cooperation and achievement of organization’s goals through cooperation is relatively high. (Planned vs. achieved: greater than and equal to 70% and less than 85%)
3Individual participation for cooperation and achievement of organization’s goals through cooperation is somewhat high. (Planned vs. achieved: greater than and equal to 60% and less than 70%)
2Some of Individual participation for cooperation and achievement of organization’s goals through cooperation were made. (Planned vs. achieved: greater than and equal to 50% and less than 60%)
1Almost no individual participation for cooperation and achievement of organization’s goals through cooperation were made. (Planned vs. achieved: less than 50%)
Table 4. Evaluation items for technology level analysis.
CategoryDescription
Evaluation of technology levelOwn companyEvaluating the level of the element technologies in own company
Dominant > Strong > Favorable > Tenable > Weak
Domestic competitor(s)Providing information about domestic competitor and evaluating the level of the element technologies in them
Dominant > Strong > Favorable > Tenable > Weak
Foreign competitor(s)Providing information about foreign competitor and evaluating the level of the element technologies in them
Dominant > Strong > Favorable > Tenable > Weak
Matching between division and technologyAssessing the relevance of the organization and the factors described in step 5
5 points: high relevance ↔ 1 points: no relevance
Table 5. Basic data collection for evaluating technological capabilities.
PerspectivesCriteriaCollection MethodData SourceCollection Period
Individual competitivenessHuman resourceSurvey712 employees21–31 July 2014
Continuous learning
Organizational competitivenessOrganizational infrastructure
Organizational process
Interview (External expert)one per department (total of six)7–13 August 2014
Technology competitivenessTechnology levelConstruction of technology treeTechnological expert group25 June 2014
Technology assetPatent collectionEurope (EU), Japan (JP), Korea (KR), United States (US) patent office25 June 2014
Table 6. Basic information about survey respondents.
CategoryABCDEFTotal
Number of respondents133222272410296712
Response rate53.4%46.3%41.5%70.6%50.0%74.7%57.2%
Average ranks *4.34.34.03.53.84.5-
Year of employments13.213.111.513.415.414.4-
*: The ranks range from one to sever.
Table 7. Preliminary evaluation entries for the individual and organizational competitiveness.
CategoryDescription
Processes and laborIdentify key processes and process-specific labor
Characteristics of the labor by processDetailed activities: Listing labor related to the core business
Required competencies: Listing core competencies required of personnel for work performed
Systems/SW: Listing core systems, SW, and data required to perform the work
Equipment/facilities (HW): Listing the key facilities and equipment required for the work performed
Major departmental issuesIssues that do not arise in the day-to-day: (1) Task problems that need to be solved; and (2) Suddenly given tasks
Individual capabilityRequired departmental certification: Qualification lists for successful job performance
Self-development activities: Types of self-development activities to continually enhance the capabilities
Table 8. Technology tree sample.
CategoryDivisionSectionElement TechnologyR&D LeadershipRelevant Departments
Own CompanyDomestic CompetitorForeign CompetitorABCDEF
ProductionBuildingDesignT14DC1(4)FC1(5)115111
Operation
Table 9. Results of analysis on individual competitiveness—Department B.
CriteriaItemEvaluation ResultsEvaluation Methods
Human resourceQuantity3.0Index-based
Superiority4.0Index-based
Continuous learningSelf-development3.0Goal-based
Cooperation1.0Goal-based
Knowledge management5.0Maturity-based
Total evaluation results of individual competitiveness3.2-
Table 10. Results of analysis on organizational competitiveness—Department B.
CriteriaItemEvaluation ResultsEvaluation Methods
Organizational infrastructureQuantity4.0Index-based
Superiority4.0Index-based
Organizational processStandardizationSurvey: 5.04.5Maturity-based
Expert: 4.0
Quality managementSurvey: 5.05.0Maturity-based
Expert: 5.0
Issue managementSurvey: 5.03.5Maturity-based
Expert: 2.0
Total evaluation results of organizational competitiveness-3.9-
Table 11. Results of analysis on technological competitiveness—Department B.
CriteriaItemEvaluation ResultsEvaluation Methods
Technology levelIntegrated level3.73Index-based
Technology assetPatent activity1.90Index-based
Patent effect0.95Index-based
Patent competitiveness1.14Index-based
Patent profitability4.73Index-based
Total evaluation results of technology competitiveness2.49-
Table 12. Final evaluation results of internal technological capability.
CategoryCriteriaItemWeightArea-WisePerspective-Wise
Individual competitivenessHuman resourceQuantity2.40%3.003.26
Superiority4.75%4.00
Capacity building willingnessSelf-development3.20%3.00
Cooperation2.55%1.00
Knowledge management2.10%5.00
Organizational competitivenessInfrastructureQuantity9.45%4.004.15
Superiority6.40%4.00
Process capabilityStandardization6.35%4.50
Quality management5.75%5.00
Issue management7.05%3.50
Technology competitivenessTechnology levelIntegrated level25.00%3.733.00
Technology assetPatent activity6.25%1.90
Patent effect6.25%0.95
Patent competitiveness6.25%1.14
Patent profitability6.25%4.73
Total evaluation results of technology competitiveness--3.42

