Article

Temperature Field Accurate Modeling and Cooling Performance Evaluation of Direct-Drive Outer-Rotor Air-Cooling In-Wheel Motor

1
State Key Laboratory of Robotics and System, Harbin Institute of Technology, Harbin 150001, China
2
Department of Electrical Engineering, Harbin Institute of Technology, Harbin 150001, China
3
Shanghai MOONS’ Electric Co., Ltd., Shanghai 201107, China
*
Author to whom correspondence should be addressed.
Energies 2016, 9(10), 818; https://doi.org/10.3390/en9100818
Submission received: 24 July 2016 / Revised: 20 September 2016 / Accepted: 8 October 2016 / Published: 14 October 2016
(This article belongs to the Special Issue Advanced Thermal Simulation of Energy Systems)

Abstract

:
High power density outer-rotor motors commonly use water or oil cooling. A reasonable thermal design for outer-rotor air-cooling motors can effectively enhance the power density without the fluid circulating device. Research on the heat dissipation mechanism of an outer-rotor air-cooling motor can provide guidelines for the selection of the suitable cooling mode and the design of the cooling structure. This study investigates the temperature field of the motor through computational fluid dynamics (CFD) and presents a method to overcome the difficulties in building an accurate temperature field model. The proposed method mainly includes two aspects: a new method for calculating the equivalent thermal conductivity (ETC) of the air-gap in the laminar state and an equivalent treatment to the thermal circuit that comprises a hub, shaft, and bearings. Using an outer-rotor air-cooling in-wheel motor as an example, the temperature field of this motor is calculated numerically using the proposed method; the results are experimentally verified. The heat transfer rate (HTR) of each cooling path is obtained using the numerical results and analytic formulas. The influences of the structural parameters on temperature increases and the HTR of each cooling path are analyzed. Thereafter, the overload capability of the motor is analyzed in various overload conditions.

1. Introduction

Nowadays, energy shortage and environmental pollution are two increasingly serious problems in the world. The energy resources for vehicles will be exhausted if people use them in an unreasonable way. As a result, electric vehicles gradually become popular and make up a big proportion in transportation [1]. The in-wheel motors, as the power unit of electric vehicles, receive considerable attention in this aspect [2]. Direct-drive outer-rotor motors are used extensively because of their high transmission efficiency [3]. The outer-rotor motors experience more difficulties in heat dissipation than inner-rotor motors. Meanwhile, high power density outer-rotor motors commonly employ water or oil cooling [4]. Accordingly, a reasonable thermal design of outer-rotor air-cooling motors can effectively enhance the power density without the fluid circulating device. Currently, this enhancement is a direction for the further development of in-wheel motors. Determining the heat dissipation mechanism of this type of motor and calculating the limit values in various overload conditions are necessary to develop a reasonable design for the cooling structure of an air-cooling motor. Research on the heat dissipation mechanism of outer-rotor air-cooling motors can provide guidelines for the selection of the cooling mode and design of the cooling structure of such machines.
Currently, the numerical calculation method is a major approach in the study of the cooling performance of motors [5]. The numerical method requires building an accurate temperature field model. The modeling difficulties of the motor mainly include the following aspects. (1) The first aspect involves the accurate calculation of heat transfer through the air-gap. The air-gap is considerably short, thereby causing the heat transfer performance to be easily influenced by the fluid flow state. (2) Considerable attention is given to the equivalent treatment for the thermal circuit comprising the hub, shaft, and bearings. All these components are made of metals, which perform well in heat conduction. (3) The gap between two interconnected objects should be considered because such a gap can substantially affect the temperature field calculation of air-cooling motors.
Building a thermal model of the air-gap is currently done through three methods. The first is the heat transfer coefficient (HTC) method. The air-gap domain is not built, and HTCs of the rotor-side and stator-side cylinders are determined using an empirical formula for the Nusselt number. The two concentric cylinders of the air-gap contribute a convection connection [6,7,8]. The second is the coupled field method (CFM). The fluid domain of the air-gap is built and the rotor-side cylinder is provided with a rotating speed. The fluid and temperature fields are coupled [9]. The third is the equivalent thermal conductivity (ETC) method. The air-gap is seen as solid, and the ETC of the air-gap is obtained using empirical formulas [10,11]. In terms of high to low accuracies, the arrangement of the methods starts from CFM, HTC, to ETC. Accordingly, the ETC method has the highest calculation efficiency, followed by the HTC method and the CFM. Moreover, the calculation efficiency of the ETC method is substantially higher than that of the other two methods. Thus, the ETC method is a suitable choice when its calculation accuracy can satisfy the requirements.
For the outer-rotor air-cooling motors, the heat generated from the stator mainly transfers to the end caps and enclosure through the air-gap. If this type of motor adopts the ETC method, then the accuracy of the air-gap ETC must be ensured. Otherwise, the precision of the motor temperature field will be affected.
A direct-drive in-wheel motor is often mounted on the wheel without a reducer, which makes the motor have low speed and small size [12]. Accordingly, the air flow inside the air-gap is laminar. Thus, using ETC with an air-gap in the laminar state is necessary. The conventional method used to calculate the air-gap ETC is sectional. The ETC is considered the thermal conductivity of still air in the laminar state, and obtained using the empirical formula for the turbulent state [13,14,15]. However, the air-gap is better than still air in heat transfer performance when the Reynolds number of the air-gap is near the critical Reynolds number.
The current study adopts the following methods by considering the aforementioned factors. (1) The thermal model of the air-gap adopts the ETC method and provides a new method to calculate ETC in the laminar state. (2) The heat transfer mode of the thermal circuit comprising the hub, shaft, and bearings receives the equivalent treatment from heat conduction to heat convection, and a suitable HTC is applied to the cylinder of the stator yoke. (3) Adopting the CFD method for numerical analysis is necessary because the HTCs of the rotary end caps are difficult to calculate accurately. The three-dimensional (3D) temperature field of the motor is calculated numerically using the preceding methods, and the results are experimentally verified. The HTR of each cooling path is obtained using the numerical results and analytic formulas. The influences of the structure parameters on temperature increases and HTR of each cooling path are analyzed. Thereafter, the overload capability of the motor is analyzed in various overload conditions.

2. Accurate Modeling of the Temperature Field

This section describes the methods to calculate the air-gap ETC in the laminar state and the equivalent treatment to the thermal circuit of the hub–shaft–bearing.

2.1. Accurate Calculation of the Air-Gap Equivalent Thermal Conductivity (ETC)

In the heat transfer research of the air-gap in the laminar state, Gazley measured the thermal conductivity of a cross-section in the air-gap height direction. Results show that heat transfers from one surface to another, and the intensity of the heat exchange is independent of the rotating speed [16].
With increasing rotating speed, which is limited in the laminar state, the heat transfer performance of the air-gap improves constantly. The thermal conduction property of the air inside the air-gap is not enhanced but the HTC of the two cylinders is reinforced. The improvement of the HTC is caused by the fluid flow in the air-gap, which implies an improvement in the heat transfer of the two cylinders when calculating the air-gap ETC.
The definition of the Nusselt number describes Nu as follows:
N u = α 1 L 1 λ 1
where α1 is the average HTC of the two cylinders of the air-gap, L1 is the characteristic surface length, and λ1 is the thermal conductivity of the still coolant. In this case, L1 is twice the length of the air-gap [7], and λ1 is the thermal conductivity of still air; both variables are constant. As the speed of the motor increases from 0 to the limiting value, which is the maximum speed rendering the air-gap in the laminar state, α1 becomes larger and Nu increases constantly. This relationship shows the increased effect of heat convection on the heat transfer of the air-gap.
The total thermal resistance between the stator and rotor comprises three thermal resistances in series. Figure 1 shows the thermal circuit of the air-gap. RS2 is the convection thermal resistance of the rotor-side cylinder. RC is the conduction thermal resistance of the air-gap. RS1 is the convection thermal resistance of the stator-side cylinder.
The average convection thermal resistance of the two cylinders RS is provided and is defined as (RS1 + RS2)/2. 
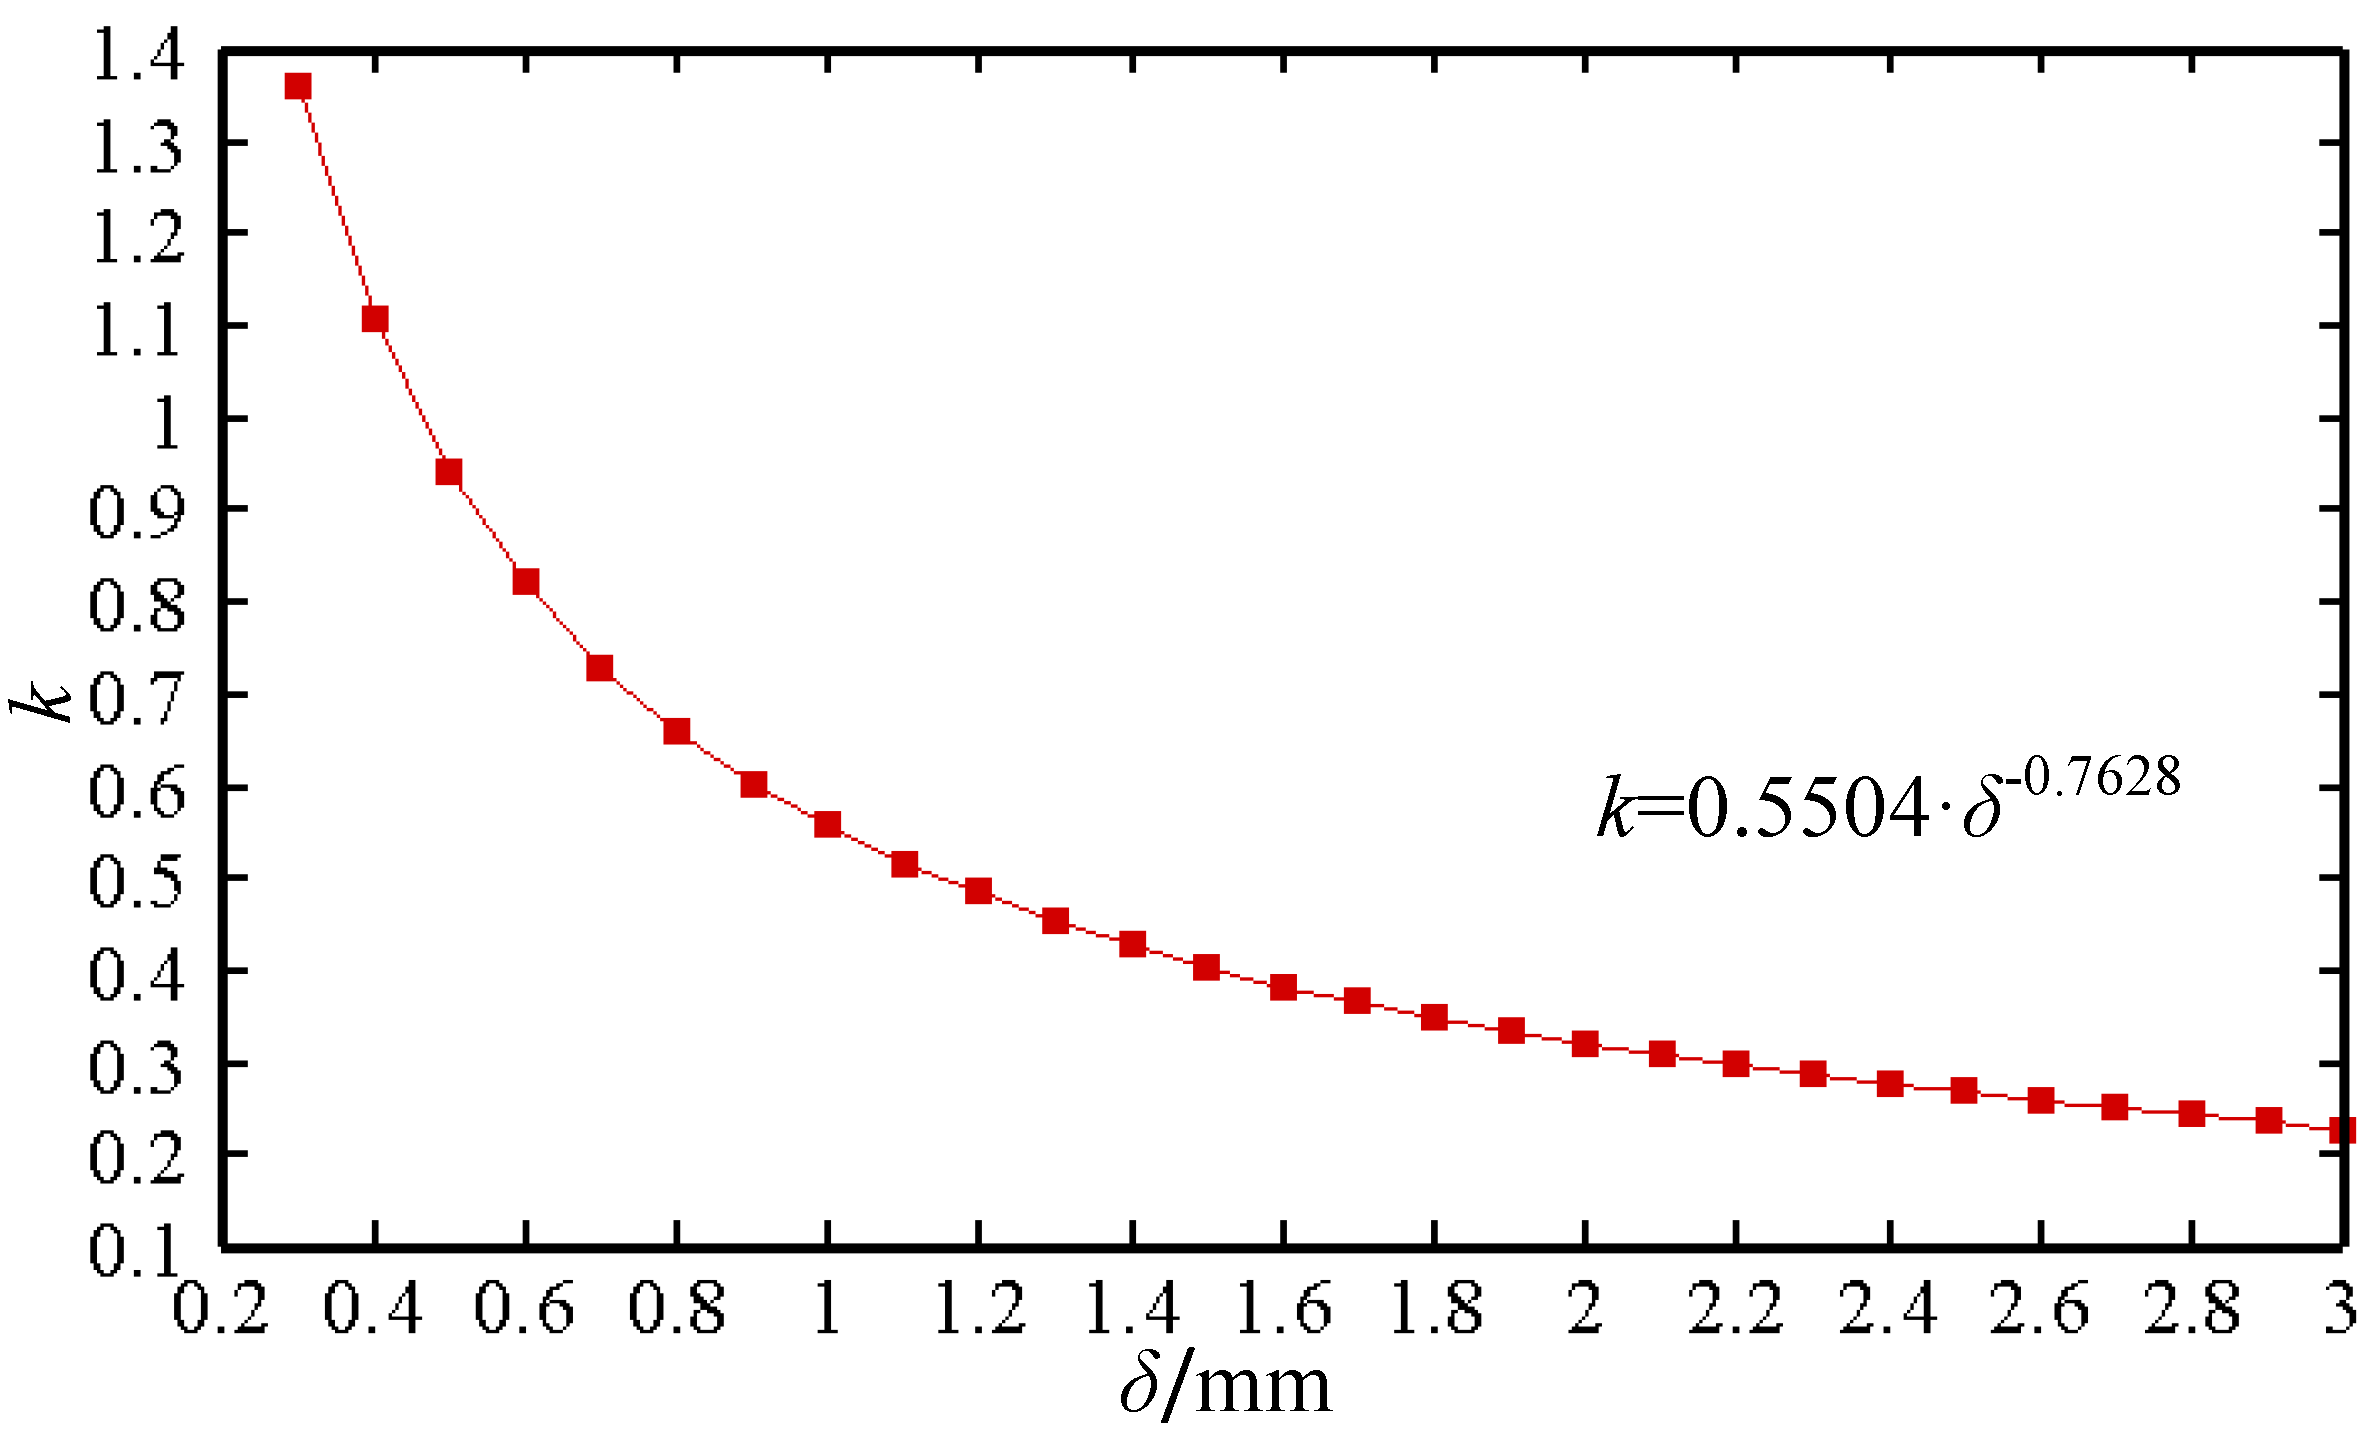
k is the critical point to determine the air-gap ETC in the laminar state. When RS/RC > k, the thermal conductivity of the air-gap equals the thermal conductivity of still air. When RS/RC < k, the thermal resistance of the two cylinders promotes the heat transfer performance of the air-gap, and the thermal conductivity of the air-gap is larger than that of still air. k is only related to the length of air-gap δ. Figure 2 shows the relationship curve of k and δ.
The conduction thermal resistance of the air-gap RC can be calculated using the following equation:
R C = δ λ 1 S a
where Sa is the mean area of the two cylinders.
The average convection thermal resistance of the two cylinders RS can be calculated using the following equation:
R S = 1 α 1 S a
where α1 can be obtained using the following equation [17]:
α 1 = 28 ( 1 + 0.5 V )
where V is the velocity of the rotor-side cylinder.
The length of the air-gap is constant for a common motor, thereby making k and RC constant as well. With the speed of the motor constantly increasing from 0, α1 increases gradually and RS decreases constantly. When RS is equal to the product of k and RC, the speed is the critical speed n1 and the air-gap ETC is λ1. n1 can be calculated using the following equation:
n 1 = 60 π r 2 ( λ 1 28 k δ 1 ) 2
where r2 is the radius of the rotor-side cylinder.
The speed continues to increase from n1. When the speed reaches the limiting speed n2, which is the maximum speed rendering the air-gap in the laminar state, the air-gap ETC is λ2. n2 can be calculated using the following equation:
n 2 = 30 R e c ν π r 2 L 1
where ν is the kinematic viscosity of air. Rec is the critical Reynolds number, which can be acquired using the following equation [18]:
R e c = 41.2 r 2 L 1
λ2 can be obtained via the following equation [13,14]:
λ 2 = 0.0019 η 2.9084 R e 0.4614 ln ( 3.3361 η )
where r1 is the radius of the stator-side cylinder; η is the ratio of r1 and r2 and its range is 0 < η < 1; Re is the Reynolds number, which can be calculated using the following equation:
R e = π n r 2 L 1 30 ν
where n is the speed of the motor. When the range of n is [n1, n2], the corresponding range of the air-gap ETC, λeff, is [λ1, λ2], and λeff is mainly affected by RS. With the constant decrease in RS, λeff increases gradually. λeff n (∝ means proportional) because of the relationship of RS ∝ 1/α and α ∝ n . When the air-gap is in the laminar state, λeff with a speed of n, can be obtained using the following equation:
{ R S R C > k , λ e f f = λ 1 R S R C k , λ e f f = λ 2 λ 1 n 2 n 1 ( n n 1 ) + λ 1
When the air-gap is in the turbulent state, the air-gap ETC can be calculated using Equation (8).

2.2. Equivalent Treatment of the Hub–Shaft–Bearing Thermal Circuit

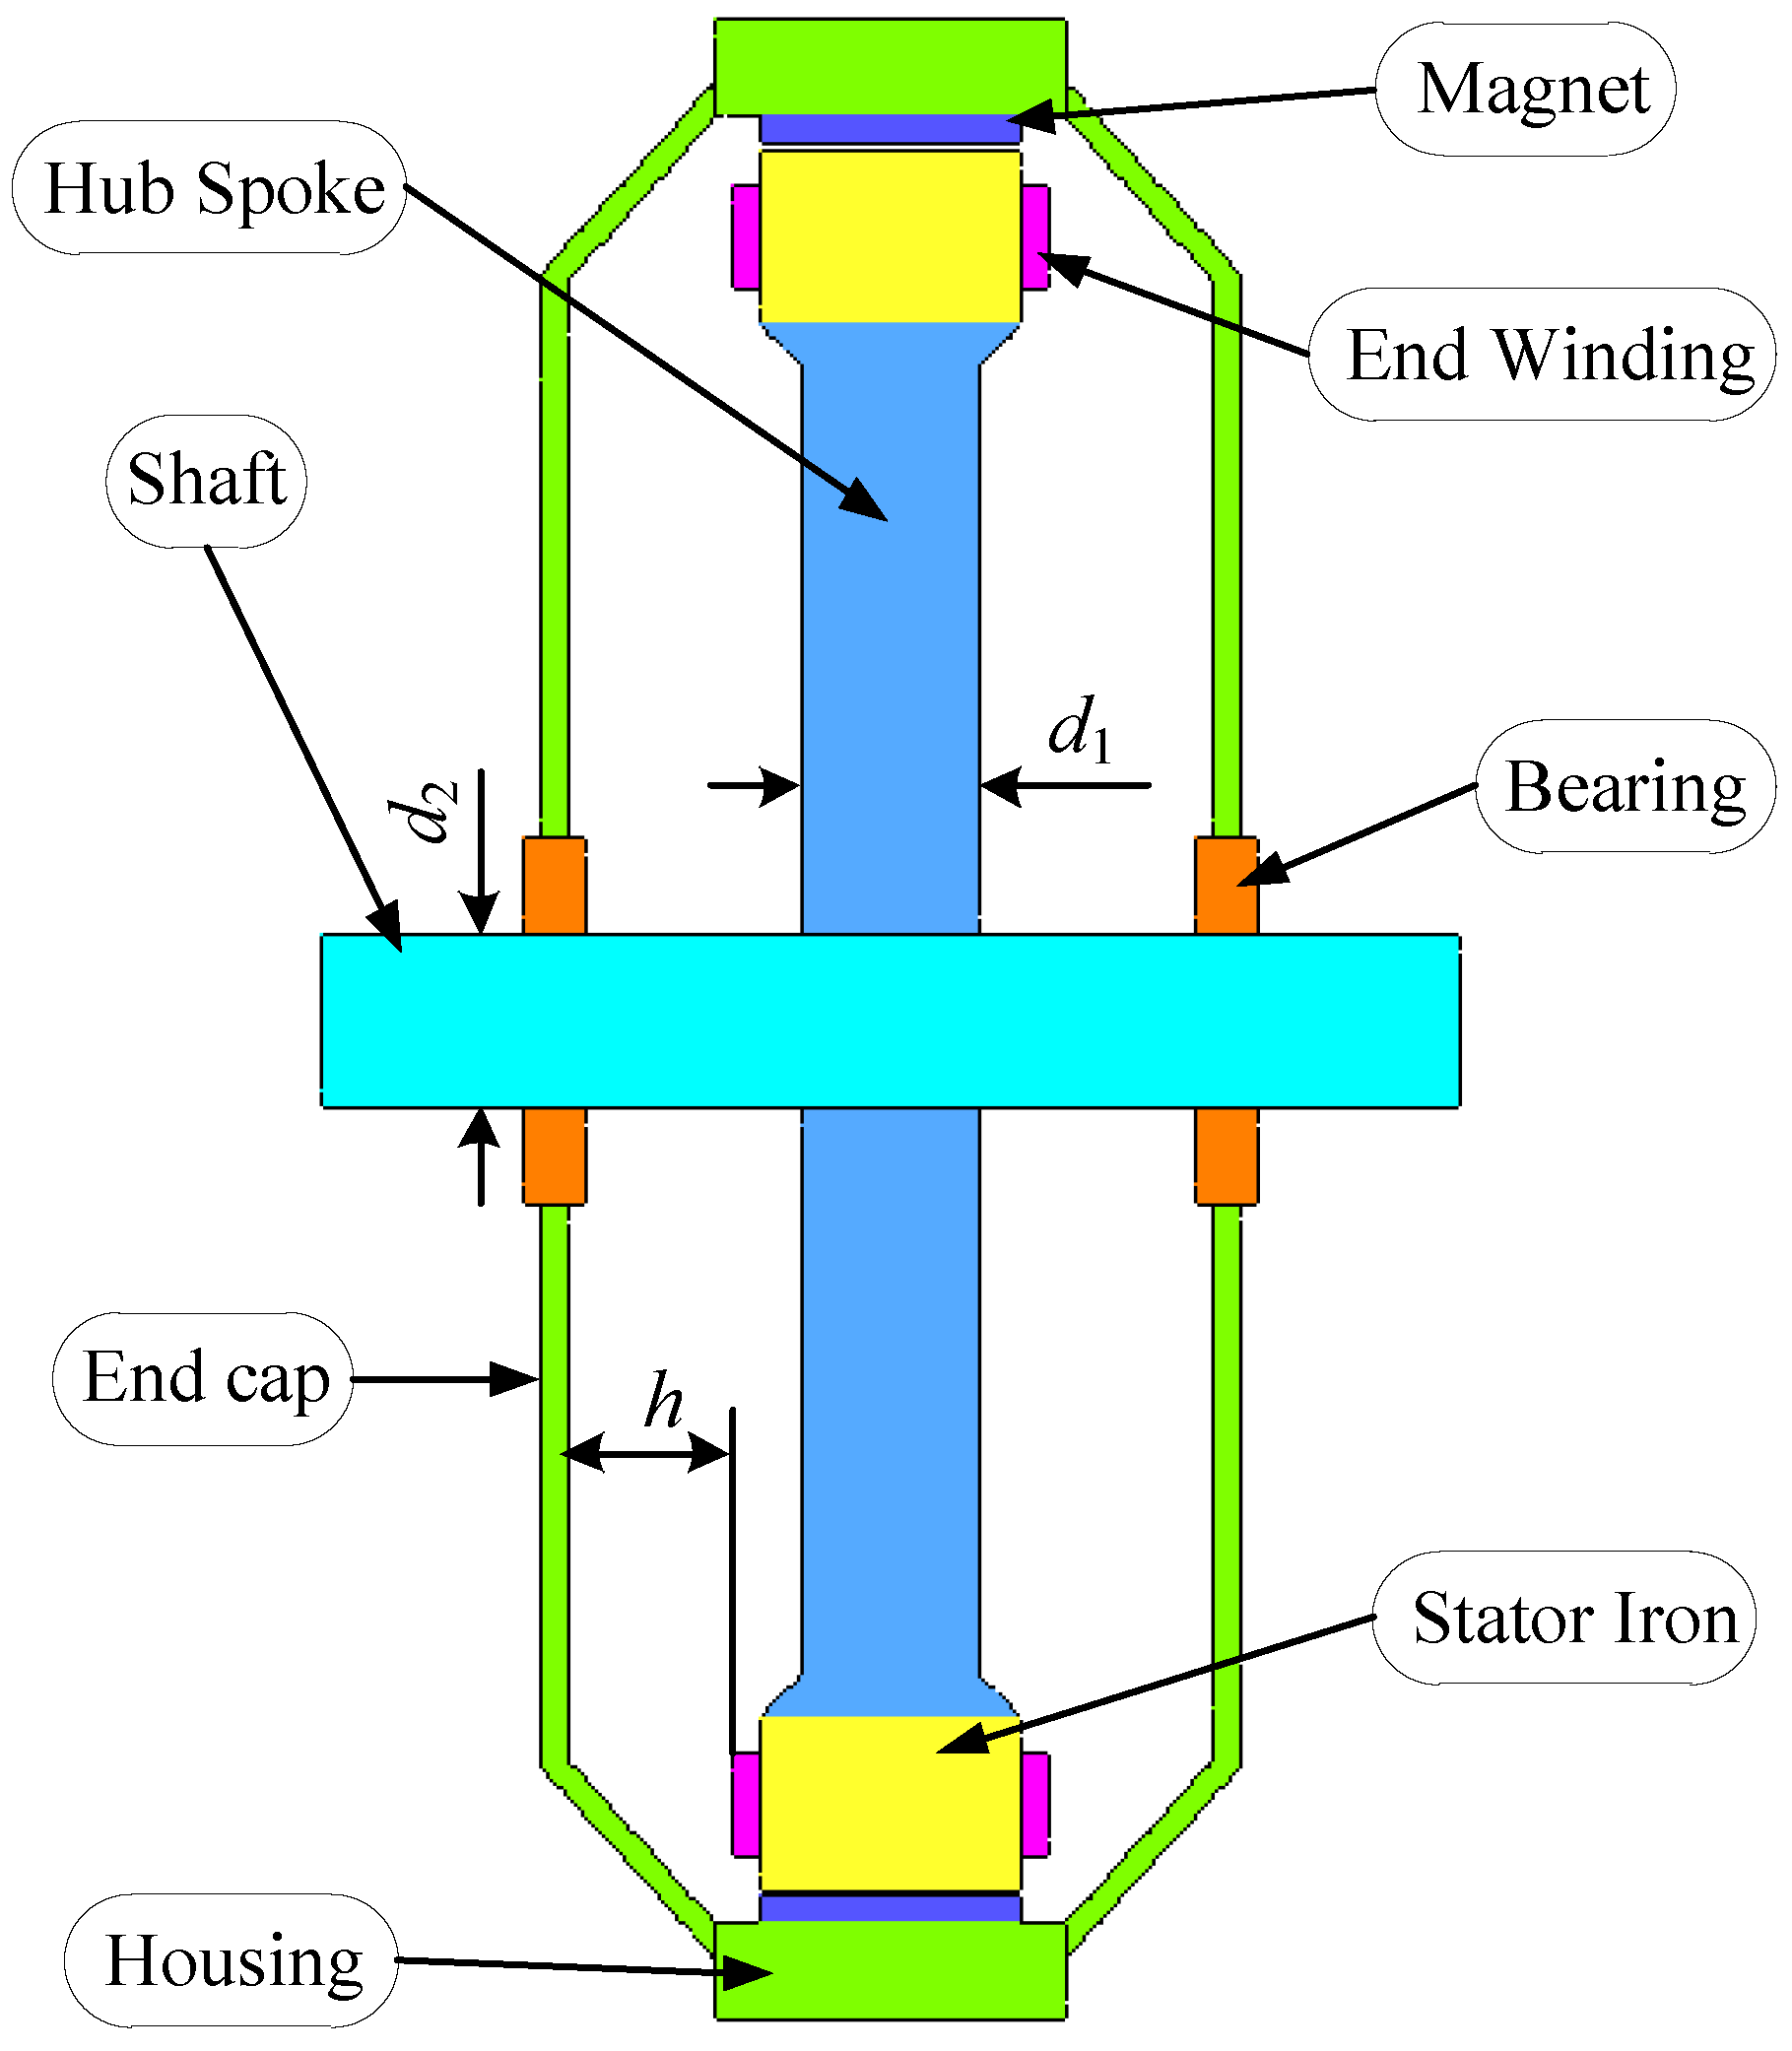
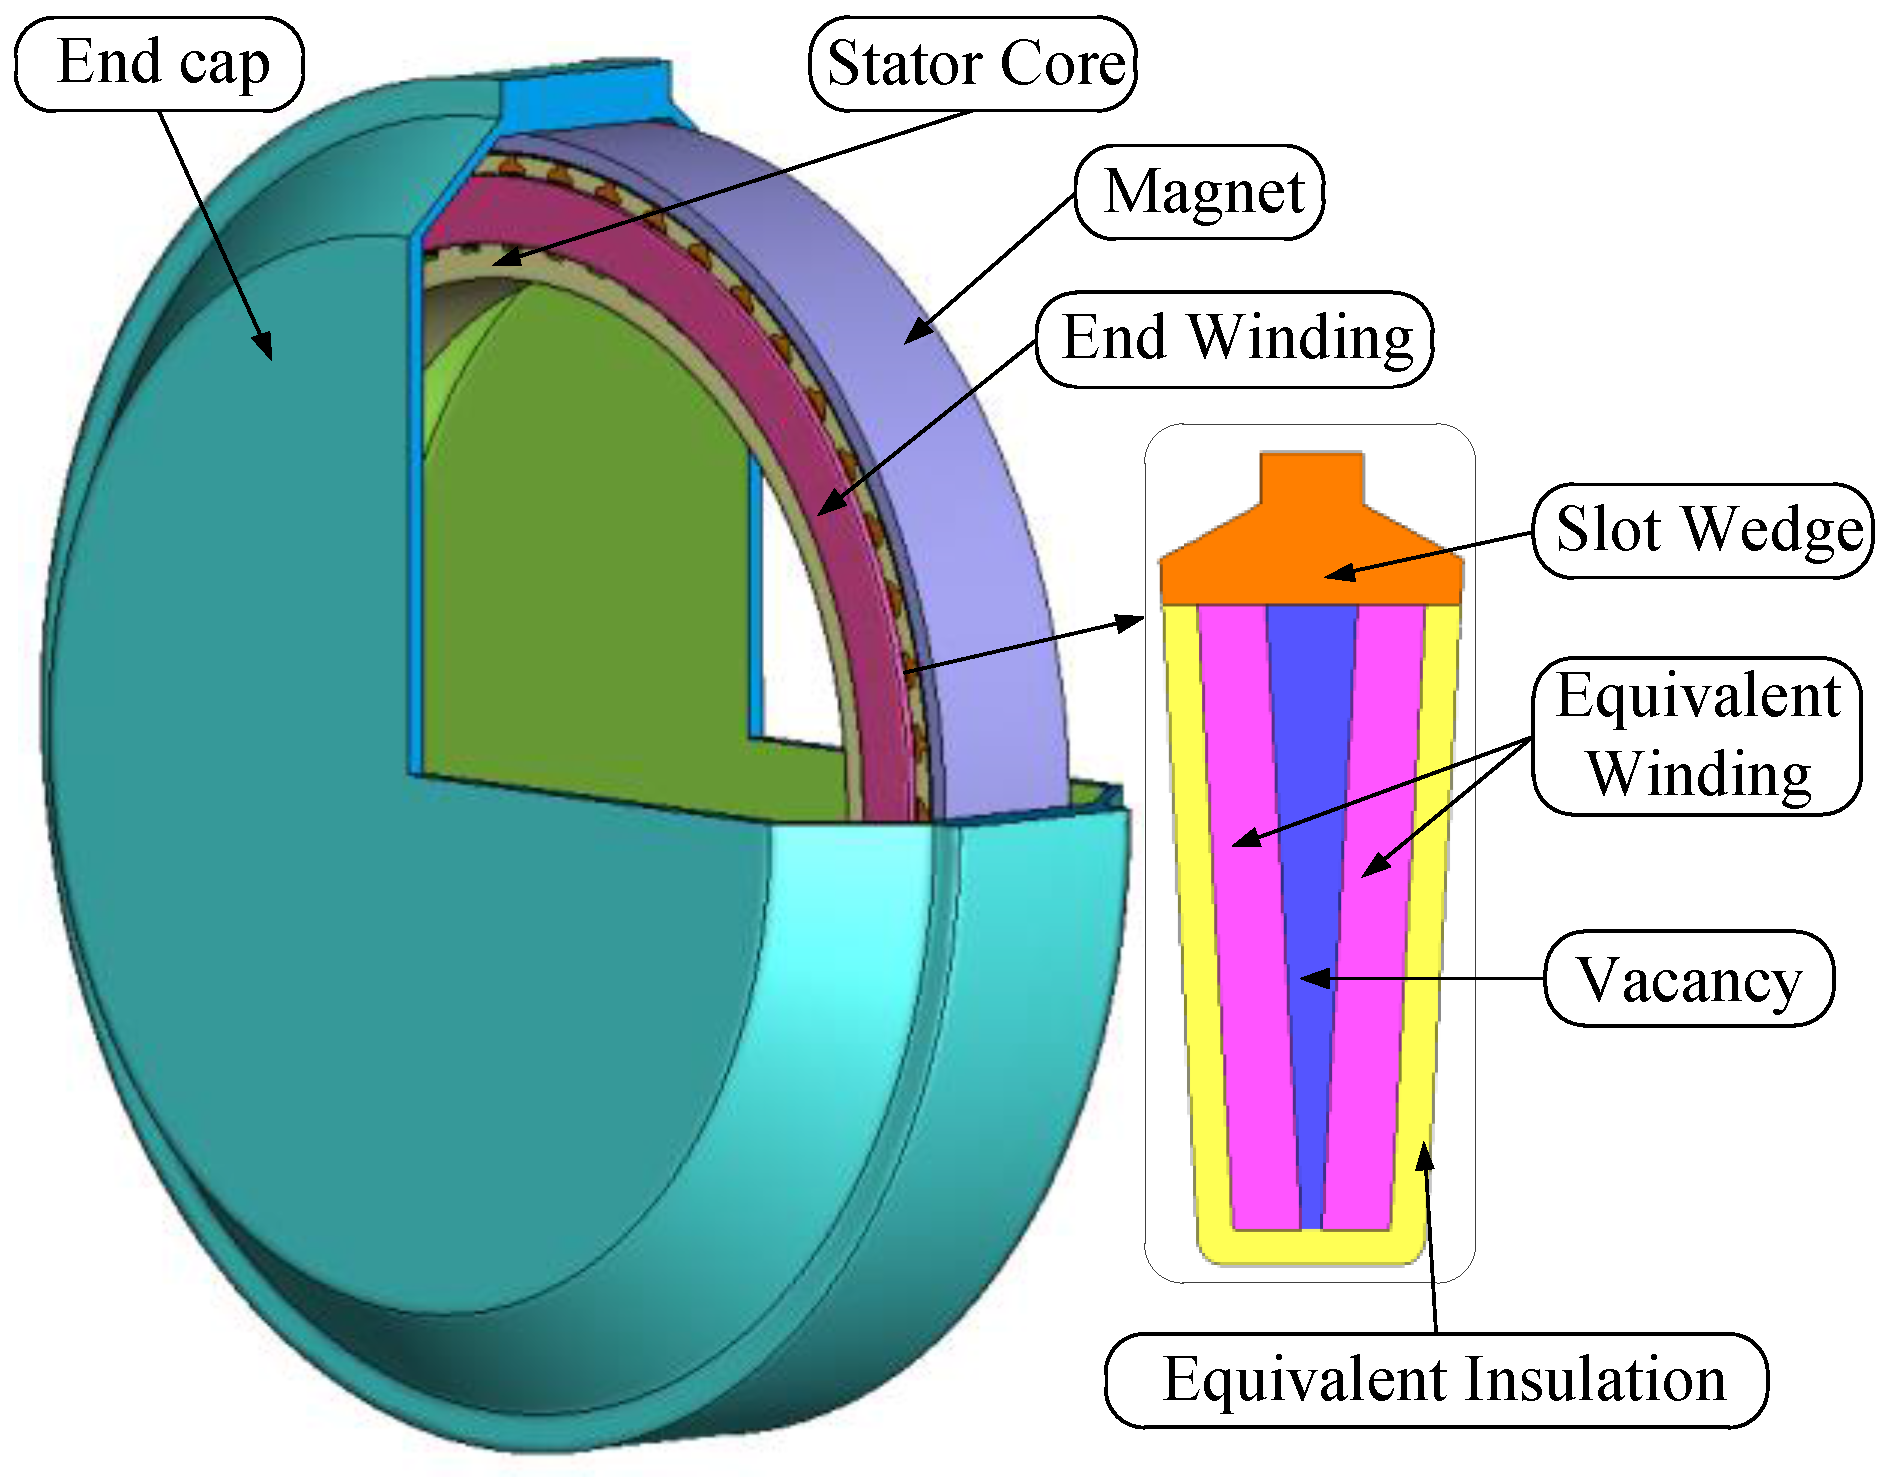
An outer-rotor air-cooling motor is used as an example to illustrate the method of equivalent treatment of the hub–shaft–bearing thermal circuit. Figure 3 shows that the cylinder of the stator yoke connects with the end caps through the hub, shaft, and bearing. All these components are made of metals, thereby performing well in heat conduction. Thus, the effect of heat transfer on the thermal circuit should be considered. The calculation efficiency will decrease if the calculation model is built according to the actual structure. The heat transfer mode of the thermal circuit is equivalent to the heat convection from heat conduction on the premise of the same cooling performance. The HTC of the stator yoke cylinder is considered a boundary condition that is applied to the model. The equivalent treatment saves the establishment of the hub, shaft, and bearing in the model, thereby simplifying the physical model and embodying the heat transfer effect of the thermal circuit.
The thermal circuit of the hub includes six spokes that conduct heat in a parallel manner. The thermal circuit of the shaft comprises two cylinders that are half the length of the parallel heat shaft conductor. The aforementioned thermal resistances are calculated using Equation (2). The thermal conductivity of the hub and shaft is 40 W/(m∙°C) according to their material properties. The type of bearing used is a deep groove ball bearing and the model is 6004/61804-LS [19]. The thermal resistance of the bearings is 0.526 °C/W, as obtained through the thermal circuit calculation according to the structure parameters of the bearing.
The heat transfer between two interconnected objects is often described by the junction thermal resistance. For air-cooling motors, the gap between the joint surfaces has an immense influence on the accuracy of temperature calculation. The equivalent thermal resistance of the joint surfaces can be modeled by the equivalent air-gap conduction. Table 1 presents the equivalent air-gap length [20].
The total resistance RT can be obtained using the cascade relationship of all the aforementioned thermal resistances. The HTC of the stator yoke cylinder α2 is obtained using the following equation:
α 2 = 1 R T S b
where Sb is the area of the stator yoke cylinder.

3. Practice and Verification of the Accurate Modeling Method

An outer-rotor air-cooling motor is used as an example to verify the accuracy of the modeling method. Table 2 shows the parameters of the motor.

3.1. Application of the Accurate Modeling Method in Numerical Calculation

3.1.1. Computational Fluid Dynamics (CFD) Modeling

Three CFD models are used in this study. For these models, all the fluid domains and solid domains are the same except the air-gap. The first is the CFM model. Currently, CFM is the most accurate numerical calculation method but has a long calculating time. In the model, the hub–shaft–bearing receives equivalent treatment, and the air-gap adopts the suitable boundary conditions to simulate the actual flow state. The air-gap material is defined as the air, the rotor-side cylinder is given a rotating speed, and the stator-side cylinder is still. The other two are ETC models whose air-gap is equivalent to solid. In the models, both the hub–shaft–bearing and the air-gap adopt equivalent treatment. The difference between the two models is the air-gap ETCs, which are 0.037 W/(m·°C) and 0.028 W/(m·°C), obtained by the new method and conventional method respectively.
In the accurate modeling method, two equivalent treatments are totally proposed. Their verifications should be in logical order. The CFM model is used to verify that the equivalent treatment of the hub–shaft–bearing is practicable and accurate. Thereafter, the ETC models are adopted to prove that the equivalent treatment of the air-gap is feasible and the new method of calculating the ETC is accurate.
To simplify the problem, the following assumptions are adopted.
(1)
All the magnets are considered an annular body. The stator-side and rotor-side cylinders are smooth.
(2)
The losses are evenly distributed in the objects that generate the losses.
(3)
The impregnation state is perfect in slots, and the insulating paint on the surfaces of the copper wires distributes evenly.
Considering the influence of the heat transfer in the axial direction on temperature calculation, a 3D model is considered to numerically calculate the temperature field of the motor. The following boundary conditions are adopted.
(1)
The windings and insulations in each slot are subjected to equivalent treatments. The layer insulations and the air inside the slot are disregarded. The remainders in the slot are divided into equivalent insulations and pure copper [21].
(2)
The end windings are equivalent to annular bodies because the end windings are substantially short for the motor. The physical property is obtained using the proportion of pure copper and insulating paint and impregnating paint in the end winding.
(3)
A suitable HTC is applied to the stator yoke cylinder. HTC is 15.75 W/(m2·°C). The thermal conductivity of the stator core is anisotropic.
(4)
A sufficient fluid domain is established to wrap the motor. All the rotor surfaces are provided a rated speed.
(5)
The gap between the joint surfaces is considered solid, which is equal to the still air in the material property. Table 1 presents the equivalent length of the gap. The ambient temperature is 22 °C (in accordance with the experimental condition).
(6)
The radiant model adopts the discrete ordinates model. The emissivity of the end annular surfaces of the stator is 0.3, and the emissivity of internal surfaces and external surfaces of the end caps is 0.9.
Figure 4 shows the physical model. Figure 5 shows the mesh generation. All components of the physical model are meshed with the unstructured grid. The grid quantity is good and the skewness of the majority of the grids is below 0.8.
In Figure 4, the vacancy is the layer insulation and the air, both ignored in modeling. The fluid domains are established as in the actual situation. Two fluid domains are built between the end cap and end winding. To see the model clearly, the fluid domains are set to the transparent media in Figure 4 and Figure 5.
In cylindrical coordinates, the 3D heat conduction equation in the steady-state is shown as follows:
{ 1 r r ( λ r T r ) + 1 r 2 φ ( λ φ T φ ) + z ( λ z T z ) = q v λ T n | S 1 = α ( T T f ) λ T n | S 2 = ε σ ( T a 4 T e 4 )
where T is the temperature of the boundary surface; qv is the sum of all heat sources; λr, λφ and λz are the thermal conductivities of materials in the r, φ and z directions; S1 is the convective boundary surface; α is the HTC of each surface, which is the interface of fluid and solid; Tf is the local temperature of the fluid; n is the normal vector of the boundary surfaces; S2 is the radiant boundary surface; Te is the thermodynamic temperature of the radiating surface; Ta is the thermodynamic temperature of the absorbing surface; ε is the emissivity of S2; and σ is the Stefan–Boltzmann constant, that is, 5.67 × 10⁻⁸ W/(m2·K4).
For the steady-state fluid field, the mass conservation and momentum conservation equations are shown as references [22]. The turbulence mathematical model adopts standard equations [23].

3.1.2. Temperature Field Analysis

The temperature field diagrams of the middle cross-section of the motor in the radial and axial directions are shown in Figure 6a,c,d. Figure 6b shows the velocity vector diagram and velocity contour map of the air-gap in the CFM method.
Figure 6a illustrates that the temperature distribution is independent of the stator, rotor, and air-gap face region. The temperature of the air-gap changes significantly, and the gradient is constant in the radial direction. With the air-gap equivalent to a solid, as shown in Figure 6c,d, the heat transfer mode is transformed from heat convection to heat conduction. Consequently, the air-gap affects the temperature of the stator and rotor regions, which are substantially close to the air-gap. Because Figure 6c shows a substantially large ETC, then this effect is more evident compared with that shown in Figure 6d. Overall, the calculation results of the CFM method are substantially close to those of the new method, and the temperature of the conventional method is the highest.
Figure 6b shows that the fluid flow of the air-gap between two concentric cylinders is laminar. When the fluid is near the stator side, its velocity is near 0. When the fluid is near the rotor side, its velocity is near that of the rotor-side cylinder. The velocity of the fluid changes evenly in the radial direction, which means that dV/dδ is equal to the ratio V/δ. The relative velocity of the rotor-side cylinder and fluid next to its surface is equal to that of the stator-side cylinder and fluid next to its surface. The HTC of the two cylinders is approximately equal. When the rotating speed increases, V/δ increases; the relative velocity of the cylinder and fluid next to its surface also increases. That is, the cylinder HTC increases with the constant increase in speed, which makes the Nusselt number increase constantly. The analysis agrees with the prediction below the Equation (1) in Section 2.1.

3.2. Experimental Verification

The temperatures of the stator windings and enclosure are measured by employing the temperature rise test. The winding temperature is measured using two temperature sensors (i.e., Pt100) to prevent accidental error. Figure 7 shows the temperature measuring points of the windings. Figure 8 shows the experiment test bed. The ambient temperature is 22 °C.
Three measuring points are considered. Two temperature sensors are embedded in the windings. The temperature of the enclosure is measured using an infrared temperature measuring apparatus.
The experimental and CFD results are compared and analyzed. Table 3 shows the correlation data.
Table 3 shows that the average winding temperature of the experimental results is 51.1 °C. The results of the CFM correspond well with the experimental results, thereby proving the practicable and accurate equivalent treatment of the hub–shaft–bearing. Compared with the results of the conventional method, results of the new method are near those of the experimental results. The new method is more accurate than the conventional method in terms of the ETC calculation. The calculation efficiency of the new method is substantially higher than that of the CFM method. The new method is the optimal method based on comprehensive comparison.
To further verify the accuracy of the new method, additional working conditions (all the speeds are below the limiting speed n2) are simulated and verified via experiments. Table 4 shows the correlation data.
Table 4 shows that the results of the new method agree with the experimental results under all conditions. However, the results of the conventional method agree with the experimental results at a low speed. With the constant increase in speed, the accuracy of the conventional method decreases. The new method can provide a considerably accurate ETC when the flow state of the air-gap is laminar.

4. Heat Transfer Rate (HTR) Distribution of Each Cooling Path

HTR of each cooling path is obtained through the CFD results of the new method and analytic formulas. The rule for the HTR distribution of the stator heat sources is presented.

4.1. HTR of the Air-Gap

In terms of energy conservation law and Fourier heat conduction law, the air-gap HTR is obtained using the following equation:
Φ a = 2 π λ e f f L 1 ( T 2 T 1 ) ln ( r 2 / r 1 )
where Φa is the HTR through the air-gap, T2 is the temperature of the rotor-side cylinder, T1 is the temperature of the stator-side cylinder (T2 and T1 are acquired through CFD results), and L1 is the length of the stator core.

4.2. HTR of the Thermal Circuit of the Hub–Shaft–Bearing

HTR of the thermal circuit of the hub–shaft–bearing is obtained using the following equation:
Φ b = T 4 T 3 R T
where Φb is the HTR through the thermal circuit of the hub–shaft–bearing, T4 is the temperature of end caps, and T3 is the temperature of the stator yoke cylinder. T4 and T3 are acquired through the CFD results.

4.3. HTR of the Annular Surfaces

The stator can be considered an annular body with four surfaces. Two cylinders and two annular surfaces are also included in the stator. The outer and inner cylinders indicate the heat dissipations of the air-gap and hub–shaft–bearing, respectively. The cooling modes of the two annular surfaces are convection and radiation. An annular surface comprises a stator core and end windings. The convective HTR of the annular surfaces is obtained using the following equation:
Φ c = α 3 S c ( T 5 T 6 )
where Φc is HTR through the annular surfaces, α3 is the HTC of the annular surface, Sc is the area of the two annular surfaces, T5 is the average temperature of the annular surface, and T6 is the average temperature of the air inside the motor. α3, T5, and T6 are acquired through the CFD results.
The radiant HTR of the annular surfaces is obtained using the following equation:
Φ d = ε 1 S c σ ( T 5 4 T 7 4 )
where Φd is HTR of the radiant heat dissipation, T5 is the thermodynamic temperature of the radiating surface (the two annular surfaces of the stator), T7 is the thermodynamic temperature of the absorbing surface (the two internal surfaces of end caps), and ε1 is the emissivity of the two annular surfaces (0.3 emissivity is adopted in this case). T5 and T7 are acquired using the CFD results.
Table 5 shows the HTR distribution of each cooling circuit.
Table 5 shows that the total HTR of the three cooling paths is 42.74 W and the error with the stator losses is 43 W. The error is caused by disregarding the heat convection between the hub–shaft and air inside the motor. However, the precision of the results can satisfy the engineering requirements, and these results can be used as references in actual practice.
The percentage of the air-gap HTR is 51.3%, which indicates that the air-gap significantly influences the temperature distribution of the motor. Only the air-gap is adopted as a suitable equivalent treatment that can obtain the accurate temperature field of the motor. It is necessary to give an accurate air-gap ETC if the air-gap is equivalent to solid. The proportion of HTR in the axial direction is 48%. Because the outer-rotor direct-drive motors often have a small ratio of iron length and armature diameter, they have a large percentage of HTR in the axial direction.
For the outer-rotor natural-convection air-cooling motor, the radiant contribution on heat dissipation is considerably small and negligible. The two end caps are rotating, which makes the HTCs of their surfaces substantially larger than those of still end caps. The surfaces of the end caps mainly transfer the heat by convection rather than radiation.

5. Influence of the Structure Parameters on Cooling Performance

The influences of the motor structure parameters on the temperature increases and the HTR distribution of each cooling path is analyzed. The structure parameters of the motor include the air-gap length δ, diameter of the hub spokes, shaft diameter d3 (to study the variables conveniently, the diameter of the hub spokes d1 and shaft diameter d2 are made equal to d3), and the distance from the enclosure to the end winding h. Figure 3 labels d1, d2, and h.

5.1. Influence of δ on the Cooling Performance

A series of average winding temperatures and the proportion of HTR for each cooling path are obtained by changing the air-gap length δ. The variation range is from 0 to 1 mm. The step measurement is 0.1 mm. Figure 9 shows the results.
Figure 9 shows that with the constant increase in the air-gap length, the winding average temperature increases, the proportion of air-gap HTR decreases constantly, and the proportion of the hub–shaft–bearing HTR and annular surfaces HTR increase constantly. The thermal resistance of the air-gap increases with the constant increase in air-gap length. The thermal resistances of other thermal circuits indicate a lack of change, thereby resulting in a large total thermal resistance and modified HTR proportion of each thermal circuit based on the preceding description. The cooling performance of the motor becomes poor with the constant increase in air-gap length. Considering the bumpy driving environment and rotor assembly, the air-gap length cannot be substantially small and requires further comprehensive consideration before it can be selected.

5.2. Influence of d3 on the Cooling Performance

A series of average winding temperatures and proportions of the HTR for each cooling path are obtained by changing the diameter of the hub spokes and shaft diameter d3. The values of d3 are 15, 17, 20, 25, and 30 mm. Table 6 shows the results.
Table 6 shows that with d3 increasing from 15 to 30 mm, the average winding temperature decreases constantly, the proportion of HTR of annular surfaces displays a decline of 2.3%, and the proportion of the hub–shaft–bearing HTR shows a substantial increase value of 16.9%, and the proportion of the air-gap HTR presents a significant decline of 14.7%. The thermal resistance of the hub–shaft–bearing decreases with the constant increase in d3. The thermal resistances of other thermal circuits indicate a lack of change, thereby lowering the total thermal resistance and the HTR proportion for each thermal circuit changed. The cooling performance of the motor improves with constant increase in d3. Considering the manufacturing costs and motor assembly, d3 cannot be substantially large and requires further comprehensive consideration before it can be utilized.

5.3. Influence of h on the Cooling Performance

A series of average winding temperatures and proportions of the HTR for each cooling path are obtained by changing the distance from the enclosure to the end winding h. The variation range is from 0.5 to 20 mm. The step measures 2.5 mm. Figure 10 shows the results.
Figure 10 shows that with the constant increase in h, the cooling performance of the motor shows limited improvement and the proportion of each cooling path is nearly constant. The thermal resistance of the annular surface shows limited changes with the constant increase in h. The thermal resistances of other thermal circuits show a lack of change, thereby making the total thermal resistance and HTR proportion of each thermal circuit essentially constant. That is, h has a limited effect on the cooling performance of the motor. A considerably small h can decrease the volume and mass of the motor, thereby making the vehicle a less unsprung mass. Accordingly, h should be as small as possible based on the premise that the motor operation and motor assembly are unaffected.

6. Research on Overload Capability in Various Overload Conditions

Direct-drive motors generally work at low speed, and the limiting temperature of work (LTW) often occurs under low speed and high torque conditions. In such conditions, the winding is the main heat source and maximum temperature point, and the magnets rarely generate heat. However, the influence of the heat sources of stator on the temperature of the magnets must be considered. The overload capability of the motor is studied using the maximum temperatures of the winding and magnets.
The insulation grade of the motor is B, the LTW of which is 130 °C. Considering the error of the maximum winding temperature between the calculated and actual values, 5 °C is considered a redundancy and the LTW of insulation is 125 °C. The ambient temperature adopted in this study is 40 °C based on the influence of ambient temperature on the temperature increase in the motor under limited working conditions.

6.1. Research on Overload Capability under Long-Time Overload Condition

The motor operates under constant conditions of a rated speed and an overload torque. The increase in temperature becomes high with the constant increase in the overload torque. The LTW of the insulation corresponds to the highest overload torque. The main heat source is the resistive losses of the stator obtained by the following equation:
p c u = 4 m I 2 ρ L 2 π d 4 2 N
where pcu is the resistive losses, m is the phase number, I is the root mean square (RMS) value of the phase current, ρ is the resistivity of conductor at a corresponding temperature, L2 is the length of one-phase winding, d4 is the wire diameter, and N is the number of strands.
The resistive losses are the only variables dependent on I and temperature of the motor, whereas the other parameters are constant. The LTW of the motor is 125 °C. The resistive losses are obtained through the corresponding I and ρ . Table 7 compares and shows the parameters of the limiting and rated work conditions.
Table 7 shows that the motor can operate steadily with the increase in torque by 1.87-fold. In limiting work conditions, the temperature of the magnets is considerably below their own LTW, and the temperature of winding acquires the LTW of insulation. The percentages of the HTR in the radial and axial directions reveal minimal changes. The use of multiple overload currents is approximately proportional to the maximum temperature of the winding.

6.2. Research on Overload Capability under Short-Time Overload Condition

In actual operation, in-wheel motors often encounter such conditions as overtaking and climbing. These motors need to provide a substantially large torque in the preceding conditions. The temperature of the motor increases significantly during this time. The windings and cores may destroy the insulation and cause the failure of the motor when the operation time is beyond the safe margins. Thus, studying the overload capability under short-time overload conditions is necessary. Two short-time overload conditions are studied. The first condition is that the motor operates with three times the torque after it reaches a thermal balance with the rated operation. The second condition includes the motor operating with four times the torque after it reaches a thermal balance with the rated operation. Figure 11 shows the relationship curves of the operation time and maximum temperature of the windings and magnets.
Figure 11a shows that the temperature of the windings acquires the LTW at 450 s (i.e., 7 min, 30 s). The temperature of the magnets is 55 °C. Figure 10b shows that the temperature of the windings acquires the LTW at 155 s (i.e., 2 min, 35 s). The temperature of the magnets is 51 °C. The overload capability of the motor is only restricted by the LTW of the insulation. Selection of the magnets with a low LTW for designing the outer-rotor air-cooling motors, such as Neodymium-Iron-Boron (NdFeB), is expected thereafter because the temperature of the magnets is considerably below their own LTW.

7. Conclusions

(1) This study proposes a method of accurate modeling of the temperature field for outer-rotor air-cooling motors. This method is applied to the CFD model and is experimentally verified. The CFD results agree well with the experimental results, thereby proving the accuracy of the modeling method. The proposed method is significant in accurately and efficiently handling the heat transfer problem of the air-gap in the laminar state.
(2) The rule of heat distribution of the stator heat sources is presented. The air-gap is the main cooling path for the stator heat sources. The HTR in the axial direction is nearly half that of the total HTR. It is necessary to consider the heat dissipation in the axial direction when the cooling performance of this kind of motor is studied.
(3) The cooling performance of the motor becomes poor with the constant increase in the air-gap length, and improves with the constant increase in d3. h has a limited effect on the cooling performance. The results provide important reference values for designing the cooling structure of outer-rotor motors.
(4) The temperature of the magnets is considerably below their own LTW. The overload capability of the motor is only restricted by the LTW of insulation. As a reference for the overload capability of the outer-rotor air-cooling motors, the results provide a selection principle for the parameters in the design of the motors.

Acknowledgments

The authors would like to thank the support by Self-Planned Task (No. SKLRS201608B) of State Key Laboratory of Robotics and System (HIT) and the National Natural Science Foundation of China (51477032) for funding this work.

Author Contributions

Feng Chai, Yue Tang and Yulong Pei discussed and aroused the idea. Yue Tang, Peixin Liang and Hongwei Gao organized the overall numerical analysis and experimental verification. Yue Tang drafted the manuscript. Feng Chai supervised the whole thing and provided feedback for improvement from the original manuscript. All authors read and approved the manuscript.

Conflicts of Interest

The authors declare no conflict of interest.

Nomenclature

NuNusselt number
αheat transfer coefficient (W/(m∙°C))
α1, α2, α3average HTC of the two cylinders of the air-gap (W/(m∙°C)), HTC of the stator yoke cylinder (W/(m∙°C)), HTC of the annular surface (W/(m∙°C))
L1, L2characteristic surface length of air-gap (m), length of one-phase winding (m)
δlength of air-gap (m)
r1, r2radius of the stator-side cylinder (m), radius of the rotor-side cylinder radius (m)
Sa, Sb, Scmean area of the two cylinders (m2), area of the stator yoke cylinder (m2), area of the two annular surfaces (m2)
S1, S2convective boundary surface, radiant boundary surface
ReReynolds number
Reccritical Reynolds number
RS, RC, RTconduction thermal resistance of the air-gap (°C/W), average convection thermal resistance of the two cylinders (°C/W), thermal resistance of hub–shaft–bearing (°C/W)
Vvelocity of the rotor-side cylinder (m/s)
nspeed (r/min)
n1, n2critical speed (r/min), limiting speed (r/min)
εemissivity of S2
ε1emissivity of the two annular surfaces
λeffequivalent thermal conductivity of air-gap
λ1, λ2thermal conductivity of still air (W/(m∙°C)), ETC of air-gap with speed n2 (W/(m∙°C))
T1, T2, T3temperature of the stator-side cylinder temperature (°C), temperature of the rotor-side cylinder (°C), temperature of the stator yoke cylinder (°C)
T4, T5, T6temperature of end caps (°C), average temperature of the annular surface (°C), average temperature of the air inside the motor (°C)
T7, Ta, Tetwo internal surfaces of end caps (°C), thermodynamic temperature of the absorbing surface (°C), thermodynamic temperature of the radiating surface (°C)
Φa, Φbheat transfer coefficient through the air-gap (W), HTR of the thermal circuit of the hub–shaft–bearing (W)
Φc, Φdconvective HTR of the annular surfaces (W), radiant HTR of the annular surfaces (W)
Icurrent (A)
d4wire diameter (m)
ρ resistivity (Ω·m)
νkinematic viscosity (m2/s)
Nnumber of strands
mphase number
pcuresistive losses (W)

Abbreviations

CFDcomputational fluid dynamics
ETCequivalent thermal conductivity
HTRheat transfer rate
HTCheat transfer coefficient
CFMcoupled field method
3Dthree-dimensional
LTWlimiting temperature of work
RMSroot mean square

References

  1. Nikam, S.P.; Rallabandi, V.; Fernandes, B.G. A high-torque-density permanent-magnet free motor for in-wheel electric vehicle application. IEEE Trans. Ind. Appl. 2012, 48, 2287–2295. [Google Scholar] [CrossRef]
  2. Gong, H.L.; Chai, F.; Pei, Y.L. Research on torque performance for permanent magnet in-wheel motor. In Proceedings of the 2008 IEEE Vehicle Power and Propulsion Conference, Harbin, China, 3–5 September 2008.
  3. Chan, T.F.; Yan, L.T.; Fang, S.Y. In-wheel permanent-magnet brushless DC motor drive for an electric bicycle. IEEE Trans. Energy Convers. 2002, 17, 229–233. [Google Scholar] [CrossRef]
  4. Wrobel, R.; Mellor, P.H.; McNeill, N. Thermal performance of an open-slot modular-wound Machine with external rotor. IEEE Trans. Energy Convers. 2010, 25, 403–411. [Google Scholar] [CrossRef]
  5. Lee, M.Y.; Lim, D.H.; Kim, S.C. Evaluation of the Effect of Operating Parameters on Thermal Performance of an Integrated Starter Generator in Hybrid Electric Vehicles. Energies 2015, 8, 8990–9008. [Google Scholar] [CrossRef]
  6. Xie, Y.; Gu, C.; Wang, L. There-dimensional temperature estimation of squirrel-cage induction motor using finite element method. In Proceedings of the 2011 International Conference on Electrical Machines and Systems (ICEMS), Beijing, China, 20–23 August 2011.
  7. Howey, D.A.; Childs, P.R.N.; Holmes, A.S. Air-gap convection in rotating electrical machines. IEEE Trans. Ind. Electron. 2012, 59, 1367–1375. [Google Scholar] [CrossRef]
  8. Romanazzi, P.; Howey, D.A. Air-gap convection in a switched reluctance machine. In Proceedings of the 2015 Tenth International Conference on Ecological Vehicles and Renewable Energies (EVER), Monte Carlo, Monaco, 31 March–2 April 2015.
  9. Wrobel, R.; Mellor, P.H.; McNeill, N.; Staton, D.A. Thermal Performance of an Open-Slot Modular-Wound Machine with External Rotor. IEEE Trans. Energy Convers. 2010, 25, 403–411. [Google Scholar] [CrossRef]
  10. Nachouane, A.B.; Abdelli, A.; Friedrich, G.; Vivier, S. Numerical approach for thermal analysis of heat transfer into a very narrow air gap of a totally enclosed permanent magnet integrated starter generator. In Proceedings of the 2015 IEEE Energy Conversion Congress and Exposition (ECCE), Montreal, QC, Canada, 20–24 September 2015.
  11. Ding, J.; Zhang, P.; Li, J.H. 3D temperature field calculation of mine-used flame-proof integrative variable-speed system. In Proceedings of the 2015 IEEE 11th International Conference on Power Electronics and Drive Systems, Sydney, Australia, 9–12 June 2015.
  12. Protean’s Motor Technology. Available online: http://www.proteanelectric.com (accessed on 24 July 2016).
  13. Arbab, N.; Wang, W.; Lin, C.; Hearron, J.; Fahimi, B. Thermal Modeling and Analysis of a Double-Stator Switched Reluctance Motor. IEEE Trans. Energy Convers. 2015, 30, 1209–1217. [Google Scholar] [CrossRef]
  14. Hatziathanassiou, V.; Xypteras, J.; Archontoulakis, G. Electrical-thermal coupled calculation of an asynchronous machine. Arch. Elektrotech. 1994, 77, 117–122. [Google Scholar] [CrossRef]
  15. Xyptras, J.; Hatziathanassiou, V. Thermal analysis of an electrical machine taking into account the iron losses and the deep-bar effect. IEEE Trans. Energy Convers. 1999, 14, 996–1003. [Google Scholar] [CrossRef]
  16. Gazley, C. Heat transfer characteristics of the rotational and axial flow between concentric cylinders. Trans. ASME 1958, 80, 79–90. [Google Scholar]
  17. Wen, J.B.; Wang, G.H. Calculation and analysis of 3D size high voltage asynchronous temperature fields of medium motor based on coupled field. Electr. Mach. Control 2011, 15, 74–78. [Google Scholar]
  18. Staton, D.A.; Cavagnino, A. Convection heat transfer and flow calculations suitable for electric machines thermal models. IEEE Trans. Ind. Electron. 2008, 55, 3509–3516. [Google Scholar] [CrossRef]
  19. Liu, Z.J.; He, S.Q.; Liu, H. Rolling Bearing Application, 1st ed.; China Machine Press: Beijing, China, 2014; pp. 32–57. [Google Scholar]
  20. Boglietti, A.; Cavagnino, A.; Staton, D.; Shanel, M.; Mueller, M.; Mejuto, C. Evolution and Modern Approaches for Thermal Analysis of Electrical Machines. IEEE Trans. Ind. Electron. 2009, 56, 871–882. [Google Scholar] [CrossRef]
  21. Liang, P.L.; Pei, Y.L.; Chai, F.; Cheng, S.K. Equivalent stator slot model of temperature field for high torque-density permanent magnet synchronous in-wheel motors accounting for winding type. COMPEL Int. J. Comput. Math. Electr. Electron. Eng. 2016, 35, 713–727. [Google Scholar] [CrossRef]
  22. Wen, J.B.; Tang, Y.; He, J.Z.; He, H.B. Numerical calculation and optimization of fluid flow field of external fan of high voltage asynchronous motors. Electr. Mach. Control 2013, 17, 79–85. [Google Scholar]
  23. Lu, Y.P.; Liu, L.; Zhang, D.X. Simulation and Analysis of Thermal Fields of Rotor Multislots for Nonsalient-Pole Motor. IEEE Trans. Ind. Electron. 2015, 62, 7678–7686. [Google Scholar] [CrossRef]
Figure 1. Thermal circuit of the air-gap.
Energies 09 00818 g001
Figure 2. Relationship curve between the air-gap and k.
Energies 09 00818 g002
Figure 3. Structural diagram of the motor.
Energies 09 00818 g003
Figure 4. Physical model of the motor.
Energies 09 00818 g004
Figure 5. Mesh generation of the model.
Energies 09 00818 g005
Figure 6. Temperature distribution and velocity distribution of the middle cross-section: (a) temperature contour map of the coupled field method (CFM); (b) velocity distribution of the air-gap of the CFM; (c) temperature contour map of the new method; (d) temperature contour map of the conventional method.
Energies 09 00818 g006
Figure 7. Measuring points of the windings.
Energies 09 00818 g007
Figure 8. Experiment test bed of the outer-rotor motor: (a) control test bed on the left side of the shielding net; (b) physical test bed on the right side of the shield net.
Energies 09 00818 g008
Figure 9. Influence of δ on cooling performance: (a) relationship diagram of δ and average winding temperature; (b) relationship diagram of δ and proportion of HTR of each cooling path.
Energies 09 00818 g009
Figure 10. Influence of h on the cooling performance: (a) relationship diagram of h and average winding temperature; (b) relationship diagram of h and proportion of HTR for each cooling path.
Energies 09 00818 g010
Figure 11. Relationship curves of the operation time and maximum temperature of the windings and magnets: (a) relationship curve with thrice the torque; (b) relationship curve with four times the torque.
Energies 09 00818 g011
Table 1. Equivalent joint air-gap lengths.
Joint TypeJoint Equivalent Air-Gap Length (mm)Joint TypeJoint Equivalent Air-Gap Length (mm)
Stator yoke to hub0.03Rotor yoke to enclosure0.005
Bearing to end cap0.0073Magnet to rotor core0.005
Bearing to shaft0.0112Endcap to enclosure0.005
Table 2. Parameters of the motor.
Names/UnitsValueNames/UnitsValue
Efficiency/%90Iron length/mm30
Rated power/W500Outer diameter of stator/mm200
Peak speed/rpm500Inner diameter of stator/mm160
Pole/slot number56/51Outer diameter of rotor/mm230
Bus voltage/V48Air-gap length/mm0.5
Rated current/A11Resistive losses of stator/W22
Eddy current losses of magnets/W1Iron losses of stator/W21
Table 3. Comparison of the experimental and CFD data.
Temperature/°CSensor 1Sensor 2Enclosure
CFDCFM method51.251.227.4
New method51.351.327.5
Conventional method52.352.326.6
Experimental results50.851.427.5
Table 4. Verification of equivalent thermal conductivity (ETC) under various working conditions.
Working ConditionsSpeed/rpm300350400450500
Current/A1115111511
ETC of New Method W/(m·°C)0.0320.0350.0370.040.043
ETC of Conventional Method W/(m·°C)0.0280.0280.0280.0280.028
New Method ResultsWinding/°C47.162.651.367.255.9
Enclosure/°C26.729.727.530.728.5
Experimental ResultsWinding/°C46.261.851.166.855.1
Enclosure/°C26.129.227.529.628.2
Conventional Method ResultsWinding/°C47.563.352.368.758.0
Enclosure/°C25.828.626.628.326.5
Table 5. Heat transfer rate (HTR) distribution of each cooling circuit.
Cooling PathHeat Transfer ModeHTR/WThermal Resistance/(°C/W)Proportion on Total HTR/%
Air-gapConduction21.880.9551.3
Hub–shaft–bearingConduction5.054.2811.8
Annular surfacesConvection15.151.4435.4
Radiation0.6618.181.5
Total HTR-42.74-100
Table 6. Influence of d3 on the temperature and HTR proportion.
d3/mm1517202530
Average winding temperature/°C52.251.651.049.447.7
Proportion of air-gap HTR/%5654.45246.841.3
Proportion of hub–shaft–bearing HTR/%7.49.6121824.3
Proportion of annular surfaces HTR/%36.636.33635.234.3
Table 7. Parameter comparison of the two work conditions.
Names/UnitsRated Work ConditionLimiting Work Condition
Multiple of overload current11.87
Multiple of overload torque11.9
Linear current density/(A/cm)91.3170.8
Current density/(A/mm2)4.247.9
Resistive losses/W26.1106.3
Max. winding temperature/°C72.1124.7
Max. magnet temperature/°C46.858.4
Enclosure temperature/°C45.955.8
Proportion of HTR in radial direction/%53.254.5
Proportion of HTR in axial direction/%46.845.5

