Article

Direct and Indirect Impacts of Vegetation on Building Comfort: A Comparative Study of Lawns, Green Walls and Green Roofs

by
Laurent Malys
1,2,
Marjorie Musy
1,2,*,† and
Christian Inard
2,3,†
1
L'Université Nantes Angers Le Mans, ensa Nantes, UMR CNRS 1563, Centre de REcherche Nantais Architecture Urbanité, 6 quai F. Mitterrand, Nantes 44000, France
2
Institut de Recherche en Sciences et Techniques de la Ville, FR CNRS 2488, 1 rue de La Noé, Nantes 44000, France
3
Laboratoire des Sciences de l'Ingénieur pour l'Environnement, Université de La Rochelle, UMR CNRS 7356, Avenue M. Crépeau, 17042 La Rochelle Cedex 1, France
*
Author to whom correspondence should be addressed.
These authors contributed equally to this work.
Energies 2016, 9(1), 32; https://doi.org/10.3390/en9010032
Submission received: 4 November 2015 / Revised: 15 December 2015 / Accepted: 23 December 2015 / Published: 7 January 2016
(This article belongs to the Special Issue Energy Efficient Building Design 2016)

Abstract

:
Following development and validation of the SOLENE-microclimat tool, the underlying model was used to compare the impacts of various “greening strategies” on buildings’ summer energy consumption and indoor comfort. This study distinguishes between direct and indirect impacts by successively implementing the test strategies on both the studied building and surrounding ones; it also considers insulated vs. non-insulated buildings. Findings indicate that green walls have a direct effect on indoor comfort throughout the entire building, whereas the effect of green roofs is apparently primarily confined to the upper floor. Moreover, the indirect effect of a green wall is greater, mainly due to the drop in infrared emissions resulting from a lower surface temperature. It has also been proven that the indirect effects of green walls and surrounding lawns can help reduce the loads acting on a non-insulated building.

1. Introduction

France’s total energy consumption and the share generated by the country’s residential and commercial sectors have stabilized since 2006 at values of 164 Mtoe and 68 Mtoe, respectively. These two sectors account for 43% of all energy consumption and 23% of CO2 emissions. For the European building sector taken as a whole, the air conditioning of occupied spaces has been estimated at 57% of total energy demand and 33% of CO2 generation. The building sector therefore is key to fulfilling the commitment made in 2003 by the French Government to the international community that calls for cutting by 75% the nation’s greenhouse gas emissions by 2050. Technically speaking, such a reduction is much easier to achieve in new buildings than from retrofitting the large stock of older buildings, as part of a program that would need to be planned over a several-year period. Reducing summer heat stresses in an urban context may be partially and indirectly achieved by modifying the local climate through the introduction of adaptive techniques. The effectiveness of such solutions, however, requires extensive knowledge of the correlations existing between climate and the thermal behavior of buildings.
Techniques aimed at expanding the green spaces in cities have been approved by a large majority of interested parties because of their numerous benefits to the city ecosystem. Such techniques have been the focus of a wide array of studies over the past decade.
This is especially true for trees, whose effect has been broadly studied and shown to be the most efficient source for cooling cities and improving thermal comfort at the local scale [1,2,3,4,5].
Since roofs constitute a very high percentage of the exposed urbanized area, green roofs have received widespread attention for their direct impact on energy consumption, as well as for their impact caused by urban climate modification. Santamouris recently presented a state-of-the-art assessment of green roofs and proceeded to compare their effects with those of cool roofs [6].
It has been demonstrated that whenever vegetative, or green, roofs are installed in high- or even medium-rise buildings, their mitigation potential becomes almost negligible [7,8,9].
Nonetheless, the direct impacts of green roofs on building energy consumption have been extensively studied, and depending on climate conditions and building characteristics, results show a variable thermal efficiency derived from green roofs [10].
Walls also occupy a high fraction of the total urban surface, with total wall areas potentially greater than the space available for green roofs. Walls have been shown to reduce a building’s cooling load and overall energy consumption, while improving indoor comfort [11,12,13,14,15], as the cooling potential is in fact influenced by the choice of plant species [16]. Temperatures on city streets are also cooler when green walls are installed on building facades [17,18]; their global impact on a city’s climate and outdoor comfort however has not been widely investigated.
Due to their limited impact on climate, lawns have naturally received scant attention despite the fact that these surfaces, which are maintained at low temperatures compared to paved surfaces, do indeed exert a thermal impact on their environment [19].
Urban vegetation has direct impacts, namely those due to the building envelop modifications, such as decrease of solar heat gain by shading and a decrease of convective heat fluxes by lowering near-wall air velocity or increasing the envelop thermal resistance due to the substrate layer. Indirect impacts are due to the buildings’ environment modifications as air and surface temperatures that influence long-wave (LW) radiation transfer, convective heat fluxes and ventilation and infiltration loads [20]. Due to the fact that their study requires using both a microclimate model and building energy simulation, they are more rarely studied: Djedjig [21] did this at the street scale using transient system simulation tool (TRNSYS) and a street canyon model and de Munck [9] at the city scale in town energy budget (TEB), where the building are averaged buildings and represented by a mono-zone mode.
As an extension of previous works that intended to developed new sub-models in SOLENE-microclimat and validate them [22,23,24,25], in this paper, through a case study conducted in Nantes (northwestern France), the direct and indirect effects will be compared from three greening configurations applicable to urban surfaces, namely: lawns, green roofs and green walls. The detailed simulations performed herein will enable analyzing how these configurations modify a city’s thermal environment and then alter indoor building comfort.

2. Methodology

2.1. The SOLENE-Microclimat Model

The SOLENE-microclimat project was first developed for the purposes of an urban insolation assessment. Sub-modules have since been added, now making it possible to incorporate:
-
LW radiation exchanges using the radiosity method;
-
conduction heat transfer and thermal storage in walls and soil;
-
airflow and convective exchanges through the coupling with a computational fluid dynamics (CFD) code.
The near-surface air velocity and temperature calculated by the CFD code allow evaluating the convective heat transfer of the surfaces used as the entries for the SOLENE software. On the other hand, the surface temperatures calculated with SOLENE software are used as entries for the conservation of energy equation of the CFD code, evapotranspiration from natural surfaces, like plants and water ponds or humidification systems and, lastly, the energy balance (i.e., energy demand or indoor temperature) for a building within the simulated zone. Towards this end, a multi-zone building nodal network model is used. The temperature nodes correspond to each building floor, and the boundary conditions are the canopy air temperature and humidity calculated by the CFD code. In addition, the heat fluxes exchanged by radiation are computed with the thermo-radiative model [26]. It should be noted that the energy balance of each node includes ventilation and infiltration loads, both latent and sensible.
Only the SOLENE-microclimat thermo-radiative validation as a whole has been carried out, and its coupling with the Saturne CFD code is presented in [21]. Due to the difficulty in getting complete and accurate experimental datasets (airflows, canopy and surface temperatures, turbulent heat fluxes, etc.), it is very difficult to validate the SOLENE-microclimat model as a whole. Nevertheless, some validations have been carried out concerning sub-models of the software. For instance, walls, roofs and soil surface temperatures were compared successfully to measurements [22]. It is the same for green walls’ behavior [23]. In the future, it is planned to increase these validation efforts. The SOLENE-microclimat thermo-radiative model and its validation have been presented in [22]. The coupling with the Saturne CFD code is also explained.
The modules added to study the direct and indirect impacts of adaptation and mitigation solutions are detailed in [23,25].
These latest developments introduced into SOLENE-microclimat models for lawns, green roofs and walls are now available for use. In all of these models, the vegetation layer acts on the following energy transfers:
-
Evapotranspiration, i.e., latent heat flux due to transpiration and evaporation of water contained in both the plants and substrate.
-
Radiation: the foliage layer modifies both short-wave (SW) and LW radiation; moreover, it reflects, absorbs and transmits a portion of the SW radiation to the shaded surface area. In covering the surface, this layer exchanges LW radiation with the surrounding surfaces, as well as with the surface being covered.
-
Convection: the foliage layer is rough and modifies the near surface airflow, thus implying a modification to the heat transfer.
The transfer by conduction is also changed whenever the green surface contains a substrate; this layer can then be included in the wall (or ground) model. The way in which these transfers have been taken into account in the SOLENE model is detailed in [23,25].

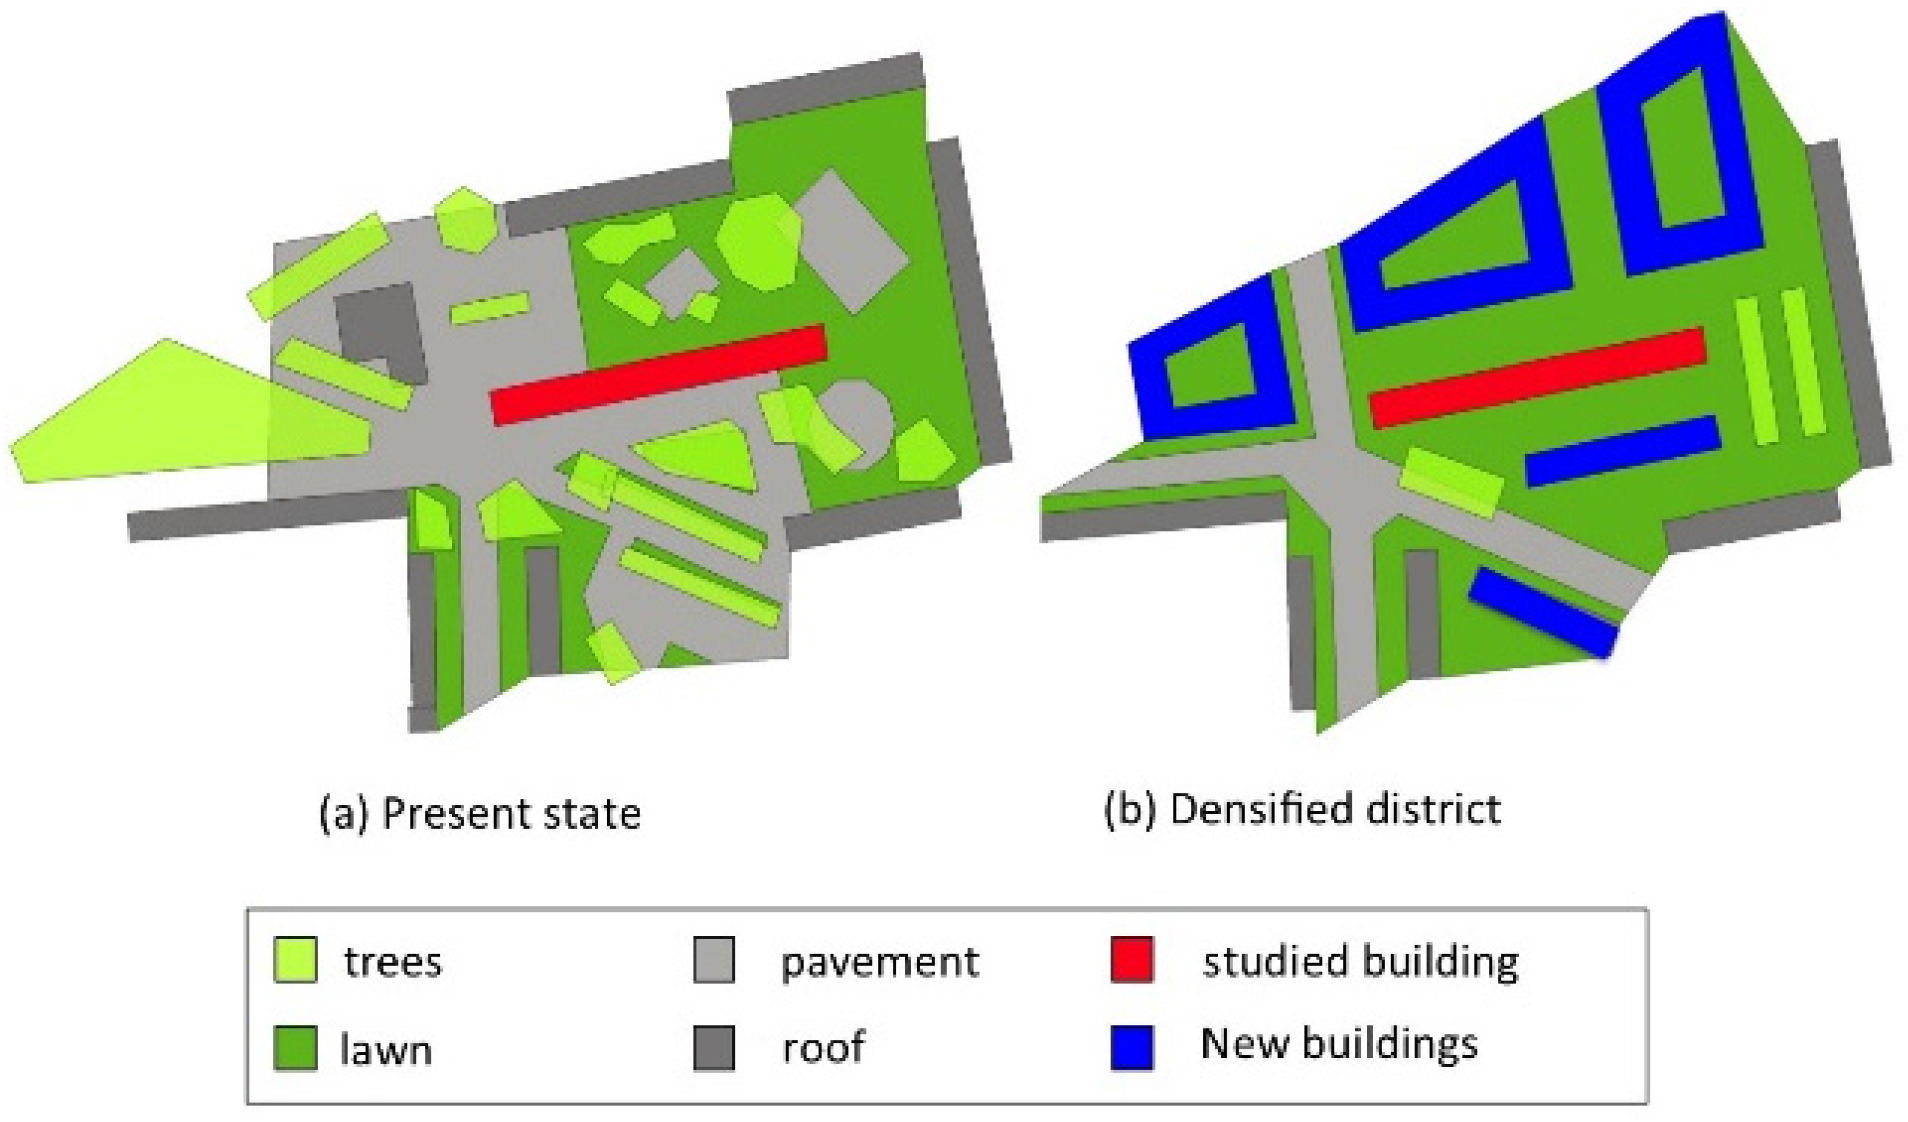
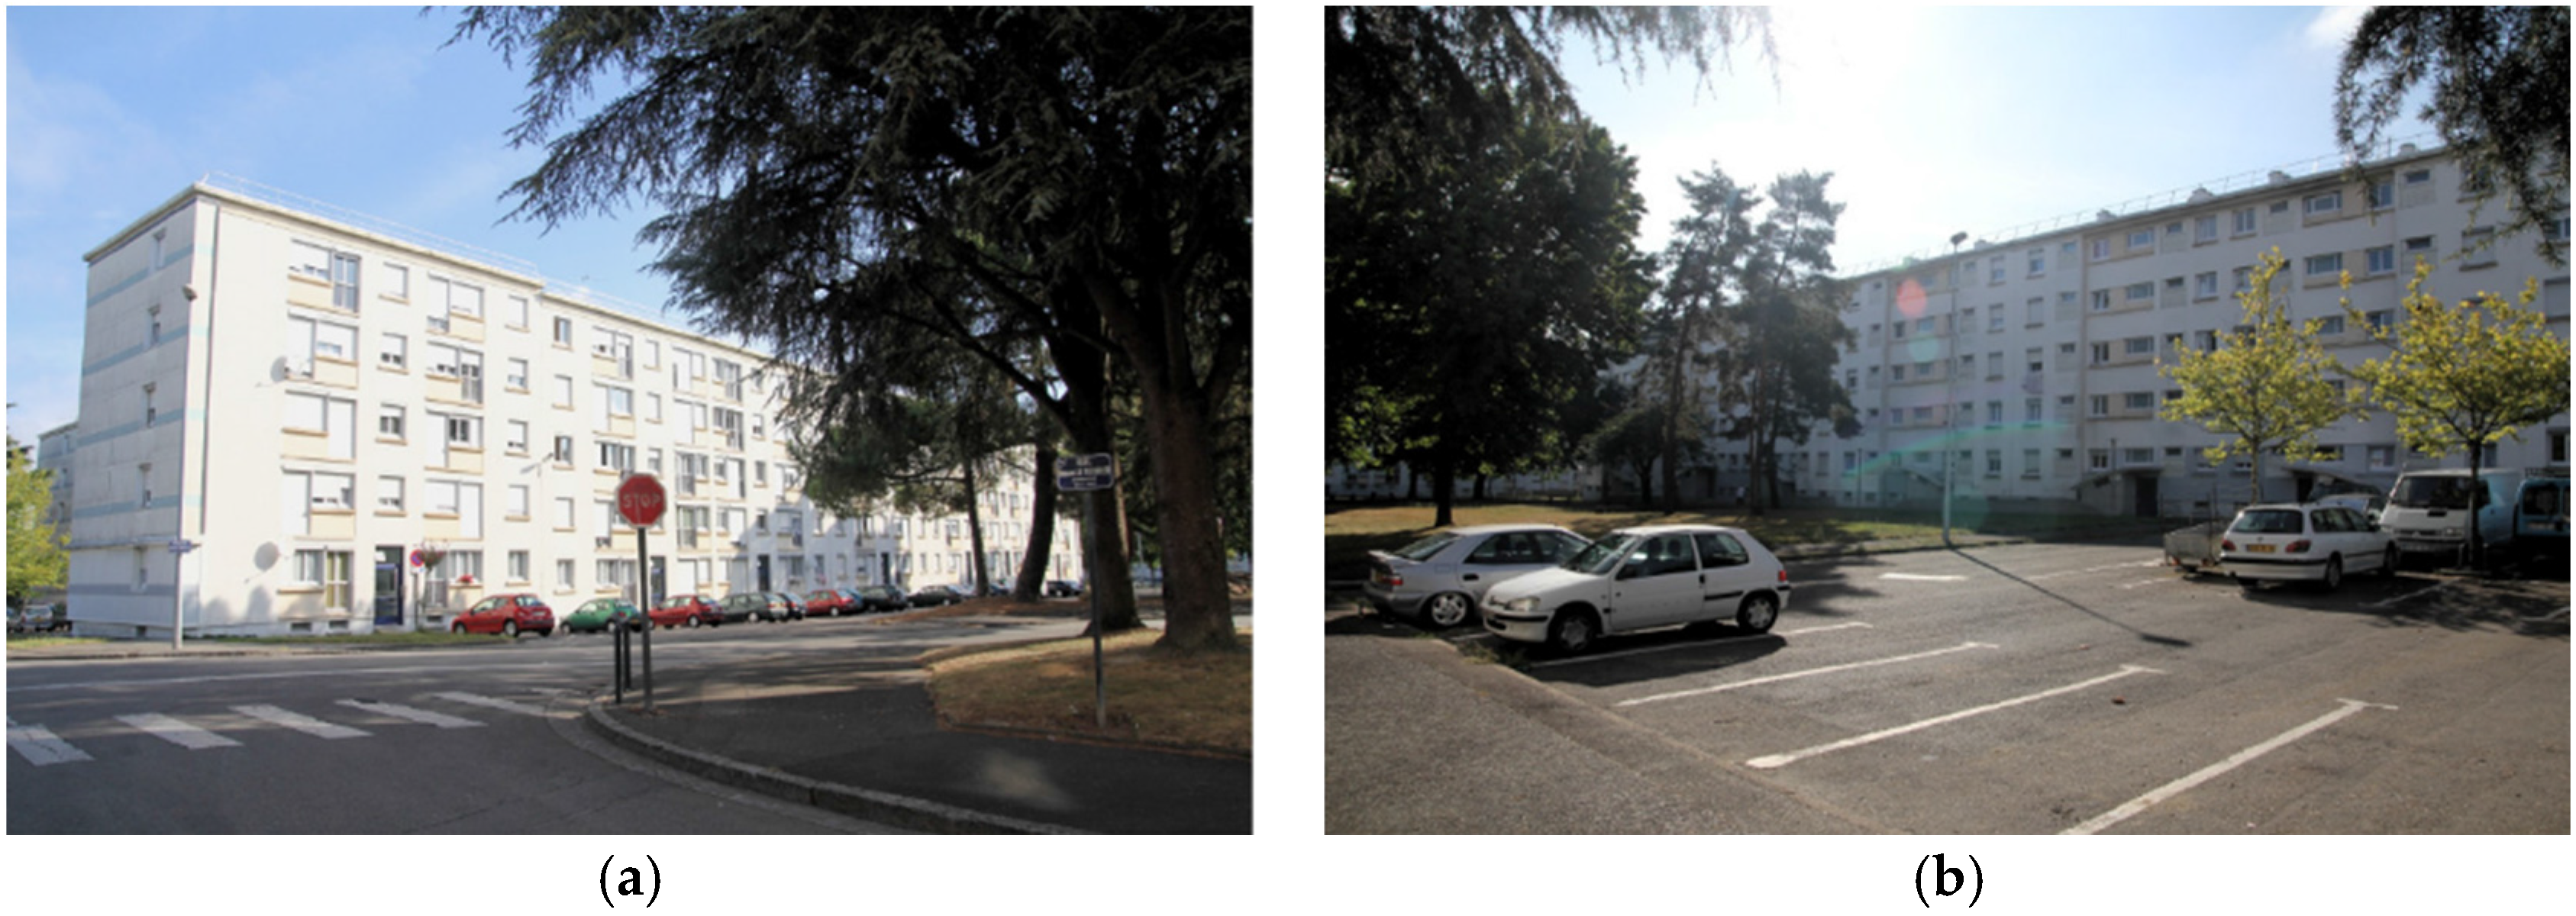
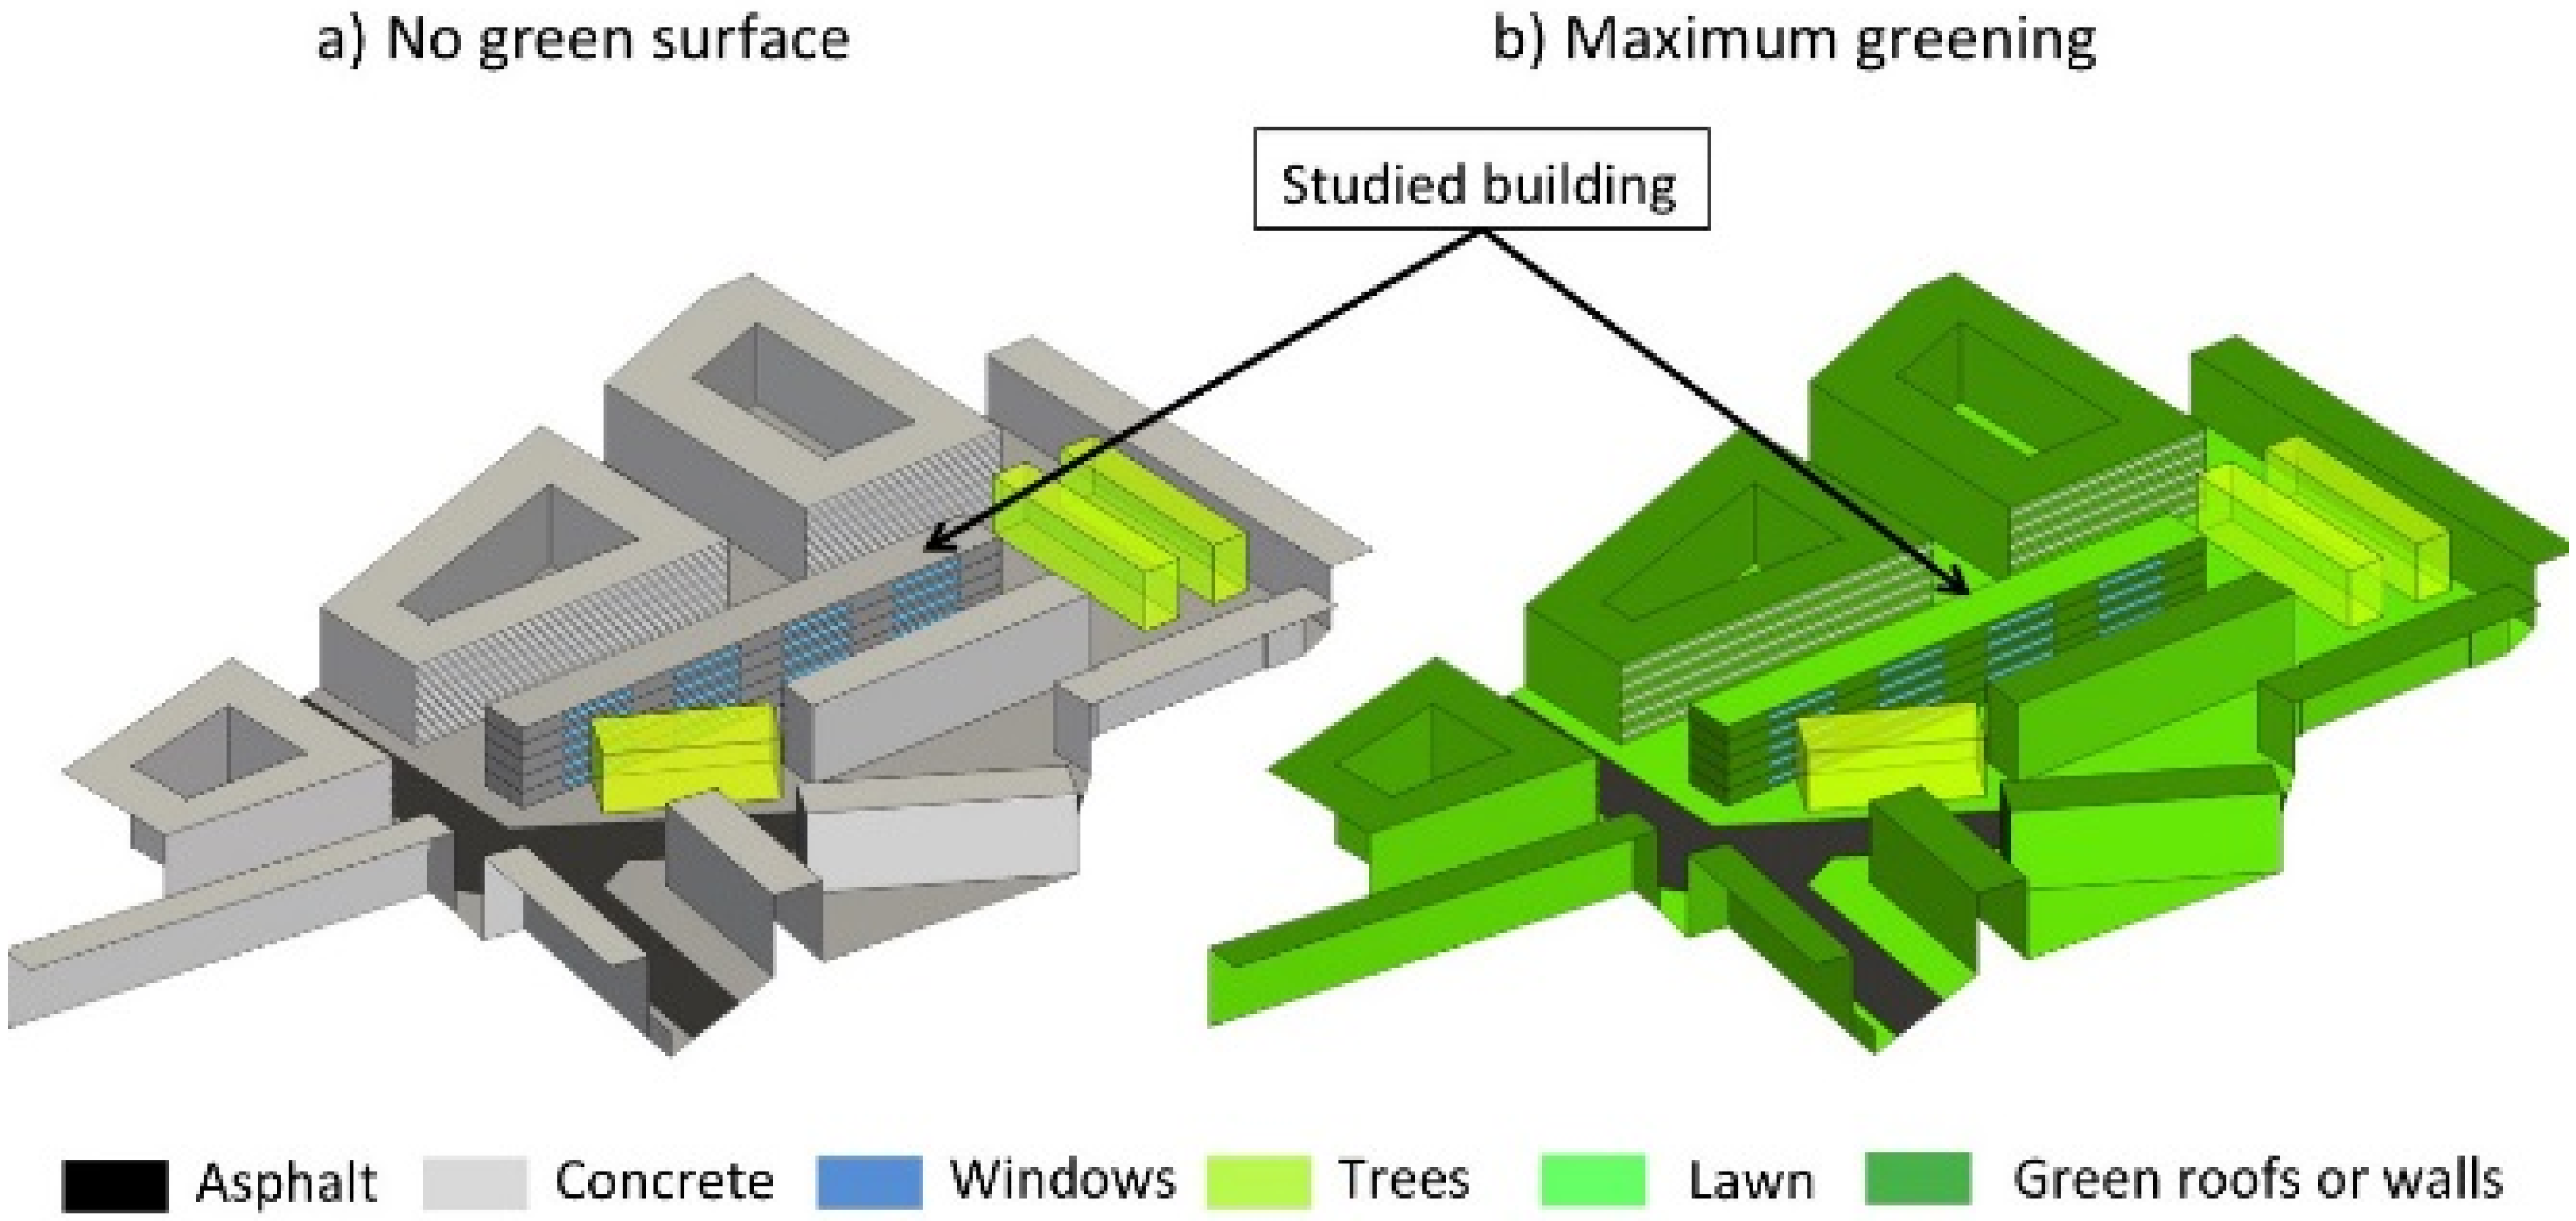
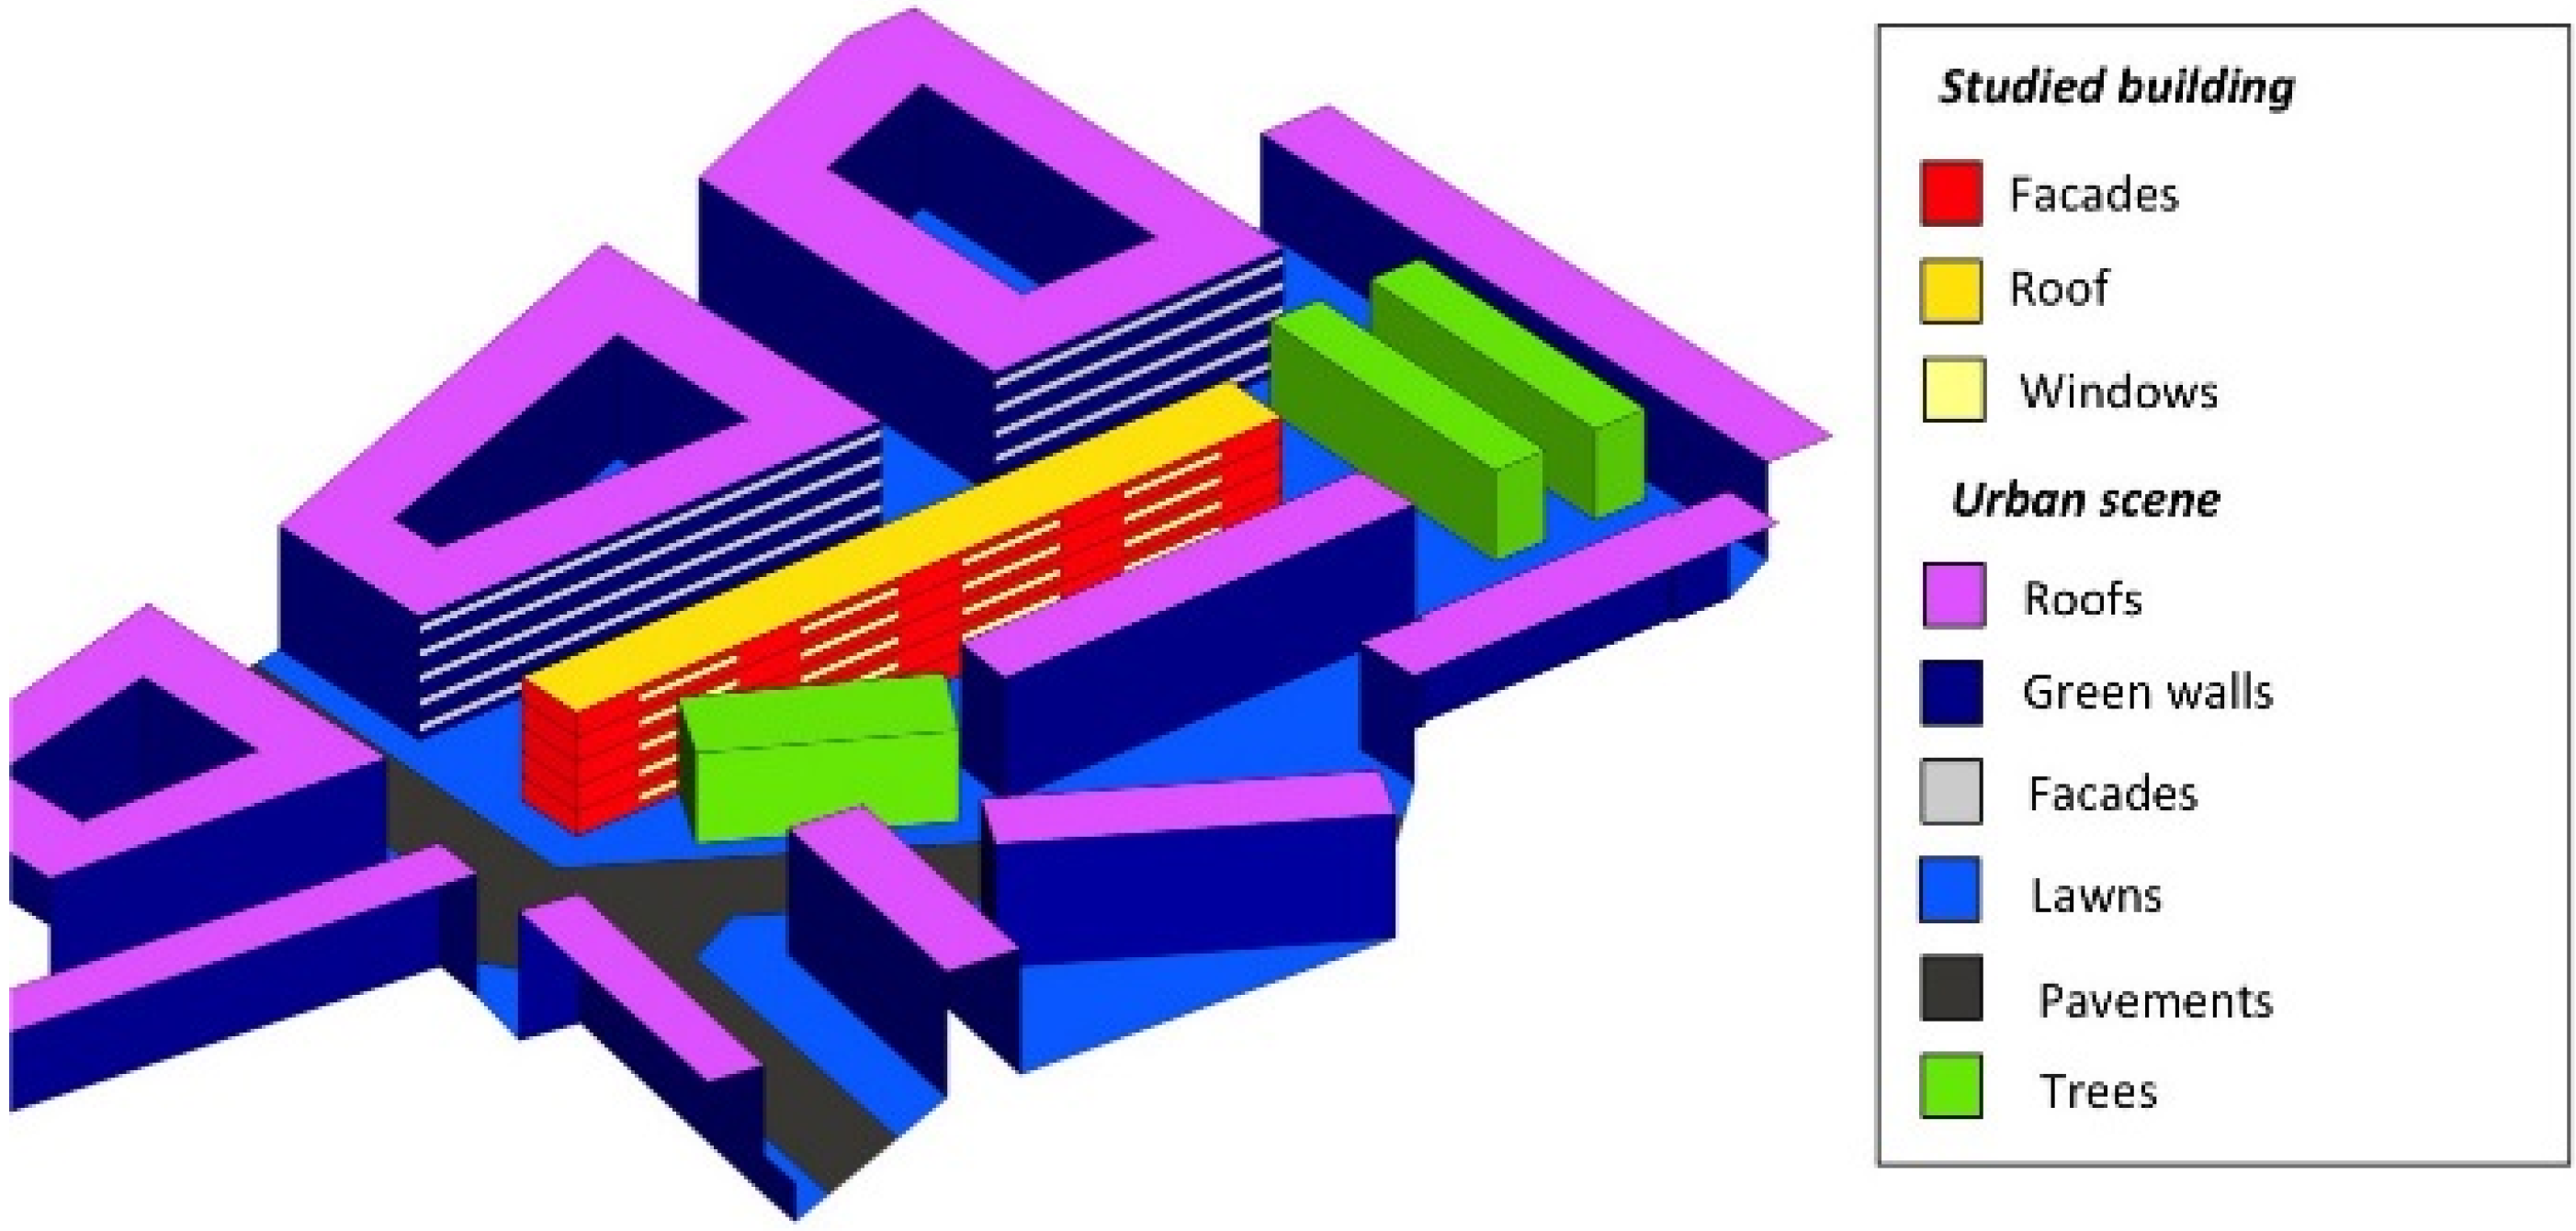
2.2. The Studied Urban District

Our study has been carried out in an actual urban district, called Pin Sec, in Nantes. Pin Sec underwent urbanization from 1954 through the end of the 1980s. The first buildings constructed here were called “large blocks” (“grands ensembles” in French), though those built in Nantes were not as high as in other French cities. The construction techniques employed in this district were typical of practices during France’s post-war economic boom, i.e., featuring non-insulated concrete.
This district was chosen because of the presence of comprehensive measurement instrumentation. Furthermore, it is representative of suburban residential districts that constitute land reserves due to their low density. As a countermeasure to urban sprawl, these districts were earmarked for increased density, as was the case for similar districts in the city of Nantes. The proposed Pin Sec densification scenario corresponds to an increase in density from 20% to 35%, with this latter figure having been attained in current projects. The block plans of this district, in both its present state and with a denser layout, are shown in Figure 1.

2.3. The Studied Building

The building under study is the so-called “Dunant block” (Figure 2); this choice was based on the fact that a meteorological station had been installed on the roof, though complementary measurements were conducted so as to verify that our model would correctly reproduce its thermal behavior [23]. Predominantly south facing, this building measures 99.2 m long by 9.6 m wide by 15 m high, corresponding to a total floor area of 4767 m2, encompassing 120 housing units.
Figure 1. Block plans for the district, in both (a) its present state and (b) following densification.
Energies 09 00032 g001
Figure 2. The Dunant building: (a) southern facade; and (b) northern facade.
Energies 09 00032 g002
This building has never been insulated, although the original windows have been replaced by double-glazed panes, with the following characteristics: a glazing ratio of 17%, glass transmissivity of 0.7 and a low facade albedo (0.3). The walls and roof are made of a single layer of concrete (10 cm thick for walls and 20 cm for the roof).
For the simulation, the indoor boundary conditions applied are as follows:
-
constant air change rate: Qr = 0.3 vol·h−1;
-
constant indoor heat gain: 30 kW.
Artificial soil surfaces are composed of a 10 cm-thick layer of asphalt and a 10 cm thick layer of concrete above a 2 m thick layer of soil. A description of the soil model is given in [27].

2.4. Greening Scenario

This study took place within the framework of the role of vegetation in sustainable urban development (VegDUD) Project [28], and the greening strategies studied were selected from among those identified in the project, i.e.,
-
architectural greening: green roofs and walls;
-
lawns;
-
trees;
-
sustainable urban drainage systems using vegetation;
-
vegetation in deep soil vs. a soilless culture.
These strategies, or volume devices, were studied with respect to two families of parameters, namely:
-
their management: extensive vs. intensive;
-
their spatial distribution (city, district or building).
At the building or district scale, the use of SOLENE-microclimat allows handling the first three options. We have elected to focus on green roofs, green walls and lawns, because they all comprise surfaces and are thus more comparable, though admittedly, trees are volume devices, as well.
With the capability of explicitly representing urban geometry, it then becomes possible to explore the relative effect of various types of surfaces (roofs, soil, facades) based on their distribution across the urban landscape.
The presence of trees was included in the model of the district, and a description of the way to model them is given in [22]. Nevertheless, various tree layouts were not studied here. This will be done in the future. The green walls are living walls with an irrigated substrate. This model has been developed and validated by Malys et al. [25] from measurement data. For all configurations, we have assumed an absence of hydric stress; subsequently, results are to be analyzed in terms of water consumption.
The hypotheses adopted for vegetation modeling are as follows:
-
foliar density: leaf area index (LAI) = 2;
-
thickness: L = 0.2 m;
-
extinction coefficient: ks = 0.8;
-
transmissivity: τf = 0.2;
-
an irrigation equal to potential evaporation (PTEc).
The goal here is to isolate the vegetation effect, neglecting both the insulation and inertia effects of the substrate. Only the solar mask and evapotranspiration of vegetation, which cannot be replaced by wall construction materials, have been studied. This set-up implies comparing a building whose living wall contains a substrate to one with walls featuring the same thermal conductivity, density and thermal capacity.
Similarly, albedo values have been set at 0.2 for facades and 0.3 for roofs. We have assumed that artificial pavement surfaces are covered with a paint whose reflectivity equals that of vegetation.

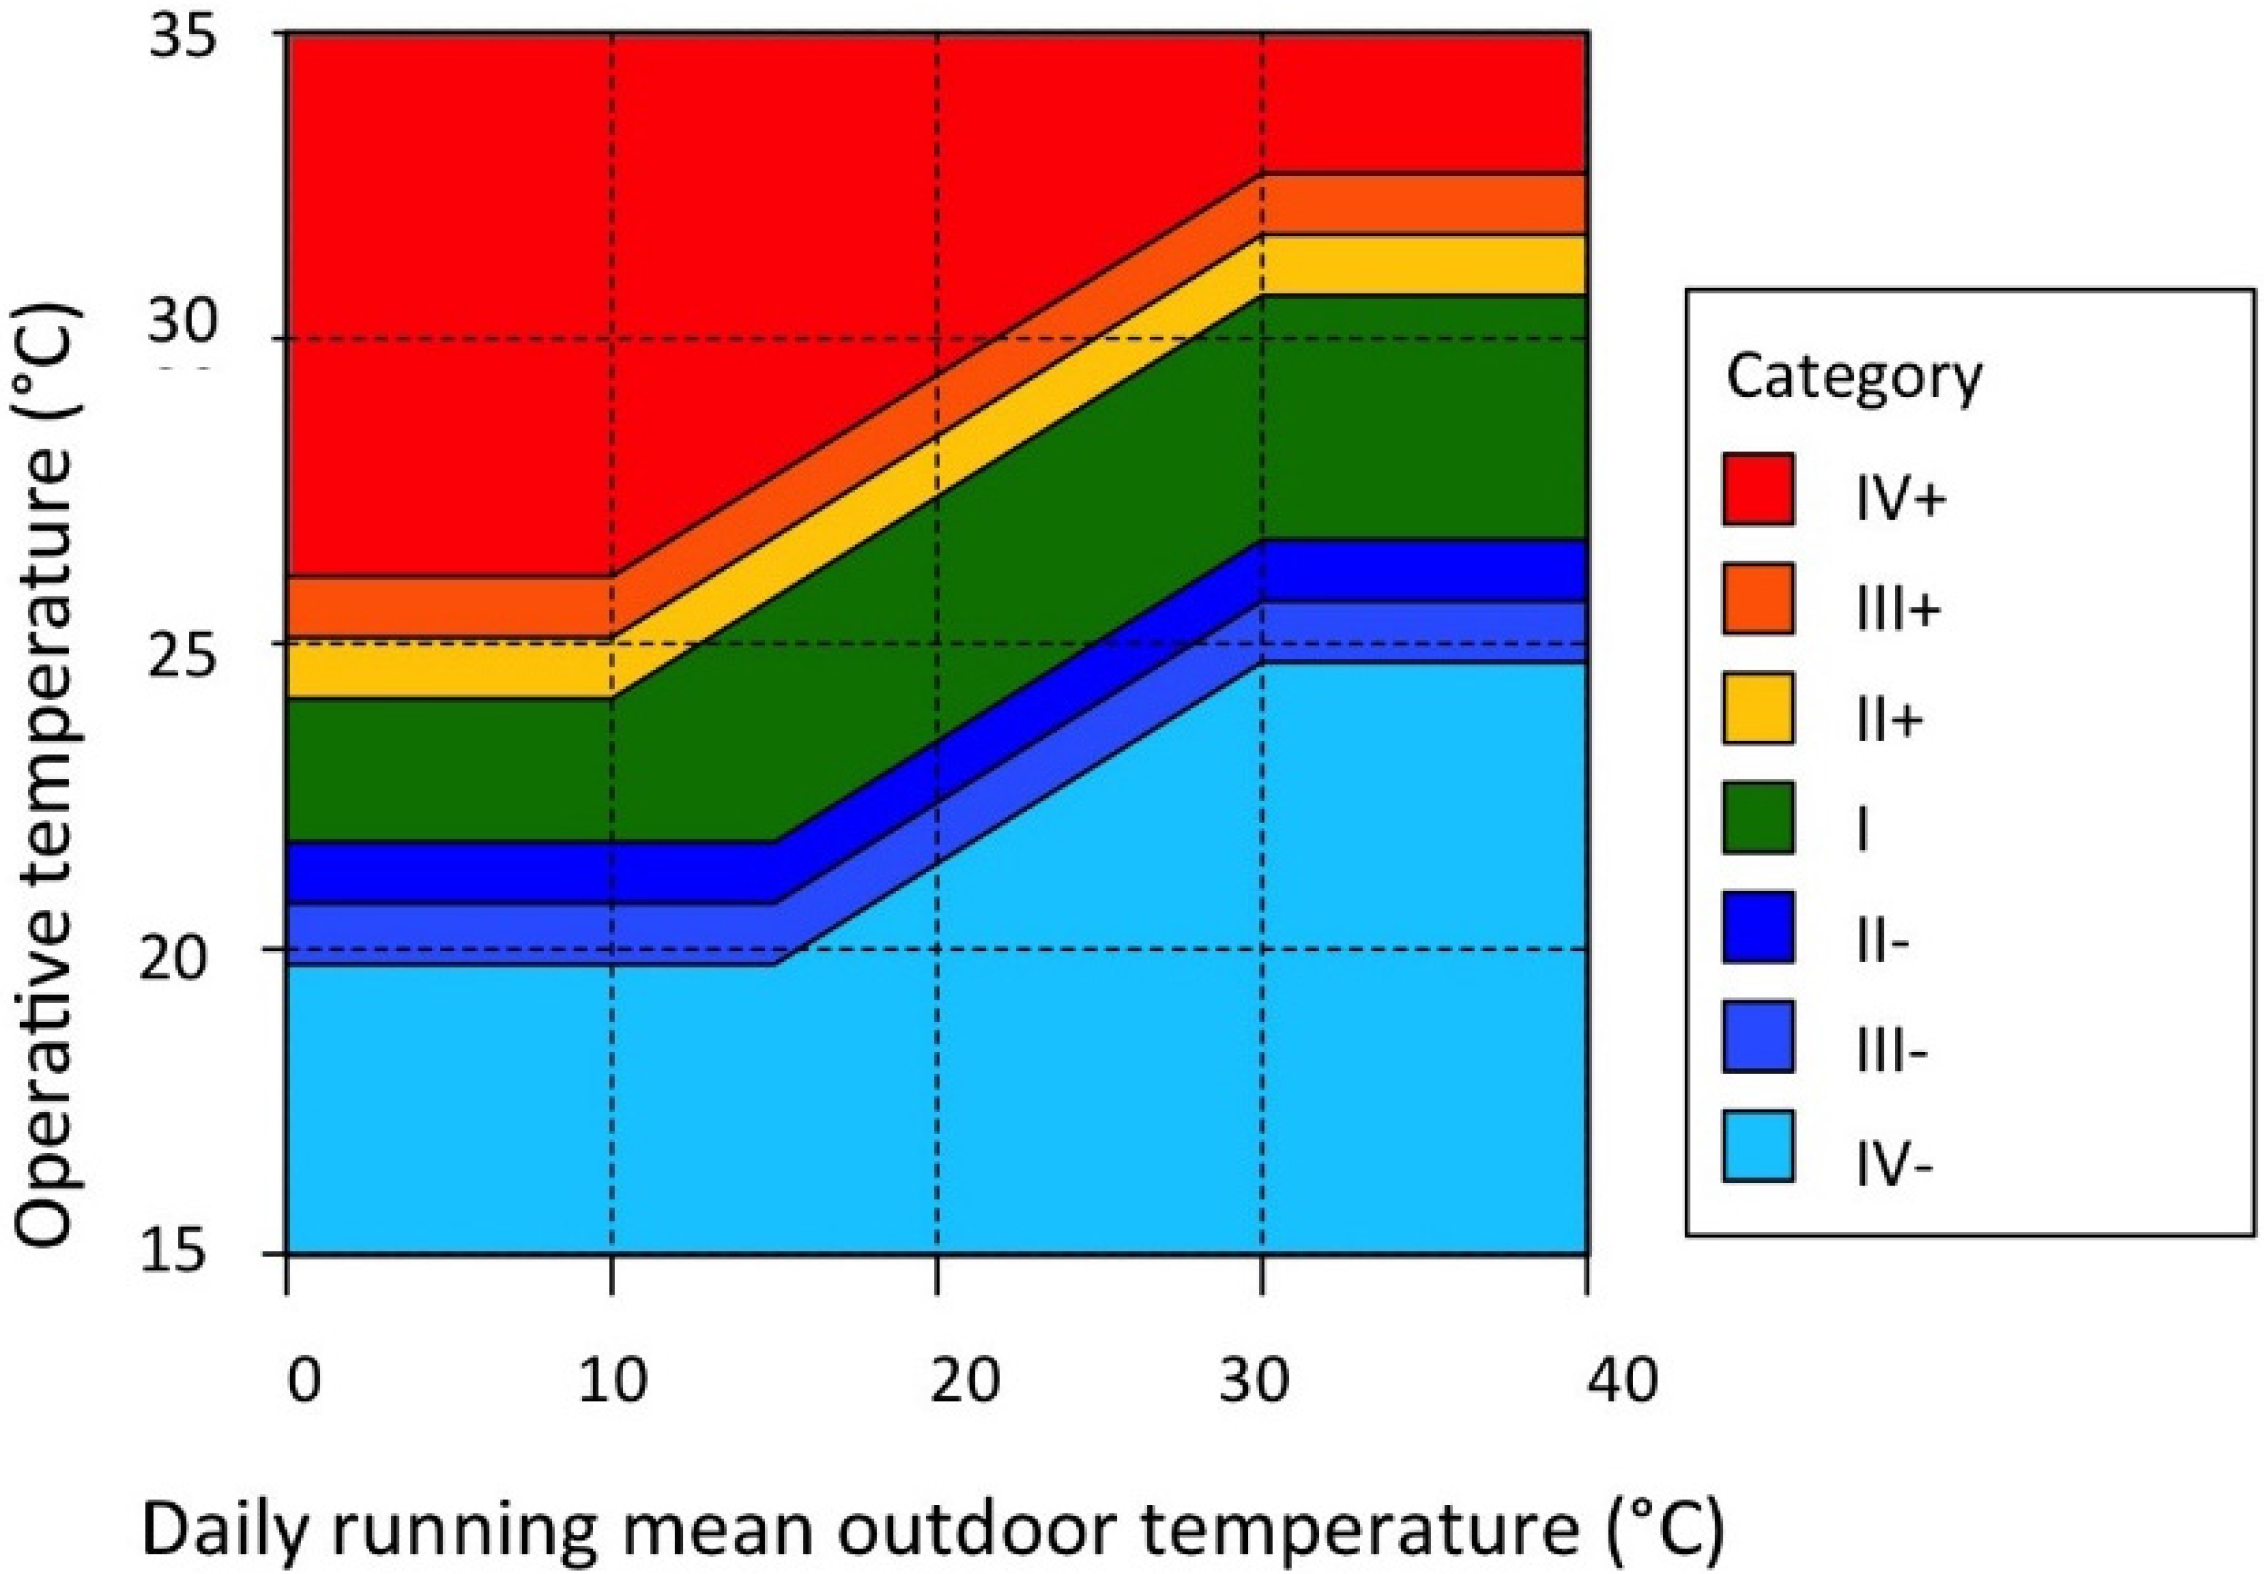
2.5. Adaptive Comfort

To compare the effects of these test strategies, we have used the indoor summer thermal comfort assessment (with no cooling system). An adaptive thermal comfort approach takes into account the ways people perceive their environment change. Their seasonal expectations of temperature and relative humidity, as well as on their capacity to control the spatial conditions are also considered [29,30].
A calculation method is presented in the European standard (NF-EN) 15251 Standard [31]. Four thermal comfort categories are defined on a predicted percentage dissatisfied-predicted mean vote (PPD-PMV) index that takes into account clothes, activity, mean radiant temperature, air temperature, velocity and humidity. In this standard [31], thermal comfort categories for naturally-ventilated spaces are differentiated by:
  • high expectations, used solely for spaces occupied by very sensitive and fragile individuals;
  • normal expectations, used for new buildings and renovated spaces;
  • moderate expectations, used for existing buildings;
  • expectation level for buildings outside the first 3 category levels. It is suggested that this category should be used for just a short period of the year.
With a relative humidity of 50% and a low air velocity, these categories are defined strictly from operating temperature ranges, as calculated by taking into account the variations in outdoor temperature during the previous days via the outdoor running mean temperature θm,i. This parameter is formulated on the basis of its value on the previous day (θm,i−1), the mean daily value of outdoor temperature on the previous day (θe,i−1) and a coefficient α. Its recommended value equals 0.8:
θ m , i = ( 1 α ) θ e , i 1 + α θ m , i 1
The limits of these recommended comfort categories for a residential building are expressed in the following and then presented in Figure 3 as a function of the outdoor running mean temperature:
θ I , max = 0.33 θ m + 18.8 + 2
θ I , min = 0.33 θ m + 18.8 2
θ II , max = 0.33 θ m + 18.8 + 3
θ II , min = 0.33 θ m + 18.8 3
θ III , max = 0.33 θ m + 18.8 + 4
θ III , min = 0.33 θ m + 18.8 4
Figure 3. Thermal comfort categories for the operating temperature in naturally-ventilated buildings, according to the European standard (NF-EN) 15251 Standard [31].
Energies 09 00032 g003

3. Simulations

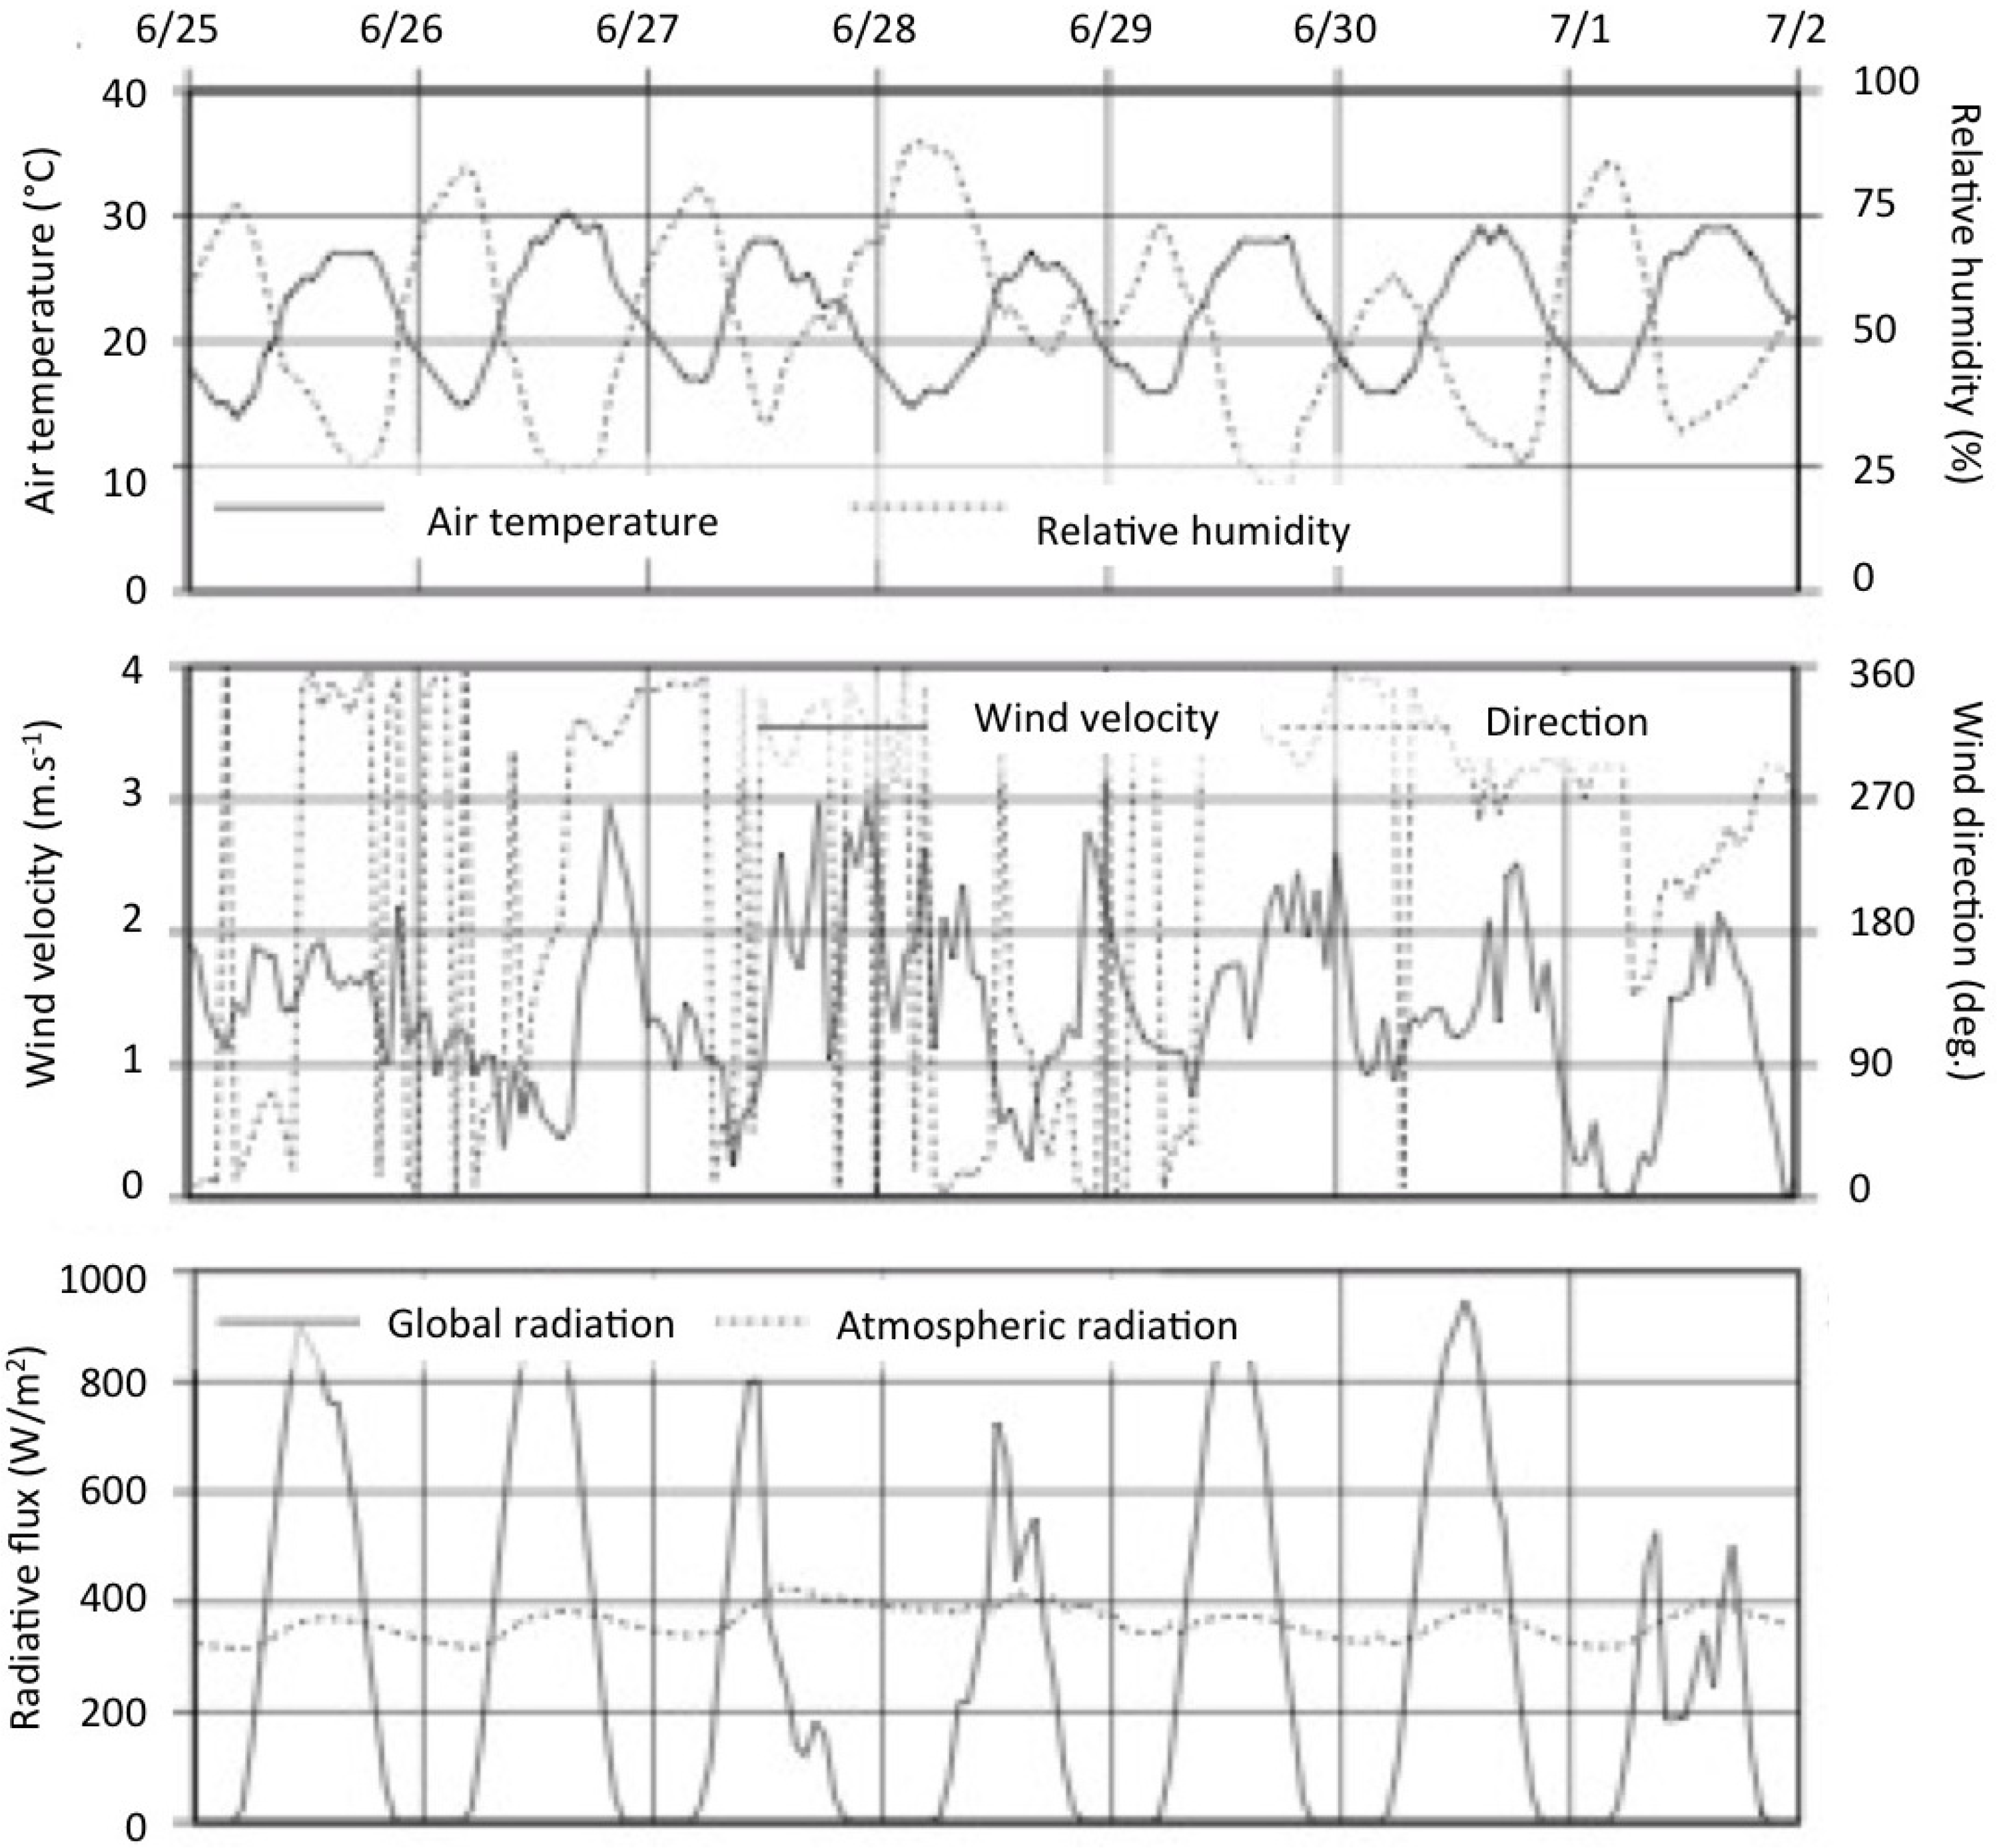
3.1. Weather Conditions

With respect to the weather conditions, we relied on in situ measurements for the year 2010 [32], consisting of:
-
outdoor temperature (sensors/Vaisala HMP45C-L, Campbell Scientific, Logan, UT, USA);
-
solar radiation (pyranometer Skye SKS 1110, Environmental Measurements Limited, North Shields, UK);
-
infrared atmospheric flux (pyrgeometer Kipp&Zonen CGR3, Kipp & Zonen, Delft, The Netherlands);
-
wind velocity and direction (wind monitor Young 05103, Young, Traverse City, MI, USA);
These data are acquired at a 3 s time step, but provided by the experimentalist after an average over a period of 15 min. Four our application, the average period is 1 h. They are then used as entries for all of the simulations. Wind velocity is used to calculate the airflow field (coupling with the Code-Saturne model) and the convective heat transfer coefficient. The LW energy balance within this urban landscape and exchanges with the sky are also calculated.
Our analysis focused on the hottest week recorded in 2010, i.e., 25 June to 2 July. Meteorological data recorded on the building roof during this period are given in Figure 4. Air temperature ranged between 15 °C and 30 °C; and wind velocity, while highly variable, did not exceed 3 m/s. Just after the summer solstice, solar fluxes on a horizontal surface were near their maximum at nearly 1000 W·m−2 on the afternoon of 26 June. Cloud cover was prevalent on 27 and 28 June, as well as on 1 July, which also resulted in an increase of infrared thermal flux from the sky vault. With the exception of these periods, the infrared flux varied from 320 W·m−2 to 400 W·m−2.
Even though it was not excessively hot, this week still gave rise to thermal stresses by virtue of following a rather cold week. Consequently, according to the principles of adaptive comfort, the temperatures used to ascertain indoor comfort will be low, i.e., 6 °C less than the mean daytime temperature on 26 June.
Figure 4. Weather conditions measured on the Dunant roof from 25 June to 2 July 2010.
Energies 09 00032 g004

3.2. The Targeted Greening Strategies

When choosing the applicable greening strategy, we considered two objectives:
-
separating direct from indirect effects of the green envelopes;
-
comparing the disposal rates.
This approach led us to distinguish five types of surfaces for potential greening, namely:
-
facades of the studied building;
-
roof on the studied building;
-
facades of the other buildings;
-
roofs on the other buildings;
-
the soil.
Considering all combinations would yield 32 distinct case studies.
The cases actually studied herein are presented in Table 1, i.e.,
-
the reference case, without vegetation, or Case (0);
-
Cases (1)–(3) are dedicated to assessing the direct effects (only the surfaces on the studied building are greened), with Case (1) being the facades, Case (2) being the roof and Case (3) being both facades and roof;
-
Cases (4)–(7) consider just the indirect effects of greening, with Case (4) focusing on the facades, Case (5) focusing on the roofs and Case (6) focusing on the lawns; both the facades and soil are greened in Case (7);
-
In Case (8), the entire envelop of the studied building is covered with vegetation, as are the other buildings;
-
Cases (0+), (3+), (4+) and (8+) are similar to Cases (0), (3), (4) and (8), respectively, yet with an insulated building; for this insulated building, 10 cm of mineral wool have been added to the internal surface of three walls and the roof.
Table 1. The 13 selected simulation cases.
Simulation cases00+1233+44+56788+
EffectReferenceDirectIndirectDirect + indirect
Building greeningFacades--X-XX-----XX
Roof---XXX-----XX
Greening of the vicinityFacades------XX--XXX
Roof--------X----
Soil---------XX--
+: with an insulated building-X---X-X----X
All types of surfaces, whose thermal characteristics remain variable, are shown in Figure 5, with their extreme cases being depicted in Figure 6. Table 1 presents the 13 cases simulated herein.
Figure 5. The various types of surfaces available for assignment.
Energies 09 00032 g005
Figure 6. 3D models of the simulated configurations for the two extreme cases: (a) with no green surfaces; and (b) maximum greening.
Energies 09 00032 g006

4. Results

These results have been analyzed from four perspectives on compiling and comparing several simulation cases:
-
Perspective 1, the effects of vegetation on the thermal insulation level: Cases (0), (3), (4) and (8) for the non-insulated building and Cases (0+), (3+), (4+) and (8+) for the insulated building;
-
Perspective 2, comparison of the direct and indirect effects from green walls: Cases (0), (3), (4) and (8);
-
Perspective 3, study of the direct effects of green envelopes: Cases (0)–(3);
-
Perspective 4, study of the indirect effects of urban green surfaces: Cases (4)–(7).
These results simultaneously consider: indoor thermal conditions, modification of the urban microclimate and thermal exchanges between the building and its surroundings.
The large quantity of data generated has led to various analyses for each perspective. Comparisons will first be carried out for indoor conditions. In seeking to highlight the green wall effect, which until now has been studied the least, focus is placed at the mid-height of the building, i.e., on the third floor.
Next, the energy exchanges between the building and its surroundings will be studied by analyzing heat fluxes at the outer surfaces.
Lastly, water requirements to irrigate the green envelopes for effect optimization will be provided.

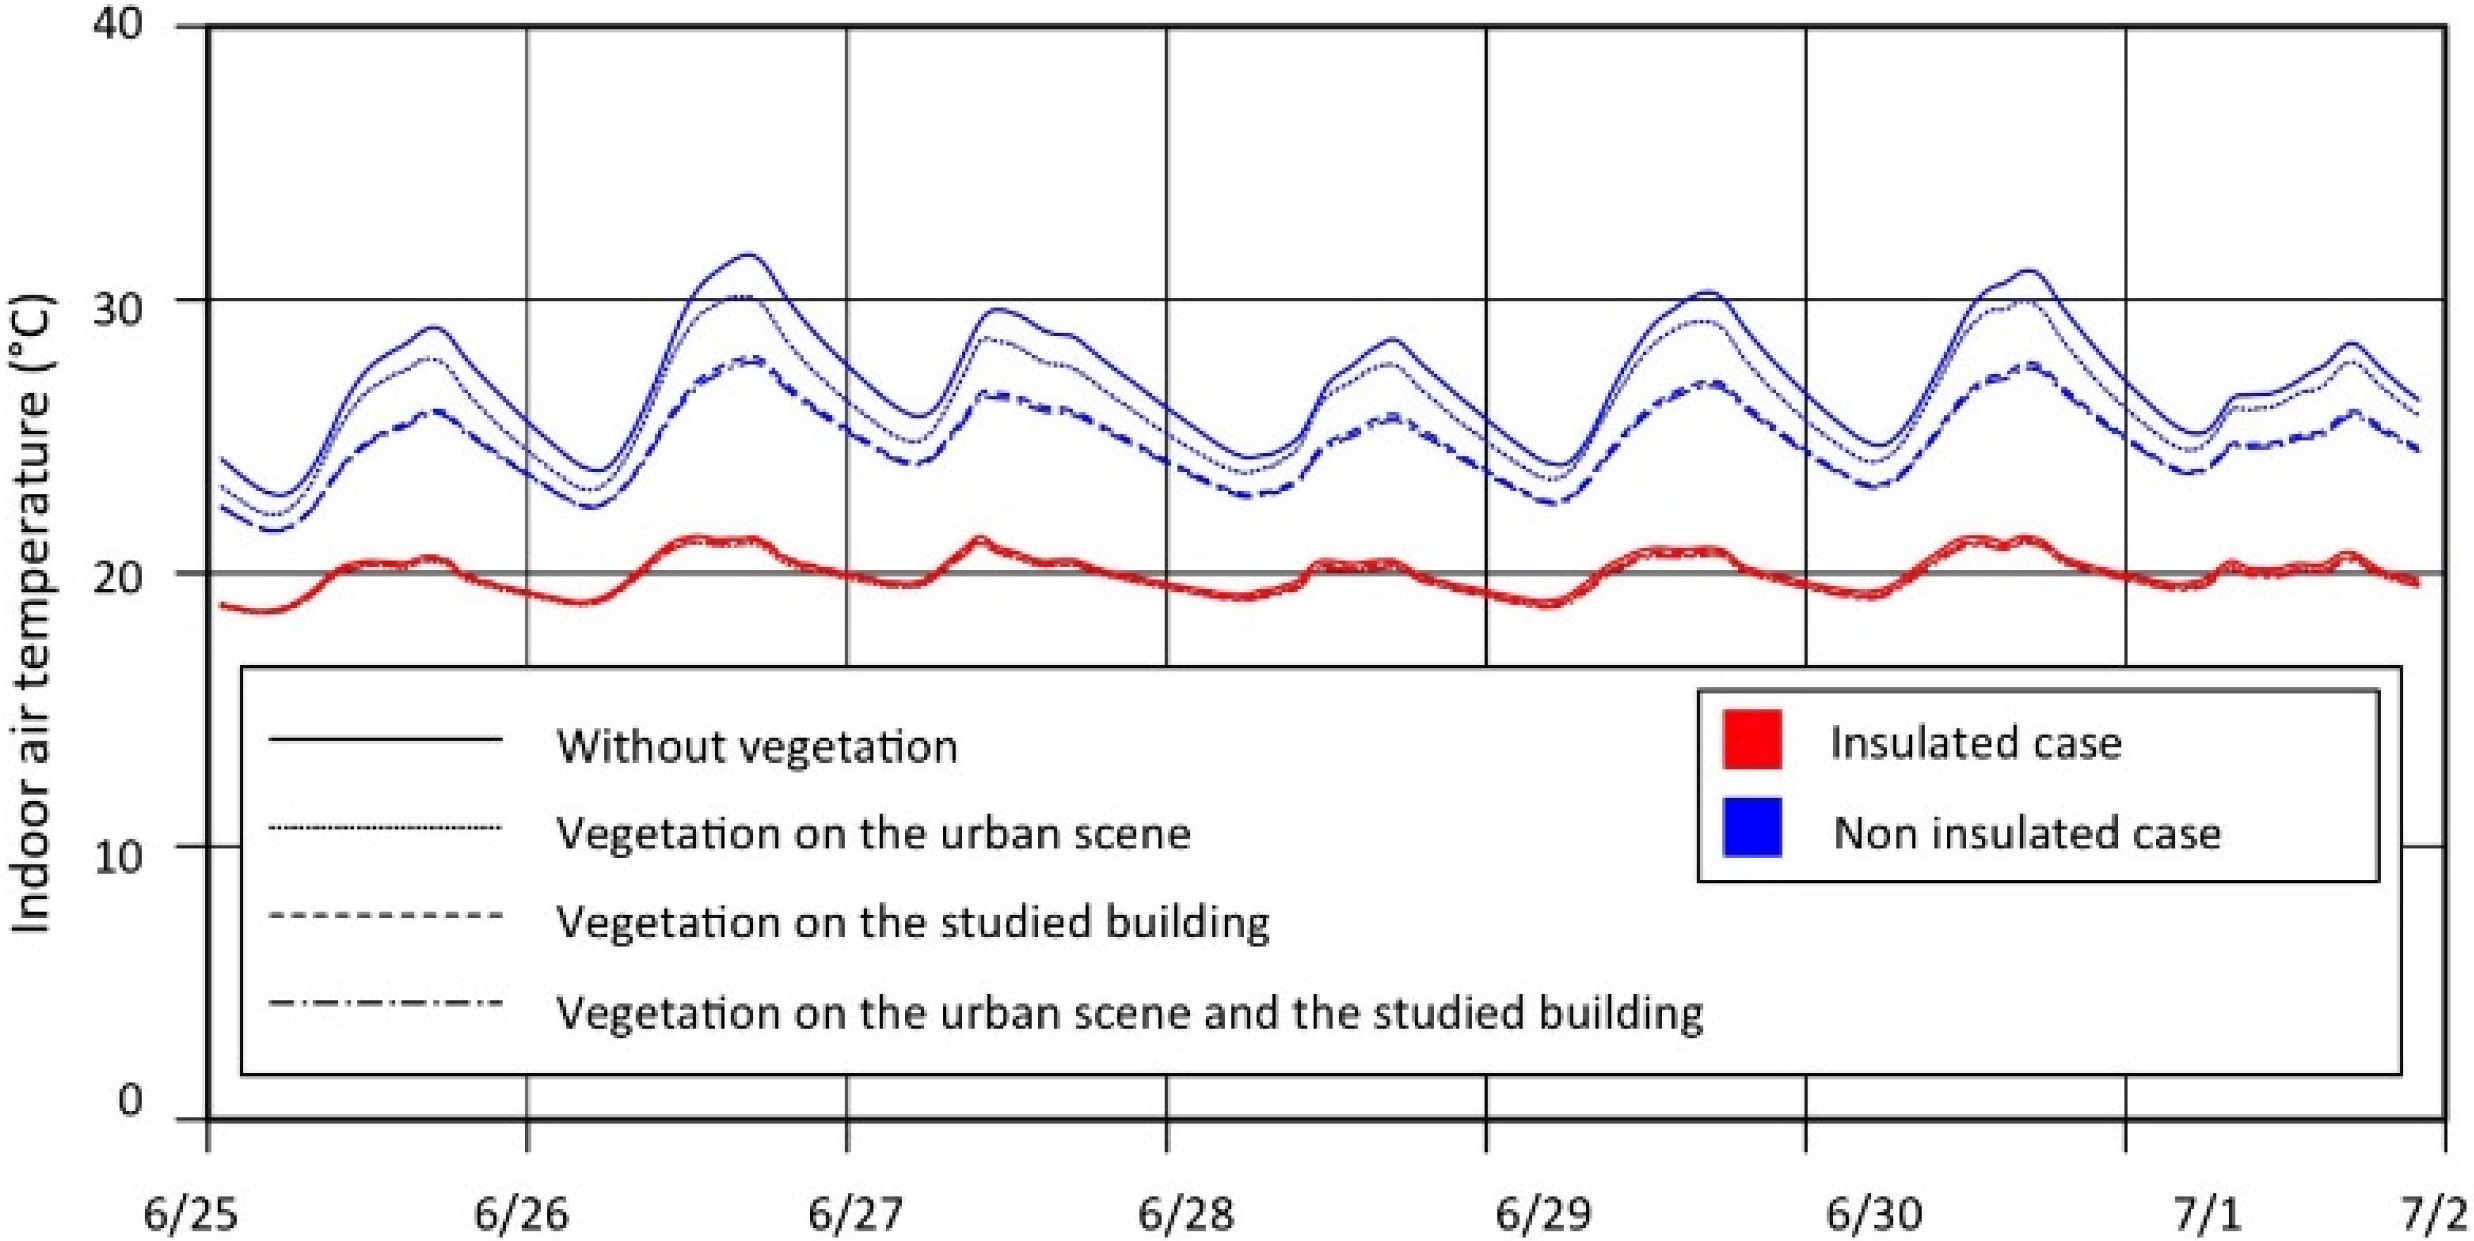
4.1. Perspective 1: Impact of Green Surfaces on the Thermal Insulation Level

According to the results previously obtained [19,27], it may be assumed that a well-insulated building will be little affected by adding green envelopes. The results derived for both the insulated and non-insulated buildings are displayed in Figure 7.
Figure 7. Indoor air temperatures (average of all five floors) for the insulated and non-insulated cases.
Energies 09 00032 g007
These findings simultaneously reveal the sensitivity of the building’s thermal behavior to direct effects (i.e., green strategies on the building), indirect effects (green strategies on surrounding surfaces) and a compounding of these two effects.
Let us note the major differences between cases relative to the insulated building and those relative to the non-insulated one. The amplitude and mean values of indoor temperature variations differ sharply. For the insulated cases, the amplitude of daily temperature variation is less than 3 °C, while this figure may exceed 6 °C for the non-insulated building without vegetation, where indoor temperatures can top 30 °C. In all insulated cases, indoor temperatures vary slightly in the vicinity of 20 °C.
To highlight the differences due to vegetation, it can be postulated that they become imperceptible when the building is insulated and remain capable of reaching 2 °C to 7 °C, depending on the greening configuration actually implemented. This finding confirms those from other studies in the literature [6,10,24] and leads us at this point to focus our study solely on the non-insulated building.

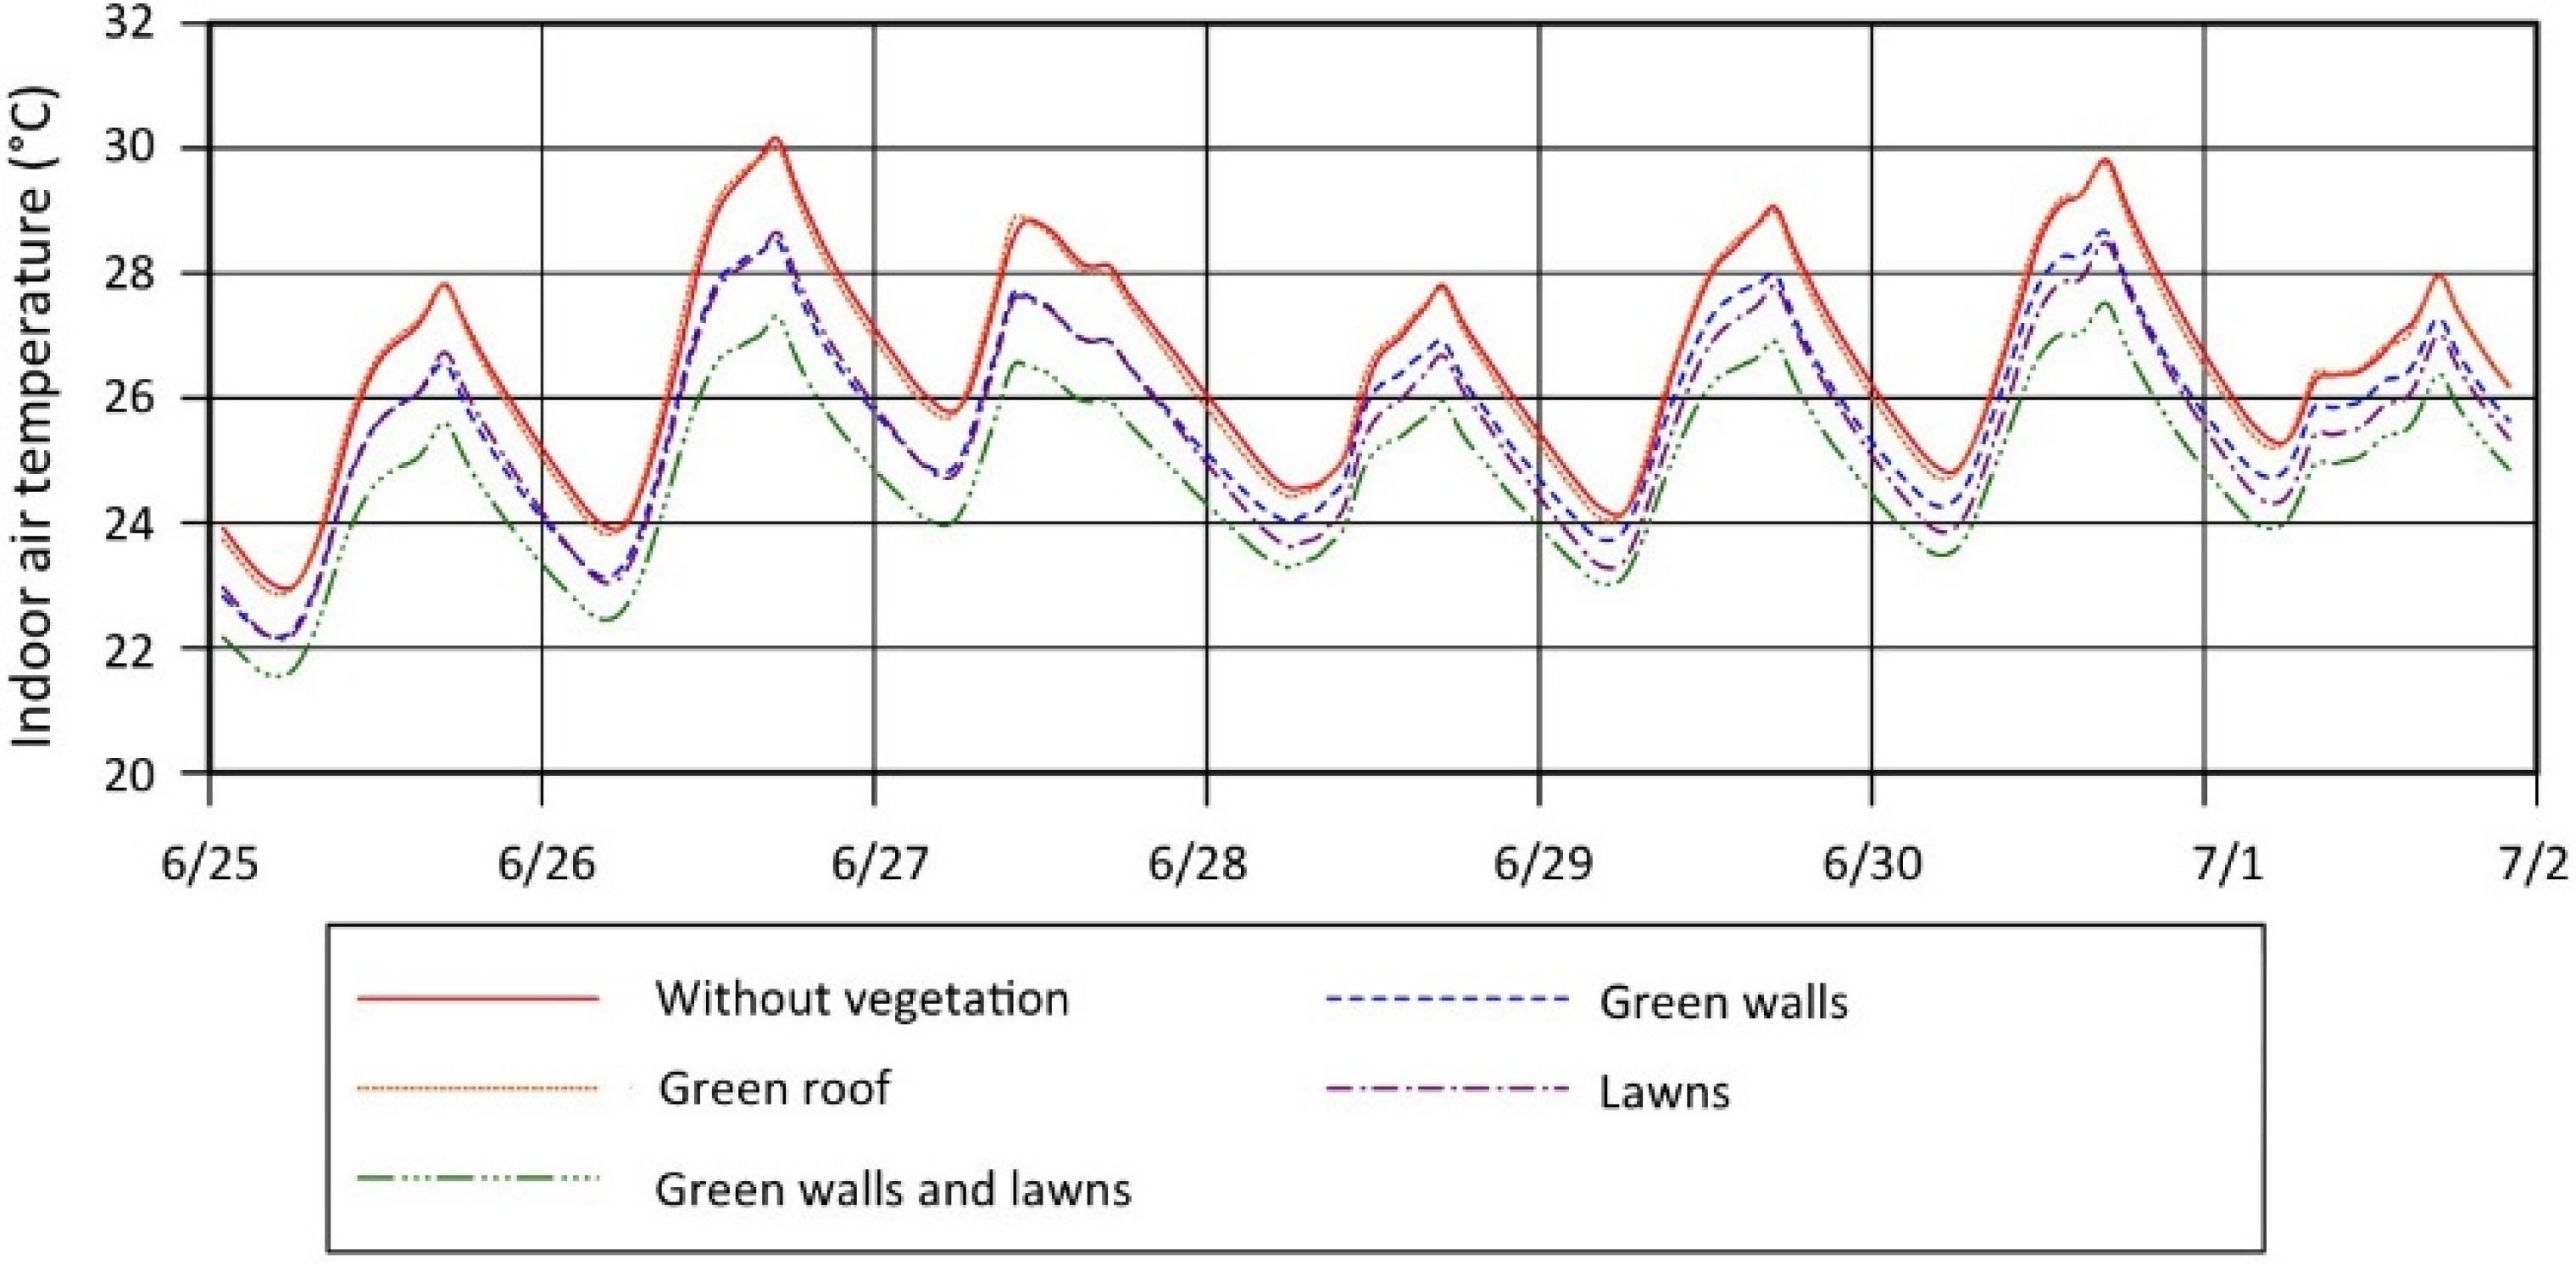
4.2. Perspective 2: Comparison of Direct and Indirect Effects of Green Facades

The focus here lies on a non-insulated building where facades have been greened either on the building itself, or on surrounding buildings, or on both the studied building and surrounding ones.
Figure 8 presents the variation in indoor temperatures on a floor at mid-height (i.e., the third floor) of the building for four cases:
-
the reference case, i.e., without vegetation (0);
-
green facades on just the studied building (3);
-
green facades on the surrounding buildings, but not on the studied one (4);
-
green facades on both the surrounding buildings and the studied one (8).
Figure 8. Indoor temperatures of the third floor (in blue) and the difference with the mineral case (in red). Nota bene (N.B.): the results of the cases “vegetation on the studied building” and “vegetation both in the urban environment and on the studied building” are superimposed.
Energies 09 00032 g008

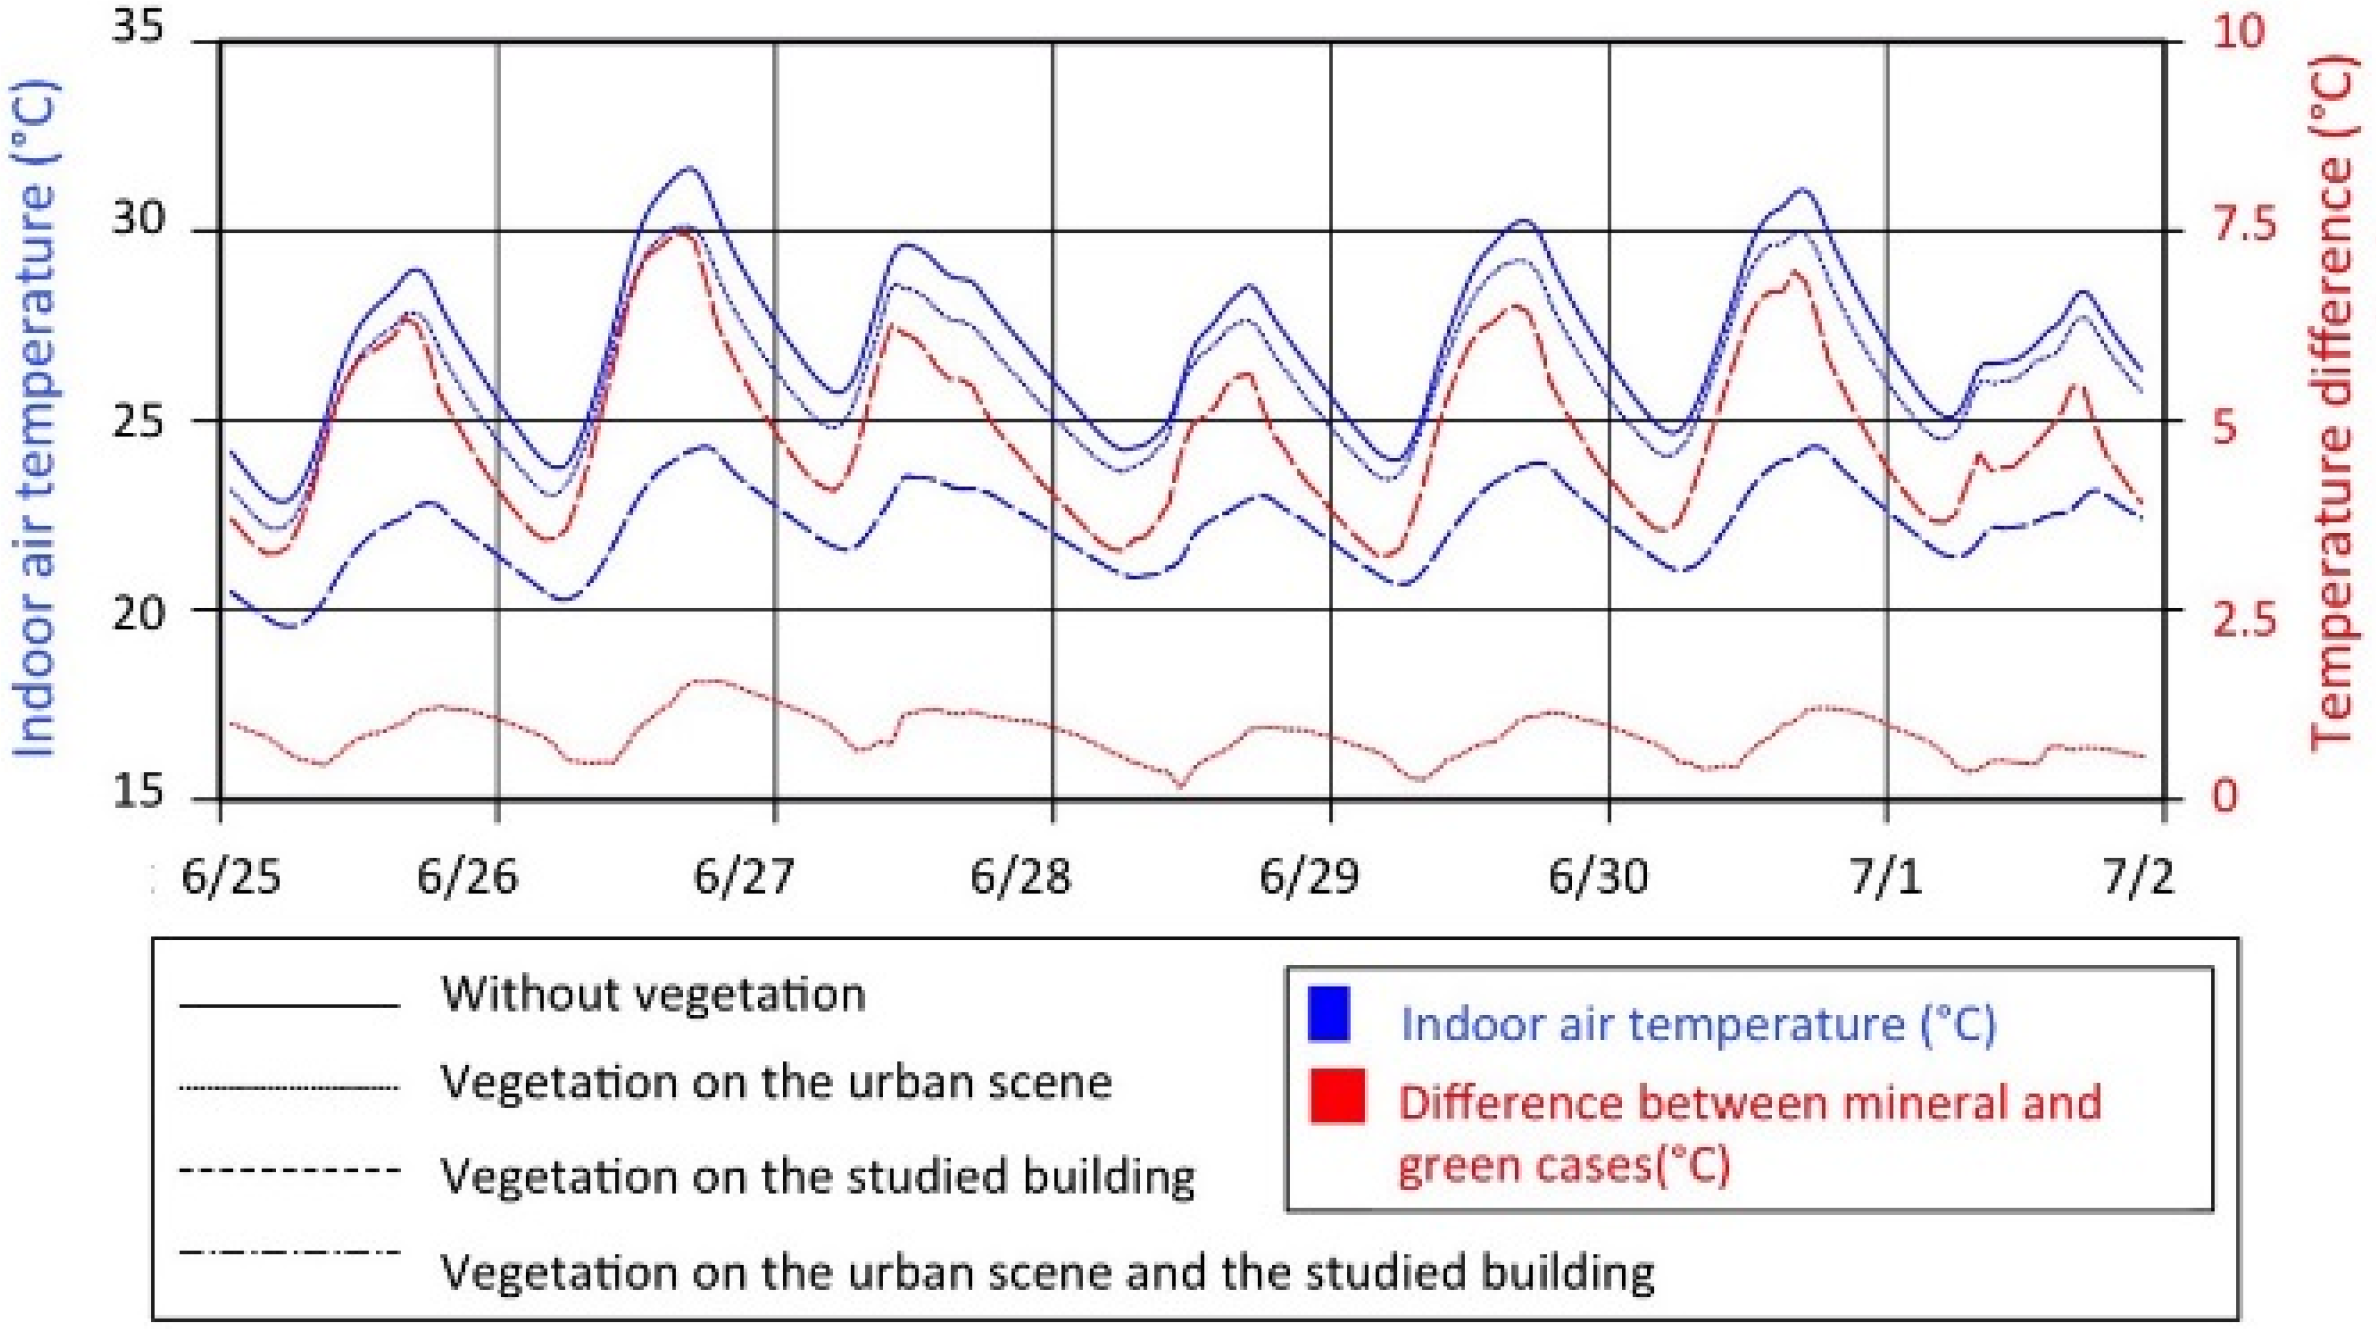
4.2.1. Indoor Air Temperature

Implementing green facades on the surrounding buildings exerts a quite limited impact on the indoor temperature of the non-greened building. The greatest reduction obtained is 1.7 °C. The magnitude of the effect increases at the end of the afternoon, yet this effect does not fundamentally alter the thermal behavior of the building: the daily amplitude also lies between 5 °C and 7 °C.
The effect on indoor air temperature is correlated with modifications to the surrounding surface temperatures that influence LW radiation exchanges and convective exchanges with the air, thus modifying air temperature, as well.
Greened facades on the studied building lead to cooler indoor air, particularly during the daytime. The highest observed difference equaled 7.5 °C, and the lowest was 3 °C. Temperatures were capped at 25 °C, while in the reference case, the 30 °C threshold was often surpassed.
The amplitude in daily variations was also attenuated and did not exceed 4 °C. The fact that the impact was greater during the daytime suggests that the shading effect of vegetation is predominant.
The indirect effect of greening is practically zero when the studied building contains green facades. Implementing green facades on a building implies that it will be less sensitive to a modification of thermal boundary conditions, in particular LW radiation.

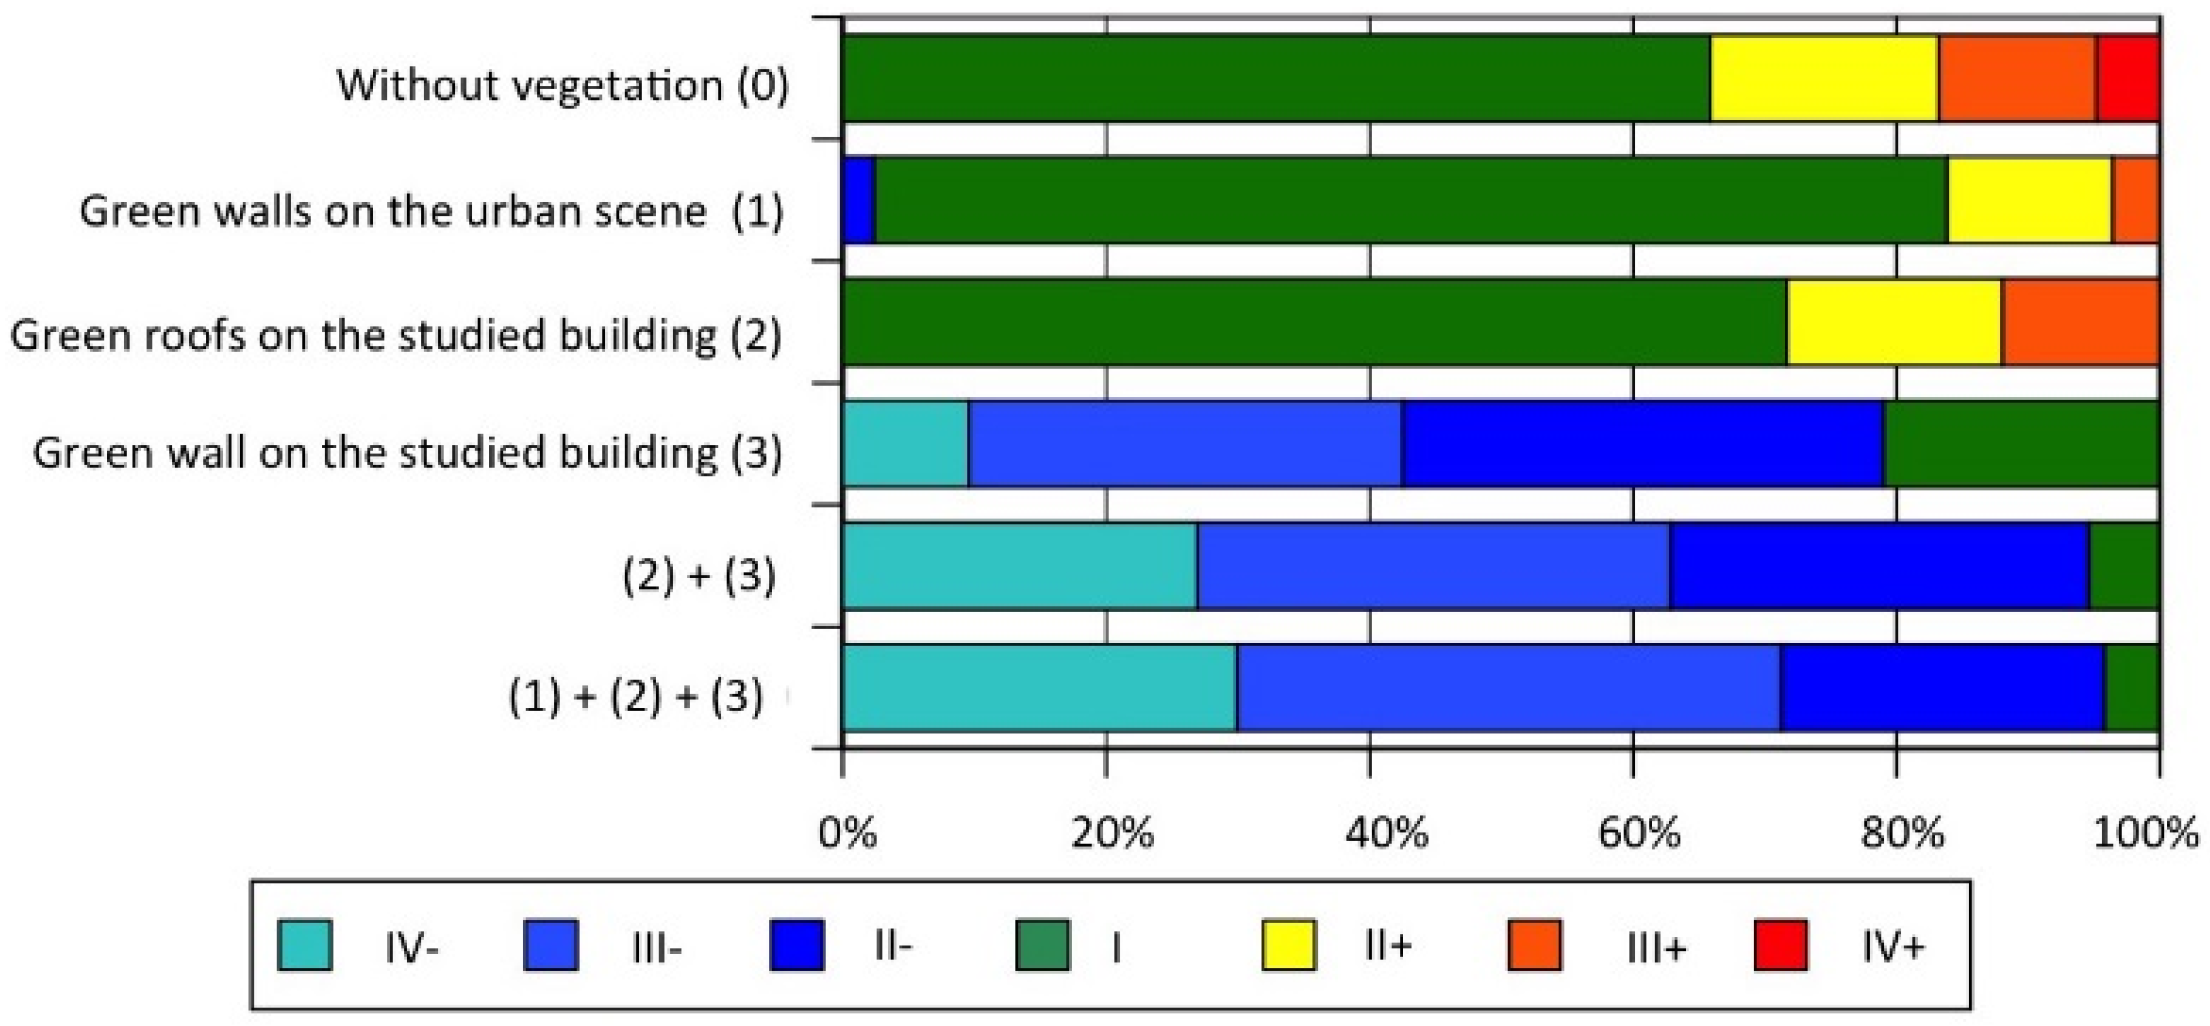
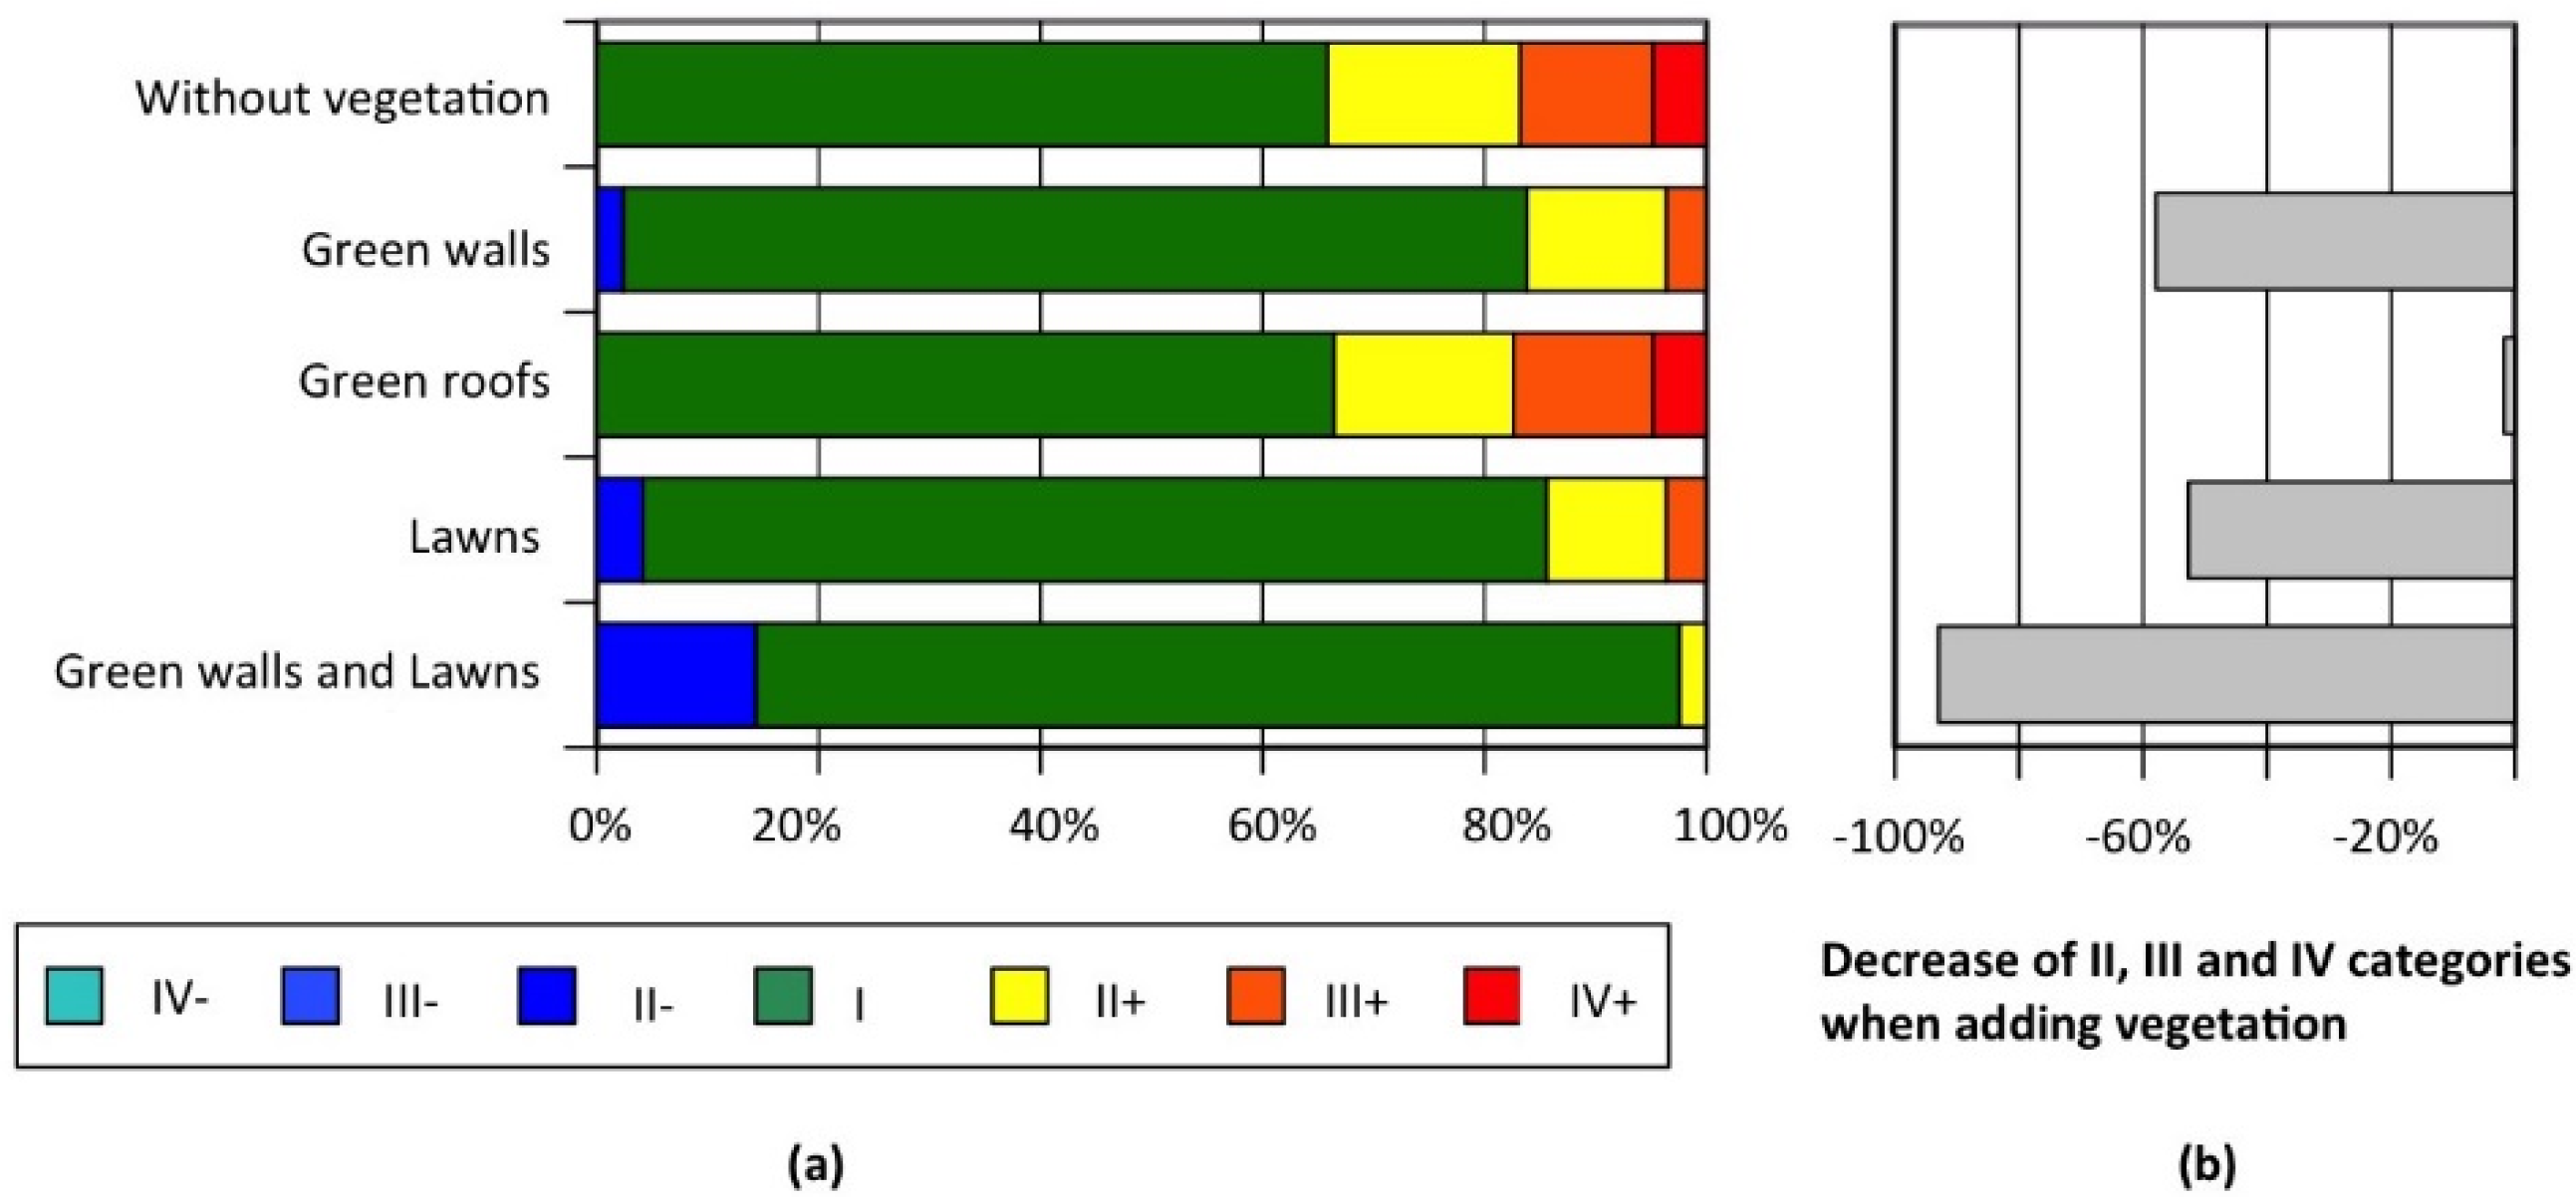
4.2.2. Indoor Thermal Comfort

Figure 9 shows the distributions of the occurrences among thermal comfort categories for the third floor. In the reference case, “hot” thermal comfort categories occur over 30% of the time; moreover, the IV+ category accounts for 5% of the occurrences. In contrast, this category tends to disappear under all green scenarios.
Figure 9. Distribution of the occurrences among thermal comfort categories on the third floor during the day.
Energies 09 00032 g009
The results when implementing a green roof or green facades on the studied building are also shown in Figure 9.
As regards the indirect effect, let us note that even though the difference in indoor temperature remained low, it was still sufficient to eliminate the occurrences of the IV+ comfort category. For the third floor, the indirect effect of green facades is greater than that of a green roof on the building, with this finding being somewhat counterintuitive.
The use of green facades on the studied building leads to significant changes in the comfort category distribution. Hot categories disappear and are offset by a sizable increase in cold categories. The appearance of these so-called “cold” categories might seem alarming, but it can still be verified that minimum temperatures lie around 20 °C at night (Figure 8) when the outdoor temperature is around 17 °C.
The indirect effect of implementing green facades on a studied building, in cases with green facades, as well, is perceptible, albeit quite small.

4.2.3. Water Balance
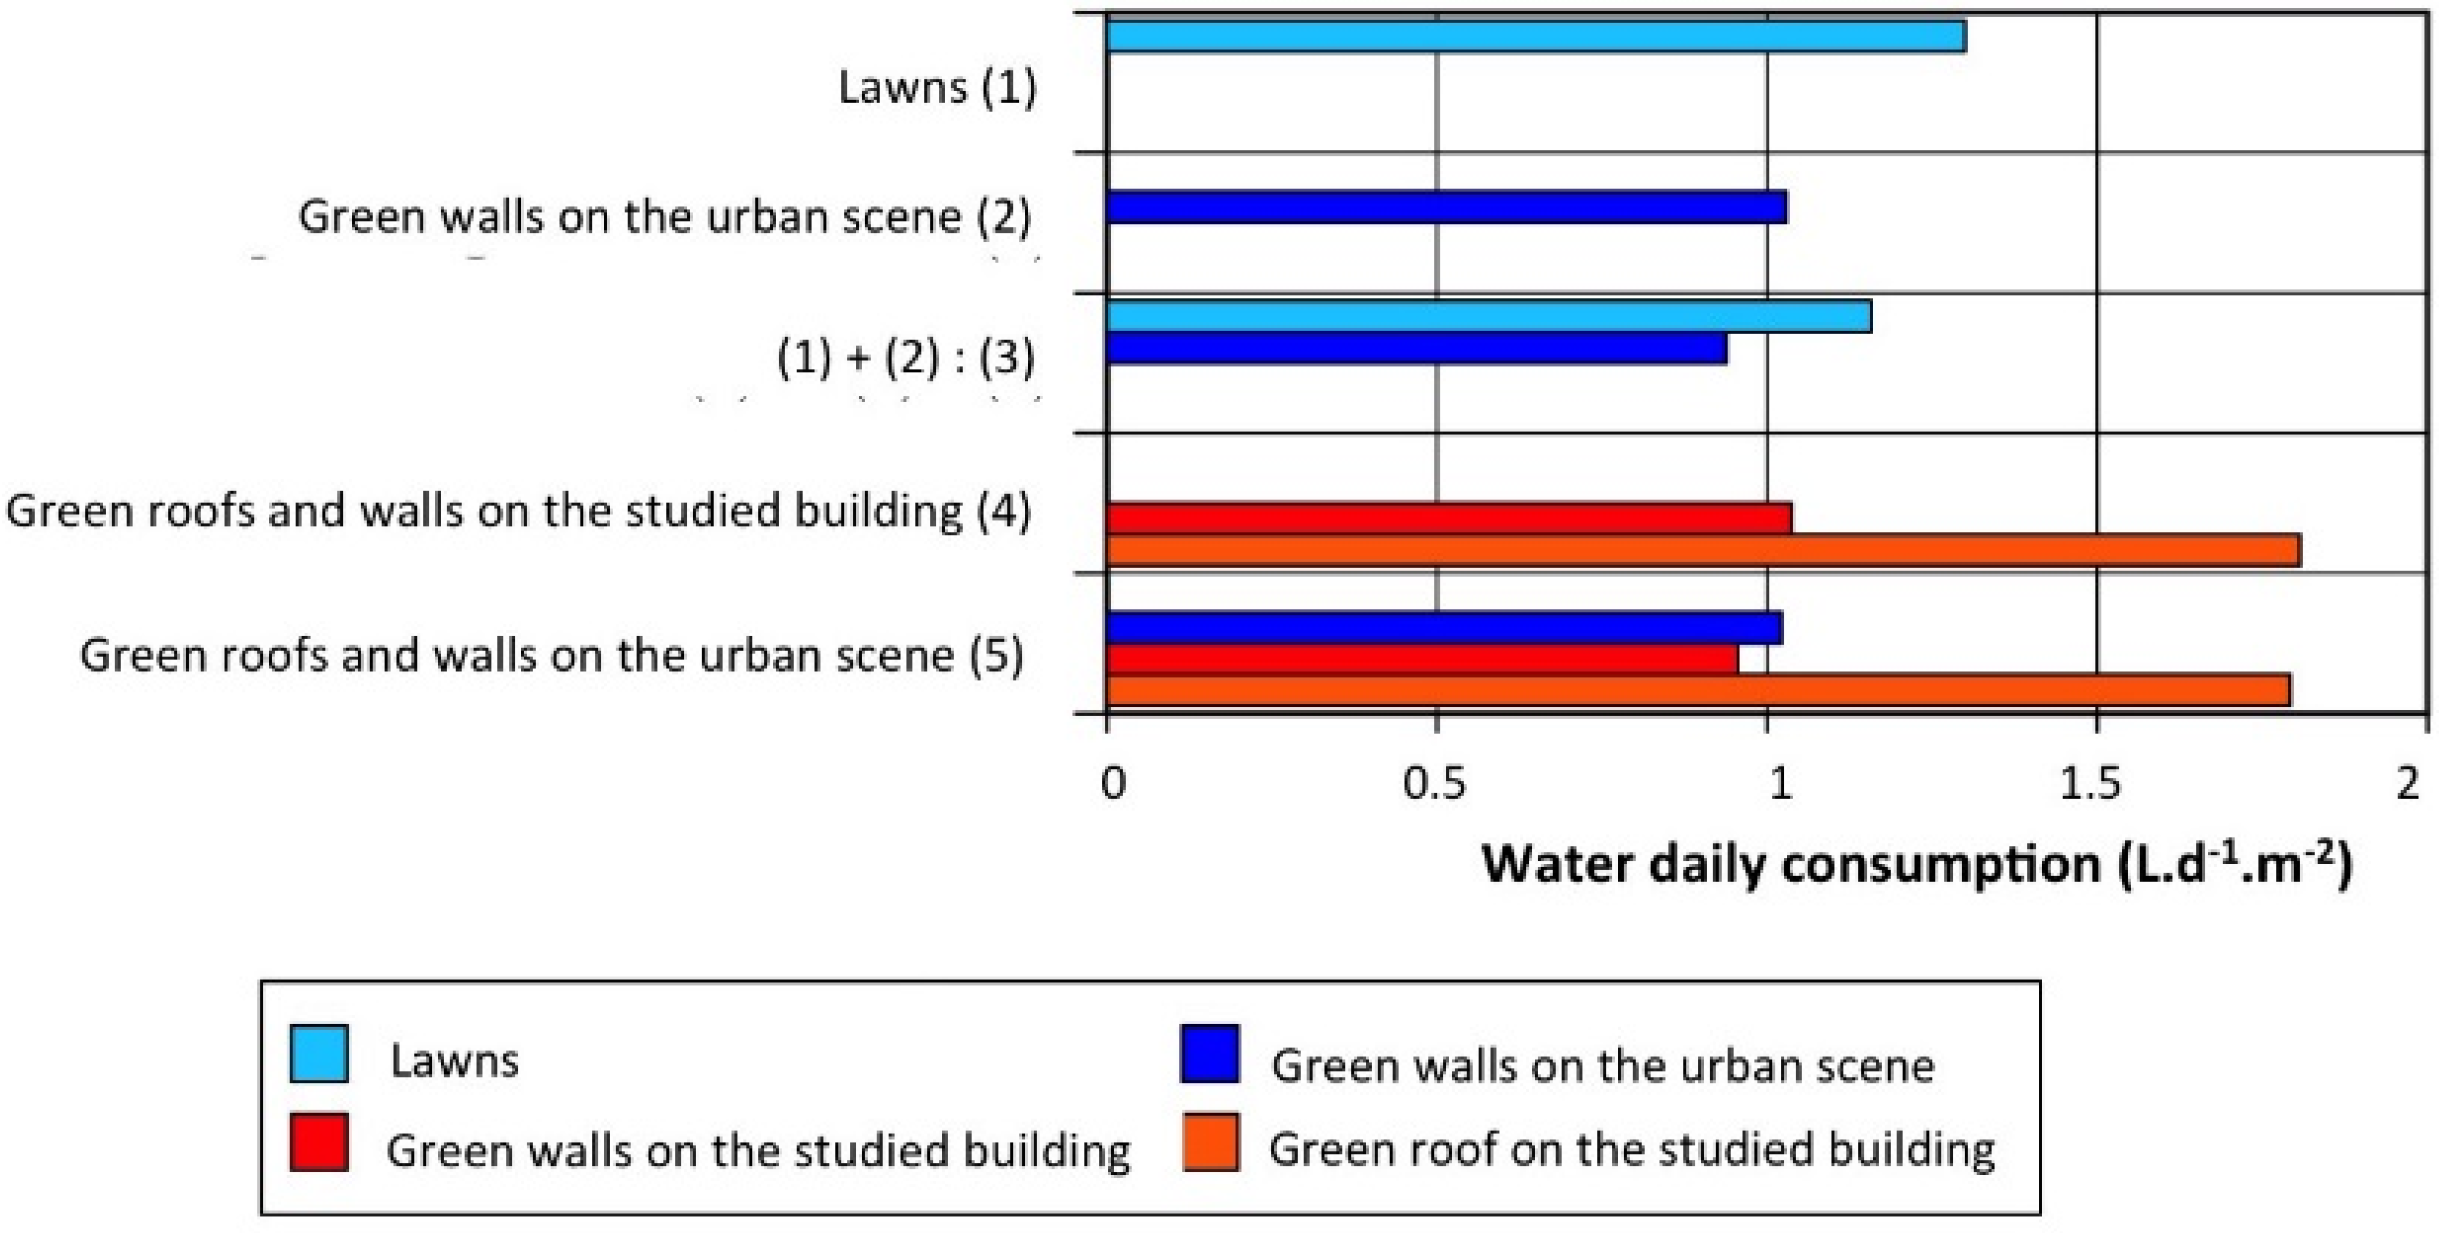
Green facades and green roofs represent passive solutions for cooling buildings. Both however require water not only to keep the plants alive, but also to obtain a satisfactory cooling effect [9]. When comparing the irrigation rate used in the samples by Malys et al. [25], which equaled 6 L·d−1·m−2, to what would be necessary to irrigate the entire Dunant building surface and to its number of inhabitants, a daily need of 53 L·d−1 per inhabitant is derived. This figure corresponds to over one-third of France’s mean daily per capita water consumption. Fortunately, the simulated consumption levels are lower (Figure 10), due to the fact that conditions in the vicinity of the simulated green facades differ from those of the samples. More specifically, the samples were facing south, whereas according to the district simulations, they received varying levels of sun exposure. Similarly, the samples were recorded on a rooftop exposed to high wind speeds, while in our case, wind speeds were lower. The mean water consumption values obtained were in the range of 1 L·d−1.
Figure 10. Mean daily water consumption of the various surfaces (in L·d−1·m−2).
Energies 09 00032 g010
The impact of solar heat fluxes on water consumption is depicted in Figure 10, with the surface requiring the largest quantity of water being the roofs. The second biggest consumer is the ground, whose insolation is attenuated by the buildings’ shading effect. Facades need less water.
Let us also remark on the indirect effect of green surfaces on the quantity of evaporated water:
The addition of water consumption in Cases (1) and (2) (Figure 10) is 10% higher than in Case (3), which is accounted for in the implementation. The greater presence of green surfaces leads to a local increase in relative humidity and a decrease in air temperature, which in turn raises the evaporating power of air in the district. The decrease in LW radiation fluxes is another influential phenomenon.
These water needs have been compared to precipitation data. Table 2 presents the evaporated water quantities during a typical day, as correlated with the given ground coverage. As regards the facades, the reference area was set as the building roof area. The precipitation ratio is defined as the volume of evaporated water to that of the rainwater potentially stored on the reference. In Nantes, the mean June monthly precipitation equals approximate 46 mm, or 1.5 mm a day.
Table 2. Quantities of water evaporated by the various surfaces relative to both their ground coverage and precipitation.
ConfigurationTotal Quantity (L)Footprint (m2)Total Height of Evaporated Water (mm·m−2)Evaporation Ratio (%)
Green walls on the studied building25949542.72177
Green roof on the studied building17239541.80118
Green walls and roof on the studied building43179544.53195
Green walls in the urban environment18,52780122.31151
Lawns15,56813,4441.1675
Total38,41223,3501.65107
The water needs of the green roof and facades of the studied building correspond to nearly twice the mean daily rainwater falling on the roof in June. The facades require two-thirds of this water amount.
As for the lawns, the precipitation ratio exceeds one.
This approach is too simplistic to adequately address the hydrological stresses of the surfaces and to mitigate their evaporation rates, which would require a dynamic water balance and include an irrigation system in the vertical wall facade.
This crude analysis does however make it possible to highlight that evaporative cooling has a water consumption effect and that implementing green strategies must be considered in paying special attention to water availability, as this will also become a challenge relative to climate change.
This approach has also demonstrated that the opportunity to implement green facades must take into account the wall orientation, as it influences water needs.

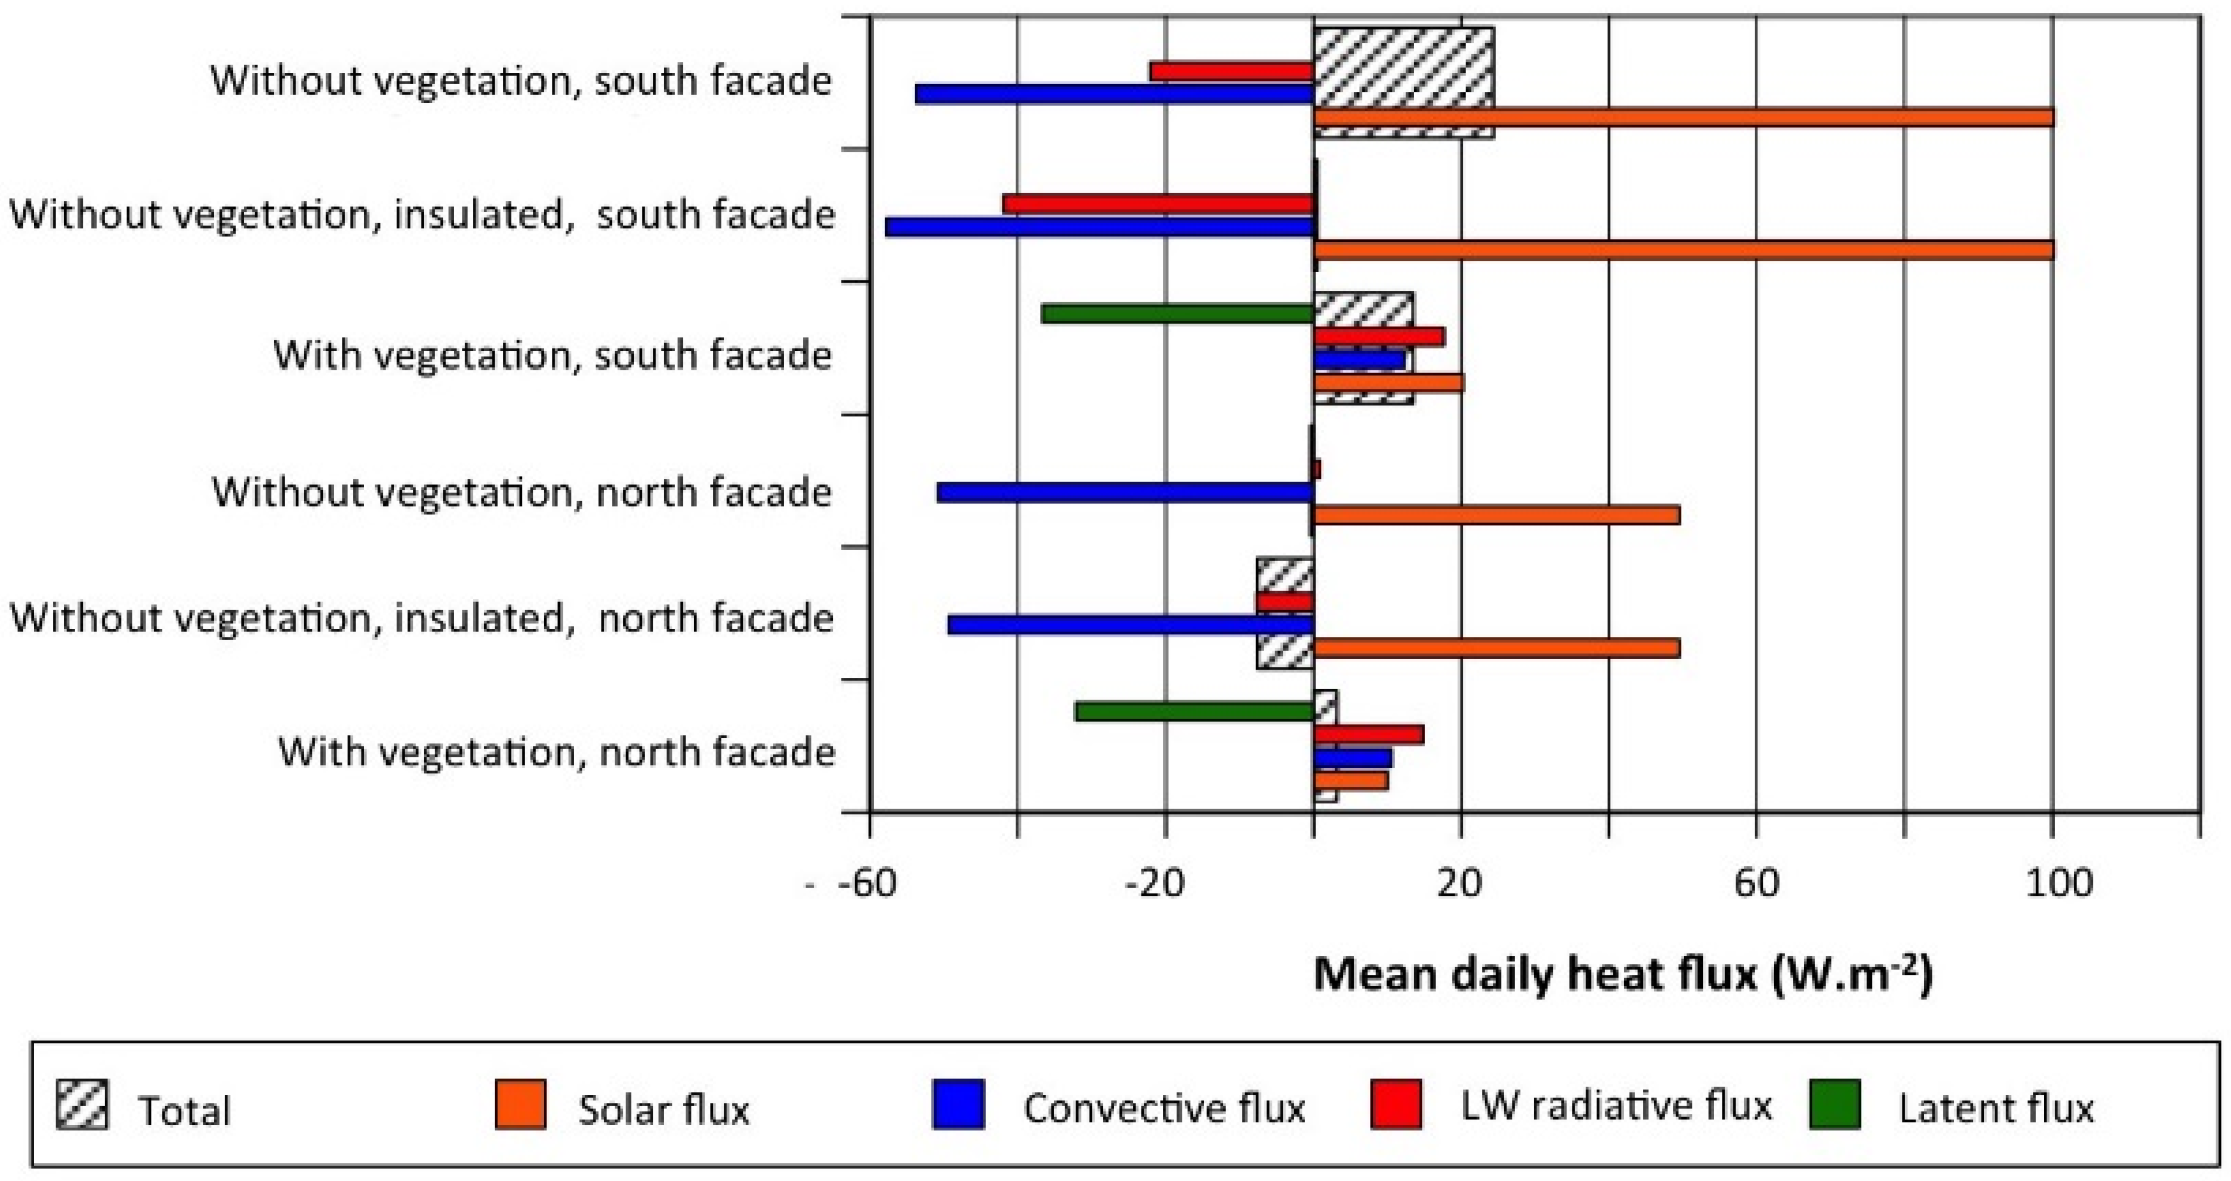
4.3. Perspective 3: Direct Effect of Green Envelopes

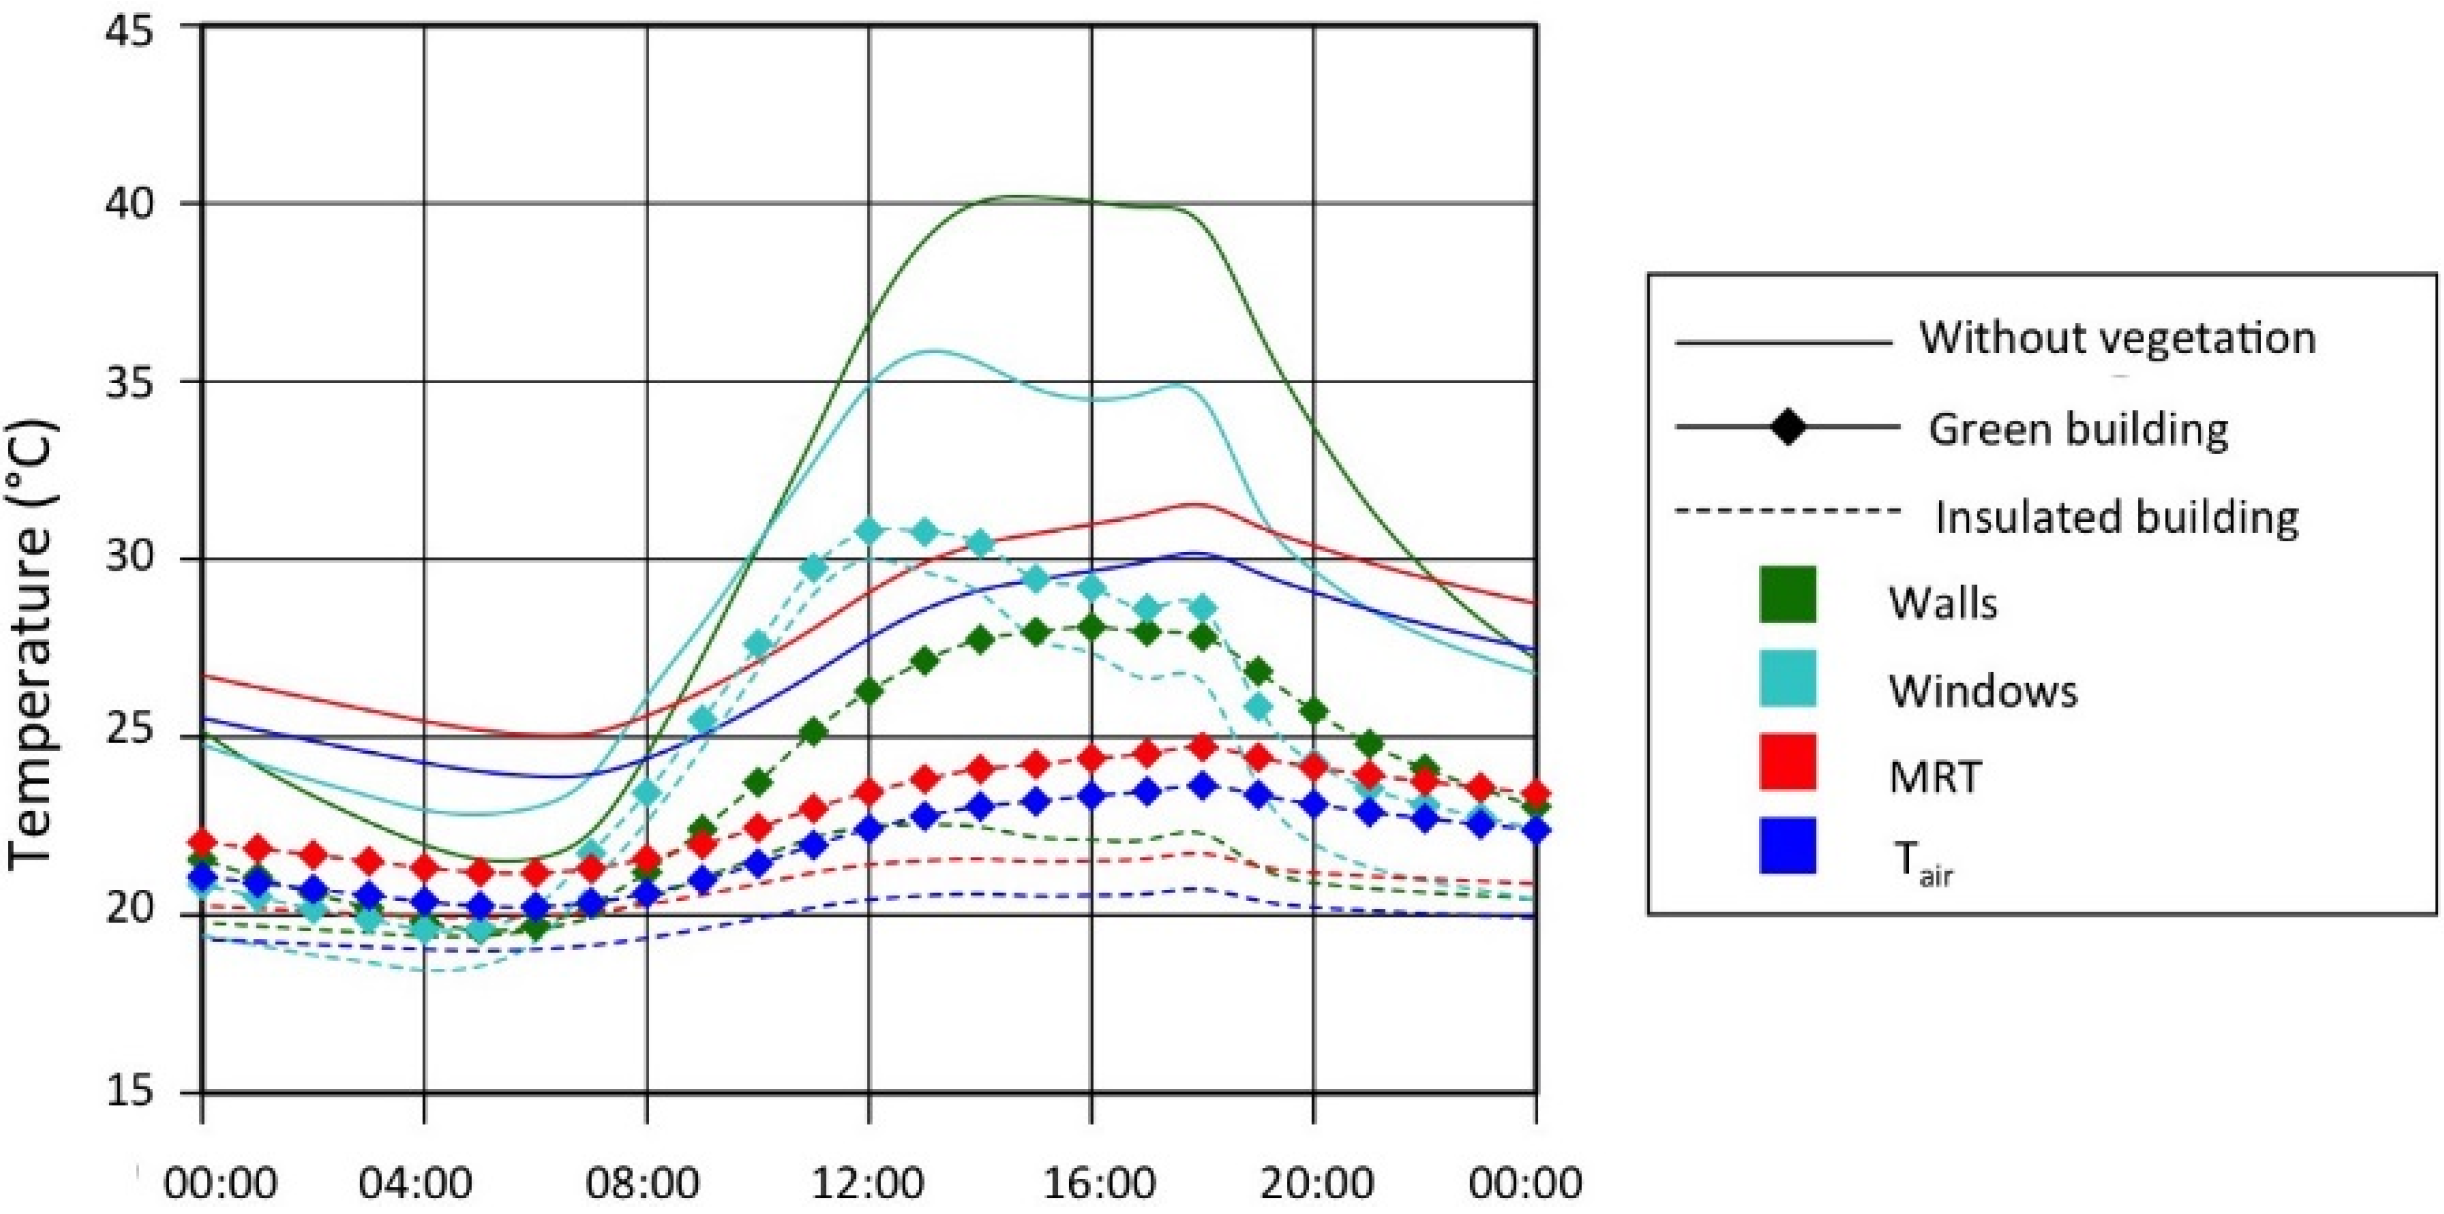
4.3.1. Variation of Temperature Inside the Building

Our thermal model has yielded the temporal variations of both internal surface temperatures and indoor air temperature. The mean radiant temperature (MRT) can be calculated on each floor, along with the various heat fluxes between indoors and outdoors or between two contiguous floors.
Temporal variations in the internal surface temperature of windows and walls, in MRT and in indoor air temperature, are all given in Figure 11 for three simulation cases, namely:
-
building without any vegetation;
-
building with a green roof and green facades;
-
an insulated building without vegetation.
Figure 11. Internal surface temperature of windows and walls, mean radiant temperature (MRT) and indoor air temperature (Tair) of the third floor on 26 June 2010.
Energies 09 00032 g011
It can be observed that the internal surface temperature is high in the absence of any greening or insulation, allowing it to reach 40 °C, thus providing a sense of the extent of heat transmission by conduction. This finding can be explained by the low albedo values (0.25) and thermal resistance of the walls. The maximum internal surface temperature of the windows is lower because less solar flux is being absorbed by these surfaces. The variation in amplitude of MRT and Tair is smaller, and the difference between these two variables remains constant at around 1 °C. The green wall effect is especially noticeable on the internal surface temperature of walls, which can be as much as 12 °C lower than in the case without a green wall. The impact of insulation however is greater, with the decrease capable of reaching 25 °C. With insulation, the amplitude of variation is reduced to 3 °C.

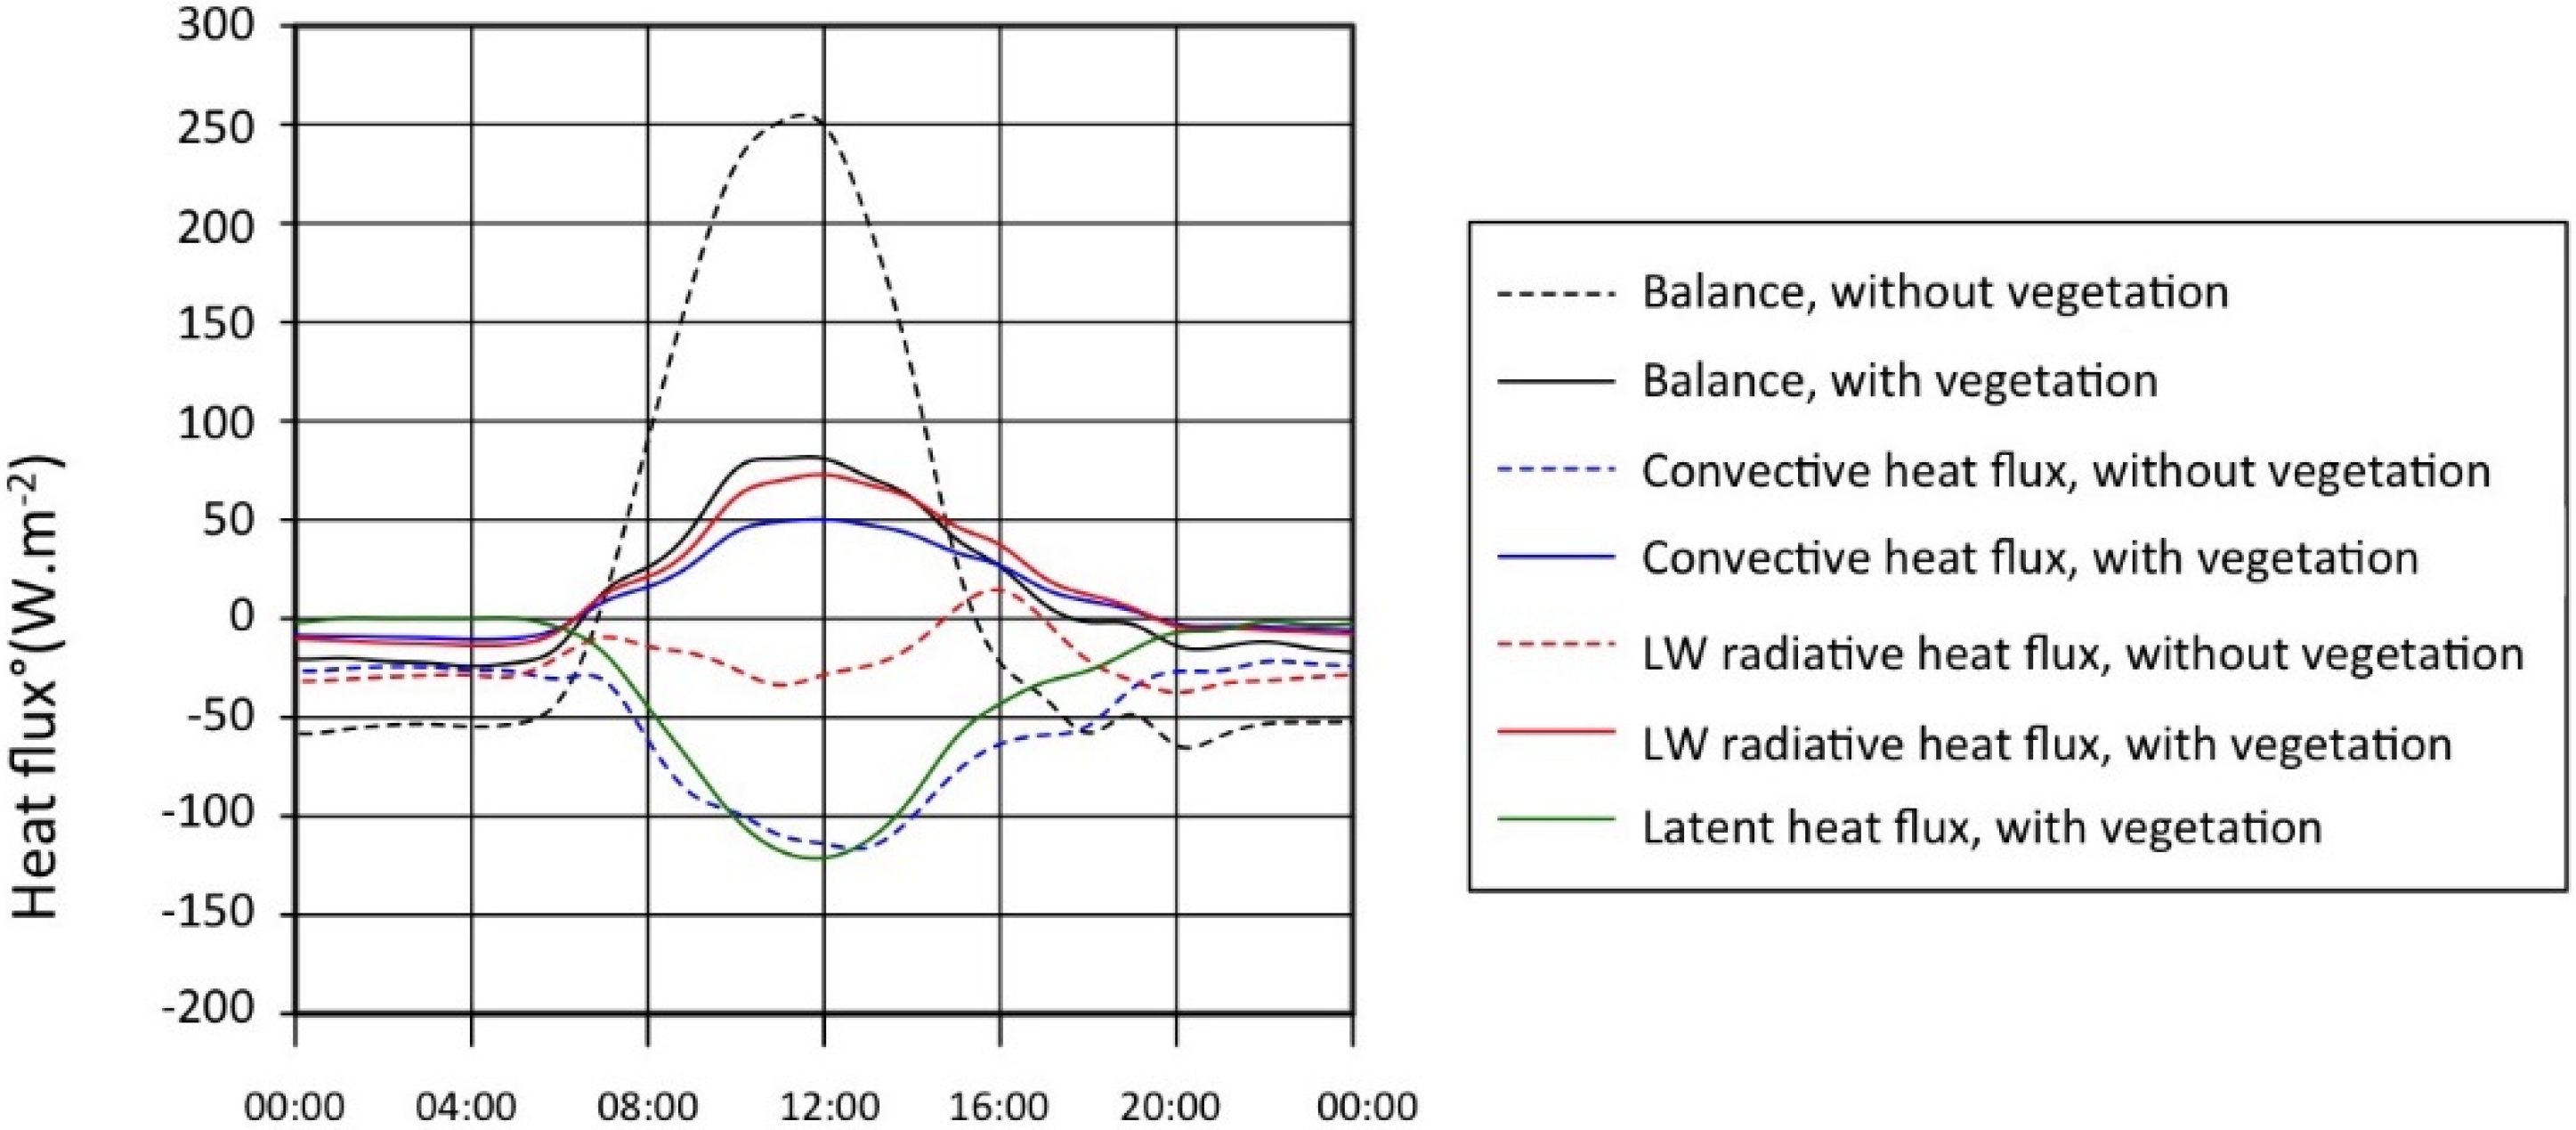
4.3.2. Thermal Fluxes at the External Building Surface

Figure 12 indicates the temporal variation of heat fluxes at the external surface of the south-facing wall, on the third floor. The heat fluxes are positive when entering the building. The solar flux, while not shown here, is much greater than the other fluxes and reaches a maximum of 400 W·m−2 for the facade directly facing the Sun’s rays. This flux is reduced by a factor of 0.2 when vegetation is added to the surface, thus declining to 80 W·m−2. This decrease is taken into account when plotting the balance curves that represent the thermal flux either transmitted to the internal surface or stored in the wall:
Q Balance = Q SW + Q conv + Q LW + Q E
Figure 12. Heat fluxes on external surfaces of the south facing wall, third floor, 26 June 2010.
Energies 09 00032 g012
The difficulty of comparing these heat fluxes stems from the difference in calculation protocol depending on whether a green facade is being implemented or not. In the absence of a green wall, the convective heat flux is calculated directly between the outdoor ambient air and the external wall surface, while the LW radiative flux is between the surfaces and the sky. When a facade is present, the convective flux is calculated between the wall surface and the air confined in the foliage layer, with the LW radiative flux between the wall and the foliage cover. The latent heat flux must also be considered, along with the SW transmission coefficient of the foliage cover.
Let us note that the thermal behavior of the external wall surface differs. Without vegetation, the convective and LW radiative fluxes are the main contributors to its cooling. The LW radiative flux depends on the insolation of the facing surfaces, which explains its irregular variation.
With vegetation, the confined air layer and foliage cover exhibit a higher temperature than that of the external wall surface during the day; hence, both convective and LW radiative exchanges are positive.
The variation in these fluxes seems to be mainly due to incoming SW radiation. The nocturnal cooling is then reduced. Figure 12 clearly highlights the importance of the effect due to solar mask and evaporation at the substrate surface.
Lastly, the maximum flux transmitted to the indoor air or stored in the wall is reduced by two-thirds when a green wall has been implemented.
Figure 13 displays the mean daily heat fluxes calculated for two facades, one facing south, the other north, at the external surface of the building wall, both with and without a green wall. For the sake of comparison, the fluxes calculated for the non-insulated and mineral case are also given.
Figure 13. Mean daily heat fluxes on the external walls of the third floor, on 26 June 2010.
Energies 09 00032 g013
Averaged over the day, the thermal fluxes transmitted through the wall and stored in it are reduced by 50% for the south-facing facade due to greening. For the north-facing facade, the effect is reversed: without vegetation, the thermal balance is negative, i.e., this facade contributes to cooling the building, but with vegetation, it is slightly positive. This finding is consistent with previously-observed trends: the large decrease in incoming solar flux and evaporation flux limits the contribution of the surface to the heating of indoor air.
In the case of an insulated building, the high thermal resistance of the walls leads to an increase in the external surface temperature of the walls and subsequently increases the convective and LW heat fluxes, which contribute more to microclimate heating and exert a negative impact on the surrounding buildings.
It is difficult to establish this kind of reasoning with regard to green walls, since the fluxes at the external surface are not directly exchanged with the outdoor air, but instead remain within the confined air layer. These effects are indirect and will be studied in Perspective 4 below.

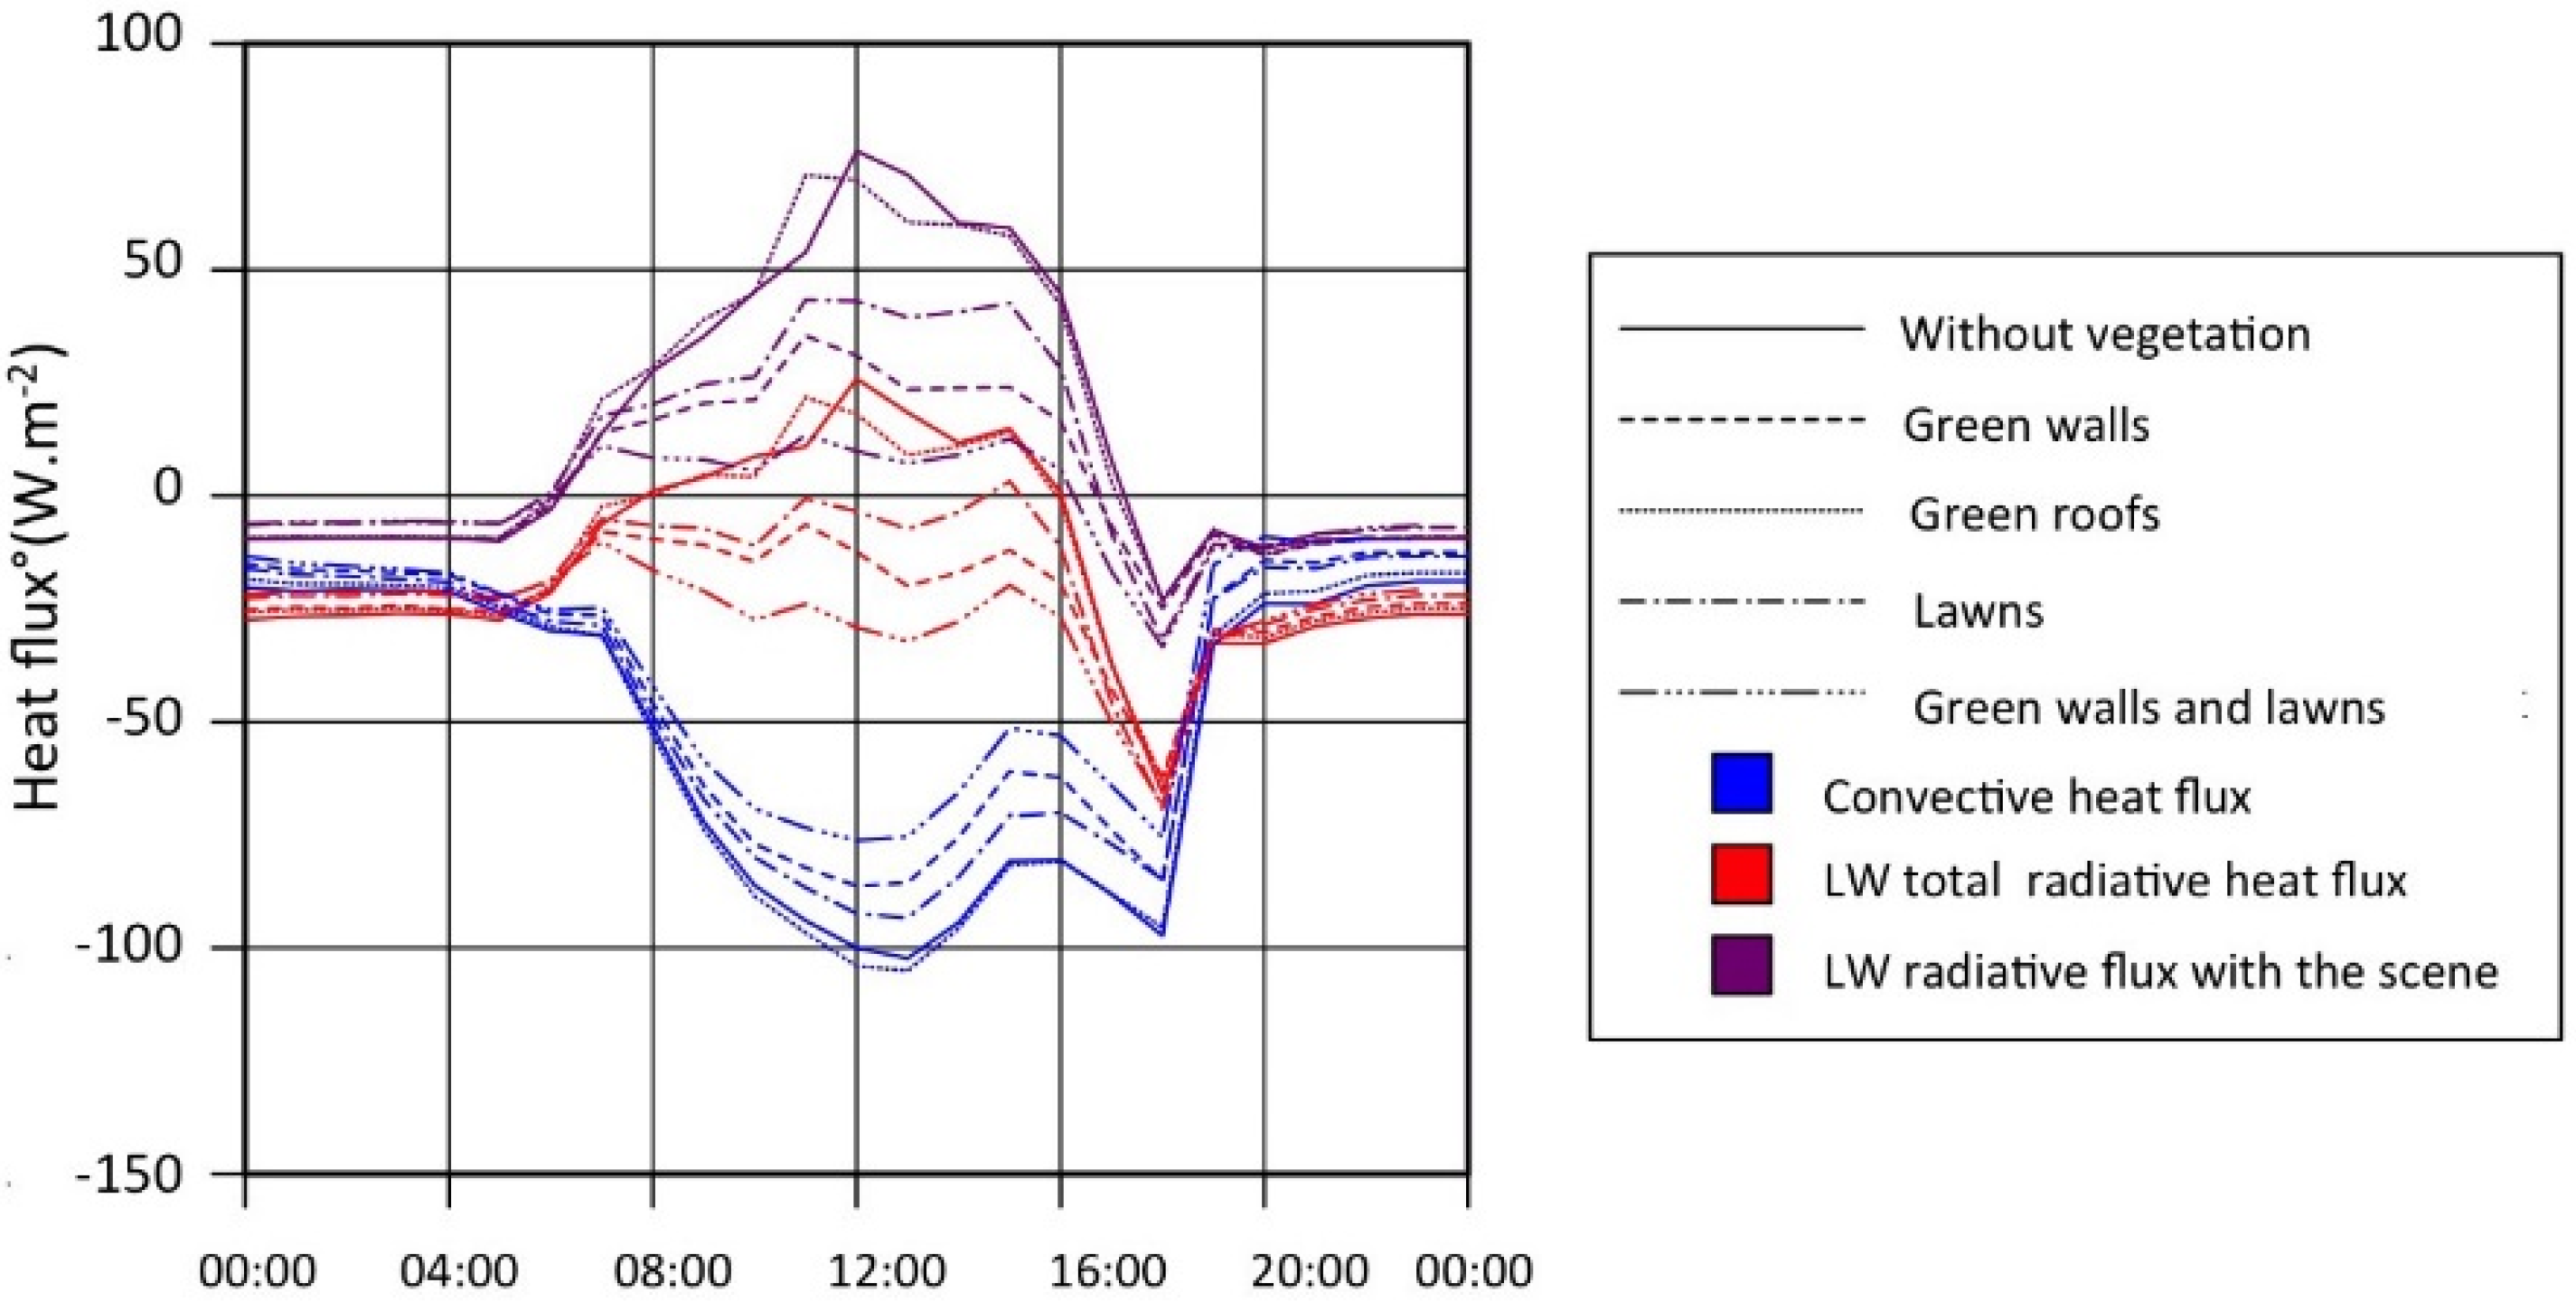
4.4. Perspective 4: Indirect Effects of Vegetation

The visibility of green roofs from the urban space is very limited. One can therefore presume that their effect on the thermal comfort of residents in the street is also limited, as is their impact on the thermal behavior of surrounding buildings. It has been shown however that green roofs can have a major impact on the thermal behavior of the buildings where they have been installed, as well as on the urban microclimate. In considering the high level of roof insolation during the summer, the direct impact of green roofs is an obvious one. For this same reason, plus the fact that roofs occupy a large proportion of a dense urban surface, it can be anticipated that the effect of these surfaces, if greened, on the urban climate would also be strong. However, at the smaller scale of the urban block or street, on which green facades and ground vegetation is considered to be more efficient, further examination is still required. Studying the indirect effect of a green surface should help to answer the following questions:
-
To what extent do green roofs modify air temperature in the district and affect the thermal behavior of surrounding buildings?
-
What are the impacts of lawns and green walls on the thermal behavior of surrounding buildings?
-
Are the direct and indirect effects of these techniques comparable? In particular, what is the predominant effect: convective or radiative?
To better answer these questions, the following configurations have been compared:
-
the reference case, without vegetation (0);
-
a green roof on the studied building (2);
-
lawns on the uncovered ground (6);
-
lawns and green facades on the studied building and surrounding buildings, (7) + (3).
Simulation results have been analyzed in considering both the impact on indoor thermal comfort and the modification of radiative and convective heat fluxes.

4.4.1. Indoor Thermal Comfort

The temporal variations in indoor temperatures on the third floor for the various configurations are given in Figure 14. Three distinct effects can be distinguished:
-
The effect of green roofs is practically negligible;
-
The effect of lawns and green walls leads to a decrease in indoor temperature, ranging from 1 °C to 2 °C. This difference slowly varied during the week, with some differences appearing between the configurations after 28 June.
The temperature decrease is maximized with both green walls and lawns, reaching 3 °C on the afternoon of 26 June.
Figure 14. Indoor temperatures on the third floor for various greening configurations.
Energies 09 00032 g014
The three previous impact levels are once again observed, as applied to the distribution of thermal comfort categories (Figure 15). The effect of green walls is still imperceptible. Lawns and green walls together lead to a 50% decrease in the number of hours of discomfort and serve to eliminate the occurrence of Category +IV. A possible cold discomfort appears, which corresponds to night periods.
Figure 15. (a) Distribution of occurrences among thermal comfort categories for the third floor; and (b) relative decrease in the occurrences of hot categories compared to the reference case.
Energies 09 00032 g015
Covering all surfaces visible from the studied building with vegetation makes it possible to nearly eliminate all periods of discomfort.

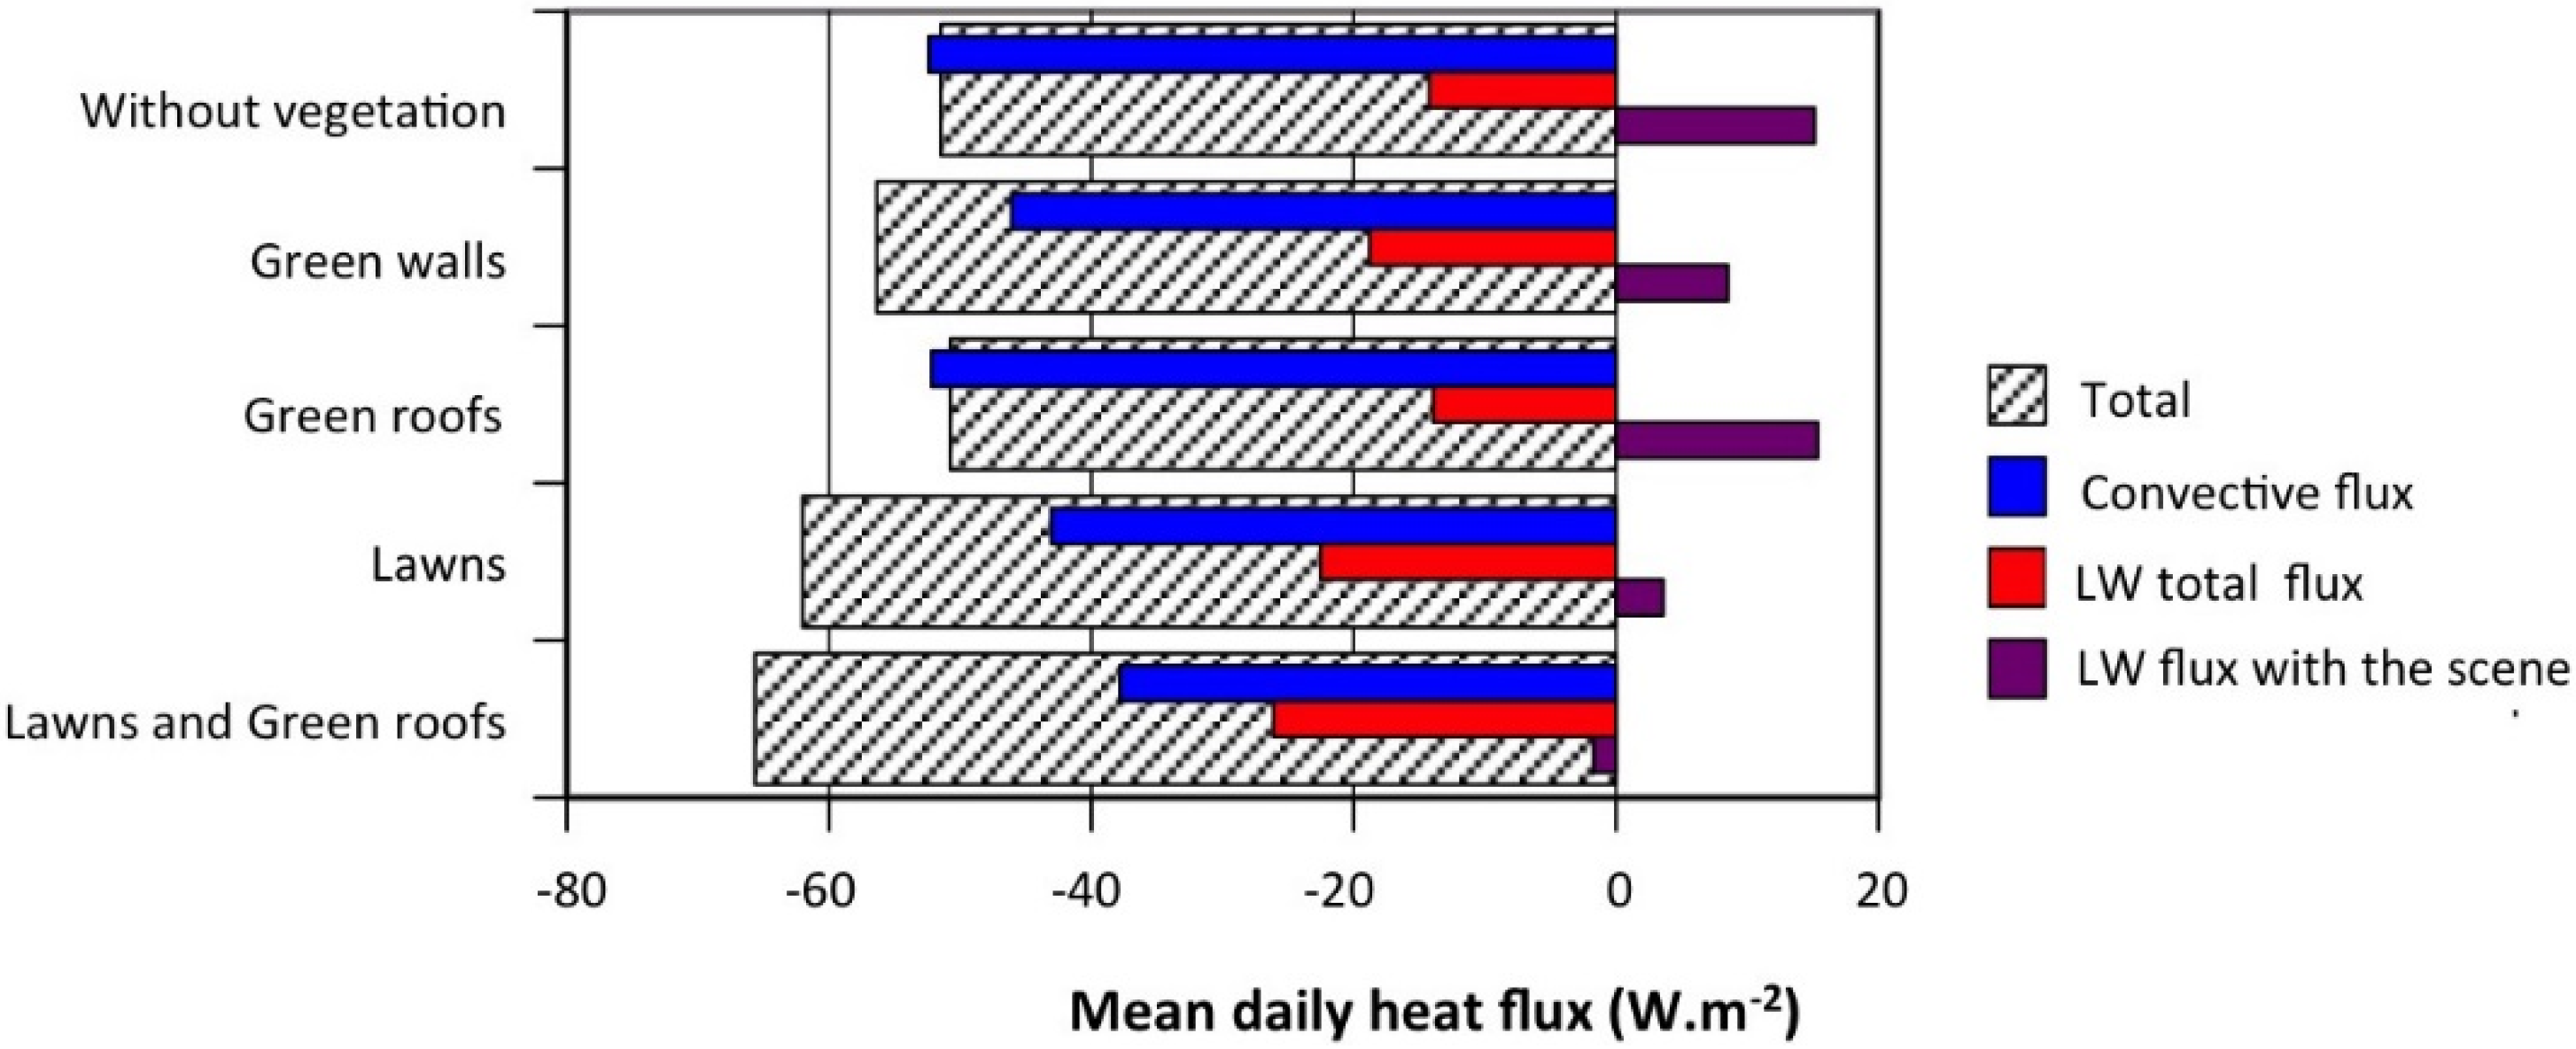
4.4.2. Convective and Radiative Heat Fluxes

When analyzing the thermal balance at the external wall surface, it becomes clear how the various fluxes act upon both the thermal behavior of the studied building and the urban microclimate. The temporal variations of mean flux values (as calculated over the entire external surface of the third floor) on 26 July are shown in Figure 16 for the studied cases, using the same conventions as before.
Figure 16. Mean values of convective and radiative heat fluxes over the entire third floor external surface. LW, long wave.
Energies 09 00032 g016
The net radiative LW flux exchange with the other urban surfaces is also provided so as to better highlight the contribution of these specific surfaces. The differences between total LW radiative flux and this latter value yield the exchanges with the sky.
Regardless of the configuration, a change in the fluxes can be noticed every day around 5:00 pm: the LW radiative flux becomes negative, as does the absolute value of the convective heat flux (Figure 16). This outcome is certainly due to the fact that at this moment in time, sun rays are reaching the north facade.
The convective heat flux is the main negative flux (cooling the facades) not only during the day, but at night, as well. LW radiation with the other surfaces makes a slight contribution to cooling the building, yet the effect on indoor comfort is negative overall due to strong contributions during the day. This radiation is partially offset by the LW exchanges with the sky, though the net LW balance remains positive over the course of the day (Figure 17).
Figure 17. Convective and long-wave (LW) radiative heat fluxes at the external third floor surface, cumulated throughout the day.
Energies 09 00032 g017
Except in the case of green roofs, the effect of green surfaces on heat fluxes is significant. The positive effect of LW radiation is reinforced, ranging from 17 W·m−2 to 25 W·m−2. With green facades or lawns, the net LW fluxes are almost always negative (Figure 16 and Figure 17). When implementing green surfaces on all buildings and on the ground, the net LW flux with the environment is negative. The impact of ground vegetation is most significant with respect to the LW radiative flux, as the result of a higher view factor (compared to facade intervisibility) and of the fact that the ground is more exposed to sun rays.
Implementing vegetation on the surfaces leads to an overall decrease in convective heat fluxes, due at first to the decrease in surface temperature and, then, to the temperature differential with the air.

5. Discussion and Conclusions

The various configurations studied herein have demonstrated that introducing vegetation on buildings and on the ground has a positive summer effect on comfort in a non-insulated building, when considering the temperate climate of the city of Nantes. We decomposed the effect of the multiple heat fluxes in order to show how vegetation acts. It has been revealed that the direct effect resulting from the shading of leaves is predominant. The surface temperature of a green surface, due to its evaporation capacity, is much less than that of a mineral surface. This effect has contributed to improving the building’s thermal conditions in the summer and reducing LW radiative fluxes between surfaces in a district, which also exerts a significant impact on a building’s energy balance.
The results obtained for a non-insulated building were not applicable to an insulated one. They can however be of great interest when considering the proportion of buildings that are impossible to refurbish for structural or other reasons. It has been shown that for such buildings, acting on the surroundings can lead to an improvement in the level of summer comfort.
Green roofs appear to be effective only for the upper floors of the building where they have been installed. Green facades have both direct and indirect impacts, while lawns only provide an indirect effect, which deserves to be considered in the case of a non-greened and non-insulated building.
Even though such was not the stated purpose of this paper, it can still be deduced from our calculations that green surfaces, due to their lower temperature, will also have an improvement effect on outdoor thermal comfort, as a result of their ability to decrease the LW radiative flux.
Many complementary studies could be carried out, for various insulation and glazing levels, as performed by [24], and by taking into account in greater detail the kind of plants (e.g., climbing plants, which prove to be the least expensive green facades). This additional research should be conducted for different climate conditions, as well.

Acknowledgments

This research work was carried out within the scope of the VegDUD Project, funded by the French Research Agency (ANR) under Contract No. ANR-09-VILL-0007. The authors are grateful to the Pays de la Loire Regional Council and ADEME (French Environment and Energy Management Agency) for their financial support of this study, as well as to the Laboratory Energy, Environment & architecture (LEEA) at Haute Ecole du Paysage, d'Ingénierie et d'Architecture de Genève (HEPIA) facility for providing us with experimental data.

Author Contributions

This paper is part of a Ph.D work that has been carried out by Laurent Malys and co-supervised by Marjorie Musy and Christian Inard.

Conflicts of Interest

The authors declare no conflict of interest.

References

  1. Nasir, R.A.; Ahmad, S.S.; Zain-Ahmed, A.; Ibrahim, N. Adapting Human Comfort in an Urban Area: The Role of Tree Shades Towards Urban Regeneration. Proced. Soc. Behav. Sci. 2015, 170, 369–380. [Google Scholar] [CrossRef]
  2. De Abreu-Harbich, L.V.; Labaki, L.C.; Matzarakis, A. Effect of tree planting design and tree species on human thermal comfort in the tropics. Landsc. Urban Plan. 2015, 138, 99–109. [Google Scholar] [CrossRef]
  3. Hong, B.; Lin, B. Numerical studies of the outdoor wind environment and thermal comfort at pedestrian level in housing blocks with different building layout patterns and trees arrangement. Renew. Energy 2015, 73, 18–27. [Google Scholar] [CrossRef]
  4. Vailshery, L.S.; Jaganmohan, M.; Nagendra, H. Effect of street trees on microclimate and air pollution in a tropical city. Urban For. Urban Green. 2013, 12, 408–415. [Google Scholar] [CrossRef]
  5. Shashua-Bar, L.; Tsiros, I.X.; Hoffman, M.E. A modeling study for evaluating passive cooling scenarios in urban streets with trees. Case study: Athens, Greece. Build. Environ. 2010, 45, 2798–2807. [Google Scholar] [CrossRef]
  6. Santamouris, M. Cooling the cities—A review of reflective and green roof mitigation technologies to fight heat island and improve comfort in urban environments. Sol. Energy 2014, 103, 682–703. [Google Scholar] [CrossRef]
  7. Chen, H.; Ookab, R.; Huang, H.; Tsuchiyab, T. Study on mitigation measures for outdoor thermal environment on present urban blocks in Tokyo using coupled simulation. Build. Environ. 2009, 44, 2290–2299. [Google Scholar] [CrossRef]
  8. Smith, K.; Roeber, P. Green roof mitigation potential for a proxy future climate scenario in Chicago, Illinois. J. Appl. Meteorol. Climatol. 2011, 50, 507–522. [Google Scholar] [CrossRef]
  9. De Munck, C. Modélisation de la végétation urbaine et stratégies d’adaptation pour l’amélioration du confort climatique et de la demande énergétique en ville. Ph. D. Thesis, University de Toulouse, Toulouse, France, 2013. [Google Scholar]
  10. Ascione, F.; Bianco, N.; de’ Rossi, F.; Turni, G.; Vanoli, G.P. Green roofs in European climates. Are effective solutions for the energy savings in air-conditioning? Appl. Energy 2013, 104, 845–859. [Google Scholar] [CrossRef]
  11. Susorova, I.; Angulo, M.; Bahrami, P.; Stephens, B. A model of vegetated exterior facades for evaluation of wall thermal performance. Build. Environ. 2013, 67, 1–13. [Google Scholar] [CrossRef]
  12. Gros, A. Modélisation de la demande énergétique des bâtiments à l’échelle d’un quartier. Ph.D. Thesis, University de La Rochelle, La Rochelle, France, 2013. [Google Scholar]
  13. Chen, Q.; Li, B.; Liu, X. An experimental evaluation of the living wall system in hot and humid climate. Energy Build. 2013, 61, 298–307. [Google Scholar] [CrossRef]
  14. Wong, N.H.; Tan, A.Y.K.; Tan, P.Y.; Wong, N.C. Energy simulation of vertical greenery systems. Energy Build. 2009, 41, 1401–1408. [Google Scholar] [CrossRef]
  15. Hoyano, A. Climatological uses of plants for solar control and the effects on the thermal environment of a building. Energy Build. 1988, 11, 181–199. [Google Scholar] [CrossRef]
  16. Cameron, R.W.F.; Taylor, J.E.; Emmett, M.R. What’s “cool” in the world of green facades? How plant choice influences the cooling properties of green walls. Build. Environ. 2014, 73, 198–207. [Google Scholar] [CrossRef]
  17. Alexandri, E.; Jones, P. Temperature decreases in an urban canyon due to green walls and green roofs in diverse climates. Build. Environ. 2008, 43, 480–493. [Google Scholar] [CrossRef]
  18. Djedjig, R.; Bozonnet, E.; Belarbi, R. Analysis of thermal effects of vegetated envelopes: Integration of a validated model in a building energy simulation program. Energy Build. 2015, 86, 93–103. [Google Scholar] [CrossRef]
  19. Armson, D. The Effect of Trees and Grass on the Thermal and Hydrological Performance of an Urban Area. Ph.D. Thesis, University of Manchester, Manchester, UK, 2012. [Google Scholar]
  20. Akbari, H. Shade trees reduce building energy use and CO2 emissions from power plants. Environ. Pollut. 2002, 116, S119–S126. [Google Scholar] [CrossRef]
  21. Djedjig, R. Impacts des enveloppes végétales à l’interface bâtiment microclimat urbain. Ph.D. Thesis, University de La Rochelle, La Rochelle, France, 2013. [Google Scholar]
  22. Malys, L.; Musy, M.; Inard, C. Microclimate and building energy consumption: Study of different coupling methods. Adv. Build. Energy Res. 2015, 9, 151–174. [Google Scholar] [CrossRef]
  23. Musy, M.; Malys, L.; Morille, B.; Inard, C. The use of SOLENE-microclimat model to assess adaptation strategies at the district scale. Urban Clim. 2015, 14, 213–223. [Google Scholar] [CrossRef]
  24. Morille, B.; Musy, M.; Malys, L. Preliminary study of the impact of urban greenery types on energy consumption of building at a district scale: Academic study on a canyon street in Nantes (France) weather conditions. Energy Build. 2015. [Google Scholar] [CrossRef]
  25. Malys, L.; Musy, M.; Inard, C. A hydrothermal model to assess the impact of green walls on urban microclimate and building energy consumption. Build. Environ. 2014, 73, 187–197. [Google Scholar] [CrossRef]
  26. Bouyer, J.; Inard, C.; Musy, M. Microclimatic coupling as a solution to improve building energy simulation in an urban context. Energy Build. 2011, 43, 1549–1559. [Google Scholar] [CrossRef]
  27. Bouyer, J. Modélisation et simulation des microclimats urbains—Étude de l’impact de l’aménagement urbain sur les consommations énergétiques des bâtiments. Ph.D. Thesis, Ecole Polytechnique de l’Université de Nantes, Nantes, France, 2009. [Google Scholar]
  28. Musy, M. VegDUD project: Role of vegetation in sustainable urban development. In Proceedings of the 8th International Conference on Urban Climate and 10th Symposium on the Urban Environment, Dublin, Ireland, 6–10 August 2012.
  29. Nicol, F.; Humphreys, M.A.; Roaf, S. Adaptive Thermal Comfort: Principles and Practice; Routledge: London, UK; New York, NY, USA, 2012. [Google Scholar]
  30. Nicol, J.F.; Humphreys, M.A. Adaptive thermal comfort and sustainable thermal standards for buildings. Energy Build. 2002, 34, 563–572. [Google Scholar] [CrossRef]
  31. NF-EN 15251: Critères d’ambiance intérieure pour la conception et l’évaluation de la performance énergétique des bâtiments couvrant la qualité de l’air intérieure, la thermique, l’éclairage et l’acoustique; AFNOR: La Plaine Saint-Denis, France, 2007. (In French)
  32. Mestayer, P.; Rosant, J.-M.; Rodriguez, F.; Rouaud, J.-M. The experimental campaign FluxSAP 2010: Climatological measurements over a heterogeneous urban area. Int. Assoc. Urban Clim. 2011, 40, 22–30. [Google Scholar]

