
Noise Emission of a 200 kW Vertical Axis Wind Turbine


Abstract
:
1. Introduction
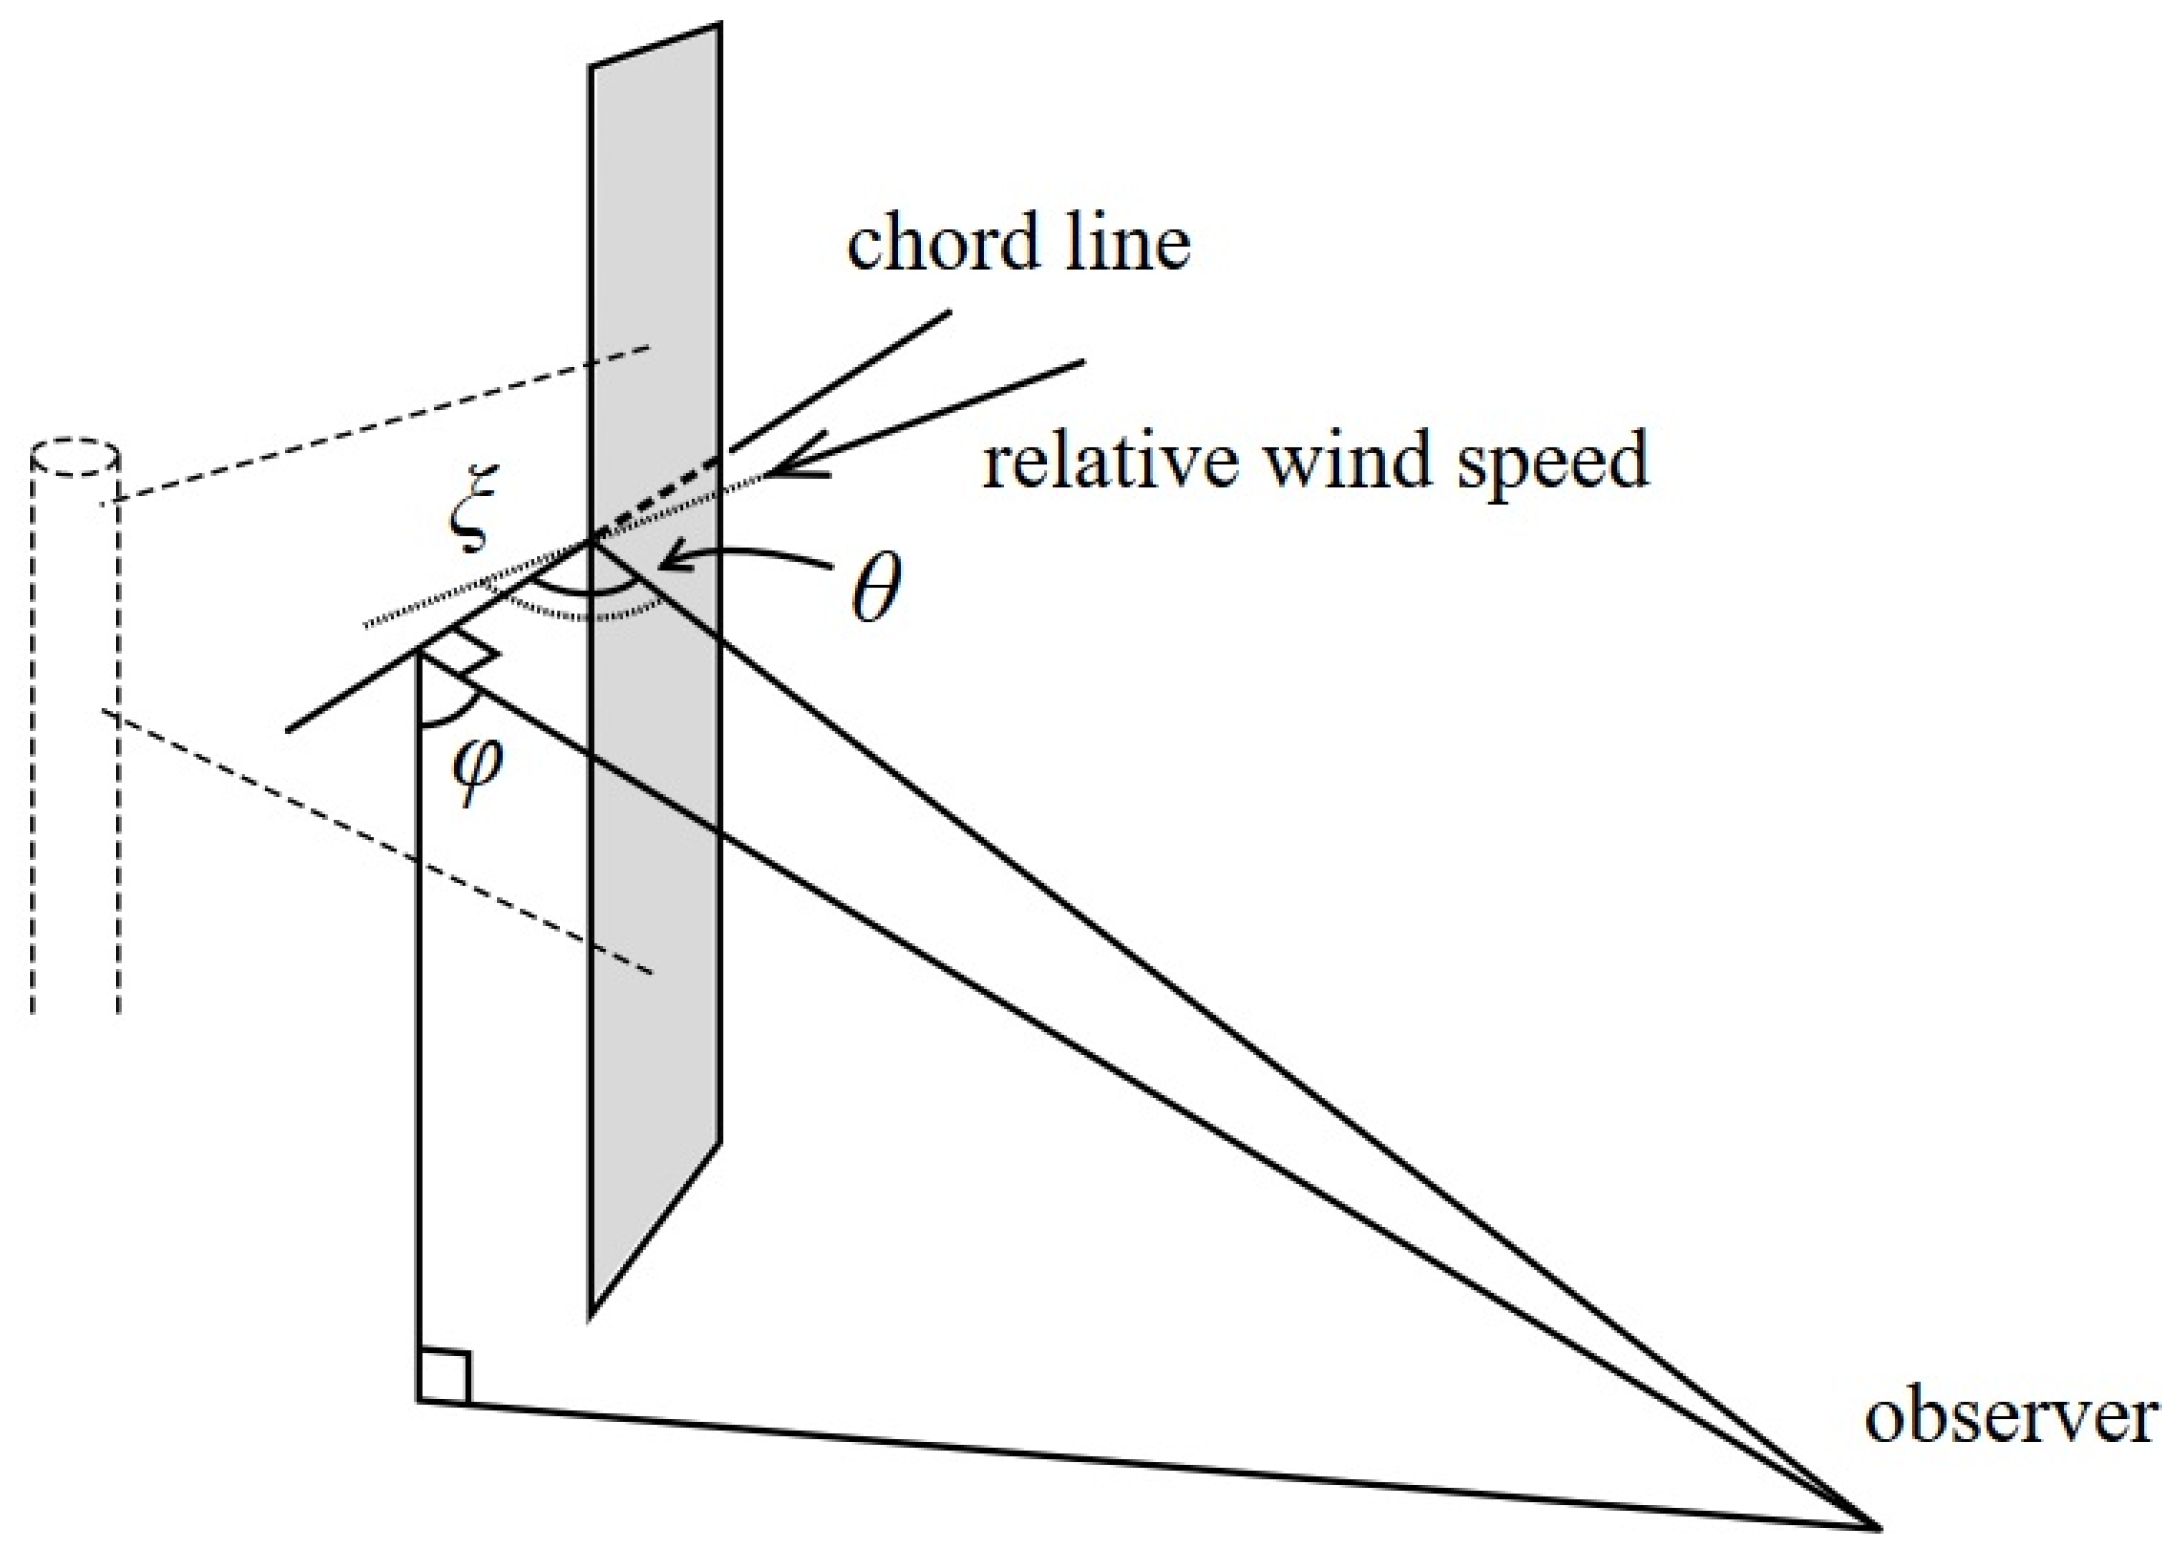
2. Theory
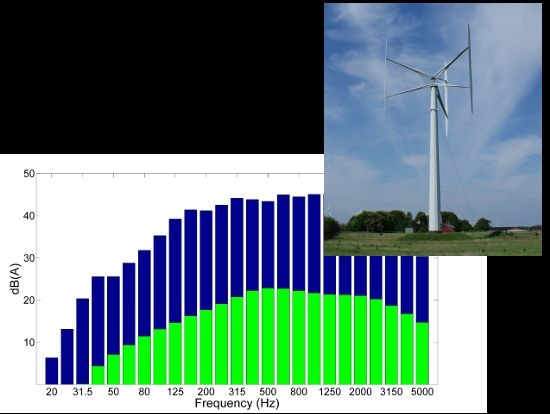
Modeling the Noise

3. Method
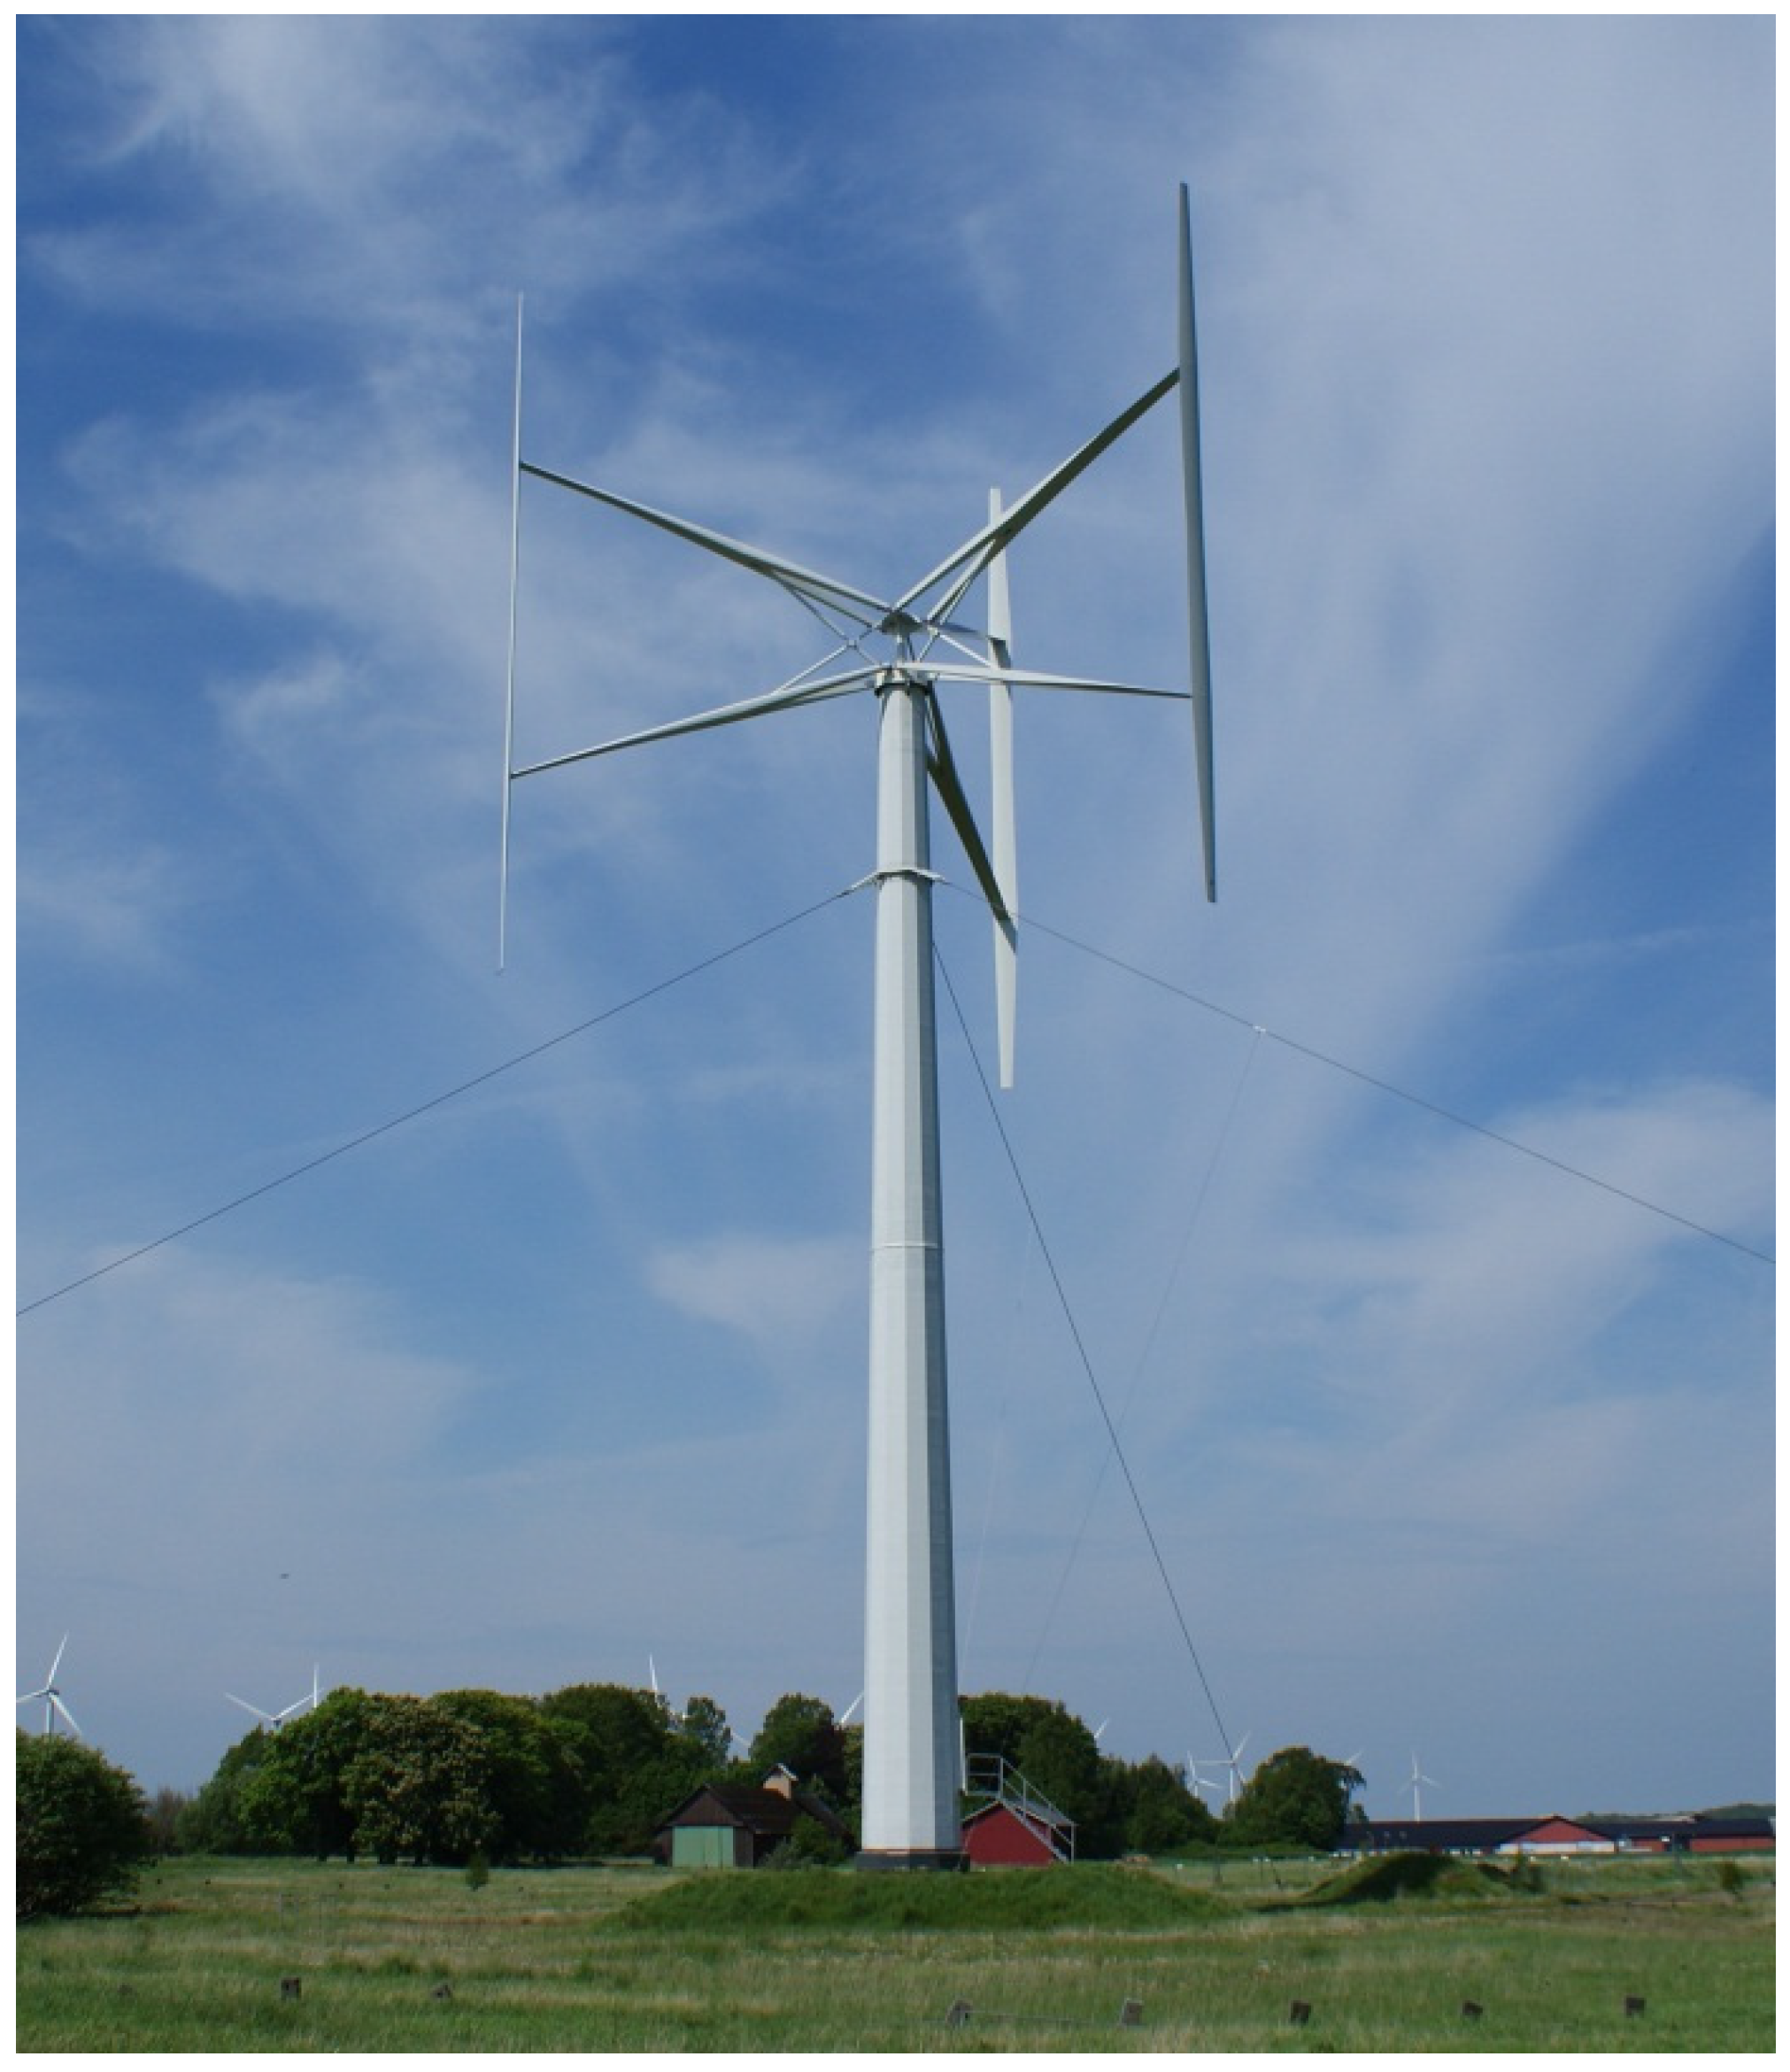
3.1. Wind Turbine System


| Category | Property | Value |
|---|---|---|
| Operation | Rated power | 200 kW |
| Rotational speed | 16–33 rpm | |
| Nominal tip speed ratio | 3.8 | |
| Cut-in wind speed | 4 m/s | |
| Rated wind speed | 12 m/s | |
| Cut-out wind speed | 25 m/s | |
| Survival wind speed | 60 m/s | |
| Power regulation | Stall | |
| Geometry | Turbine diameter | 26 m |
| Hub height (foundation included) | 40 m | |
| Blade length | 24 m | |
| Blade chord | 0.4–0.9 m | |
| Swept area | 624 m2 | |
| Material | Blade/strut material | Fiberglass composite |
| Tower material | Laminated wood |
3.2. Experimental Setup
3.3. Observations
3.4. Calculating Noise Emission from Recordings
Method of Bins and Standard Uncertainty
3.5. Measurement Limitations
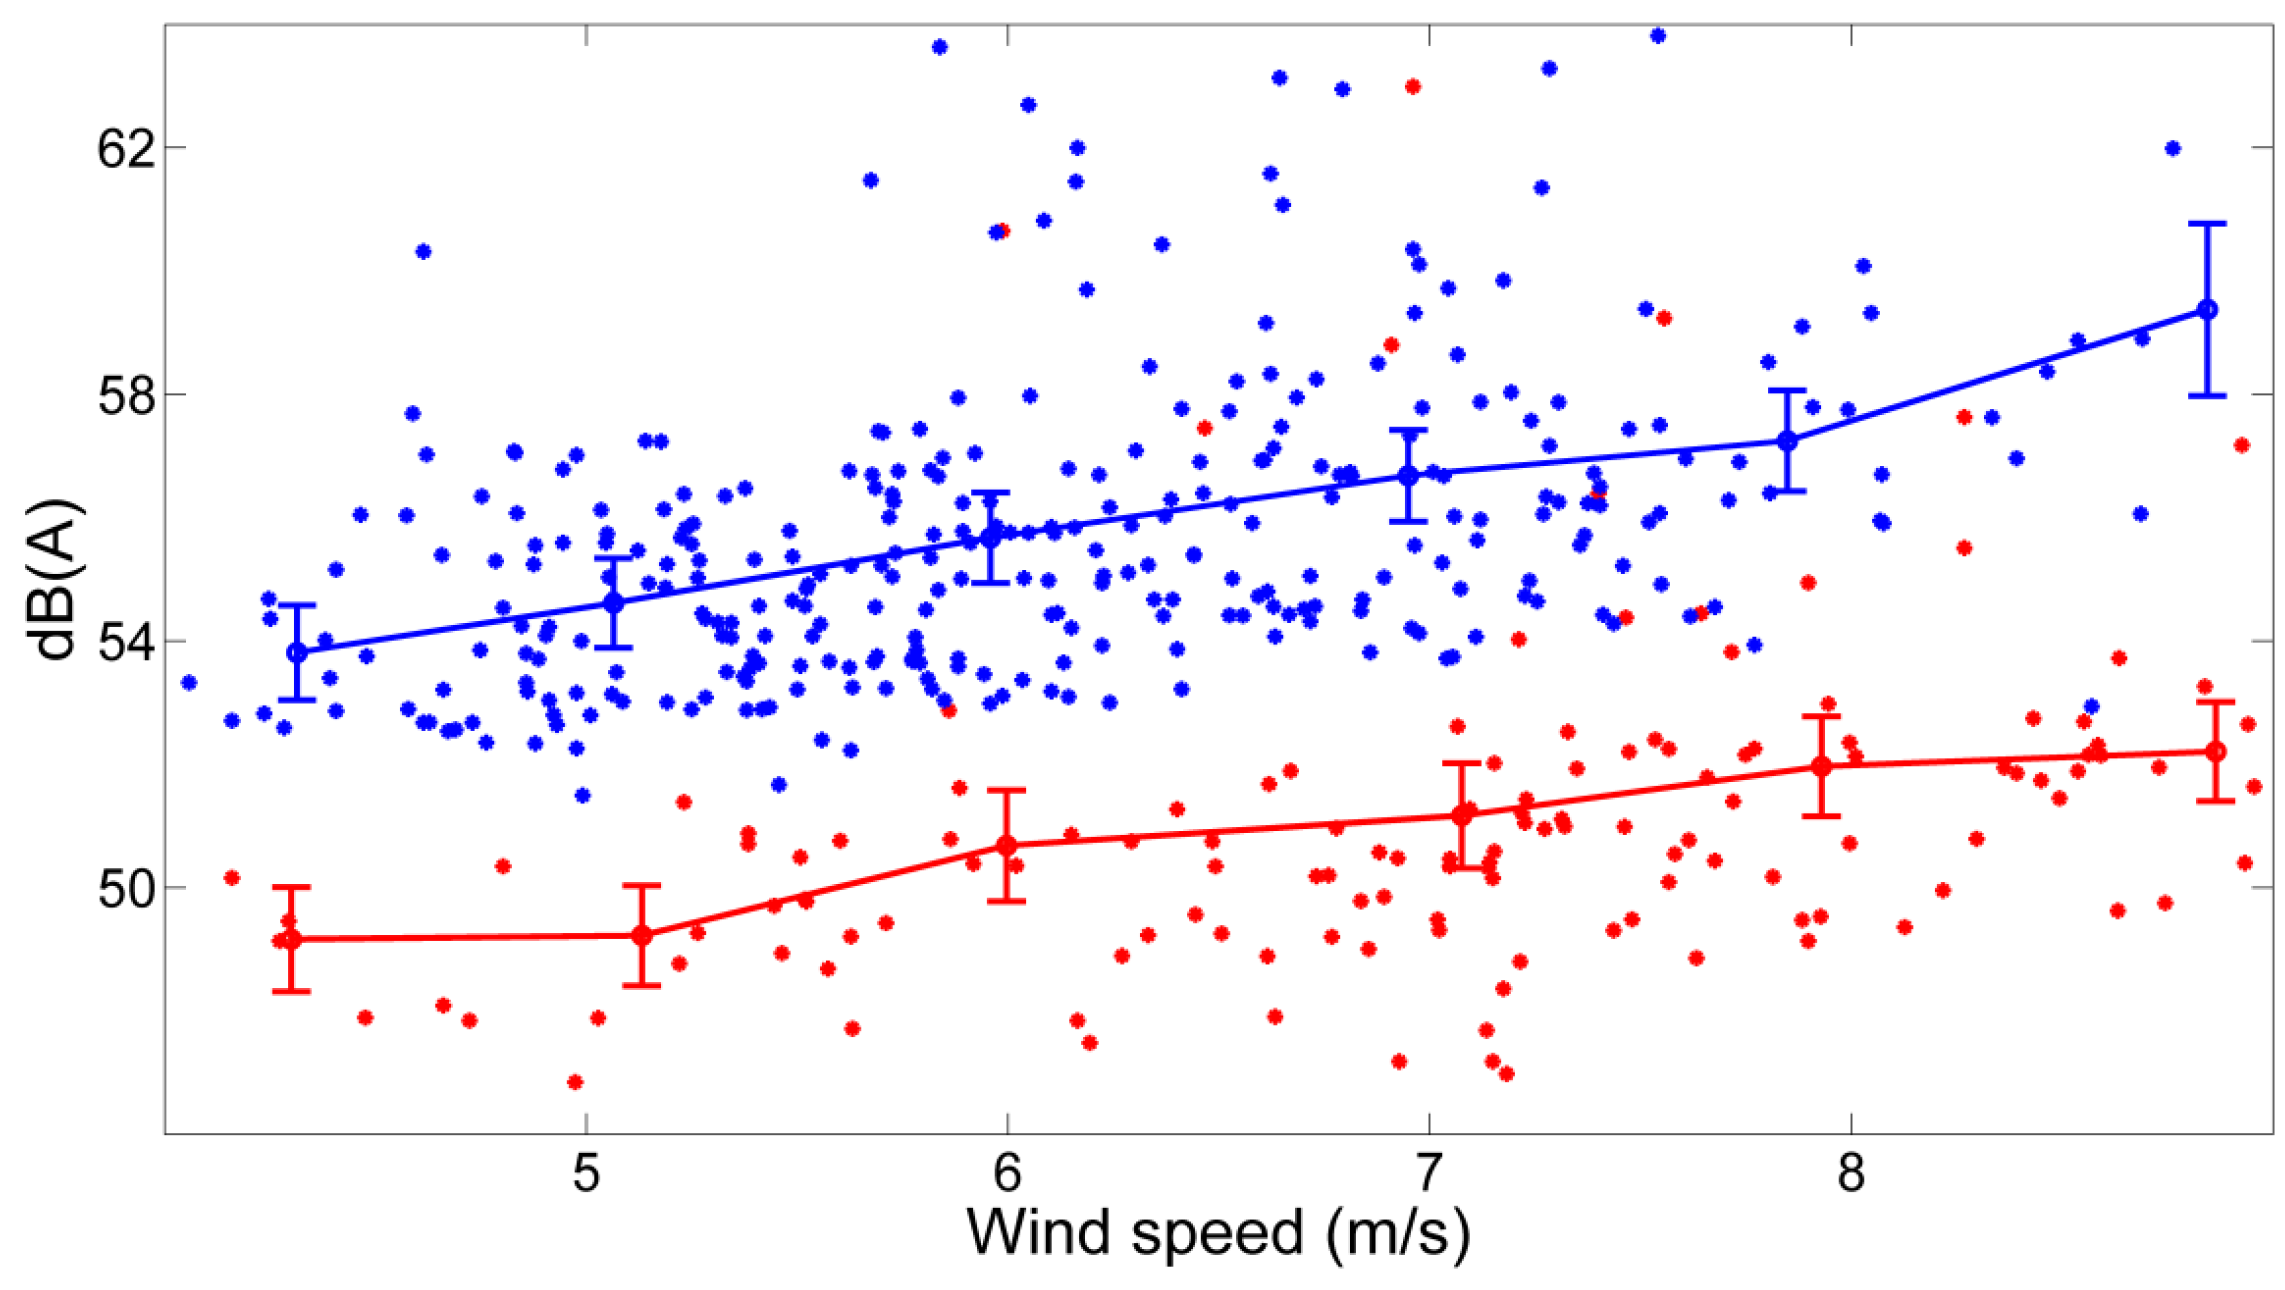
4. Results

| Wind Speed at 10 m Height | Tip Speed Ratios (TSR) | Noise Emission with Standard Uncertainty | Noise Model Calculation |
|---|---|---|---|
| m/s | - | dBA | dBA |
| 5 | 3.8 | 93.1 ± 1.0 | 69.6 |
| 6 | 3.8 | 94.1 ± 1.1 | 74.5 |
| 7 | 3.4 | 95.4 ± 1.0 | 78.6 |
| 8 | 2.9 | 96.2 ± 1.0 | 82.3 |
5. Discussion and Conclusions
| Turbine Model | Power (kW) | Rotor Diameter (m) | No. of Blades | Power Regulation | dBA at 6 m/s | dBA at 8 m/s |
|---|---|---|---|---|---|---|
| Vestas V27 | 225 | 27 | 3 | Pitch | 96.7 | 97.3 |
| GEV-MP R | 200–275 | 32 | 2 | Pitch | 100.2 | 102.4 |
| WTN250 | 250 | 30 | 3 | Stall | 95.1 | 99.8 |
| Norwin 29/225 | 225 | 29 | 3 | Stall | 95.2 | 97.5 |
Acknowledgments
Author Contributions
Conflicts of Interest
References
- Eriksson, S.; Bernhoff, H.; Leijon, M. Evaluation of different turbine concepts for wind power. Renew. Sustain. Energy Rev. 2008, 12, 1419–1434. [Google Scholar] [CrossRef]
- Ottermo, F.; Bernhoff, H. An upper size of vertical axis wind turbines. Wind Energy 2013, 17, 1623–1629. [Google Scholar] [CrossRef]
- Adolfsson, E. Riktvärden för Ljud från Vindkraft; Swedish Environmental Protection Agency: Stockholm, Sweden, 2010. (In Swedish) [Google Scholar]
- Bowdler, D.; Leventhall, H.G. Wind Turbine Noise; Multi Science Publishing Company Limited: Hockley, UK, 2011. [Google Scholar]
- Bolin, K. Wind Turbine Noise and Natural Sounds: Masking, Propagation and Modeling. Ph.D. Thesis, Royal Institute of Technology, Stockholm, Sweden, 2009. [Google Scholar]
- Pedersen, E. Human response to wind turbine noise: Perception, annoyance and moderating factors. Ph.D. Thesis, The Sahlgrenska Academy, University of Gothenburg, Gothenburg, Sweden, 2007. [Google Scholar]
- Iida, A.; Mizuno, A.; Fukudome, K. Numerical simulation of aerodynamic noise radiated from vertical axis wind turbines. In Proceedings of the 18 International Congress on Acoustics, Kyoto, Japan, 4–9 April 2004.
- Dumitrescu, H.; Cardos, V.; Dumitrache, A.; Frunzulica, F. Low-frequency noise prediction of vertical axis wind turbines. Proc. Rom. Acad. 2010, 11, 47–54. [Google Scholar]
- Pearson, C. Vertical axis wind turbine acoustics. Ph.D. Thesis, Cambridge University, Cambridge, UK, 2014. [Google Scholar]
- Barsky, D.; Posa, A.; Rahromostaqim, M.; Leftwich, M.C.; Balaras, E. Experimental and computational wake characterization of a vertical axis wind turbine. In Proceedings of the 32nd AIAA Applied Aerodynamics Conference, Atlanta, GA, USA, 16–20 June 2014.
- Elkhoury, M.; Kiwata, T.; Aoun, E. Experimental and numerical investigation of a three-dimensional vertical-axis wind turbine with variable-pitch. J. Wind Eng. Ind. Aerodyn. 2015, 139, 111–123. [Google Scholar] [CrossRef]
- Li, C.; Zhu, S.; Xu, Y.; Xiao, Y. 2.5 D large eddy simulation of vertical axis wind turbine in consideration of high angle of attack flow. Renew. Energy 2013, 51, 317–330. [Google Scholar] [CrossRef]
- Shamsoddin, S.; Porté-Agel, F. Large eddy simulation of vertical axis wind turbine wakes. Energies 2014, 7, 890–912. [Google Scholar] [CrossRef]
- Ferreira, C.J.S.; van Zuijlen, A.; Bijl, H.; van Bussel, G.; van Kuik, G. Simulating dynamic stall in a two-dimensional vertical-axis wind turbine: Verification and validation with particle image velocimetry data. Wind Energy 2010, 13, 1–17. [Google Scholar] [CrossRef]
- Oerlemans, S.; Sijtsma, P.; López, B.M. Location and quantification of noise sources on a wind turbine. J. Sound Vib. 2007, 299, 869–883. [Google Scholar] [CrossRef]
- Brooks, T.F.; Pope, D.S.; Marcolini, M.A. Airfoil Self-Noise and Prediction; National Aeronautics and Space Administration: Hampton, VA, USA, 1989. [Google Scholar]
- Paraschivoiu, I. Wind Turbine Design: With Emphasis on Darrieus Concept; Presses inter Polytechnique: Montreal, QC, Canada, 2002. [Google Scholar]
- Dyachuk, E.; Goude, A. Simulating Dynamic Stall Effects for Vertical Axis Wind Turbines Applying a Double Multiple Streamtube Model. Energies 2015, 8, 1353–1372. [Google Scholar] [CrossRef]
- Marie, D.G.J. Turbine Having Its Rotating Shaft Transverse to the Flow of the Current. U.S. Patent 1,835,018, 8 December 1931. [Google Scholar]
- Möllerström, E.; Ottermo, F.; Hylander, J.; Bernhoff, H. Eigen Frequencies of A Vertical Axis Wind Turbine Tower Made of Laminated Wood and the Effect Upon Attaching Guy Wires. Wind Eng. 2014, 38, 277–290. [Google Scholar] [CrossRef]
- Eriksson, S.; Kjellin, J.; Bernhoff, H. Tip Speed ratio control of a 200 kW VAWT with synchronous generator and variable DC voltage. Energy Sci. Eng. 2013, 1, 135–143. [Google Scholar] [CrossRef]
- Kjellin, J.; Eriksson, S.; Bernhoff, H. Electric control substituting pitch control for large wind turbines. J. Wind Energy 2013, 2013. [Google Scholar] [CrossRef]
- Möllerström, E.; Ottermo, F.; Goude, A.; Eriksson, S.; Hylander, J.; Bernhoff, H. Turbulence influence on wind energy extraction for a medium size vertical axis wind turbine. Wind Energy 2016, in press. [Google Scholar]
- Electroacoustics—Sound Level Meters—Part 1: Specifications, Edition 2; IEC 61672-1; The International Electrotechnical Commission (IEC): Genèva, Switzerland, 2013.
- Wind Turbine Generator Systems–Part 11: Acoustic Noise Measurement Techniques, Edition 3; IEC 61400-11; The International Electrotechnical Commission (IEC): Genèva, Switzerland, 2012.
- Manwell, J.F.; McGowan, J.G.; Rogers, A.L. Wind Energy Explained: Theory, Design and Application; John Wiley & Sons: Hoboken, NJ, USA, 2010. [Google Scholar]
- Noise Measurement of VESTAS V27-225kW Wind Turbine, DNV Det Norske Veritas. Available online: http://www.southhams.gov.uk/planningdocs/1/00/20/23/00202341.pdf (accessed on 27 June 2014).
- GEV MP-R32 m Rotor Diameter Sound Power Levels, VERGNET Wind Turbines. Available online: http://www.cesa.org/assets/2013-Files/ITAC/VergnetGEVMPRacousticreport.pdf (accessed on 23 July 2014).
- Noise Assessment NORWIN 29 225 kW Wind Turbine, 24 Acoustics. Available online: http://planning.allerdale.gov.uk/portal/servlets/AttachmentShowServlet?ImageName=218119 (accessed on 23 July 2014).
- General Noise Specifications WTN 250 kW. Wind Technik Nord GmbH. Available online: http://www.newport.gov.uk/stellent/groups/public/documents/planningdocument/cont616474.pdf (accessed on 23 July 2014).
© 2015 by the authors; licensee MDPI, Basel, Switzerland. This article is an open access article distributed under the terms and conditions of the Creative Commons by Attribution (CC-BY) license (http://creativecommons.org/licenses/by/4.0/).
Share and Cite
Möllerström, E.; Ottermo, F.; Hylander, J.; Bernhoff, H. Noise Emission of a 200 kW Vertical Axis Wind Turbine. Energies 2016, 9, 19. https://doi.org/10.3390/en9010019
Möllerström E, Ottermo F, Hylander J, Bernhoff H. Noise Emission of a 200 kW Vertical Axis Wind Turbine. Energies. 2016; 9(1):19. https://doi.org/10.3390/en9010019
Chicago/Turabian StyleMöllerström, Erik, Fredric Ottermo, Jonny Hylander, and Hans Bernhoff. 2016. "Noise Emission of a 200 kW Vertical Axis Wind Turbine" Energies 9, no. 1: 19. https://doi.org/10.3390/en9010019
APA StyleMöllerström, E., Ottermo, F., Hylander, J., & Bernhoff, H. (2016). Noise Emission of a 200 kW Vertical Axis Wind Turbine. Energies, 9(1), 19. https://doi.org/10.3390/en9010019