1. Introduction
To date, European countries have supported the growth of solar photovoltaic (PV), with the goals of cutting carbon emissions, boosting energy security and nurturing a clean technology sector. As these countries cut support, the industry may appear at a cross-roads. Evidence from rapid cost reductions and capacity growth suggests that solar power will prosper without support. The last few decades shows solar module costs have fallen by about 20% for every doubling in installed capacity [
1]. Recent cost reductions have reduced the share of solar modules in full system costs. Further reductions will increasingly depend on other, so-called balance of system costs, or “soft costs”. The rate of cost reductions may therefore fall.
Recent market growth shows the emergence of solar power as a serious global energy player. In the last 10 years, cumulative installed capacity has grown at an average rate of 49% annually [
2]. In 2013, about 37 gigawatts (GW
p) of new PV capacity were added globally, bringing cumulative capacity to more than 135 GW
p. On the human scale, electricity is no longer generated exclusively by huge, centralised utilities, instead by hundreds of thousands or millions of households, with 1.5 million solar installations in Germany and more than 600,000 in Britain [
3,
4].
1.1. What is Grid Parity?
The three main configurations of solar PV are small-scale, residential rooftop; commercial rooftop; and large-scale, ground-mounted solar farms. Large-scale solar delivers electricity into the medium-voltage, transmission network. Once large-scale solar is competitive with wholesale power prices, called grid parity, it will be economic without government support. In this report, we use British government projections for wholesale power prices [
5]. It is noted, however, that wholesale power prices may fall faster than these projections, as a result of more wind and solar power, or rise, depending on fossil fuel prices and energy technologies going forward. The notion of “support-free” large-scale solar may be less relevant in an increasingly regulated power market where all technologies are supported, as we are seeing in Britain. In this event, parity with gas may be the target.
Roof-top solar delivers electricity into the home or business, at the low-voltage, distribution end of the electric grid, called distributed generation. It is sometimes assumed that once roof-top solar is cheaper than residential power prices, it is cost-competitive without support. In fact, competitiveness depends on the proportion of solar power that households use (“self-consumption”); retail power prices; and the proportion that they feed into the grid instead. In Europe, households with roof-top solar presently consume about 30% of the solar power they generate, feeding the remainder back into the grid.
Self-consumption of solar power is already competitive in many countries without subsidy, compared with the alternative of using mains electricity. However, roof-top solar power is still more expensive than wholesale electricity prices. As a result, exporting surplus power to the grid is still not competitive without a supported, “export tariff”, which is well above the wholesale power price. If solar users had to export power at wholesale power prices, roof-top installations would only be starting to break-even now in central and southern Europe [
6].
Maximising self-consumption is therefore critical for subsidy-free, rooftop solar. Going forward, we see this issue being resolved by continuing cost reductions, and trends which drive self-consumption rates to well above 50% (see
Section 3). These trends include smart energy devices in our homes, which coordinate home appliances with solar power generation, plus cost reductions in battery storage.
1.2. The UK Market
Cumulative solar PV capacity is already above 5,000 megawatts (MW
p) [
7], compared with total generating capacity in Britain of about 71,200 MW [
8]. Britain’s Department of Energy and Climate Change (DECC) has estimated the cost of large-scale electricity generation for different technologies, commissioned from 2015–2030 [
9]. The study uses both assumed, average costs of capital, and technology-specific costs of capital, the latter taking into account factors such as construction time and planning permitting risk. Where technology-specific costs of capital are used, the study found that large-scale solar in Britain is already cheaper than offshore wind power; is in the same ballpark as nuclear; and will be able to compete with gas and onshore wind by 2025 [
9]. Meanwhile, the rooftop market in Britain is nearing cost-competitiveness with domestic mains electricity, as solar costs fall and residential power prices rise.
Germany now provides a possible glimpse of Britain’s electric power system in 2020. Solar photovoltaic (PV) power accounts for about 7% of the country’s final electricity demand. Solar accounts for most peak demand in summer, and as much as half of all electricity demand on summer weekends. It has up-ended power markets, pushing wholesale power prices lower. Having zero fuel costs and a guaranteed right to sell power into the grid, it can displace gas and coal-fired power, leading even to negative wholesale power prices, and threatening utility profits.
1.3. Comparisons between Britain and Germany
Germany is a good benchmark for Britain, given its similar energy mix (fossil fuels, nuclear and renewables); standard of living; level of power demand; and solar irradiance [
10]. The big difference at present is that Germany is the world’s biggest market for solar, with an installed capacity of some 37.2 gigawatts across about 1.5 million installations [
3]. Britain, in contrast, has about 5 GW
p installed across 0.6 million installations [
4,
7]. In 2014, solar power accounted for nearly 7% of total final electricity consumption in Germany [
11], compared with 1.3% in Britain [
12].
As the British solar market develops we expect it to go through many of the changes seen in Germany, including growing competitiveness across the solar value chain. Solar installation costs are lower in Germany than the UK because of greater efficiency, particularly in financing but also in development and installation. We believe that German and UK full installed solar prices will converge over the next years. Lower German costs are reflected in differences in feed-in tariffs and installation costs for rooftop solar. In Britain, the support for solar power generation by 0–4 kW systems is 14.38 pence per kWh for 20 years, plus inflation, plus an export tariff of 4.77 pence [
13]. The German feed-in tariff for small systems is 10.1 pence (12.69 euro cents) per kWh, over the same period. The differences can also be seen in the installation costs, which were £1,580 per kW in Q1 2014 in Britain, compared with £1,310 (€1,640) per kW in Germany [
14,
15]. Germany’s Fraunhofer Institute calculated the most cost-efficient solar farms were now competitive with onshore wind and well ahead of offshore wind [
16].
1.4. Cost Calculation: Levelised Cost of Energy (LCOE) and Payback Periods
One common measure of the cost of generating solar power is the levelised cost of energy (LCOE), which divides the lifetime cost of a solar installation by lifetime power generation, measured in pence per kilowatt hour (kWh). For the sake of simplicity, LCOE excludes important costs, such as grid integration; waste disposal; and pollution. LCOE is a useful way to account for important factors such as capacity factor and the weighted average cost of capital (WACC), two critical variables.
Capacity factor is the actual output of a power plant as a percentage of its theoretical maximum. In the case of solar, it will take into account local solar irradiance and day length. In very sunny countries, such as Australia, solar panel load factors can reach 30% or more. Britain’s Department of Energy and Climate Change (DECC) calculated an average capacity factor for solar PV in Britain of 10.3% in 2013 [
17]. Weighted cost of capital (WACC) reflects the average cost of financing for a project. WACC will be higher for less mature technologies, because investors require a higher return on equity to compensate for the higher risk. The WACC is used to discount future cash flows, and so critically affects the cost calculation. British government estimates for large-scale solar LCOE illustrate the point. Using a 10% WACC across all energy technologies, DECC ranks solar costs higher than wind, nuclear and gas. However, using a lower, technology-specific WACC for large-scale solar power of 6.2%, reflecting the maturity of the technology and speed of construction, DECC ranked large-scale solar as the cheapest form of UK power generation before 2025 [
9].
Most rooftop solar consumers assess solar investments in terms of payback periods, rather than LCOE. As a result, we use LCOE as a measure for the economics of large-scale, ground-mounted solar, and payback periods for the economics of commercial and residential rooftop solar power. The payback period is defined as the length of time it takes to recoup the upfront investment, based on annual savings as a result of reduced utility bills. We assumed steadily rising domestic power prices, using the latest DECC projections; rising self-consumption rates; and we discounted the revenues and expenses according to a discount rate or WACC (see
Section 5. Methodology). We expect that most customers would require payback periods around 10 years or below before considering an investment. Payback periods were calculated using the same approach as for LCOE, including estimates for cost reductions in solar hardware and balance of systems over the next decade.
Increasing the self-consumption rate is critical for the economics of unsubsidised residential systems, as described above. With higher self-consumption, households avoid selling surpluses at a very low wholesale power price (presently about 5 pence per kWh in Britain), and buying mains electricity at much higher retail power prices (about 16 pence). While self-consumption rates in Europe are presently about 30%, home management systems are emerging which can boost these to 45%. As support is withdrawn, the incentive for self-consumption will rise. We assume steadily rising self-consumption rates (see
Section 5. Methodology). Critically, battery storage increases self-consumption above 50%, and may therefore be the cornerstone of unsubsidised residential systems.
2. UK Solar Economics
2.1. Solar Module Selling Costs and Prices
Solar module prices have fallen sharply over the past four decades. Solar module cost reductions are driven by a combination of innovation in the efficiency of material use; light conversion; and production. Regarding light conversion efficiencies, for example, U.S.-based First Solar expects to reach efficiencies of 19.5% in 2017, referring to its Cadmium Telluride (CdTe) thin film cells, from 13% in 2013 [
18]. Such numbers refer to the proportion of light energy striking a solar module that is converted to electricity. Recent cost reductions additionally reflect global commoditization of solar cells and modules, and in particular a ramp-up of manufacturing capacity in China, leading to global surpluses. A decade ago, solar panel (module) prices were as high as £4.00/Watt and the global market for solar was 500 megawatts (MW
p) installed per year. Today modules prices are well below £0.40/Watt and the global market in 2014 is expected to be over 40 GW
p.
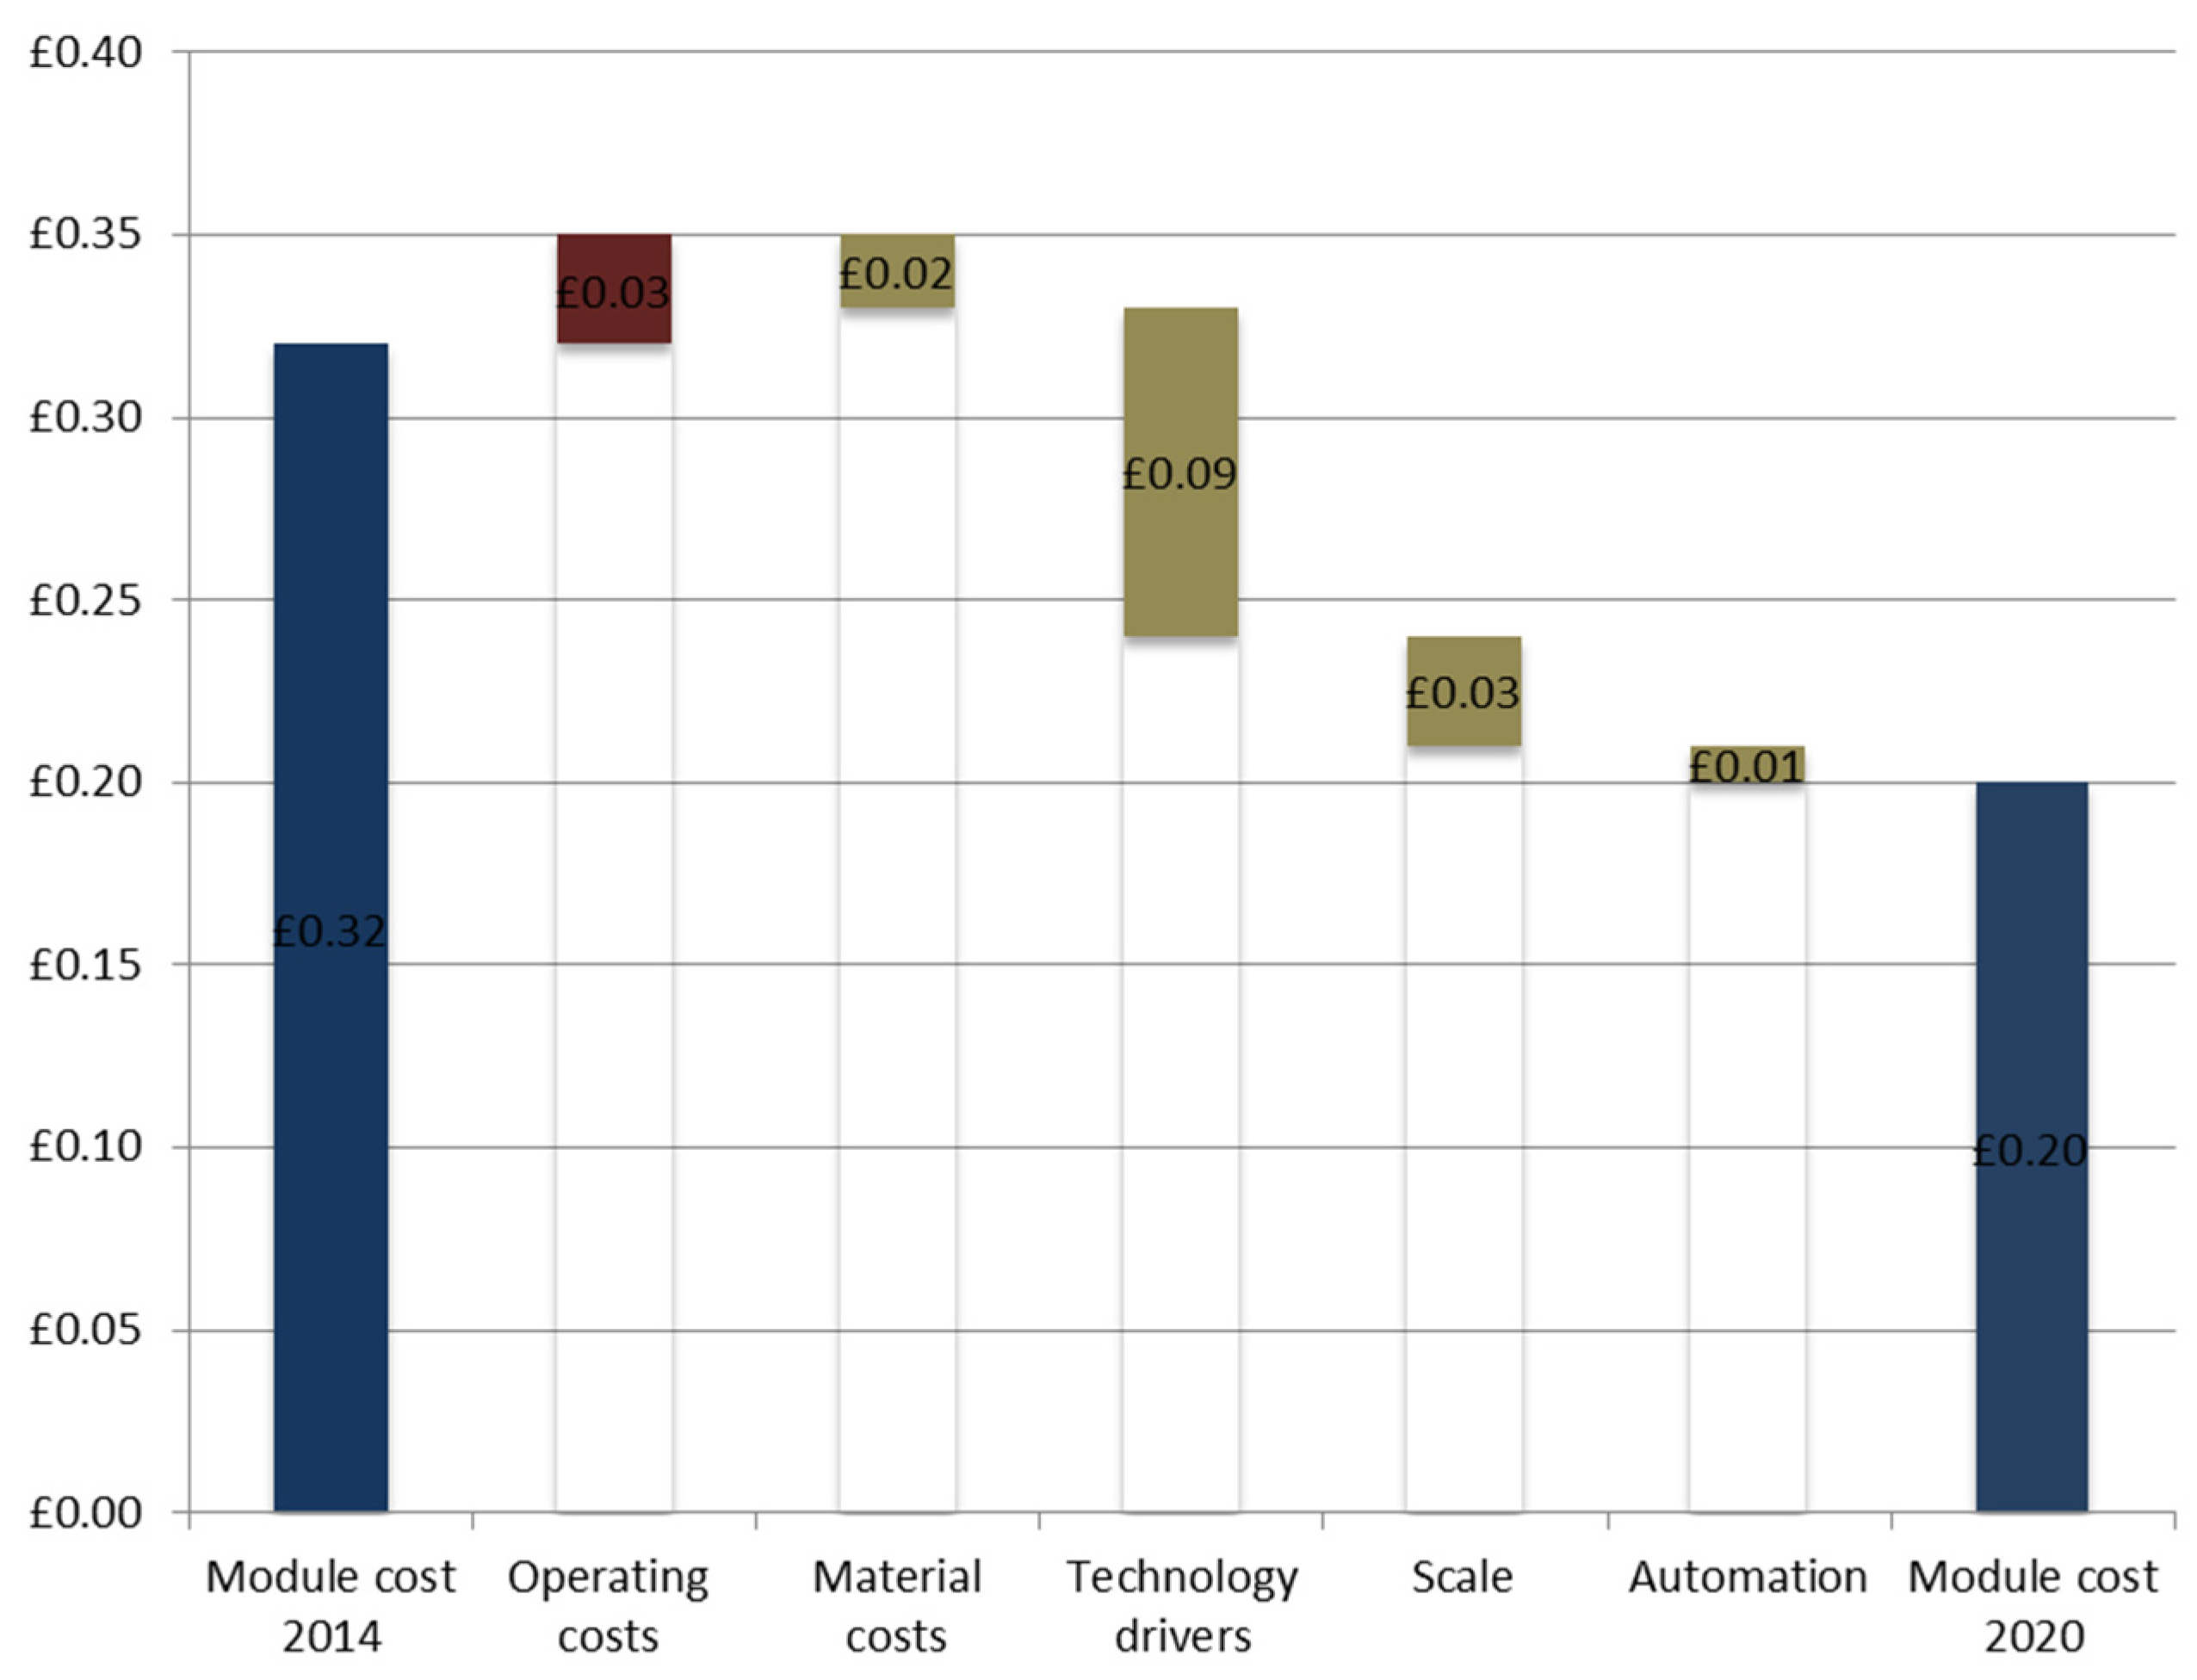
Our own predictions, based on in-depth conversations with manufacturers, suggest best-in-class module costs falling from £0.32/Watt in 2014 to £0.20/Watt in 2020.
Figure 1 shows our expectations for changes in module production costs from 2014 to 2020, taking into account small cost increases expected in operation and materials, more than offset by savings as a result of innovation in manufacturing and economies of scale.
Figure 1.
Module production cost reductions, 2014–2020. Sources: First Solar, and unpublished industry cost maps.
Figure 1.
Module production cost reductions, 2014–2020. Sources: First Solar, and unpublished industry cost maps.
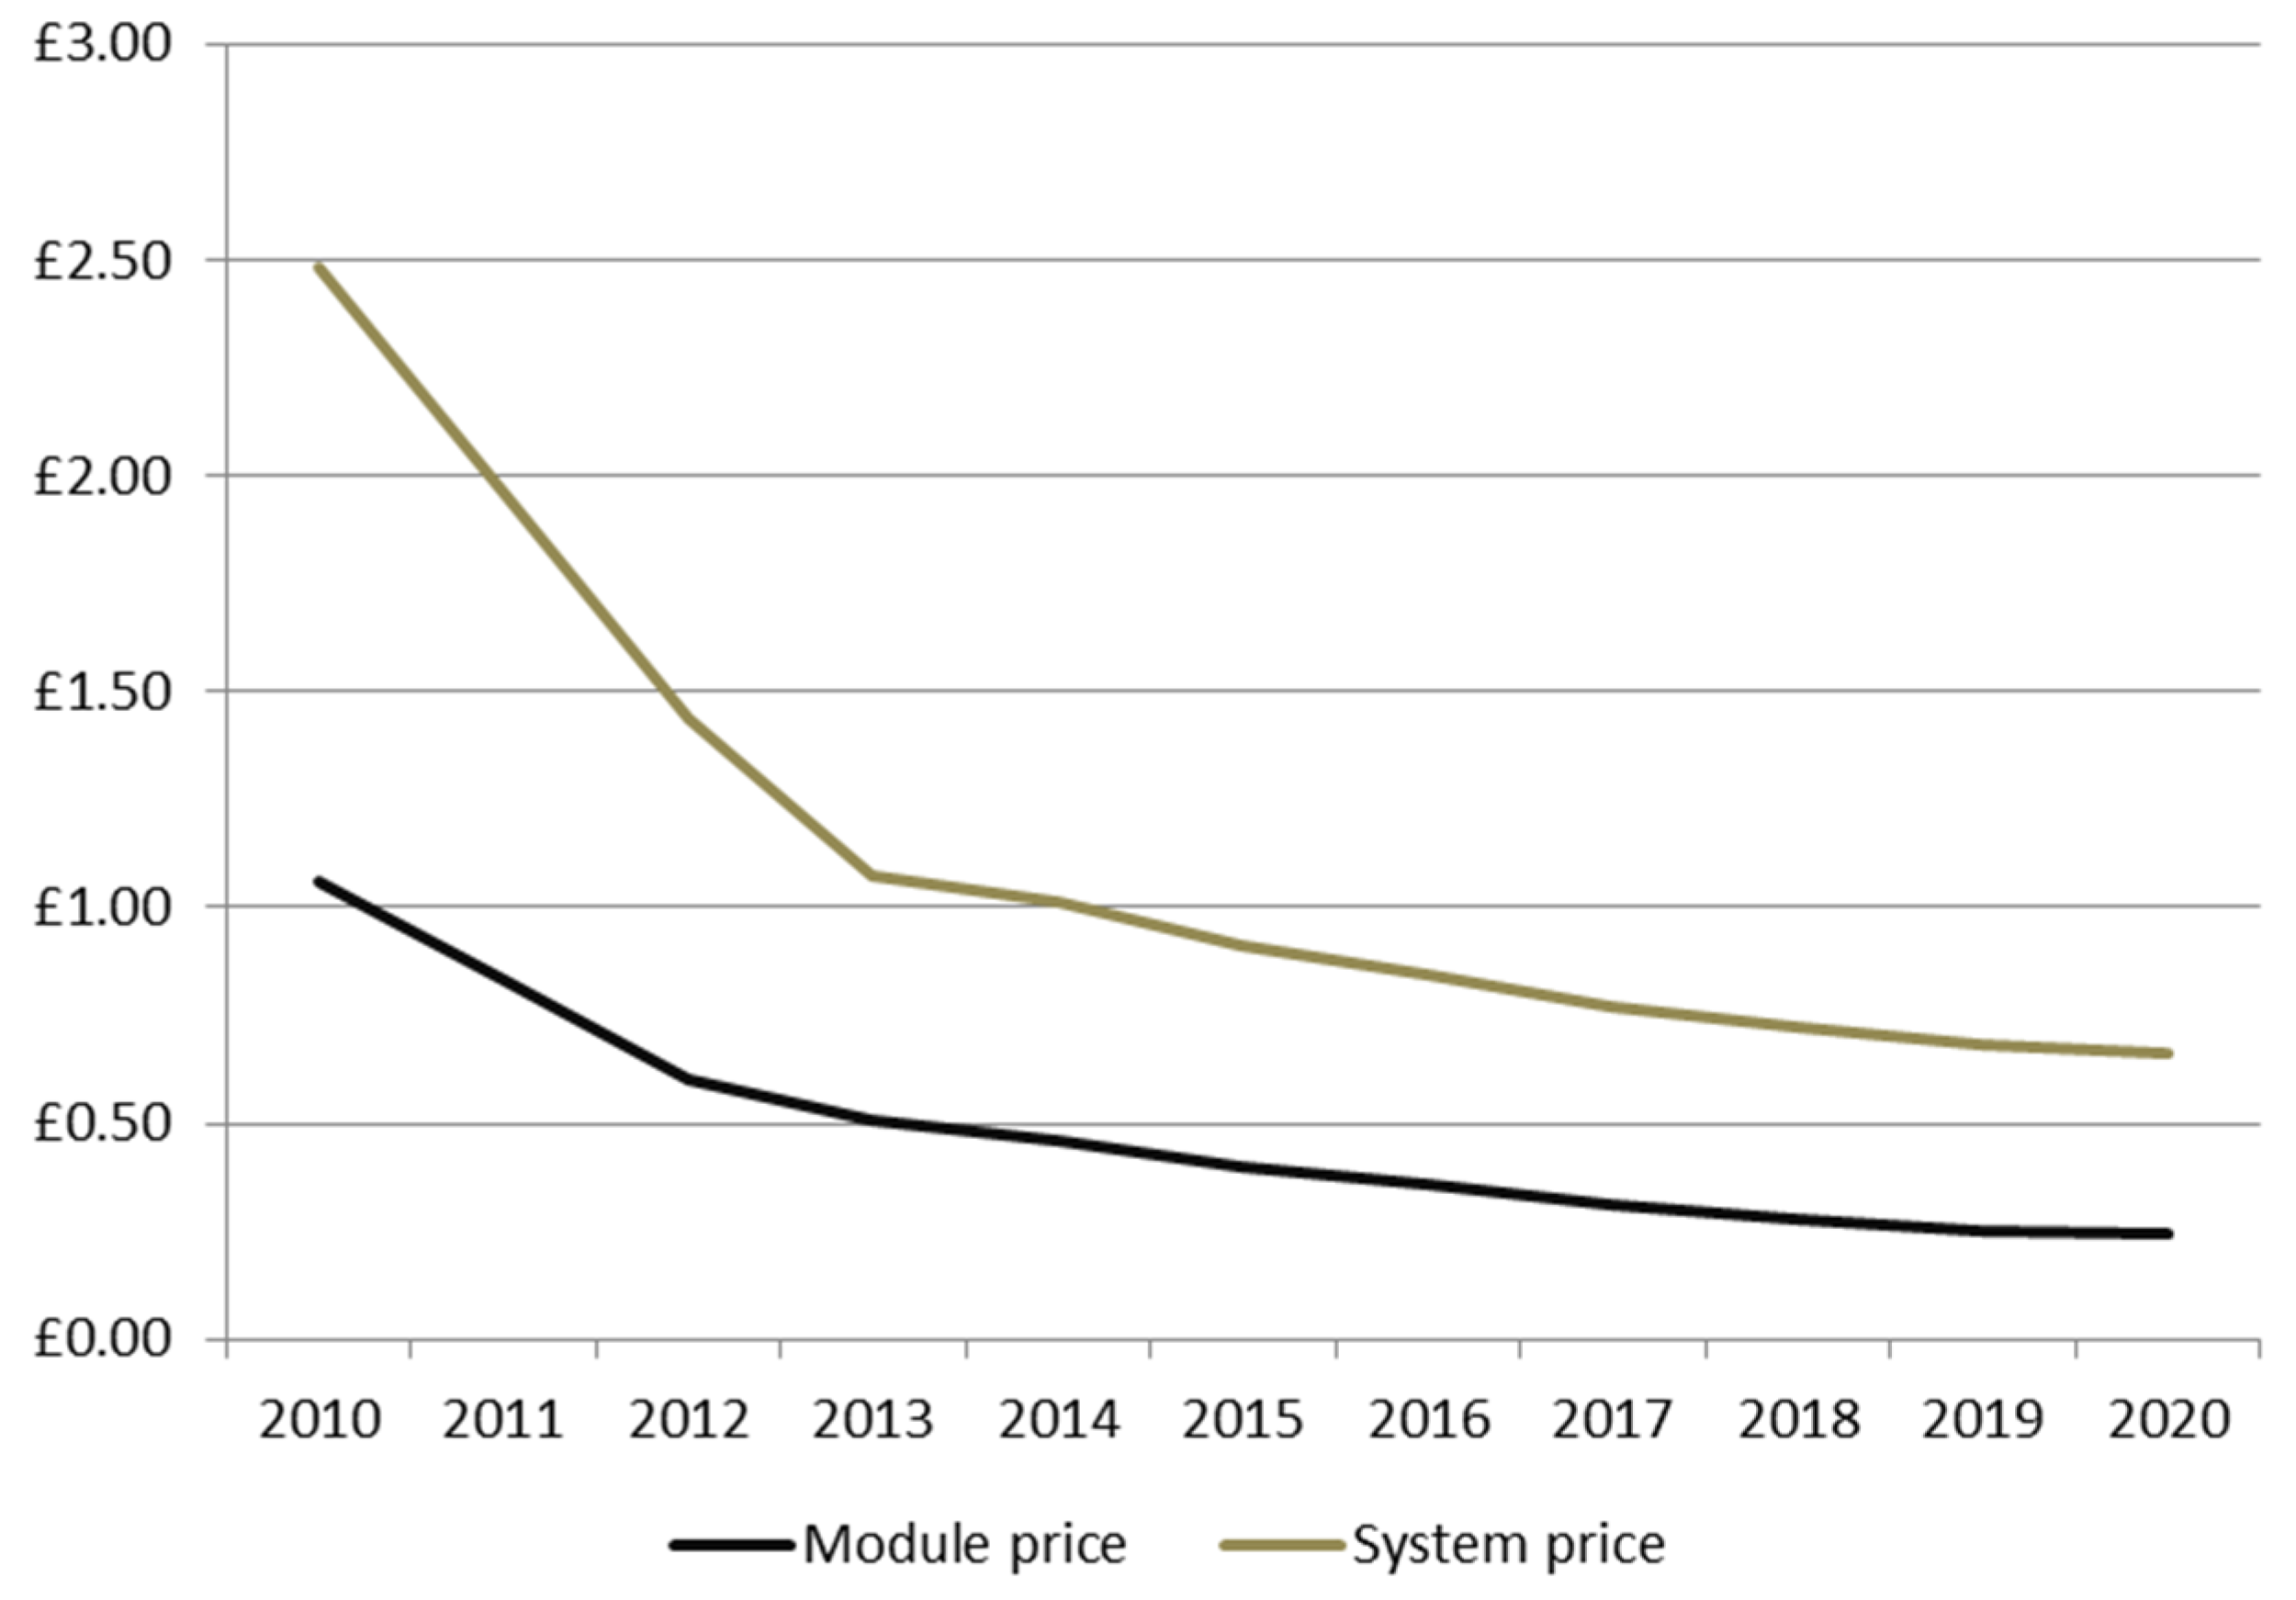
Full solar system costs may not maintain the same pace of reductions as seen in the past five years. That is because the swiftest reductions have come from solar modules, which now account for a smaller share of the total. The remaining, so-called balance of system costs, include inverters, installation and financing. Inverters convert direct current electricity generated by solar modules into alternating current required by many machines and household appliances. Inverter costs are continuing to fall, and Britain will in addition benefit from continuing reductions in installation and financing, as the supply chain matures. However, these cost reductions may be more gradual. Meanwhile, we expect soft costs such as installation and financing to fall, as discussed above, as Britain converges with other more mature markets such as Germany.
We see the pace of full system cost reductions in Britain moderating for the rest of this decade, compared with the previous five years. Nevertheless, we still expect full installed costs to fall by about one third between now and 2020 (see
Figure 2). This is slightly more ambitious than some estimates. For example, the International Energy Agency recently estimated that global average full installed solar costs (including equipment, labour and financing) would halve by 2040 or sooner [
2].
Figure 2.
Full installed costs, UK ground-mounted systems, 2010–2020. Source: Our research, industry experts.
Figure 2.
Full installed costs, UK ground-mounted systems, 2010–2020. Source: Our research, industry experts.
2.2. Solar Battery Pack Economics
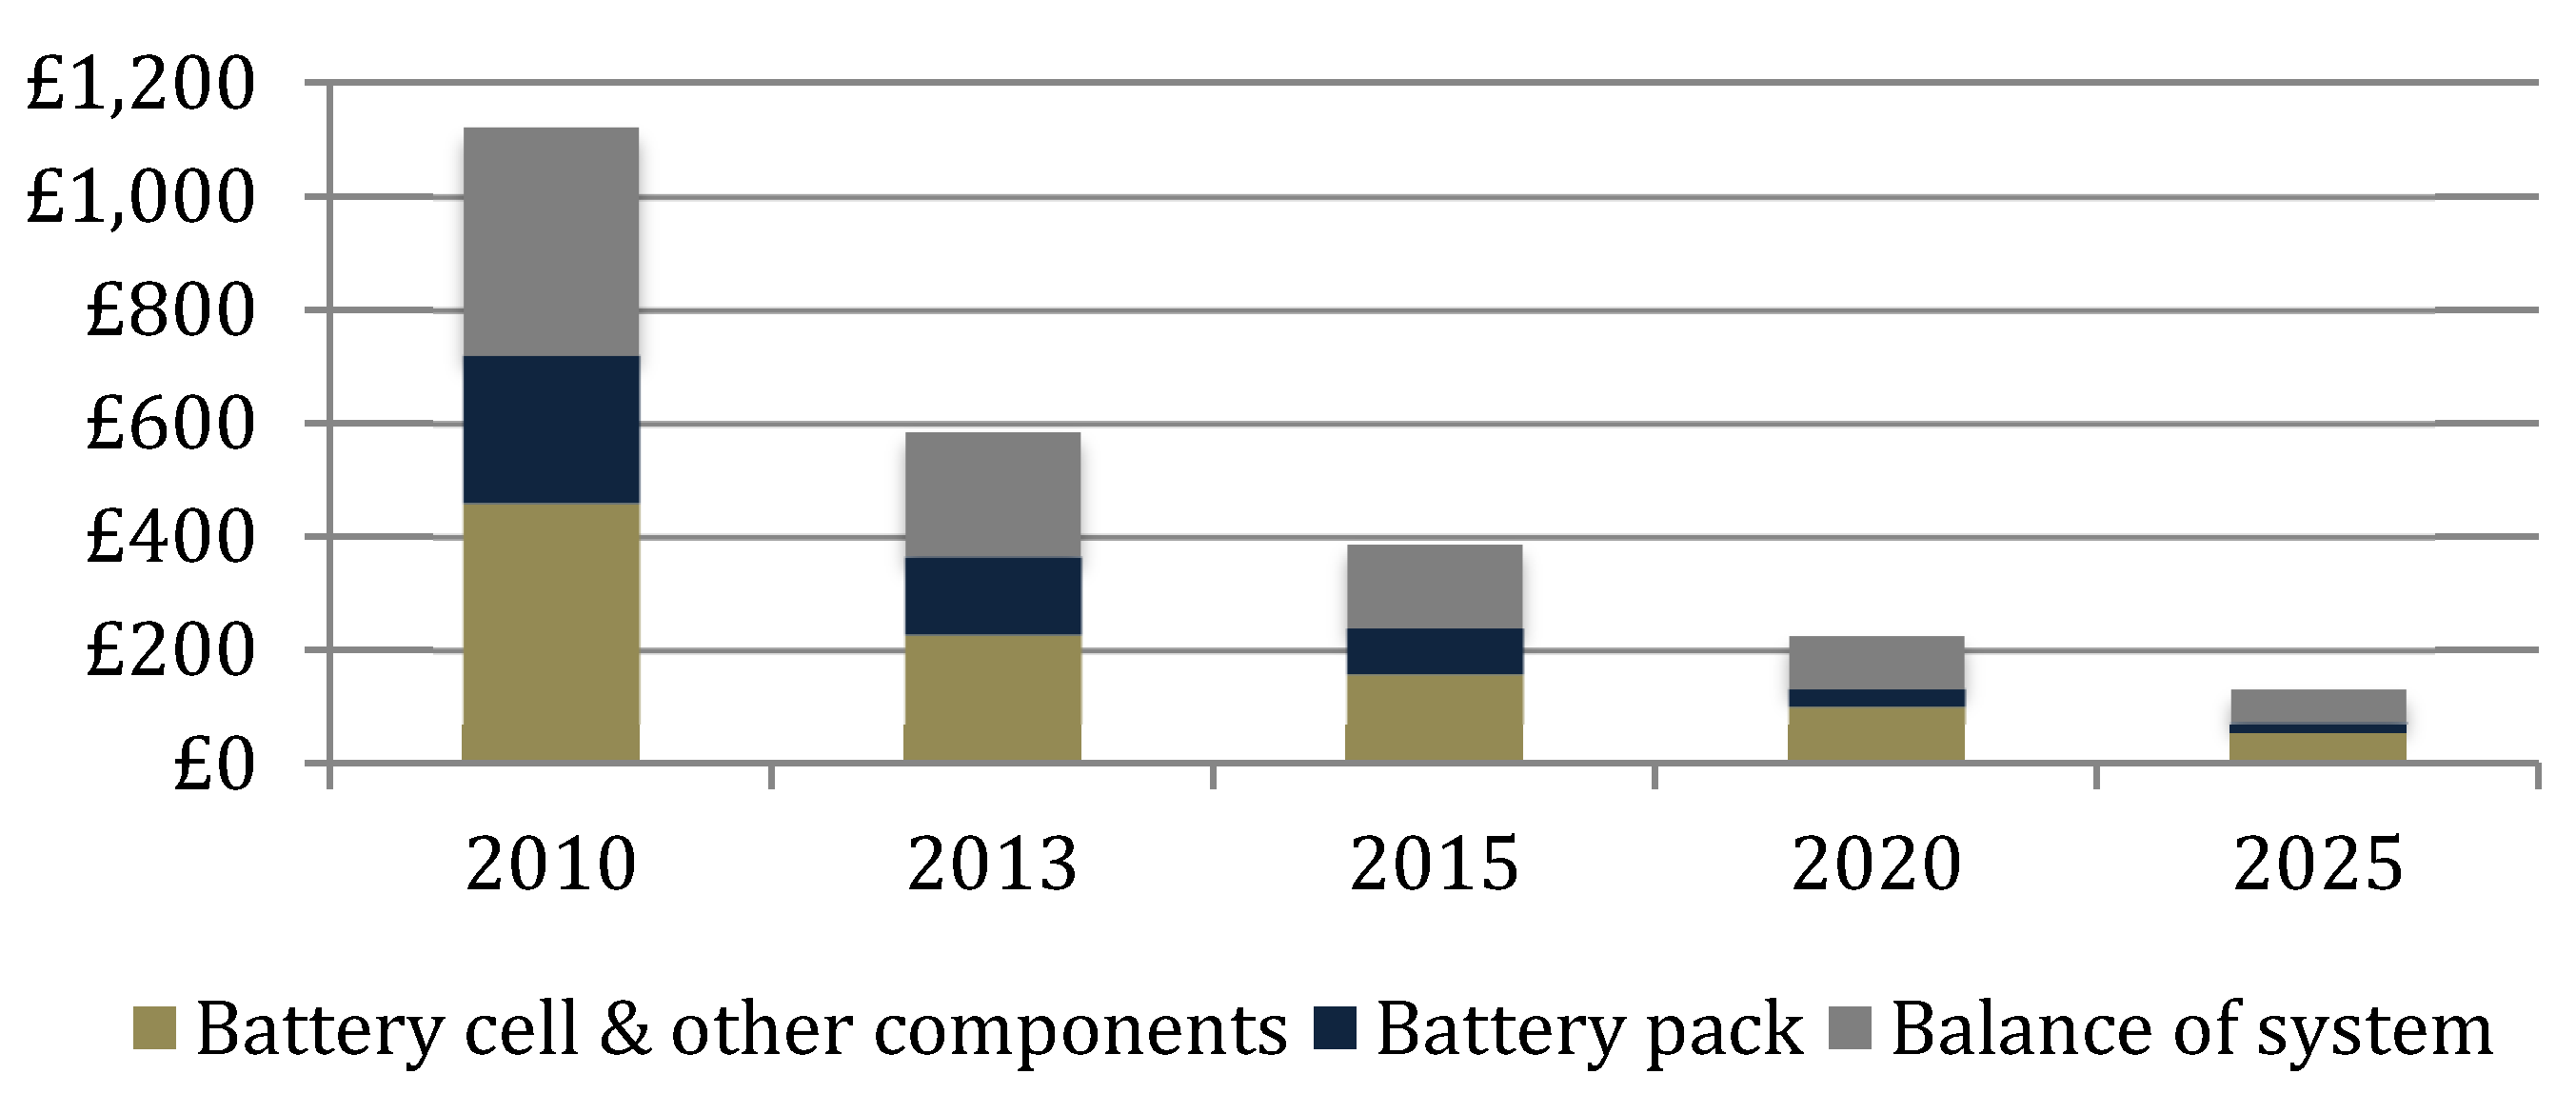
Various potential remedies exist for the variability of solar power. Battery storage is one of these, where solar battery pack products are now emerging. Storage solutions available today are expensive. Electricity must be converted into another form of energy and then converted back into electrical energy. Lithium-ion is one promising battery storage technology currently under development. Lithium ion battery packs are still costly, at around £320/kWh [
19]. Battery costs are falling, however, partly as a result of production and innovation in the automotive sector. With its planned “gigafactory”, Tesla Motors believe that their battery packs could reach £100–130/kWh in 2020 [
20,
21]. See
Figure 3 for our projection of battery pack costs, taking into account published Tesla projections and our unpublished interviews with the German battery developer, Younicos.
Figure 3.
Battery pack production cost reductions, 2010–2020 (£/kWh). Sources: Published Tesla cost data; conversations with industry experts, including Younicos.
Figure 3.
Battery pack production cost reductions, 2010–2020 (£/kWh). Sources: Published Tesla cost data; conversations with industry experts, including Younicos.
At present in Germany, the problem for unsubsidised solar is the very low wholesale power price at which solar surpluses must be sold into the grid. The Swiss investment bank, UBS, last year calculated that unsupported rooftop solar in southern Germany already breaks even (defined as total annual electricity costs with and without solar panels), assuming a grid export price of 3 cents, and 30% self-consumption [
6]. The regulated, “subsidised” export price at present is up to 12.69 euro cents per kilowatt hour, in Germany, compared with domestic power prices of about 29 cents, and spot wholesale power prices of about 3 cents.
Without supported grid export prices, it becomes critical to maximise self-consumption. Households can first change their behaviour by using more self-generated electricity in the daytime, called load shifting. Leading global inverter manufacturer SMA Solar has developed software which matches the operation of household appliances and heating systems with forecast home solar output, through radio-controlled switches. This can increase self-consumption to 45%, the company estimates [
22]. Batteries can make a bigger difference. Households can use deliberately small battery packs, minimising extra costs, and extend home-generated solar power past sunset, and increase self-consumption beyond 50% (see
Section 5). Unsupported residential battery-pack solar PV systems are already becoming a cost-effective option in Germany, Italy and Spain, according to UBS. UBS sees a particular benefit from combining solar PV with a static battery, plus an electric vehicle (EV). That is because of a natural fit, where the static (non-EV) battery would mop up surplus daytime solar supply, and use this to charge the EV battery at night. In Germany, unsubsidised solar battery/ EV packages would deliver a return on investment of more than 7% by 2020, compared with a conventional car and no solar panels, according to UBS [
21].
2.3. Cost Trajectories: Fossil Fuels
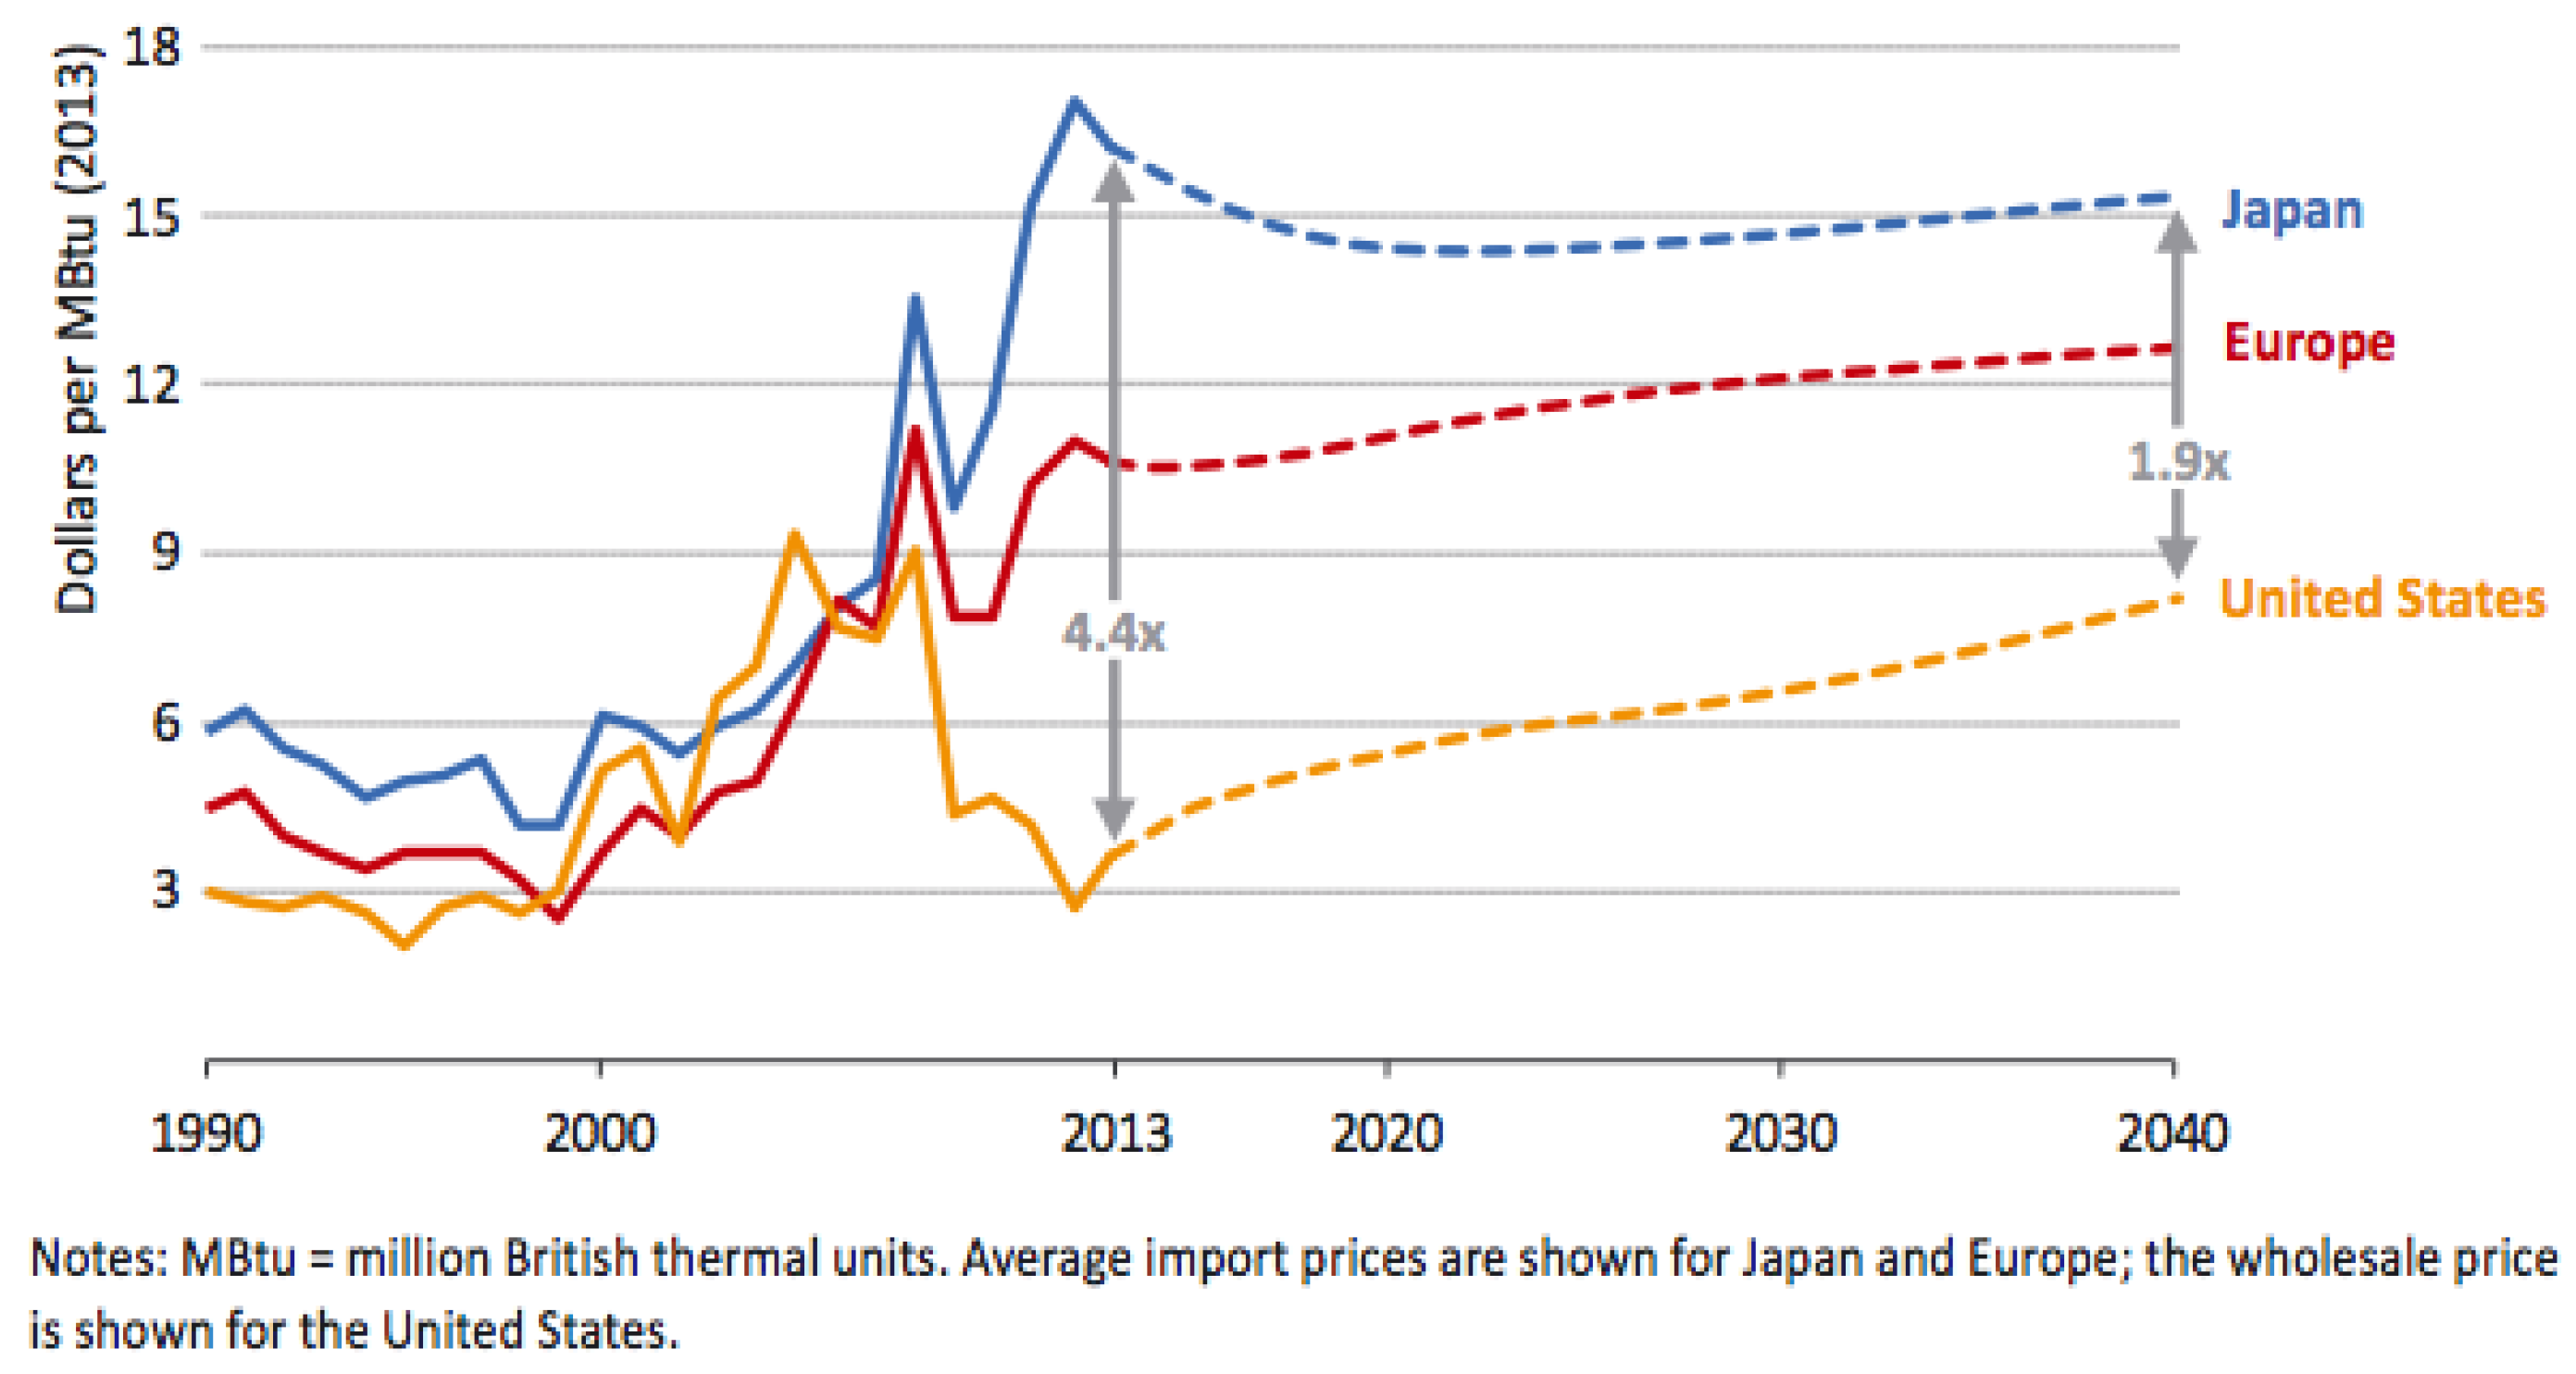
Gas is what is called the “marginal provider” in Britain, meaning that power prices are determined most of the time by gas plants, as opposed to much of the continent where it is determined by coal and power prices in neighbouring countries. Depending on the cost trajectory for advanced turbine design, gas-fired power may have more limited scope for reductions, given that the largest cost element in terms of its LCOE is fuel cost (the natural gas price), which is both difficult to predict and hedge. There are huge differences in global gas prices, with Japan (in 2013) paying on average $17 per Mbtu as opposed to $10 in Europe and $3 in the US. The major reason for this is the difficulty and high cost of transporting gas (see
Figure 4). In Britain, domestic resources are dwindling, with little hope of UK shale gas coming online for another decade, meaning that other, more expensive sources need to be found.
Figure 4.
Natural gas price by region in the New Policies Scenario, World Energy Outlook 2014, IEA/OECD. Source: International Energy Agency (2014) [
23]; Based on IEA data from IEA WEO 2014 © OECD/IEA, IEA Publishing; modified by GWG Energy and Alexa Capital. Licence:
http://www.iea.org/t&c/termsandconditions/.
Partly, as a result of expected rises in gas prices, as well as the growing cost of support for environmental policies and grid network upgrades, the Department of Energy and Climate Change (DECC) projects rising British residential power prices for the rest of this decade and beyond [
5]. If British gas and power prices rise, it will become easier for solar PV to compete, and market penetration will continue to grow.
3. Projected Solar Costs: Our Findings
We conducted an analysis of projected costs of solar hardware and balance of systems. Underlying cost data were based both on published commercial projections, and interviews with multiple installers, developers and manufacturers in the industry. The analysis enabled us to make estimates for cost, assuming no government support, across different parts of the UK over the next 10 years (see
Section 5. Methodology). Below we present the findings for the LCOEs of large-scale ground-mounted solar, and payback periods for commercial and residential rooftop solar.
3.1. Large-Scale Ground-Mounted Solar LCOEs
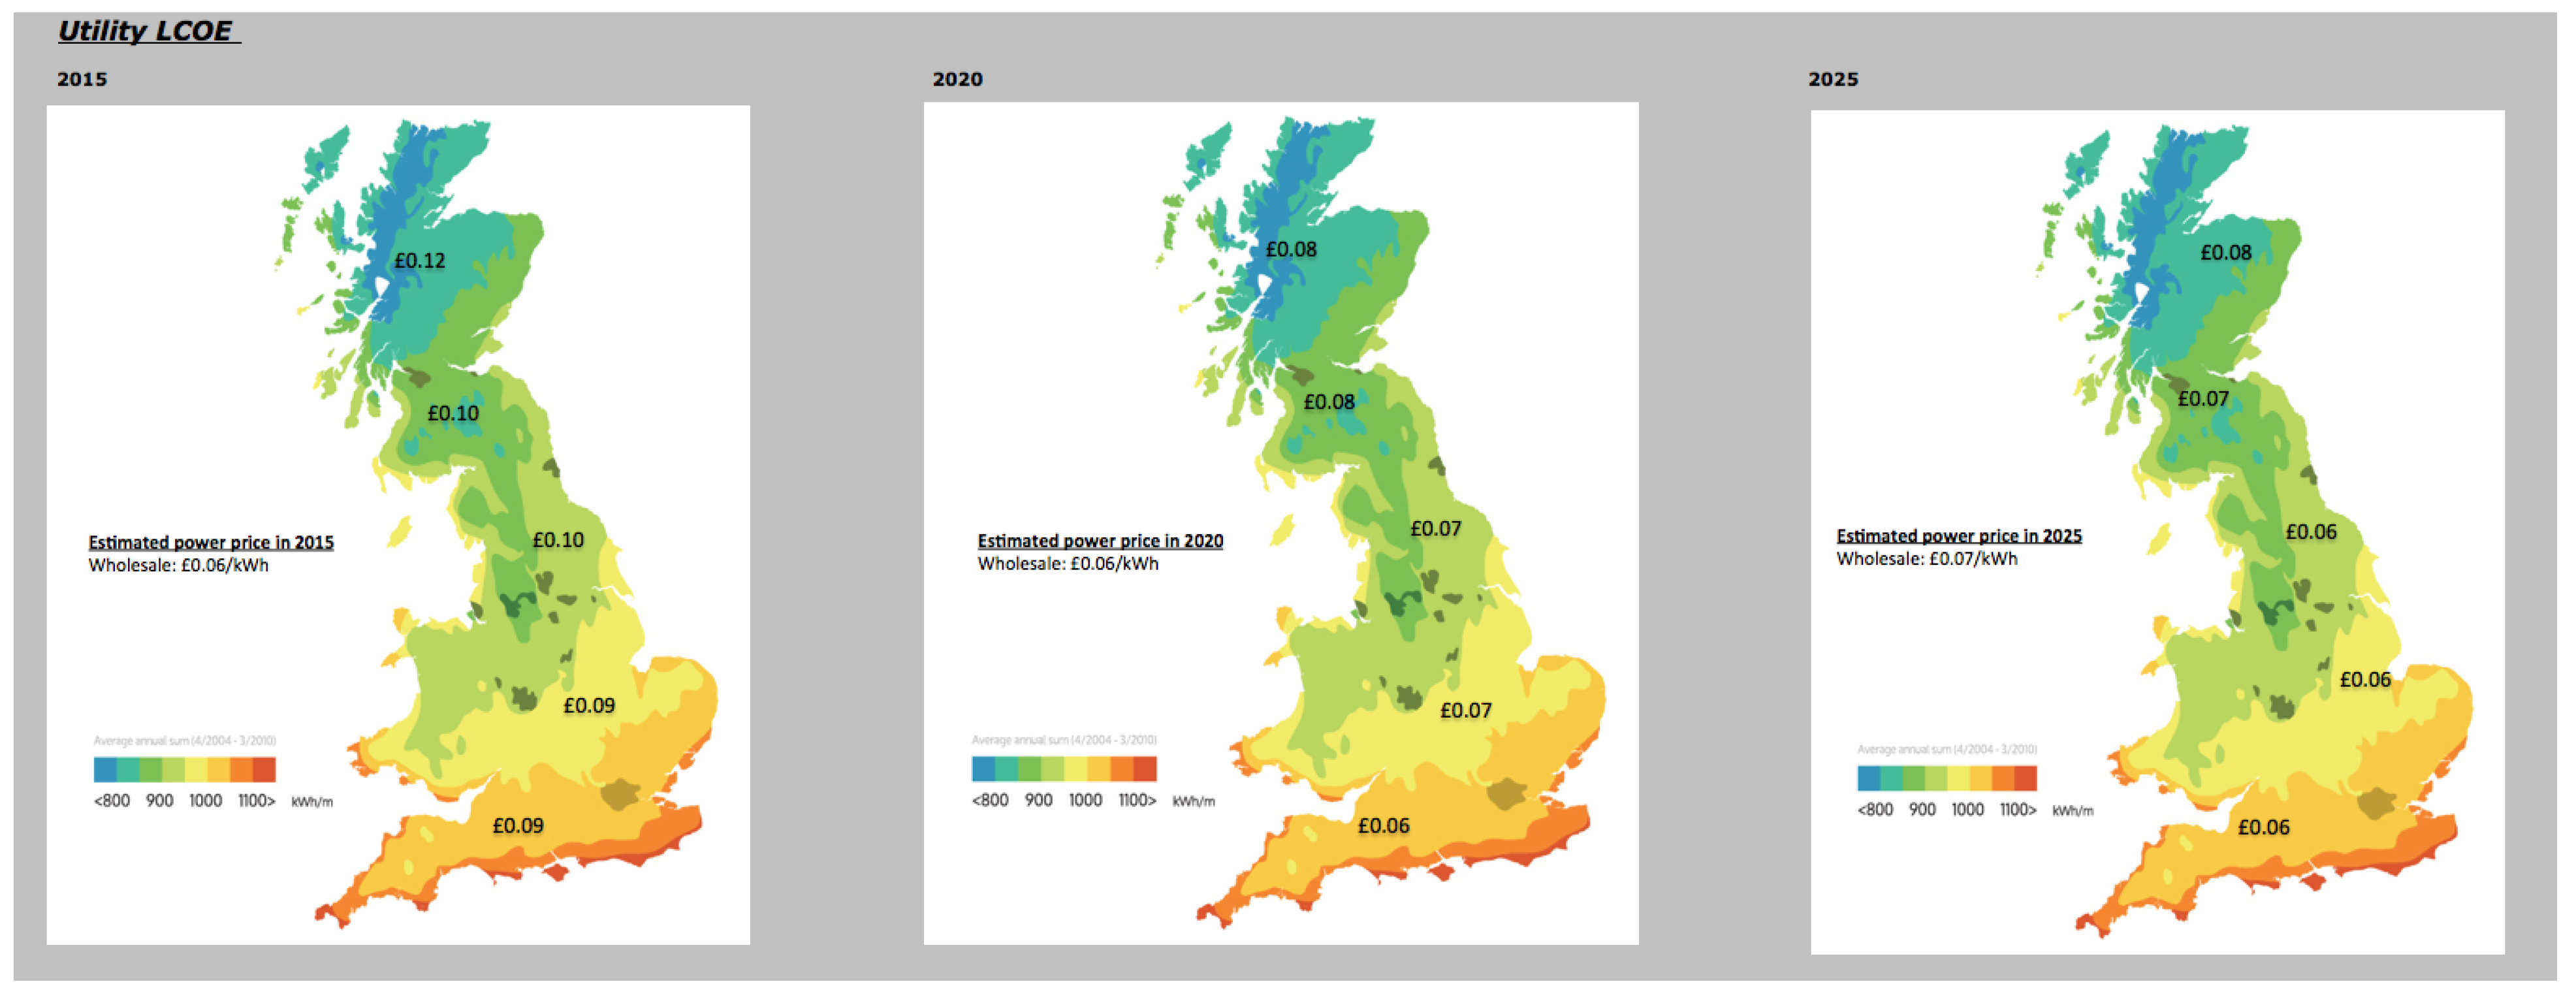
In the southern half of England, we estimate that large-scale solar farms will reach parity with onshore wind power in 2015, and full parity with fossil fuels and wholesale prices by 2025 at the latest (see
Figure 5). These comparisons are with forecasts for rising fossil fuel and wholesale power prices, as projected by the UK government [
5].
Figure 5.
UK large-scale solar farm LCOEs, £/kWh, 2015–2025.
Figure 5.
UK large-scale solar farm LCOEs, £/kWh, 2015–2025.
3.2. Commercial Rooftop Payback Periods
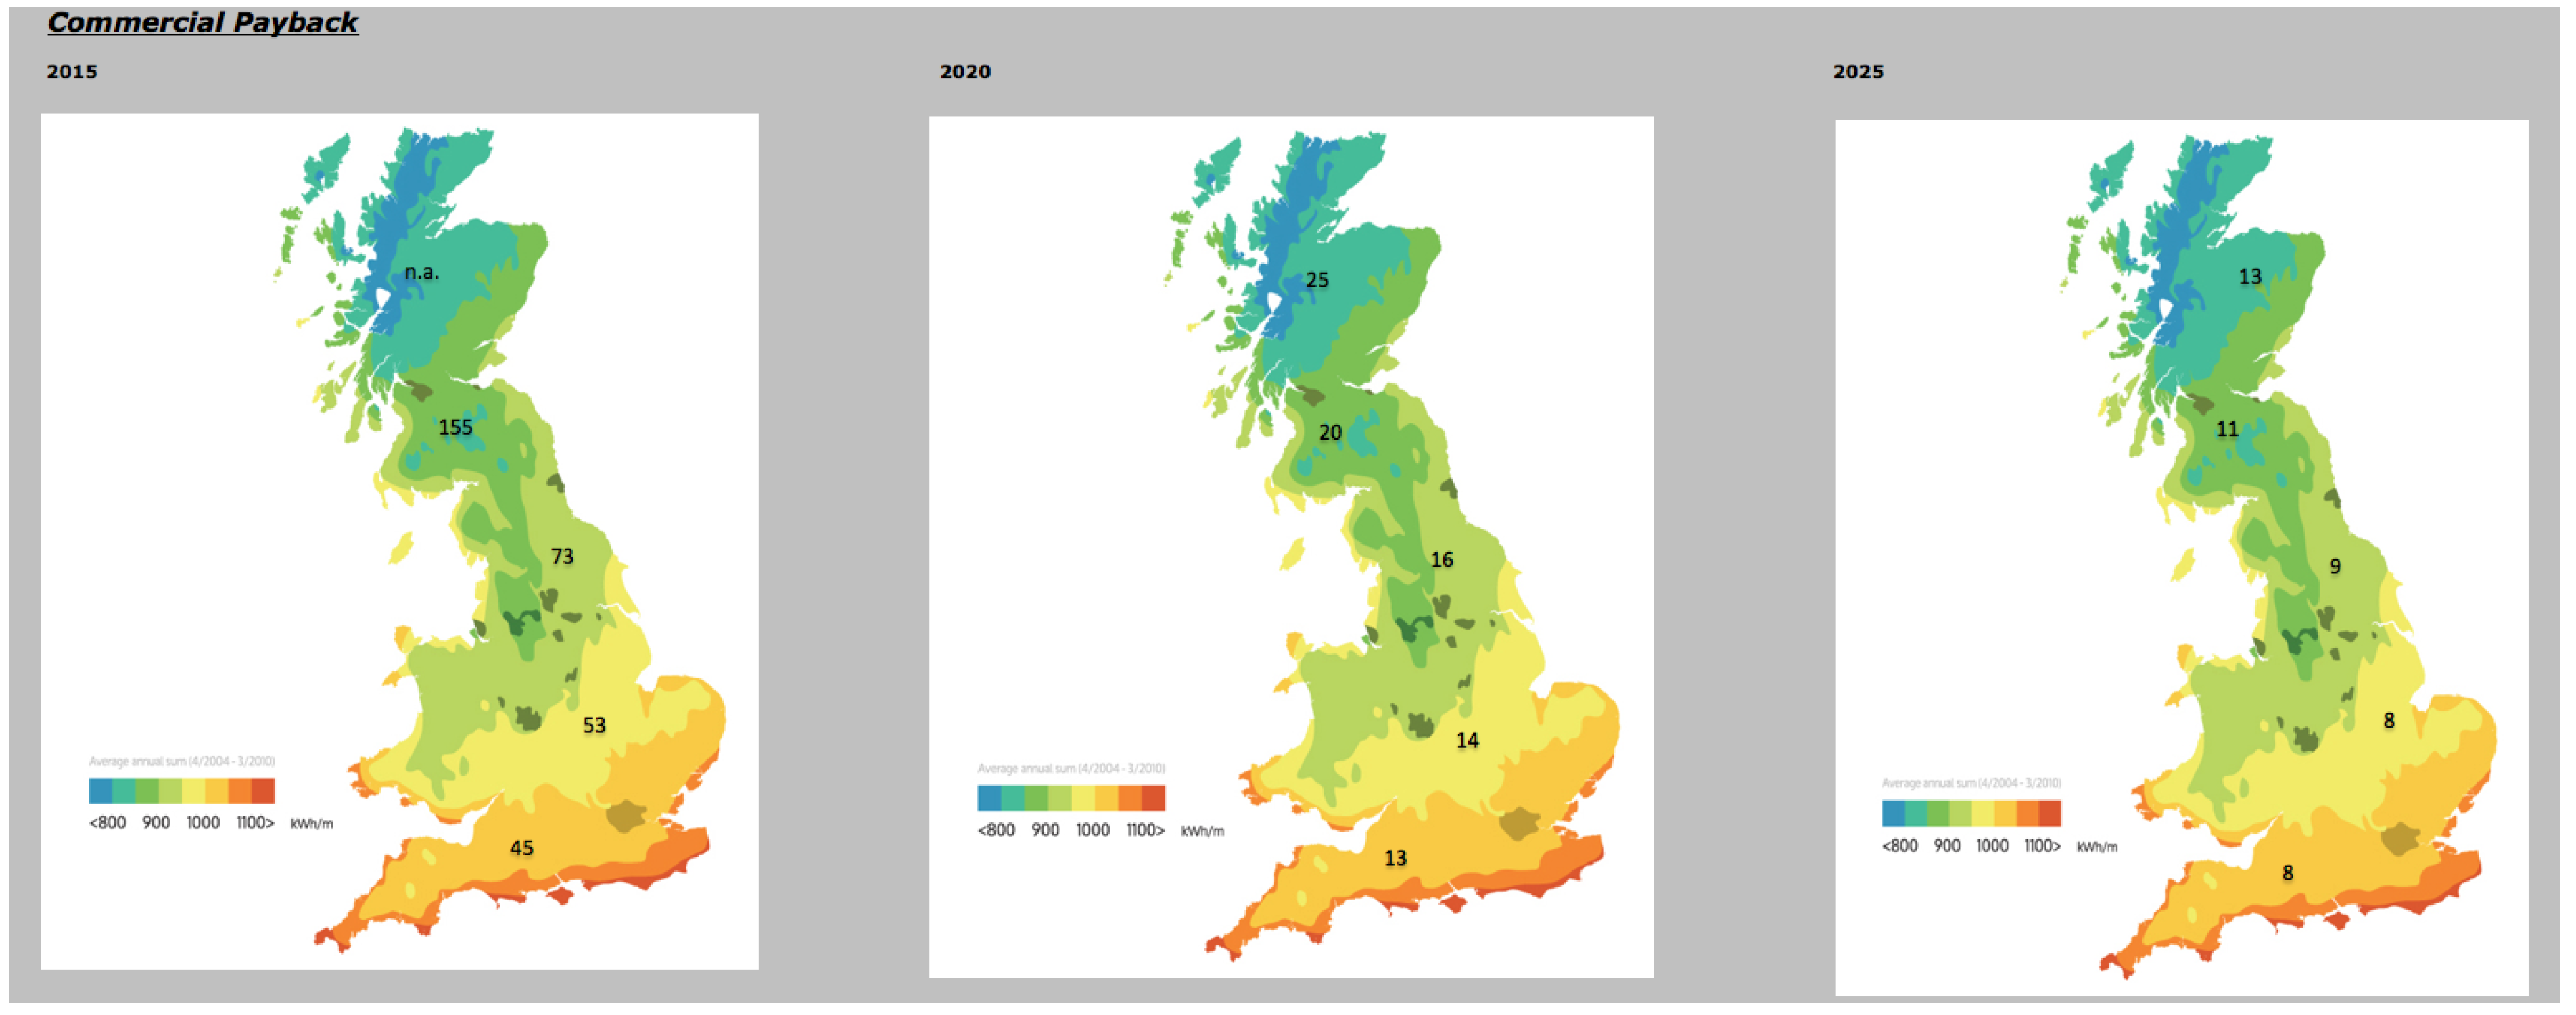
Our analysis finds that commercial rooftop solar systems reach payback periods of well below 15 years in southern England by 2020. These findings assume that commercial business can use 70% of the power produced (see
Figure 6). Payback periods fall below 10 years across Britain more generally by 2025, using government assumptions for irradiation and power prices. These estimated payback periods could be a substantial driver for this market, depending on the minimum payback periods required to trigger investments by individual businesses.
Figure 6.
UK commercial rooftop payback periods, number of years, 2015–2025.
Figure 6.
UK commercial rooftop payback periods, number of years, 2015–2025.
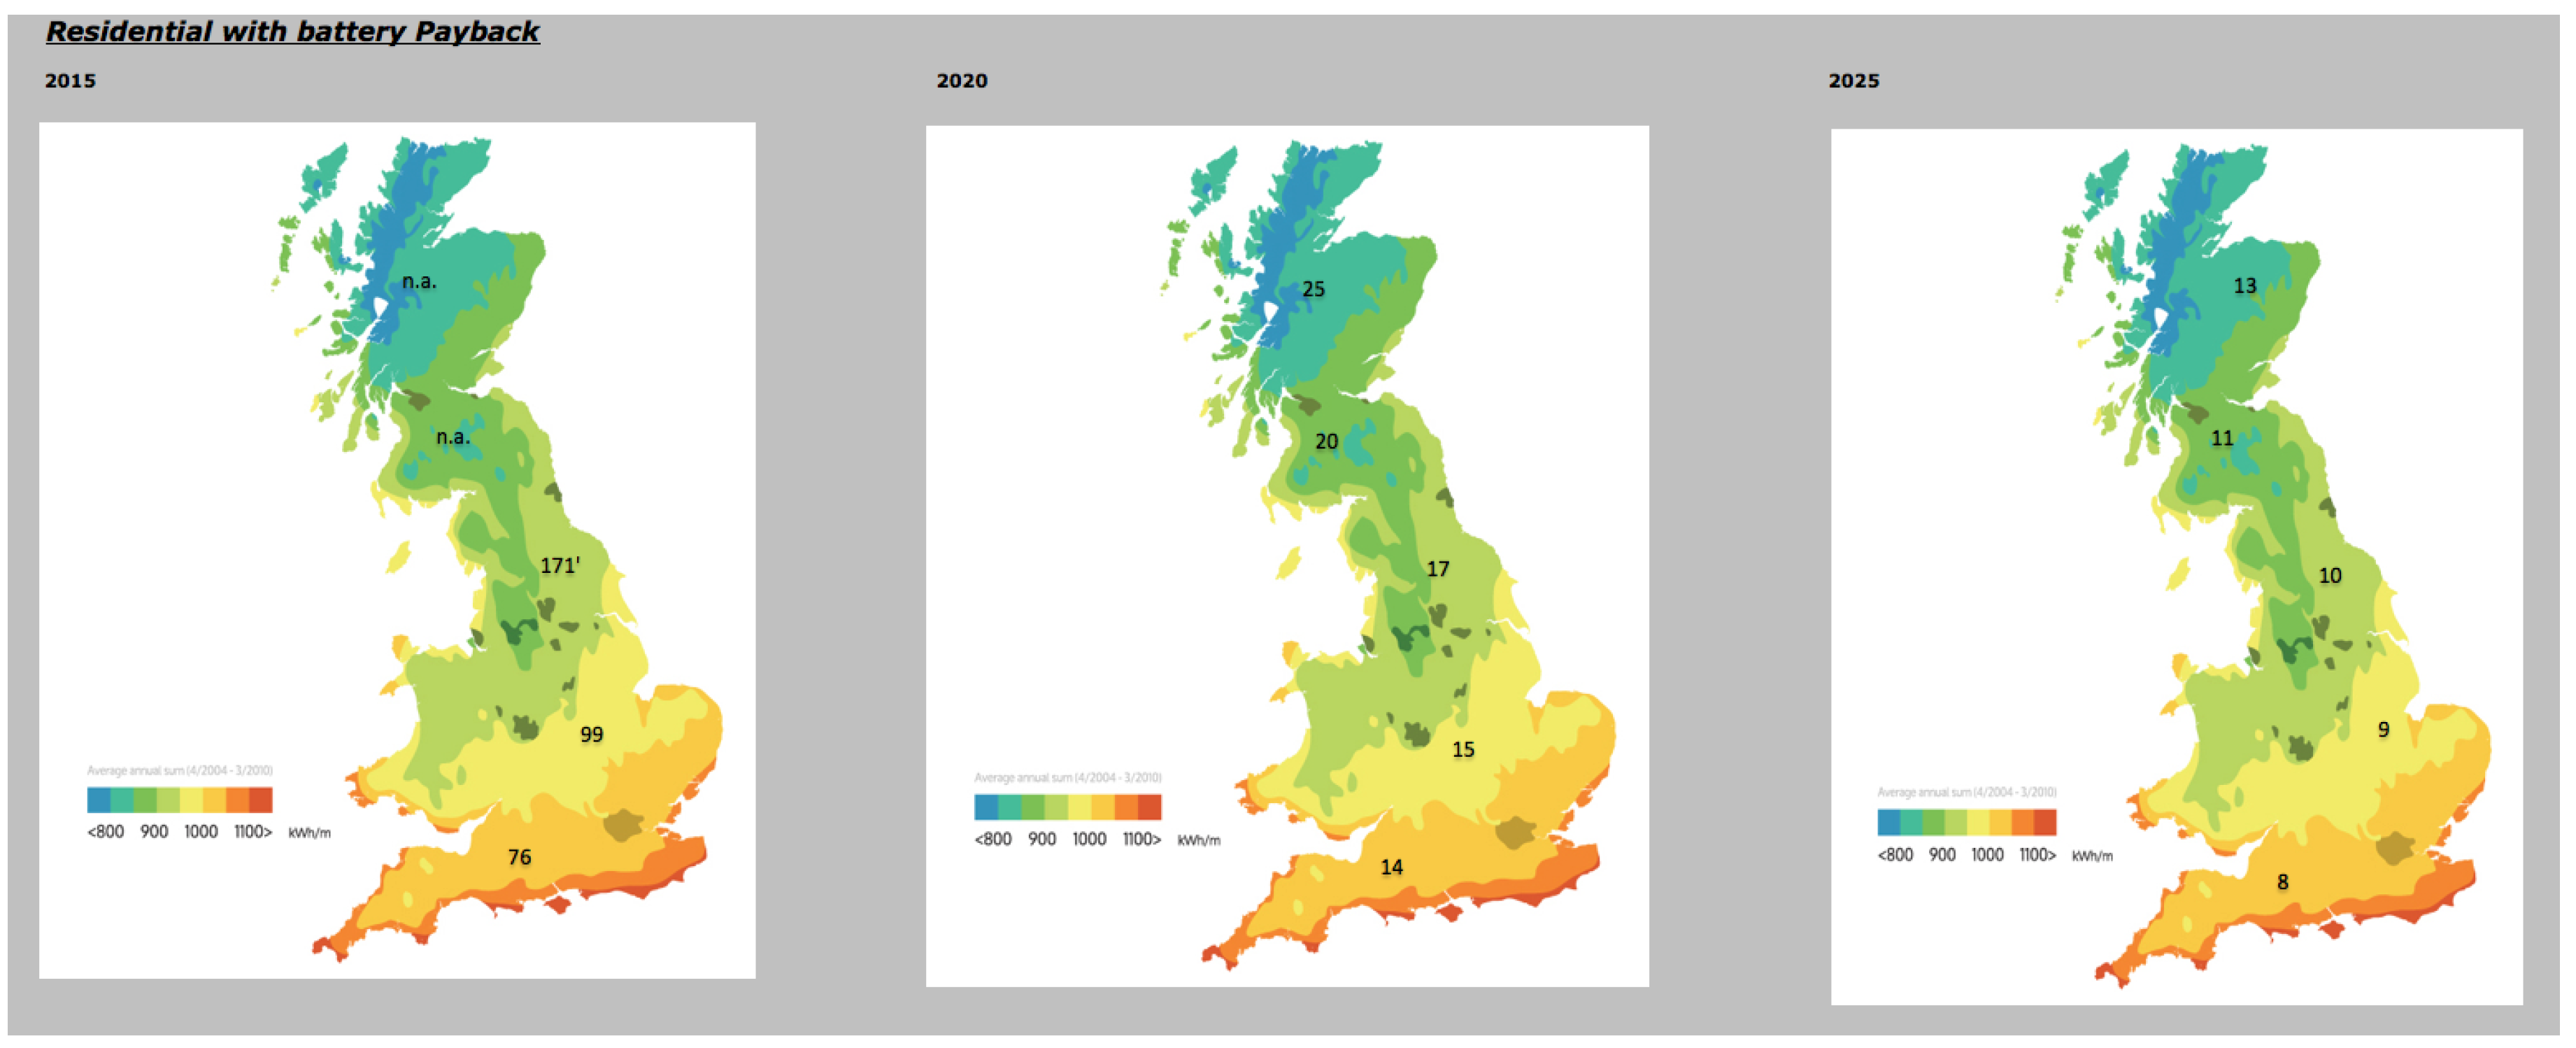
3.3. Residential Rooftop Payback Periods
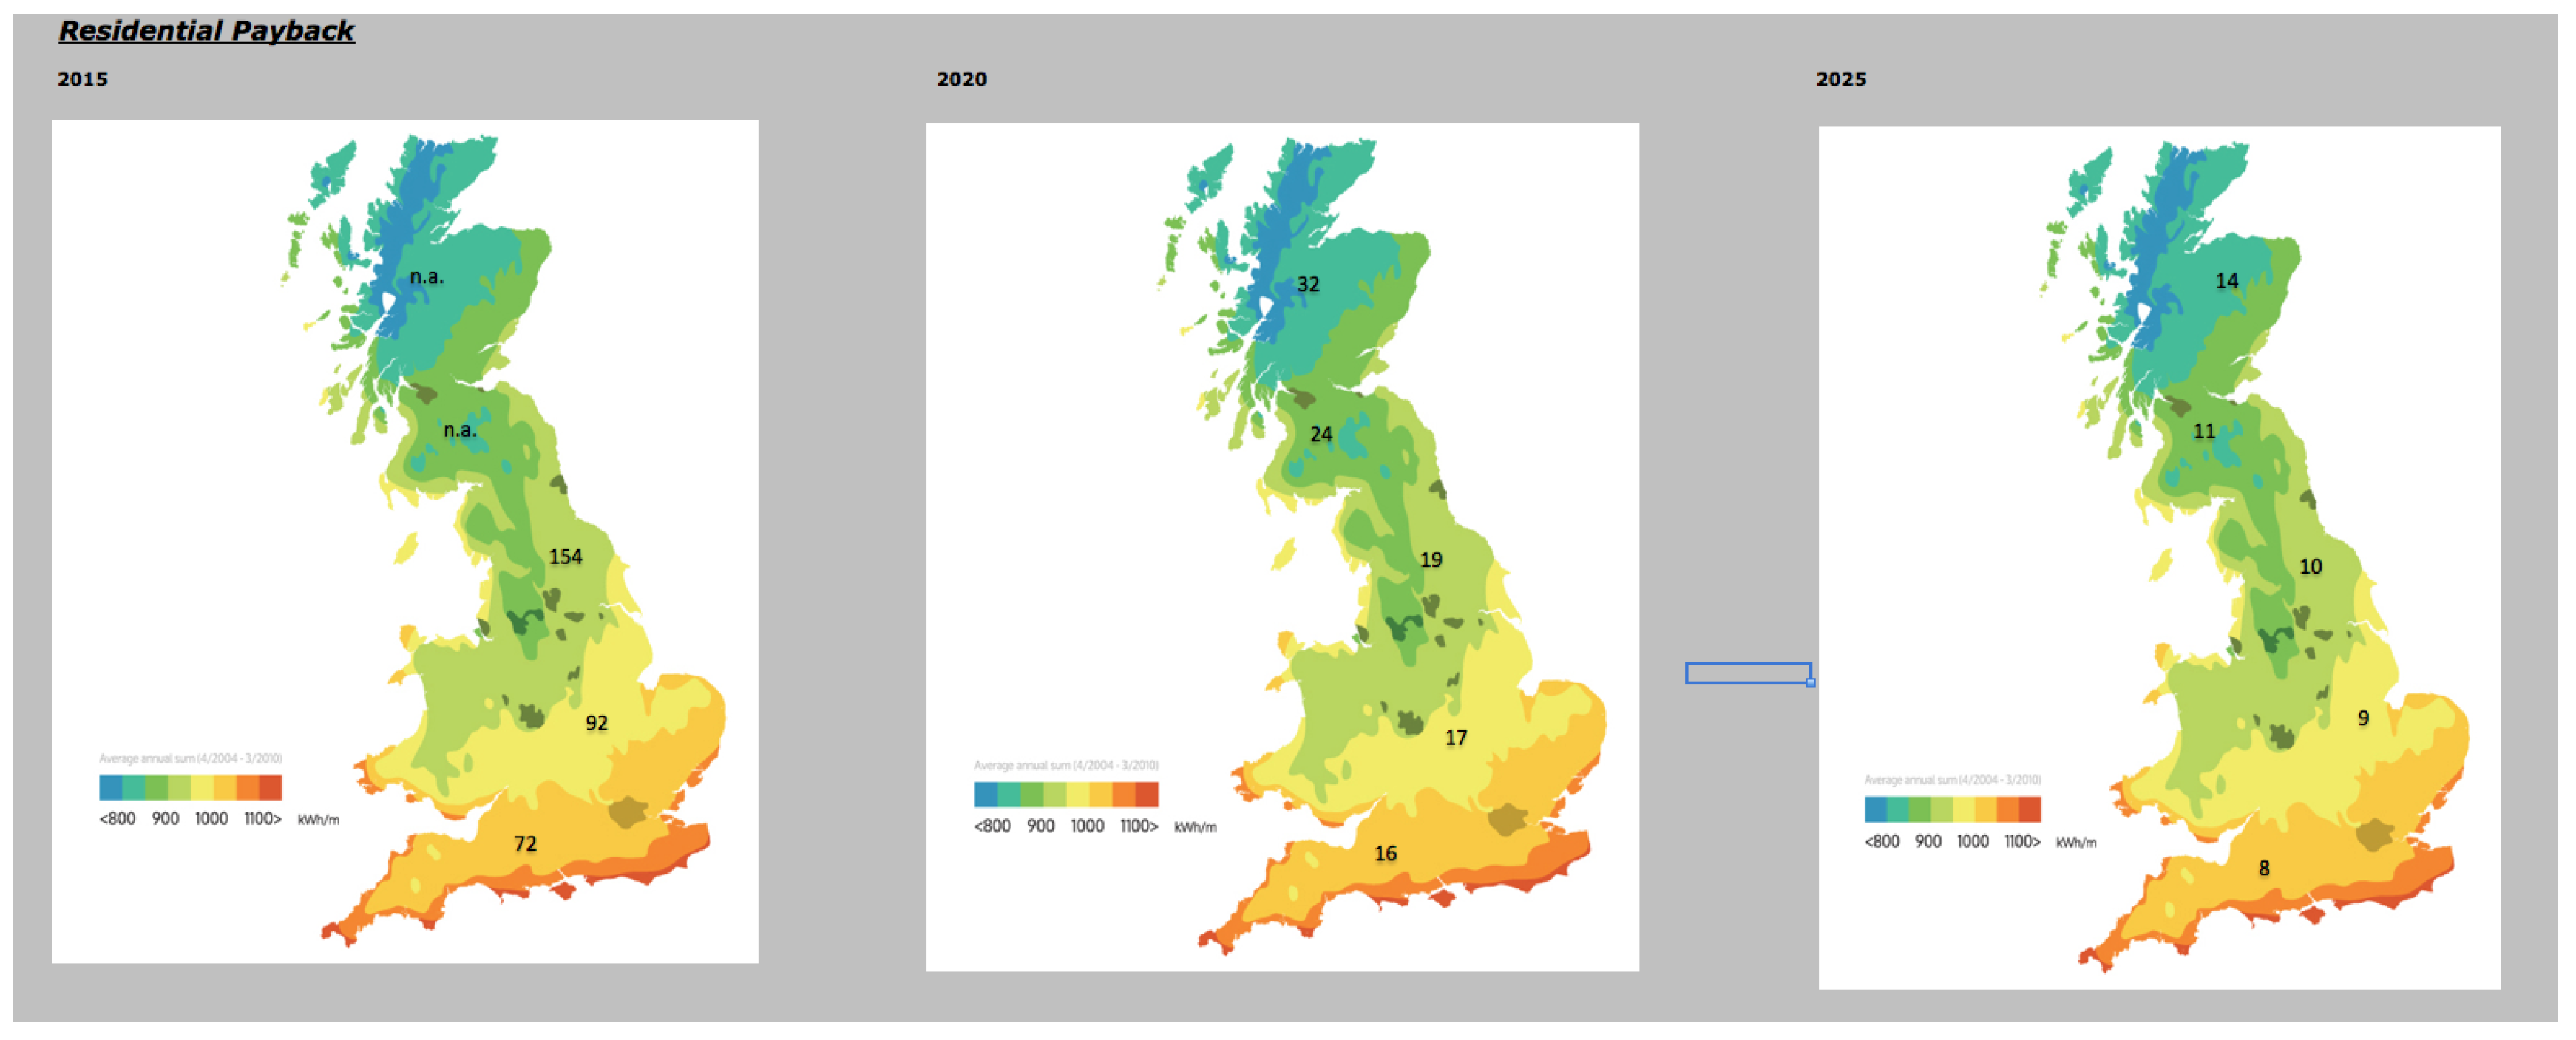
By 2020, paybacks of 16 years are reached in southern England, under our various assumptions (see
Figure 7). By 2025, payback periods are as low as eight years in southern England, and even in northern Scotland only 14 years. At these levels, residential solar may be viable without government help. These findings assume steadily rising consumption rates of home-generated solar power, and therefore bigger savings on avoided utility bills. If self-consumption remained at present rates of about 25%–30%, unsubsidised residential solar may struggle even in 2025 (see
Table 1). On the other hand, a lower cost of capital would bring forward parity without support. We assumed much higher residential financing costs, for example, than the bottom end of the 1%–12% range used by Britain’s National Audit Office [
24].
Figure 7.
Residential rooftop payback periods, number of years, 2015–2025.
Figure 7.
Residential rooftop payback periods, number of years, 2015–2025.
Table 1.
UK average payback period for unsupported residential solar, according to self-consumption ratio, 2015–2025.
Table 1.
UK average payback period for unsupported residential solar, according to self-consumption ratio, 2015–2025.
| 2015 | | | | | |
| Self consumption ratio | 100% | 75% | 50% | 25% | 0% |
| Payback period, years | 19 | 29 | 69 | (190) | (40) |
| 2020 | | | | | |
| Self consumption ratio | 100% | 75% | 50% | 25% | 0% |
| Payback period, years | 8 | 11 | 17 | 40 | (106) |
| 2025 | | | | | |
| Self consumption ratio | 100% | 75% | 50% | 25% | 0% |
| Payback period, years | 6 | 7 | 10 | 18 | 70 |
3.4. Solar Battery Pack Payback Periods
Our analysis of the economics of solar battery pack systems suggests that these could achieve payback periods of below 15 years in 2020 (see
Figure 8).
Figure 8.
Projected solar battery pack payback periods, number of years, 2015–2025.
Figure 8.
Projected solar battery pack payback periods, number of years, 2015–2025.
That is a little more competitive than our analysis of residential solar without batteries, reflecting higher self-consumption rates. Our modelling suggests payback periods of 10 years or less for solar battery pack systems across England and Wales by 2025, at which point financial support may no longer be needed.
4. Discussion
Solar PV is likely to be a critical technology in the 21st century. It is already a technology which is nearing maturity. At this stage, it makes sense that governments continue to support the industry until it is fully economic without subsidies. Progressive and predictable reductions in support over the next decade will help build a more mature, low-cost supply chain, while maintaining value for money and preventing developers from inflating prices. Getting the right support level is critical to driving sustained cost reductions.
The analysis presented in this study suggests that support for solar power in Britain can be cut progressively to zero over the next five to 10 years. The trick is finding the right balance, between driving efficiencies which create a new, low-margin business model, and killing a British solar industry which has export potential, particularly in finance and project development. Support for solar power to date has led to capacity increases which have cut costs as supply chains matured [
25]. The International Energy Agency showed that Britain now has one of the most cost-effective markets for solar systems, with lower costs than major markets including the United States, Japan and France [
2]. Public policy advisers such as the Global Commission on Economy and Climate have stressed that governments should reduce support for renewable energy progressively, but in a predictable way [
26].
Policymakers could reduce the impact of solar support on domestic power prices, by shifting some price-based support towards alternatives such as low interest rate credit, and subsidies for batteries. Britain’s Green Investment Bank, for example, has so far excluded solar power from loans of £1.6 billion for renewable energy. The government can support measures to optimise the grid integration of renewables, including the rollout of smart meters, and a more computerised grid, which uses digital technologies for faster, deeper, more responsive network communication and control. Near-term support for domestic solar battery packs, for example through grants or low-cost credit, could also aid a shift away from price-based support while preserving the economics of solar power.
This report shows a cost trajectory where both large-scale and rooftop solar will be able to survive increasingly without direct support over the next decade. Such a definition of support excludes wider policy measures which would indirectly benefit solar power, such as carbon pricing, or capacity payments for gas-fired power plants, which would support the grid integration of variable renewables. Such less visible support may be justified in the context of clear, un-priced and under-priced non-market benefits of solar power.
5. Methodology
Cost data were gleaned from a mix of interviews with leading companies and experts in the solar and battery space. Regarding projections, there is uncertainty about each of these factors and their values which can vary regionally and across time as weather patterns change and technologies evolve. Regarding technology change, and its impact on capital costs, the authors undertook unattributed interviews with five leading global manufacturers, and five solar developers operating in the UK. The results of these interviews were validated using the cost roadmaps of three listed companies: First Solar, Sun Edison and Trina Solar. Soft costs were based on interviews with leading installers. A similar process was followed to evaluate the prospects for commercially competitive batteries. The literature reveals that costs are falling, but with large uncertainties on past, current and future costs of the dominating Li-ion technology. In this study, interviews were conducted with the leading Asian manufacturers, on an unattributed basis. These interviews were validated with the publicly available cost roadmap of Tesla; third party research from investment banks such as UBS; and interviews with buyers of the battery technology, such as Germany’s Younicos.
These data were used to derive cost estimates using two approaches. Levelised cost of electricity (LCOE) analysis was used to determine the cost of power generation by large-scale, ground-mounted solar systems. Payback periods were calculated for commercial and residential systems. LCOE is a standard measure used globally to compare the costs of differing generation technologies, also used by institutional investors to determine the valuation of generation assets. However, it is not used by the average household when making investment decisions. Householders often think in terms of how long it takes to recover their upfront investment. Payback periods are similarly appropriate for commercial businesses which also think in these terms.
Under LCOE analysis, the costs for constructing and operating a plant over its lifetime are summed and divided by the amount of power that the plant produces. The resulting LCOE is expressed in pounds per KWh. The key inputs to calculating the LCOE are: capital costs, operations and maintenance costs (O&M); financing costs; fuel costs; and an assumed utilization rate for each area. The latter was determined based on so-called isolation rates. This study used insolation data from the UK Met Office. Such data show the amount of electricity that can be generated by an optimally positioned 1kW rated PV solar panel. For example, in Leeds a 1kW solar module should produce 825 kWh of electricity in a typical year whereas a module in Aberdeen only 700 kWh. To calculate the net present value of costs, we used a weighted average cost of capital (WACC) to discount revenues and expenses, as calculated below. The discount rate (WACC) is very important, because the rate reflects the riskiness of the investment, and small changes can lead to relatively large changes in investment returns. For simplicity, we assumed a WACC of 6.2%, which is in line with the UK government’s assumptions for large-scale solar power:
where
wd = Weight of debt proportion to total capital,
ws = Weight of equity proportion to total capital,
kd = Cost of debt,
ks = Cost of equity and
t = Corporate tax rate.
The study used payback periods for the economics of commercial and residential rooftop systems. The payback period is defined as the length of time it takes to recoup the upfront investment, based on annual savings as a result of reduced utility bills. To this it was assumed that consumer power prices would rise in line with the latest DECC projections (see assumed self-consumption rates below). Payback periods were calculated using the same analysis as for LCOE, including estimates for cost reductions in solar hardware and balance of systems over the next decade. In our LCOE and Payback Period calculations, we have assumed the following:
Module prices for large scale systems of £0.46 pence today falling to £0.24 in 2020 and then £0.22 in 2025;
Zero support for solar power generation; export tariff at the level of the wholesale power price;
Load factors of 9.3% to 12.5%, depending on latitude;
Increased efficiency across the whole solar value chain;
Cost of debt: 4% and cost of equity 6% (German levels);
Debt to equity ratios of 60:40 for large-scale and commercial solar, and 80:20 for residential;
The latest (October 2014) UK projections for residential, commercial and wholesale power prices, from the Department of Energy and Climate Change (DECC) [
27];
For roof-top systems, self-consumption rates for commercial users of 70%; for residential systems, 32% in 2015 rising to 45% in 2025; and 55% for residential systems with batteries;
Depreciation: 10 years for batteries, 25 years for solar panels.


