Article

Global Energy Development and Climate-Induced Water Scarcity—Physical Limits, Sectoral Constraints, and Policy Imperatives

by
Christopher A. Scott
1,2,* and
Zachary P. Sugg
2
1
Udall Center for Studies in Public Policy, University of Arizona, 803 E. 1st St., Tucson, AZ 85719, USA
2
School of Geography & Development, University of Arizona, ENR2 Building, 1064 E. Lowell St., P.O. Box 210137, Tucson, AZ 85721, USA
*
Author to whom correspondence should be addressed.
Energies 2015, 8(8), 8211-8225; https://doi.org/10.3390/en8088211
Submission received: 28 May 2015 / Revised: 5 July 2015 / Accepted: 27 July 2015 / Published: 5 August 2015
(This article belongs to the Special Issue Energy Policy and Climate Change)

Abstract

:
The current accelerated growth in demand for energy globally is confronted by water-resource limitations and hydrologic variability linked to climate change. The global spatial and temporal trends in water requirements for energy development and policy alternatives to address these constraints are poorly understood. This article analyzes national-level energy demand trends from U.S. Energy Information Administration data in relation to newly available assessments of water consumption and life-cycle impacts of thermoelectric generation and biofuel production, and freshwater availability and sectoral allocations from the U.N. Food and Agriculture Organization and the World Bank. Emerging, energy-related water scarcity flashpoints include the world’s largest, most diversified economies (Brazil, India, China, and USA among others), while physical water scarcity continues to pose limits to energy development in the Middle East and small-island states. Findings include the following: (a) technological obstacles to alleviate water scarcity driven by energy demand are surmountable; (b) resource conservation is inevitable, driven by financial limitations and efficiency gains; and (c) institutional arrangements play a pivotal role in the virtuous water-energy-climate cycle. We conclude by making reference to coupled energy-water policy alternatives including water-conserving energy portfolios, intersectoral water transfers, virtual water for energy, hydropower tradeoffs, and use of impaired waters for energy development.

1. Introduction

Globally, increasing demand for energy continues to outpace rates of population and economic growth [1]. The quest for sustainable energy futures will depend significantly on water-resource availability and quality impacts associated with energy development [2,3]. Both energy and water are inextricably linked to climate change, which tends to heighten the use of both resources [4] while increasing the variability of water availability for energy development, other human uses, and ecosystem processes. Drought and water scarcity in particular have direct effects for energy development [5,6], principally electrical power generation [7] but also the rapidly expanding production of biofuels [8]. The nexus between energy and water—both the water needed for energy development as described in this paper and energy for water pumping, conveyance, treatment, and other operations [9]—has important implications for climate change. For example, energy development and use generate greenhouse gases that significantly contribute to global warming. Additionally, adaptation to the effects of climate change [10] and mitigation of its anthropogenic causes are fundamentally centered on the use and management of energy and water—separately as resources and increasingly in tandem as the water-energy nexus [11].
Climate change and variability are now firmly linked to anthropogenic drivers via greenhouse gas emissions, in particular, carbon dioxide from a range of human activities including electricity generation and land use, the two processes we are concerned with in this paper. Policy-makers are increasingly called on to adopt and incentivize programs that mitigate CO2 while at the same time adapting to the effects of climate change [12]. In this context, the water-energy nexus plays a critical role in resource-use policy [13]. The availability and quality of water resources greatly influence energy options, and conversely, water management has an appreciable impact on CO2 emissions [14].
Water is required for a range of energy development processes. The environmental quality impacts of fossil-fuel development, e.g., petroleum, coal, and natural gas, are increasingly being factored into water-energy nexus assessments [15]. Here we focus on water use for: (a) hydroelectric and thermoelectric power generation, and (b) biofuel production (chiefly feedstock irrigation but also other life-cycle processes). Even with the technological shift from once-through cooling to evaporative cooling of thermoelectric generation, water consumption (depletion through evaporation) per unit of power generated represents an increasing demand on water resources. Additionally, irrigation is required for biofuel feedstocks (e.g., sugarcane or corn for ethanol and soy or rapeseed for biodiesel), and consumes significant amounts of water although some feedstocks are raised under rainfed conditions. In river basins with physically stressed water resources or in locations where water is allocated for other human uses (often with secure water rights) or environmental flows, energy demands for water are of growing concern [16,17].
Several regional and national assessments of water requirements for energy development have been published [9,18,19,20,21]. Yet, limited work has addressed key components of the water-for-energy challenge at the global scale [8,22,23]. Most recently, Spang et al. [8] developed a metric for water consumption for energy production portfolios including various fuel types, then used it to calculate the water-for-energy footprint for 158 countries. These data were normalized based on several other indicators in order to rank countries according to different metrics [24]. While useful for developing a comprehensive assessment of the consumptive use of water for a given country’s energy sector, such analyses are thus far temporally limited, providing a snapshot of water consumption for a given year. They should be augmented with current energy production trends including biofuels, analyses of technological innovation, and policy alternatives to address water-resource constraints. In order to develop a more complete picture, this paper quantitatively evaluates physical and sectoral (allocative) water scarcity resulting from thermoelectric generation and biofuels production trends at the global scale using current data, and identifies and assesses policy options to address these challenges. The goal of these analyses is to highlight current and future challenges with meeting water demands for energy generation.
This paper is organized as follows. Above, we have briefly framed the need to consider water and energy interlinkages in the context of climate change. While an increasing number of studies are available, most are constrained by regional or local focus or they are temporally limited. Next, we present our approach and methods for a global assessment of time-series trends of the water-resource use implications of electrical energy and biofuel feedstock irrigation. In the discussion section that follows, we consider the implications of climatic trends plus adaptive management and technological options to address these challenges. We identify and discuss “flashpoint” countries that are expected to face increasing constraints of water availability for energy development. Finally, we conclude with an assessment of policy alternatives for expanding energy requirements while also accounting for climate change and variability.

2. Methods and Data

The mapping and coupled energy-water resource analyses presented here are based on robust global datasets, specifically, 2010 electrical power and biofuel production and trends to 2020 from the U.S. Energy Information Administration [25], and freshwater availability and sectoral allocations from the U.N. Food and Agriculture Organization [26] and World Bank [27]. Newly available data on water consumption and life-cycle impacts of electrical generation [28] and biofuel production were also incorporated [29,30,31], including projections to 2020 for ethanol and biodiesel for several countries [32].
The cooling tower process for thermal electricity generation requires approximately 45 times lower withdrawals than once-through cooling [22]. Because cooling type for individual power plants globally is not widely reported, we estimated annual freshwater withdrawals for combined thermal and nuclear electricity based on both cooling tower and once-through technologies. We recognize that once-through cooling continues to be used in electricity generation, e.g., in some European countries, Canada, and U.S. (where once-through cooling has become less common since 1970). However, the results reported here for all countries are based on assumed cooling tower technology, which we derived by multiplying EIA generation values by a median withdrawal intensity of 3.8 m3 per MWh. This assumption results in estimates of freshwater withdrawals that are lower than actual, i.e., if data existed to accurately account for once-through cooling.
Projected future energy generation was based on compound annual growth rates (CAGR) (Equation 1) where V(t0) is the earliest available electricity generation value and V(tn) is the most recent value within the period 2000–2010. No CAGR was calculated for lack of adequate data if fewer than five years of generation data were available for a given country.
CAGR (t0, tn) = (V(tn)/V(t0))^(1/(tn-t0)) – 1
Irrigation water applied for ethanol feedstock production was calculated by multiplying EIA ethanol production data by country-specific irrigation quantity coefficients for ethanol-producing nations obtained from de Fraiture et al. [33]. We also sought to include estimates of life-cycle water use associated with specific ethanol and biodiesel feedstocks. However, there is no robust global database on water use for the cultivation and processing of the many different biofuel feedstocks, although some estimates of “water consumption for energy production” [8] and life-cycle water use [29] have been derived for a few feedstocks. Use of water coefficients for biofuel production is further complicated by the fact that water consumption of biofuel feedstocks varies widely depending on the particular feedstock and climatic conditions [34]. For example, while soybeans under rainfed conditions consume no “blue water” as irrigation [34], in locations where they are irrigated, water consumption estimates can reach up to 844 m3/GJ [8]. Additionally, while some biodiesel feedstocks are grown under rainfed conditions, water is still used in the total life cycle during the processing stage. Because robust data on life cycle water usage for the various biodiesel feedstocks are not available, we assumed a minimum 0.031 l/MJ of water for biodiesel processing of all feedstocks under all climates of using the estimate reported in Spang et al. [8]. This represented biodiesel production using feedstocks grown under rainfed conditions, imported from other countries (as in the United Kingdom and South Korea), or from sources such as recycled cooking oils that are not primarily produced via large-scale agricultural production. Because the USA’s soybean feedstocks for biofuels are increasingly produced under irrigated conditions, a higher coefficient of 21.71 L/MJ was used for USA biodiesel [29]. Utilizing water use coefficients obtained from Mulder et al. [29] and Spang et al. [8], we assumed ethanol feedstocks (corn and sugarcane) were irrigated, with the exception of Canada. For Brazil and the USA, we present a range of values (discussed below).
The derived estimates of sectoral withdrawals for combined thermal and nuclear electricity generation and for biofuels production (from EIA data) were then taken as a percentage of total available freshwater for the industrial and agricultural sectors, respectively, found in FAO and World Bank databases, just a year apart from EIA energy data. Electricity generation, water withdrawal and availability, and biofuel production data were compiled into a GIS geodatabase for mapping.

3. Results

3.1. Spatial and Temporal Trends in Energy Generation

Presenting multiple dimensions of energy-generation analyses in a single graphic each for thermoelectric generation and biofuels production results in figures that require some explanation. Recent (2000–2010) growth rates in total electricity production comprising conventional thermoelectric, non-hydropower renewables, hydropower, and nuclear generation for 199 countries are presented in Figure 1, which also shows projected increases for the period 2010–2020 in total thermal electricity generation. Additionally, the percentage mix of fuel ethanol to total biofuel production for those countries producing more than 5000 barrels (795,000 liters) of biofuels per day in 2010 is shown in Figure 2, which also shows recent (2000–2010) growth rates in total biofuel production.
Figure 1. Growth in electricity generation by country (total, nuclear, hydropower, non-hydropower renewable, and conventional thermal), 2000–2010; and percentage increase in conventional thermal electricity generation, 2010–2020.
Energies 08 08211 g001
The water requirements for current and future thermoelectric generation and biofuels production, as detailed in the Methods section above, are presented here. Hydropower was not assessed due to inherent methodological difficulties in attributing evaporative losses resulting solely from power generation by multi-purpose reservoirs [35]. Additionally, non-hydropower renewables such as solar and wind energy, use minimal quantities of water (with the exception of concentrated solar and geothermal using steam cycles) and were not explicitly assessed here. Thus, our analysis focuses on water requirements for conventional thermal and nuclear generation.
Finally, water demand for biofuels was attributed to feedstock production (with irrigation volumes for sugarcane and ethanol reported separately by major producing countries), in addition to water for processing associated with life cycle and consumptive water use analyses. Based on figures reported by de Fraiture et al. [33], fuel ethanol feedstocks were assumed to be irrigated except in the case of Canada, where corn and wheat are not typically irrigated; instead we applied an estimate of the non-irrigation water use for corn ethanol from Mulder et al. [29]. However, because the amount of water used for corn cultivation for ethanol varies widely from state to state in the USA [36], and between the major sugarcane growing regions in Brazil [37], we present a range of estimates for water consumption for ethanol feedstocks for those two countries that included lower bounds of zero irrigation (Table 1). Although not all sugarcane cultivation is irrigated in Brazil, the percentage is increasing, especially in the northeast region [37] and particularly as a result of drought and related climate effects. Because robust country-level data are not available for biodiesel feedstocks, we assumed a minimum amount of water use for all biodiesel processing for all countries except for irrigated soybeans in the USA [38] as mentioned.
Figure 2. Share of ethanol in total biofuel production, 2010; and growth in total biofuel production.
Energies 08 08211 g002

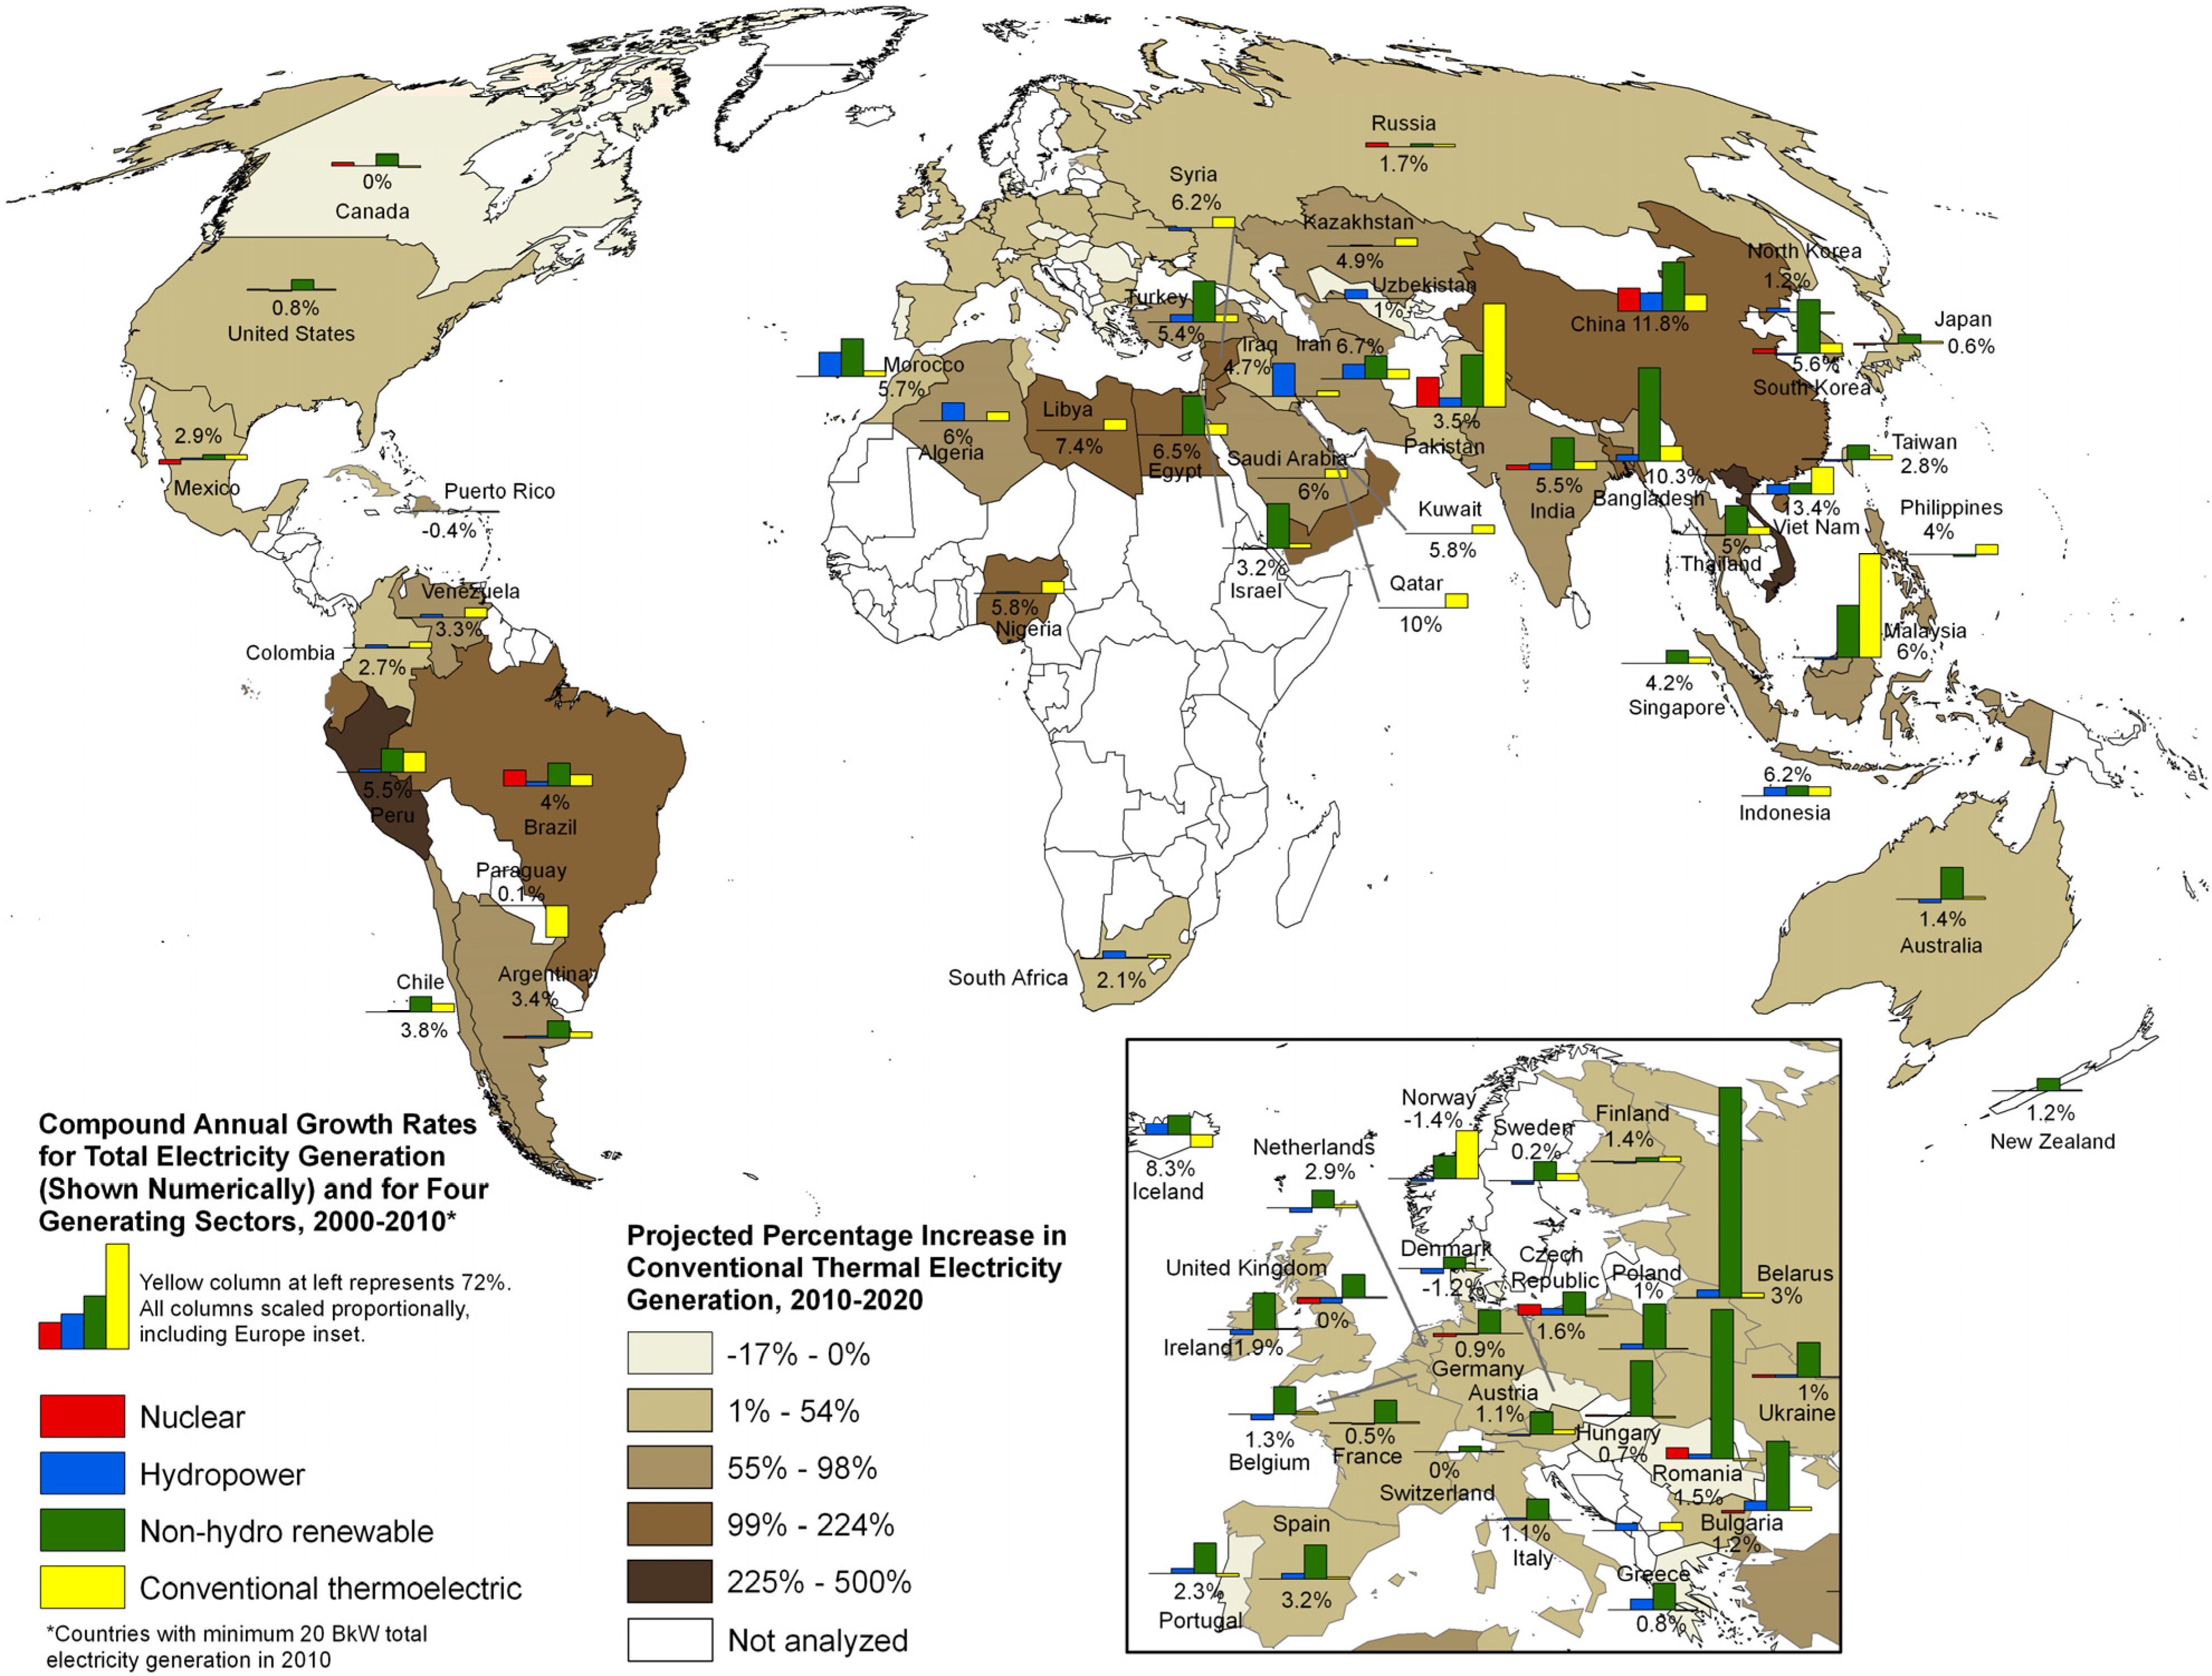
3.2. Growth in Thermal Electrical Production

With increasing energy development comes increasing water demand. Results shown in Figure 1 indicate that most industrialized Western nations have exhibited low or flat growth rates in conventional thermoelectric power generation along with concurrent rapid growth in the development of non-hydropower renewable energy. This is especially true, for example, in Western European countries, consistent with renewable energy targets adopted in EU directives and individually by EU member states [39]. Most of the recent growth in thermoelectric power generation at the global level has come from countries in the Middle East, East and Southeast Asia, and South America. The BRIC countries show diverse energy portfolios; Brazil, Russia, India, and especially China show positive growth rates in all four categories of electricity generation. At 3595.5 billion kWh in 2011, China is orders of magnitude greater than most other countries (data not shown). While China and USA currently have comparable total net electricity generation, USA has a CAGR of only 1% based on the period 2000–2010. By contrast, the CAGR for Chinese thermoelectric generation is 11.4%.
Table 1. Water withdrawals for thermoelectric and nuclear power generation as fractions of industrial water withdrawals; and total water withdrawals for energy (thermoelectric and nuclear power generation, and biofuels feedstock irrigation), 2010 and 2020. Water withdrawals are defined as diversions from freshwater bodies (FAO AQUASTAT) [26], not depletion through evaporation. Color coding shown at bottom of table.
CountryCurrent Thermo & Nuclear Water Withdrawal/Industrial Water Withdrawal [%, Fraction], 2010Future Thermo & Nuclear Water Withdrawal/Industrial Water Withdrawal [%, Fraction], 2020Current Irrigation Withdrawals for Ethanol/Agricultural Water Withdrawals [%, Fraction], 2010 *Current Thermo & Nuclear Water Consumption + Lifecycle Water (Ethanol & Biodiesel)/Total Internal Renewable Water [%, Fraction], 2010 **Future Thermo & Nuclear Water Consumption + Lifecycle Water (Ethanol & Biodiesel)/Total Internal Renewable Water [%, Fraction], 2020 **
Australia32.6%37.3% 0.1%0.1%
Brazil2.8%6.2%0%–7.7%0.01%–0.3%0.02%–0.4%
Canada2.7%2.8%0%–8.9%0.0%0.0%
China10.0%28.4%0%–1.6%0.4%2.2%
Egypt11.8%24.2% 15.7%32.3%
India17.1%29.1%0%–0.2%0.1%0.3%
Mexico10.7%14.8% 0.1%0.2%
Pakistan15.7%22.4% 0.2%0.4%
S. Korea57.4%101.4% 1.7%3.8%
Saudi Arabia113.2%202.5% 20.1%35.9%
South Africa120.4%148.9%0%–0.1%1.2%n/a
Thailand18.6%30.6%0%–4.7%0.2%0.6%
Turkey12.9%21.3% 0.1%0.2%
UK28.9%28.2% 0.5%0.5%
USA6.3%6.8%0%–11%0.42%–0.8%0.6%–1.1%
Venezuela21.6%40.1% 0.0%0.0%
[Value: ]>10%>10%>10%>10%>10%
[Value: ]>30%>30%>30%>30%>30%
* Lower values assume no irrigation of ethanol feedstock. Upper values assume some irrigation based on estimates reported by de Fraiture et al. (2008) [33]. ** Lower values for Brazil and USA assume water consumption for ethanol processing but no irrigation of feedstock.

3.3. Increasing Water Demands for Conventional Electricity Generation

This anticipated global increase in electricity generation from conventional, i.e., non-renewable, sources will be accompanied by greater water demands. But while these nations are all expected to expand conventional thermal electricity generation capacity, they differ in the amount of overall industrial water usage that can and will be devoted to such development. The results shown in Table 1 indicate that all major countries with the exception of the UK are projected over 2010–2020 to increase the fraction of industrial water withdrawn for use in nuclear and conventional thermoelectric power generation. For example, in China, in 2010 water withdrawn for nuclear and conventional thermoelectric power generation accounted for an estimated 10.0% of all industrial water withdrawals and is projected to increase to 28.4% by 2020. India may also increase from 17% to almost 30% of its industrial water supply for conventional thermal electricity by that same future date. In contrast, water withdrawals for these same uses only account for 2.8% of Brazil’s total industrial water withdrawals in 2010 and are expected to increase to about 6% by 2020. This is related to the significant contribution of hydropower to Brazil’s overall portfolio.
Of the 16 major energy-producing nations included in Table 1, all but Brazil, Canada, and USA were devoting at least 10% of total industrial water available to nuclear and conventional thermoelectric power generation, with four using more than 30%, and South Africa and Saudi Arabia each over 100%. In this context, it should be noted that seawater used for cooling is not included in the current definition of industrial withdrawals of (fresh) water. Nevertheless, use of seawater and other waters not suitable for irrigation or other human purposes, e.g., inland brackish water, “produced” water from oil and gas development, effluent, etc., will increasingly need to be used in energy generation and other industrial processes.

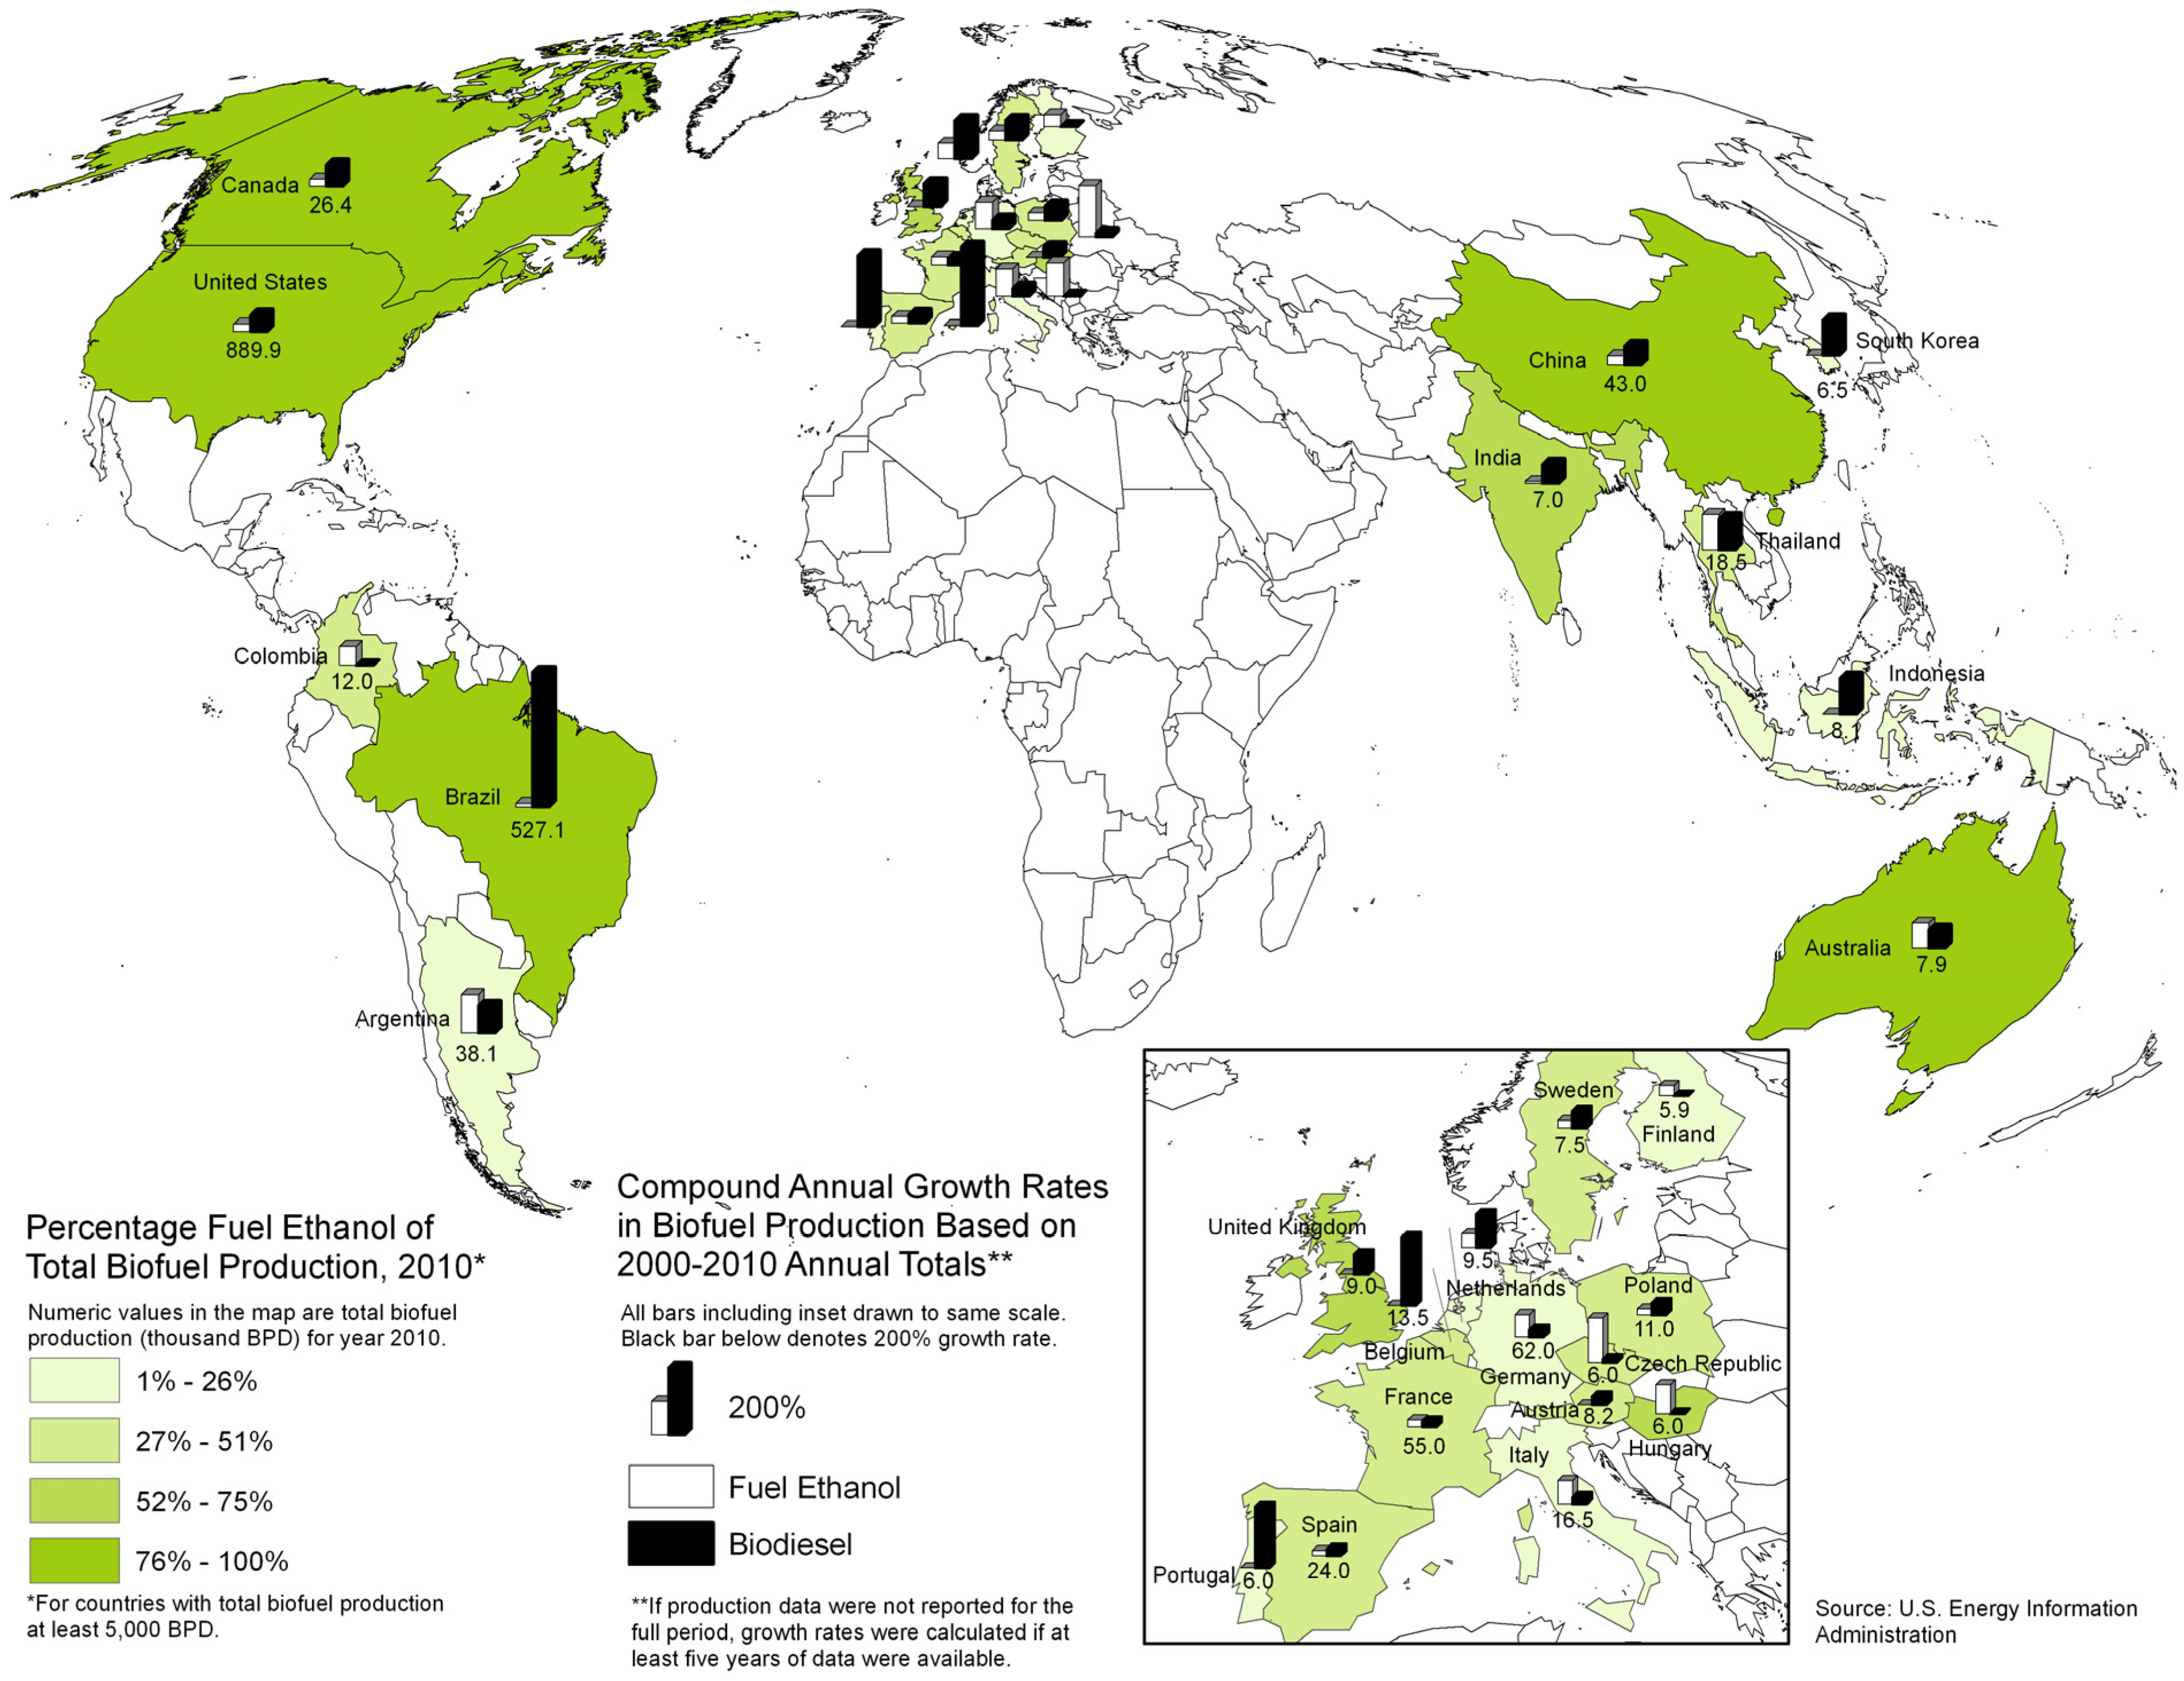
3.4. Growth Trends in Water for Biofuel Production

The major fuel ethanol producing countries as shown in the map—USA and Brazil at 889.9 and 527.1 thousand BPD, respectively—were by far the largest producers of total biofuel (fuel ethanol and biodiesel) in 2010. At least 76% is fuel ethanol, not biodiesel. The next highest is China at 43.0 thousand BPD. For the purposes of this analysis, our results quantify the relative proportions of agricultural water withdrawals used to irrigate ethanol feedstocks. In Table 1 we report the current (2010) withdrawals for irrigation for ethanol as a percentage of total agricultural water withdrawals for each country. None of the countries is above 10% (one of our thresholds) except for the USA, the world’s largest ethanol producer, where large volumes of irrigation water are used for corn production as an ethanol feedstock [40], especially in more arid western states [36]. Irrigation requirements for corn per liter of ethanol produced vary widely geographically, from 5 L L–1 in Ohio to 2138 L L–1 in California [36]; thus, the relative share of agricultural water devoted to corn may be much lower at a state or regional scale. The second largest producer of biofuels, Brazil, applies less water than the USA, 7.7%, for irrigating energy feedstocks because sugarcane is largely rain-fed. While growth in biodiesel production has been rapid in recent years in Brazil, ethanol still comprises by far the larger share of total biofuel production.
We also estimated the future amount of total agricultural water devoted to ethanol crop production based on recent trends. These estimates assume that total agricultural water withdrawals do not begin increasing. This is based on data showing that total freshwater withdrawals for agriculture have remained steady or have not increased appreciably during the period 2002–2011 for the countries shown in Table 2, with the exceptions of India and Saudi Arabia. We also assume that the recent rates of expansion of energy crop acreage requiring irrigation continue. While in 2010 the irrigation requirements for ethanol feedstock production were relatively low, fuel ethanol production in these major producing countries has increased although less rapidly than in earlier decades. For example, in USA the contribution of ethanol to the renewable fuels standard is near its maximum while other biofuel feedstocks do not yet have appreciable market share. Additionally, the European Union has cut back its demand for biofuels in order to minimize impacts on developing countries. With uncertainty in energy security coupled with climate change impacts on energy demand and water availability, however, these feedstocks may demand a markedly greater proportion of the total water available for agriculture. Applying a 10% reduction in total water available for agriculture due to effects of climate change while assuming the percentage of all available agricultural water applied for ethanol feedstock cultivation remains the same, Canada and the USA would devote 10% and 12% of all agricultural water to ethanol feedstock cultivation, respectively. If we apply a further reduction due to allocative scarcity (i.e., other sectors adapting to water scarcity by reallocating water currently used in agriculture), totaling 25% reduction, the percentage of all agricultural water applied for ethanol feedstock production in the USA increases to 15%, Canada to 12%, and Brazil to 10%. It should be noted that drought conditions in California and Australia, for example, exemplify how reductions in water allocated to agriculture frequently result in such drastic cuts.
Table 2. Increases in carbon dioxide emissions, agricultural freshwater withdrawals, and irrigation freshwater withdrawals based on reported data (FAO AQUASTAT) [26]. Color coding shown at bottom of table.
CountryCO2 Emissions Increase [%/yr], 1999–2009Total Freshwater Withdrawals Increase [%/yr], 2002–2011Agricultural Freshwater Withdrawals Increase [%/yr], 2002–2011Industrial Freshwater Withdrawals Increase [%/yr], 2002–2011
Australia2.1%0.0%0.0%0.0%
Brazil1.4%–0.2%–1.6%–0.5%
Canada0.0%0.0%0.0%0.0%
China8.8%0.6%–1.4%3.7%
Egypt5.6%0.0%0.0%0.0%
India5.6%2.5%2.3%6.1%
Mexico1.6%1.1%1.0%0.8%
Pakistan4.9%0.7%0.6%–9.6%
S. Korea2.5%0.0%0.0%0.0%
Saudi Arabia6.7%3.7%3.5%15.6%
South Africa3.0%0.0%0.0%0.0%
Thailand3.3%0.0%0.0%0.0%
Turkey3.5%–0.5%–0.7%0.5%
UK–1.2%–2.0%–0.2%–5.6%
USA–0.4%0.1%–0.2%0.4%
Venezuela0.7%0.0%0.0%0.0%
[Value: ]>1% /yr>1% /yr>1% /yr>1% /yr
[Value: ]>3% /yr>3% /yr>3% /yr>3% /yr
We also combined 2010 water consumption for nuclear and thermoelectric electricity generation with lifecycle water use for all biofuels for each country and report as a percentage of total internal renewable water (Table 1). Egypt and Saudi Arabia are highlighted as already using a relatively high percentage (>10%) of freshwater resources. As shown in the far right column of Table 1, assuming growth rates continue, these two countries, with Thailand and USA added, project to withdraw an increasing percentage of freshwater for these combined purposes.

4. Discussion

It is evident that water withdrawals for energy production are increasing, a challenge that poses difficult policy questions for climate adaptation and carbon mitigation, as well as for the water-energy nexus as a management tool to meet future demands for these resources. While our analysis presents conservative estimates of water withdrawals, it is evident is that: (a) water demands for energy are increasing, (b) few robust estimates exist, (c) climate impacts are expected to exacerbate current and future trends, and (d) water and energy planners have taken little notice of these trends at least until very recently. We compare the results reported here to previous related work and then briefly demonstrate the implications of these results for several “flashpoint” countries.

4.1. Climate Adaptation in the Water and Energy Sectors

The principal climate-change processes that are projected to intensify globally—warming temperature and increasing variability of precipitation resulting in drought and flood extremes [12]—drive increased demand for energy and water separately as resources, and via nexus effects that each exerts on the other. Urban adaptation to climate change, for example, tends to raise electricity requirements for (a) air-conditioning resulting from warming, (b) pumping and infrastructure management under conditions of both drought and flooding, and (c) redundant power supplies in transportation, emergency response, and medical systems planned for under conditions of power-grid tripping or more catastrophic failure. Cities are also implementing a range of green-infrastructure interventions to address urban heat island effects of warming, e.g., urban water bodies and landscaping vegetation, which tend to raise water diversions and consumption. In agricultural systems, climate change has a multiplier effect for water and electricity demand as well as adaptive response—that is, warming temperatures significantly increase water requirements for crop growth that can be met through increasing irrigation applications, which in turn can increase power demand for pumping and reduce hydropower generation from storage reservoirs as infrastructure operators are forced to decide on tradeoffs among multiple uses of water. Alternately, as considered above, agriculture may experience allocative water scarcity, resulting in lower yields, reduced area planted, and in general, loss of output, financial returns, and farm labor.
Perhaps more significant, however, are the carbon implications of conventional fossil fuel-based generation of electricity. The first column in Table 2 shows rapidly escalating CO2 emissions at the country and global levels, for which a leading cause is the rising demand for electricity. The IPCC [12] indicates that economic growth is a more potent driver than population growth alone. Heightened emissions in turn translate into warming and a speeding up of the hydrological cycle with greater variability in drought and flood cycles. Carbon-mitigation efforts aiming to decarbonize economic activity and future growth consider alternative fuels, including hydropower and biofuels among other sources—all of which portend future increases in water consumption.

4.2. Relevance to Other Estimates of Intensity of Water Demand for Energy

As Spang et al. [8] point out, there is a global shortage of detailed estimates of the water consumption of energy generation. Still, to interpret the results reported here on geographic water availability on a per-country basis, it is helpful to consider how they relate to recent work in a similar vein. In particular, Spang et al. [8] developed the first country-level comparison of water consumption for fuels and electricity production using a derived metric of ‘water consumption for energy production’. They calculated water consumption for production of various sub-types of fossil, nuclear, and biomass fuels and then applied them to the global scale, generating national energy portfolios for 158 countries. In their companion paper [24], they normalized these earlier per-country water consumption results by various other indicators (GDP, population, total energy production, and regional water availability). The results reported here expand on this approach, using more recent data as inputs (2010) and by examining temporal trends—in the form of compound annual growth rates—rather than a single snapshot in time, as was done in other previous studies [20,21,41,42]. Based on the results described above, we have identified several flashpoint countries that warrant further discussion.

4.3. Comparative Analysis of Flashpoint Countries

We observe increasing water demands for conventional and nuclear electricity generation at alarming levels for several countries. As shown, at least 13 countries are already using a relatively high percentage—10% or more—of the total industrial water withdrawals for these purposes. Many of the very countries projected to increase thermoelectric generation are arid and already using relatively high amounts of freshwater resources for these power sources. Surprisingly, we find that a few countries, e.g., Saudi Arabia and South Africa as shown above, already appear to be diverting more water for thermoelectric and nuclear power generation than the total reported industrial water withdrawals. Our analysis does not account, however, for dry cooling systems, e.g., for coal-based generation as increasingly implemented in South Africa. The results for Saudi Arabia may seem counterintuitive, but Spang et al. [24] made a similar observation that both the United Arab Emirates and Qatar were using over three times the total amount of water naturally internally available in those countries.
We find a rapid expansion in recent years of irrigation of ethanol crops in the U.S. and associated water use. Upper bound estimates place Brazil, Canada, and the USA at close to 10% of total agricultural water applied to ethanol crop production. If recent growth rates in ethanol crop production under irrigation were to continue, the associated water withdrawals would escalate to unrealistic levels. Therefore, planted acreage will not increase indefinitely. However, even a more modest gradual increase would be accompanied by an increase in the use of irrigation to intensify production in certain regions, depending on climatic conditions. This appears to be the case for Brazilian sugarcane production. Additionally, while we assumed soybean production for Brazilian biodiesel was cultivated under rainfed conditions, FAO (AQUASTAT) [26] reports that 624,000 ha were irrigated in 2006; 11.7% of all irrigated cropland. Increases in the production of biofuels based on irrigated feedstocks are highly concerning because, as others have pointed out, biofuel feedstock cultivation is the most water-intensive compared to other fuel sources [8]. Chiu et al. [36] observed that the continued expansion of corn cultivation for ethanol in the Great Plains and Western USA is likely to exacerbate the expected water challenges in those regions. Mulder et al. [29] analysis of water use efficiency led them to conclude that “the development of biomass energy technologies in scale sufficient to be a significant source of energy may produce or exacerbate water shortages around the globe and be limited by the availability of fresh water.”

5. Conclusions

We have assessed current and future trends in energy production, specifically electricity generation and biofuel feedstocks and processing, in relation to the consumption of water under changing climatic conditions. Despite ongoing energy diversification, fossil fuels remain the principal energy source and will for some time to come. Policy options to address these challenges can be difficult and complex [43] and are often overlooked in sectorally focused planning [44]. Technology enhancement and the means to spur innovation are crucial choices [45]. Technological change tends to be most dynamic in countries with low installed capacity, which can allow for leap-frogging in the adoption of technologies. However, access and cost to new technologies can be formidable challenges that the global community must address, through funding of adaptation tied to verifiable benchmarks. Particularly for gains in efficiency, technology substitution has already resulted in progress. While this allows for better input-output conversions, e.g., reducing the coefficient values used and cited above, rebound and take-back effects [46] that tend to increase, instead of limiting resource use, must be explicitly addressed through programmatic interventions, incentives for conservation tied to efficiency, and low-carbon adaptive strategies.
Adaptation of water use under climate change and the implications this holds for energy demand are often not explicitly considered in climate or energy policy. Various coupled energy-water policy measures have been identified. These include water-conserving energy portfolios as described, e.g., in the United States by Scott et al. [13]. Such options will be increasingly adopted, given the financing and public-resistance pressures against large, new energy and water infrastructure. We have referred above to allocative water scarcity, yet intersectoral water transfers can be used to enhance energy production while intensifying agriculture (invariably the source of water transferred) and assuring food security. The long-distance conveyance of energy through electricity grids allows for generation that can be distant from the location of acute water scarcity—an example of virtual water for energy. Policy-makers must be cognizant the reverse does not occur, i.e., locations with adequate water for power generation must not convey electricity from generation sources in water-scarce locations, even though financial advantages for such virtual exchange may exist. The use of impaired waters (effluent, saline and brackish waters) for energy production will become increasingly common, just as seawater is used for thermoelectric cooling. Finally, hydropower is a unique water-energy nexus technology and policy domain in which tradeoffs must be explored [47] and rights and regulations must be explicitly accounted for [48]. As with the other options discussed above, integrating technology and policy options to address water, energy, and climate challenges in an integrated manner is above all a question of institutional arrangements.

Acknowledgments

The authors gratefully acknowledge the support of the Inter-American Institute for Global Change Research, via project CRN3056, which is supported by the US National Science Foundation (NSF) Grant No. GEO-1128040; NSF Grant DEB-1010495; and the Morris K. and Stewart L. Udall Foundation. The comments received from three anonymous reviewers were invaluable in improving the analyses.

Author Contributions

Christopher Scott conceived of the research and undertook initial data exploration. Zachary Sugg contributed significantly to the data analysis and interpretation of results. Both authors worked together on the discussion and conclusions.

Conflicts of Interest

The authors declare no conflict of interest.

References

  1. Chu, S.; Majumdar, A. Opportunities and challenges for a sustainable energy future. Nature 2012, 488, 294–303. [Google Scholar] [CrossRef] [PubMed]
  2. Ackerman, F.; Fisher, J. Is there a water–energy nexus in electricity generation? Long-term scenarios for the western United States. Energy Policy 2013, 59, 235–241. [Google Scholar] [CrossRef]
  3. Rio Carrillo, A.M.; Frei, C. Water: A key resource in energy production. Energy Policy 2009, 37, 4303–4312. [Google Scholar] [CrossRef]
  4. Shah, T. Climate change and groundwater: India’s opportunities for mitigation and adaptation. Environ. Res. Lett. 2009, 4, 035005. [Google Scholar] [CrossRef]
  5. Hightower, M.; Pierce, S.A. The energy challenge. Nature 2008, 452, 285–286. [Google Scholar] [CrossRef] [PubMed]
  6. King, C.W.; Holman, A.S.; Webber, M.E. Thirst for energy. Nat. Geosci. 2008, 1, 283–286. [Google Scholar] [CrossRef]
  7. Van Vliet, M.T.H.; Yearsley, J.R.; Ludwig, F.; Vögele, S.; Lettenmaier, D.P.; Kabat, P. Vulnerability of US and European electricity supply to climate change. Nat. Clim. Chang. 2012, 2, 676–681. [Google Scholar] [CrossRef]
  8. Spang, E.S.; Moomaw, W.R.; Gallagher, K.S.; Kirshen, P.H.; Marks, D.H. The water consumption of energy production: an international comparison. Environ. Res. Lett. 2014, 9, 105002. [Google Scholar] [CrossRef]
  9. Siddiqi, A.; Díaz Anadón, L. The water energy nexus in Middle East and North Africa. Energy Policy 2011, 39, 4529–4540. [Google Scholar] [CrossRef]
  10. Chandel, M.K.; Pratson, L.F.; Jackson, R.B. The potential impacts of climate-change policy on freshwater use in thermoelectric power generation. Energy Policy 2011, 39, 6234–6242. [Google Scholar] [CrossRef]
  11. Scott, C.A. The water-energy-climate nexus: Resources and policy outlook for aquifers in Mexico. Water Resour. Res. 2011, 47, W00L04. [Google Scholar] [CrossRef]
  12. IPCC. Climate Change 2014: Synthesis Report. Contribution of Working Groups I, II and III to the Fifth Assessment Report of the Intergovernmental Panel on Climate Change. Intergovernmental Panel on Climate Change; Pachauri, R.K., Allen, M.R., Barros, V.R., Broome, J., Cramer, W., Christ, R., Church, J.A., Clarke, L., Dahe, Q., Dasgupta, P., et al., Eds.; IPCC: Geneva, Switzerland, 2014; p. 151. [Google Scholar]
  13. Scott, C.A.; Pierce, S.A.; Pasqualetti, M.J.; Jones, A.L.; Montz, B.E.; Hoover, J.H. Policy and institutional dimensions of the water–energy nexus. Energy Policy 2011, 39, 6622–6630. [Google Scholar] [CrossRef]
  14. Shrestha, E.; Ahmad, S.; Johnson, W.; Batista, J.R. The carbon footprint of water management policy options. Energy Policy 2012, 42, 201–212. [Google Scholar] [CrossRef]
  15. Vengosh, A.; Jackson, R.B.; Warner, N.; Darrah, T.H.; Kondash, A. A critical review of the risks to water resources from unconventional shale gas development and hydraulic fracturing in the United States. Environ. Sci. Technol. 2014, 48, 8334–8348. [Google Scholar] [CrossRef] [PubMed]
  16. Averyt, K.; Fisher, J.; Huber-Lee, A.; Lewis, A.; Macknick, J.; Madden, N.; Rogers, J.; Tellinghuisen, S. Freshwater Use by US Power Plants: Electricity’s Thirst for a Precious Resource; Union of Concerned Scientists: Cambridge, MA, USA, 2011. [Google Scholar]
  17. Scanlon, B.R.; Duncan, I.; Reedy, R.C. Drought and the water-energy nexus in Texas. Environ. Res. Lett. 2013, 8, 045033. [Google Scholar] [CrossRef]
  18. Sovacool, B.K.; Sovacool, K.E. Identifying future electricity-water tradeoffs in the United States. Energy Policy 2009, 37, 2763–2773. [Google Scholar] [CrossRef]
  19. Flörke, M.; Teichert, E.; Bärlund, I. Future changes of freshwater needs in European power plants. Manage. Environ. Quality 2011, 22, 89–104. [Google Scholar]
  20. DOE. Energy demands on water resources: report to Congress on the interdependency of energy and water. US Department of Energy (DOE): Washington, DC, USA, 2006. Available online: http://energy.sandia.gov/wp/wp-content/gallery/uploads/dlm_uploads/121-RptToCongress-EWwEIAcomments-FINAL.pdf (accessed on 25 June 2013). [Google Scholar]
  21. Elcock, D.; Future, U.S. water consumption: The role of energy production. J. Am. Water Resour. Assoc. 2010, 46, 447–460. [Google Scholar] [CrossRef]
  22. Vassolo, S.; Döll, P. Global-scale gridded estimates of thermoelectric power and manufacturing water use. Water Resour. Res. 2005, 41, W04010. [Google Scholar] [CrossRef]
  23. Gerbens-Leenes, P.W.; van Lienden, A.R.; Hoekstra, A.Y.; van der Meer, T.H. Biofuel scenarios in a water perspective: the global blue and green water footprint of road transport in 2030. Global Environ. Change 2012, 22, 764–775. [Google Scholar] [CrossRef]
  24. Spang, E.S.; Moomaw, W.R.; Gallagher, K.S.; Kirshen, P.H.; Marks, D.H. Multiple metrics for quantifying the intensity of water consumption of energy production. Environ. Res. Lett. 2014, 9, 105003. [Google Scholar] [CrossRef]
  25. International energy statistics. U.S. Energy Information Administration [EIA]. Available online: http://www.eia.gov/cfapps/ipdbproject/IEDIndex3.cfm (accessed on 23 January 2013).
  26. AQUASTAT database. Food and Agriculture Organization of the United Nations [FAO]. Available online: http://www.fao.org/nr/water/aquastat/main/index.stm (accessed on 14 March 2013).
  27. Indicators. World Bank. Available online: http://data.worldbank.org/indicator (accessed on 12 March 2013).
  28. Macknick, J.; Newmark, R.; Heath, G.; Hallett, K.C. Operational water consumption and withdrawal factors for electricity generating technologies: a review of existing literature. Environ. Res. Lett. 2012, 7, 045802. [Google Scholar] [CrossRef]
  29. Mulder, K.; Hagens, N.; Fisher, B. Burning water: A comparative analysis of the energy return on water invested. Ambio 2010, 39, 30–39. [Google Scholar] [CrossRef] [PubMed]
  30. Bailey, R. Trouble with Biofuels: Costs and Consequences of Expanding Biofuel Use in the United Kingdom. In Energy, Environment and Resources EER PP; 2013/01; Chatham House: London, UK, 2013; p. 24. [Google Scholar]
  31. Mittal, A. Energy-water nexus: Many uncertainties remain about national and regional effects of increased biofuel production on water resources. Government Accountability Office: Washington, DC, USA, 2010. Available online: http://www.gao.gov/assets/300/299103.pdf (accessed on 12 February 2015). [Google Scholar]
  32. OECD-FAO Agricultural Outlook Database. Organisation for Economic Co-operation and Development; Food and Agricultural Organization of the United Nations. Available online: http://www.agri-outlook.org/database.html (accessed on 25 May 2015).
  33. De Fraiture, C.; Giordano, M.; Liao, Y. Biofuels and implications for agricultural water use: Blue impacts of green energy. Water Policy 2008, 10, 67–81. [Google Scholar] [CrossRef]
  34. Kanellakis, M.; Martinopoulos, G.; Zachariadis, T. European energy policy—A review. Energy Policy 2013, 62, 1020–1030. [Google Scholar] [CrossRef]
  35. Wurbs, R.A.; Ayala, R.A. Reservoir evaporation in Texas, USA. J. Hydrol. 2014, 510, 1–9. [Google Scholar] [CrossRef]
  36. Chiu, Y.-W.; Walseth, B.; Suh, S. Water embodied in bioethanol in the United States. Environ. Sci. Technol. 2009, 43, 2688–2692. [Google Scholar] [CrossRef] [PubMed]
  37. Herreras Martinez, S.; van Eijck, J.; Pereira da Cunha, M.; Guilhoto, J.J.M.; Walter, A.; Faaij, A. Analysis of socio-economic impacts of sustainable sugarcane–ethanol production by means of inter-regional Input–Output analysis: Demonstrated for Northeast Brazil. Renew. Sust. Energ. Rev. 2013, 28, 290–316. [Google Scholar] [CrossRef]
  38. Chiu, Y.W.; Wu, M. Assessing county-level water footprints of different cellulosic-biofuel feedstock pathways. Environ. Sci. Technol. 2012, 46, 9155–9162. [Google Scholar] [CrossRef] [PubMed]
  39. Mekonnen, M.M.; Hoekstra, A.Y. The green, blue and grey water footprint of crops and derived crop products. Value of water research report series no. 47; UNESCO: Delft, The Netherlands, 2010; Available online: http://waterfootprint.org/media/downloads/Report47-WaterFootprintCrops-Vol1.pdf (accessed on 20 February 2015).
  40. King, C.W.; Webber, M.E.; Duncan, I.J. The water needs for LDV transportation in the United States. Energy Policy 2010, 38, 1157–1167. [Google Scholar] [CrossRef]
  41. Kenny, J.F.; Barber, N.L.; Hutson, S.S.; Linsey, K.S.; Lovelace, J.K.; Maupin, M.A. Estimated use of water in the United States in 2005. United States Geological Survey: Reston, VA, USA, 2009. Available online: http://pubs.usgs.gov/circ/1344/ (accessed on 18 January 2015). [Google Scholar]
  42. Orcutt, M. Water power. MIT Tech. Rev. 19 April 2011. Available online: http://www.technologyreview.com/graphiti/423762/water-power/ (accessed on 22 February 2015).
  43. Siddiqi, A.; Kajenthira, A.; Díaz Anadón, L. Bridging decision networks for integrated water and energy planning. Energy Strateg. Rev. 2013, 2, 46–58. [Google Scholar] [CrossRef]
  44. Schoonbaert, B. The water-energy nexus in the UK: Assessing the impact of UK energy policy on future water use in thermoelectric power generation. Master’s thesis, Kings College, University of London, UK, 2012. Available online: http://www.kcl.ac.uk/sspp/departments/geography/study/masters/dissertations/Dissertation-2012-Schoonbaert.pdf (accessed on 20 February 2015). [Google Scholar]
  45. Rhodes, A.; Skea, J.; Hannon, M. The global surge in energy innovation. Energies 2014, 7, 5601–5623. [Google Scholar] [CrossRef]
  46. Sorrell, S. Energy substitution, technical change and rebound effects. Energies 2014, 7, 2850–2873. [Google Scholar] [CrossRef]
  47. Koch, F.H. Hydropower—the politics of water and energy: Introduction and overview. Energy Policy 2002, 30, 1207–1213. [Google Scholar] [CrossRef]
  48. Bauer, C.J. Slippery property rights: multiple water uses and the neoliberal model in Chile, 1981–1995. Nat. Resour. J. 1998, 38, 109. [Google Scholar]

