1. Introduction
Gas hydrates are crystalline, ice-like structures composed of water and gas molecules that store large volumes of gas (e.g., methane). They are stable at elevated pressure and low temperature-conditions, such as are found in permafrost and marine shelf areas, where they constitute promising fossil fuel reservoirs [
1]. From one cubic meter of hydrate, a volume of up to 172 m
3 methane at standard conditions can be released [
2]. The recovery of methane from these deposits is, therefore, of great interest economically, but appropriate techniques still need to be developed and tested. Generally, decomposition of gas hydrates can be realized via thermal stimulation, depressurization, or distortion of the chemical equilibrium by adding chemicals or other hydrate-forming molecules [
3,
4,
5].
Schicks
et al. [
6] developed a Large Reservoir Simulator (LARS), which is used to mimic hydrate formation and decomposition events. LARS is a large volume, sediment-filled pressure vessel equipped with a cooling system, a pressurization system, and a gas water mixing vessel that produces a gas-loaded water supply for hydrate formation [
7]. Additionally, LARS contains various
in and
ex situ analytical tools such as pressure and temperature sensors, a gas chromatography, and an electrical resistivity tomography system [
8].
With LARS, a variety of hydrate decomposition simulating experiments have been performed. Depressurization experiments mimicking the conditions of the well-known Mallik field test [
9] have been done and the distortion of the chemical equilibrium has been realized by introducing CO
2 as further hydrate-forming gas. For hydrate decomposition via thermal stimulation, Schicks
et al. [
3] developed a counter-current heat-exchange reactor. The reactor can be placed directly at the location of a gas hydrate deposit. The heat required to decompose the surrounding hydrates is generated by the exothermal conversion of CH
4 with air into CO
2 and water. By using a platinum group catalyst, this combustion reaction is flameless. The reactor requires only about 15% of the total amount of methane released during hydrate decomposition, thus the process is easily self-sustaining with a net 85% of the methane available for extraction [
6]. Therefore, it is plausible that the released CH
4 from the hydrate source might serve as direct feed to the reactor. One problem that must be overcome is the separation of released CH
4 from pore fluid and sediment before it is introduced to the catalyst. For this purpose a membrane setup has been developed and tested as a suitable “extractor” for methane feed gas into the reactor.
Initially, the operation of the membranes as a simple capture tool for the released methane from a hydrate deposit is considered.
Furthermore, tests have been performed with respect to the utilization of the membrane technique in hydrate research and recovery developments. These focus on the operation as an analytical tool to monitor the amount of free methane gas in the surroundings of the hydrate decomposition center (e.g., around the heat source) and, hence, the propagation of the heat front through the degrading hydrates.
The energy efficiency and simplicity of membrane-based gas separation makes it extremely attractive for a variety of applications and commercially competitive with existing separation technologies [
10]. The process only requires simple, easy to operate and compact equipment.
Due to the good permeability towards CH
4 and its robust nature regarding pressure and temperature variations, we selected PDMS (polydimethylsiloxan) membranes for this study. PDMS is a silicium-based organic polymer, commonly referred to as silicone. It is regarded as one of the most permeable elastomers [
11].
Generally, the driving force of gas permeation itself is the difference in partial pressure between feed and permeate side.
Gas permeation through PDMS membranes is described by the solution-diffusion mechanism as a three-step process. First, the gas molecules are absorbed by the membrane surface, diffusion through the polymer matrix follows, and finally the gas molecules evaporate on the other side of the membrane [
12]. The process is based on the solubility of specific gases within the membrane and their diffusivity through the membrane matrix. Gas separation is, therefore, diffusion dependent but also reliant on the physical-chemical interaction between gas species and polymer, which determines the amount of gas that can be dissolved in the membrane polymeric matrix [
13].
The good methane permeability through PDMS membranes is well known and numerous studies have been carried out on permeability of various pure and mixed gases such as O
2, N
2, H
2, CO, CO
2, and CH
4 through the PDMS membrane [
13,
14,
15]. Some studies focus on CH
4 and light hydrocarbons [
16,
17,
18].
There are different types of PDMS membranes commercially available or produced directly in the laboratories. Most of them are developed to optimize the gas permeability by producing very thin, often multi-layer membranes where the PDMS layer thickness rarely exceeds the micrometer scale and is mostly stabilized by supportive layers of porous material. The work presented here, however, utilizes a comparatively thick material, a silicone tube that had already been tested and applied as a component of a gas membrane sensor assemblage of a borehole tool [
19]. The membrane tube is stabilized using glass beads as a filler material to prevent the tube from collapsing during a high-pressure experiment. We have taken up this idea because, despite lower permeation rates due to the thickness of the membrane layer, its stability with respect to mechanical loads, salinity, and thermal effects makes it a suitable and easy-to-handle tool for our approach.
The application of the membranes designed for this study is twofold:
A detailed description of the installation and function of these designs is given in the following section.
2. Experimental Section
The silicone tubing, supplied by Fisher Scientific™, has an outer diameter of 6.4 mm and a wall thickness of 0.8 mm. The silicone is platinum cross-linked and its quality is ensured in the temperature range of 233 to 473 K. We usually prepared membranes of a length of 11–12 cm, which equals an outer membrane area of about 20 cm2.
The tubes had to be equipped for use in a high-pressure environment and were therefore tightly packed with glass beads (diameter between 0.25 and 0.5 mm, supplied by Carl Roth®) to avoid collapsing. The tube endings were prepared using conical stainless steel tubes, which were sized to be adaptable to Swagelok® fittings. Additional O-ring sealings ensure a leak-tight membrane setup.
Due to the single piece manufacturing, each membrane is unique in its permeation properties and had to be checked separately. Therefore, two types of test apparatus (
Figure 1 and
Figure 2) were designed for the small-scale examinations of silicone tubing as a suitable membrane unit.
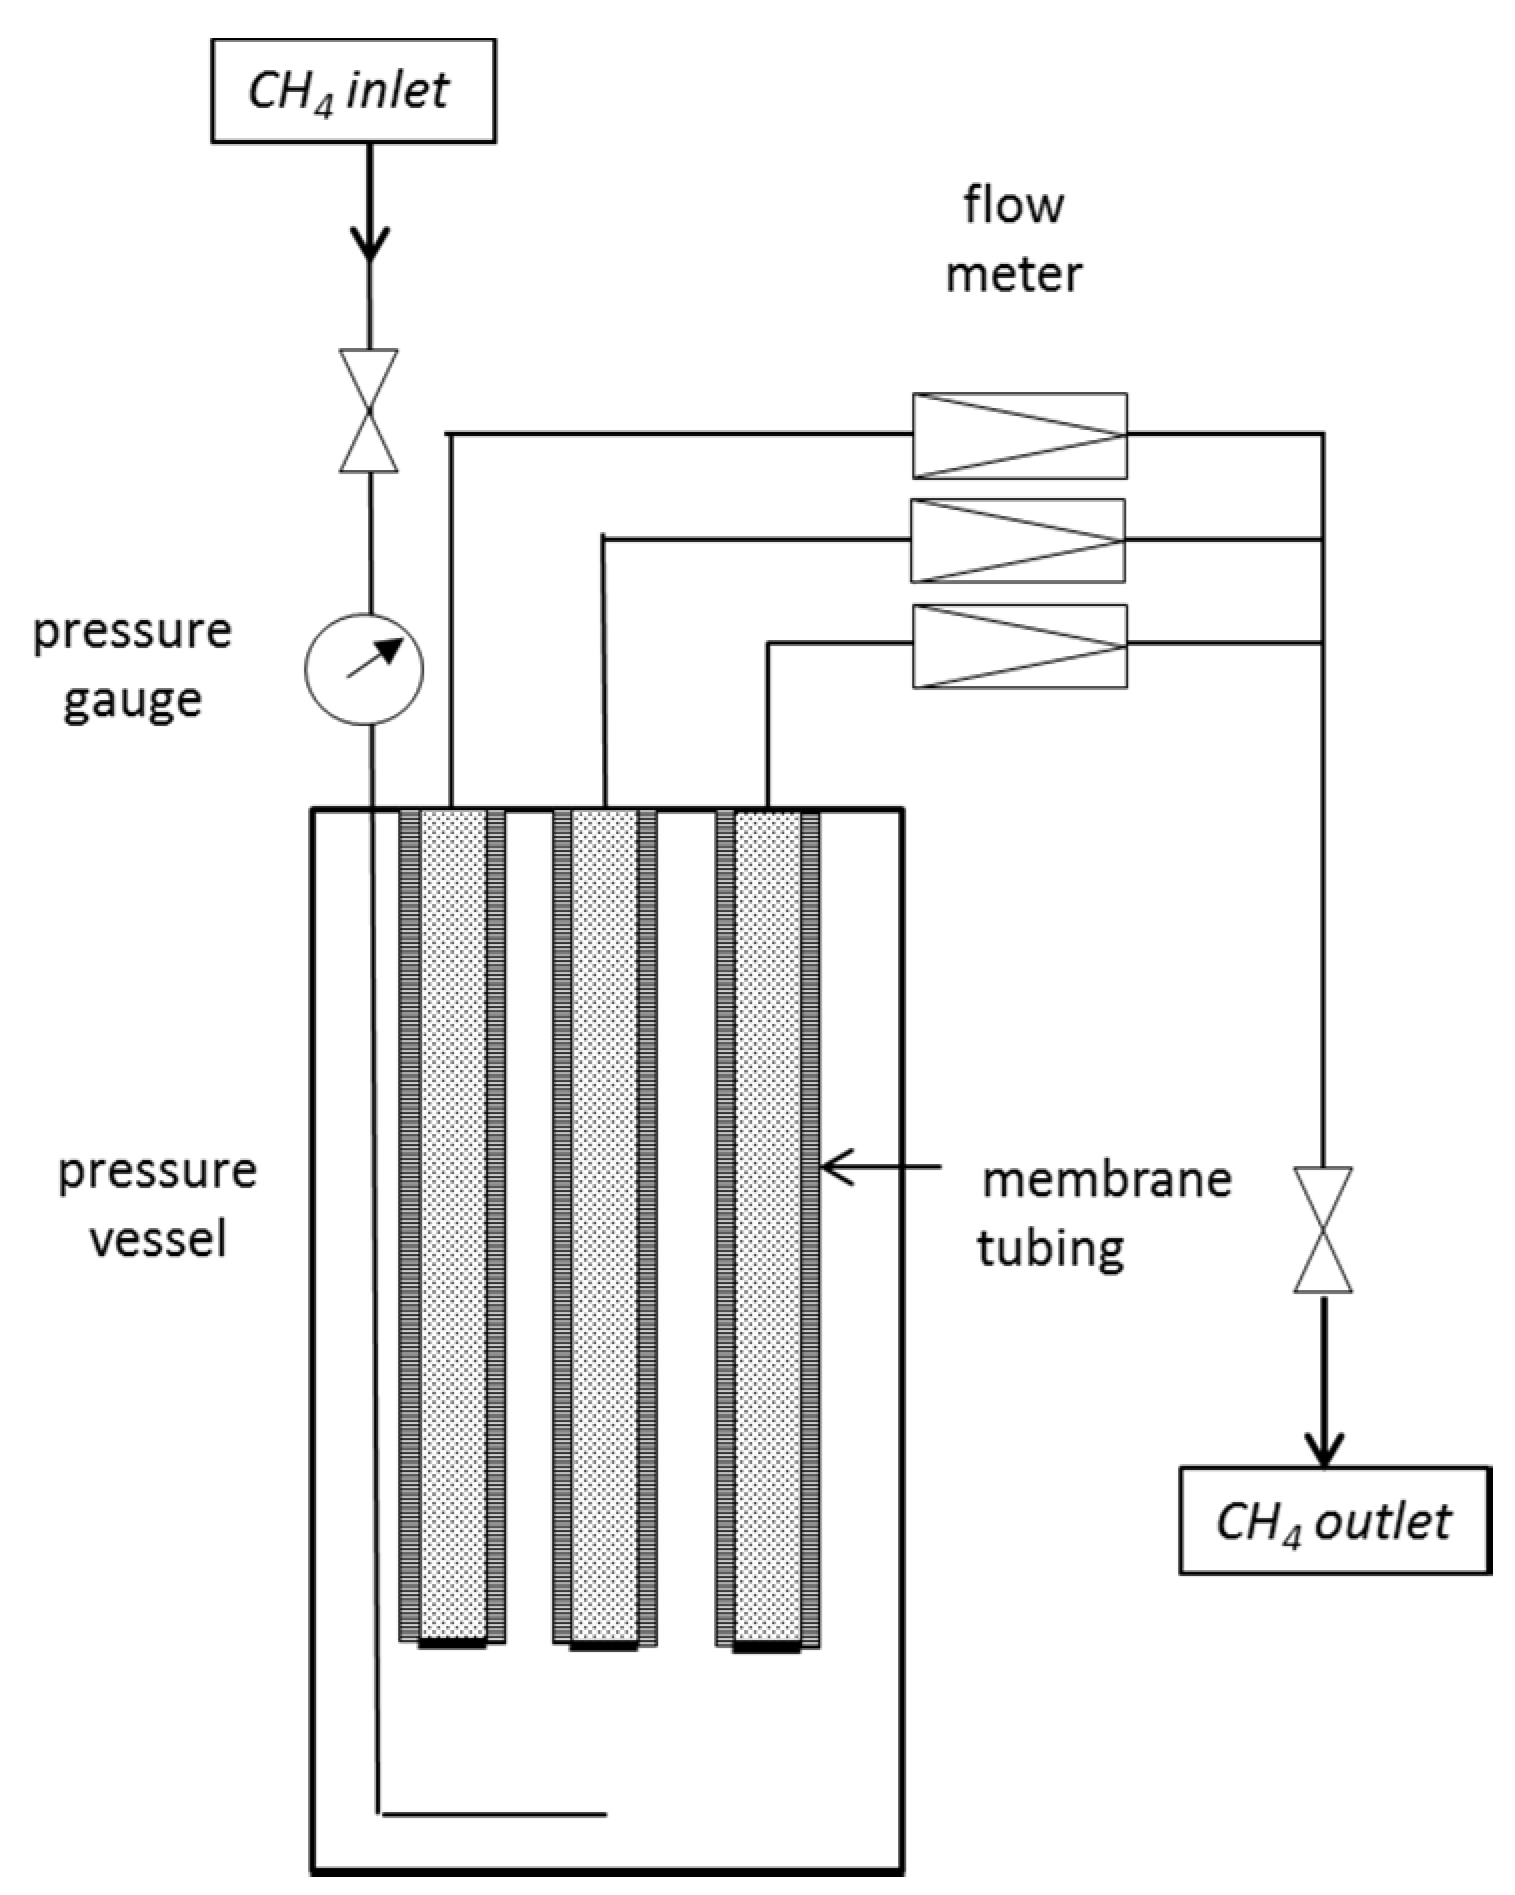
2.1. Measurement of Pure Gas Permeability
For basic experiments on the gas permeation rates and leak-tightness of the membrane tubing, a test facility was set up (
Figure 1) where up to three membranes were installed in a pressure vessel and connected via capillaries to a flow meter.
Figure 1.
Schematic diagram of the setup for CH4 gas permeation measurements.
Figure 1.
Schematic diagram of the setup for CH4 gas permeation measurements.
The CH4 gas was introduced into a stainless steel pressure vessel of 1 L volume and adjusted to the desired pressure. The feed pressure decreased due to permeation through the membrane. A regular readjustment was performed to preserve constant conditions. The temperature was kept at a constant, air-conditioned room temperature of 295 K during all experiments.
One end of the membrane tubing was closed; the other was attached to a 1/16” capillary which led to a mass flow meter (Analyt-MTC GmbH) to instantaneously detect the CH4 flow with time.
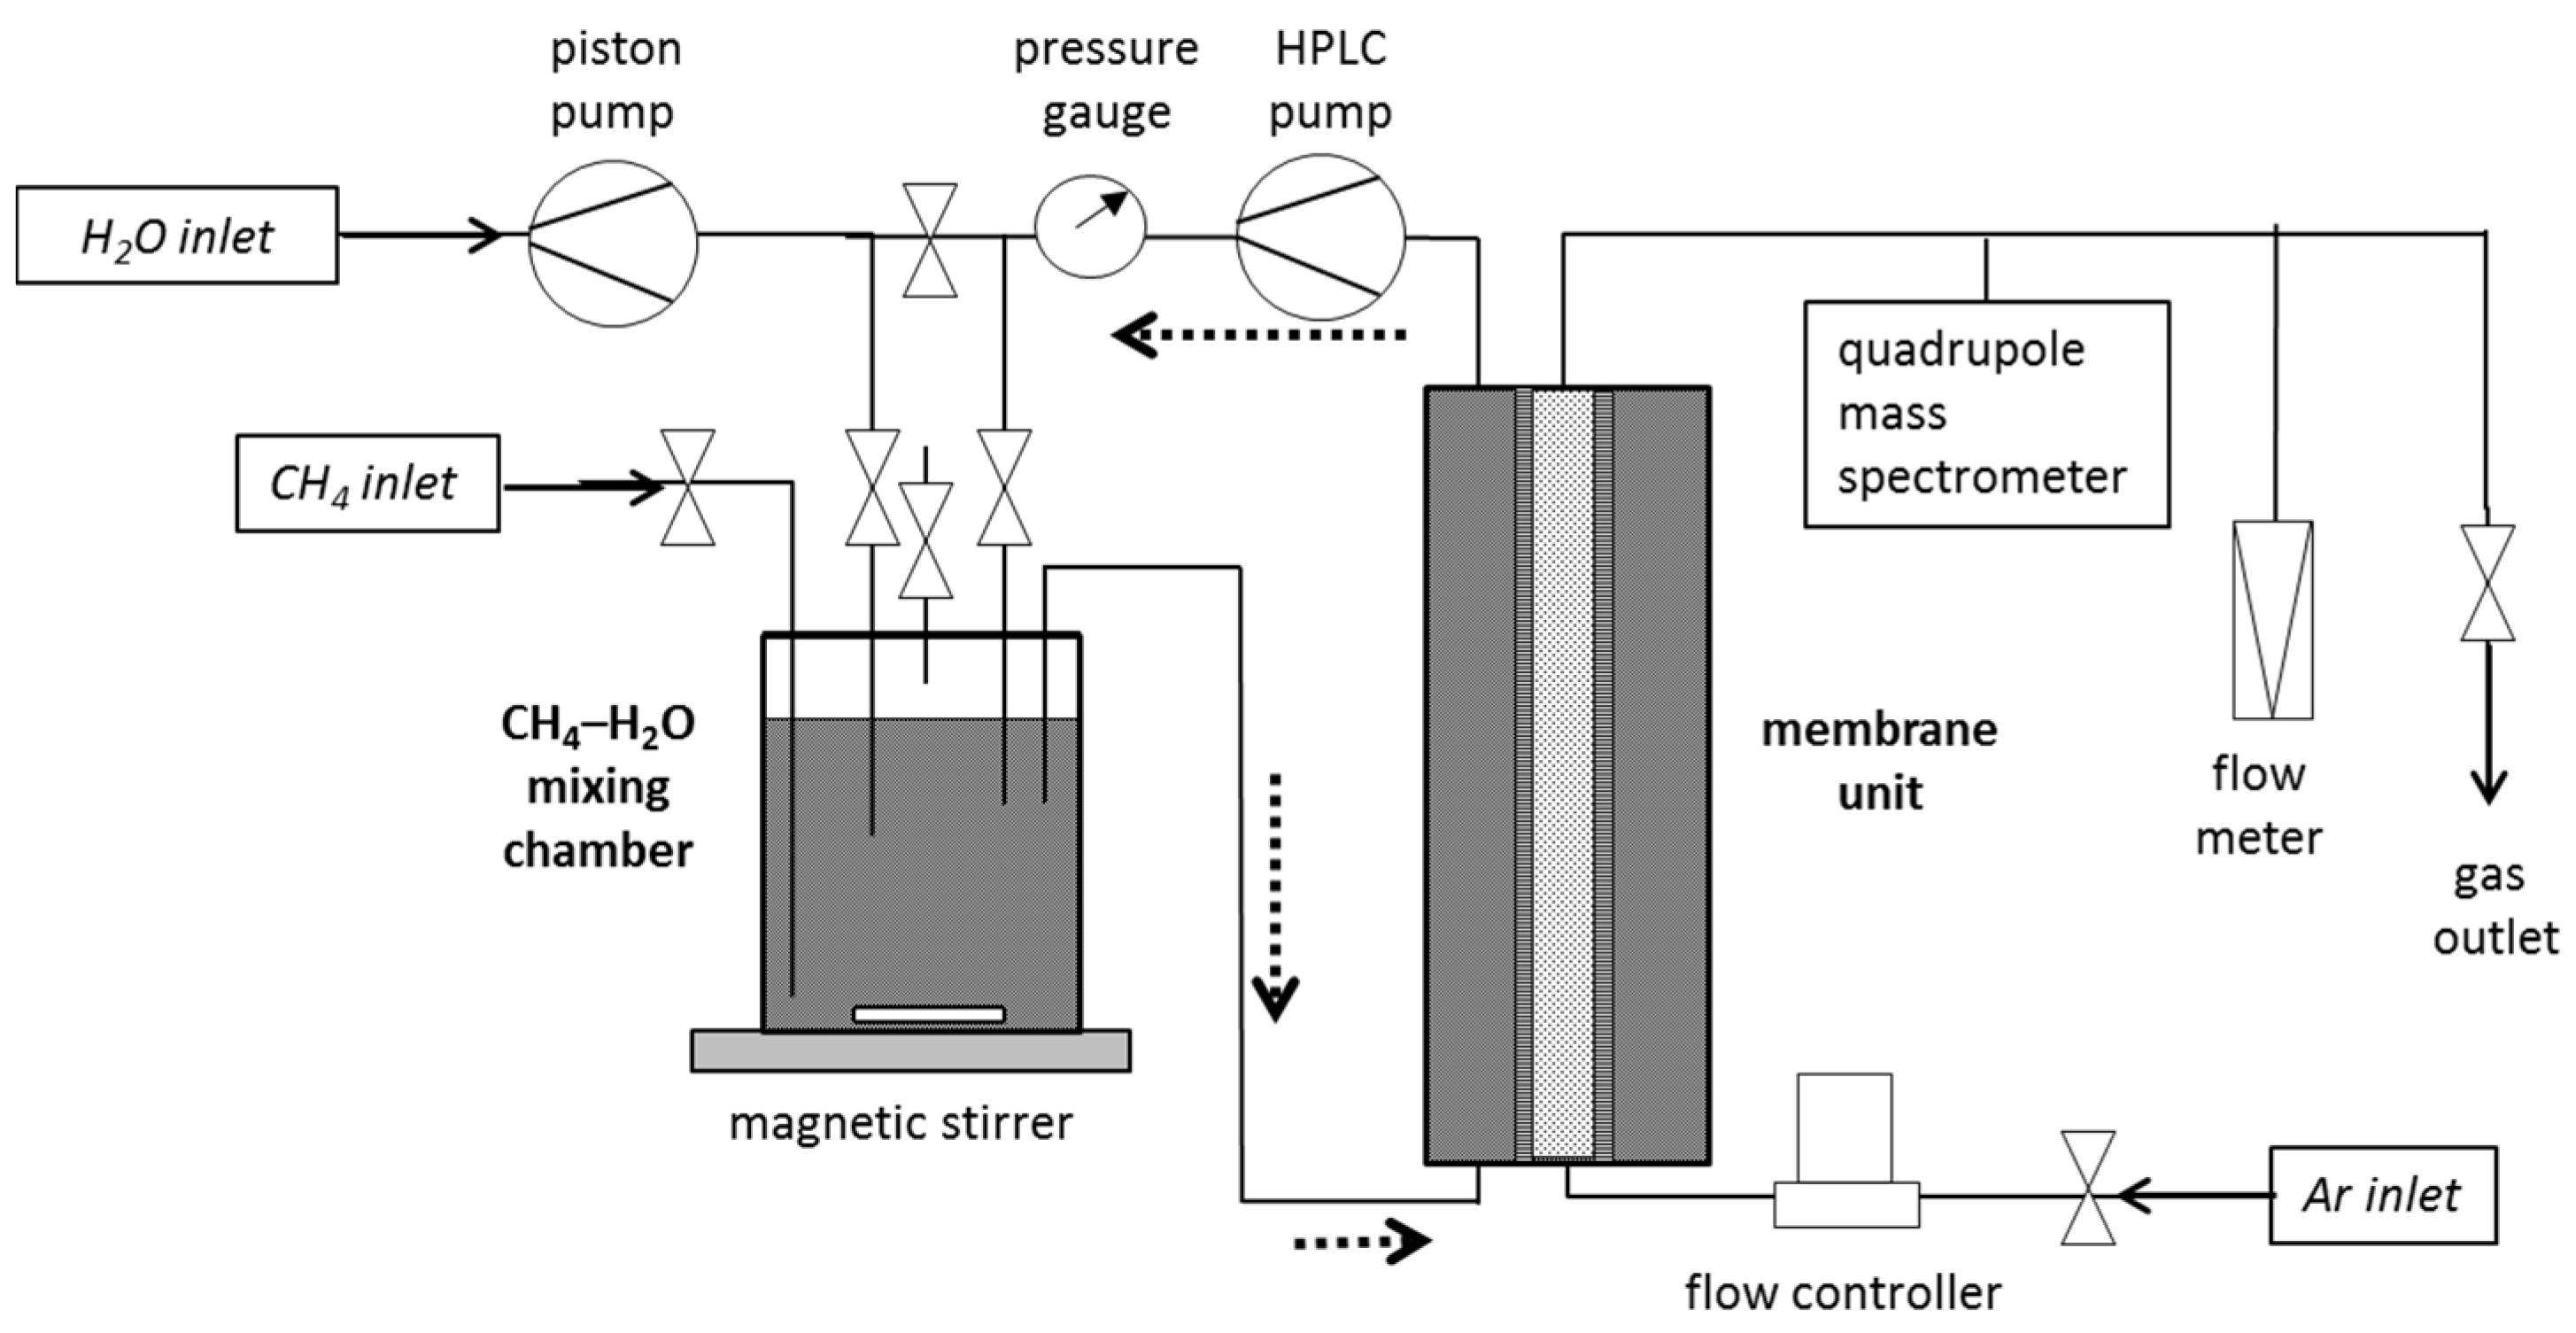
2.2. Measurement of Gas Permeation from CH4-Saturated Aqueous Solutions
The CH
4 concentration in the feed solution is, compared to free gas, very small (e.g., at 12 MPa it is only 0.123 mol/L) and the concentration gradient, which is the driving force for the gas to permeate through the membrane, is therefore low. Consequently, the gas volume that permeates through the membrane from a CH
4-saturated solution is, compared to free gas, also very small (e.g., at 12 MPa it is 0.23 mL/min). The permeate was continuously carried away from the membrane to the analytical equipment by an argon gas stream of 50 mL/min to keep up the concentration gradient between the CH
4-saturated solution and the gas stream (
Figure 2). Both membrane ends were connected to 1/16” capillaries; one end constitutes the entry of the argon gas stream, the other one the exit of the argon gas, now enriched in permeate (CH
4 and water vapor). This gas mixture was then directed to a quadrupole mass spectrometer for the analysis of the volumetric parts of H
2O vapor and CH
4 gas in the argon carrier gas.
To create a CH4-saturated solution a CH4–H2O mixing chamber (1 Liter Volume) was added to the experimental setup and connected to the membrane unit. Initially, the entire internal volume was filled with demineralized, degassed water. During the first pressurization with CH4 a gas pillow in the CH4–H2O mixing chamber was created by pushing 100 mL water out of the system. The gas pressure equals the feed pressure and was initially set to 1 MPa and, in the course of the experiment, successively increased to about 10 MPa. Through vigorous stirring of the water in the mixing chamber, a CH4-saturated solution was formed. The solution was permanently circulated through both vessels via an HPLC pump with 10 mL/min to assure that a CH4-saturated solution existed in the membrane unit. To obtain equilibrium between both chambers, 2–3 h of circulation was necessary. The circulation and stirring was continued during the entire experiment and regular pressure readjustments were necessary to keep the feed pressure constant. In this way, the feed solution was always re-loaded with CH4 and its concentration can be assumed to be constant.
Figure 2.
Schematic diagram of the setup for gas permeation measurements from a CH4-saturated solution. The stippled arrows show the circulation of the CH4-loaded feed solution.
Figure 2.
Schematic diagram of the setup for gas permeation measurements from a CH4-saturated solution. The stippled arrows show the circulation of the CH4-loaded feed solution.
Due to the removal of CH4 from the solution by permeation, an immediate depletion in CH4 in the vicinity of the membrane at the feed side occurs. This effect was minimized by the constant renewal of the feed solution around the membrane tubing by circulating the liquid between the mixing chamber and membrane unit. An accumulation of permeate at the inside of the membrane tubing was prevented by the continuous argon gas stream. In this way, a constant concentration gradient, as the driving force for permeation, could be preserved.
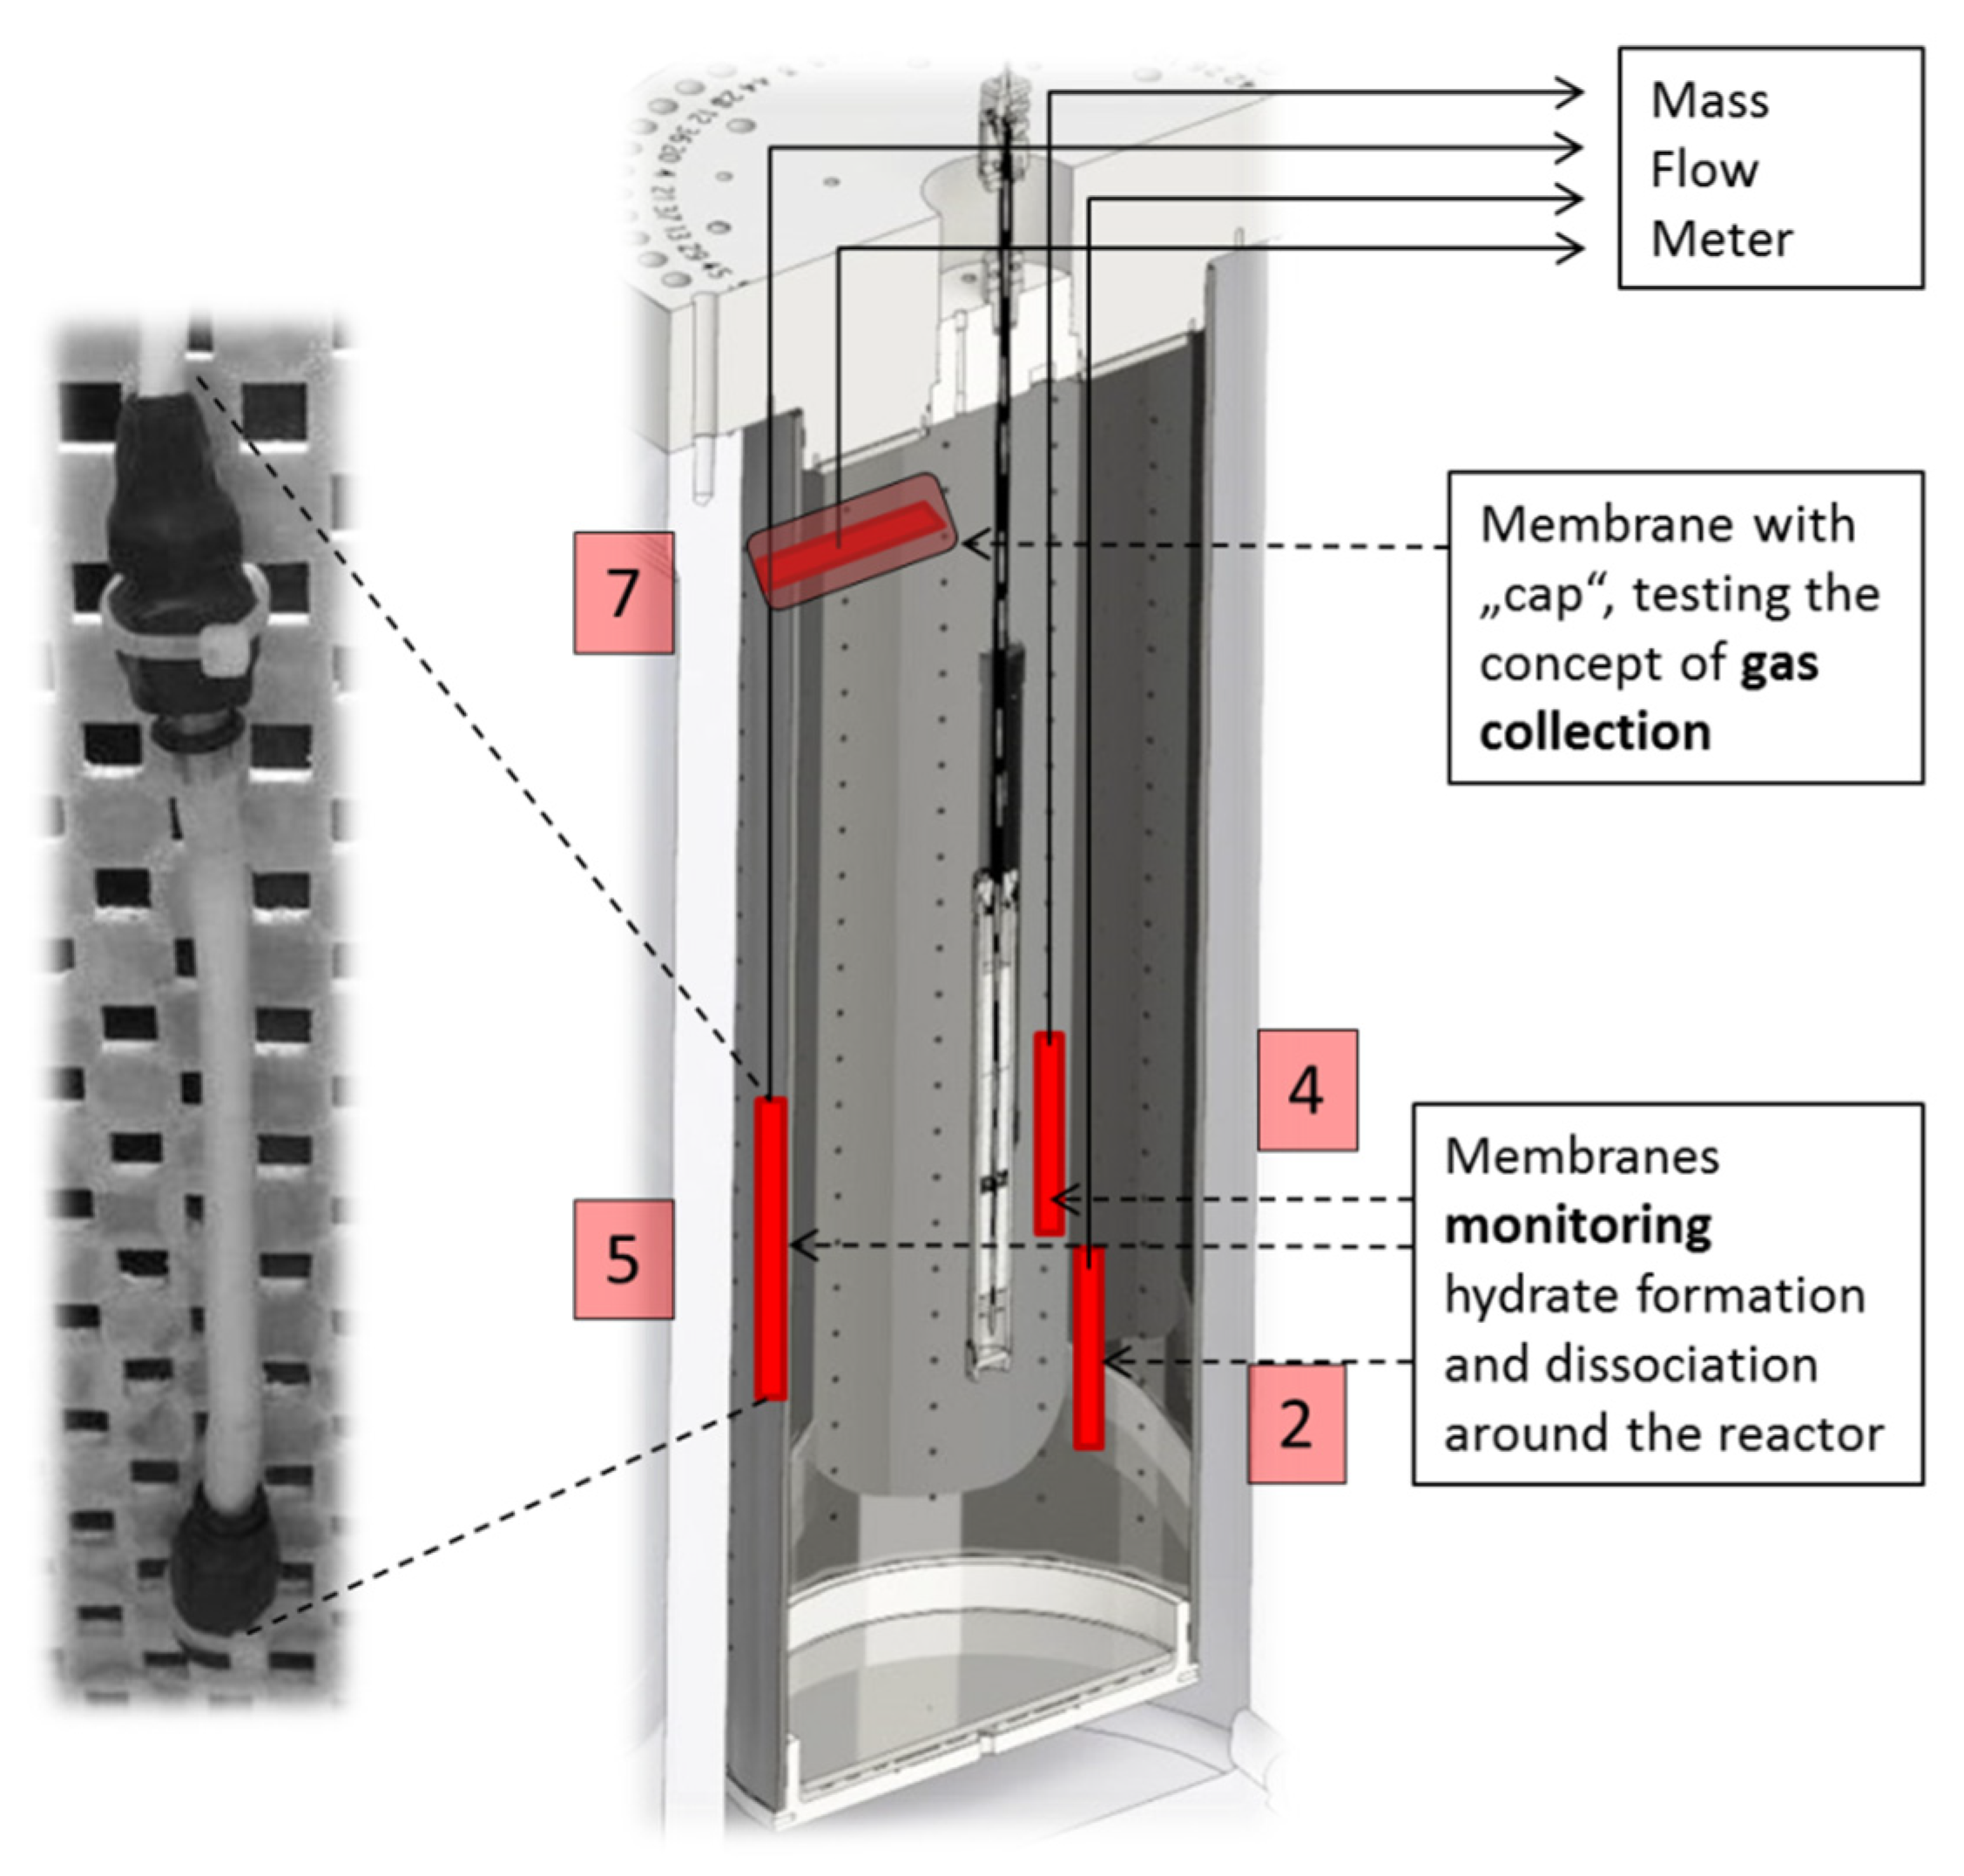
2.3. Setup for LARS Experiments
For the application of membranes as possible CH
4 extractors or as an analytical tool to monitor CH
4 concentration in rough areas, several membrane tubes were assembled for the operation within the large-scale reservoir simulator (LARS;
Figure 3).
Figure 3.
Schematic diagram of the setup for measurements in LARS. Left: photograph of a membrane fitted to a perforated board (to keep items in place); right: cross section through LARS showing membrane positions and their numbering used in the following (red). In the center the heat exchange reactor is shown.
Due to the occurrence of gas hydrates in hard-to-reach areas, their behavior in sedimentary deposits is largely investigated on experimental setups in the laboratory. Because of its large internal volume of 425 L, LARS is suitable for pilot plant scale tests on hydrate behavior in sediments. This includes the possibility to mimic scenarios for the hydrate decomposition and subsequent natural gas extraction. The prerequisites for the simulation of a natural gas hydrate reservoir are given in LARS with porous sediment filling (39.2% porosity with a permeability of 2030 D ± 23 D [
20]), methane-saturated water circulation, low temperature, and high pressure. Four silicone membranes were placed in different positions within the LARS reservoir. They were kept in place by fitting them to a perforated plate, positioned, next to temperature sensors, along the cross-sectional area of the vessel. Three membranes (2, 4, and 5) were installed near the heat exchange reactor with the aim of observing the propagating hydrate dissociation around the heat source. However, results presented here were obtained during a hydrate dissociation test that has been performed by depressurization. The upper membrane (7) was equipped with a cap to simulate the scenario of gas capture in the course of hydrate dissociation. The membranes are meant to deliver continuous data and provide information on the gas/water ratio within LARS in the course of an experiment by measuring the flow rates of methane.
Gas hydrate was formed using a confining pressure of 12–15 MPa and a pore pressure of 8–12 MPa at a temperature of about 283 K. During hydrate formation, the vessel was continuously flushed with CH
4-loaded brine. The duration of the formation process was in the range of several weeks. The subsequent decomposition experiment ran for two days and aimed to mimic realistic scenarios such as hydrate decomposition via pressure reduction, comparable to the CH
4 production test in Mallik [
9]. During this field test, hydrate decomposition was realized by depressurization in three steps at 7.0, 5.0, and 4.2 MPa.
2.4. Data Evaluation
Gas and vapor permeate through the membrane due to a partial pressure difference between the feed and permeate side. The permeability is influenced by the surface area and the thickness of the membrane. The dependency is described according to the following Equation (1):
where
q is the penetrated mass flux of gas or vapor through the membrane at STP (cm
3) per time
s through a membrane of a thickness
t (cm) and an area
A (cm
2). The partial pressure gradient
Δp between the feed and permeate sides of the membrane is expressed in cmHg, which equals 1.33 kPa.
The permeability unit, Barrer, is given by the following Equation (2):
In the following, results are mainly expressed by permeate flow. This is because the volumetric flow is directly measured during the experiment. The permeate flow was measured per minute through tubular membranes of 0.8 mm wall thickness over an area of about 20 cm2. The pressure on the feed side was variable; the pressure on the permeate side equaled the atmospheric pressure.
3. Results and Discussion
The investigations are subdivided into three parts. First, the general permeability towards pure methane and the behavior under high pressure was looked at on a small lab scale. Secondly, the separation of CH4 from the dissolved phase was tested, also considering water vapor permeability at various pressure conditions. Thirdly, the application of silicone tubes as membrane in near-natural condition in LARS was investigated. Finally, the discrepancy between theoretical expectations and practical results is discussed.
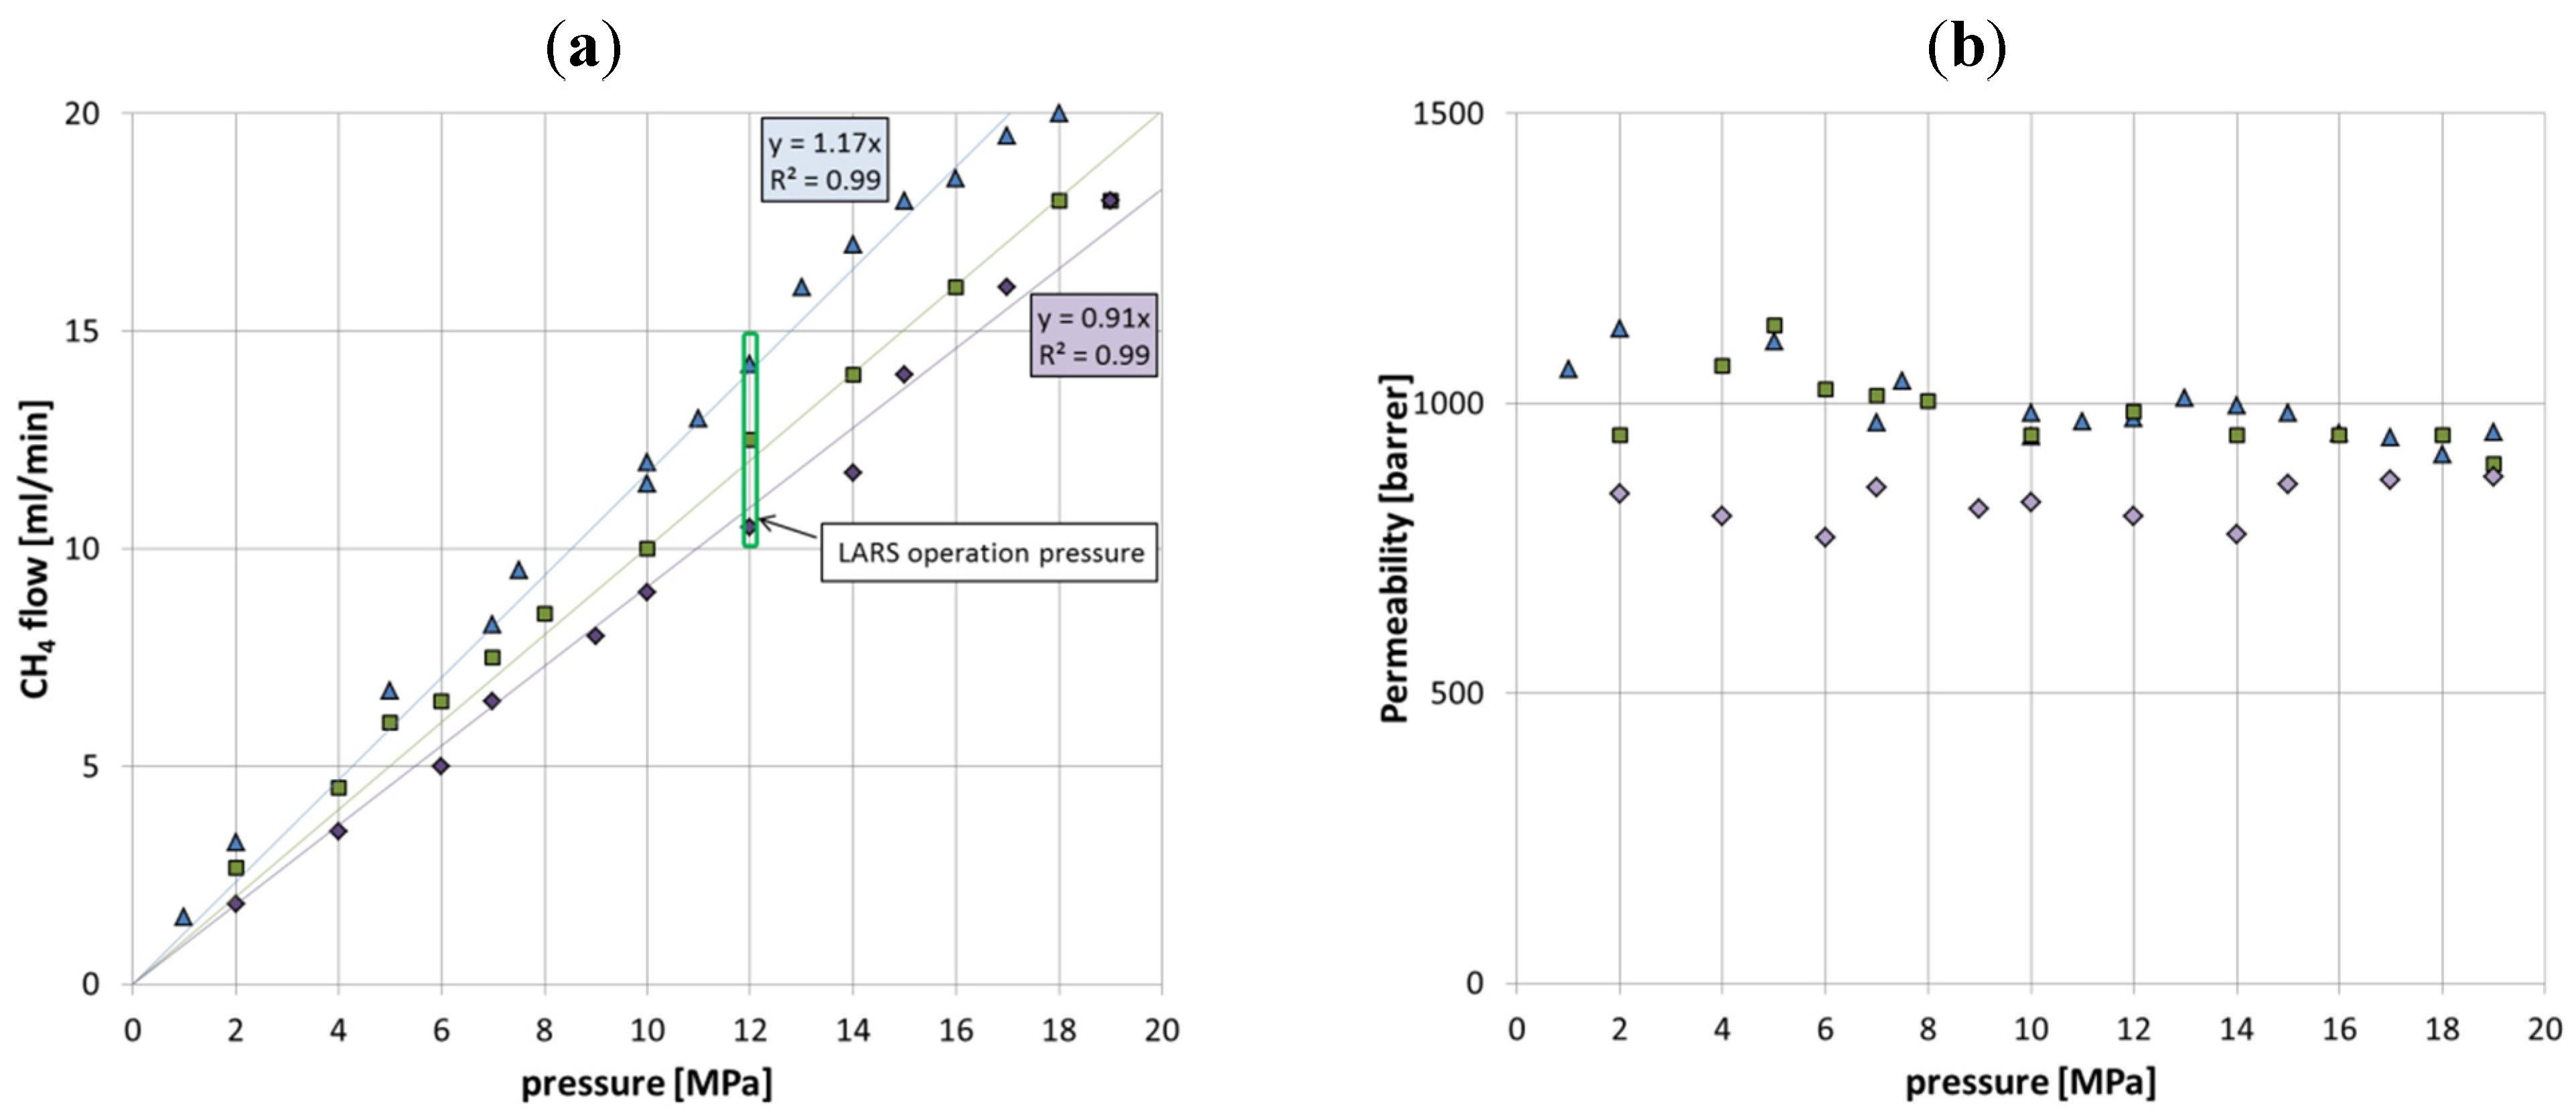
3.1. CH4 Gas Permeation Rate
Driven by the transmembrane pressure difference, the CH
4 flow through the membranes increased in a nearly linear manner with increasing feed gas pressure. For the setup presented here, with a membrane area of about 20 cm
2 this means that a pressure of 2 MPa on the feed side resulted in a CH
4 flow of about 2 mL/min (
Figure 4). More generally, this type of tubular silicone membrane with a thickness of 0.8 mm gained 1 mL CH
4 per minute per cm
2 at a transmembrane pressure difference of about 20 MPa. This corresponds to a permeability of about 1000 Barrer, which is in good agreement with values reported in other publications on permeability of CH
4 through PDMS membranes [
13,
16,
18].
Figure 4.
(a) The diagram shows the relationship between gas flow through the membrane and the gas pressure on the feed side. (b) The diagram shows the corresponding permeability values. In both diagrams, data sets of three similar manufactured membranes are shown, to illustrate the degree of inconsistency of gas flow and permeability between them.
Even though the assemblage was the same for all membranes, there were differences in permeability performance between the various membranes. These are explained by variations in glass bead packing density due to manual preparation and the possibility of slightly thinning out the tube wall during packing. In addition, discontinuities during the main factoring process can also result in variations in the tube wall thickness.
Another factor that individually influences the permeability is the total contact area between glass beads and tubing, in that the contact areas reduce the effective membrane surface. However, the very dense glass bead filling is absolutely important for a well-functioning, non-squeezable membrane setup that does not collapse and subsequently prevents the permeate from freely exiting the membrane site. For all these factors, each membrane has to be tested for its individual permeability.
3.2. The Separation of CH4 from Aqueous Solution
To justify the idea of applying membranes as a CH4 extractor in the course of hydrate degradation, it was necessary to clarify the effectiveness of both the separation of gas and water through the tubular PDMS membrane as well as the gas collection from the solution. Thus, two types of experiments were performed.
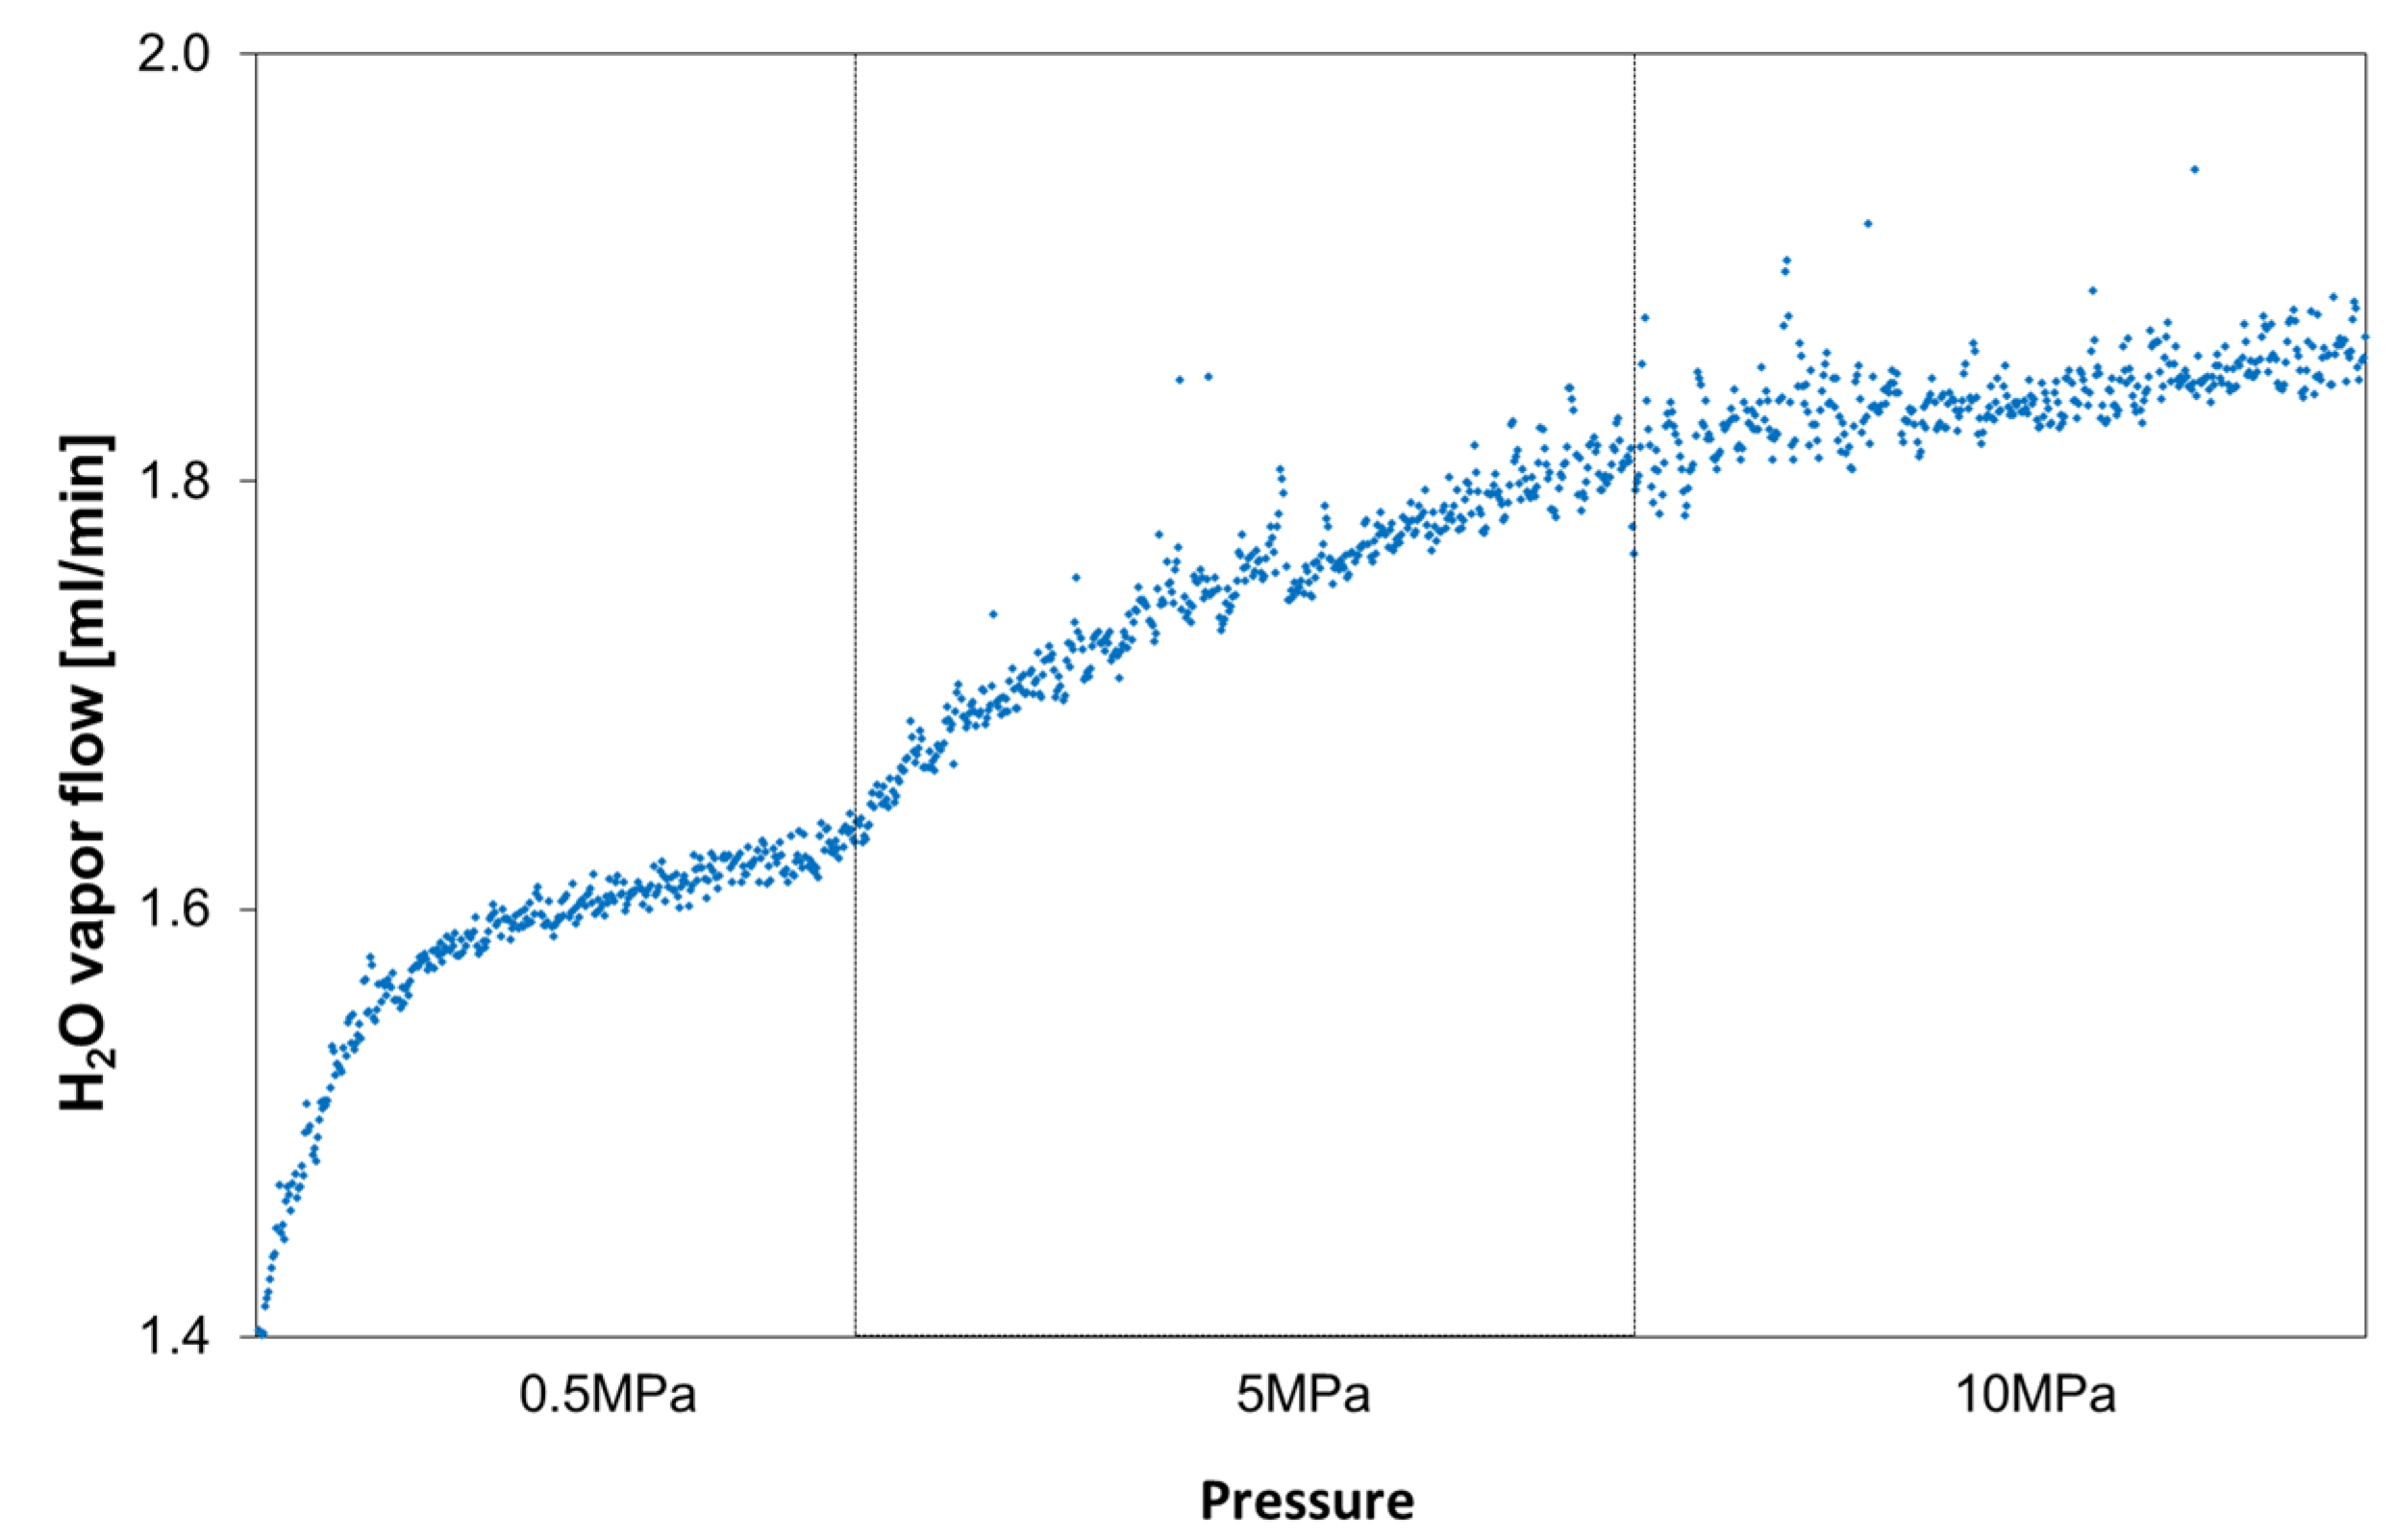
First, only degassed and demineralized water was used as a feed component. The permeate concentration was analyzed using a quadrupole mass spectrometer. The feed pressure was increased in three steps from 0.5 MPa to 5 MPa to maximum values of 10 MPa. Each pressure step was held for about two hours to assure the achievement of equilibrium. All experiments were performed at room temperature of 295 K.
The resulting mass spectrometer data (
Figure 5) show that the water vapor volume, collected by the argon carrier gas stream, immediately increased to values above 1.4 mL H
2O vapor per minute but, in the following, increased only slightly to 1.8 mL/min with feed pressure rising to 10 MPa.
Figure 5.
The diagram shows H2O vapor volumes permeating through the membrane with increasing pressure on the feed side.
Figure 5.
The diagram shows H2O vapor volumes permeating through the membrane with increasing pressure on the feed side.
Secondly, the gas and water separation was investigated (
Figure 6). Thereby, it was assumed that the water is CH
4-saturated (maximum concentration at pressure) during each step.
The flow of water vapor (
Figure 6) through the membrane remains, regardless of the pressure step, relatively constant with values of around 0.5 mL/min, which is low compared to the total permeate flow. It is noteworthy that the H
2O vapor flow remains considerably below the values measured for pure H
2O vapor permeation. This is presumably due to the presence of competing CH
4 molecules that preferentially diffuse through the membrane. Furthermore, the CH
4 gas flow was lower than that of pure gaseous CH
4 on the feed side. This is expected because the effective feed concentration of CH
4 in the solution is considerably lower than it is when pure gas is offered as a feed component.
We performed the experiment with stepwise increasing pressure. During each pressure step, we observed that, if gas pressure on the feed side is adjusted, the measured gas flow on the permeation side increased immediately. However, while the pressure on the feed side then started to decrease due to gas loss through the membrane, the methane flow through the membrane still increased. In order to reach a constant value, this process was usually hold for up to two hours.
Even though the data set could not be continued to pressures up to 12 MPa as expected in LARS, we can extrapolate the linear correlation towards higher pressure values.
The following diagrams serve as the basis for validating the membrane as an analytical tool that enables the measurements of dissolved or free gas concentration in water and to diagnose if the water is either saturated, or under- or oversaturated, in CH
4. The permeability of the PDMS tubular membrane can be stated for dissolved CH
4 to values of about 400 Barrer. This is significantly lower compared to permeability data of the free gas feed but explained mainly by the generally lower supply of CH
4 molecules. As shown in
Figure 7a, based on the small-scale experiments the gas flow expected for a fully CH
4-saturated solution at 12 MPa should equal 4.8 mL/min. Higher gas flow values suggest a free gas phase in the feed solution; the values below are indicative for a CH
4-under saturated feed solution.
Figure 6.
CH4 and H2O vapor flow with increasing feed pressure.
Figure 6.
CH4 and H2O vapor flow with increasing feed pressure.
Figure 7.
(
a) Correlation between pressure and methane flow. Red dots show the data of the experiment discussed above—large dots at equilibrium, small dots before equilibrium reached; violet dots show data of a further experiment with similar conditions to illustrate the variation between individual membranes. The large green dot shows that at a pore pressure of 12 MPa, as applied in LARS, the extrapolated CH
4 flow is about 4.8 mL/min. (
b) Correlation between dissolved CH
4 in the feed solution and the CH
4 flow. Shown in red are the average values from the small-scale tests in (
a); shown in green is the CH
4 dissolution adjusted with respect to temperature and salinity (calculated according to Duan and Sun [
21]) in LARS.
3.3. Operation in LARS
Having all above information, the membranes were now ready to be tested in a near-real scenario -in the sediment-filled vessel, equipped with several monitoring systems; all aiming for a better understanding of hydrate formation and decomposition performance.
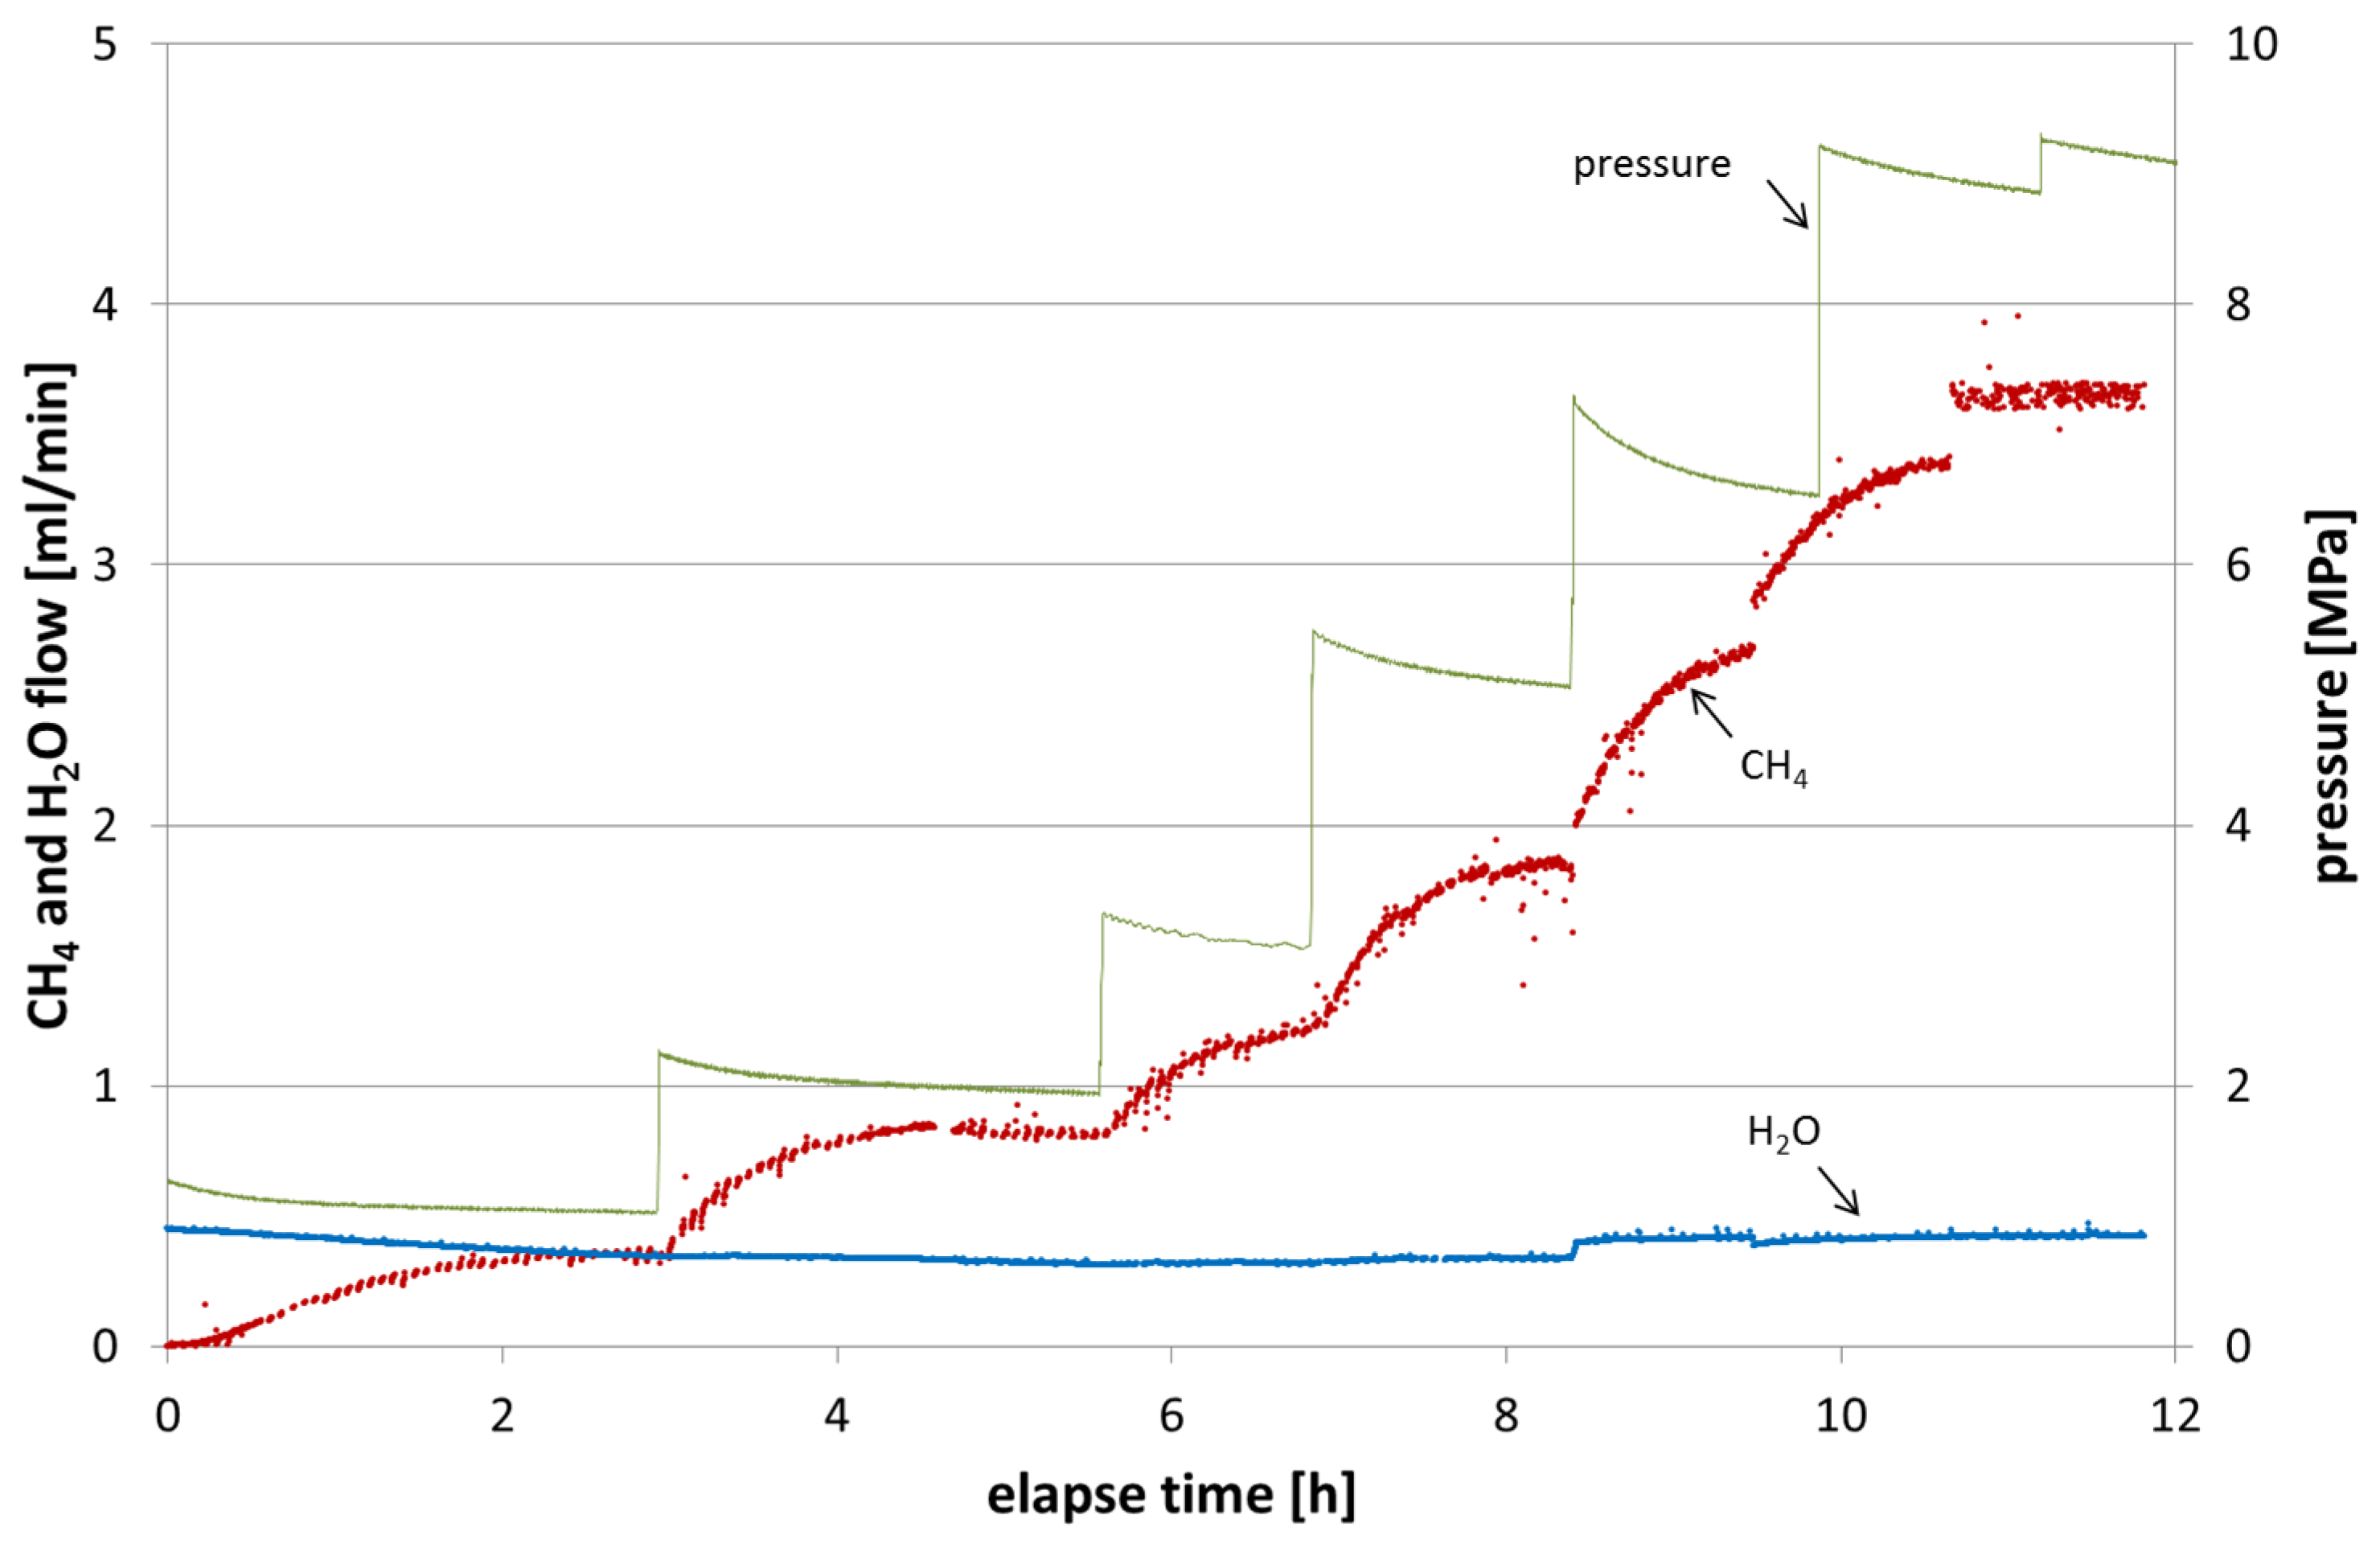
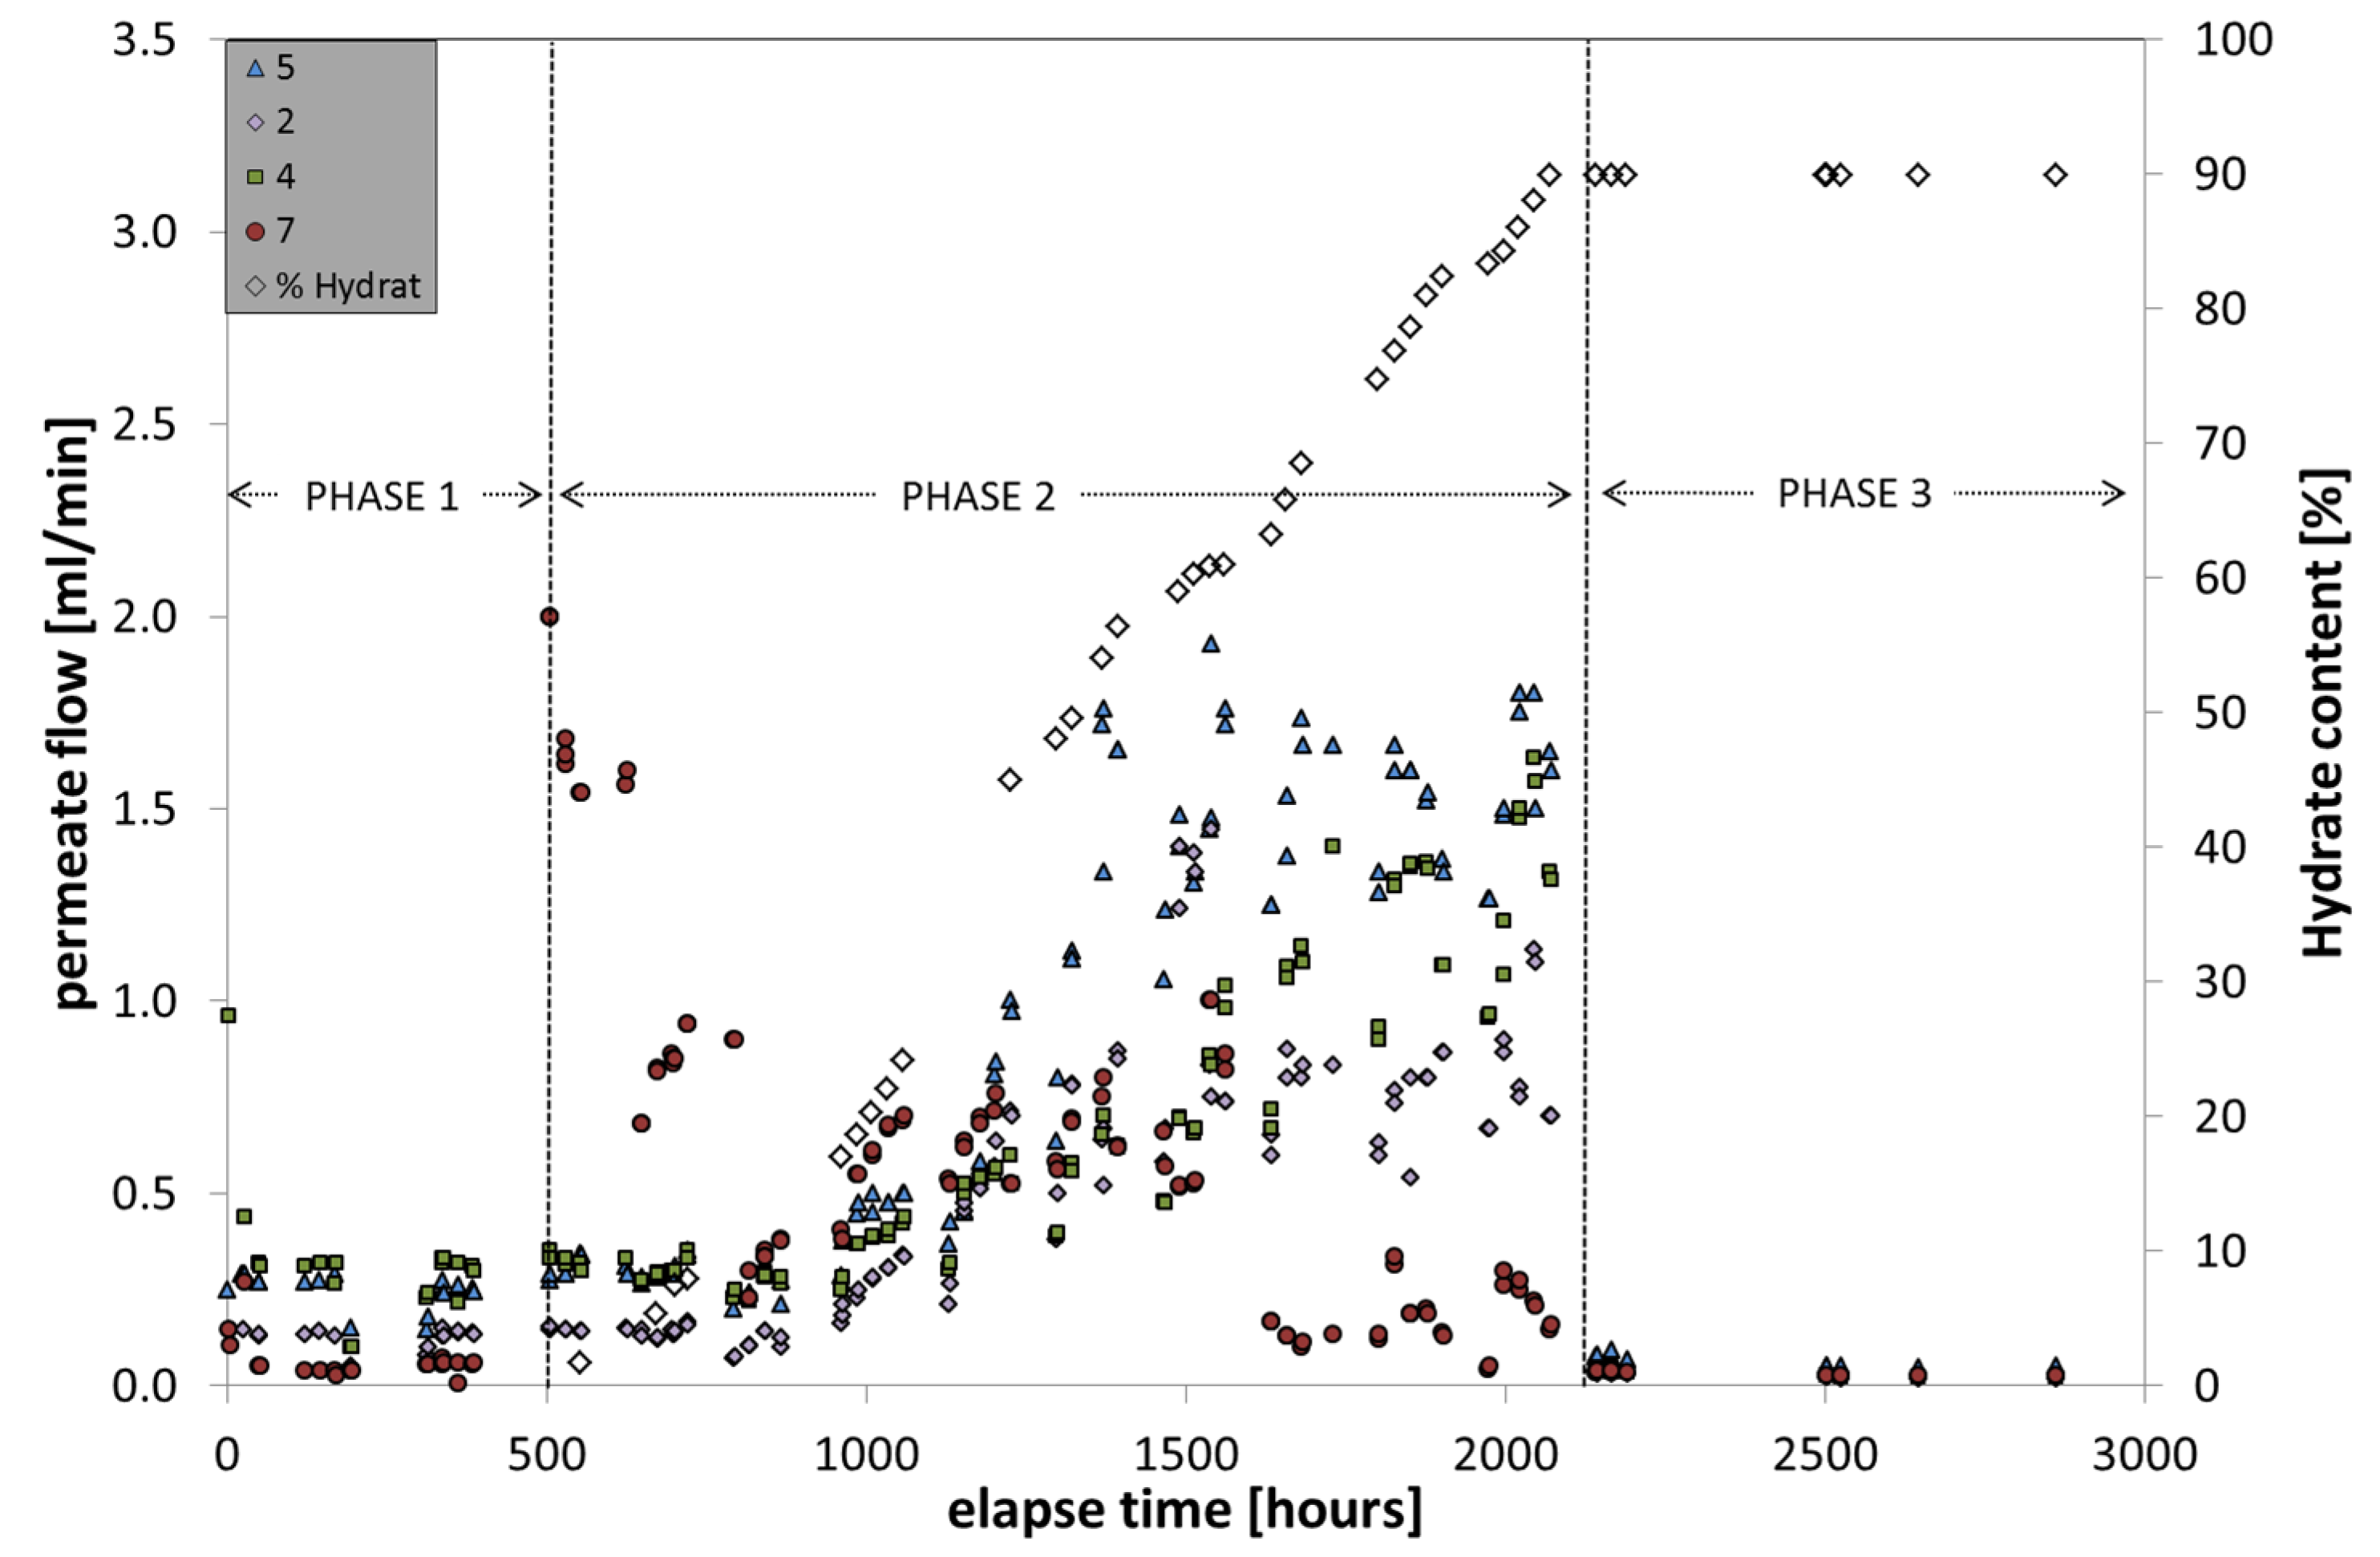
During the hydrate formation (
Figure 8), the pore pressure was adjusted to 12 MPa; temperature values can be approximated with 285 K, although they varied slightly within the large vessel due to internal inhomogeneous distribution of fresh water and hydrate formation. The initial salt concentration of 4.5 g/L increased in the course of freshwater uptake by hydrate formation to a final concentration of 10.5 g/L. Recognizable by membrane data, the hydrate formation can be subdivided into three steps.
During the first phase the pore water was continuously loaded with dissolved CH4 by permanently flushing fresh methane-loaded water through the entire LARS sediment pore space for several weeks. An increase in CH4 concentration in the pore space fluid, however, was not detectable by membrane data. It was noticeable that the capped membrane 7 comprised the lowest gas flow rate. The reason might be that the fresh water supply and exchange underneath the cap was limited, so that at this position the membrane was reached only by independently uprising gas bubbles, which are at this time not available.
Phase two comprises the time of hydrate formation from 0 to 90% hydrate occupation in the pore space of the sediment. According to the membrane data, the formation was initiated by the presence of an oversaturated solution with an excess of free gas in the water phase. This is concluded by the sudden increase of permeate flow of membrane 7 that indicates gas accumulation underneath the cap. Within the next 10 days the gas flow of membrane 7 decreased successively, whereas the gas flow data of the other three membranes remained relatively unchanged. When the hydrate content in the sediment increased above 10%, the gas flow of membrane 7 continued on a level below 1 mL/min, whereas the lower-positioned membranes increased in gas flow rates. This behavior continued between 1000 and 1500 h elapse time. Between 1500 h and the end of phase 2 at about 2000 h, the gas flow of membrane 7 dropped to significantly lower values of around 0.2–0.3 mL/min, while the other three membranes continued to slightly rise their permeate flow. The differences between the latter three might be caused by slightly different positions within the LARS where they were differently supplied with feed solution. The gas flow through the membranes increased to values up to one magnitude higher than during the starting phase.
Figure 8.
Gas flow monitoring through the membranes installed in LARS in the course of hydrate formation (18 weeks).
Figure 8.
Gas flow monitoring through the membranes installed in LARS in the course of hydrate formation (18 weeks).
In phase three of the hydrate formation experiment, the final hydrate saturation (90%) was reached and the circulation of CH
4-saturated water was stopped. This was immediately visible in the membrane data, which exhibited very low gas flow rates. This phase was invented to allow the system to equilibrate and to decrease temperature and concentration gradients within the LARS [
22]. The low permeation values in the phase of maximum hydrate occurrence show that from the hydrate deposit itself not much CH
4 was supplied to and through the membrane. Occasional measurements during the five weeks of balancing indicated very low permeation rates down to 0.02 mL/min. This leads to the conclusion that, even though there is a highly concentrated methane source (in the form of hydrate) available on the feed side with 12 MPa, the pressure gradient towards atmospheric pressure on the inner membrane tube (permeate side) is not sufficient to initiate CH
4 production by, at least local, hydrate dissociation and subsequent permeation through the membrane. This suggests that only the dissolved or gaseous phases constitute an appropriate source for membrane-based CH
4 extraction.
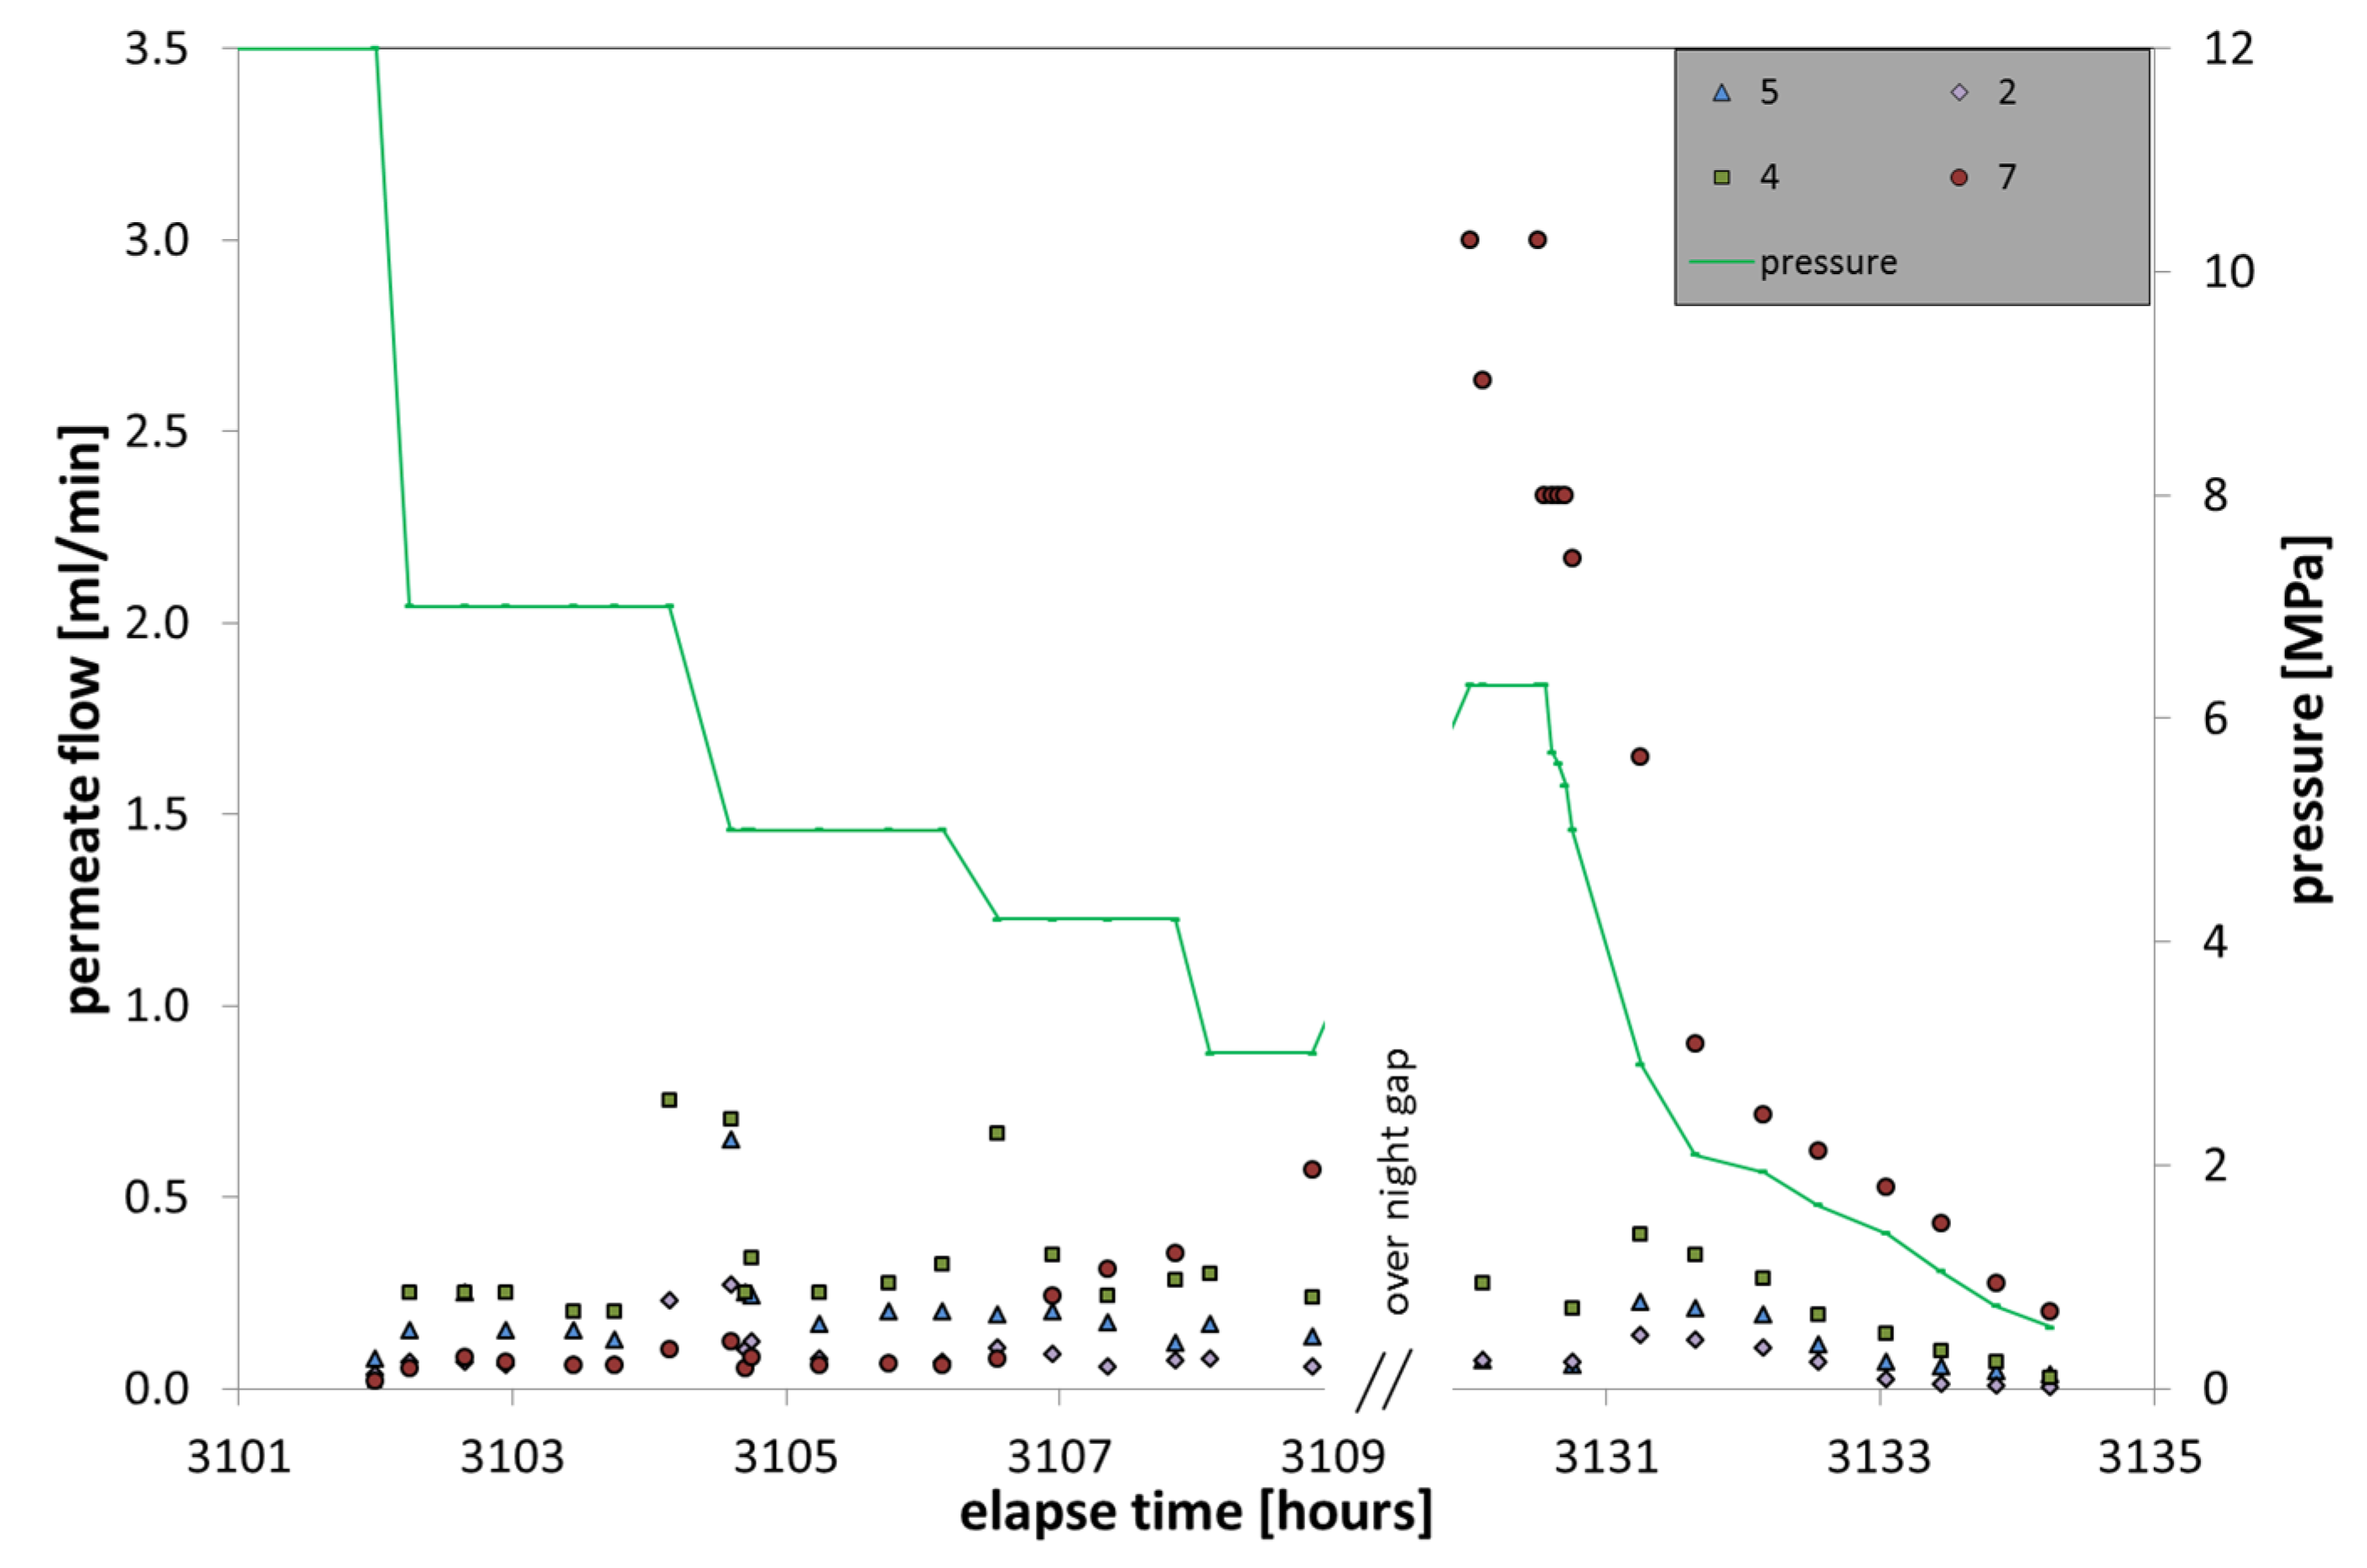
The hydrate dissociation in LARS (
Figure 9) was performed via depressurization and the pressure steps were chosen corresponding to a field test performed in the permafrost area in the McKenzie Delta in 2007–2008 [
23]. The starting pressure of 12 MPa was reduced stepwise to 7.0, 5.0, and 4.2 MPa and then further to 3.0 MPa. The pressure was kept at constant conditions for about two hours per step.
Figure 9.
Gas flow monitoring during the two days of hydrate decomposition through depressurization. The green line indicates the depressurization steps and shows the overnight increase. The elapse time continues from the prior hydrate formation experiment.
Figure 9.
Gas flow monitoring during the two days of hydrate decomposition through depressurization. The green line indicates the depressurization steps and shows the overnight increase. The elapse time continues from the prior hydrate formation experiment.
Immediately after pressure reduction to 7 MPa, the permeate flow increased by about a magnitude, from values of 0.02 mL/min to 0.1–0.3 mL/min. These values are comparable to that of phase 1 of hydrate formation and indicate CH4 in dissolution. However, the several further pressure drops left the gas flow rates fairly unaffected, except for some peaks. About 5 m3 CH4 were already released during the first eight hours of the hydrate decomposition in LARS (unpublished data). This was not observed in the membrane data and might be explained by a fast upstream of the liberated gas that left behind a mixture of continuously shrinking hydrate and water in the area of the membrane position. Still, a fast upstream of CH4 gas should be detected on the capped membrane 7, positioned on the upper part of the LARS vessel. The lack of free gas might be explained by a sealing of the area around the membrane due to occupation with hydrate, which prevented free gas from entering the cap and getting into contact with the membrane itself. Five hours after depressurization began, the values of membrane 7 started to increase continuously, suggesting first hydrate degradation in this area.
The CH4 flow is generally correlated with the membrane position in LARS. The higher the membrane position, the more CH4 could be gathered. Membrane 4 gained the most CH4 and also showed some randomly occurring exceptional high gas flow values. These might be in correlation with hydrate decomposition directly around the membrane, which then immediately gathered the released gas. Another explanation is the occurrence of gas bubbles that lingered on at the membrane surface.
In the overnight phase, the pressure increased back to 6 MPa, which was caused by further hydrate decomposition, hence expanding gas and water. Furthermore, a strong increase in gas flow on membrane 7 was detected, which suggests the occurrence of free gas. At the end of the deformation experiments the permeate flow went back to values comparable to those at the beginning of the experiment.
3.4. Discrepancies between Small-Scale Experiments and Experiments in LARS
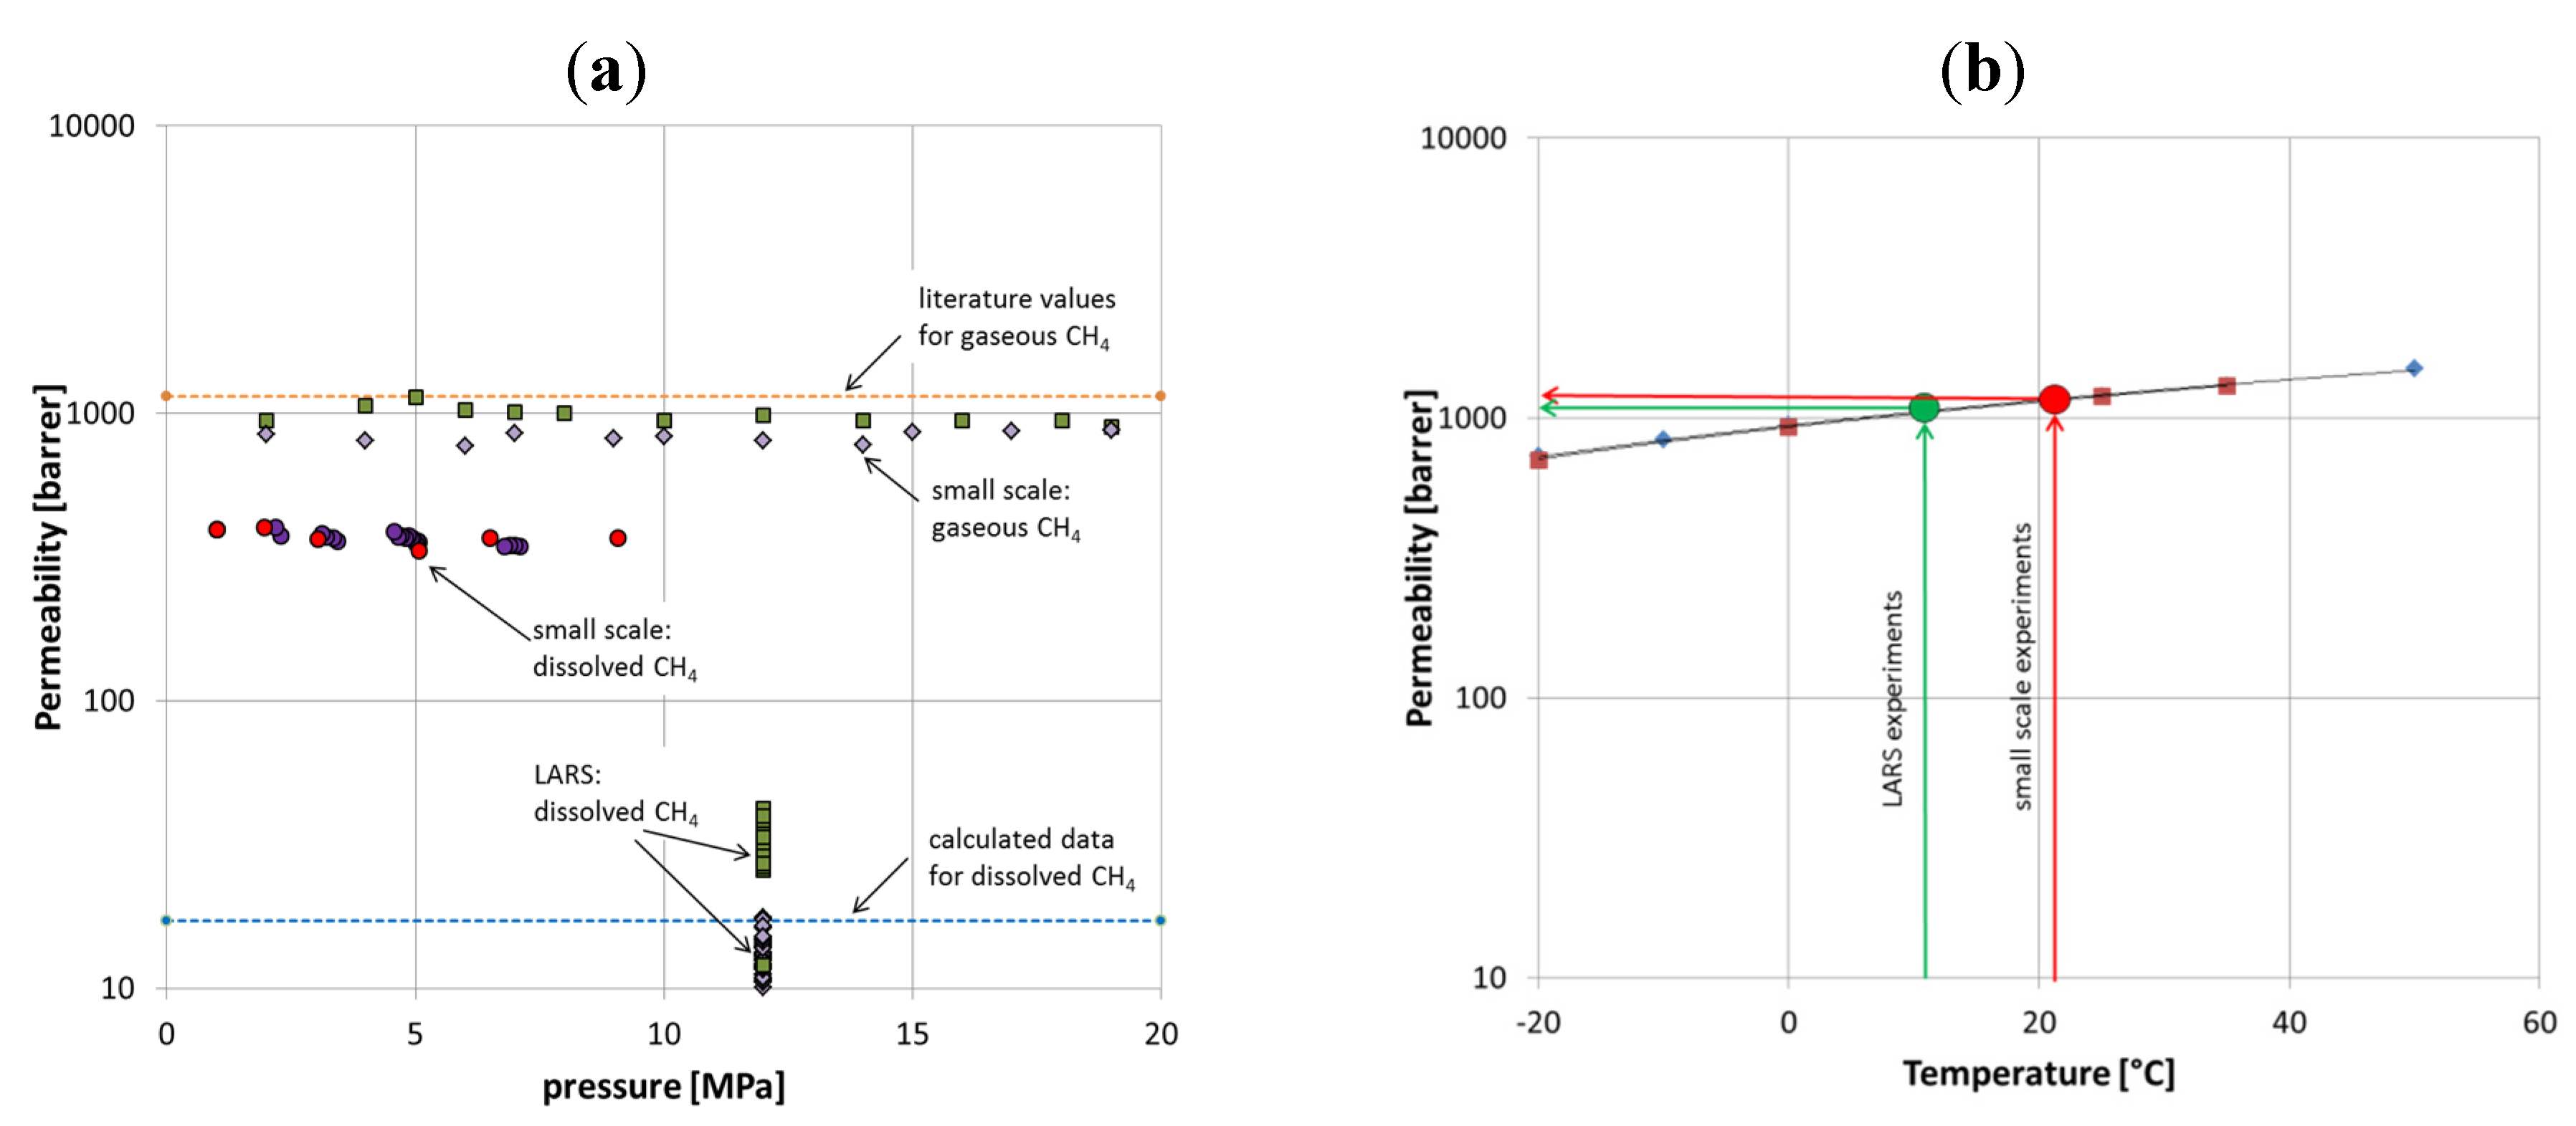
Generally, the permeate flow detected in LARS is considerably below what would be expected based on small-scale lab experiments. However, the measured values are in good agreement with theoretical assumed data.
There are a number of factors that differ between theory, small-scale, and large-scale experiments but these can only partly be quantified. First, the resistance of the glass bead filling against the gas transport across the membrane was doubled in LARS; as here, the membrane surface was surrounded not only by water or gas, like in the first small-scale experiments, but by sediments. The permeability for membranes used here ranged from 800 to 1100 Barrer (
Figure 10a). Literature values vary but can be assumed to be on average 1150 Barrer. In terms of quantifying this effect, we assume that glass bead filling reduced the effective permeability by approximately 100 Barrer; the outer sediment cover might double the effect and reduce permeability values by another 100 Barrer.
Figure 10.
(
a) Permeability variation for different settings, for comparison literature values [
16,
18], and calculated data for dissolved CH
4 are shown. (
b) Effect of temperature on permeability of CH
4. Literature values are shown in red [
16] and blue [
18].
Figure 10.
(
a) Permeability variation for different settings, for comparison literature values [
16,
18], and calculated data for dissolved CH
4 are shown. (
b) Effect of temperature on permeability of CH
4. Literature values are shown in red [
16] and blue [
18].
Furthermore, temperature has a general effect on permeability. According to Raharjo
et al. and Pinnau and He [
16,
18], the permeability correlates with temperature. The temperature difference between the small-scale experiments and the LARS experiments was about 10 °C. Accordingly, the permeability decreased by about 10%, which equals approximately 100 Barrer (
Figure 10b).
The effect of salinity towards the solubility of CH
4 gas in water was calculated according to Duan [
21] (illustrated in
Figure 7b) and is considered not to be of substantial influence on the data.
The large inconsistency between LARS-derived data and small-scale lab data might be explained by the discrepancy between actual feed compositions with respect to the ratio of gaseous and dissolved CH4. The assumptions that all gained CH4 in the permeate is derived from the dissolved phase in the feed might be ambiguous.
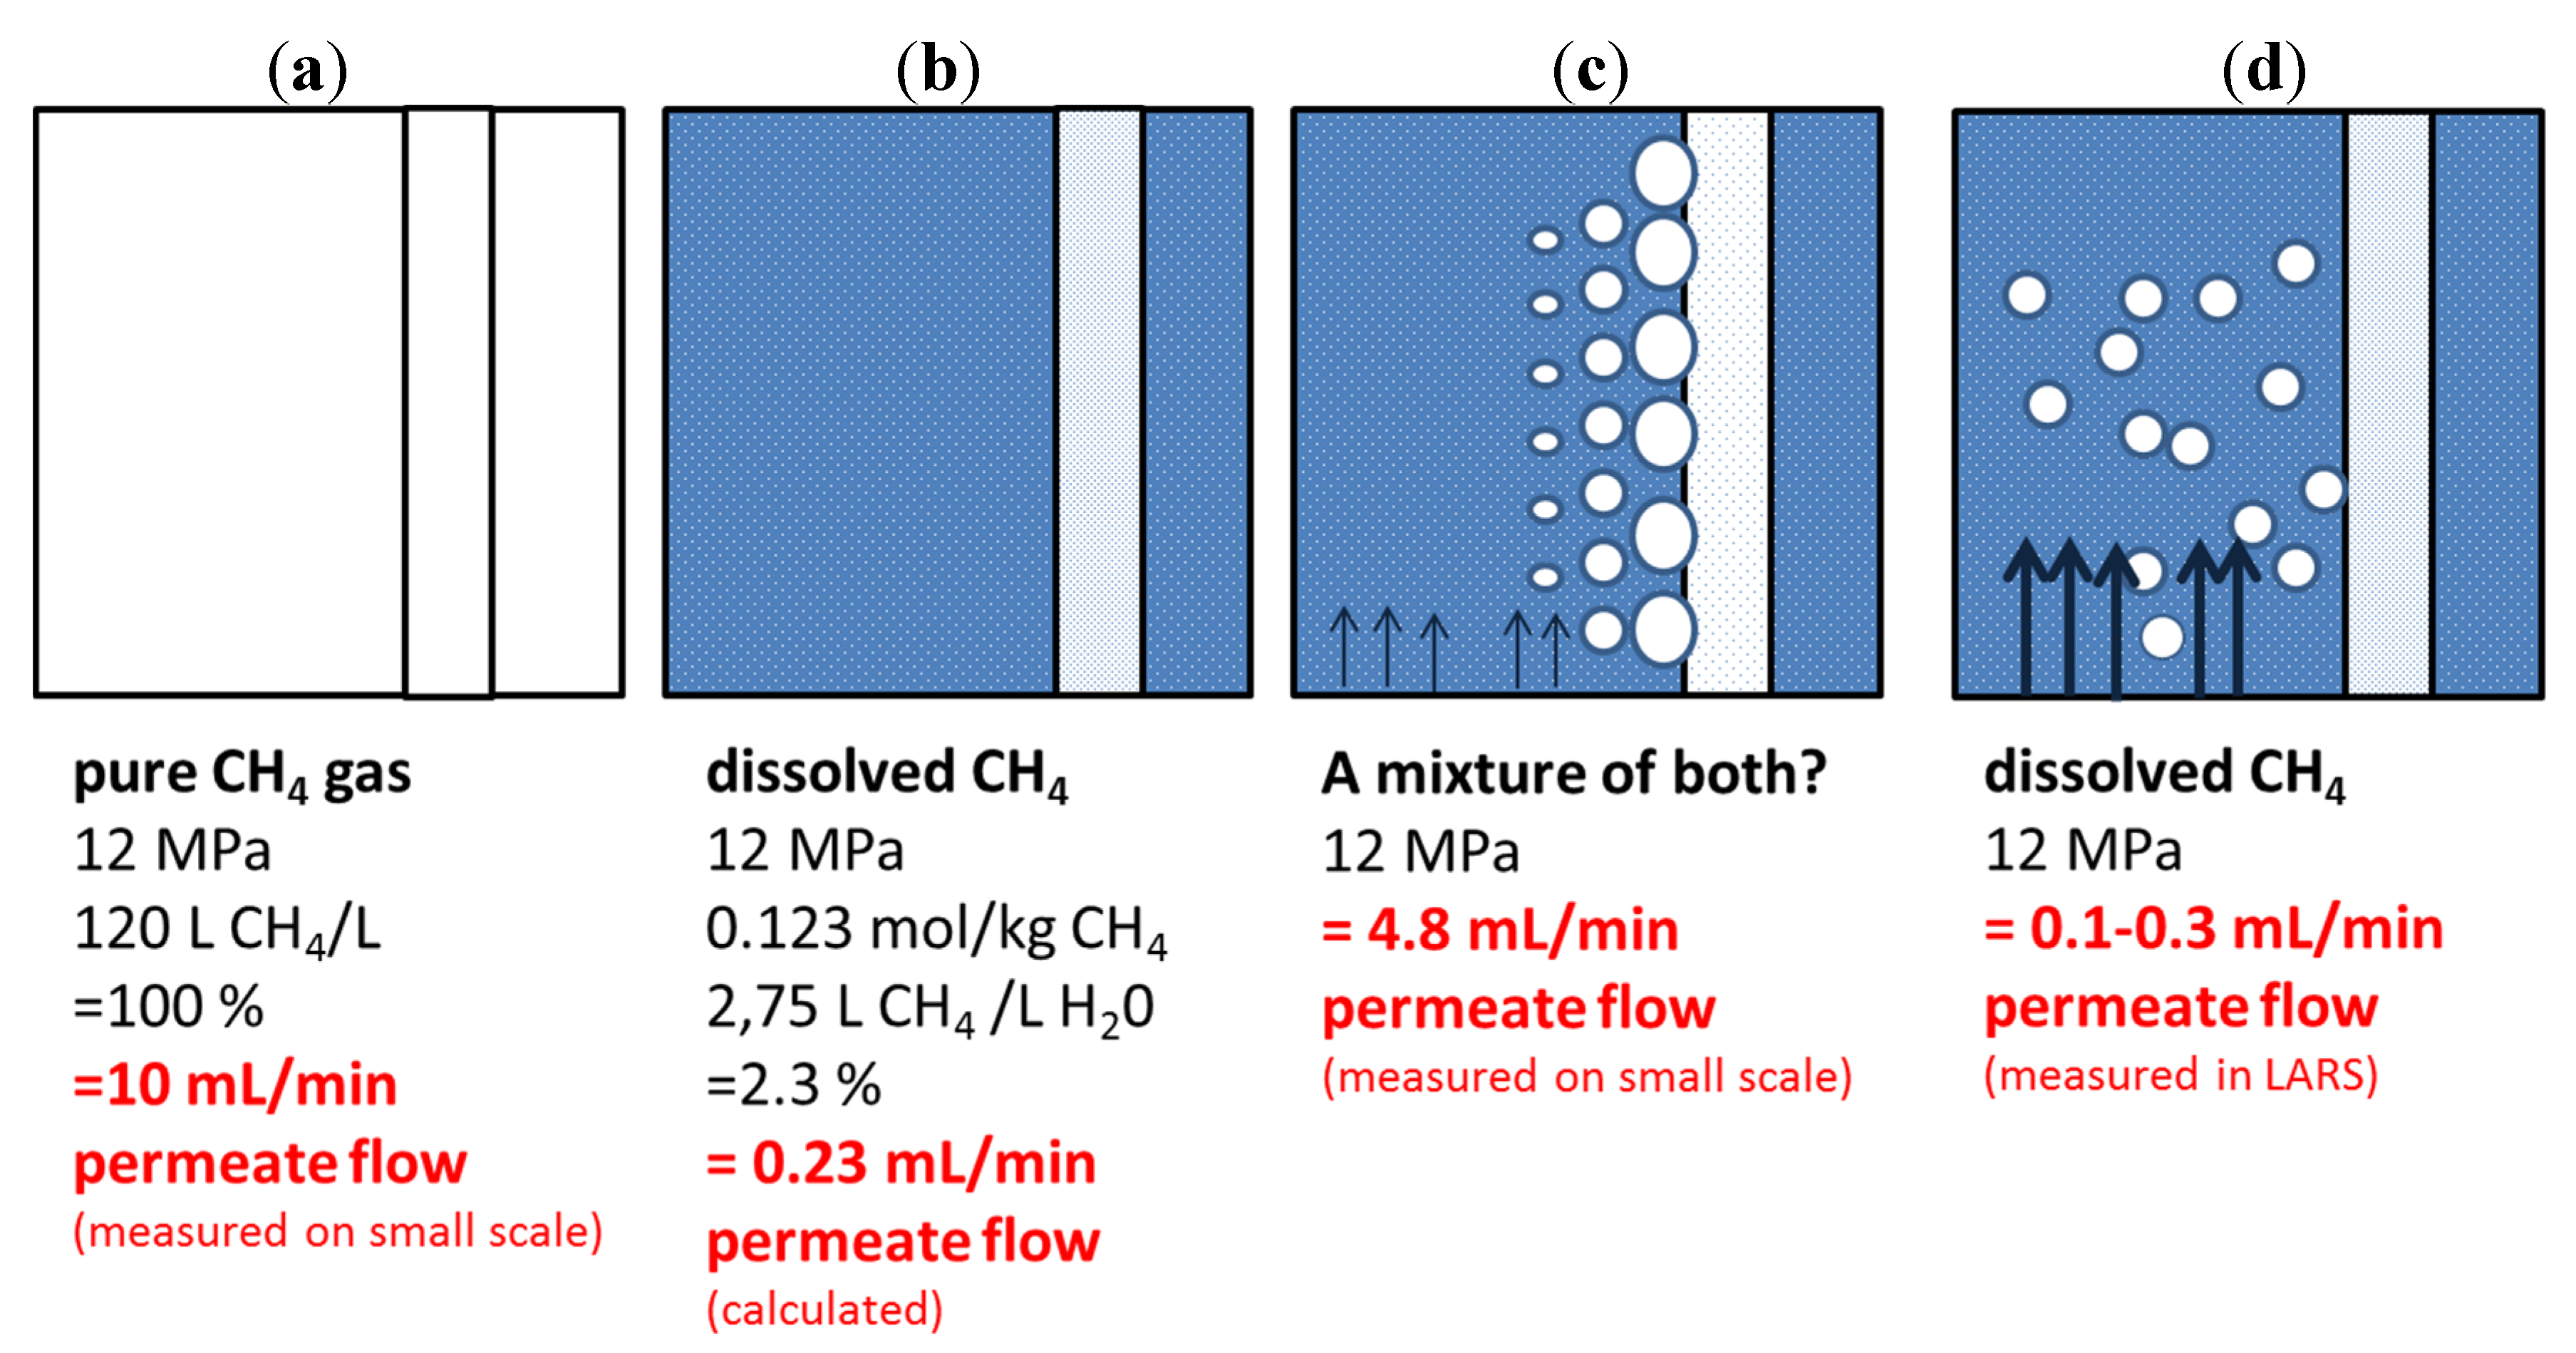
A simple theoretical approach shows the amount of permeate derived from gaseous CH
4; hence 100% CH
4 at 12 MPa is 10 mL/min (
Figure 11a). Calculations show that the permeate flow solely from dissolved CH
4 should be only 0.23 mL/min (
Figure 11b). This value is calculated by assuming a system of 12 MPa, salt-free water, and a temperature of 295 K where 2.75 L CH
4 dissolves in 1 L of water. Interestingly, the derived value is in agreement with LARS-derived data (
Figure 11d). Small-scale data, however, are considerably higher (
Figure 11c). We assume that, despite continuous circulation movement, the feed composition comprised a mixture of both gaseous and dissolved CH
4. Due to the pressure gradient of 12 MPa in the feed and 0.1 MPa inside the membrane tube, it might be possible that a pressure reduction in the immediate vicinity of the membrane tube caused CH
4-degassing from the solution with subsequent bubble accumulation on the membrane surface. This effect then resulted in a higher-than-expected CH
4 permeate flow. In contrast, this effect has likely been avoided in LARS due to the higher volume of feed solution and the much higher flow velocity that simply flushed away any free gas bubbles. Whereas in the small-scale experiments the circulation of the CH
4-saturated solution had 10 mL/min as its maximum, the LARS circulation flushes the feed solution with 10 L/min through the vessel.
Figure 11.
Sketch illustrating the theoretical approach to the expected amount of CH4 from (a) a pure gas phase and (b) from CH4 in solution and the discrepancies between (c) small-scale and (d) LARS-scale experiments.
Figure 11.
Sketch illustrating the theoretical approach to the expected amount of CH4 from (a) a pure gas phase and (b) from CH4 in solution and the discrepancies between (c) small-scale and (d) LARS-scale experiments.
4. Conclusions
The current study builds on the principle of membrane gas separation for application in CH4 gas extraction and monitoring.
Positioning the membrane in a hydrate-rich environment alone does not necessarily activate a sufficient pressure gradient to degrade the hydrate and subsequently capture the released CH4. However, the silicone tube membrane has proven suitable as a tool for capturing CH4 in the course of hydrate decomposition via depressurization or thermal stimulation. Especially for the latter, the concept of in situ decomposition and CH4 capture with its exothermal oxidation in a catalytic heat exchange reactor, it will be considered further.
Of further significance is the fact that the membrane as a monitoring tool has the advantage of being of low maintenance and low cost. The setup itself is promising as it represents a robust, versatile, and individually manufacturable item.
The presented results of CH4 permeation rates mirror the processes occurring during hydrate formation and decomposition in LARS and are, therefore, to be considered for further use.
However, at this stage no satisfactory quantitative data can be obtained. For this, a more comprehensive data pool needs to be acquired for the membranes on the small scale. In particular, bubble accumulation due to pressure gradients needs to be addressed in further studies. Also, the effects of salinity, temperature, and permeability on CH4 dissolution, as well as the resistance of the membrane surface, should be carefully considered in the next generation of experiments.
To conclude, this study shows that results of small-scale experiments are not necessarily transferable to large-scale or even natural conditions.


