Review

Recent Progress on the Resilience of Complex Networks

1
Center for Complex Network Research and Department of Physics, Northeastern University, Boston, MA 02115, USA
2
Key Laboratory of Image Information Processing and Intelligent Control, School of Automation, Huazhong University of Science and Technology, Wuhan 430074, China
3
Center for Polymer Studies and Department of Physics, Boston University, Boston, MA 02215, USA
4
School of Reliability and Systems Engineering, Beihang University, Beijing 100191, China
5
Science and Technology on Reliability and Environmental Engineering Laboratory, Beijing 100191, China
6
Department of Physics, Bar-Ilan University, Ramat-Gan 52900, Israel
*
Author to whom correspondence should be addressed.
Energies 2015, 8(10), 12187-12210; https://doi.org/10.3390/en81012187
Submission received: 2 July 2015 / Revised: 18 September 2015 / Accepted: 9 October 2015 / Published: 27 October 2015
(This article belongs to the Special Issue Resilience of Energy Systems)

Abstract

:
Many complex systems in the real world can be modeled as complex networks, which has captured in recent years enormous attention from researchers of diverse fields ranging from natural sciences to engineering. The extinction of species in ecosystems and the blackouts of power girds in engineering exhibit the vulnerability of complex networks, investigated by empirical data and analyzed by theoretical models. For studying the resilience of complex networks, three main factors should be focused on: the network structure, the network dynamics and the failure mechanism. In this review, we will introduce recent progress on the resilience of complex networks based on these three aspects. For the network structure, increasing evidence shows that biological and ecological networks are coupled with each other and that diverse critical infrastructures interact with each other, triggering a new research hotspot of “networks of networks” (NON), where a network is formed by interdependent or interconnected networks. The resilience of complex networks is deeply influenced by its interdependence with other networks, which can be analyzed and predicted by percolation theory. This review paper shows that the analytic framework for NON yields novel percolation laws for n interdependent networks and also shows that the percolation theory of a single network studied extensively in physics and mathematics in the last 60 years is a specific limited case of the more general case of n interacting networks. Due to spatial constraints inherent in critical infrastructures, including the power gird, we also review the progress on the study of spatially-embedded interdependent networks, exhibiting extreme vulnerabilities compared to their non-embedded counterparts, especially in the case of localized attack. For the network dynamics, we illustrate the percolation framework and methods using an example of a real transportation system, where the analysis based on network dynamics is significantly different from the structural static analysis. For the failure mechanism, we here review recent progress on the spontaneous recovery after network collapse. These findings can help us to understand, realize and hopefully mitigate the increasing risk in the resilience of complex networks.

1. Introduction

Network science is an interdisciplinary research field, attracting enormous and increasing attention from many disciplines, ranging from computer science, physics, biology, social science to engineering [1,2,3,4,5,6,7,8,9,10,11,12,13,14,15,16,17,18,19,20,21]. Many real-world complex networks are heterogeneous and show a power-law degree distribution, called scale-free (SF) networks [2,6], such as the Internet [22], the WWW [3], social networks [23,24,25,26,27,28], infrastructure networks [29], biological networks [30,31], etc. The discovery of SF networks has a large impact on the basic properties of networks, since SF networks exhibit drastically different properties compared to the classical Erdős–Rényi (ER) networks [32]. For example, SF networks are significantly more robust than ER networks to random failures, but less robust to targeted attack [3,4,5,33].
The resilience of a network characterizes its ability to remain functional after node or link failures, the study of which is usually based on three main factors: the network structure [4,5,8,33,34], the network dynamics [35,36] and the failure mechanism [37,38,39]. The resilience of complex networks can be either characterized by the integral size of the giant component during the whole attacking process [34,40] or defined by the percolation thresholds [4,41,42]. The percolation threshold, p c , is the minimal fraction of remaining nodes (or links) that leads to the collapse of the network [4,43], which is usually predicted by percolation theory, a method from statistical physics [43]. The percolation theory helps us identify the global connectivity of complex networks with critical threshold p c that distinguishes between the connectivity phase and the fragmented phase of networks. Apart from finding the percolation threshold, percolation theory yields quantitative information on the critical properties near the critical threshold, showing how fast or slow the system collapse is. Moreover, using percolation theory, one can address some other issues, such as efficient attacks or immunization [5,8,33,44,45], obtaining the optimal path [46] and designing robust networks [34,35].
For the network structure, increasing evidence shows that diverse critical infrastructures interact with each other, such as water and food supply, communications, fuel, financial transactions and power stations [47,48,49,50,51,52,53]. Take the coupled system for example, as shown in Figure 1: the electric power network provides power for pumping and for controlling the systems of the water network; the water network provides water for the cooling and emissions reduction of the power network; the fuel network provides fuel for generators in the electric power network; the electric power network provides power to pump oil in the fuel network, etc. [54].
Figure 1. (Color online) Illustration of the interdependent relationship among different infrastructures [54]. These complex relationships are characterized by multiple connections between infrastructures, feed-back and feed-forward paths and intricate, branching topologies. The connections create an intricate web that can transmit shocks across multiple infrastructures. [54].This figure is from Ref. [59].
Energies 08 12187 g001
To study the interdependence between networks, Buldyrev et al. [55] developed an analytical framework based on the generating function formalism [56,57], discovering a first order discontinuous phase transition, which is dramatically different from the second order continuous phase transition found in isolated networks. This means that the interdependence between networks can highly increase the vulnerability of the system, since the failure of nodes in one network may lead to the failure of dependent nodes in other networks, and this may happen recursively and lead to a cascade of failures and system collapse. For example, electrical blackouts that affect large regions are usually the result of cascading failures between interdependent communication network and the power grid [52,58].
The development of the model of interdependent networks triggered many follow-up works [59]. For example, Parshani et al. [60] studied a model more close to real systems, two partial interdependent networks; Shao et al. [61] developed a theoretical framework for understanding the robustness of interdependent networks with a varying number of support and dependency relationships. Baxter et al. [62] studied avalanches in interdependent networks. Cellai et al. [63] studied percolation in interdependent nodes with common links. Note that, in interdependent networks [55,60], there are two types of links: (i) connectivity links within each network and (ii) dependency links between networks. Connectivity links within and between networks have been studied extensively in [64]. The case in which two types of links may coexist in a single network has been studied in [65,66,67]. Hu et al. [68] studied the case where both dependency and connectivity links connect different networks in coupled network systems and found a hybrid first and second order transition. The theory for the cascading failures of interdependent networks potentially helps us to understand and realize the theoretical foundation in the study of resilience in the next generation of the power grid, including smart grids [69,70,71]. While the interdependency links between networks make the systems highly vulnerable, correlations exist between the degrees of the dependent nodes in both networks, and the vulnerability of these coupled system is also studied [63,72,73,74].
In many real systems, more than two networks might interact with each other. For example, in biology, the gene regulatory network, the protein interaction network and the metabolic network are coupled with each other. Gao et al. [42,75,76] developed an analytical framework to study the percolation of a tree-like network formed by n interdependent networks (tree-like NON), discovering that while for n = 1 , the percolation transition is a second order, and for any n > 1 , where cascading failures occur, it is a first order (abrupt) transition. The tree-like NON has some other extensions, such as the multiplex networks [62] considered as n interdependent networks without the feedback condition and the interdependent networks based on epidemic spreading [77]. More recently, Gao et al. [78] developed a general framework to study the percolation of any “network of networks” and found that the percolation theory of a single network studied extensively in physics and mathematics in the last is a specific limited case of the more general case of n interacting networks. Due to the broad range of applications of networks of networks, there are many studies in this field [42,53,55,79,80], such as the robustness of the network of ecological networks [81], the robustness of multiplex networks [62], the percolation of two antagonistic networks [82], the transportation in two interconnected networks [83,84], the eigenvalue and eigenvector analysis of multi-layered networks [85,86,87,88,89], and so on.
Another fundamental property of network structure influencing resilience is that the systems are usually spatially embedded. For example, cascading failures [90] have caused blackouts in interdependent communication and power grid systems spanning several countries [52]. The spatial properties of the power grid and transportation networks can be modeled by a lattice model due to its simplicity. This is since their links have a typical length, which is significantly smaller than the system size. Based on the universality principle of statistical physics, the breakdown process of the power grid can be viewed as a phase transition, whose critical properties are independent of the network structure details. These critical properties are considered universal on different spatial networks with the same dimension (note that the dimension of the power grid and lattice is two). Indeed, by comparing the lattice model presented here to a more general model proposed by Danziger et al. [91], where the distribution of link lengths is more like the power grid, similar results are obtained. In order to design resilient infrastructures or to improve existing ones, it is necessary to understand how vulnerability is affected by such interdependencies [52,54,92]. Spatially-embedded networks characterized by a dimension, which depends on the link length distribution [12,93,94], are extremely vulnerable to various types of attacks [95,96,97] when they are interdependent on each other.
For the study of the resilience of complex networks, besides the network structure, the second main factor is the network dynamics. Most studies carried out on networks assume static networks, while many real systems are dynamically evolving with time or influenced by other factors. For example, the flows in traffic networks evolve with time [35], and the gene regulatory networks are different under different environment conditions [98]. The behavior of the resilience of dynamic systems may be different from the static systems where the breakdown only occurs in their structure. For example, the functional part of a traffic transportation network is usually determined by the dynamical flows, which may be different from the giant connected component in static networks. Moreover, the robustness of the dynamic traffic networks [35] can be improved by increasing the velocities of the bottleneck links, which are identified via the dynamic functional traffic network, and these links are usually different from the results of network analysis based solely on structural information. It has been observed [35] that there is hardly a correlation between the dynamic robustness and the velocities of the links with the highest betweenness, which are usually considered as a structural bottlenecks.
Furthermore, the failure mechanism is another main factor in the study of the resilience of complex networks. Many works that we reviewed above, especially the work on interdependent networks [55,60] and networks of networks [42,75,76], already demonstrate the mechanism of cascading failures. For some systems in real-world scenarios, after the breakdown, they can spontaneously recover, such as brain seizures in neuroscience or sudden market crashes in finance; after an inactive period of time, a significant part of the damaged network is capable of spontaneously becoming active again; moreover, the process can often occur repeatedly. Majdandzic et al. [39] developed a framework for understanding dynamic networks based on the node recovery process that demonstrates the systems’ or system of systems’ [99] ability to spontaneously recover. These papers [39,99] also demonstrate the conditions for which a system will be in a functional state.
These three main factors (network structure, network dynamics and failure mechanism) play important roles in determining the resilience of realistic critical infrastructures, which may also shed light on the study of the resilience of the power grid (an important system related to energies). In this review, we discuss in Section 2 the percolation of a network formed of nodes that represent interdependent networks. We review the new phenomena found in networks of networks and show that the new percolation laws of interdependent networks generalize the known results for single networks. Since spatially-embedded networks are common in our world, we discuss in Section 3 the results on the extreme vulnerability of interdependent spatially-embedded networks. Moreover, we summarize the percolation transition and spontaneous recovery in dynamic systems respectively in Section 4 and Section 5.

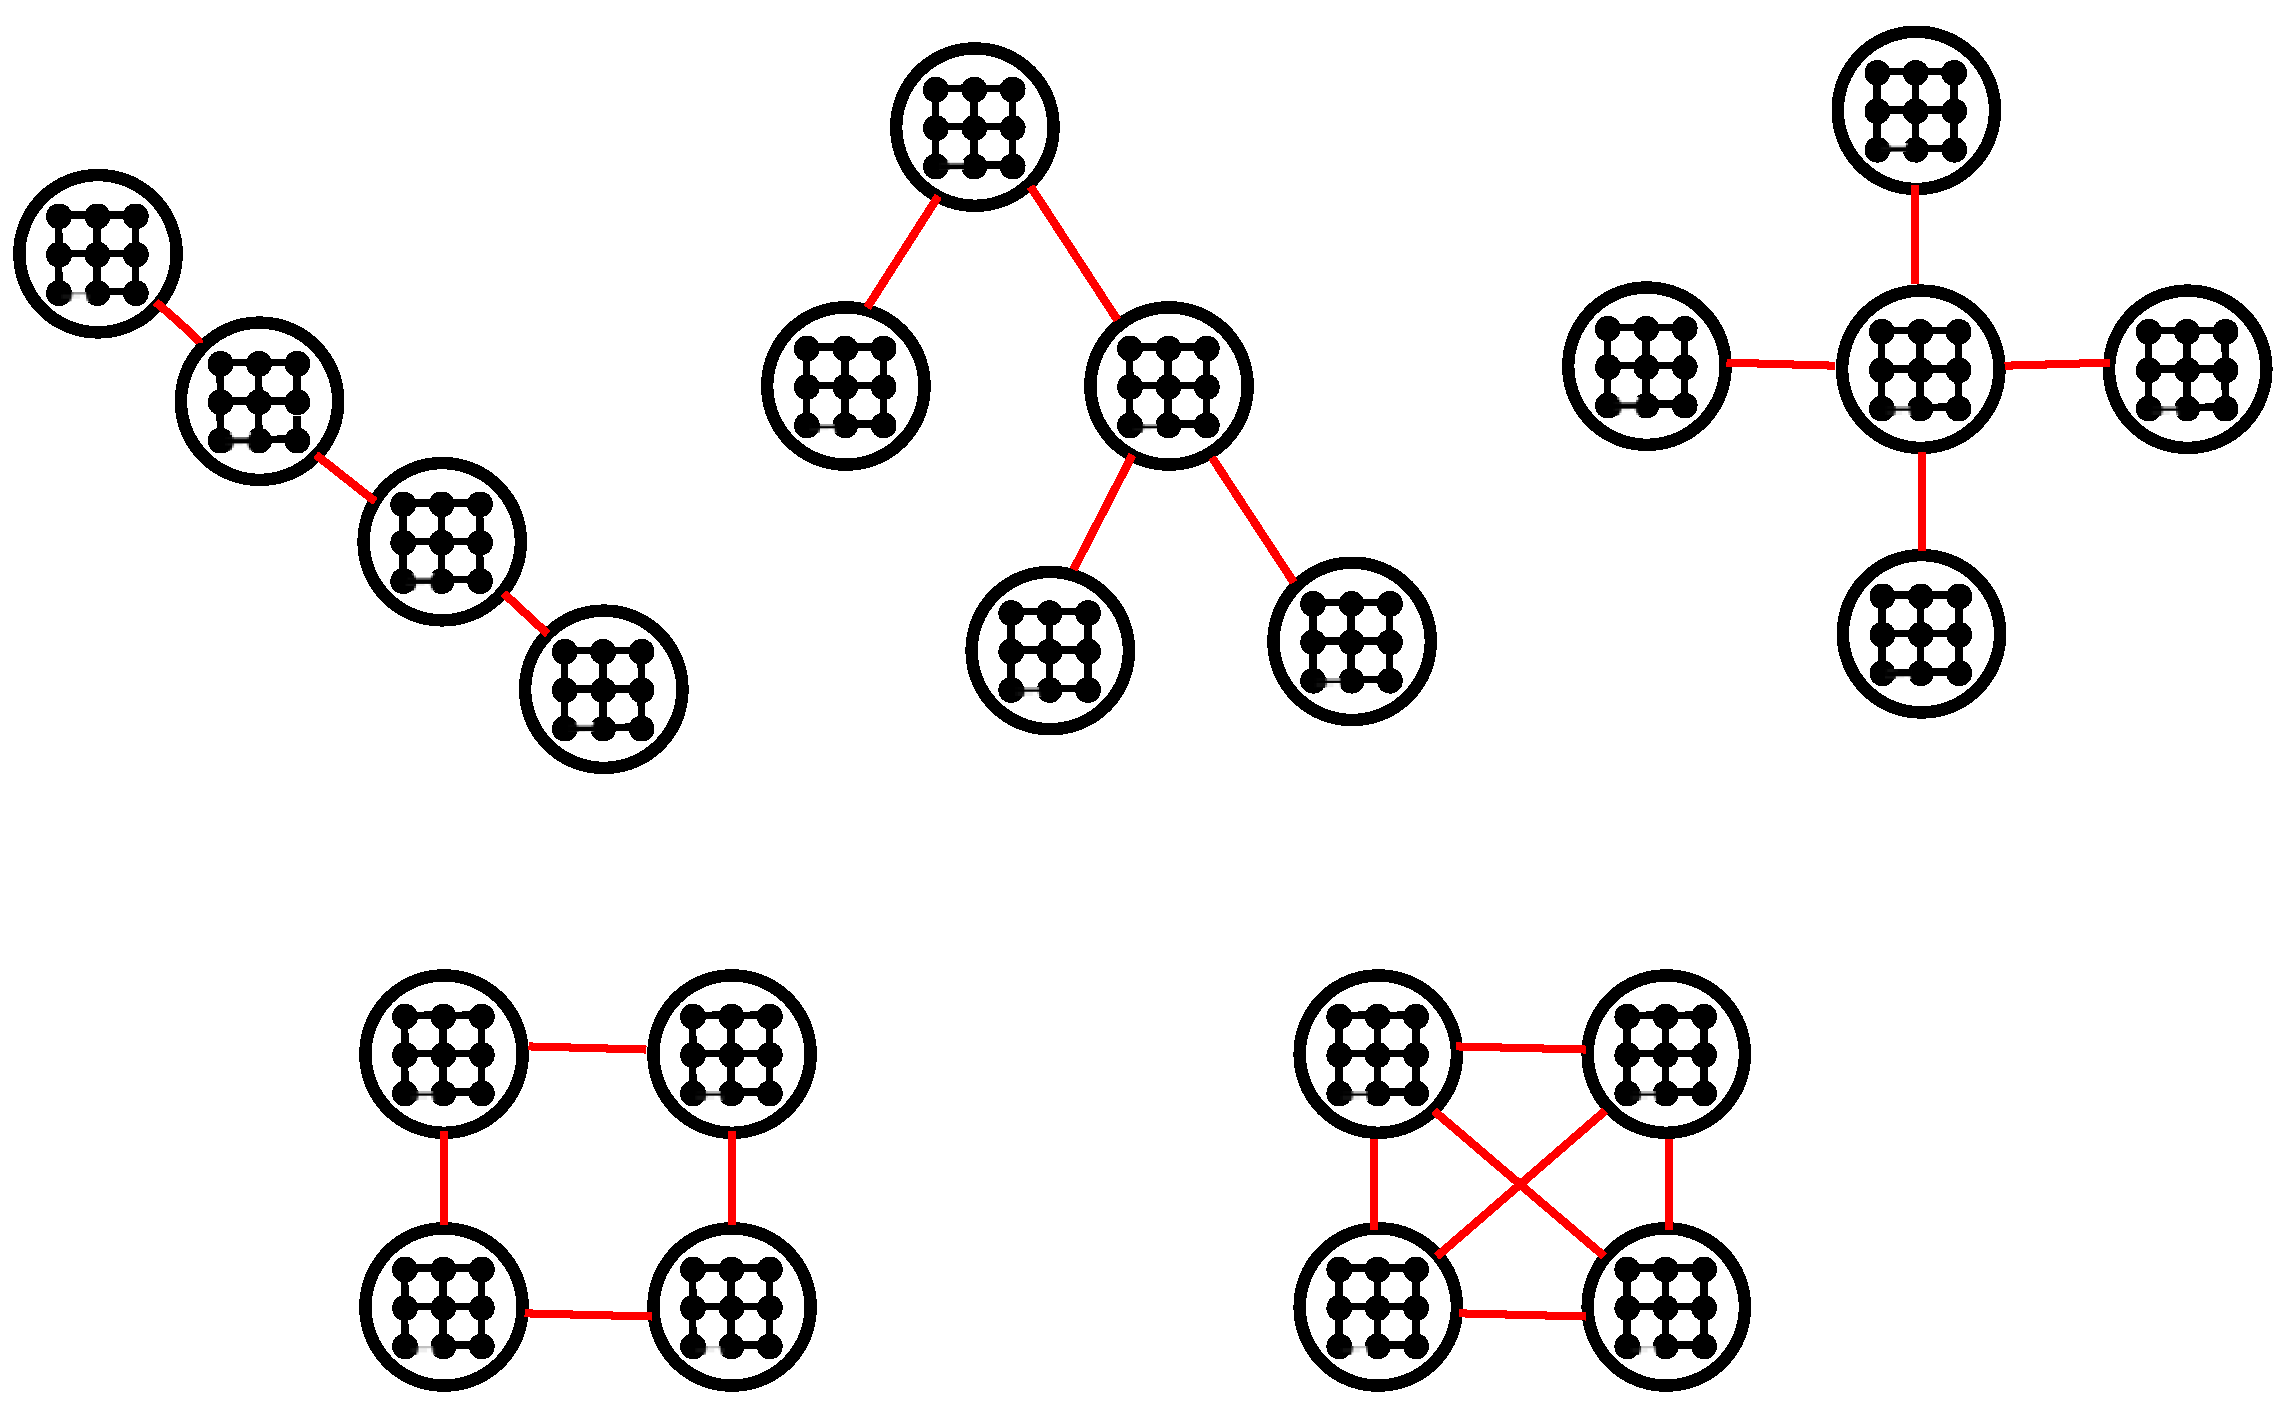
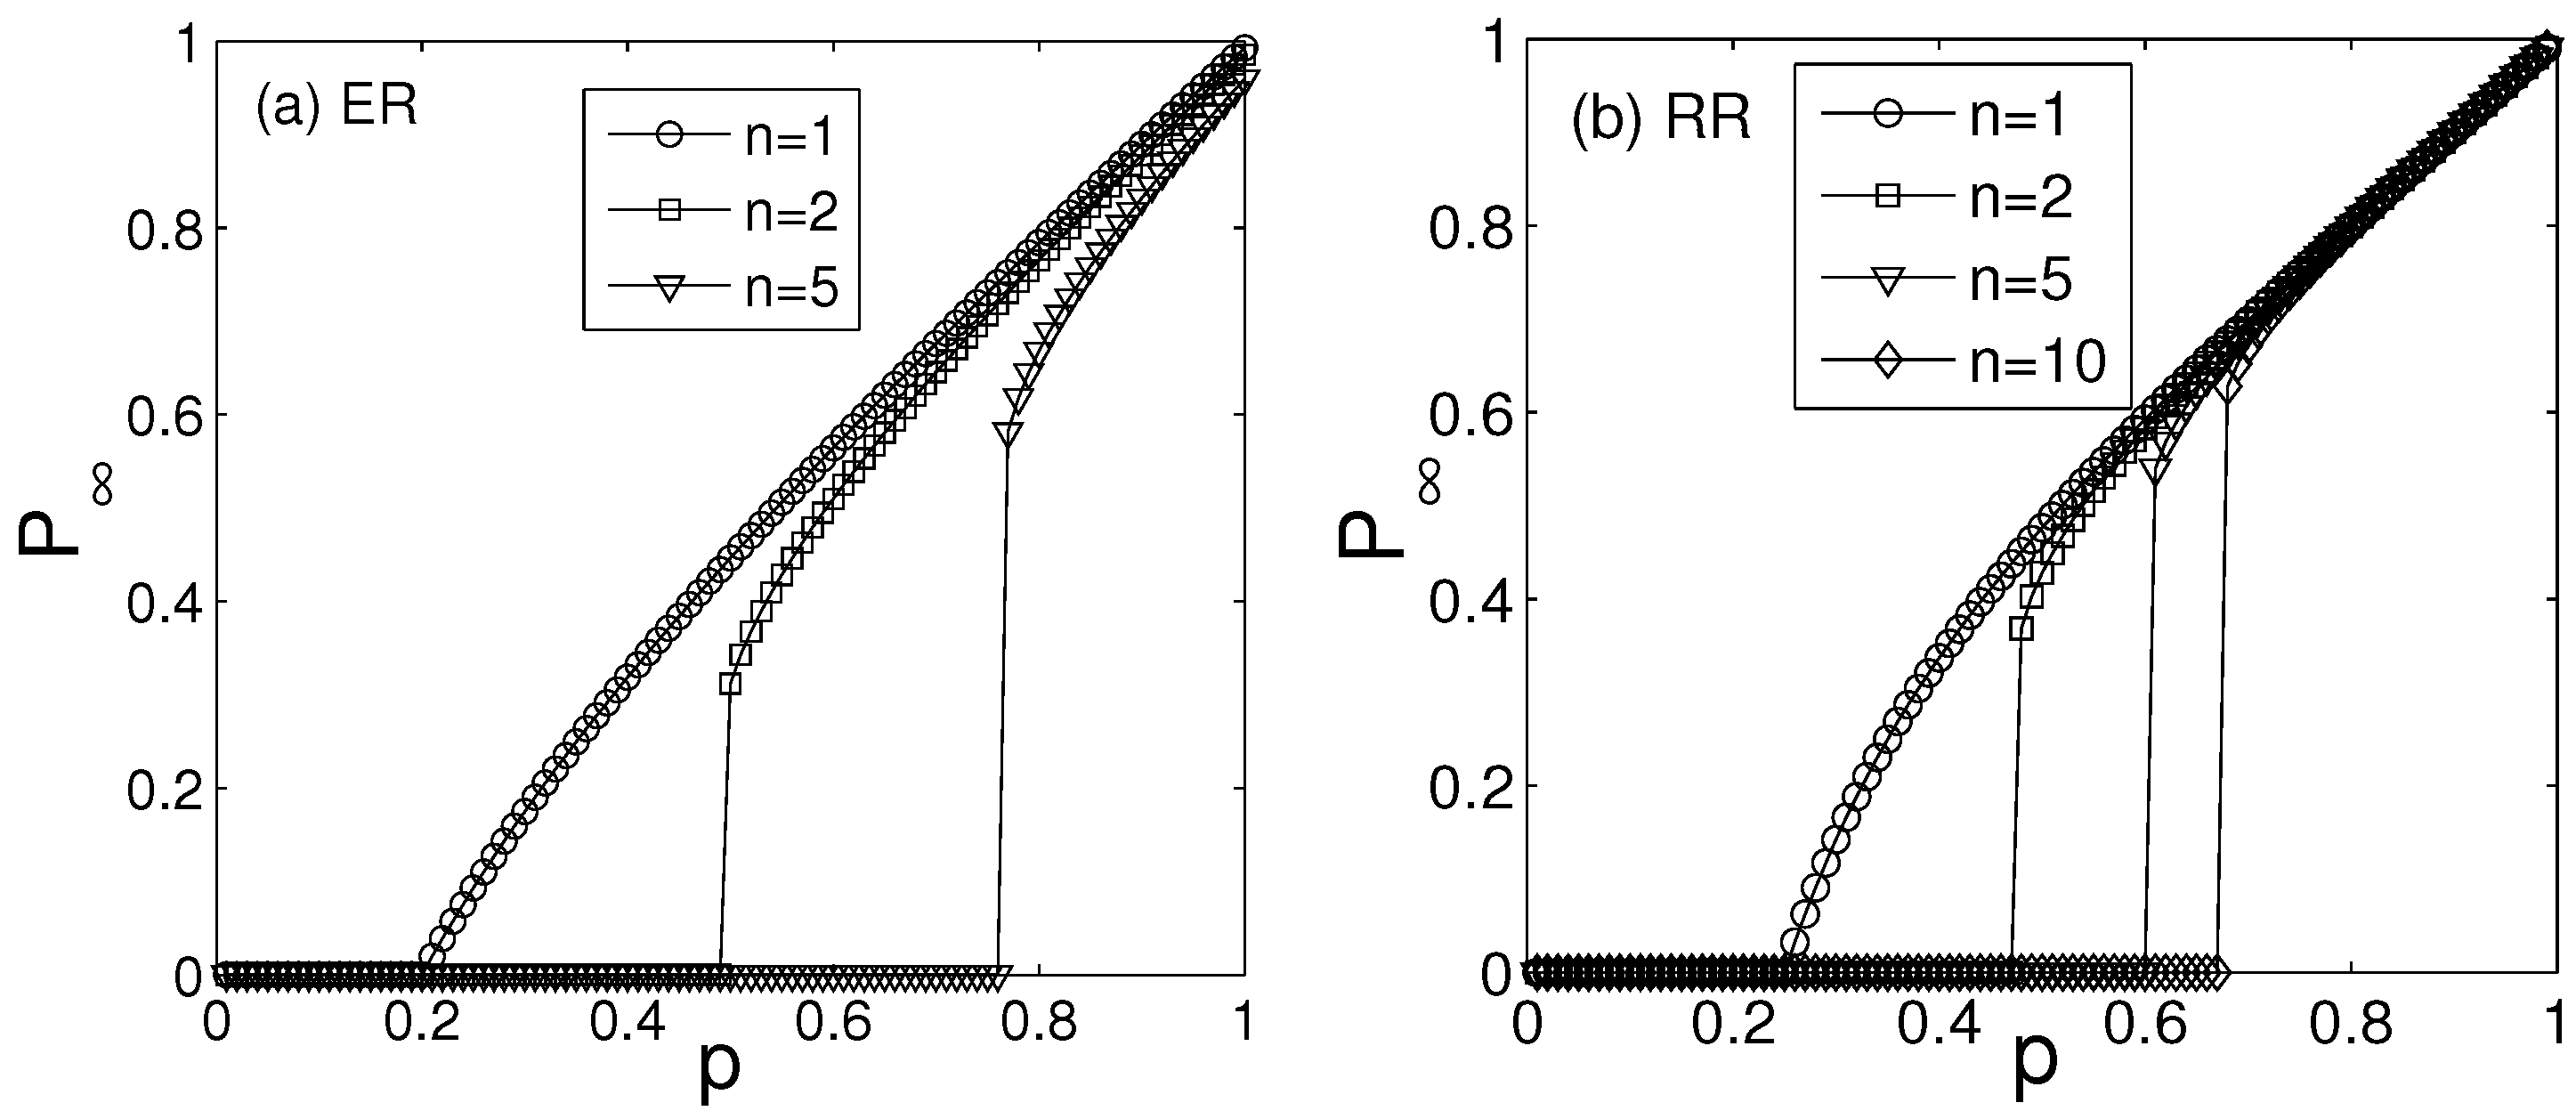
2. Framework for a Network Formed of Interdependent Networks

Diverse networks are coupled together and depend on each other: for example, gene regulatory networks, protein interaction networks and metabolic networks are coupled in biology; and the power grid networks, communication networks and other critical infrastructures are dependent on each other. Such coupled networks form a system of a NON. Understanding how the interdependence between networks affect the system robustness is one of the major challenges when designing resilient infrastructures. Here, we review the theory generalization of the robustness of NON [42,75,76].

2.1. General Framework

Consider a system (NON) composed of n nodes, as shown in Figure 2, where each node is a network and each link represents a full or partial dependency relation between networks.
Figure 2. Schematic representations of a network of networks (NON) and several examples of its possible structures. Connectivity links (black) exist within networks, and dependency links (red) connect different networks. Examples include a line (top left), a tree (top center), a star (top right), a random regular network of networks where each network has m = 2 dependencies (bottom left) and a random regular network of networks with m = 3 (bottom right). After [100].
Energies 08 12187 g002
Each network i ( i = 1 , 2 , . . . , n ) of the NON is assumed to consist of N i nodes linked by connectivity links and is characterized by a degree distribution P i ( k ) . Two networks i and j form a partially-dependent pair if a certain fraction q j i > 0 of nodes of network i directly depends on the nodes of network j, that is the nodes of network i will stop functioning if the nodes in network j on which they depend do not function. In each network i, we remove a fraction of 1 - p i of nodes and only a fraction of nodes p i could function after initial attacks or random failures. The assumption that only nodes that belong to the giant connected component of each network i remain functional can be used to explain the cascade of failures: nodes in each network i that do not belong to its giant component fail, causing failures of nodes in other networks that depend on the failing nodes of network i. Such a failure of the nodes in other networks will cause further failures of nodes in network i, which depends on the failed nodes of the other networks, and this process will keep on iteratively, until no more failure could happen. At the final steady state, the final giant component size of each network P , i can be computed by the equations from [78]:
P , i = x i g i ( x i )
where g i ( x i ) is the function for computing the size of the giant component of network i and x i ( i = 1 , 2 , . . . , n ) satisfy the following n equations:
x i = p i j = 1 K [ q j i y j i g j ( x j ) - q j i + 1 ]
and the product is taken over the K networks inter-linked with network i by the partial dependency links (non-zeros q j i ). If the dependencies between networks satisfy the condition of “no-feedback” (if node a l of network i depends on node b m of network j and b m depends on node a n in network i, then l = n ) [42], the fraction of nodes in network j that survive after the damage caused by the dependencies between network j and other networks, except network i, can be written as:
y i j = x i q j i y j i g j ( x j ) - q j i + 1
If the dependencies do not satisfy the condition of “no-feedback”, then y i j = x j .

2.2. Percolation Laws

Next, we will summarize the percolation laws in an NON for both cases where the dependencies satisfy the “no-feedback” condition and where no such condition holds [42,75,76,78].
(a) No-feedback condition
(i) Given a tree-like NON consisting of n Erdős–Rényi (ER) [32] networks with the same average degrees k and each pair of networks are fully interdependent q i j = 1 , after removing the 1 - p fraction of nodes from any one of the networks, the size of the mutual giant component (the final giant components, which are the same for all networks after the process of cascading failure) [75] follows:
P = p [ 1 - exp ( - k P ) ] n
If n = 1 , Equation (4) is the result for a single ER network [32], and the system shows a second order phase transition, while for n > 1 , the system undergoes a first order phase transition, as shown in Figure 3a.
(ii) For a tree-like NON formed by n random regular (RR) networks [76] with the same degree k, after removing the 1 - p fraction of nodes from any one of the networks, the size of the mutual giant component follows:
P = p { 1 - { p 1 n P n - 1 n [ ( 1 - ( P p ) 1 n ) k - 1 k - 1 ] + 1 } k } n
If n = 1 , Equation (5) yields the result of a single RR, as shown in Figure 3b.
(iii) For an NON composed by an n ER network with the same average degree k where each network depends on exactly m other networks (an RR network where each node is an ER network) and each pair of interdependent networks has a coupling strength q, after removing a fraction 1 - p of nodes from one network, the final giant component [75] size of the system and of each network follows:
P = p 2 m ( 1 - e - k P ) [ 1 - q + ( 1 - q ) 2 + 4 q P ] m
where P does not depend anymore on the number of networks n. Note that if q = 0 or m = 0 , then P = p ( 1 - e k P ) , which is again the result of a single ER network [32]. The good agreement between theory and simulations is shown in Figure 4; for the details, see [78].
Figure 3. The tree-like NON is composed of (a) Erdős–Rényi (ER) networks and (b) random regular (RR) networks. Plotted is P as a function of p for k = 5 for RR networks composed of (a) ER and (b) RR networks for several values of n. The results obtained using Equation (4) for ER networks and Equation (5) for RR networks (lines) agree well with the simulations (symbols). After [76].
Energies 08 12187 g003
Figure 4. The giant component for an RR network composed of ER networks, P , as a function of p, for ER networks with average degree k = 10 , (a) for two different values of m and q = 0.5 and (b) for two different values of q and m = 3 . The curves in (a) and (b) are obtained using Equation (6) and are in excellent agreement with the simulations (symbols). The symbols are obtained from simulations by averaging over 20 realizations for N = 2 × 10 5 . In (a), simulation results are shown as circles ( n = 6 ) for m = 2 and as diamonds ( n = 12 ) for m = 3 . These simulation results support our theoretical result, Equation (6), which is indeed independent of the number of networks n. After [78].
Energies 08 12187 g004
(b) Absence of no-feedback condition
(iv) For an NON composed by n ER network with the same average degree k , each network depends on exactly m other networks (an RR network where each node is an ER network), and the dependencies between networks do not satisfy the “no-feedback” condition. The size of the final giant component [75] for all networks after removing a fraction 1 - p of nodes from each network follows:
P = p ( 1 - e - k P ) ( 1 - q + q P ) m
(v) For an NON composed by n RR networks with the same degree k, where each network depends on exactly m other networks (an RR network where each node is an RR network), after removing randomly a fraction 1 - p of nodes from one network, the size of the giant component [75] follows:
1 - 1 - P p ( 1 - q - q P ) 1 k = p 1 - 1 - P p ( 1 - q - q P ) k - 1 k ( 1 - q + q P ) m
Again, both Equations (7) and (8), if m = 0 or q = 0 , show the analytical results of a single network. Equations (7) and (8) agree well with the simulation results, as seen in Figure 5 and Figure 6.
This rich generalization shows that the percolation of a single network studied for more than 50 years is a limited case of the more general case of a NON.
Figure 5. The giant component for an RR network of ER networks with feedback condition P as a function of p for ER average degree k = 10 , for different values of m when q = 0.5 and (a) for different values of q when m = 3 . The curves in (a) and (b) are obtained using Equation (7) and are in excellent agreement with the simulations (symbols). The symbols are obtained from simulations of an NON with n = 6 networks forming a circle by averaging over 20 realizations with N = 2 × 10 5 with both cases m = 2 and m = 3 . The absence of the first order regime in the NON formed of ER networks is due to the fact that at the initial stage, nodes in each network are interdependent on isolated nodes (or clusters) in the other network. However, if only nodes in the giant components of both networks are interdependent, all three regimes, second order, first order and collapse, will occur, like in the case of the RR NON formed of RR networks. After [78].
Energies 08 12187 g005
Figure 6. The giant component for an RR NON formed of RR networks with feedback condition P as a function of p for the RR of degree k = 6 and m = 3 , for two different values of q. The curves are obtained using Equation (8), which shows a first order phase transition when q is large, but a second order phase transition when q is small. After [78].
Energies 08 12187 g006

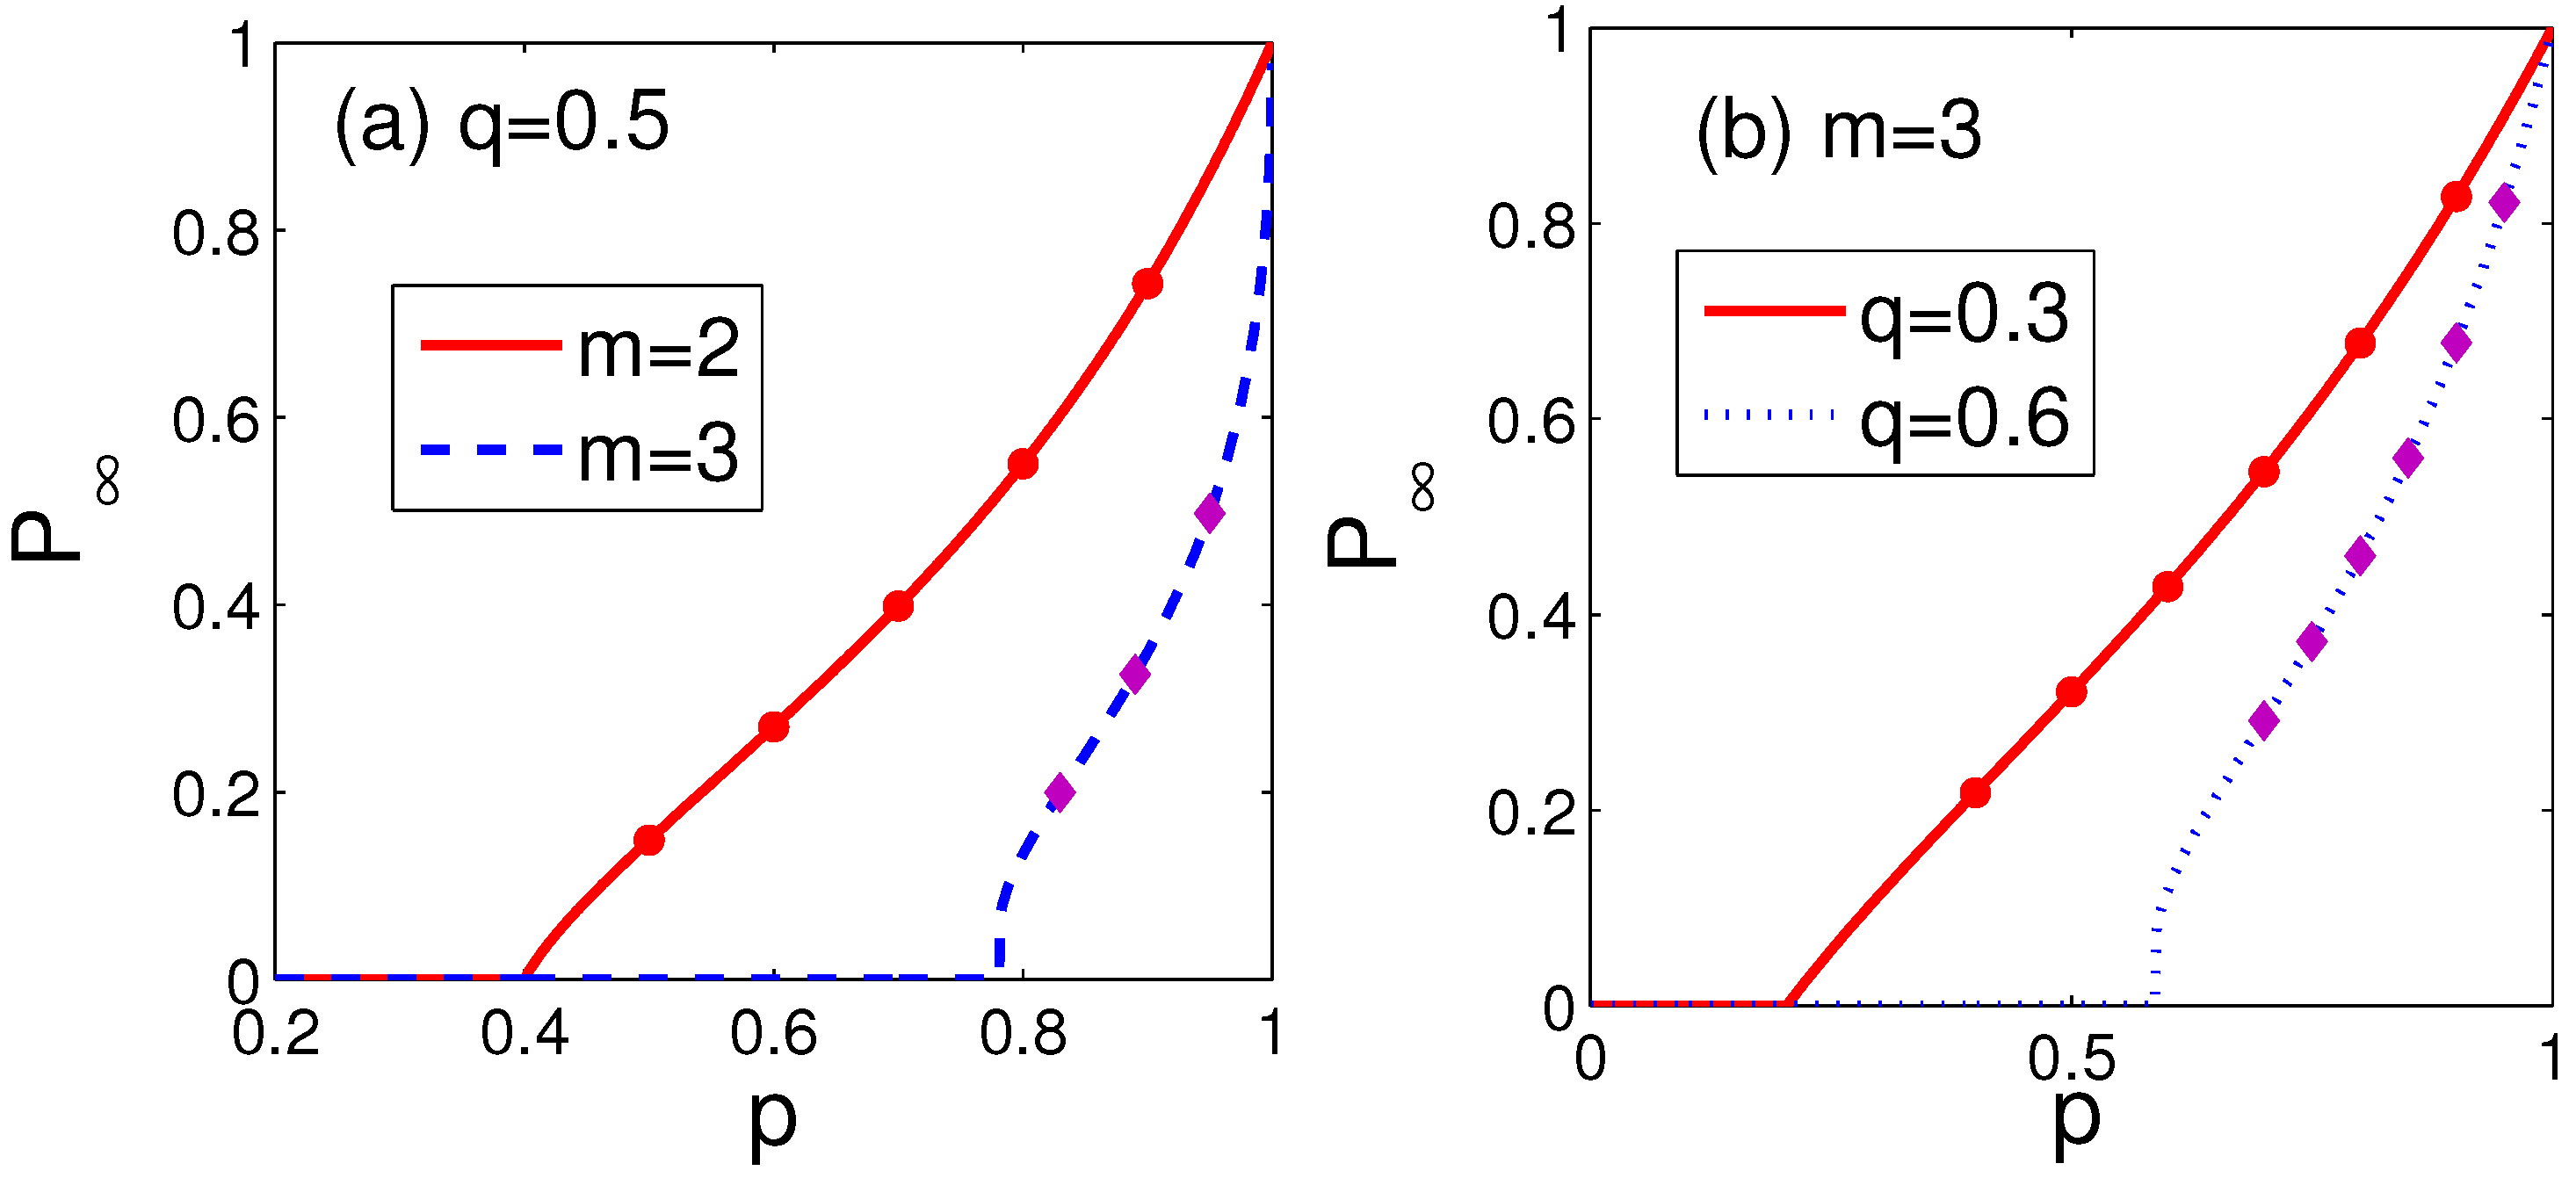
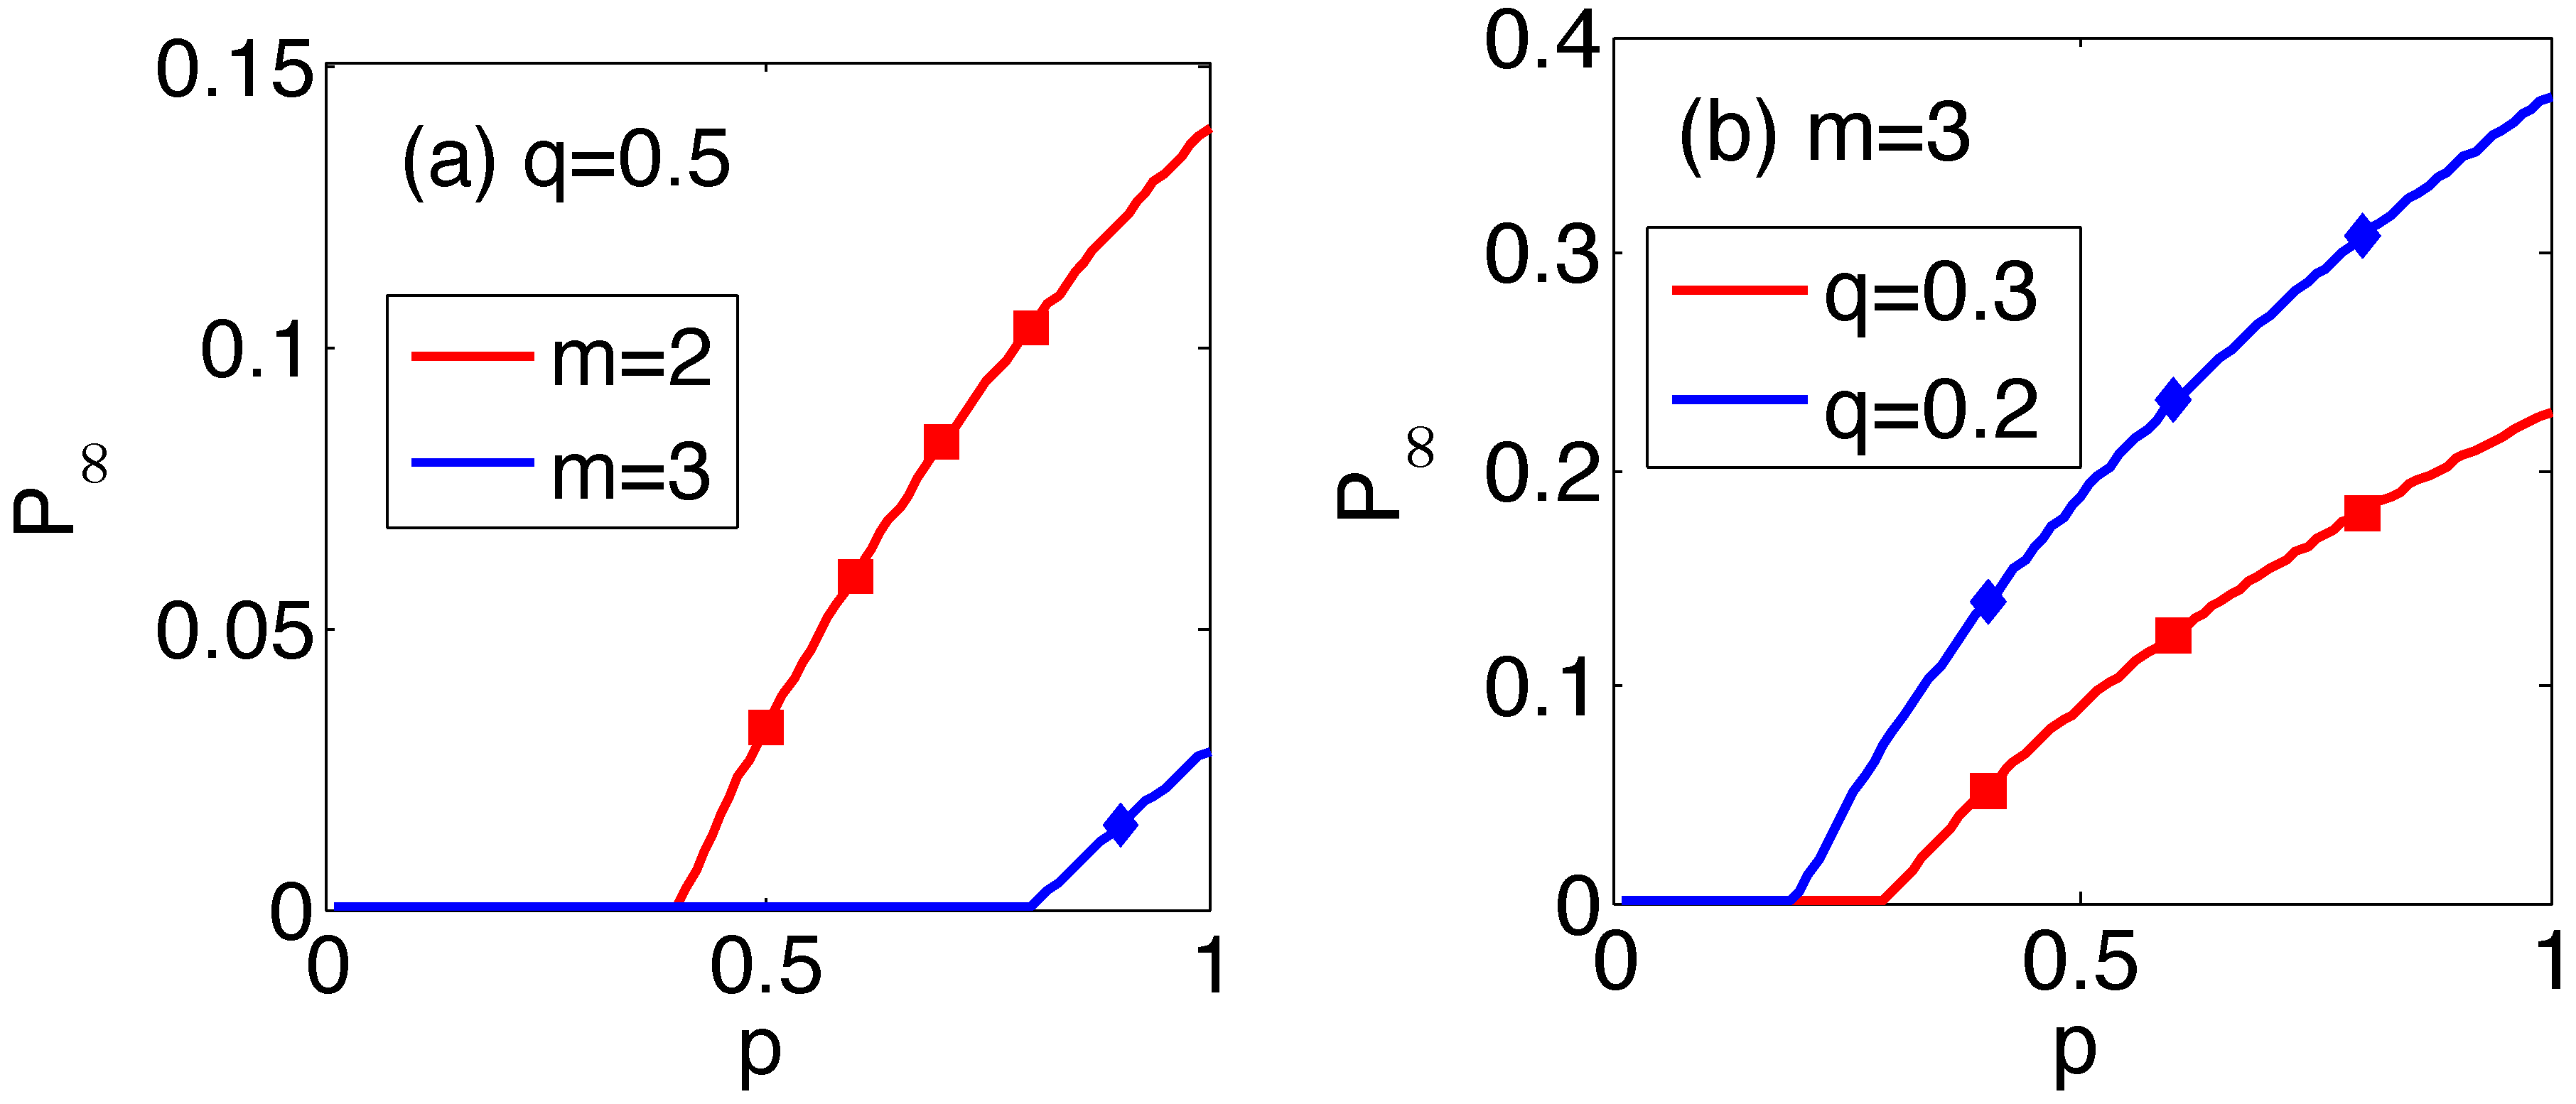
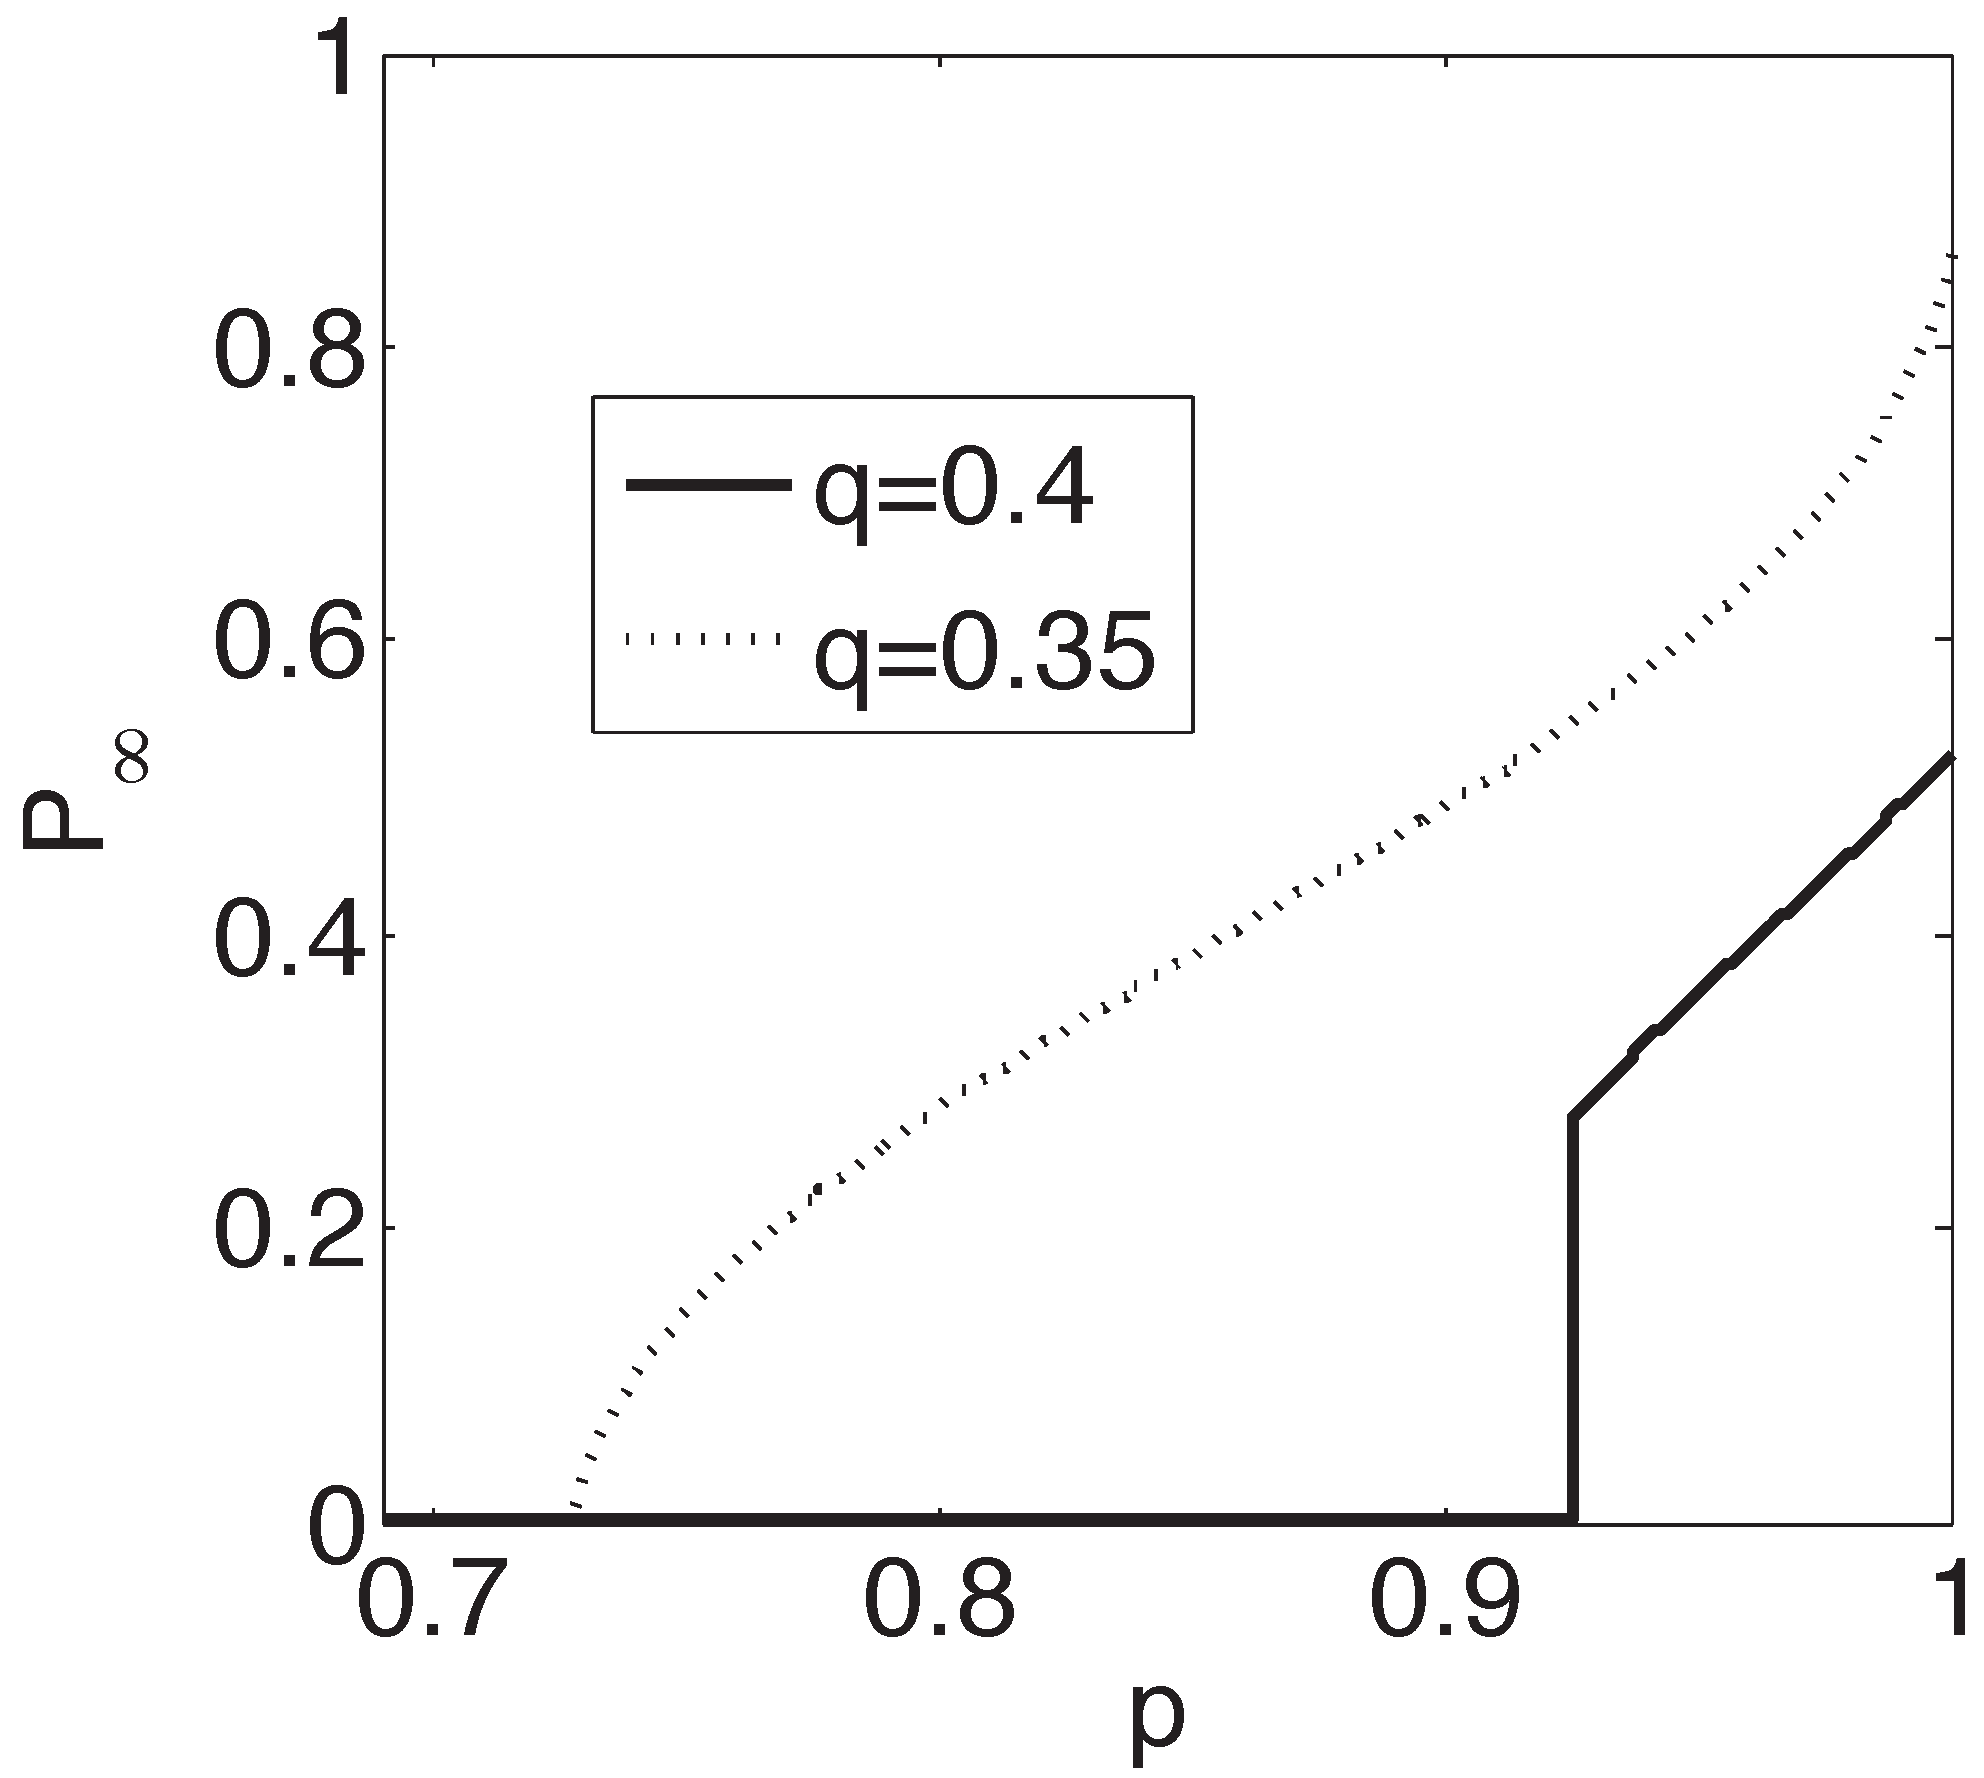
3. Extreme Vulnerability of Interdependent Spatially-Embedded Networks

3.1. Pair of Spatially-Embedded Networks

In interdependent non-embedded networks, there is a critical coupling of interdependence above which a single failure can invoke cascading failures that may abruptly break down the system, while below which small-scale failures only lead to small damages on the system, and the percolation transition is continuous and not a collapse. If the coupling in the interdependent NON is below this critical coupling, the system can be considered in a “safe region” which is free from the risk of abrupt collapse.
Many critical infrastructure networks are embedded in space, such as the telecommunication networks and the power grid. Interdependent spatially-embedded networks, modeled by coupled lattices, have been found significantly more vulnerable compared to non-embedded networks [96]. In contrast to non-embedded networks, there exists no critical coupling, and any small coupling of interdependent nodes will lead to an abrupt collapse of first order transition. In such systems, there is no “safe region”. Furthermore, in [95,96], it is assumed that the length of the interdependent links between sites of two lattices is constrained by distance r, as shown in Figure 7. The work in [95] found that for full coupling ( q = 1 ), the percolation transition changes from a first order to a second order at r = r c = 8 ; percolation for r < r c is a second order transition and for r > r c is first order transition. When the coupling reduces ( q < 1 ), r c increases, as shown by Danziger et al. [101]. Very recently, it was found that when the dependency links have zero length, but the connectivity links have a characteristic length ξ, a similar phenomena happens that a critical characteristic length ξ c exists [91]. For ξ < ξ c , the percolation transition is continuous (second order), while for ξ > ξ c , the transition is abrupt.
Figure 7. Illustration of interdependent spatial networks. Two square lattices A and B are networks where every node has two types of links: connectivity links and dependency links. Every node is initially connected to its four nearest neighbors within the same lattice via connectivity links. Each node A i in Lattice A depends on one and only one node B j in Lattice B via a dependency link (and vice versa), with the constraints that | x i - x j | r and | y i - y j | r . If node A i fails, then node B j fails and vice versa. After [95].
Energies 08 12187 g007
Spatial constraints make the system not only vulnerable to random failures, but also even more susceptible to spatially-localized failures caused by natural disasters or malicious attacks. Local failures (like the Tohoku earthquake and tsunami in 2011, or the recent typhoon in the Philippines, or a chemical/biological attack), can cause total failures within a given radius from the center of the disaster, which may propagate over the entire interdependent network system [97]. Note that for non-embedded networks, the effect of local failures on different networks is different when compared to random failures [102]: the effects of local failures and random failures on an ER network are identical; an RR network is more robust under local failures compared to random failures; and there is a critical exponent λ c for SF networks (with degree distribution p ( k ) k - λ ). For λ below λ c , the SF network is found to be significantly more vulnerable with respect to local failures compared to random failures, and for λ > λ c , the opposite is true.
Under a random attack, a finite fraction of the system nodes has to be removed to trigger the collapse of the system. Surprisingly, it is found that a localized failure in interdependent spatial networks can invoke, in many scenarios, substantially more damage to the networks than an equivalent random failure [97], as shown in Figure 8a. In the k - r plane, where k is the average degree of network and r is the length of dependency links shown in Figure 8b, the interdependent spatially-embedded network shows three phases: stable, unstable and metastable. As shown in Figure 8c, the metastable phase spans a broad range of parameters, and if the localized failure size is larger than a critical size r h c , it will spread globally and fragment the entire system. The critical damage size r h c does not scale with the system size and constitutes a zero-fraction of large systems, as shown in Figure 8d.
Figure 8. The effect of a localized attack on a system with dependencies. (a) Propagation of local damage in a system of two interdependent diluted lattices with spatially-constrained dependency links between the lattices (only one lattice shown here). The hole on the right is above the critical size r h c and spreads throughout the system, while the hole on the left is below r h c and remains essentially the same size. (b) A localized circular failure of radius r h in a lattice with dependency links of length up to r. (c) Phase diagram of a lattice with dependencies or two interdependent lattices. Depending on the average degree k and dependency length r, the system is either stable, unstable or metastable. The circles illustrate the increase (when k increases) of the critical attack size ( r h c ) that leads to system collapse in the meta-stable region. (d) As the system size grows, the minimal number of nodes that cause the system to collapse increases linearly for random attacks, but stays constant (<300) for localized attacks. This figure was obtained for a system of interdependent lattices diluted to k 2.9 and r = 15 with 1000 runs for each data point. After [97].
Energies 08 12187 g008

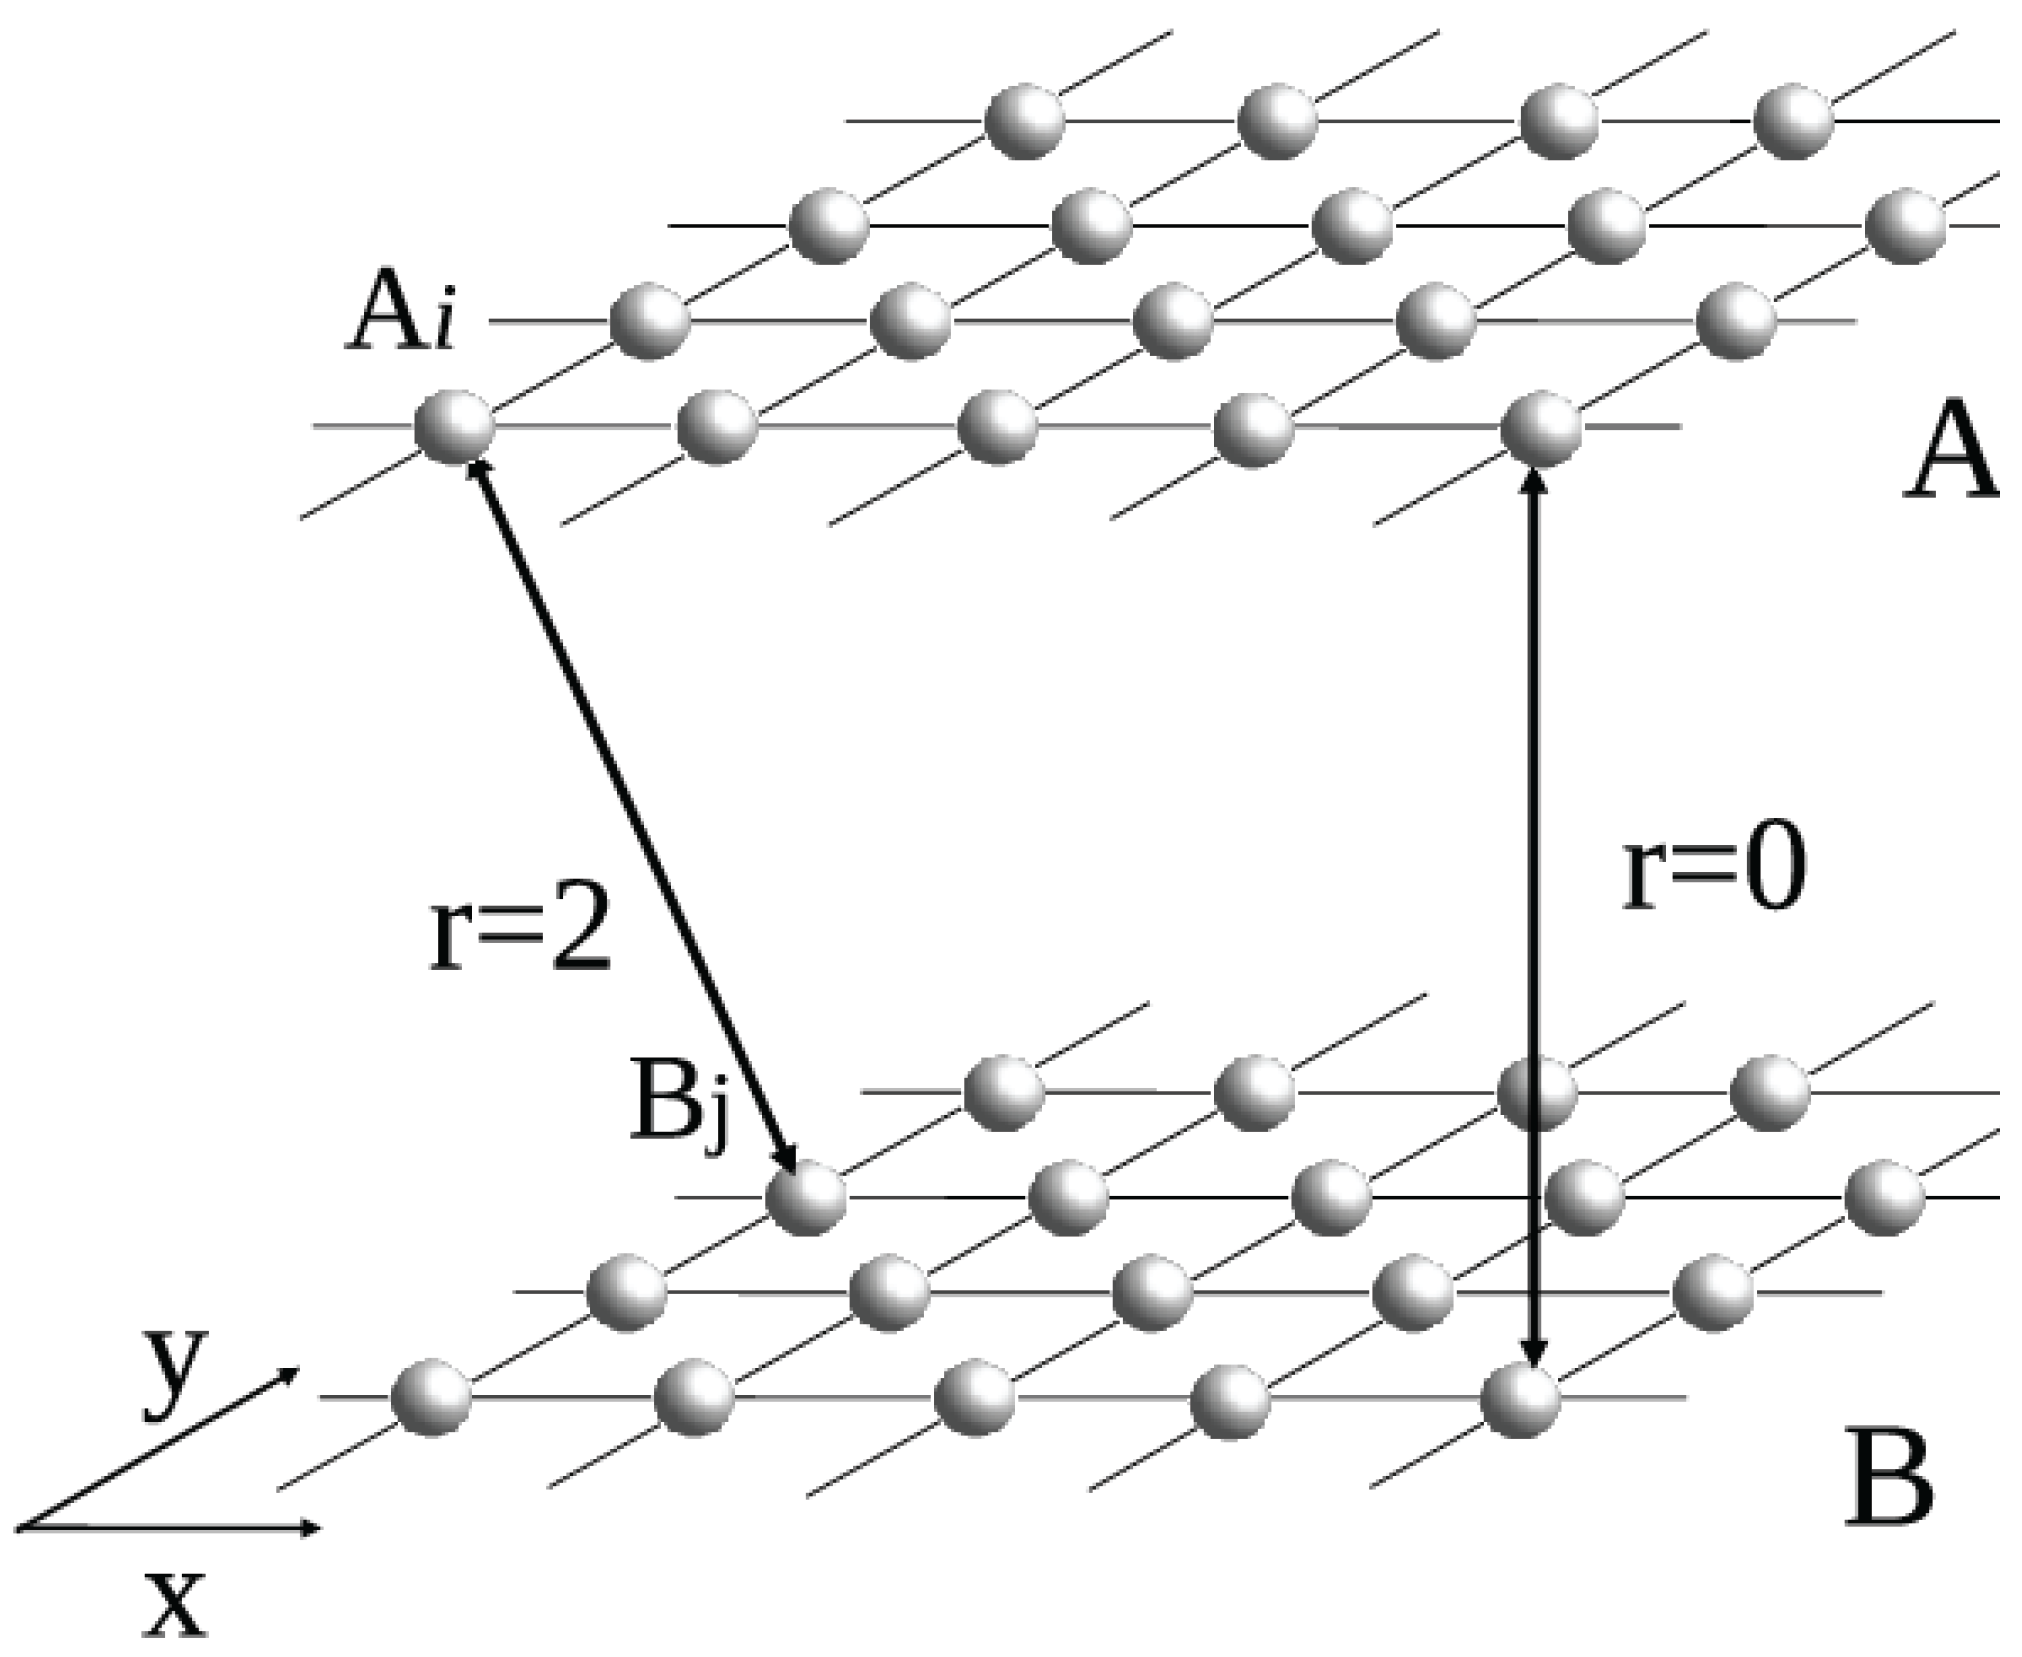
3.2. Network of Spatially-Embedded Networks

As reviewed above, a system of two interdependent spatially-embedded networks is extremely vulnerable. In real systems, more than two spatially-embedded networks might be coupled together, which makes the system even more vulnerable as more networks are coupled. Shekhtman et al. [100] has generalized the study of the percolation of a pair of interdependent spatial networks to the percolation of a network of interdependent spatial networks. The spatial correlations found between failures in power grids and transportation systems might enable a method to better predict the location of forthcoming failures.
The NON (composed of n networks, which are numbered by 1, 2, ..., n) can assume various topologies, such as a line, a tree or a star. Some examples of possible configurations are shown in Figure 2. For each pair of interdependent networks, a fraction of nodes q i j in network i depend on the nodes of network j, and the dependencies either follow the “no feedback condition” [42] or the “feedback condition”, where the dependencies may form loops [78].
For the case of two interdependent spatially-embedded networks, the system undergoes a first-order phase transition only for r > r c 8 , where r c is the critical dependency length above which the percolation transition shifts from a second order (below r c ) to a first order. It is found [100] that for tree-like networks of networks, the critical dependency length r c significantly decreases as more networks are coupled, and with enough interdependent networks ( n 11 ), the system undergoes a first order phase transition even for r = 1 .
If the dependencies between networks contain loops, the system is so vulnerable that when the coupling strength is q > q m a x , it will collapse even if a single node is removed. The critical coupling strength q m a x decreases quickly, as the degree m of the random regular NON increases regardless of the dependency length r. These results show the extreme sensitivity of coupled spatial networks and emphasize the susceptibility and the high risk of these networks to sudden collapse. Note that the percolation theory of a network of interdependent spatial networks can be potentially applied to infrastructural systems, such as power systems and transportation systems, which are embedded in 2D space, for designing more resilient interdependent systems.

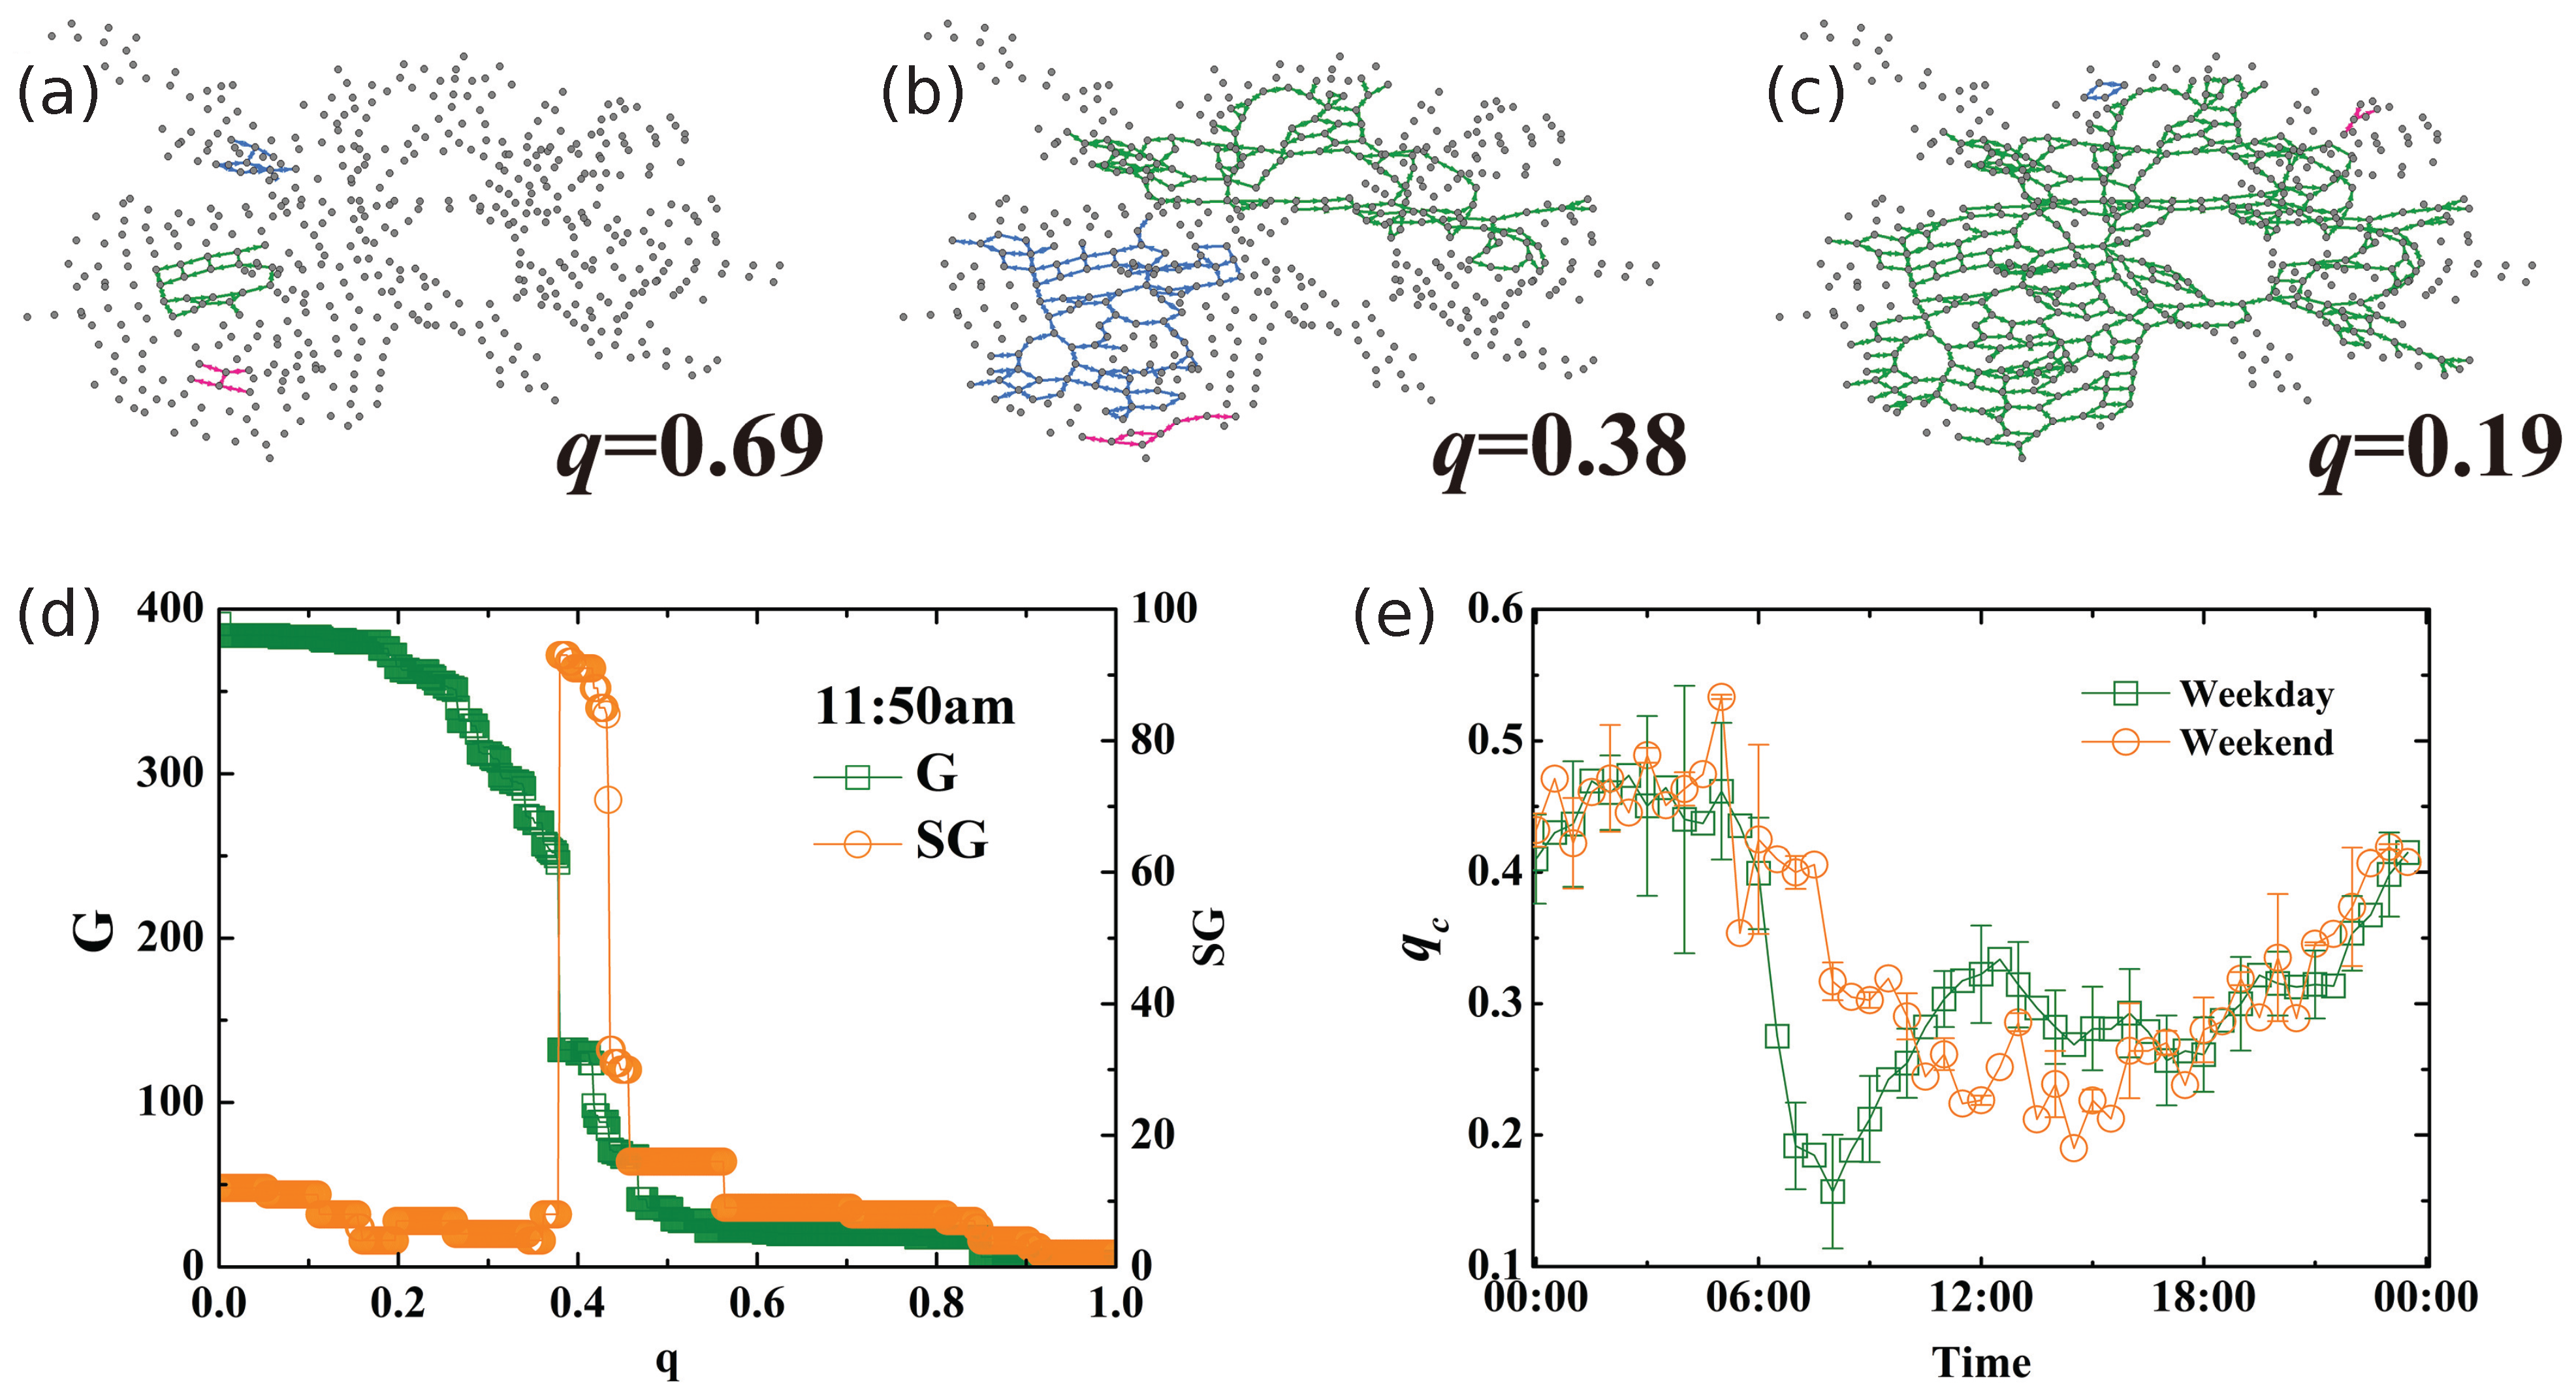
4. Percolation in a Dynamic Traffic Network

The studies of the percolation phenomena in complex networks and that in the NON reviewed above mainly focus on their static structures. Many systems are not static, but dynamically evolve with time [103,104]. For example, the flows of a traffic network [35] dynamically change at different times during a day, which leads to different dynamical structures of the traffic network. The study of percolation in a dynamic traffic network reviewed here provides insight to the traffic dynamics, which might be useful for improving transportation, epidemic control and emergency evacuation.
In [35], a road network is constructed based on the data of the velocities with 5-min segment records measured in a region in the central part of Beijing, where nodes represent the intersections and links represent the road segments between two intersections. For each road, the velocity v i j ( t ) varies during a day according to real-time traffic. For each road e i j , the 95th percentile of its velocity in each day is set as its limited maximal velocity, and r i j ( t ) is defined as the ratio between its current velocity and its limited maximal velocity measured for that day. For any given threshold q, the road e i j can be classified into two categories: functional when r i j > q and dysfunctional for r i j < q :
e i j = 1 , r i j > q 0 , r i j < q
In this way, a functional traffic network can be constructed for any given q value from the traffic dynamics of the original road network, which becomes more diluted as the value of q increases. As shown in Figure 9, when the value of q increases, the size of second largest cluster reaches a maximal value at a critical threshold q c , separating the fragmented phase from the connected phase of the traffic network and quantifying the organization efficiency of real traffic.
Figure 9. Percolation of traffic networks. Traffic networks for three q values corresponding to different connectivity states. (a)–(c) exhibit the traffic networks under different q values with 0.69, 0.38 and 0.19 representing the states of high-, medium- and low-velocity thresholds, respectively. For clarity, only the largest three clusters are plotted, which are marked in green (largest cluster), blue (second largest cluster) and strawberry (third-largest cluster). Here, the clusters are strongly connected components. (d) The size of the largest cluster (G) and the second largest cluster (SG) of traffic networks as a function of q. Critical value q c is determined as the q value when SG becomes maximal. (e) q c as a function of time, averaged separately over nine weekdays and two weekends. After [35].
Energies 08 12187 g009
The value of q c characterizes the efficiency of global traffic. The higher q c , the more efficient is the traffic in the city. The critical threshold q c is determined by the velocities of the bottleneck links, which bridge different functional clusters in a functional traffic network. The critical threshold q c can be significantly increased through increasing the velocity of the bottleneck link. Surprisingly, the improvement of q c is usually negligible when the velocity of the link with the highest betweenness is increased, although such a link is usually considered as a bottleneck link, because it bridges different topological communities [105,106]. This indicates that the bottleneck links found via percolation in the dynamical network are unique and different from the results of network analysis based only on structural information.

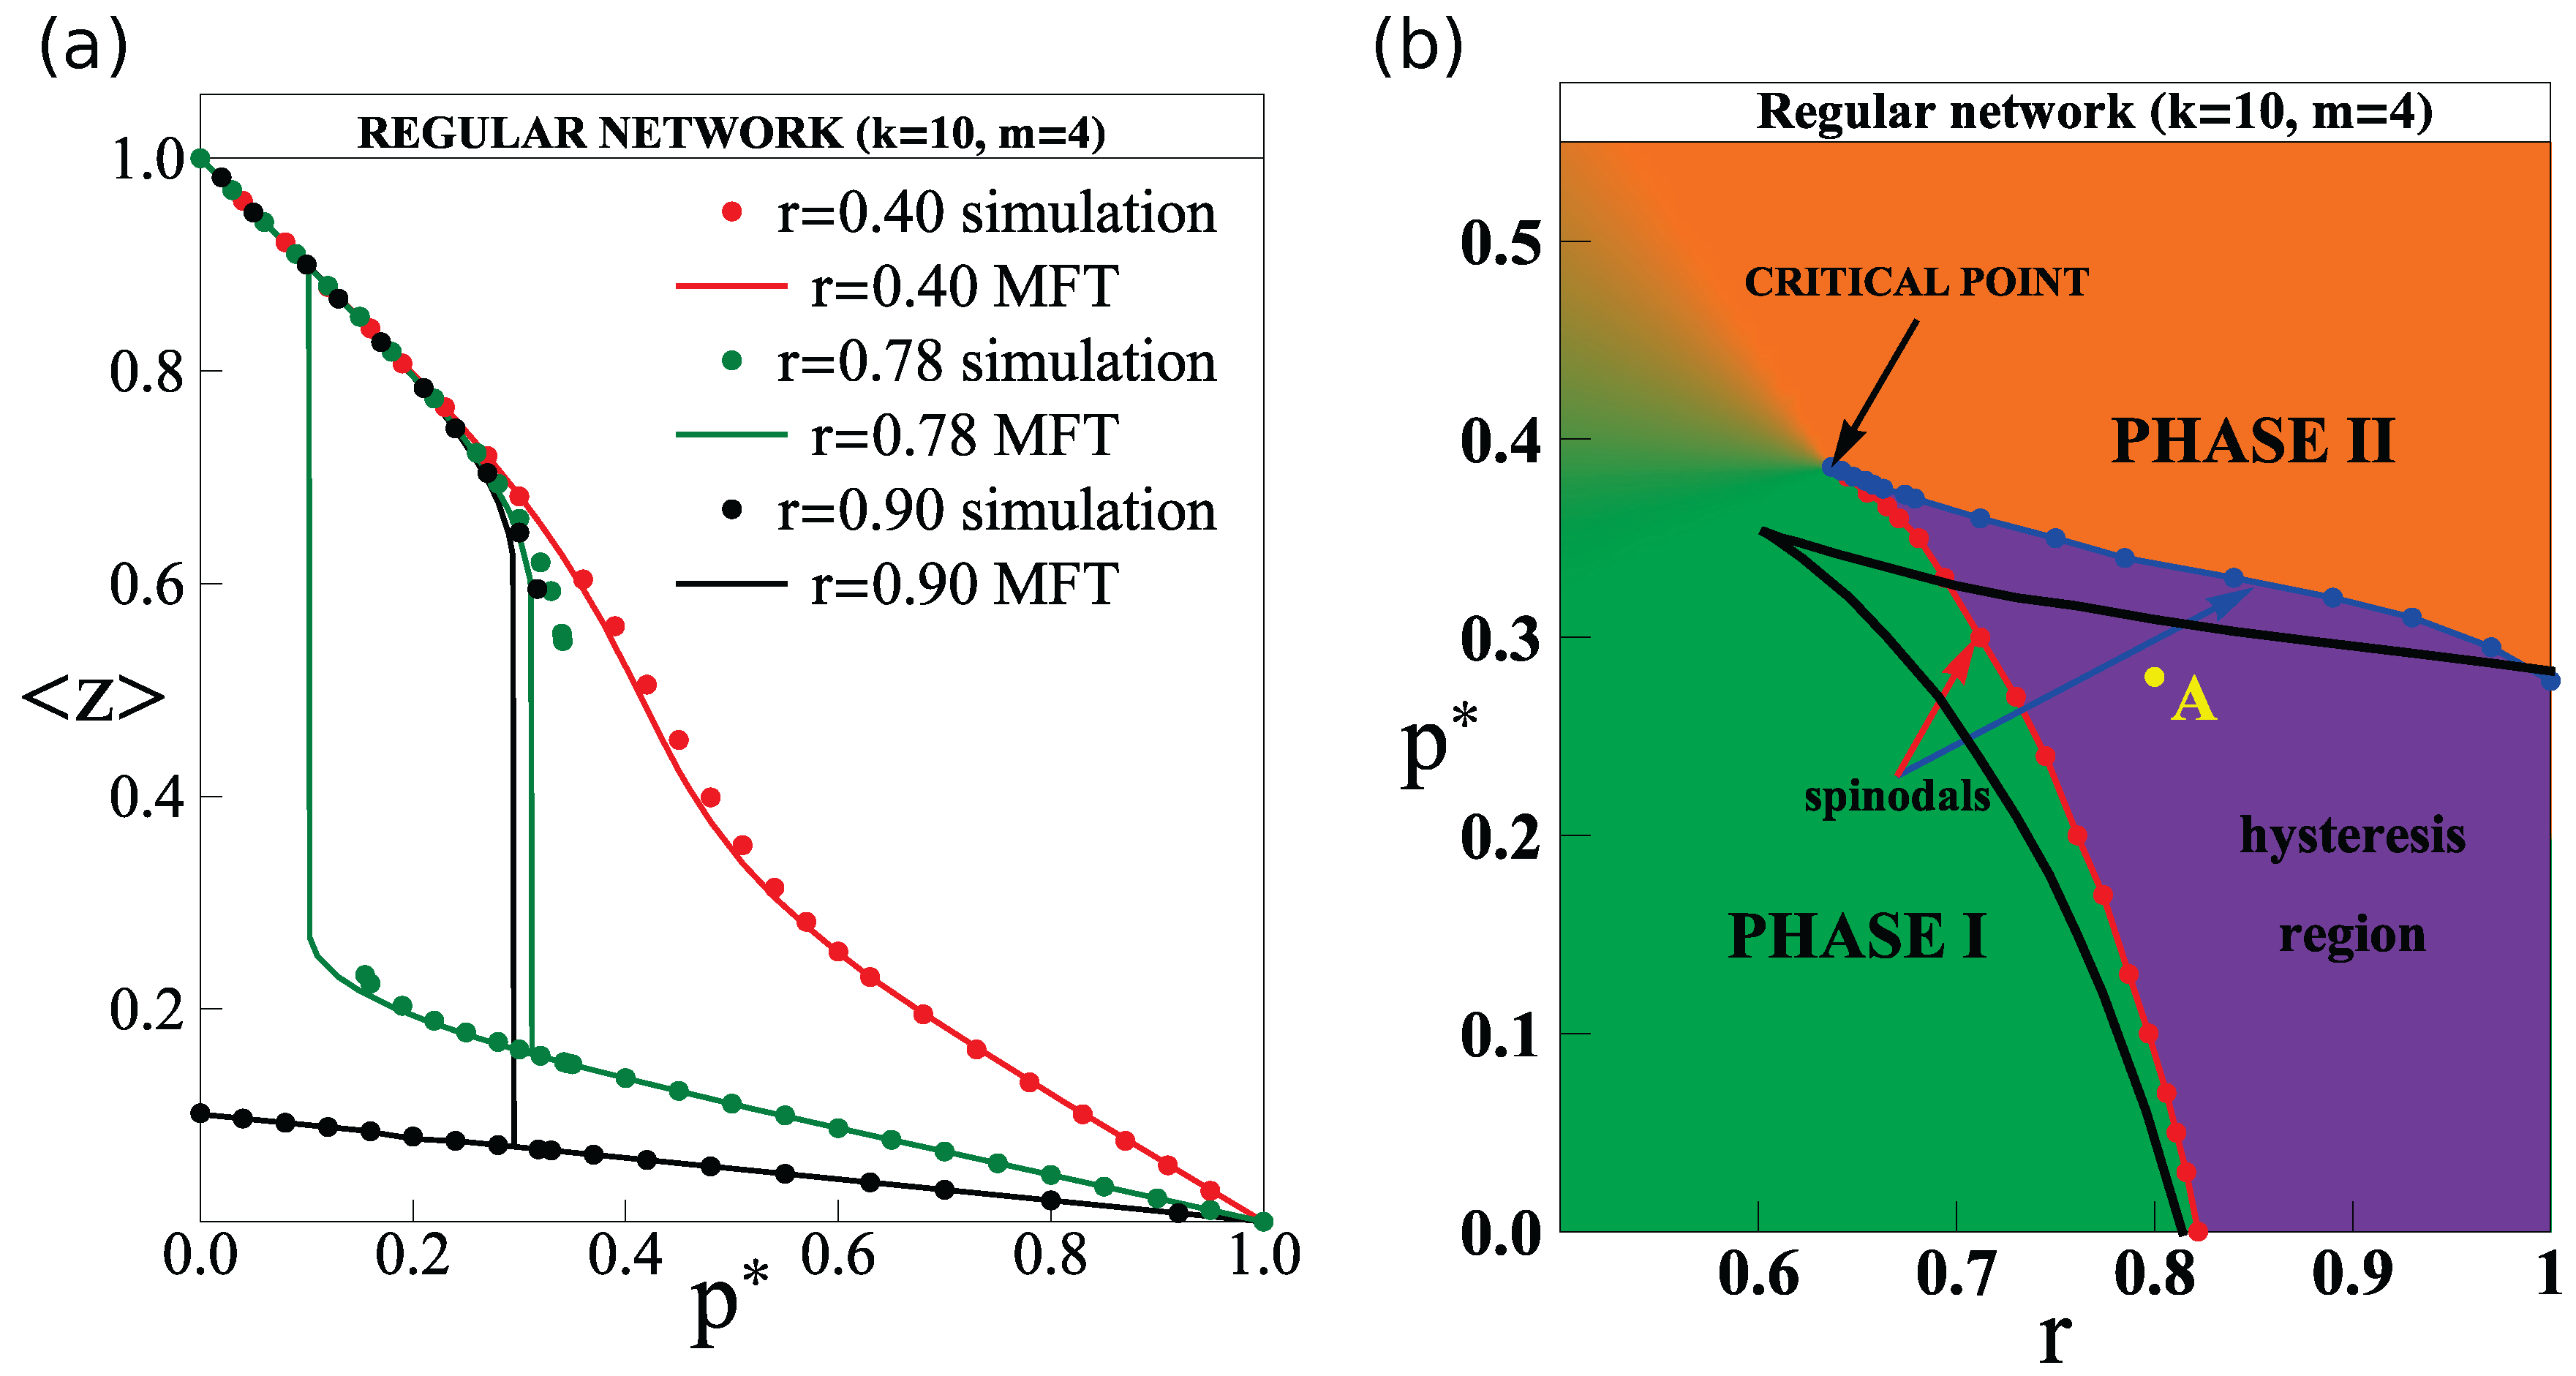
5. Spontaneous Recovery in Dynamical Networks

An entire class of real-world dynamic complex systems can spontaneously recover after their collapse [39,107,108,109,110]. For example, the Internet can initially fail after a severe attack, and then after a period of time, recover; a human brain can spontaneously recover after an epileptic attack; a traffic network returns to its normal state after a period of gridlock; and a financial network may, after a period of time, recover after having a large fraction of its constituents fail. Majdandzic et al. [39] developed a framework for understanding dynamic networks that demonstrate an ability to spontaneously recover.
We next review briefly the model developed in [39]. Given a network, each node is assumed to fail independently of other nodes (internal failure) with a probability of p d t during a time interval d t and also fail externally due to a substantially damaged neighborhood. Nodes that have not failed either externally or internally are regarded as active. If node j has m or more than m active neighbors during d t , we assume that its neighborhood is “healthy”, but if node j has less than m active neighbors during the interval d t , there is a probability r d t that node j will externally fail, where r is denoted as “damage conductivity”. Moreover, there is a reversal process in the network: node j recovers from an internal failure after a time period τ 0 , and it recovers from an external failure after time τ , which are set to one for simplicity.
The time-averaged fraction of failed nodes a in a network can be analytically computed by the equation:
a ( r , p * ) = p * + r ( 1 - p * ) k f k j = 0 m k k - j a k - j ( 1 - a ) j
where the parameter p * 1 - e x p ( - p τ ) represents the average fraction of internally-failed nodes and r is the parameter that controls the external failures. The solution of the time-averaged fraction of active nodes z = 1 - a shows hysteresis for a range of r while slowly changing p * in different directions, increasing or decreasing p * . In the two-parameter ( r , p * ) space, the network exhibits two phases. As shown in Figure 10, Phase I (green region) represents a high activity collective network mode; Phase II (orange) represents a low-activity mode. The hysteresis region (purple) is bounded with spinodals denoted by red and blue lines.
The analytic framework has been applied to a real economic network where nodes represent companies. Market returns (for a period of 100 days) were used to construct an appropriate binary variable for each node. The state of company i at time t was defined as “good” (“bad”) if, during the period [ t - 100 , t ] , the company has a market value increase (decrease). At each t, the fraction of companies that have positive net returns during [ t - 100 , t ] is defined as z ( t ) . The behavior of z ( t ) switches back and forth between high and low values, resembling the phase-flipping phenomena that our model predicts for the hysteresis regime. The comparison with real data indicates that the model is a plausible qualitative explanation for the behavior that is observed in real economic networks. Moreover, the study of the spontaneous recovery in dynamical networks was recently extended to the case of networks of networks [99].
Figure 10. Critical behavior of the system with first order phase transition and hysteresis. (a) Equilibrium average fraction of active nodes z as a function of p * , which represents the average fraction of internally-failed nodes. For three different values of r, simulation results (symbols) and the mean-field theory (MFT) prediction (solid lines) agree well with each other. Parameters for random regular networks, N = 107 , k = 10 and m = 4 , are used in this example. (b) The phase diagram in model parameters ( r , p * ) exhibits two phases. Phase I (green region) represents a high activity collective network mode; Phase II (orange) represents a low activity mode. The hysteresis region (purple) is bounded with spinodals denoted by red and blue lines. After [39].
Energies 08 12187 g010

6. Conclusions

We have reviewed recent studies on the resilience of complex networks. In interacting networks, when a node in one network fails, it usually causes dependent nodes in other networks to fail, which, in turn, may cause further damage in the first network and result in a cascade of failures with sometimes catastrophic consequences. For the dynamics of the cascading failures and, in particular, how they behave with time (number of steps), see Zhou et al. [111]. The analytic framework of the percolation of a NON represents a general result that includes a specific case of percolation of a single network. Our review intends to introduce the recent progress in the theoretical aspects of the robustness of interdependent networks, the dynamics of cascading failures and their realistic applications, which may shed some light on the study of power grid resilience considering the risky issues due to the interdependence between the electric grid and other networks.
It is thus important to develop algorithms for improving the robustness of embedded interdependent networks according to their topological structure and function. Currently, three methods have been proposed to improve the robustness of the non-embedded interdependent networks: (i) increase the fraction of autonomous nodes [60], especially nodes with a high degree, (ii) design the dependency links, such that they connect the nodes with similar degrees [72,73], and (iii) protect the high degree nodes against attack [112].
The behavior of the breakdown of dynamic systems may be different from the static systems, where the breakdown only occurs in their structure. For example, the robustness of dynamic traffic networks [35] can be improved by increasing the velocities of the bottleneck links, which are identified via the dynamic functional traffic network. Moreover, the dynamical robustness of complex networks, which is defined as the ability of a network to maintain its dynamical activity, when a fraction of the dynamical components are deteriorated or functionally depressed, but not removed [113], may be different from the structural robustness. For example, the low degree nodes are the key nodes that influence the dynamic robustness, while structural robustness is largely influenced by hubs [114]. Note that some dynamic systems can spontaneously recover after a breakdown [39,107,108,109,110,115,116].
In summary, our analysis may help engineers to identify the vulnerabilities of systems in order to plan and design more resilient infrastructure systems. In particular, the following ideas should be considered: (1) when one designs a single infrastructure network, which is isolated and independent of other systems, in order to increase its robustness to random failures, one needs to construct the structure to have an as much as possible heterogeneous degree distribution, such as in SF networks; (2) however, when one designs interdependent infrastructure systems, it is preferred that each network will be as much as possible homogeneous in the degree distribution in order to increase its robustness to random failures; (3) if the topology of some networks is known to be heterogeneous, such as communication networks, and these networks are interdependent on each other, one should prefer to increase the degree correlations (prefer dependencies between nodes of similar degrees) between two networks in order to increase their robustness. More results about how to design and protect interdependent systems can be found in [117,118,119].
The challenge remains in this field that only a very few real-world systems have been analyzed using the percolation approach [72,120,121]. We expect the framework of an interdependent NON to provide insights leading to further analysis of real data on interdependent networks. Further studies of interdependent networks should focus on (i) an analysis of real data from various interdependent systems and (ii) the development of mathematical tools for studying models based on data of real-world interdependent systems.

Acknowledgments

We thank the support from National Natural Science Foundation of China (Grant Nos. 61104144 and 61374160) and the MULTIPLEX (EU-FET Project 317532) projects. Jianxi Gao acknowledges the support from the U.S. Army Research Laboratory and the U.S. Army Research Office under Cooperative Agreement W911NF-09-2-0053, the John Templeton Foundation ID #PFI-777, as well as the Defense Threat Reduction Agency Basic Research Grant No. HDTRA1-10-1-0100/BRBAA08-Per4-C-2-0033. Daqing Li acknowledges the support from the Collaborative Innovation Center for Industrial Cyber-Physical System. Shlomo Havlin acknowledges the European Learning about Interacting Networks in Climate project (No. 289447), funded by the European Community’s Marie-Curie Innovative Training Networks program, and the Israel Science Foundation, Binational Science Foundation, Office of Naval Research and Defense Threat Reduction Agency for financial support.

Conflicts of Interest

The authors declare no conflict of interest.

References

  1. Watts, D.J.; Strogatz, S.H. Collective dynamics of ‘small-world’ networks. Nature 1998, 393, 440–442. [Google Scholar] [CrossRef] [PubMed]
  2. Barabási, A.L.; Albert, R. Emergence of scaling in random networks. Science 1999, 286, 509–512. [Google Scholar] [PubMed]
  3. Albert, R.; Jeong, H.; Barabási, A.L. Error and attack tolerance of complex networks. Nature 2000, 406, 378–382. [Google Scholar] [CrossRef] [PubMed]
  4. Cohen, R.; Erez, K.; Ben-Avraham, D.; Havlin, S. Resilience of the Internet to random breakdowns. Phys. Rev. Lett. 2000, 85, 4626–4628. [Google Scholar] [CrossRef] [PubMed]
  5. Callaway, D.S.; Newman, M.E.; Strogatz, S.H.; Watts, D.J. Network robustness and fragility: Percolation on random graphs. Phys. Rev. Lett. 2000, 85. [Google Scholar] [CrossRef]
  6. Albert, R.; Barabási, A.L. Statistical mechanics of complex networks. Rev. Mod. Phys. 2002, 74, 47–97. [Google Scholar] [CrossRef]
  7. Barrat, A.; Barthelemy, M.; Pastor-Satorras, R.; Vespignani, A. The architecture of complex weighted networks. Proc. Natl. Acad. Sci. USA 2004, 101, 3747–3752. [Google Scholar] [CrossRef] [PubMed]
  8. Gallos, L.K.; Cohen, R.; Argyrakis, P.; Bunde, A.; Havlin, S. Stability and topology of scale-free networks under attack and defense strategies. Phys. Rev. Lett. 2005, 94. [Google Scholar] [CrossRef]
  9. Song, C.; Havlin, S.; Makse, H.A. Self-similarity of complex networks. Nature 2005, 433, 392–395. [Google Scholar] [CrossRef] [PubMed]
  10. Newman, M.; Barabási, A.L.; Watts, D.J. The Structure and Dynamics of Networks; Princeton University Press: Princeton, NJ, USA, 2006. [Google Scholar]
  11. Cohen, R.; Havlin, S. Complex Networks: Structure, Stability and Function; Cambridge University Press: Cambridge, UK, 2009. [Google Scholar]
  12. Daqing, L.; Kosmidis, K.; Bunde, A.; Havlin, S. Dimension of spatially embedded networks. Nat. Phys. 2011, 7, 481–484. [Google Scholar] [CrossRef]
  13. Newman, M.E.J. Networks: An Introduction; Oxford University Press: New York, NY, USA, 2010. [Google Scholar]
  14. Dorogovtsev, S.N.; Mendes, J.F. Evolution of Networks: From Biological Nets to the Internet and WWW (Physics); Oxford University Press: New York, NY, USA, 2003. [Google Scholar]
  15. Satorras, R.P.; Vespignani, A. Evolution and Structure of the Internet: A Statistical Physics Approach; Cambridge University Press: Cambridge, UK, 2004. [Google Scholar]
  16. Caldarelli, G.; Vespignani, A. Large scale Structure and Dynamics of Complex Webs; World Scientific: New York, NY, USA, 2007. [Google Scholar]
  17. Barrat, A.; Barthelemy, M.; Vespignani, A. Dynamical Processes on Complex Networks; Cambridge University Press: Cambridge, UK, 2008. [Google Scholar]
  18. Barthélemy, M. Spatial networks. Phys. Rep. 2011, 499, 1–101. [Google Scholar] [CrossRef]
  19. Strogatz, S.H. Exploring complex networks. Nature 2001, 410, 268–276. [Google Scholar] [CrossRef] [PubMed]
  20. Bashan, A.; Bartsch, R.P.; Kantelhardt, J.W.; Havlin, S.; Ivanov, P.C. Network physiology reveals relations between network topology and physiological function. Nat. Commun. 2012, 3. [Google Scholar] [CrossRef] [PubMed]
  21. Ludescher, J.; Gozolchiani, A.; Bogachev, M.I.; Bunde, A.; Havlin, S.; Schellnhuber, H.J. Improved El Niño forecasting by cooperativity detection. Proc. Natl. Acad. Sci. USA 2013, 110, 11742–11745. [Google Scholar] [CrossRef] [PubMed]
  22. Faloutsos, M.; Faloutsos, P.; Faloutsos, C. On power-law relationships of the internet topology. In Proceedings of the ACM SIGCOMM 1999 Conference on Applications, Technologies, Architectures, and Protocols for Computer Communication, Cambridge, MA, USA, 30 August–3 September 1999; Volume 29, pp. 251–262.
  23. Handcock, M.S.; Raftery, A.E.; Tantrum, J.M. Model-based clustering for social networks. J. R. Statist. Soc. A 2007, 170, 301–354. [Google Scholar] [CrossRef]
  24. Jackson, M.O.; Rogers, B.W. Meeting Strangers and Friends of Friends: How Random are Social Networks? Am. Econ. Rev. 2007, 97, 890–915. [Google Scholar] [CrossRef]
  25. Borgatti, S.P.; Mehra, A.; Brass, D.J.; Labianca, G. Network Analysis in the Social Sciences. Science 2009, 323, 892–895. [Google Scholar] [CrossRef] [PubMed]
  26. Borgatti, S.P. Identifying sets of key players in a network. Comput. Math. Organ. Theory 2006, 12, 21–34. [Google Scholar] [CrossRef]
  27. Onnela, J.P.; Saramäki, J.; Hyvönen, J.; Szabó, G.; Lazer, D.; Kaski, K.; Kertész, J.; Barabási, A.L. Structure and tie strengths in mobile communication networks. Proc. Natl. Acad. Sci. USA 2007, 104, 7332–7336. [Google Scholar] [CrossRef] [PubMed]
  28. Faust, K. Comparing social networks: Size, density and local structure. Metodol. Zv. 2006, 3, 185–216. [Google Scholar]
  29. Colizza, V.; Barrat, A.; Barthélemy, M.; Vespignani, A. The role of the airline transportation network in the prediction and predictability of global epidemics. Proc. Natl. Acad. Sci. USA 2006, 103, 2015–2020. [Google Scholar] [CrossRef] [PubMed]
  30. Milo, R.; Shen-Orr, S.; Itzkovitz, S.; Kashtan, N.; Chklovskii, D.; Alon, U. Network motifs: Simple building blocks of complex networks. Science 2002, 298, 824–827. [Google Scholar] [CrossRef] [PubMed]
  31. Alon, U. Biological Networks: The Tinkerer as an Engineer. Science 2003, 301, 1866–1867. [Google Scholar] [CrossRef] [PubMed]
  32. Bollobás, B. Random Graphs; Cambridge University Press: London, UK, 1985. [Google Scholar]
  33. Cohen, R.; Erez, K.; Ben-Avraham, D.; Havlin, S. Breakdown of the Internet under intentional attack. Phys. Rev. Lett. 2001, 86, 3682–3685. [Google Scholar] [CrossRef] [PubMed]
  34. Schneider, C.M.; Moreira, A.A.; Andrade, J.S.; Havlin, S.; Herrmann, H.J. Mitigation of malicious attacks on networks. Proc. Natl. Acad. Sci. USA 2011, 108, 3838–3841. [Google Scholar] [CrossRef] [PubMed]
  35. Li, D.; Fu, B.; Wang, Y.; Lu, G.; Berezin, Y.; Stanley, H.E.; Havlin, S. Percolation transition in dynamical traffic network with evolving critical bottlenecks. Proc. Natl. Acad. Sci. USA 2015, 112, 669–672. [Google Scholar] [CrossRef] [PubMed]
  36. Dickison, M.; Havlin, S.; Stanley, H.E. Epidemics on interconnected networks. Phys. Rev. E 2012, 85. [Google Scholar] [CrossRef]
  37. Crucitti, P.; Latora, V.; Marchiori, M. Model for cascading failures in complex networks. Phys. Rev. E 2004, 69. [Google Scholar] [CrossRef]
  38. Ash, J.; Newth, D. Optimizing complex networks for resilience against cascading failure. Phys. A Stat. Mech. Appl. 2007, 380, 673–683. [Google Scholar] [CrossRef]
  39. Majdandzic, A.; Podobnik, B.; Buldyrev, S.V.; Kenett, D.Y.; Havlin, S.; Stanley, H.E. Spontaneous recovery in dynamical networks. Nat. Phys. 2014, 10, 34–38. [Google Scholar] [CrossRef]
  40. Herrmann, H.J.; Schneider, C.M.; Moreira, A.A.; Andrade, J.S., Jr.; Havlin, S. Onion-like network topology enhances robustness against malicious attacks. J. Stat. Mech. Theory Exp. 2011, 2011. [Google Scholar] [CrossRef]
  41. Bunde, A.; Havlin, S. Fractals and Disordered Systems; Springer: New York, NY, USA, 1996. [Google Scholar]
  42. Gao, J.; Buldyrev, S.V.; Stanley, H.E.; Havlin, S. Networks formed from interdependent networks. Nat. Phys. 2012, 8, 40–48. [Google Scholar] [CrossRef]
  43. Cohen, R.; Havlin, S. Complex Networks: Structure, Robustness and Function; Cambridge University Press: Cambridge, UK, 2010. [Google Scholar]
  44. Chen, Y.; Paul, G.; Havlin, S.; Liljeros, F.; Stanley, H.E. Finding a better immunization strategy. Phys. Rev. Lett. 2008, 101. [Google Scholar] [CrossRef]
  45. Cohen, R.; Havlin, S.; Ben-Avraham, D. Efficient immunization strategies for computer networks and populations. Phys. Rev. Lett. 2003, 91. [Google Scholar] [CrossRef]
  46. Braunstein, L.A.; Buldyrev, S.V.; Cohen, R.; Havlin, S.; Stanley, H.E. Optimal paths in disordered complex networks. Phys. Rev. Lett. 2003, 91. [Google Scholar] [CrossRef]
  47. Zimmerman, R. Decision-making and the vulnerability of interdependent critical infrastructure. In Proceedings of the 2004 IEEE International Conference on Systems, Man and Cybernetics, The Hague, The Netherlands, 10–13 October 2004; Volume 5, pp. 4059–4063.
  48. Mendonça, D.; Wallace, W.A. Impacts of the 2001 World Trade Center attack on New York city critical infrastructures. J. Infrastruct. Syst. 2006, 12, 260–270. [Google Scholar] [CrossRef]
  49. Robert, B.; Morabito, L. The operational tools for managing physical interdependencies among critical infrastructures. Int. J. Crit. Infrastruct. 2008, 4, 353–367. [Google Scholar] [CrossRef]
  50. Reed, D.A.; Kapur, K.C.; Christie, R.D. Methodology for assessing the resilience of networked infrastructure. IEEE Syst. J. 2009, 3, 174–180. [Google Scholar] [CrossRef]
  51. Mansson, D.; Thottappillil, R.; Backstrom, M. Methodology for classifying facilities with respect to intentional EMI. IEEE Trans. Electromagn. Compat. 2009, 51, 46–52. [Google Scholar] [CrossRef]
  52. Rosato, V.; Issacharoff, L.; Tiriticco, F.; Meloni, S.; Porcellinis, S.; Setola, R. Modeling interdependent infrastructures using interacting dynamical models. Int. J. Crit. Infrastruct. 2008, 4, 63–79. [Google Scholar] [CrossRef]
  53. D’Agostino, G.; Scala, A. Networks of Networks: The Last Frontier of Complexity; Springer: Berlin, Germany, 2014. [Google Scholar]
  54. Rinaldi, S.M.; Peerenboom, J.P.; Kelly, T.K. Identifying, understanding, and analyzing critical infrastructure interdependencies. IEEE Control Syst. 2001, 21, 11–25. [Google Scholar] [CrossRef]
  55. Buldyrev, S.V.; Parshani, R.; Paul, G.; Stanley, H.E.; Havlin, S. Catastrophic cascade of failures in interdependent networks. Nature 2010, 464, 1025–1028. [Google Scholar] [CrossRef] [PubMed]
  56. Newman, M.E.; Strogatz, S.H.; Watts, D.J. Random graphs with arbitrary degree distributions and their applications. Phys. Rev. E 2001, 64. [Google Scholar] [CrossRef]
  57. Shao, J.; Buldyrev, S.V.; Braunstein, L.A.; Havlin, S.; Stanley, H.E. Structure of shells in complex networks. Phys. Rev. E 2009, 80. [Google Scholar] [CrossRef]
  58. U.S.-Canada Power System Outage Task Force. Final Report on the August 14th 2003 Blackout in the United States and Canada: Causes and Recommendations; U.S. Department of Energy: Washington, DC, USA, 2004. [Google Scholar]
  59. Gao, J.; Li, D.; Havlin, S. From a single network to a network of networks. Natl. Sci. Rev. 2014, 1, 346–356. [Google Scholar] [CrossRef]
  60. Parshani, R.; Buldyrev, S.V.; Havlin, S. Interdependent networks: Reducing the coupling strength leads to a change from a first to second order percolation transition. Phys. Rev. Lett. 2010, 105. [Google Scholar] [CrossRef]
  61. Shao, J.; Buldyrev, S.V.; Havlin, S.; Stanley, H.E. Cascade of failures in coupled network systems with multiple support-dependence relations. Phys. Rev. E 2011, 83. [Google Scholar] [CrossRef]
  62. Baxter, G.; Dorogovtsev, S.; Goltsev, A.; Mendes, J. Avalanche collapse of interdependent networks. Phys. Rev. Lett. 2012, 109. [Google Scholar] [CrossRef]
  63. Cellai, D.; López, E.; Zhou, J.; Gleeson, J.P.; Bianconi, G. Percolation in multiplex networks with overlap. Phys. Rev. E 2013, 88. [Google Scholar] [CrossRef]
  64. Leicht, E.A.; D’Souza, R.M. Percolation on Interacting Networks; Cornell University: Ithaca, NY, USA, 2011. [Google Scholar]
  65. Parshani, R.; Buldyrev, S.V.; Havlin, S. Critical effect of dependency groups on the function of networks. Proc. Natl. Acad. Sci. USA 2011, 108, 1007–1010. [Google Scholar] [CrossRef] [PubMed]
  66. Bashan, A.; Parshani, R.; Havlin, S. Percolation in networks composed of connectivity and dependency links. Phys. Rev. E 2011, 83. [Google Scholar] [CrossRef]
  67. Zhao, J.H.; Zhou, H.J.; Liu, Y.Y. Inducing effect on the percolation transition in complex networks. Nat. Commun. 2013, 4. [Google Scholar] [CrossRef] [PubMed]
  68. Hu, Y.; Ksherim, B.; Cohen, R.; Havlin, S. Percolation in interdependent and interconnected networks: Abrupt change from second to first order transition. Phys. Rev. E 2011, 84. [Google Scholar] [CrossRef]
  69. Amin, S.M.; Wollenberg, B.F. Toward a smart grid: Power delivery for the 21st century. IEEE Power Energy Mag. 2005, 3, 34–41. [Google Scholar] [CrossRef]
  70. Farhangi, H. The path of the smart grid. IEEE Power Energy Mag. 2010, 8, 18–28. [Google Scholar] [CrossRef]
  71. Gungor, V.C.; Lu, B.; Hancke, G.P. Opportunities and challenges of wireless sensor networks in smart grid. IEEE Trans. Ind. Electron. 2010, 57, 3557–3564. [Google Scholar] [CrossRef]
  72. Parshani, R.; Rozenblat, C.; Ietri, D.; Ducruet, C.; Havlin, S. Inter-similarity between coupled networks. Europhys. Lett. 2010, 92. [Google Scholar] [CrossRef]
  73. Buldyrev, S.V.; Shere, N.W.; Cwilich, G.A. Interdependent networks with identical degrees of mutually dependent nodes. Phys. Rev. E 2011, 83. [Google Scholar] [CrossRef]
  74. Hu, Y.; Zhou, D.; Zhang, R.; Han, Z.; Rozenblat, C.; Havlin, S. Percolation of interdependent networks with intersimilarity. Phys. Rev. E 2013, 88. [Google Scholar] [CrossRef]
  75. Gao, J.; Buldyrev, S.V.; Havlin, S.; Stanley, H.E. Robustness of a network of networks. Phys. Rev. Lett. 2011, 107. [Google Scholar] [CrossRef]
  76. Gao, J.; Buldyrev, S.V.; Havlin, S.; Stanley, H.E. Robustness of a network formed by n interdependent networks with a one-to-one correspondence of dependent nodes. Phys. Rev. E 2012, 85. [Google Scholar] [CrossRef]
  77. Son, S.W.; Bizhani, G.; Christensen, C.; Grassberger, P.; Paczuski, M. Percolation theory on interdependent networks based on epidemic spreading. Europhys. Lett. 2012, 97. [Google Scholar] [CrossRef]
  78. Gao, J.; Buldyrev, S.V.; Stanley, H.E.; Xu, X.; Havlin, S. Percolation of a general network of networks. Phys. Rev. E 2013, 88. [Google Scholar] [CrossRef]
  79. Brummitt, C.D.; DâĂŹSouza, R.M.; Leicht, E. Suppressing cascades of load in interdependent networks. Proc. Natl. Acad. Sci. USA 2012, 109, E680–E689. [Google Scholar] [CrossRef] [PubMed]
  80. Li, D.; Qin, P.; Wang, H.; Liu, C.; Jiang, Y. Epidemics on interconnected lattices. Europhys. Lett. 2014, 105. [Google Scholar] [CrossRef]
  81. Pocock, M.J.; Evans, D.M.; Memmott, J. The robustness and restoration of a network of ecological networks. Science 2012, 335, 973–977. [Google Scholar] [CrossRef] [PubMed] [Green Version]
  82. Zhao, K.; Bianconi, G. Percolation on interacting, antagonistic networks. J. Stat. Mech. Theory Exp. 2013, 2013. [Google Scholar] [CrossRef]
  83. Morris, R.G.; Barthelemy, M. Transport on coupled spatial networks. Phys. Rev. Lett. 2012, 109. [Google Scholar] [CrossRef]
  84. Zhang, P.; Cheng, B.; Zhao, Z.; Li, D.; Lu, G.; Wang, Y.; Xiao, J. The robustness of interdependent transportation networks under targeted attack. Europhys. Lett. 2013, 103. [Google Scholar] [CrossRef]
  85. Gomez, S.; Diaz-Guilera, A.; Gomez-Gardeñes, J.; Perez-Vicente, C.J.; Moreno, Y.; Arenas, A. Diffusion dynamics on multiplex networks. Phys. Rev. Lett. 2013, 110. [Google Scholar] [CrossRef]
  86. Nagler, J.; Levina, A.; Timme, M. Impact of single links in competitive percolation. Nat. Phys. 2011, 7, 265–270. [Google Scholar] [CrossRef]
  87. Aguirre, J.; Papo, D.; Buldú, J.M. Successful strategies for competing networks. Nat. Phys. 2013, 9, 230–234. [Google Scholar] [CrossRef]
  88. Kivelä, M.; Arenas, A.; Barthelemy, M.; Gleeson, J.P.; Moreno, Y.; Porter, M.A. Multilayer networks. J. Complex Netw. 2014, 2, 203–271. [Google Scholar] [CrossRef]
  89. Radicchi, F.; Arenas, A. Abrupt transition in the structural formation of interconnected networks. Nat. Phys. 2013, 9, 717–720. [Google Scholar] [CrossRef]
  90. Li, D.; Jiang, Y.; Kang, R.; Shlomo, H. Spatial correlation analysis of cascading failures: Congestions and Blackouts. Sci. Rep. 2014, 4. [Google Scholar] [CrossRef]
  91. Danziger, M.M.; Shekhtman, L.M.; Berezin, Y.; Havlin, S. Two Distinct Transitions in Spatially Embedded Multiplex Networks; Cornell University: Ithaca, NY, USA, 2015. [Google Scholar]
  92. Peerenboom, J.P.; Fisher, R.; Whitfield, R.G. Recovering from disruptions of interdependent critical infrastructures. In Proceedings of the CRIS/DRM/IIIT/NSF Workshop on Mitigating the Vulnerability of Critical Infrastructures to Catastrophic Failures, Alexandria, VA, USA, 10–11 September 2001.
  93. Emmerich, T.; Bunde, A.; Havlin, S.; Li, G.; Li, D. Complex networks embedded in space: Dimension and scaling relations between mass, topological distance, and Euclidean distance. Phys. Rev. E 2013, 87. [Google Scholar] [CrossRef]
  94. Emmerich, T.; Bunde, A.; Havlin, S. Diffusion, annihilation, and chemical reactions in complex networks with spatial constraints. Phys. Rev. E 2012, 86. [Google Scholar] [CrossRef]
  95. Li, W.; Bashan, A.; Buldyrev, S.V.; Stanley, H.E.; Havlin, S. Cascading failures in interdependent lattice networks: The critical role of the length of dependency links. Phys. Rev. Lett. 2012, 108. [Google Scholar] [CrossRef]
  96. Bashan, A.; Berezin, Y.; Buldyrev, S.V.; Havlin, S. The extreme vulnerability of interdependent spatially embedded networks. Nat. Phys. 2013, 9, 667–672. [Google Scholar] [CrossRef]
  97. Berezin, Y.; Bashan, A.; Danziger, M.M.; Li, D.; Havlin, S. Localized attacks on spatially embedded networks with dependencies. Sci. Rep. 2015, 5. [Google Scholar] [CrossRef] [PubMed]
  98. Segal, E.; Shapira, M.; Regev, A.; Pe’er, D.; Botstein, D.; Koller, D.; Friedman, N. Module networks: Identifying regulatory modules and their condition-specific regulators from gene expression data. Nat. Genet. 2003, 34, 166–176. [Google Scholar] [CrossRef] [PubMed]
  99. Majdandzic, A.; Braunstein, L.A.; Curme, C.; Vodenska, I.; Levy-Carciente, S.; Stanley, H.E.; Havlin, S. Multiple Tipping Points and Optimal Repairing in Interacting Networks; Cornell University: Ithaca, NY, USA, 2015. [Google Scholar]
  100. Shekhtman, L.M.; Berezin, Y.; Danziger, M.M.; Havlin, S. Robustness of a network formed of spatially embedded networks. Phys. Rev. E 2014, 90. [Google Scholar] [CrossRef]
  101. Danziger, M.M.; Bashan, A.; Berezin, Y.; Havlin, S. Interdependent Spatially Embedded Networks: Dynamics at Percolation Threshold. In Proceedings of the 2013 International Conference on Signal-Image Technology & Internet-Based Systems (SITIS), Kyoto, Japan, 2–5 December 2013; pp. 619–625.
  102. Shao, S.; Huang, X.; Stanley, H.E.; Havlin, S. Percolation of localized attack on complex networks. New J. Phys. 2015, 17, 1367–2630. [Google Scholar] [CrossRef]
  103. Jelasity, M.; Montresor, A.; Babaoglu, O. Gossip-based aggregation in large dynamic networks. ACM Trans. Comput. Syst. 2005, 23, 219–252. [Google Scholar] [CrossRef]
  104. Steglich, C.; Snijders, T.A.; Pearson, M. Dynamic networks and behavior: Separating selection from influence. Sociol. Methodol. 2010, 40, 329–393. [Google Scholar] [CrossRef]
  105. Goh, K.I.; Kahng, B.; Kim, D. Universal behavior of load distribution in scale-free networks. Phys. Rev. Lett. 2001, 87. [Google Scholar] [CrossRef]
  106. Girvan, M.; Newman, M.E. Community structure in social and biological networks. Proc. Natl. Acad. Sci. USA 2002, 99, 7821–7826. [Google Scholar] [CrossRef] [PubMed]
  107. Blanchard, O.J.; Summers, L.H. Hysteresis and the European unemployment problem. In NBER Macroeconomics Annual 1986; MIT Press: Cambridge, MA, USA, 1986; pp. 15–90. [Google Scholar]
  108. Ding, F.; Dokholyan, N.V.; Buldyrev, S.V.; Stanley, H.E.; Shakhnovich, E.I. Direct molecular dynamics observation of protein folding transition state ensemble. Biophys. J. 2002, 83, 3525–3532. [Google Scholar] [CrossRef]
  109. Kesselring, T.A.; Lascaris, E.; Franzese, G.; Buldyrev, S.V.; Herrmann, H.J.; Stanley, H.E. Finite-size scaling investigation of the liquid-liquid critical point in ST2 water and its stability with respect to crystallization. J. Chem. Phys. 2013, 138. [Google Scholar] [CrossRef] [PubMed]
  110. Motter, A.E.; Myers, S.A.; Anghel, M.; Nishikawa, T. Spontaneous synchrony in power-grid networks. Nat. Phys. 2013, 9, 191–197. [Google Scholar] [CrossRef]
  111. Zhou, D.; Bashan, A.; Cohen, R.; Berezin, Y.; Shnerb, N.; Havlin, S. Simultaneous first-and second-order percolation transitions in interdependent networks. Phys. Rev. E 2014, 90. [Google Scholar] [CrossRef]
  112. Schneider, C.M.; Yazdani, N.; Araújo, N.A.; Havlin, S.; Herrmann, H.J. Towards designing robust coupled networks. Sci. Rep. 2013, 3. [Google Scholar] [CrossRef] [PubMed]
  113. He, Z.; Liu, S.; Zhan, M. Dynamical robustness analysis of weighted complex networks. Phys. A Stat. Mech. Appl. 2013, 392, 4181–4191. [Google Scholar] [CrossRef]
  114. Tanaka, G.; Morino, K.; Aihara, K. Dynamical robustness in complex networks: The crucial role of low-degree nodes. Sci. Rep. 2012, 2. [Google Scholar] [CrossRef] [PubMed]
  115. Morino, K.; Tanaka, G.; Aihara, K. Efficient recovery of dynamic behavior in coupled oscillator networks. Phys. Rev. E 2013, 88. [Google Scholar] [CrossRef]
  116. Zou, W.; Senthilkumar, D.; Nagao, R.; Kiss, I.Z.; Tang, Y.; Koseska, A.; Duan, J.; Kurths, J. Restoration of rhythmicity in diffusively coupled dynamical networks. Nat. Commun. 2015, 6. [Google Scholar] [CrossRef] [PubMed]
  117. Huang, X.; Gao, J.; Buldyrev, S.V.; Havlin, S.; Stanley, H.E. Robustness of interdependent networks under targeted attack. Phys. Rev. E 2011, 83. [Google Scholar] [CrossRef]
  118. Dong, G.; Gao, J.; Tian, L.; Du, R.; He, Y. Percolation of partially interdependent networks under targeted attack. Phys. Rev. E 2012, 85. [Google Scholar] [CrossRef]
  119. Dong, G.; Gao, J.; Du, R.; Tian, L.; Stanley, H.E.; Havlin, S. Robustness of network of networks under targeted attack. Phys. Rev. E 2013, 87. [Google Scholar] [CrossRef]
  120. Yagan, O.; Qian, D.; Zhang, J.; Cochran, D. Optimal allocation of interconnecting links in cyber-physical systems: Interdependence, cascading failures, and robustness. IEEE Trans. Parallel Distrib. Syst. 2012, 23, 1708–1720. [Google Scholar] [CrossRef]
  121. Gu, C.G.; Zou, S.R.; Xu, X.L.; Qu, Y.Q.; Jiang, Y.M.; Liu, H.K.; Zhou, T. Onset of cooperation between layered networks. Phys. Rev. E 2011, 84. [Google Scholar] [CrossRef]

