Abstract
This paper reviews the most relevant works that have investigated robustness in power grids using Complex Networks (CN) concepts. In this broad field there are two different approaches. The first one is based solely on topological concepts, and uses metrics such as mean path length, clustering coefficient, efficiency and betweenness centrality, among many others. The second, hybrid approach consists of introducing (into the CN framework) some concepts from Electrical Engineering (EE) in the effort of enhancing the topological approach, and uses novel, more efficient electrical metrics such as electrical betweenness, net-ability, and others. There is however a controversy about whether these approaches are able to provide insights into all aspects of real power grids. The CN community argues that the topological approach does not aim to focus on the detailed operation, but to discover the unexpected emergence of collective behavior, while part of the EE community asserts that this leads to an excessive simplification. Beyond this open debate it seems to be no predominant structure (scale-free, small-world) in high-voltage transmission power grids, the vast majority of power grids studied so far. Most of them have in common that they are vulnerable to targeted attacks on the most connected nodes and robust to random failure. In this respect there are only a few works that propose strategies to improve robustness such as intentional islanding, restricted link addition, microgrids and smart grids, for which novel studies suggest that small-world networks seem to be the best topology.
1. Introduction
In the context of power grids a cascading outage is a sequence of failures and disconnections triggered by an initial event, which can be caused by natural phenomena (e.g., high wind, flooding or a lightning shorting a line), human actions (attacks) or the emergence of imbalances between load and generation. An outage that affects a wide area or even the whole power grid is also called “blackout” [1], and usually occurs in a time-scale that is typically too short to stop it by human intervention.
In this respect, most of the major blackouts in power grids have been generally caused by an initial event (for instance, critical loads) that unchains a series of “cascading failures” [2,3,4,5,6,7], with very severe consequences. This is the reason why the study of cascading failures in power grids (both in power transmission grids [2,8], distributed generation [9] and smart grids [10]) is currently a vibrant topic which is being profusely investigated [2,3,4,8,9,10,11,12,13,14,15]. Some historic blackouts—such as the recently one occurred in India on end July 2012 [15], those in the north-east area of US and Canada (August 14, 2003) [16,17,18], the one affecting a large portion of Italy (September 28, 2003) and other countries in the European Union [19,20]—have been widely studied using both Complex Networks (CN) and Electrical Engineering (EE) tools [2,7,8,12,13,14,21,22,23,24,25,26,27,28,29,30,31,32,33,34,35,36,37,38]. However, there seems to exist no single framework capable of uncontroversially explaining neither their inner nonlinear dynamics nor their pervasiveness [7,11,33], not only due to the complexity of the topic in itself [7,39] but also because of the disconnection between the CN and EE communities [11], and the scientific controversy about whether the pure CN theory is able to provide insights into real power grids.
Due to the complexity of these situations and their different theoretical approaches, some extremely important and beneficial properties for power grids, such as “reliability”, “resilience” and “robustness”, which are different although related concepts, have been tackled with different approaches [21,40,41,42,43,44]. “Reliability” is a beneficial property for a power grid that refers to its ability to supply electric loads with a high level of probability, during a given time interval [40]. Further details about its technical definitions and references therein can be found in Table 1, which, for the sake of clarity, summarizes this and other concepts that will be used throughout this paper. Likewise, “robustness” or “vulnerability” (its opposite concept) are often used to measure to what extent a power grid has high reliability or low reliability, respectively. In this review we follow the approach in [12] by using the definition that considers the vulnerability of a power grid as the performance drop when a disruptive event emerges. The performance can be measured by using a number of metrics; if ξ labels the metric to be considered, the power grid vulnerability to an unexpected event that removes an element j (a line, a generator, whatsoever) can be defined as
where ξ and represent the value of the metric before and after the event affecting element j, respectively. This generic formula will be particularized for different metrics throughout this paper.
The “resilience” of a power grid [44,45,46] is the ability to recover quickly after high-impact, low-probability disruptive events, and is related to the potential to adapt its structure and operation for mitigating or even preventing the impact of similar events in the future [41,45,47]. Accordingly, there is a relationship between robustness (which establishes how much damage occurs as a consequence of an unexpected perturbation) and resilience (which is related to how quickly the power grid can recover from such damage). Specifically, a power grid that lacks of robustness will often collapse before recovery, having thus small or even no resilience. As shown in [45], the concept of resilience is broader than that of robustness, and in fact encompasses not only robustness but also redundancy, adaptive self-organization, and rapidity. The interested reader is referred to [45] for a deeper introduction to the resilience framework.

Table 1.
Summary of definitions related to robustness in power grids and their references.
| Concept | Definition | Ref. |
|---|---|---|
| Reliability | Probability that an electric power grid can perform a required function under | |
| given conditions for a given time interval (IEC definition). | [45] | |
| The probability of its satisfactory operation over the long run (IEEE definition). | [48] | |
| Disturbance | An unexpected event that produces an anomalous system condition. | [45] |
| Contingency | The unexpected failure or outage of a network component, such as a generator, | |
| transmission line, or other electrical element. | [45] | |
| Robustness | Degree to which a network is able to withstand an unexpected event without degradation in | |
| performance. It quantifies how much damage occurs as a consequence of such unexpected | ||
| perturbation. | [49] | |
| Vulnerability | The lack of robustness. Vulnerability is often used to score low reliability of power grids. | |
| It can be quantitatively defined by Equation (1). | [12] | |
| Resilience | The ability of a power system to recover quickly after a disaster or, more generally, the | |
| ability of anticipating to extraordinary, high-impact, low-probability events, quickly | ||
| recovering from these disruptive events, and adapting its operation and structure for | ||
| preventing or mitigating the impact of similar events in the future. | [45] | |
| Resilience vs. | Robustness measures how much damage occurs as a consequence of an unexpected perturbation, | [49] |
| robustness | while resilience measures how quickly the network can retrieve from such damage. | |
| Resilience vs. | Resilience is related to low probability, high impact events. It is a dynamic concept. | [41,49] |
| reliability | Reliability is related to high probability, low impact events. It is a static concept. | |
| Stability | The ability to maintain or to recover a state of equilibrium after disturbances or contingencies. | [40] |
| Critical | Infrastructure whose unavailability or destruction would have a extensive impact on economy, | |
| Infrastructure | Government services and, in general, on everyday life, with severe consequences | |
| for a nation. Examples of critical infrastructures are power grids, telecommunication | ||
| networks, transportation networks, water supply systems and natural gas and oil pipelines. | [50,51,52,53] |
In this context it is insightful to note that in Figure 1a the random failure of the marked link does not affect the network functionality (since nodes 1 and 2 remain linked to the rest of the network), while the targeted attack on the marked node in Figure 1b will make the network disintegrate in many unconnected parts before recovery. Thus, its lack of robustness results in negligible resilience. For more details about methodologies for resilience analysis in largely networked infrastructure (including power grids), we refer the interested reader to the recent works [41,44,45,47].
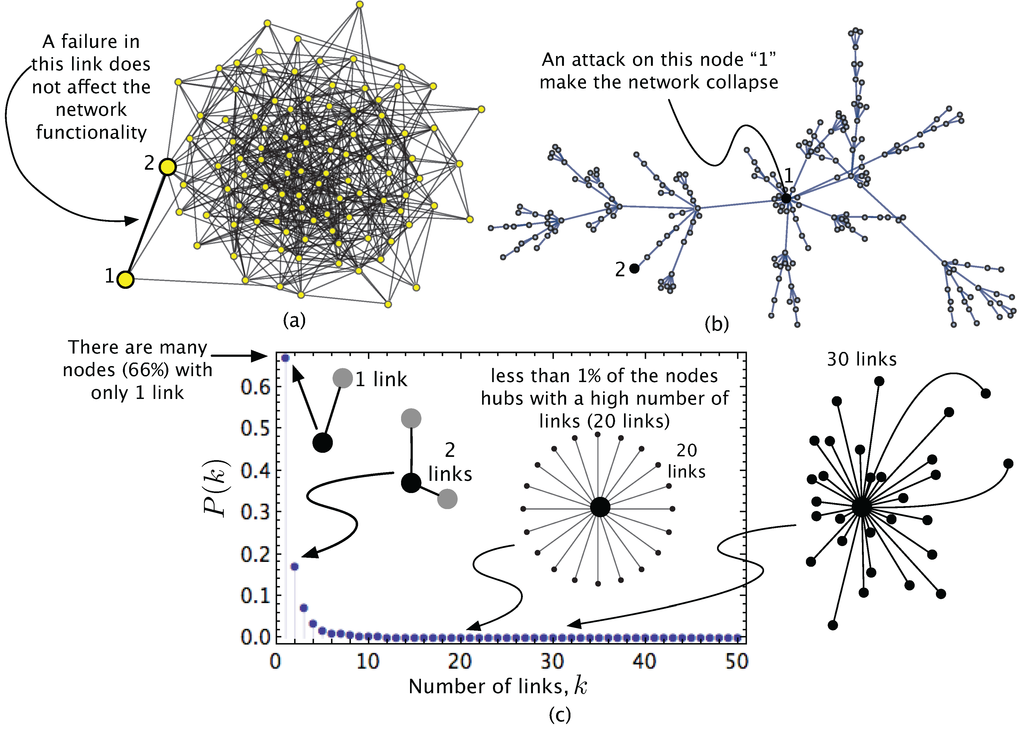
Figure 1.
(a) Example of a robust network; (b) Example of a scale-free network, vulnerable to attacks on nodes with many links; (c) Node degree probability density function of a network similar to that represented in (b).
Although robustness and resilience are different albeit related concepts, as will be shown throughout this survey sometimes they are used indistinguishably because, from a practical point of view, robustness is a necessary but not sufficient condition to make the power grid resilient. In this survey we will focus on robustness of power grids using concepts extracted from CN Science and approximations from EE, as will be motivated below.
Modeling robustness of power grids against cascading failures is the main reason why many scientists and engineers have decided to apply the CN approach [51,54,55,56,57,58,59,60,61,62] to power grids [8,13,14,22,23,24,25,27,30,34,35,36,63,64,65,66], these being a representative selection of the latest works in the field. Although it will be explained in Section 2 to make the manuscript self-completed, we introduce at this point the simple mathematical concept of network graph because it will assist us in better motivating the purpose of this paper and in explaining its structure. A network is simply a set of “entities” called nodes or vertices (in our case, stations in a power grid, or routers in Internet, one of the clearest examples of complex network) that are connected to each other by means of links or edges (correspondingly, lines in a power grid). The CN approach has been used to explore the robustness, stability (see definition in Table 1), and resilience of different networks in highly cited papers such as [19,38,61,67,68,69,70,71,72,73] and, more recently, in [74,75,76,77,78,79,80,81,82,83,84,85,86,87,88]. The key topic of network robustness (or vulnerability, the opposite property) has strongly attracted the attention of researchers in very different scientific and technological fields (physics, mathematics, biology, telecommunications, energy, economy,...) [51,55,57,58,59,60,61,62]. In fact, cascading failures, described before as an apparently inherent potential weakness of electricity grids, are however common in complex networks regardless of whether they are integrated circuits, Internet, or transport networks, to name a few where the phenomenon is more noticeable [51,57,58,59,60,61,89,90,91,92].
Thus robustness in power grids is critical not only to ensure their own functionality against random failures or intentional attacks (“threats” [40] in the wide sense), but also to ensure the robustness of other infrastructures that are mutually dependent. This is the concept of “interdependent networks” [93,94,95,96,97,98,99], which relates to the wider one of “multilayer networks” [100,101,102,103] and “network of networks” [104,105]. The concept of “interdependent networks”, as will be shown later on, has also been used recently to investigate power grids [106,107,108], since the power grid operates as a network of networks defined by the country geography [107,108]. In particular, the interdependence among a class of large networks called “critical infrastructures” (Table 1) [52,109] has currently become a vibrant research topic. The key point in this respect is that power grid stands out as one of the most critical ones. The rationale behind this lies on the observation that most of the other large-scale infrastructures delivering essential services and goods (namely communications, emergency services, health, transport, water, energy, financial services, food, and Government services) require electric power for their operation. For instance, as pointed out in [40], in the 2003 Northeast Blackout [16], the outage collapsed several services and facilities one after another: all trains arriving at and departing from New York City were shut down; the water pressure was reduced because water pumps had no electricity; mobile communications became out of order, ... Reference [53] is a good introduction to interdependent networks while we refer the reader to [95,96,97,98,99,103,105] for further details out of the scope of this paper. The protection of critical infrastructures has become a priority for Governments since terrorist groups may potentially take advantage of vulnerabilities and interdependencies in power grids [50,110,111,112,113], threats that make robustness and resilience even more crucial.
With this complex scenario in mind, the purpose of this paper is to review the works that have tackled the robustness of power grids by using the CN approach, not only those based solely on topological CN concepts (“pure topological approach”), but also those that enhance the CN approach by including concepts from EE (“hybrid approaches”), in which the so-called “extended topological model” developed by Bompard et al. [8,78] plays a key role. This is a similar approach to the one adopted by the useful recent reviews [8,12,14].
The differential contributions of this paper are: (1) a summary of the fundamental concepts of complex networks on which the review is based, in an effort to make the paper self-contained as far as possible; (2) an analysis of recent papers aimed at suppressing cascading failures in power grids [106,107,108] by modeling power grids as networks of networks; (3) an extension of the review to works that apply CN concepts to smart grids [64,114,115] (which, as will be shown, are much less numerous than those devoted to transmission high voltage power grids, but in which, however, the CN theory is very useful to propose new structures [64]); (4) a classification of the revised works according to different useful metrics, in a similar approach to [14], including novel criteria that will be explained later; (5) a critical analysis of the feasibility of CN theory to provide insights into real power grids, which is still under debate in the literature [8,11]. Regarding this controversy, Luo and Rosas-Casals have very recently proposed a study [116] that aims to correlate novel vulnerability metrics (based on the extended topological approach mentioned before) with real malfunction data for several European power transmission grids (Germany, Italy, France and Spain), and which opens a research line to find a more meaningful connection between CN-based metrics and the empirical data of power grids.
We would like finally to emphasize that there are too many works related to the analysis of robustness in power grids based on both pure topological and hybrid approaches. In fact, there is a huge number of contributions, not only those directly focused on power grids, but also those emerging from multidisciplinary works centered in collateral yet related topics, which involve other sciences (graph theory, chaos, ecology, economics, telecommunication and computer science, and critical infrastructures science, among many others). Thus the methodological approach we have adopted in our review hinges on selecting and analyzing those most cited references (those who provide the scientific basis) along with those most recent with the highest quality when explaining the concepts involved.
With these considerations in mind, the structure of the rest of this paper is as follows: Section 2 introduces the basic concepts that help understanding the works that gravitate on robustness/vulnerability in power grids from the CN point of view. Grounded on these concepts, Section 3—the core of this paper—focuses on reviewing those most important works dealing with the analysis of power grid robustness by resorting to CN theory. As already mentioned, these can be grouped into two classes: those works that study the power grid based only on topological CN concepts, and those that additionally include electrical concepts within the CN framework. Section 4 analyses the reviewed papers as a function of the vulnerability used, discusses critically the ability of CN theory to provide insights into real power grids, summarizes the topological structures founds, and suggests strategies to mitigate vulnerability. The paper concludes with Section 5, which summarizes the work and synthesizes its main findings.
2. Complex Networks Fundamentals: An Introduction
The purpose of this section is to make this paper stand by itself by providing an introduction to the necessary concepts related to complex networks science (Subsection 2.1), the vulnerability metrics most commonly used in the literature (Subsection 2.2), and the cascading failures issue in the more general context of complex networks (2.3).
2.1. Complex Network Concepts
We have previously mentioned that a power grid is nothing more than a network in which nodes (or “vertices”) are stations (generators, transmission substations, loads), while links (“edges”) correspond to the transmission lines between the nodes. This representation (sometimes with weighted links) is adequate for both high-voltage transmission grids (the vast majority of the reviewed contributions focus on high-voltage transmission power grids) and medium- and low-voltage distribution grids [117], as well as smart grids [10,64,114,115,118,119] (these two later classes of grids having being studied at a lesser extent).
In turn, a network can be represented mathematically by using a “graph” , where represents the set of nodes (or vertices) and denotes the set of links (edges). This is the most simple graph. However, as will be explained, sometimes it is necessary for the graph to contain information about links (for instance, impedance line), this information being represented by weighted links.
The following list summarizes some important concepts and definitions [6,57,59,61] that will help better understand the review in Section 3 and to discuss it in Section 4. The key concepts are:
- An “undirected” graph is a graph for which the relationship between pairs of nodes are symmetric, so that each link has no directional character (unlike a “directed graph”). Unless otherwise is indicated, the term “graph” is assumed to refer to an “undirected graph”.
- An undirected graph is “connected” if there is a path from any two different nodes of . A disconnected graph can be partitioned into at least two subsets of nodes so that there is no link connecting the two components (“connected subgraphs”) of the graph.
- A “simple graph” is an unweighted, undirected graph containing neither loops nor multiple edges.
- The “order” of a graph is the number of nodes in set , that is the cardinality of set , which we represent as . We label the order of a graph as N, .
- The “size” of a graph is the number of links in the set , , and can be defined (≐) as :where if node i is linked to node j and otherwise. Elements are the matrix elements of the “adjacency matrix”.
- The “degree” of a node i is the number of links connecting i to any other node. The “degree” of node i, denoted as , is simply:
- The node degree is characterized by a probability density function indicating the probability that a randomly selected node has k links.
- A “geodesic path” is the shortest path through the network from one nodes to another. Or, in other words, a geodesic path is the path which has minimal number of links between two nodes. Note that there may be and often is more than one geodesic path between two nodes [61].
- The “distance” between two nodes i and j, , is the length of the shortest path (geodesic path) between them, that is, the minimum number of links when going from one node to the other [120].
- The “average path length” of a network is the mean value of distances between any pair of nodes in the network [57]:where is the distance between node i and node j.
- The “diameter” of a network is the length (in number of links) of the longest geodesic path between any two vertices [61].
- The “clustering coefficient” is a local property capturing the density of triangles in a network. That is, two nodes that are connected to a third node are also directly connected to each other. Thus a node i in a network has links that connects it to other nodes. The clustering coefficient of node i is defined as the ratio between the number of links that exist between these vertices and the maximum possible number of links (. The clustering coefficient of the whole network is [57]:Put it simple, for a given node, we compute the number of neighboring nodes that are connected to each other, and average this number over all the nodes in the network.
Most recent studies reveal that several complex networks—such as some power grids or Internet—have a heterogeneous topology [57,69] as the one represented in Figure 1b. This leads to a probability density function like the one represented in Figure 1c. Note that, as most nodes have only a few connections and only a few nodes (often referred to as “hubs”) possess a high number of links, then the network is said to have no “scale” [121]. This is why they are called “scale-free” networks. Many of these networks with heterogeneous node degree distribution follow a power law distribution for large k. In particular:
- For illustrative purposes, Figure 1c shows the probability density function of a scale-free network we have generated. Note that there are many nodes with few links, for instance, about 66% of nodes have only 1 link. However, there is a extremely low number of nodes with many links (“hubs”). It is more likely that a random failure affects one node with very few nodes (such as “2” in Figure 1b), which minimally impacts on the operation of the network as a whole. However a targeted attack on a hub (node “1” in Figure 1b) may disconnect the network in many parts, affecting severely its operation. This exemplifies the fact that scale-free networks are robust to random failures at most of their constituent nodes, but fragile when undergoing targeted attacks on a single or few hubs [121]. In contrast, Figure 1a is intuitively more robust, as mentioned before. This is the “random” or “Erdős-Rényi” (ER) network.
- A scale-free network can be generated by progressively adding nodes to an existing network by introducing links to nodes with “preferential attachment” [69,122] so that the probability of linking to a given node i is proportional to the number of existing links of the node. This is the so-called Barabási and Albert (BA) model. In contrast, in ER networks, the connection of the nodes is completely random, with a given connection probability p.
In addition, there are some complex networks that exhibit the “small world” property. Figure 2 will help introducing this concept.
- A small-world network is a complex network in which the mean distance or average path length ℓ is small when compared to the total number of nodes N in the network: as . That is, there is a relatively short path between any pair of nodes [51,70]. The term “small-world networks” is often used to refer Watts-Strogatz (WS) networks, first studied in [70]. Figure 2a shows the aspect and of a WS we have generated with nodes and links. It has a short mean distance, , and high clustering, . Most of small world networks have exponential degree distributions [123]. As will be shown, there are some power grids that exhibit the small-world property [111], and has been found very recently to be a beneficial property for smart grids [64].
- A key feature of a small-world network is that it can be generated by taking a small fraction of the links in a regular (ordered) network and “rewiring” them. The rewiring algorithm involves going through each link and, with “rewiring probability” p, disconnecting one end of that link and connecting it to a new node chosen at random, with the only restrictions that no double edges or self-edges are ever generated [61]. Figure 2b aims at illustrating this procedure: link , which was connecting node 1 to node 3, is now disconnected (from node 3) and rewired to connect node 1 to node 9. This means that, in the new network, going from node 1 to node 9 only requires one jump via the rewired link (and thus ). However, in the original regular network, going from node 1 to node 9 through the geodesic or shortest path () involves 4 links (). That is, the rewired link can be viewed as a “shortcut” between nodes 1 and 9, which avoids having to go through intermediate nodes. In general, creating a few shortcuts may have the effect of reducing at a great extent the mean free path [124].
- This method, applied to networks with a large number of nodes, leads to topologies like the one represented in Figure 2a ( and ). This also illustrates that the architecture of real small-world networks is extremely heterogeneous: the vast majority of the elements are poorly connected, but simultaneously few have a large number of connections [124]. The robustness of small-world network has been explored in [125,126] leading to the conclusion that, in non-sparse WS network (), simultaneously increasing both rewiring probability and average degree improve significantly the robustness of the small-world network.
- An important variant of WS model is the one proposed by Newman and Watts [127] (NW small-world model) in which one does not break any connection between any two nearest neighbors, but instead, adds with probability p a connection between a pair of nodes. It has been found that for sufficiently small p and sufficiently large N, the NW model is basically equivalent to the WS model [128]. Currently, these two models are together commonly termed small-world models. As will be shown in Section 4, a feasible strategy to improve the robustness of power grids is to add a controlled number of links between distant nodes (shortcuts, assumed to be as links to go from one node to another without having to go through others), similar to the NW small-world model.
Finally it is worth mentioning that complex networks emerge not only in power grids and other human-made systems—including Internet [129,130], the topology of web pages (where the nodes are individual webs and edges are hyperlinks) [57,62], airline routes [131], electronic circuits [132] or socioeconomic systems [133]—but also in systems stemming from Nature, e.g., evolution [134], metabolic networks [135], protein interactions [136] and food webs [137]. For more details regarding the description and bibliographic references of these complex networks, which are outside the scope of this paper, we refer the interested reader to the recent books [62,90].
A way to quantify the extent to which a complex power grid is robust is to use vulnerability metrics. The following subsection summarizes the key metrics that have appeared in our review, which will help us understand it better.
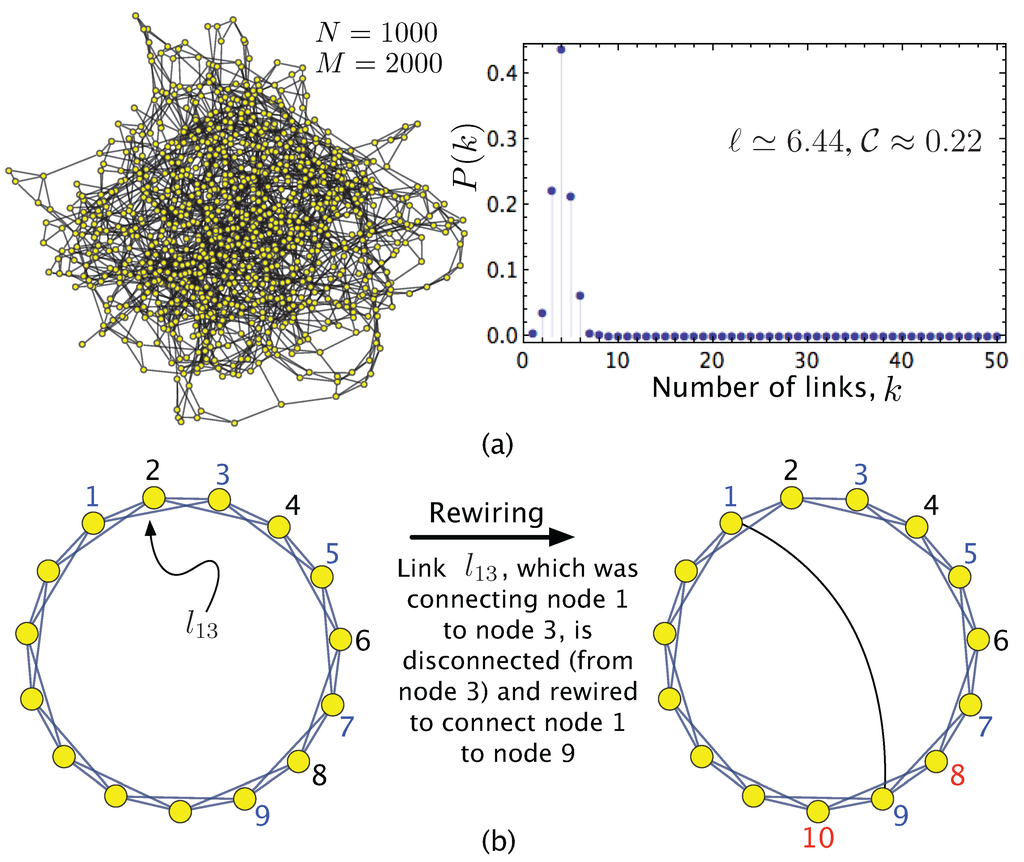
Figure 2.
(a) Example of a Watts-Strogatz (WS) network and its node degree distribution; (b) First step in the creation of a small-world network. See the main text for further details.
2.2. CN-Based Vulnerability Metrics
As pointed out in [12], the concept “vulnerability” has many meanings in the literature [138,139]. We have mentioned in Section 1 that in this review we follow [12] by using the definition that considers the vulnerability as the drop in performance of a power grid when a disruptive event emerges. The key point is that such performance can be measured by using a variety of metrics. As will be shown throughout this paper, the particular metrics applied in the different works will be used to finally categorize all the revised works in Table 3 when completing the manuscript. The CN topology-based metrics that appear the most in the revised papers are summarized in the paragraphs below for understanding our review in a structured fashion, and to better understood those novel that will be described when revising the papers. These topology-based metrics are:
- The “relative size of the largest connected component”, which is defined aswhere N and are the numbers of nodes in the largest connected component before and after the event.
- The “efficiency” E of a network is the communication effectiveness of a networked system [140],which is a measure of the network performance under the assumption that the efficiency for sending load (electricity, information, packets, whatsoever) between two nodes i and j is proportional to the reciprocal of their distance. Based on this definition, and following [12], the vulnerability of a network can be defined as the drop in the efficiency when link j is removed from the network, that is
- The “betweenness centrality” quantifies how much a node v is found between the paths linking other pairs of nodes, that is,where is total number of shortest paths from node s to node t and is the number of those paths that pass through v. A high value for node v means that this node, for certain paths, is critical to support node connections. The attack or failure of v would lead to a number of node pairs either to be disconnected or connected via longer paths.
- The “degree centrality” of a node i is defined as [30]and can be interpreted in terms of the number of vertices and edges that are directly influenced by the status of node i.
- The “eccentricity” (eccentricity centrality) of a node i is:Note that a low eccentricity of node i suggests that all other nodes are close to it [30].
- The “centroid centrality” of node i isbeing [30]. It means that a node has a central position within a region, characterized by a high density of interacting nodes.
Metrics , , , and are “centrality measures” and quantify to what extent a node is “central” in a network. We will show that “electrical centrality metrics” have been proposed based on , , , and .
2.3. Cascading Failures in Complex Networks
Cascading failures in large complex networks have been explored in a broad general context [17,141,142,143,144] (with application to power grids, Internet and transportation networks, among others). Although these networks are very different to each other at a first glance, they all have in common the fact that the flow of a physical quantity in the network (that is, electric power on power grids, packets on Internet) plays a key role. In these works, the load at a node is simply the betweenness centrality—Equation (9)—while its capacity is the maximum load that the node can handle. Indeed it is pointed out that for those complex networks in which loads can be redistributed among nodes, intentional attacks can trigger a cascade of failures which in turn, may yield the collapse of large network areas, or even the whole network. In particular [141] emphasizes that this effect is of great importance in networks with high heterogeneity (Figure 1). The study of cascades in these networks—regardless of the physical quantity flowing through the network (electric power flow in a power grid, vehicles in a transportation network, packets is a communication network...)—evinces that while the scale-free property makes many man-made and natural networks robust against to random node failure, the existence of hub nodes may make the network vulnerable to a cascade of overload failures, which may end up splitting the network into isolated fragments. In a similar line of reasoning, the “fiber-bundle” model for scale-free networks with power-law distribution has been proposed to model cascading failures [144]. In a fiber-bundle model a set of fibers (elements) is placed on the sites of a network, and a random strength (with a given probability distribution, frequently the Weibull distribution) is applied to each. When the strength increases, those elements with smaller thresholds fail. The consequence is that the individual load of each of the malfunctioning (or even broken) nodes is then distributed among their non-damaged nearest neighbors. Thus the breakdown of a node may lead to other failures which, in turn, may trigger and catastrophically propagate other faults. The analogy with a complex network is as follows [144]: any fiber may be viewed as a node, while the directions of the load-transfers are equivalent to the links connecting the nodes, and the load represents the intensity of the physical magnitude flowing into nodes. Failures are quantified by the relative size of the largest connected component formulated in Equation (6). The model in [144] also predicts that a scale-free network has an abrupt transition in its connectivity: as the load is increased, the cascading failure begins to reach more and more nodes up to a “critical point”, beyond which the network collapses in many small parts.
In [145] the capacity of a node i, , is assumed to be proportional (via a tolerance parameter) to its initial load, . The efficiency has been selected as the appropriate CN metric to quantify the grid performance. The proposed model is based on the dynamical redistribution of the flow triggered by the sudden initial overload or failure of a node. If the affected node is among those with the highest load, the model predicts that its failure is sufficient to affect the efficiency of the power grid up to its complete collapse. This is particularly important in real-world networks such as electrical power grids, and in networks with a highly heterogeneous node degree, such as Barabasi-Albert (BA) scale-free networks [69,121]. The results suggest that (1) the failure of a small number of selected nodes (those with many connections, or hubs) suffices to collapse the entire network; and (2) failures in most of the nodes (which have a small number of connections) do not produce any major fault at the global level on the network.
3. Review of Robustness in Power Grids as Complex Networks
As mentioned before, and following the categorization carried out in recent works [12,14], we have structured our review into two groups of approaches. The first one corresponds to those that only consider the structural vulnerability of the power grid, and will be first reviewed in Subsection 3.1. The second group of works, as will be shown in Subsection 3.2, postulate that these approaches can be enhanced by including models and metrics from electrical engineering. Despite this enhancement, there is a controversy [11] in the research community between both complex networks and electrical engineering centered on whether CN approaches are able to capture and fully explain all robustness issues ocurring in power grids. The recent work by Rosas-Casals [11] relates very illustratively and clearly the relationship between electricity networks and complex networks. This will be discussed in our critical analysis in Section 4.
3.1. Topological Approaches
The works within this subsection are said to belong to the pure topological approach because they focus on structural vulnerabilities based only on the mathematical graph of the power network: a set of nodes or vertices connected by a set of links or edges. These works resort to CN metrics (Subsection 2.2) such as efficiency, degree and betweenness, hence they do not consider any roughly electrical concept. As mentioned in Section 1, many of these works have been motivated by the emergence of cascading failures in power transmission grids. In this regard, [17] proposes a very simple model to study the behavior of avalanches, in which nodes are characterized by a value of a “load”, and they can operate up to a maximum value of such load. The model, which does not consider electrical properties, assumes that the load is distributed so that neighboring nodes with the larger degree can operate with the larger loads. Despite its apparent simplicity, the model leads to results in line with the analysis of the disturbances in the US power grid [146], one of the most studied systems in the related literature.
Just in this respect, within the body of work studying US power grids the US blackout in August 2003 is one of the major events that has been studied by conceiving the power grid as a complex network [147]. This topological study, centered only and exclusively on the grid structure ( substations and transmission lines), is based on evaluating its ability to transfer electric power between generators and consumers when certain nodes are removed from the grid. The load of a node is related to the number of links it has, that is, on the node degree. The concept of “connectivity loss” to quantify the average decrease in the number of generators connected to a distributing substation has been used. The investigation concludes that the power grid is robust enough to most perturbations (random failures) that impact on those more abundant nodes (which are those with small number of links), while disturbances (for instance, targeted attacks) affecting key substations (“hubs” with many connections) may impact critically the network operation, an even collapse it. The work concludes that this vulnerability is inherent to the topological structure of the power grid. Specifically, the results indicate that the topological structure is extremely vulnerable to the removal of the nodes with highest load (hubs): if only 4% of the nodes with the highest load are broken (or removed from the structure) all together, the performance of the grid suffers a drop of 60%.
The analysis of topological aspects of the Italian power grid using the complex network approach and neglecting electricity transmission details has been tackled in [148]. The authors demonstrate that, regardless power concepts, the grid structure by itself contains enough information on its vulnerability to cascading failures. In this work the power grid is represented as a graph with stations—generators and distribution substations—as nodes, and transmission lines as links. A particular aspect of this contribution is the use of weighted links: every link between nodes i and j is additionally modeled with a real number which quantifies how efficient the transmission between nodes i and j is. As such represents that the link between node i and node j is working faultlessly, while means that issues hold along the line that disable the transmission of power from node i to node j. The results evince that the analyzed grid exhibits a high heterogeneity in the node load distribution (see Figure 1c): while most of the nodes receive small loads, a small number of nodes (hubs) must convey extremely high loads. It is just the failure of one of this hubs what triggers large-scale blackouts. This is a common finding with the aforementioned study [147], which focuses on the US grid.
In a similar approach, [149] has focused on studying the cascading failure problem in power grids (and in artificially created BA scale-free networks) by including, in the CN framework, a model in which the capacity of a link is a function of its load. The motivation of this model is that, in a power grid with a highly heterogeneous load distribution, those nodes with the strongest loads should be more protected by assigning them large capacities. This approach is different from others in which the capacity of i-th link () is assumed to be proportional to its load () by means of a constant value λ: . In [149], the novelty is that λ is not a constant but an increasing function of the link load, , depending on two parameters α and β. α is the step height of the Heaviside step function, which has been used for simplicity. β is the the step position. When tested on real power grids and artificial BA network, the results reveal that it is possible to make the network more robust along with a reduction of the cost by assign large capacities to those nodes with strongest loads.
The tolerance analysis of scale-free networks against targeted attacks that trigger cascades of failures [150] has been motivated by the question of how to design scale-free networks of finite capacity so that they are resistant to cascading failures. To achieve this the load (or betweenness) in a node is considered as the total number of shortest paths through such a node. The capacity of a node is assumed to be the maximum load the node can carry, and proportional to its initial load, as in [141,142,143]. A failure of a node (that is, the removal of this node from the graph) may affect the loads on the other neighboring nodes. If the load arriving to a neighbor node increases beyond its limiting capacity, the node will collapse. Therefore any failure leads to a redistribution of loads over the network, and consequently succeeding failures can emerge. Failures may stop without affecting the network connectivity at a great extent, or may propagate widely and collapse a considerable fraction or even the whole network. In this work, cascading failures are quantified by the relative size of the largest connected component G defined by Equation (6). The integrity of the network is maintained if , while the global collapse emerges if [150]. By analyzing the dynamics of load redistribution obtained by removing selectively a small subset of low-degree nodes, the authors have found the minimum value of the capacity parameter to prevent a scale-free network from cascading failures.
The dependability of North American eastern and western power transmission grids has been investigated using a scale-free Barabási-Albert model of the network topology [151]. Prior to the analysis, the authors confirm experimentally that the topologies of the Eastern Interconnect and Western System power transmission grids have scale-free nature. Based on this fact, and using only the most general topological data about the transmission grids, the authors successfully prove the accuracy of the proposed Barabási-Albert network model. Additionally, the loss-of-load probability reliability index has been applied to the Barabási-Albert network model using a simple failure propagation model. The results are similar to those computed using standard power engineering methods, and confirm the validity of the scale-free network model.
The topological vulnerability of three European electric power grids (i.e., Spanish 400 kV grid, French 400 kV grid, and Italian 380 kV grid) has been analyzed [152] by evaluating the impact on vulnerability when nodes and/or edges are removed. An interesting point of this work is that it proposes a method that intelligently add edges so as to reduce vulnerability. This study also differs from others adopting the same approach in that the particularly stretched tight geography of Italy makes its power grid very different from those of Spain and France. Specifically, it is shown to be so vulnerable that the joint removal of only three links is sufficient to collapse dramatically the grid and to cause a drop in the efficiency of about 30%. The counterpart however is that it is also the only power grid whose robustness can be increased the most with the simple addition of a single edge [152].
The North America power grid is again being studied in [153] by using its real topology and feasible assumptions about the load and overload of transmission substations. The substations can be classified into three different groups: the set of generation substations , whose elements produce electric power to distribute, the set of transmission substations set , whose elements transfer power along high voltage lines, and the distribution substations, whose elements distribute power to small, local grids. The efficiency from Equation (7) is the metric used as a measure of performance, being defined in this particular case as
where is the efficiency of the most efficient path between the generator i and the distribution substation j, calculated as the harmonic composition of the efficiencies of the component edges. The damage D that a failure causes is defined in [153] as the normalized efficiency loss,
where is the efficiency of the network before the emergence of any breakdown and is the final efficiency that is reached by the network after the end of the transient caused by the failure, that is, when the grid efficiency reaches a new stable state. The results point out that the loss of a single substation can lead to a 25% efficiency reduction because it triggers an overload cascade. While the loss of a single node can yield significant damage, the subsequent removals have only incremental effects.
The topological properties of two very different power grids have been also studied in the light of the CN theory [111]. The first power grid investigated in [111] is the Nordic power grid, which includes the national transmission grids of Sweden, Finland, Norway and the main part of Denmark (Sjaelland). Its order and size are and , respectively. The second grid explored is the US Western States Electricity Transmission (WECC) grid, which extends from Alberta (in the north) to Mexico (in the south), and from California (in the west) to Montana (in the Midwest). The corresponding order and size of its graph is and . The Nordic grid is more scattered than the grid of the US western states. Both transmission grids have a clustering coefficient significantly larger than the random graphs, while the average path length ℓ is more than twice as large as the equivalent random graph. These power grids exhibit “small-world nature”, as explained in Section 2.1. Their structural vulnerability have been studied in [111] by means of numerical simulations of the error and attack tolerance, leading to the conclusion that both power grid have comparable disintegration patterns. In particular both studied grids collapse appreciably faster when the nodes are removed deliberately (targeted attack) than randomly (failures). The conclusion is that the analyzed power grids are more sensitive to attacks than random networks.
Power grid outages and vulnerability have been tackled by using topological CN estimators such us the average path length ℓ and clustering coefficient [154]. Based on the notion that the U.S. Western Systems Coordinating Council (WSCC) grid is a small world network, with its sub-network of 300kV as a pseudo-small world, this research is based on the idea of obtaining two different graphs, and comparing the way a cascade outage progresses. The first one is the graph that represents the structure of WSCC grid when the lines that triggered the 1996 blackout are removed. That is, it represents the graph in the early time instants that caused the blackout. We label this graph “”. The second graph investigated (“”) is based on the undamaged WSCC power grid, but with the same number of removed lines than in , but selected at random. A key finding of this work is that , i.e., the mean path length of the graph , which represents the initial moments of the event that provoked the blackout, is higher that that of graph (the initial graph in which the same number of nodes that in have been removed at random). This means that the disrupting event triggering the 1996 blackout could progress because, apparently, it degraded the small world structure of the initial undamaged network by reducing ℓ, that is, by removing lines that acted as shortcuts (remember Figure 2). The problem was not the number of links damaged but also their quality in the context of small-world: removing the same number of nodes at random (leading to ) does not affect as much as in since remains small, (see Subsection 2.1).
The efficiency and other topological properties of high-voltage electrical power transmission grids in three UE countries (the Italian 380 kV, the French 400 kV and the Spanish 400 kV networks) have been analyzed in [155]. The vulnerability analysis has been carried out by measuring the efficiency degradation generated by the removal of links. This analysis has unveiled a number of topological properties which are common to these networks, independently of their structure and which are typical of “small world” networks. In fact, albeit very different the three power grid explored exhibit a very large clustering coefficient and relative small path length, larger than those of random networks. Other authors who have analyzed the US electrical transmission lines [147] have reported similar results.
Similarly, [20] analyzes the topological structure and static tolerance to random failures (errors) and attacks of thirty-three different European power grids using data from the Union for the Coordination of Transport of Electricity (UCTE). The study has been carried out over transmission grids (voltage levels ranging from 110 kV to 400 kV, ignoring distribution grids), and focuses on analyzing the tolerance to random failures and selective attacks of the most connected nodes (highest node degree). The results reveal that the grid has been found to be robust enough against random loss of nodes but fragile when the most connected nodes are targeted attack. That is, although the explored grids seem to have exponential degree distributions, and most of them lack small-world property, this grids show however a behavior similar to scale-free networks when nodes are removed. The authors thus conclude that this behavior is not unique to scale-free networks. The authors also concluded that the node vulnerability can be logarithmically related to the size of the power grid, and suggest that a feasible method to prevent disturbances propagation would be to design the network to allow for intentional separation into stable small islands. This important topic of power grid size have been recently investigated in [28], and suggest that there may be an optimal size for the power grid based on a balance between efficiency and risk of large failure.
The robustness of the European power grid under intentional attacks has been studied in [19] based on CN arguments along with a mean field theory approach. The purpose is to analytically predict the fragility of the networks against selective removal of nodes. The European power grid seems to have two different classes of grids: robust and fragile. Although networks in the robust group represent only 33% of the UCTE nodes under study and they manage a similar amount of power than that of the networks in the fragile class, they suffer much less percentage of the whole UCTE average interruption time, power loss and undelivered energy. How this can be related with the internal topological structure of the networks and the “subgraphs” abundances is a key issue the study does not reveal. What it does reveal is that fragility (measured by the undelivered energy and the total power loss) increases with γ, the parameter that characterizes the degree probability distribution [19]. From a structural point of view, increasing γ implies, rather counter-intuitively, a deviation towards more connected and not randomly topologies [156]. The authors conjecture that it seems as if the same criteria that favors connectivity (as a measure originally intended to avoid interruptions in power service) would simultaneously complicate the “islanding” of disturbances (preventing its spread).
In this respect, [107] seems to have found an explanation for this apparent contradiction. The novelty of [107], when compared to other works belonging to the pure topological approach, consists of studying how the interconnectivity (interdependence) between networks affects the sizes of their cascades. Explicitly, this work focuses on networks abstracted from two interdependent power grids in the southeastern of the United States. The first power grid has 439 nodes and 527 internal links, while the second grid has 504 nodes and 734 internal links. These two networks are interconnected by 8 external links. Thus, the complete grid, view as the interconnection of both power grids (“1” and “2”), has 943 nodes and 1261 links. The model in [107] is based on applying the classic “sandpile model” of Bak-Tang-Wiesenfeld [157,158] to the corresponding network graph composed of nodes and links, each node having a capacity for keeping sand grains (viewed as load for power grids). The model is as follows: sand grains are dropped randomly on nodes, and whenever a node receives more grains than its capacity, it tumbles down and sheds all its grains onto its neighbors which, in turn, may end up having too many grains and thus collapsing. Consequently dropping a single grain can cause an avalanche (cascade). These cascades, like blackouts in power grids, are characterized by a power law distribution: they are often tiny but very occasionally huge. Applying this model to the two aforementioned interdependent power grids in the southeastern of the United States (and on an idealization of them, which is easier to work with) the authors lead to the key result that interdependence can have a stable minimum with critical amount of interconnectivity . On the one hand, some interconnectivity () is beneficial for an individual network since the other network acts as a reservoir for extra load. In fact, the probability of a large cascade in a network can be reduced at great extent by increasing slightly the interconnectivity p (as long as ). Thus a way to mitigate cascades hinges on operating close to this critical optimum point by adding (or removing) interconnections. On the other hand, too much interdependence, may become however harmful [107]: too many interconnections open paths for the neighboring network to inject extra load. Therefore, networks that interconnect to one another to mitigate their own cascades may accidentally cause larger global cascades in the whole network. This is the reason why authors warn against the construction of a great number on interconnections among different power grids to balance production (renewable sources of energy, for instance wave energy converters and wind-turbines placed offshore) and consumption (high populated areas far from these regions). The idea is adding a controlled number of interconnections to keep the global network of networks close to the critical amount of interconnectivity .
Again focusing on European grids, [156] uses topological CN measures to evaluate the robustness of the European electricity transmission grid, which is a large networked infrastructure formed by almost 2800 substations and more than 200000 km of transmission lines. This work aims at finding evidences to relate unexpected blackouts and cascading failures—in the form of reliability indexes: energy not supplied, total power loss, restoration time, and equivalent interruption time—with the topological structure of the grid. A key finding is that the grid fragility increases as the topology deviates from that of a random network. The authors found that national grids might have very different local structure. Specifically, this local structure can be characterized by the existence of some patterns named “network motifs” or subgraphs. These are shown to arise at a much higher frequency than expected in random networks. As a consequence, grid fragility increases as motifs (e.g., stars and triangles) begin to appear [156].
A key issue discussed in [159] is based on the fact that many studies usually compute the load on a node (or an link) by using its degree or betweenness, and the redistribution of such a load is usually forwarded following the shortest path (for instance, the works [141,142,143], revised above). [159] argues that this principle based on betweenness is only reasonable for small- or medium-sized networks because of the requirements of structural information of the complete networks. The authors in [159] combine the CN approach with a more realistic distribution of load among the neighboring nodes. In this work the distribution of load among neighboring nodes is carried out so that the one with the higher load will receive the higher shared load from the broken node. The model incorporates an adjustable parameter α that governs the strength of the initial load of a node, which permits investigating the response of the US power grid under attacks causing cascading propagation.
A local preferential redistribution rule of the load [159,160,161] that breaks a particular node has recently been added to the CN approach [162], in an attempt at analyzing cascading failures in power grids. In this rule, the load on the affected node is redistributed to its neighboring nodes according to the preferential probability (the one with a higher degree receives more load). Specifically, the weight of a node is correlated with its link degree k as . As argued in [162], this is different from other models because the load on a node is usually estimated by using its degree or betweenness (as in the above revised [141,142,143]) so that the load redistribution is forwarded following the shortest path routing strategy, which may be not practical for large power networks. The proposed rule has been tested on different standard IEEE test power networks (IEEE 300, 162, 145, 118, 57, 30 bus test systems) as small power systems, and in the European power grid as a large real power system. The metric used to quantify the robustness of the whole network is the “normalized avalanche size” given by
where is the avalanche size after removing node i. The experimental work reveals that the larger β is, the more robust the power network results to be.
The work [163] is especially useful since it provides a very clear analysis of the most important features that power grids exhibit based on CN concepts. The work was motivated by the question about what patterns would arise in the European power grid when analyzing data corresponding to a six years interval (2002 to 2008). Data refer to three malfunction indicators: energy not supplied, total loss of power, and restoration time. It has been shown that fragility (measured by energy not delivered and total loss of power for a particular grid) increases with γ, the parameter that characterizes the degree probability distribution. Based on the previous result [19] that found that the European power grids is composed of both fragile and robust grids, the corresponding cumulative distribution functions for the robust grids present a higher probability of occurrence than that of the fragile ones for the same measure. Although robust grids accumulate much less events than fragile ones, the values for the robust power grids are significantly higher than those of the fragile grids. The authors hypothesize that failures affecting robust grids lead to higher risks and more important consequences than those striking fragile grids, although disruptive events in the latter are more frequent. The authors have not found either a plausible or general explanation to this phenomenon.
Switching again to US power grids, [84] analyzes the robustness of power grids under random and selective node removals. In particular the authors analytically estimate the thresholds corresponding to the removal of critical nodes that make the grid collapse: a selective node breakdown is much more effective to disintegrate the grid because even a small fraction of high-degree node removal can destroy the grid as a whole. Although the empirical thresholds under random node breakdowns match accurately the theoretical values, those thresholds corresponding to selective attacks differ slightly from those predicted in [19].
While the aforementioned references focus on high-voltage transmission power grids, the work in [117] shifts the scope onto the medium- and low-voltage grids in northern Netherlands, with the aim at understanding its potentials as a feasible infrastructure to delocalize electricity distribution. The study employs a number of statistical topological measures for the mentioned purpose. The second key difference when compared to most works (as will be summarized later on in Table 3) is that it proposes to utilize a weighted link topological model applied to the lower—medium- and low-voltage—layers of the power grid. The authors have found that the node degree distributions tend to approach a power-law, that is, there are a few nodes that have many connections, while the majority has a very limited number of links. This result is similar to those found in the papers reviewed above, yet with some details: there are high-voltage power grids whose node degree distribution match better an exponential distribution, while others with many more nodes approach a power-law distribution [151]. The work suggests that the power-law distribution of the medium- and low-voltage grids may be caused by the relatively small number of nodes (in good agreement with [151]) that receive electricity from the high-voltage grid, and have to distribute this to many more substation at lower voltages. Another finding is that the betweenness distribution follows an exponential decay unlike the usual power-law of high-voltage grids. Another remarkable aspect is the relatively higher tolerance of the medium-voltage network: since the medium-voltage network is more densely meshed, it is less prone to failures than its low-voltage counterpart [117].
Likewise [63] delves into the Florida high-voltage power grid as a network with strong geographical constrains that embeds it in space. This power grid is a relatively small network consisting of vertices ( generators and loads) with strong geometrical constrains (“spatial network”, as the Italian power grid [152]). The nodes are connected by weighted links (power transmission lines), the “electrical conductance weight” being the magnitude associated with each link. In this work, the electrical conductance between two nodes has been assumed to be proportional to the number of links and inversely proportional to the corresponding geographical distance. The conductance matrix, , is thus the weighted version of the adjacency matrix . The research shows that the Florida high-voltage power grid seems to have a complex architecture quite different from random-graph models usually considered. It seems to be optimized not only by reducing the construction cost (measured by the total length of power lines), but also through reducing the total pairwise link resistance in the grid, which increases the robustness of power transmission between generators and loads against random line failures. The modeling of power grids as spatial networks suggest that the Florida power grid has been organized such that (1) the deployment cost of transmission lines and the total resistance of lines are both minimized to some degree; and (2) there is a relatively high clustering so that the grid connectivity is robust against random failures of both stations and power lines.
Finally, and related to the power law distribution used to fit data corresponding to some huge blackouts, the analysis of the distribution of three reliability indicators (Energy Not Supplied, Total Loss of Power and Restoration Time) in electric power grids (Table 2)—using real data from the major failures occurred in the European power grid between 2002 and 2012 (and also in the US)—has been carried in [164]. The research shows that the Lomax distribution (or Pareto II distribution) [165] describes these indicators more accurately than the power law distribution (or Pareto distribution [166]). This is the key contribution of this work because most of the research papers exploring power grids from the CN viewpoint use the power law distribution to fit data corresponding to huge blackouts in the United States and in the European Union.
Table 2.
Summary of reliability indicators by ENTSOE (European Network of Transmission System Operators for Electricity).
| Acronym | Definition | Ref |
|---|---|---|
| ENS | Estimation of Energy Not Supplied to the final customers, due to incidents in the | |
| transmission network and given in MWh. | [167] | |
| TLP | Total Loss of Power, which is given in MW and is a measure of generation shortfall. | [167] |
| RT | Restoration Time, measured in minutes, corresponds to the time from the disturbance until | |
| from the disturbance until the system frequency returns to its nominal value. | [167] |
3.2. Hybrid Approaches: Combining CN and Electric Engineering Concepts
As emphasized in [8,14,78,85,168] the purely topological approach may lead to inaccurate results, since it is not able to capture some of the peculiarities of power networks described by the Kirchoff’s laws. Although it will be shown in a more detailed way, there are some basic ideas that motivate the introduction of electrical power engineering concepts. The first one, unlike in general purpose CNs, is that a power grid is a flow-based network in which the physical quantity (electric power) flowing between two modes will involve most links. From the electrical engineering viewpoint, the metric of distance in CN theory should be substituted by “electrical distance” involving line impedances [8]. The second reason is that in conventional CN analysis, all elements are usually identical, assumption that does not hold in practice over power transmission networks due to the existence of different types of nodes such as generation and load buses. Finally, in power grids transmission lines undergo flow limits, which restrict its ability to transport power. As a consequence, links should reflect this restriction. Based on this rationale [8] argues that, when applying to power networks, the graph must be weighted (impedance, maximum power) and directed (since electric power flows from generators to loads).
For the sake of clarity we have organized this Section into three Subsections: Subsection 3.2.1 introduces concepts from Electrical Engineering used in hybrid models, those that include in the CN analysis simplified electric power flow models (Subsection 3.2.2). Finally, Subsection 3.2.3 overviews novel electric metrics inspired by their topological counterparts.
3.2.1. Electrical Engineering Framework
Given a power grid with N nodes and M links—which may be referred to as “buses” and “lines” (or “branches”) in power analysis, each link between nodes i and k, , has a line impedance
where is the resistance and the reactance. The line admittance is obtained from the inverse of its impedance, i.e.,
with being the conductance and the susceptance. With these magnitudes, power flow models aim to obtain complete information on voltage angles and magnitudes at each bus i of a power system at given loads and generation [1]. A possible formulation of the alternate current (AC) flow problem reduces to the solution of a system of N equations [30]
with , and where: and represent the real power and the reactive power, respectively, at bus i; is the voltage magnitude at bus i; is the conductance of the link connecting buses ; is the susceptance of the link connecting buses ; and is the voltage angle difference for buses i, k.
Thus, for an AC model, the power balance equations can be written for each bus (nodes of the network). Real and reactive power flow on each branch (links of the network) and the generator reactive power output can be analytically computed [1]. However, due to the non-linearity of the above formulae numerical methods are required to obtain a solution. Note that this problem is very time consuming if the power grid has a large number of nodes. This is the reason why many works resort to simplified direct current (DC) power flow models, assuming that all the power is basically active power (i.e., reactive power is assumed to be negligible). The AC power flow model is more accurate than the DC approximation, but at the expense of requiring more computational load.
3.2.2. Power Flow Models on CN Graphs
An example of a hybrid approach involving a flow model is [169], which delves into the robustness of power grids by using a model that combines CN with power engineering concepts such as line impedance and DC flow models. The complex network is a synthetic Watts-Strogatz network with nodes and weighted links. The resilience analysis is carried out in terms of edge attack, line overload, cascade effects, and network disruption. By using the small-world network model this work concludes that line congestion decreases as the density of shortcuts increases. In other words, a power grid with more shortcuts in its interconnection topology—that is, with the small-world property—tends to be more robust than regular grids. This result has been recently proven by [108], as mentioned before.
A DC flow model has also been included in the CN approach to study the vulnerability of a power grid in North China [170]. The novelty of this work is that it utilizes a directional, weighted graph (the power flow direction in the power grid is considered). The graph has nodes and links. The tolerance of the power grid to random errors and targeted attacks has been analyzed by the conventional method of node and/or edge removal. The resilience analysis is based on the size of the largest power supply region under an edge attack strategy. The author suggest some possible solutions to cascading failures: (1) to remove a small part of the loads to maintain the stability of the whole network; and (2) to create a number of self-healing islands to avoid large scale blackouts.
Based also on the maximum power flow through the links, [171] includes line admittances in the pure topological model of a synthetic power grid (IEEE 39 bus system) with nodes and weighted links. It is inspired by the fact that in power grids, electric power might not necessarily flow only through the shortest path so this work proposes a centrality index based on the maximum power flow through the links. The links which carry more portion of power from the source (generator) to sink (load) are given a higher weight in this analysis. The resilience has been carried out in term of flow availability. In a similar approach, [172] makes use of power flow in the analysis of a synthetic (IEEE bus test system) high-voltage network with nodes and unweighted links. The resilience is assessed in terms of the influence in network connectivity and power degradation.
Besides, [173] includes line impedances and DC flow model in a CN power grid in North America with nodes and weighted links. The DC power flow model is used to simulate the power grid dynamics and the network vulnerability under the failure of a few nodes (not larger than 10 nodes). Connectivity loss and blackout size have been selected as vulnerability metrics. DC and AC power flows are also used in [7] to analyze the complexity of a real high power grid in China (Shanghai Power Grid) with and links. After having carried out a number of critically analyses and blackout simulations, a interesting result suggests that the explored power grid seems to have the small-world property. Also located in China, [174] focuses on a real high-voltage power grid that has nodes and links, by including the reactance of the lines. The work analyses the characteristic path length, node degree, betweenness and resilience to loss of load and node attacks. Similarly, but focuses on the blackout occurred in India on 30 and 31 July 2012, [15] combines the network concepts ( nodes and links) with those from electrical engineering such as the active (P) and reactive (Q) power loads and the locally preferential load redistribution rule. The active and reactive power load capacities of a given node j have been modeled, respectively, as and , where and are their initial values, and β and γ are the tolerance parameters of the active and reactive power loads, respectively. The main conclusion is that the probability of a cascading failure is small when tolerance parameters β and γ are both larger than some thresholds and , which, however, increases the cost of the infrastructure in the power grid.
In a more generic context, the authors in [175] investigate the structural vulnerability of scale-free grids (synthetic IEEE 14, IEEE 24, IEEE 30, IEEE 57, IEEE 118, and IEEE 300 bus networks) by comparing physical power flow models and scale-free CN metrics. This work provides an useful discussion of the utilization of several metrics in scale-free graphs for vulnerability assessment, specifically:
- The “geodesic vulnerability” , which measures the functionality of the network when it suffers a node disruption with respect to its steady condition (“base case”), and is defined as [175]:where is the shortest geodesic distant between nodes i and j after node fail, and is the shortest geodesic distant between nodes i and j in the base case.
- The “impact on connectivity” of the network, S, can be computed by calculating the number of nodes that remain connected aswith being the number of connected nodes after the node failure.
- The “load shedding”, LS, which aims at estimating the total apparent power that remains connected after node fail, is defined aswhere is the active power load that remains electrically connected after disruption of node i; is the reactive power load that remains electrically connected; denotes the active power load under the base case (before disruption); and stands for the reactive power load under the base case.
Two main conclusions are drawn in [175]: (1) the proposed geodesic vulnerability index is useful to carry out comparative connectivity and functionality benchmarks among different network topologies in power grids; (2) an added value of is that it is less time consuming to assess the vulnerability of power grids.
The approach [36] deserves special attention since it makes use of the CN approach hybridized with the more elaborated electrical DC-based OPA model (from the US Oak Ridge National Laboratory, the Power System Engineering Research Center at the University of Wisconsin-Madison, and the University of Alaska), in which blackouts are modeled by overloads and outages of transmission lines in the context of DC flow dispatch. It focuses on real power grids that have a global inhomogeneous structure but contains a number of relatively homogeneous regions, which are coupled to each other like pearls on a string [36]. The described results suggest that in some cases highly inhomogeneous power grids can have a higher risk of large blackouts than both uncoupled individual grids and homogeneous grids of comparable size. The authors suggest that this result might change as the size of the individual homogeneous regions gets larger within the global inhomogeneous grid. In fact the unit size of the homogeneous parts embedded in the inhomogeneous global network seems to be critical in determining whether large blackouts will become more likely as the system evolves between more homogeneous or inhomogeneous.
The recent work [1] uses the Pahwa’s model—a novel model to study cascade failures in power grids in which the grid is modeled as a complex network (nodes represent buses and links represent electrical branches) and the power flows on lines are calculated using a DC power flow model—to study two extreme setups. The first one is a scenario characterized by a load growth, which models the ever-increasing user demand along time. The second limiting setup focuses on power fluctuations mimicking the effects of intermittent renewable energy sources. The obtained results determine that increasing the power grid size can abruptly trigger blackouts. This is the reason why the authors recommend taking into account this effect in planned grid layouts so as to integrate national power grids into “super-grids” [176].
Recent research in [30] utilizes electric concepts (a detailed AC electric power model) along with CN metrics (i.e., degree centrality, eccentricity, betweenness centrality and centroid centrality). It aims at quantifying the importance of premeditated physical attacks that generate breakdowns in the electric power grid. The power model developed is used to describe the operating state of the electric power network under the assumption that the system operates under balanced conditions. Specifically, in a power grid having N nodes (buses) the AC load flow problem reduces to solving a set of N equations, as those stated by Equations (18) and (19). This power model along with the aforementioned metrics has been applied to the graph representing the Swiss power grid transmission system. The target is to detect and rank the most critical elements of a power grid under a variety of premeditated attack scenarios, both deterministic (targeted) and stochastic attacks. The effect of each attack scenario has been quantified in terms of the blackout size (electric-power-not-served). The first conclusion is that the effect of targeted attacks on a node (substation) is much more harmful than the one appearing after a random removal of a node (substation) or on a link (transmission lines). The highest threat arising from a targeted attack seems to be the appearance of frequency instability.
To complete this set of works that combine the CN approach with power-flow modes, we would like to refer the reader to the very recent contribution in [21]. The power flow model applied on the corresponding graph is based on a Kuramoto model [177] and a linearized DC power flow model [178]. One of the novel aspects of this work is that network resilience is characterized in terms of the “backup capacity”. This metric is defined as the additional link capacity (overcapacity) that needs to be supplied to secure the proper network operation when the most-loaded link suffers from a failure or attack. Four different networks are modeled and set under test: the British transmission power grid ( nodes—synchronous machines (both generators and motors)—and transmission lines), and three classes of random networks, namely, Erdős-Rényi random graphs, Erdős-Rényi random graphs with a fixed number of links, and spatial networks in which the nodes are embedded in a two-dimensional plane. In the experimental work, the probability density functions of the backup capacity have been computed for the mentioned networks. In particular, special emphasis has been put on investigating the probability density functions down to their tails, in the effort of gaining a physical insight into resilient networks. This has been done using large-deviation techniques, which help study the extremely low probabilities () in the tails of . The proposed method makes use of an additional Boltzmann factor in a Markov-chain Monte Carlo (MC) simulation, which generates the network instances. The parameter T models an artificial temperature, which allows sampling different regions of . This work reveals two important conclusions: the first is that very resilient networks are basically characterized by a small diameter. This is of practical importance because it means that generators should be placed near power consumers, strategy that can be currently implemented by fostering distributed generation via renewable energies [179]. This strategy would also reduce the costs for creating or upgrading power transmission grids. The second important conclusion of [21] is that networks can be made more resilient by adding more links, which has been also pointed out in [108]. As suggested in [108,152,169], adding sufficient number of links between far nodes makes the grid more robust. This is also in line with the virtues of small-word networks [86,123,140,174,180]. Since the power grid operates as a network of networks circumscribed by the country geography (embedded network), in order to reduce the risk of cascade failures [108] suggests the deployment of a small number of longer transmission lines that form shortcuts to different parts of the grid.
Finally, very recent works [22,23,24,25] propose novel remove/attack strategies that can concurrently occur on substations and transmission lines either simultaneously [22,25] or sequentially [24]. These joint substation-line attack strategies have been tested using node degree and node load (the sum of the absolute values of power injected into it by all generation-demand-node pairs) on the IEEE 39 bus system. These strategies have been found to be useful in finding more power grid vulnerabilities when compared to conventional approaches where attacks affect either nodes (substations) or links (transmission lines) separately. The new model in [23] introduces a metric called “risk graph”, which aims at describing the hidden relationship among potential target nodes (prone to cascading failures), so that if several nodes are closely linked together, the simultaneous failure of these nodes is more likely to cause large cascading failures. This has been tested on IEEE 57 and 118 bus systems and the Polish transmission network. The obtained results in this work unveil the potentiality of the proposed risk graph to efficiently characterize the real vulnerability of the power grid.
3.2.3. Novel Electrical Metrics Inspired by Topological Metrics
Many of the contributions that have applied power flow models on graph networks have also elaborated novel “electrical metrics” that, although inspired by topological metrics, are found to be more effective to identify critical components in power grids [8], a task deemed crucial when exploring its robustness. We begin with the so-called “electrical centrality” of a given node a, which is defined as [173,181]
where is a measure of the connectivity distance for each node a and
with denoting the matrix elements of the absolute value of the inverse of the grid admittance matrix, i.e.,
where is called “electrical distance” [182,183]. This electrical centrality has been computed over a synthetic high-voltage transmission network (the IEEE 300-bus grid) with nodes and links. The resilience analysis has been based on the sensitivity of the relationship between voltages and currents, defined by the impedance matrix . The main finding is that the power grid seems to exhibit a scale-free structure, having a number of highly-connected “hub” buses.
A novel betweenness index that employs the reactance of the transmission lines as weights of the network edges has been explored in [184]. Specifically, the weights of the links that model the electricity transmission lines have been defined as the reactance of the electric path from one node to another. The aim is to introduce in the graph the physical concept in which more power is transmitted through those lines that have less reactance. The model assigns a higher weight to those edges with less reactance. Experiments have been carried out over the IEEE-39 and the IEEE-118 bus system. The betweenness index has been discovered to identify critical lines through the network, either because of their location in the grid or by the amount of power they convey.
The modification of topological metrics to obtain more new metrics that describe better the operation of power grids has ignited a series of recent contributions [34,115,118,119,185,186], which have explored the performance of novel electrical metrics to quantify the extent to which a node i of a power grid is declared critical. The two metrics that have been found to work best are the “electrical degree centrality” and the “electrical betweenness centrality”; the “electrical degree centrality” of a node i hinges on the degree centrality given by Equation (10), and is given by
where represents that node i is linked to node j, and is the electric power that flows in the line linking nodes i and j. Similarly, the “electrical betweenness centrality” stems from its topological counterpart formulated in Equation (9), i.e.,
where the ratio is a measure of the level at which the line linking s to t needs i to transmit power between them along the shortest electrical path. The feasibility of and has been tested in different power grids: IEEE 30, 57, and 118 bus systems [34,115], IEEE 30 bus system [119], and IEEE 300 bus [186]. All the results reported in these references pinpoint that is the most useful to quantify the extent to which a node i of a power grid is critical.
Following [87], assuming that for high-voltage transmission networks , and that a unit current flows along the link from node s to t, then the caused voltage difference between the ends of the link equals (or equivalently ). Therefore is interpreted as the electrical distance between node s and t and as the “coupling strength” between the two end nodes. These considerations lead to the electrical degree centrality defined as [87]
The work in [87] has investigated a number of centrality measures when applied to power grids, and generalized their analysis based on centrality in graph theory to that of power grids (including its electrical parameters). The analysis has been performed over the NYISO-2935 system (New York Independent System Operator’s transmission network), containing 2935 nodes and 6567 links, and on the IEEE-300 system. It has been found out that when the electrical parameters are included in the definitions of the centrality metrics, the distribution of the degree centrality and other measures of centrality become considerably different from those based solely on the topological structure, resulting in a easier identification of important nodes that otherwise could not be identified.
More recently, the works in [5,187] have proposed a novel metric, coined as “effective graph resistance” or , as an alternative vulnerability measure to determine the critical transmission lines in a power grid. This parameter is given by
where in a DC model, is the effective resistance between buses i and j, and is equal to the equivalent impedance between these buses. The proposed approach has been tested over the IEEE 118 power system, and the results have been compared to the traditional average shortest path length topological metric, proving the feasibility of to efficiently evaluate the vulnerability of power grids.
Finally we would like to stand out three important electric-based metrics that have been proposed in [8,35,78,85,188], which have laid the foundations for the so-called “extended topological approach”. Among other contributions, the model improves the topological CN-based approach with novel metrics referred to as “net-ability”, “electrical betweenness” and “entropy degree”, whose definitions we postpone to the following paragraph since they require certain prior comments. According to [8] the motivation of these contributions is that the pure topological concepts and metrics of the general CN approach ignore the electrical properties and the working restrictions of power grids, hence their straightforward application without any further consideration may fail to capture specific electrical aspects under certain network topologies and operational circumstances. For instance, in a general-purpose complex network, each node (either source or sink) has the same function when the physical magnitude at hand (e.g., packets, power or whatsoever) is transmitted over the network. However, in power grids buses are completely different depending on whether they are generation, load, or transmission buses. In these references denotes the set of generation buses (), is the set of load buses (), and represents the set of transmission buses (). Note that and , the total number of nodes in the network. With these definitions in mind, the following metrics are defined:
- The “electrical extended betweenness”,with denoting the “power transmission capacity” from bus g to d given byand
- −
- is the power flow limit of line l (), which is a physical constrain of line l, unrelated to operational conditions; and
- −
- is the change of the power on line l for injection at generation bus g and withdrawal at load bus d.
- The “net-ability”, proposed to evaluate the global performance of a grid by including electrical magnitudes such as capacity or impedance, is defined as [188]where is the electrical distance (impedance) between generation bus g and withdrawal at load bus d.The vulnerability of line l interpreted as the net-ability drop caused by an outage (cut) of the line l, is thus
- The “entropic degree” of a node i, denoted as , aims at including three elements in the definition of node degree when computed over a weighted network [35]: (1) the strength of the connection between node i and j in terms of link weight ; (2) the number of links connected with the node; and (3) the distribution of weights among the links. The entropic degree of a node i is defined as [35]where is the normalized weight of the link between nodes i and j for each link connecting nodes i and j.
Based on this framework, [188] has elaborated on the vulnerability of a synthetic IEEE network with and weighted links. Three different methods to assess the impact of line outages have been explored: (1) the method based on efficiency; (2) the new method based on net-ability; and (3) the computation of line overloads by DC power flow. The first vulnerability measure—using the definition of the network efficiency E [140] given by (7)—is based on the efficiency decrease when line l is removed (Equation (8)). The second method is based on the vulnerability of line l interpreted as the net-ability drop caused by an outage (cut) of the line (Equation (33)). Since the third approach based on the computation of line overloads by DC power flow is the one that most realistically captures the details of the power grid under analysis, it has been considered by the authors as the baseline method. Results reveal that the net-ability metric is able to successfully identify the most critical lines.
Also within the extended topological approach, [35] has explored the feasibility of net-ability and entropic degree metrics to quantify to what extent a power grid is robust, and compared them to their counterpart structural metrics (node degree or network efficiency). The net-ability and entropic degree metrics have been applied to real power grids, and have been found to provide a good characterization of the power grid. The network explored has a graph with nodes and weighted links, and corresponds to a real high-voltage power grid in Italy. As mentioned, resilience has been studied in terms of the global efficiency, net-ability, and overload. Similarly the work described in [85] considers a synthetic high-voltage power grid modeled as a CN (, links) enhanced with a model of power injection/withdrawal at buses, and the electrical betweenness defined in Equation (30). The resilience analysis has been carried out in terms of unserved energy/load based on a node and/or edge attack scheme. These extended electrical-based metrics have been proven to be more effective than their corresponding topological counterparts when identifying critical components in a power grid. Therefore the overview in [8] concludes that net-ability should be used instead of efficiency, entropy degree instead of node degree, and electrical betweenness instead of topological betweenness.
4. Discussion
The critical discussion of this survey starts with Table 3, where a cross-comparison of the results and suggested strategies to make power grids more robust is summarized. In particular the table performs a comparative study of selected works according to the adopted metrics which, for the sake of clarity, have been listed in Table 2 and Table 4 along with their corresponding equations. Those references belonging to the CN approach have been specifically defined in Subsection 2.2. Table 4 permits easily finding the symbols, equations and references corresponding to any given metric. The reasons why works in Table 3 have been selected for the discussion are:
- They are either the most cited (best known and most representative) or the most recent studies applying concepts from CN to power grids.
- They investigate large, real power grids in US, European Union, China and India, these latter being selected because they correspond to nations with emerging economies, dense populations, and significant electricity needs.
- Some of the works in Table 3 analyze synthetic topologies as key study cases, such as IEEE bus networks, or WS networks, BA and ER networks, these latter being appropriate structures either to study asymptotic behaviors or to simplify the studies.
Table 3 does not list papers which, although having been revised for the sake a global understanding of the main topics of the paper—cascading failure models, AC-based power flow models [189], hidden failure models [190] and stochastic models [191]—do not tackle directly the issue of power grid robustness. The acronyms and symbols on the first row of this table are as follows: N (order, second column) and M (size, third column) are approximations, typically in the order of tens, with the aim of giving a rough idea of order and the size of the network without getting lost in unnecessary details. ND and stand for node degree analysis and betweenness statistic analysis, respectively. “AT” stands for attack strategy. “w/u?” denote whether weighted or unweighted links have been used in the graph that models the network. Finally, the last column represents the metrics that the surveyed works have used to study the vulnerability of the grid.
Based on the columns in Table 3 we discuss the results by going through the following aspects:
- Removing/attacking strategies to perform vulnerability analysis (Subsection 4.1).
- Unweighted versus weighted graph analysis (Subsection 4.2).
- Analysis of vulnerability metrics (Subsection 4.3).
- Ability of CN to explain power grids (Subsection 4.4).
- Analysis of power grid structures (Subsection 4.5
- Strategies to improve robustness (Subsection 4.6).
The last two subsections aim at answering questions related to each other, such as: What types of grid structures are more robust? What can be done to improve the robustness of existing networks? What are the implications of this conclusion in terms of future grid design?
4.1. Removing/Attacking Strategies to Perform Vulnerability Analysis
The analysis of vulnerability in power grids is typically based on removing either nodes (node attack strategy) or links (link attack strategy). Recently attack strategies that can occur concurrently on nodes and links either simultaneously [22,25] or sequentially [24] have been found to be useful in discovering more power grid vulnerabilities when compared to the aforementioned conventional approaches.
Regarding the conventional strategies (based on removing either nodes or links, but not both), there seems to be no prevailing scheme in any of the two approaches: node attack has been used in [19,20,84,107,111,147,148,153,159,173,174], which contain indistinctly both topological—and hybrid-based approaches. Link attack has been adopted in [35,152,155,169,172,184,188,192,193], which also include both topological—and hybrid-based approaches. There are a few works that have carried out both analyses [7,85,112,117,151,170].
| Reference | Order | Size | ND | Attack | w/u? | Electrical concepts | Metrics/indicators used in | |
|---|---|---|---|---|---|---|---|---|
| N | M | strategy | into the CN approach | vulnerability analysis | ||||
| [17] | SN | SN | ⋄ | ⋄ | NA | u | – | ℓ, G |
| [141] | 4941 | – | ⋄ | ⋄ | NA | u | – | ℓ, G |
| [147] | 14100 | 19660 | ⋄ | ⋄ | NA | u | – | ℓ, Connectivity loss |
| [145] | 14100 | 19660 | ⋄ | ⋄ | NA | u | – | ℓ, E |
| [150] | 3000 | 12000 | ⋄ | ⋄ | NA | u | – | ℓ, G |
| [20] | 3000 | 3800 | ⋄ | NA | u | – | ℓ, G | |
| [19] | 3000 | 3800 | ⋄ | NA | u | – | ℓ, G, ENS, TLP | |
| [111] | 4800 | 5500 | ⋄ | NA | u | – | ℓ, , G | |
| [152] | 380 | 570 | NA, LA | u | – | D | ||
| [154] | 6400 | 8700 | NA | u | – | ℓ, | ||
| [155] | 370 | 570 | ⋄ | LA | u | – | ℓ, | |
| [147] | 14000 | 19600 | ⋄ | ⋄ | NA | u | – | Connectivity loss |
| [151] | 31400 | – | ⋄ | NA, EA | u | – | Probability of load loss | |
| [156] | 2700 | 3300 | ⋄ | NA | u | – | Motifs (sub-graph) size | |
| ENS, TPL, RT | ||||||||
| [84] | 8500 | 13900 | ⋄ | NA | u | – | G | |
| [159] | 4900 | 6600 | NA | u | – | |||
| [107] | 940 | 1260 | NA | u | – | Blackout size | ||
| [149] | 4940 | 6600 | ⋄ | ⋄ | NA | u | – | G |
| [117] | 4850 | 5300 | ⋄ | ⋄ | NA | both | – | ℓ, G |
| [148] | 340 | 520 | ⋄ | ⋄ | NA | w | – | E |
| [153] | 14000 | 19600 | NA | w | – | E, D | ||
| [35] | 550 | 700 | NA | w | Impedance, DC flow | E, , overload | ||
| [85] | 32 | 420 | NA, LA | w | Impedance, DC flow | , ENS | ||
| [188] | 90 | 120 | LA | w | Impedance, DC flow | E, | ||
| [169] | 200 | 400 | ⋄ | LA | w | Line impedance, DC flow | Overload, cascade | |
| [87] | 2930 | 6570 | ⋄ | NA | w | Line impedance, DC power flow | ||
| [173] | 29500 | 50000 | NA | w | Line impedance and DC flow | ℓ, connectivity level | ||
| [172] | 550 | 800 | ⋄ | NA | w | DC flow | Connectivity, TLP | |
| [7] | 210 | 320 | ⋄ | NA | both | DC and AC power flow | Blackout size, , ℓ | |
| [174] | 900 | 1150 | ⋄ | ⋄ | NA | w | Line reactance | Loss of load, ℓ |
| [15] | 570 | 870 | ⋄ | ⋄ | NA | w | Active, reactive power loads | Loss of load |
| [175] | SN | SN | ⋄ | ⋄ | NA | w | AC model | , S, LD |
| [170] | 2560 | 2890 | NA, LA | w | Impedance | Largest power supply region | ||
| [181] | 300 | 410 | ⋄ | NA | both | Line impedance | Impedance matrix sensitivity | |
| [184] | 150 | 46 | NA | w | Line reactance, active power | E | ||
| [171] | 39 | 46 | NA | w | Line admittance, power flow | Flow availability | ||
| [30] | 240 | 310 | NA, LA | w | AC power flow model | , , ENS | ||
| [36] | SN | SN | LA | w | DC-based OPA model | LS | ||
| [21] | 120 | 165 | NA | w | DC power-flow | |||
| [34] | SN | SN | NA | w | DC Power flow | , | ||
| [115] | 30 | 41 | NA | w | DC Power flow | S, connectivity loss | ||
| [118] | – | – | NA | w | DC Power flow | S, conectivity Loss, |
Table 4.
Summary of metrics and their corresponding equations, references and approaches in relation to Table 3.
| Metric | Equation or definition | Reference |
|---|---|---|
| Average path length, ℓ | (4) | [61] |
| Clustering coefficient, | (5) | [57] |
| Size of the largest connected component, G | (6) | [61] |
| Efficiency, E (definition 1) | (7) | [140] |
| Network Efficiency, E (definition 2) | (13) | [153] |
| Betweenness centrality, | (9) | [61] |
| Degree centrality, | (10) | [30] |
| Damage, D | (14) | [153] |
| Normalized avalanche size, | (15) | [162] |
| Geodesic vulnerability, | (20) | [175] |
| Impact on connectivity, S | (21) | [175] |
| Connectivity loss | Average decrease in the number of generators | [153] |
| connected to a distributing substation | ||
| Connectivity level | Average fraction of generators | [153] |
| connected by each load substation | ||
| Backup capacity, | Additional link capacity (overcapacity) | [21] |
| that needs to be supplied to secure the proper | ||
| network operation when the most loaded | ||
| link suffers from a failure or attack | ||
| Load shedding, LS | (22) | [175] |
| Electrical centrality, | (23) | [173,181] |
| Electrical distance, | (25) | [182,183] |
| Electrical degree centrality (def. 1), | (26) | [115,118,119,186] |
| Electrical degree centrality (def. 2), | (28) | [87] |
| Electrical betweenness centrality, | (27) | [34,115] |
| Electrical betweenness, | (30) | [8,78,85,168] |
| Net-ability, | (32) | [8,78,168] |
| Entropic degree, | (34) | [8,78,168] |
| Effective graph resistance, | (29) | [5,187] |
4.2. Unweighted versus Weighted Graph Analysis
An interesting point of discussion is whether the graph representing the particular grid under consideration uses either weight or unweighted links. In this respect, an interesting point to note in Table 3 is that, at a first glance, it has been naturally divided into three sub-tables: the first sub-table corresponds to those references in which the graph associated to the network under analysis has unweighted links. We have highlighted them in bold (u ≡ “unweighted”) to facilitate the visual inspection of the table and the subsequent discussion. The works in [19,20,107,111,117,147,151,152,154,155,156] have in common that each power network under study has been represented using the simplest graph model: undirected and unweighted. This is because these approaches do not include any characterization of the link weights, a key difference with respect to the contributions contained in the other two sub-tables where links have been weighted to enhance the representation of the power grid. In particular, in the references of the third subtable weights are related to electric concepts such as the maximum power flow that can be transmitted through the link.
Unweighted graphs are by far the most used representation in the group of references that tackle robustness in power grids from the pure topological CN viewpoint. It should be remarked that within this group [148,153] have used weighted links, but not to represent electrical principles. Another interesting finding is that most of these works using unweighted graphs analyze the node degree distribution of the network so as to determine the class of network that better fits the power grid under study, e.g., scale-free network or random network. On the contrary most of the hybrid approaches, which include power flow models and/or electric-based metrics, made use of weighted graphs. However, they do not undertake any statistical analysis of the node degree distribution even though it might exhibit differences when compared to that of the unweighted approaches, as Pagani et al. have noted in [14].
A deeper insight into the role of weighted links is taken in [8], where it is noted that in power grids transmission lines have power flow limits, which must be represented by weights standing for the flow limit on line linking nodes i and j. The authors in [8] argue that when applying CN analysis to power grids, the electrical power grid must be represented as a weighted and directed network graph , where is the set of weight elements . This is in contrast to the general approach stated in Section 2.1, where the graph is defined as and does not require weighted links.
4.3. Analysis of Vulnerability Metrics
In Table 3 one of the criteria to classify the selected references is the class of utilized metrics. Performance metrics can be grouped into two classes in a similar fashion to [12]. The first group of metrics corresponds to the topology-based performance measurements, which quantify the grid performance based only on the underlying structure of the network. Topology metrics include the average path length, node degree distribution, betweenness, size of the largest component, and network efficiency, the rest having appeared at a lesser extent. In particular, regarding the above listed metrics:
- The average path length formulated in Equation (4) has been utilized to analyze the topological aspects of the Italian power grid [148]; the topological vulnerability of three European electric power grids (Spanish 400 kV grid, French 400 kV grid, and Italian 380 kV grid) [152]; the vulnerability of the European Nordic power grid (which includes the national transmission grids of Sweden, Finland, Norway and the main part of Denmark) [111]; the western USA power grid [70,111,154]; the topological structure and static tolerance to errors and attacks of thirty-three different European power grids [20]; a synthetic Watts-Strogatz power grid [169]; the IEEE 300 power grid [155,173]; the medium and low-voltage grids in northern Netherlands [117]; the IEEE 118 bus test systems [172]; and high-voltage power grids in China [7,174].
- The node degree distribution has been used in the study of the August 2003 blackout in US [147]; the topological aspects of the Italian power grid [148]; the dependability of North American eastern and western power transmission grids [151]; the topological properties of Nordic power grid and US Western States Electricity Transmission (WECC) grid [111]; the robustness of the European electricity transmission grid [19,20,155,156]; the US power grid [84]; the medium- and low-voltage grids in northern Netherlands [117]; and real high-voltage power grids in China [170,174].
- The betweenness from Equation (9) has been utilized to analyze the August 2003 blackout in US [147]; the topological aspects of the Italian power grid [148]; the IEEE 300-bus grid [181]; the medium- and low-voltage grids in northern Netherlands [117]; and a real high-voltage power grid in China [174].
- The size of the largest component, which is the fraction of nodes in the connected sub-network that still have the largest number of nodes so that there is at list a path between any two nodes, has been used in [19,20,111,117,141,142,144,150].
- The network efficiency has been used to analyze the Italian power grid [145,148], the North American power grid [153], the European power grid [155], several synthetic IEEE power grids [184,188], a real high-voltage power grid in Italy [35], to name the most cited.
The second class of scores are based on power flow models and on novel electric metrics inspired by their topological counterparts. Although there are many models in the literature aimed at capturing power flow redistribution after node/link failure [12], we mention here those that have appeared in the review, and which correspond to the most cited contributions with the highest scientific relevance: the direct current-based OPA models [12,36,194], AC-based power flow model [189] and its DC approximation [8,35,78,85,188] . Based on these power flow redistribution models it is possible to compute the flow-based performance and vulnerability metrics. The most used electric metrics in our review have been:
- The net-ability, which has been used in [8,35,78,85,188].
- The electrical degree centrality of a node i, used in: [8,35,78,85,188].
- The electrical betweenness centrality , used in [8,35,78,85,188].
- The entropic degree of a node i, used in [8,35,78].
- The effective graph resistance , utilized in [5,187].
A key point to note in electrical-based metrics is that they capture important features of power grids (not considered by topological approaches), and are more effective in identifying critical components in a power grid [8], which is crucial when exploring its robustness. Thus, in this respect net-ability is used instead of efficiency, entropy degree is used instead of node degree, or electrical betweenness is used instead of topological betweenness. In the case of power grids, topological metrics identify a first level of vulnerability in the physical structure. Although some information is lost, this may be a benefit when questions that arise from difficult hypotheses can be answered with limited computational power and simplifying assumptions [8,11]. Electric metrics are a further refinement to detect other vulnerabilities, which are characteristic of the way electricity flows, which otherwise could not be detected. However there are topological metrics that are still used in some hybrid works such as, for instance, connectivity level, impact on connectivity, clustering coefficient, and others. All the graph theory applied to the model and statistical machinery also hold.
4.4. Ability of CN to Explain Power Grids: Critical Analysis
We have shown that there are many works that point out that CN Science is an unifying and very powerful technique that enables to analyze, within the same conceptual framework, a great variety of very different systems whose constituent elements are organized in a networked way. The CN community, ranging from ecology to proteomic and to engineering [120] (including part of the electrical engineering community) among others, argue that the CN approach does not aim to reflect on the detailed operation of a given system, but to discover the possible emergence of a systemic or collective behavior, beyond that of its single components. This is supported by a huge number of high-impact works published in renowned journals (see Section 1), including the field of Power Grids [1,21,23,61,67,70,106,107,108,123]. The opposing trend claims that the pure CN approach loses the details of the physics behind the Kirchhoff’s Laws and fails in predicting important aspects of power grids. Within this group of works are [8,14,35], which nevertheless take advantage of the tools offered by CN Science and combined them with concepts from Electrical Engineering, leading to the extended topological approach (Subsection 3.2.3).
The CN approach, with purely topological analysis (or even with extended ones to take into account minimal electrical information [8]), has been useful to detect critical elements and to assess topological robustness [11]. The evaluation of these results has been done by means of correlating topological and extended degrees [35] with load shedding in real systems (over several time intervals) or even with statistical data corresponding to failures in real blackouts [19]. The results of [151] are in accordance with the values of power system reliability indices previously obtained from some standard power engineering methods. Luo and Rosas-Casals have recently reported a study [116] that aims to correlate electric-based vulnerability metrics (based on the extended topological approach) with real malfunction data corresponding to some European power transmission grids (Germany, Italy, France and Spain). The authors have explored two different approaches. The first one aims at fitting the cumulated probability distributions corresponding to empirical data of major events (in terms of ENS, TLP and RT, see Table 2) to some characteristic fat-tailed functions (log-normal, exponential, stretched exponential and power-law with cut-off distributions), based on Clauset methodology [195]. The authors point out that when using the Clauset statistical approach—which offers the possibility to statistically fit data to the function tail—there is no clear correlation between empirical data and extended topological measures, and suggest that this could be probably caused by the small amount of available empirical data. To overcome this problem, the second explored approach is a two-fold strategy, which consists of (1) significantly improving the database by aggregating data (French and Spanish data on the one hand, and German and Italian data on the other hand), along with (2) the use of statistical Kolmogorov-Smirnov (KS) tests, which aim at fitting the complete function rather than only its tail. This second approach shows how aggregated data from the French and Spanish power grids can be fitted by a power-law distribution with cut-off approximation, while aggregated data from the German and Italian grids can be fitted by a stretched exponential-like function. Although weak, the results are statistically significant (KS test) and suggest the existence of a linkage between structure (described by extended topological metrics) and dynamical empirical data. In this respect, the authors argue that on the one hand, the topological structures of Spain and France power grids evince that these networks are more fragile since they are operated close to their maximum power transmission capacity, in accordance with major events data. On the other hand, German and Italian power grids are not yet at their maximum power transmission capacity, and there is still a margin to reach the upper bound of their dynamic output, as suggested by the empirical data of major events [116]. Thus these power grids can be considered more robust. Although much research must be carried out, this evidence could open a research line to find a more meaningful link between CN-based metrics and the real empirical data of power grids. The CN approach could be useful to make vulnerability assessment and to design specific actions to reduce topological weaknesses [8]. The analysis of the review and the conclusions in [8] suggests that there is a connection between the topological structure and operation performance in a power grid because the structural change could disturb its operational condition and, as a consequence, degrade its operation performance. As a result, there is an increasing interest in analyzing structural vulnerability of power grids by means of CN methodology.
However, when the CN approach is applied to other aspects of power grids, the results are not conclusive [11], so it becomes increasingly necessary for their results to be checked with real power grids’ operators. However, these are not easy to obtain in practice. A better and deeper collaboration between the CN and electrical engineering communities is desirable to clarify these controversial issues. This has also been put to debate in [11], where a clear introduction to the field of complexity science in the context of power grids is further provided. Regardless of which of the two confronting options is more accurate, the underlying question is to derive the most appropriate structures to guarantee a robust grid. This is the purpose of the next section.
4.5. Analysis of Power Grid Structures
Most of the explored works have aimed at discovering what type of prevailing network structure underlies below power grids, if any. However, it appears to be no predominant structure (except for the fact that many grids have a heterogeneous nature) [8]. In fact, throughout the review, we have shown that there are several graph structures aiming at abstracting the real power grid topology. For instance, we have seen that the research in [70] pointed out that the US western power grid seemed to be a small-world network, while the work [69] suggested that the degree distribution of the power grid seemed to be scale-free following a power law distribution function, although not all of the subsequent works have agreed on this. In this respect, some other works have also found that there are exponential cumulative degree functions, for instance in Californian power grid [123] and in the whole US power grid [147]. But, on the other hand, [151] has shown that the topologies of the North American eastern and western electric grids can be analyzed based on the Barabasi-Albert network model, with good agreement with to the values of power system reliability indices previously obtained from some standard power engineering methods. This suggests that scale-free network models are applicable to estimate aggregate electric grid reliability [8]. In addition to [70], there are also several works that report on power grids with small world nature: the Shanghai Power Grid (explored with a hybrid CN DC and AC power flow models) [7], the Italian 380 kV, the French 400 kV and the Spanish 400 kV grids [155] or the Nordic power grid [111]. Rosas-Casals et al. [20], using data from thirty-three different European power grids, found that, although the different explored grids seem to had an exponential degree distributions and most of them lack small-world property, this grids showed however a behavior similar to scale-free networks when nodes are removed, concluding that this behavior is not unique to scale-free networks. This could suggest similar topological constraints, mostly associated to geographical restrictions and technological considerations [8].
Currently, as shown in this review, the power grid is a hierarchical network that provides electric energy from large scale generators to end-users, and consists of a high-voltage transmission and a distribution grid (at medium- at low-voltage), which connects to the end-user. However, smart grids is a technology that has the potential to transform consumers into “prosumers” (consumers and producers of electricity) [64]. As pointed out in [64], the exchange of electric energy at local scale could be very positive because it stimulates the local production and consumption of renewable-based electric energy (small-scale photovoltaic systems and small-wind turbines), help the end-user obtain economic benefit by selling the energy produced in excess. Using real data from Dutch grids, and within the CN framework, the key contribution of [64] is to propose the use of CN theory combined with global statistical measures as a design tool to synthesize the best smart grid structures, in terms of performance and reliability (for a local energy exchange) and cabling cost. The authors lead to the conclusion that small-world model seems to have many feasible features, not only structural but also economical related to electricity distribution.
In spite of the existence of several topologies in high-voltage transmission power grids, most of them have in common that they are vulnerable to fails/attacks on the most connected nodes and robust against random failure. Although not conclusive, power grids with small network structure seem to be the most robust (except random networks) or, at least, seem to be those with the highest potential to improve robustness in a feasible way. A study based on a metric called “algebraic connectivity”, [125] has compared the robustness of random networks (ER), small-world (WS), and scale free (BA). Random networks are the most robust and scale-free the most vulnerable. Among the structures found in power grids (scale-free, small-world), non-sparse small-world network () are the most robust. According to [126] non-sparse small-world networks has also the beneficial property of increasing easily robustness by a feasible method which consists of simultaneously increasing both rewiring probability and average degree improve significantly the robustness of the small-world network.
Regardless the structure, the question arisen here is how to increase the power grid robustness. In the hot topic of smart grids, the best structure seems to be small world networks, as will be shown later on. Answering this question, for power grids in general, is just the purpose of the following section.
4.6. Strategies to Improve Robustness
4.6.1. Intentional Islanding
Intentional islanding is a strategy to stop the initial failure occurring in a small part of a power grid, and to prevent it from propagating through the rest of the system causing thus a larger blackout. In this review we have shown that in [20] data from thirty-three different European power grids have been utilized to conclude that the vulnerability is logarithmically related to the size of the power grid. The authors in this work suggested that a feasible method to prevent the propagation of disturbances would be to design the network so as to allow for intentionally separable, stable, small islands. This important result about the power grid size and its influence on the vulnerability of the entire grid have been recently investigated in [28], where it is noted that there may be an optimal size for the power grid based on a balance between efficiency and risk of large failure.
In this line of reasoning, as pointed out in [196], intentional islanding of a power grid can be an emergency reaction aiming at isolating failures. The aim of this study is to design a novel strategy that forms islands capable of stopping cascading failures. The island to be formed should be small in size, with the restriction that the power delivered by generators is maximized to satisfy electric loads. The intentional islanding method proposed by [196] have some novel ingredients when compared to other prior islanding techniques, which suffer from two drawbacks: they do not take into account the power flow model, and they are often designed to minimize load shedding only within the islands. The novelty of [196] resides in the incorporation of DC power flow models into the graph, the partition method to split the power grid into islands and the criteria to perform the partition, which aim at minimizing the load shedding not only in the region where the failure starts, but also in the topological complement of the region. The basic idea is to apply the “community” concept (a set of well connected nodes that are less connected to the rest of the network) from CN theory to power grids. The authors have introduced the DC power flow model into two community detection algorithms (i.e., modified versions of Bloom and Fast Greedy algorithms) to compose the partition of the grid so that the clustered islands lead to a minimum load shedding over the whole system. The islanding method has been tested on IEEE test systems with 57, 118 and 300 nodes, and is found to be able to find islands that stop the cascading failure and preserve at least 40%–50% of the network load.
The predicted effects of controlled islanding may be different depending on the adopted theoretical framework, since CN simplifications (and even DC power flow models, which in turn are a simplification of AC power flow models) may lead to unsuccessful islanding designs. As recently pointed out in [197], this is because intentional islanding is a very difficult task that must fulfill not only static limitations (load-generation balance, system limits, network constraints), but also dynamic constraints (frequency and voltage stability), and should not cause any loss of synchronism or voltage collapse. However, as argued in [197], many islanding approaches consider only real power, and assume that reactive power can be compensated locally after islanding. In this context, [198] has reported on some cases in which intentional islanding based on DC power flow (even when there is enough reactive power generation capacity in each island) fails to satisfy AC power flow and voltage constraints. A workaround to these problems has been presented in [197], which proposes a novel piece-wise linear approximation to AC power flow combined with an MILP (Mixed Integer Linear Programming) approach to design controlled islanding in power grids. This method finds which lines to disconnect, which loads to shed and how to adjust generators in order to design islands with frequency and voltage stability. Experiments performed over test networks elucidate that this model is able to eliminate the islanding problems reported in [198], and minimizes the load shed while partitioning the power grid so that coherent synchronous machines remain in the same island.
4.6.2. Smart Addition of Links
As shown in our review in Section 3, the addition of links to increase the robustness has been studied in [152] by using a topological study of real grids in Spain, France and Italy. A similar report has been published in [169], on the basis of a hybrid approach involving a DC flow model. Under the assumption of a small-world WS network model, it is observed that line congestion decreases as the density of shortcuts rises. By rewiring shortcut lines under a certain probability, the mean load in lines results lower and so does the number of congested lines. A similar result has been found in [108,169], which in turn buttresses the suitability of small-word network models when it comes to robustness [86,123,140,174,180].
The benefits springing from having small network diameters has been recently emphasized in [21], where the power grid is modeled as a network of networks. In fact, two important features have been found that could help reducing vulnerability. The first one is that networks with small diameter are very robust. This has very important practical implications because from a practical engineering viewpoint, it involves that generators should be placed near consumers, which can be attained by means of distributed renewable energy generation [179]. This strategy could reduce the investment of deploying or upgrading power transmission grids. Thus, reducing the costs and making the grid more robust can be regarded as non conflicting objectives. The second important conclusion drawn in [21] is that networks can be made typically more robust by adding more links, which has been also pointed out in [108].
Note that all works mentioned above agree on the beneficial aspects of adding lines to increase robustness. However, the results of [107]—a research work based on topology concepts and a non electrical model of cascades (the sandpile model, described in Subsection 3.1)—are partially different from those mentioned above in suggesting that an excessively large number of new lines could be harmful. We say partially because this model predicts that adding lines is beneficial until a critical number of lines is reached, beyond which adding more lines could catastrophically exacerbate cascading failures. From this point of view, not all models are consistent regarding the beneficial aspects of adding lines, although it is true that the vast majority of them agree on the conclusion that this strategy is beneficial.
4.6.3. Hybrid Power Grids
As pointed out by [41,45], the improvement of the grid resilience is a challenging objective. Deploying or modifying a power grid infrastructure that is reliable to low-impact hight-probability threats, but also resilient to high-impact, low-probability events, is difficult to accomplish. As mentioned in Section 1, resilience is a dynamic concept, an ongoing method for adapting (and presumably transforming) the structure and operation of power grids to be better prepared to external, unexpected events. Resilience exhibits two aspects: on the one hand it focuses on making the infrastructure more physically robust while, on the other, it also consists of implementing smarter operational actions and the intelligence of the service company that runs the grid [199].
In terms of robustness the addition of more lines may not always help because it may require in general a significant investment [41], and some of these actions (e.g., burying overhead lines underground to be less vulnerable to disasters) may have negative effects on resilience since it may require longer time to repair. This is why a “hybrid power grid” might be the solution for increasing the resilience of future power networks in an economically affordable fashion [41]. The term “hybrid” is interpreted by the authors in two distinct yet related ways: the combination of actions to increase the infrastructure robustness (new lines) along with smart operational actions; and the coexistence of largely interconnected grids with central control and smaller, decentralized areas that could be operated as “microgrids” in case of emergency. The authors argue that this combination would exhibit the advantages of being both more robust and easier to operate. A microgrid in this context is simply regarded as a subset of the grid (typically at low-voltage and medium-voltage levels) that can be islanded, and which is able to supply electric energy to all or most of its users when an emergency is triggered. This improves the grid resilience and is very beneficial because, as will be shown in the following subsection, have the potential to boost the efficient use of distributed energy generation facilities connected to the medium- and low-voltage grid. A microgrid requires “smart technologies” to be deliver electric power to users in islanded mode [41]. This issue is related to that of smart grids.
4.6.4. Smart Grids
In the short run, the shift towards an electric grid characterized by a very considerable influence of “prosumers” (consumers and producers of electricity) will possibly have a great influence on the electricity distribution infrastructure in the near future [64,200,201]. As a result, smart grids have gained a great momentum within the scientific community over the last four years [10,41,64,114,117,119,199,200,200,201,202]. However, as shown in this review the power grid is nowadays a hierarchically networked system that supplies electric energy from large-scale generators to end users. Although most of the papers revised in this survey deal with high-voltage transmission power grids, in the last couple of years the number of works focusing on distribution grids and smart grids as complex networks is on the rise [10,64,200,203]. For instance, [203] analyzes real power grids from the Dutch medium- and low-voltage network along with synthetic topologies, leading to the conclusion that a small increase in the average connectivity can highly enhance the robustness of the distribution grid against random and targeted attacks.
As pointed out in [64], the grid as a whole is expected to become a more capillary system, especially in the medium- and low-voltage levels, which will support local energy trading among prosumers via smart grids. The exchange of electric energy at a local level could be very positive because it would stimulate the local production and consumption of renewable energy (e.g., small-scale photovoltaic panels and wind turbines), hence aiding the end-user to obtain economic benefits by selling the energy produced in excess, and making the power grid more robust. Within the CN framework, the key contribution of [64] lies on exploring how different topologies, inspired by technological and social network investigations, exhibit different peculiarities, and whether they could be feasible for future smart grids. The authors lead to the conclusion that featuring a small-world model is the most appropriate requirement for robust smart grids.
5. Summary and Conclusions
In this survey we have reviewed the most representative contributions gravitating on the analysis of robustness in power grids by means of concepts borrowed from the theory of Complex Networks (CN). Although robustness and resilience are different but related concepts, sometimes they are used indistinguishably because, from a practical engineering viewpoint, robustness is necessary although not sufficient to make the grid resilient. Vulnerability (the opposite of robustness) is characterized as the performance drop of the grid when a disruptive event occurs, which is quantified by a metric. Robustness is an extremely beneficial property, not only for the power grid itself, but also for other critical infrastructures (e.g., telecommunication and transportation networks, water supply systems, natural gas pipelines and oil infrastructures), all depending on the energy it delivers.
The literature review shows that the CN framework consists of two different approaches. The first one is based solely on the structure and its topological concepts: a power grid can be modeled using a graph that captures its structure, with nodes (vertices) representing stations and substations, and links (edges) modeling transmission lines between nodes. The node degree (number of links in a node) distribution gives an intuitive idea of the extent to which a network is vulnerable (an attack on a high degree node is more harmful than that on a low degree one). This “pure topological approach” uses metrics such as mean path length, clustering coefficient, efficiency, and centrality metrics (mostly betweenness centrality). The second “hybrid approach” introduces some concepts from Electrical Engineering (line impedance and simplified power flow models) for enhancing the pure topological approach, as done by the so-called “extended topological approach” in [78]. This emphasizes that when applying CN analysis to a power grid, the grid must be represented with a directed, weighted graph because lines have different impedances and power flow limits, and electric power flows from generator buses to load buses. Conventional metrics are substituted by their corresponding electrical counterparts: electrical betweenness (and other electrical centrality metrics [30]), net-ability (instead of efficiency), and entropic degree (instead of node degree) [8].
The manuscript corroborates [14] and points out that unweighted graphs are by far the most used representation in the bibliography that addresses power grids from the pure topological CN viewpoint, except for a couple of works in this group that have used weighted links (not based on electrical principles but in the distribution of generic node load based on its betweenness). Another interesting finding is that most of these works resort to the node degree distribution in their analysis aiming at discovering the class of network under study, e.g., scale-free or random network. By contrast, most of the hybrid approaches which include power flow models and electric-based metrics made use of weighted graphs, but do not analyze the node degree distribution statistics which, however, might be interesting because as recently pointed out in [14], the degree distribution might exhibit differences when compared to that of unweighted approaches.
In addition the survey elucidates that there are many references that suggest that CN Science is an useful and unifying technique that allows analyzing, within the same conceptual framework, a great variety of very diverse systems whose constituent elements are organized in a networked way. The CN community, with individuals from biological to social sciences, economy and engineering, argues that the CN approach does not focus on the detailed operation of a given system, but rather intends to discover possibly emerging systemic or collective behaviors beyond that of its single components. This argument is supported by a long number of high-impact works published in prestigious journals, including research contributions within the field of power grids. However, there is a controversy about the ability of CN (even when including simplified power flow models from Electrical Engineering) to provide insights into all aspects of real power grids, as suggested by part of the Electrical Engineering community. Nevertheless this criticism does not clash with the argument defended by the CN community in the sense that the CN approach focuses on the emergence of unforeseen collective behavior, and is not intended to predict all the individual behaviors of its constituent parts. Both communities seem to have different yet not opposing interests.
There are indeed reasons to support both viewpoints. On the one hand, the CN approach with purely topological concepts—or even with extended ones to take into account minimal electrical characteristics—has been useful to detect critical elements and to evaluate the structural robustness [11]. The assessment of these results has been done by means of correlating topological and extended metrics with load shedding in real power grids (over several time intervals), or even with statistical data corresponding to failures in real blackouts. The results of [151] agree with the values of electric power grid reliability indices previously obtained from conventional electrical engineering procedures. In 2015 Luo and Rosas-Casals have recently reported a study [116] that aims to correlate electric-based vulnerability metrics based on the extended topological approach with malfunction data corresponding to real power transmission grids. This contribution paves the way for a new research line to reconcile the CN approach and conventional electrical engineering methods. Unfortunately results seem not to be irrefutable [11], thus the results from CN approaches have to be checked with more real data provided by power grid operators.
Beyond this controversy, most of the explored works, which are mainly focused on high voltage transmission grids, aim at discovering what type of prevailing network structure (if any) underlies beneath real power grids. However, it appears to be no predominant structure except for the fact that many grids have a heterogeneous nature. There are power grids with scale-free nature and others with the small-world property. In the novel field of smart grids, small-world property has been recently suggested as the best structure to fulfill the requirements for the local exchange of electric energy between prosumers [64]. Despite the existence of several topologies in high-voltage transmission power grids, most of them have in common that they are vulnerable to targeted attacks on the most connected nodes, and robust against random failures. Regarding the engineering question of how to increase robustness, a few works point out at the following strategies: (1) intentional islanding to stop the initial failure and prevent it from catastrophically propagating and an eventual blackout; (2) the intelligent addition of links so as to reduce the network diameter (which increases robustness) but without incurring too many interconnections that could unleash cascading failures between sub-networks; (3) the layout of “hybrid grids” [41], which consist of the coexistence of largely interconnected, centrally controlled grids with smaller, distributedly controlled areas that could operate as “microgrids” or independent islands in the case of emergency; and (4) the implementation of smart grids, which have the potential to reshape the medium- and low-voltage distribution grid into a more capillary, robust network by virtue of the local consumption and production of electric energy between prosumers via a local electric market.
These all considerations shed light on the importance of the topic under review and, as pointed out in [11], suggest the need for a better and deeper collaboration between the CN community, grid operators and electrical engineers in a joint effort towards clarifying the highlighted controversial issues.
Acknowledgments
This work has been partially supported by the project TIN2014-54583-C2-2-R from the Spanish Ministerial Commission of Science and Technology (MICYT), by the project S2013/ICE-2933 from Comunidad de Madrid and by the project FUTURE GRIDS-2020 from the Basque Government.
Author Contributions
Lucas Cuadra, Sancho Salcedo-Sanz, Javier Del Ser, Silvia Jiménez-Fernández and ZongWoo Geem have actively participated in the tasks of finding, selecting and analyzing the most important works presented in this review. Lucas Cuadra, Sancho Salcedo-Sanz and Javier Del Ser wrote the paper.
Conflicts of Interest
The authors declare no conflict of interest.
References
- Pahwa, S.; Scoglio, C.; Scala, A. Abruptness of cascade failures in power grids. Sci. Rep. 2014, 4, 3694. [Google Scholar] [CrossRef] [PubMed]
- Yan, J.; Tang, Y.; He, H.; Sun, Y. Cascading failure analysis with DC power flow model and transient stability analysis. IEEE Trans. Power Syst. 2015, 30, 285–297. [Google Scholar] [CrossRef]
- Henneaux, P. Probability of failure of overloaded lines in cascading failures. Int. J. Electr. Power Energy Syst. 2015, 73, 141–148. [Google Scholar] [CrossRef]
- Qi, J.; Sun, K.; Mei, S. An interaction model for simulation and mitigation of cascading failures. IEEE Trans. Power Syst. 2015, 30, 804–819. [Google Scholar] [CrossRef]
- Wang, X.; Koç, Y.; Kooij, R.E.; van Mieghem, P. A network approach for power grid robustness against cascading failures. Phys. Soc. 2015, 1, 1–7. [Google Scholar]
- Newman, D. Complex Dynamics of the Power Transmission Grid (and other Critical Infrastructures). In Proceedings of American Physical Society March Meeting, San Antonio, TX, USA, 2–6 March 2015.
- Mei, S.; Zhang, X.; Cao, M. Power Grid Complexity; Springer: Berlin, Germany, 2011. [Google Scholar]
- Bompard, E.; Luo, L.; Pons, E. A perspective overview of topological approaches for vulnerability analysis of power transmission grids. Int. J. Crit. Infrastruct. 2015, 11, 15–26. [Google Scholar] [CrossRef]
- Scala, A.; Pahwa, S.; Scoglio, C.M. Cascade failures and distributed generation in power grids. Int. J. Crit. Infrastruct. 2015, 11, 27–35. [Google Scholar] [CrossRef]
- Shi, B.; Liu, J. Decentralized control and fair load-shedding compensations to prevent cascading failures in a smart grid. Int. J. Electr. Power Energy Syst. 2015, 67, 582–590. [Google Scholar] [CrossRef]
- Rosas-Casals, M.; Bologna, S.; Bompard, E.F.; D’Agostino, G.; Ellens, W.; Pagani, G.A.; Scala, A.; Verma, T. Knowing power grids and understanding complexity science. Int. J. Crit. Infrastruct. 2015, 11, 4–14. [Google Scholar] [CrossRef]
- Ouyang, M.; Pan, Z.; Hong, L.; Zhao, L. Correlation analysis of different vulnerability metrics on power grids. Phys. A Stat. Mech. Its Appl. 2014, 396, 204–211. [Google Scholar] [CrossRef]
- Ouyang, M.; Yang, K. Does topological information matter for power grid vulnerability? Chaos Interdiscip. J. Nonlinear Sci. 2014, 24, 043121. [Google Scholar] [CrossRef] [PubMed]
- Pagani, G.A.; Aiello, M. The power grid as a complex network: A survey. Phys. A Stat. Mech. Appl. 2013, 392, 2688–2700. [Google Scholar] [CrossRef]
- Zhang, G.; Li, Z.; Zhang, B.; Halang, W.A. Understanding the cascading failures in Indian power grids with complex networks theory. Phys. A Stat. Mech. Appl. 2013, 392, 3273–3280. [Google Scholar] [CrossRef]
- U.S. Canada Power System Outage Task Force. Final Report on the Implementation of Task Force Recommendations. Technical report, US Department of Energy. 2015. Available online: http://energy.gov/oe/downloads/ (accessed on 1 May 2015). [Google Scholar]
- Sachtjen, M.; Carreras, B.; Lynch, V. Disturbances in a power transmission system. Phys. Rev. E 2000, 61, 4877. [Google Scholar] [CrossRef]
- Luo, X.S.; Wei, D.Q. Passivity-based adaptive control of chaotic oscillations in power system. Chaos Solitons Fractals 2007, 31, 665–671. [Google Scholar]
- Solé, R.V.; Rosas-Casals, M.; Corominas-Murtra, B.; Valverde, S. Robustness of the European power grids under intentional attack. Phys. Rev. E 2008, 77, 026102. [Google Scholar] [CrossRef]
- Rosas-Casals, M.; Valverde, S.; Solé, R.V. Topological vulnerability of the European power grid under errors and attacks. Int. J. Bifurc. Chaos 2007, 17, 2465–2475. [Google Scholar] [CrossRef]
- Dewenter, T.; Hartmann, A.K. Large-deviation properties of resilience of power grids. New J. Phys. 2015, 17, 015005. [Google Scholar] [CrossRef]
- Zhu, Y.; Yan, J.; Tang, Y.; Sun, Y.L.; He, H. Resilience analysis of power grids under the sequential attack. IEEE Trans. Inf. Forensics Secur. 2014, 9, 2340–2354. [Google Scholar] [CrossRef]
- Zhu, Y.; Yan, J.; Sun, Y.; He, H. Revealing cascading failure vulnerability in power grids using risk-graph. IEEE Trans. Parallel Distrib. Syst. 2014, 25, 3274–3284. [Google Scholar] [CrossRef]
- Zhu, Y.; Yan, J.; Tang, Y.; Sun, Y.; He, H. The sequential attack against power grid networks. In Proceedings of the 2014 IEEE International Conference on Communications (ICC), Sydney, Australia, 10–14 June 2014; pp. 616–621.
- Zhu, Y.; Yan, J.; Tang, Y.; Sun, Y.L.; He, H. Coordinated attacks against substations and transmission lines in power grids. In Proceedings of the 2014 IEEE Global Communications Conference (GLOBECOM), Austin, TX, USA, 8–12 December 2014; pp. 655–661.
- Diendorfer, G.; Pichler, H.; Achleitner, G.; Broneder, M. Lightning caused outages in the Austrian Power Grid transmission line network. In Proceedings of the 2014 International Conference on Lightning Protection (ICLP), Shanghai, China, 11–18 October 2014; pp. 152–156.
- Yan, J.; He, H.; Sun, Y. Integrated security analysis on cascading failure in complex networks. IEEE Trans. Inf. Forensics Secur. 2014, 9, 451–463. [Google Scholar] [CrossRef]
- Carreras, B.A.; Newman, D.; Dobson, I. Does size matter? Chaos Interdiscip. J. Nonlinear Sci. 2014, 24, 023104. [Google Scholar] [CrossRef] [PubMed]
- Zhu, Y.; Yan, J.; Sun, Y.; He, H. Risk-aware vulnerability analysis of electric grids from attacker’s perspective. In Proceedings of the 2013 IEEE PES Innovative Smart Grid Technologies (ISGT), Washington, DC, USA, 24–27 February 2013; pp. 1–6.
- Bilis, E.; Kroger, W.; Nan, C. Performance of electric power systems under physical malicious attacks. IEEE Syst. J. 2013, 7, 854–865. [Google Scholar] [CrossRef]
- Zhu, Y.; Sun, Y.; He, H. Load distribution vector based attack strategies against power grid systems. In Proceedings of the 2012 IEEE Global Communications Conference (GLOBECOM), Anaheim, CA, USA, 3–7 December 2012; pp. 935–941.
- Vaiman, M.; Bell, K.; Chen, Y.; Chowdhury, B.; Dobson, I.; Hines, P.; Papic, M.; Miller, S.; Zhang, P. Risk assessment of cascading outages: Methodologies and challenges. IEEE Trans. Power Syst. 2012, 27, 631–641. [Google Scholar] [CrossRef]
- Rosas-Casals, M.; Solé, R. Analysis of major failures in Europe’s power grid. Int. J. Electr. Power Energy Syst. 2011, 33, 805–808. [Google Scholar] [CrossRef]
- Nasiruzzaman, A.; Pota, H.; Mahmud, M. Application of centrality measures of complex network framework in power grid. In Proceedings of the 37th Annual Conference on IEEE Industrial Electronics Society, Melbourne, Australia, 7–10 November 2011; pp. 4660–4665.
- Bompard, E.; Napoli, R.; Xue, F. Analysis of structural vulnerabilities in power transmission grids. Int. J. Crit. Infrastruct. Prot. 2009, 2, 5–12. [Google Scholar] [CrossRef]
- Carreras, B.A.; Newman, D.E.; Dobson, I. The Impact of Size and Inhomogeneity on Power Transmission Network Complex System Dynamics. In Proceedings of the 47th Hawaii International Conference on System Sciences (HICSS), Waikoloa, HI, USA, 6–9 January 2014; pp. 2527–2535.
- Carreras, B.A.; Newman, D.E.; Dobson, I. Determining the vulnerabilities of the power transmission system. In Proceedings of the 45th Hawaii International Conference on System Science (HICSS), Maui, HI, USA, 4–7 January 2012; pp. 2044–2053.
- Xu, S.; Zhou, H.; Li, C.; Yang, X. Vulnerability assessment of power grid based on complex network theory. In Proceedings of the 2009 Power and Energy Engineering Conference (APPEEC 2009), Wuhan, China, 28–30 March 2009; pp. 1–4.
- Carreras, B.A.; Lynch, V.E.; Dobson, I.; Newman, D.E. Critical points and transitions in an electric power transmission model for cascading failure blackouts. Chaos Interdiscip. J. Nonlinear Sci. 2002, 12, 985–994. [Google Scholar] [CrossRef] [PubMed]
- Bompard, E.; Huang, T.; Wu, Y.; Cremenescu, M. Classification and trend analysis of threats origins to the security of power systems. Int. J. Electri. Power Energy Syst. 2013, 50, 50–64. [Google Scholar] [CrossRef]
- Panteli, M.; Mancarella, P. The Grid: Stronger, Bigger, Smarter? Presenting a Conceptual Framework of Power System Resilience. IEEE Power Energy Mag. 2015, 13, 58–66. [Google Scholar]
- Strbac, G.; Hatziargyriou, N.; Lopes, J.P.; Moreira, C.; Dimeas, A.; Papadaskalopoulos, D. Microgrids: Enhancing the Resilience of the European Megagrid. IEEE Power Energy Mag. 2015, 13, 35–43. [Google Scholar] [CrossRef]
- Heitzig, J.; Fujiwara, N.; Aihara, K.; Kurths, J. Interdisciplinary challenges in the study of power grid resilience and stability and their relation to extreme weather events. Eur. Phys. J. Spec. Top. 2014, 223, 2383–2386. [Google Scholar] [CrossRef]
- Francis, R.; Bekera, B. A metric and frameworks for resilience analysis of engineered and infrastructure systems. Reliab. Eng. Syst. Saf. 2014, 121, 90–103. [Google Scholar] [CrossRef]
- Panteli, M.; Mancarella, P. Influence of extreme weather and climate change on the resilience of power systems: Impacts and possible mitigation strategies. Electr. Power Syst. Res. 2015, 127, 259–270. [Google Scholar] [CrossRef]
- National Infrastructure Advisory Council (NIAC). National Infrastructure Advisory Council—A Framework for Establishing Critical Infrastructure Resilience Goals Final Report and Recommendations; Technical Report for National Infrastructure Advisory Council: Arlington, VA, USA, 19 October 2010. [Google Scholar]
- Ton, D.T.; Wang, W. A More Resilient Grid: The US Department of Energy Joins with Stakeholders in an R&D Plan. IEEE Power Energy Mag. 2015, 13, 26–34. [Google Scholar]
- Kundur, P.; Paserba, J.; Ajjarapu, V.; Andersson, G.; Bose, A.; Canizares, C.; Hatziargyriou, N.; Hill, D.; Stankovic, A.; Taylor, C.; Van Cutsem, T.; Vittal, V. Definition and classification of power system stability IEEE/CIGRE joint task force on stability terms and definitions. IEEE Trans. Power Syst. 2004, 19, 1387–1401. [Google Scholar]
- Kott, A.; Abdelzaher, T. Resiliency and Robustness of Complex Systems and Networks. Adapt. Dyn. Resilient Syst. 2014, 67, 67–86. [Google Scholar]
- Yusta, J.M.; Correa, G.J.; Lacal-Arántegui, R. Methodologies and applications for critical infrastructure protection: State-of-the-art. Energy Policy 2011, 39, 6100–6119. [Google Scholar] [CrossRef]
- Caldarelli, G.; Vespignani, A. Large Scale Structure and Dynamics of Complex Networks: From Information Technology to Finance and Natural Science; World Scientific: Singapore, 2007; Volume 2. [Google Scholar]
- Luiijf, E.; Nieuwenhuijs, A.; Klaver, M.; van Eeten, M.; Cruz, E. Empirical findings on critical infrastructure dependencies in Europe. In Proceedings of 3rd International Workshop on Critical Information Infrastructures Security, Rome, Italy, 13–15 October 2008; pp. 302–310.
- Danziger, M.M.; Bashan, A.; Berezin, Y.; Shekhtman, L.M.; Havlin, S. An Introduction to Interdependent Networks. In Nonlinear Dynamics of Electronic Systems; Springer: Berlin, Germany, 2014; pp. 189–202. [Google Scholar]
- Zhou, J.; Huang, N.; Sun, X.; Wang, K.; Yang, H. A new model of network cascading failures with dependent nodes. In Proceedings of the Annual Reliability and Maintainability Symposium (RAMS), Palm Harbor, FL, USA, 26–29 January 2015; pp. 1–6.
- Estrada, E. Introduction to Complex Networks: Structure and Dynamics. In Evolutionary Equations with Applications in Natural Sciences; Springer: Berlin, Germany, 2015; pp. 93–131. [Google Scholar]
- Peng, X.; Yao, H.; Du, J.; Wang, Z.; Ding, C. Invulnerability of scale-free network against critical node failures based on a renewed cascading failure model. Phys. A Stat. Mech. Appl. 2015, 421, 69–77. [Google Scholar] [CrossRef]
- Newman, M. Networks: An introduction; Oxford University Press: Oxford, UK, 2010. [Google Scholar]
- Barrat, A.; Barthelemy, M.; Vespignani, A. Dynamical Processes on Complex Networks; Cambridge University Press: Cambridge, UK, 2008. [Google Scholar]
- Newman, M.; Barabasi, A.L.; Watts, D.J. The Structure and Dynamics of Networks; Princeton University Press: Princeton, NJ, USA, 2006. [Google Scholar]
- Boccaletti, S.; Latora, V.; Moreno, Y.; Chavez, M.; Hwang, D.U. Complex networks: Structure and dynamics. Phys. Rep. 2006, 424, 175–308. [Google Scholar] [CrossRef]
- Newman, M.E. The structure and function of complex networks. SIAM Rev. 2003, 45, 167–256. [Google Scholar] [CrossRef]
- Estrada, E. The Structure of Complex Networks: Theory and Applications; Oxford University Press: Oxford, UK, 2011. [Google Scholar]
- Xu, Y.; Gurfinkel, A.J.; Rikvold, P.A. Architecture of the Florida power grid as a complex network. Phys. A Stat. Mech. Its Appl. 2014, 401, 130–140. [Google Scholar] [CrossRef]
- Pagani, G.A.; Aiello, M. Power grid complex network evolutions for the smart grid. Phys. A Stat. Mech. Its Appl. 2014, 396, 248–266. [Google Scholar] [CrossRef]
- Koç, Y.; Warnier, M.; van Mieghem, P.; Kooij, R.E.; Brazier, F.M. The impact of the topology on cascading failures in a power grid model. Phys. A Stat. Mech. Its Appl. 2014, 402, 169–179. [Google Scholar] [CrossRef]
- Sánchez, J.E.C. A Complex Network Approach to Analyzing the Structure and Dynamics of Power Grids. Ph.D. Thesis, The University of Vermont, Burlington, VT, USA, 2009. [Google Scholar]
- Albert, R.; Jeong, H.; Barabási, A.L. Error and attack tolerance of complex networks. Nature 2000, 406, 378–382. [Google Scholar] [CrossRef] [PubMed]
- Albert, R.; Barabási, A.L. Statistical mechanics of complex networks. Rev. Mod. Phys. 2002, 74, 47. [Google Scholar] [CrossRef]
- Barabási, A.L.; Albert, R. Emergence of scaling in random networks. Science 1999, 286, 509–512. [Google Scholar] [PubMed]
- Watts, D.J.; Strogatz, S.H. Collective dynamics of “small-world” networks. Nature 1998, 393, 440–442. [Google Scholar] [CrossRef] [PubMed]
- Cohen, R.; Erez, K.; Ben-Avraham, D.; Havlin, S. Resilience of the internet to random breakdowns. Phys. Rev. Lett. 2000, 85, 4626. [Google Scholar] [CrossRef] [PubMed]
- Lu, J.; Ji, Q.; Zhu, Y. Power grid vulnerability assement based on energy function. In Proceedings of the Third International Conference on Electric Utility Deregulation and Restructuring and Power Technologies (DRPT 2008), 6–9 April 2008; pp. 1039–1043.
- Baldick, R.; Chowdhury, B.; Dobson, I.; Dong, Z.; Gou, B.; Hawkins, D.; Huang, Z.; Joung, M.; Kim, J.; Kirschen, D.; et al. Vulnerability assessment for cascading failures in electric power systems. In Proceedings of the 2009 IEEE/PES Power Systems Conference and Exposition (PSCE’09), 15–18 March 2009; pp. 1–9.
- Guan, X.; Liu, J.; Gao, Z.; Yu, D.; Cai, M. Power grids vulnerability analysis based on combination of degree and betweenness. In Proceedings of the 26th Chinese Control and Decision Conference (2014 CCDC), Changsha, China, 31 May–2 June 2014; pp. 4829–4833.
- Gutierrez, F.; Nuno, J.; Barocio, E. Using a graph cuts approach to analyze the structural vulnerability of the power grids. In Proceedings of the 2014 IEEE Central America and Panama Convention (CONCAPAN XXXIV), Panama, 12–14 November 2014; pp. 1–6.
- Gao, Z.; Cai, X.; Lv, C.; Liang, C. Analysis on vulnerability of power grid based on electrical betweenness with information entropy. In Proceedings of the 33rd Chinese Control Conference (CCC), Nanjing, China, 28–30 July 2014; pp. 2727–2731.
- Wang, J. Robustness of complex networks with the local protection strategy against cascading failures. Saf. Sci. 2013, 53, 219–225. [Google Scholar] [CrossRef]
- Bompard, E.; Pons, E.; Wu, D. Extended topological metrics for the analysis of power grid vulnerability. IEEE Syst. J. 2012, 6, 481–487. [Google Scholar] [CrossRef]
- Chen, G.; Zhao, J.; Dong, Z.Y.; Weller, S.R. Complex network theory based power grid vulnerability assessment from past to future. In Procedings of the 9th IET International Conference on Advances in Power System Control, Operation and Management (APSCOM 2012), Hong Kong, China, 18–21 November 2012; pp. 162–167.
- Wu, J.; Barahona, M.; Tan, Y.J.; Deng, H.Z. Spectral measure of structural robustness in complex networks. IEEE Trans. Syst. Man Cybern. Part A Syst. Hum. 2011, 41, 1244–1252. [Google Scholar] [CrossRef]
- Schneider, C.M.; Moreira, A.A.; Andrade, J.S.; Havlin, S.; Herrmann, H.J. Mitigation of malicious attacks on networks. Proc. Natl. Acad. Sci. USA 2011, 108, 3838–3841. [Google Scholar] [CrossRef] [PubMed]
- Zhang, J.; Xu, X.; Hong, L.; Wang, S.; Fei, Q. Attack vulnerability of self-organizing networks. Saf. Sci. 2012, 50, 443–447. [Google Scholar] [CrossRef]
- Guo, Y.; Duan, R.; Cao, J.; Li, S. Power grid vulnerability identifying based on complex network theory. In Proceedings of the 2012 Second International Conference on Instrumentation, Measurement, Computer, Communication and Control (IMCCC), Harbin, China, 8–10 December 2012; pp. 474–477.
- Wang, Z.; Scaglione, A.; Thomas, R.J. The node degree distribution in power grid and its topology robustness under random and selective node removals. In Proceedings of the 2010 IEEE International Conference on Communications Workshops (ICC), Capetown, South Africa, 23–27 May 2010; pp. 1–5.
- Bompard, E.; Wu, D.; Xue, F. The concept of betweenness in the analysis of power grid vulnerability. In Proceedings of the Complexity in Engineering, 2010 (COMPENG’10), Rome, Italy, 22–24 February 2010; pp. 52–54.
- Fu, L.; Huang, W.; Xiao, S.; Li, Y.; Guo, S. Vulnerability assessment for power grid based on small-world topological model. In Proceedings of the Power and Energy Engineering Conference (APPEEC), Chengdu, China, 28–31 March 2010; pp. 1–4.
- Wang, Z.; Scaglione, A.; Thomas, R.J. Electrical centrality measures for electric power grid vulnerability analysis. In Proceedings of the 2010 49th IEEE Conference on Decision and Control (CDC), Atlanta, GA, USA, 15–17 December 2010; pp. 5792–5797.
- Wei, Z.; Liu, J. Research on the electric power grid vulnerability under the directed-weighted topological model based on Complex Network Theory. In Proceedings of the 2010 International Conference on Mechanic Automation and Control Engineering (MACE), Wuhan, China, 26–28 June 2010; pp. 3927–3930.
- Strogatz, S.H. Exploring complex networks. Nature 2001, 410, 268–276. [Google Scholar] [CrossRef] [PubMed]
- Dorogovtsev, S.N.; Mendes, J.F. Evolution of Networks: From Biological Nets to the Internet and WWW; Oxford University Press: Oxford, UK, 2013. [Google Scholar]
- Pastor-Satorras, R.; Vázquez, A.; Vespignani, A. Dynamical and correlation properties of the Internet. Phys. Rev. Lett. 2001, 87, 258701. [Google Scholar] [CrossRef] [PubMed]
- Wang, W.X.; Yang, R.; Lai, Y.C. Cascade of elimination and emergence of pure cooperation in coevolutionary games on networks. Phys. Rev. E 2010, 81, 035102. [Google Scholar] [CrossRef]
- Havlin, S.; Stanley, H.E.; Bashan, A.; Gao, J.; Kenett, D.Y. Percolation of interdependent network of networks. Chaos Solitons Fractals 2015, 72, 4–19. [Google Scholar] [CrossRef]
- Shao, S.; Huang, X.; Stanley, H.E.; Havlin, S. Robustness of a partially interdependent network formed of clustered networks. Phys. Rev. E 2014, 89, 032812. [Google Scholar] [CrossRef]
- Ouyang, M. Review on modeling and simulation of interdependent critical infrastructure systems. Reliab. Eng. Syst. Saf. 2014, 121, 43–60. [Google Scholar] [CrossRef]
- Wang, S.; Hong, L.; Ouyang, M.; Zhang, J.; Chen, X. Vulnerability analysis of interdependent infrastructure systems under edge attack strategies. Saf. Sci. 2013, 51, 328–337. [Google Scholar] [CrossRef]
- Trucco, P.; Cagno, E.; de Ambroggi, M. Dynamic functional modelling of vulnerability and interoperability of Critical Infrastructures. Reliab. Eng. Syst. Saf. 2012, 105, 51–63. [Google Scholar] [CrossRef]
- Wang, S.; Hong, L.; Chen, X. Vulnerability analysis of interdependent infrastructure systems: A methodological framework. Phys. A Stat. Mech. Its Appl. 2012, 391, 3323–3335. [Google Scholar] [CrossRef]
- Johansson, J.; Hassel, H.; Zio, E. Reliability and vulnerability analyses of critical infrastructures: comparing two approaches in the context of power systems. Reliab. Eng. Syst. Saf. 2013, 120, 27–38. [Google Scholar] [CrossRef]
- Boccaletti, S.; Bianconi, G.; Criado, R.; Del Genio, C.I.; Gómez-Gardeñes, J.; Romance, M.; Sendina-Nadal, I.; Wang, Z.; Zanin, M. The structure and dynamics of multilayer networks. Phys. Rep. 2014, 544, 1–122. [Google Scholar] [CrossRef]
- Kivelä, M.; Arenas, A.; Barthelemy, M.; Gleeson, J.P.; Moreno, Y.; Porter, M.A. Multilayer networks. J. Complex Netw. 2014, 2, 203–271. [Google Scholar] [CrossRef]
- De Domenico, M.; Solé-Ribalta, A.; Cozzo, E.; Kivelä, M.; Moreno, Y.; Porter, M.A.; Gómez, S.; Arenas, A. Mathematical formulation of multilayer networks. Phys. Rev. X 2013, 3, 041022. [Google Scholar] [CrossRef]
- Chopade, P.; Bikdash, M. Critical infrastructure interdependency modeling: Using graph models to assess the vulnerability of smart power grid and SCADA networks. In Proceedings of the 8th International Conference & Expo on Emerging Technologies for a Smarter World (CEWIT), New York, NY, USA, 2–3 November 2011; pp. 1–6.
- Gao, J.; Li, D.; Havlin, S. From a single network to a network of networks. Natl. Sci. Rev. 2014, 1, 346–356. [Google Scholar] [CrossRef]
- Eusgeld, I.; Nan, C.; Dietz, S. System-of-systems approach for interdependent critical infrastructures. Reliab. Eng. Syst. Saf. 2011, 96, 679–686. [Google Scholar] [CrossRef]
- Brummitt, C.D.; Hines, P.D.; Dobson, I.; Moore, C.; D’Souza, R.M. Transdisciplinary electric power grid science. Proc. Natl. Acad. Sci. USA 2013, 110. [Google Scholar] [CrossRef] [PubMed]
- Brummitt, C.D.; D’Souza, R.M.; Leicht, E. Suppressing cascades of load in interdependent networks. Proc. Natl. Acad. Sci. USA 2012, 109, E680–E689. [Google Scholar] [CrossRef] [PubMed]
- Bashan, A.; Berezin, Y.; Buldyrev, S.V.; Havlin, S. The extreme vulnerability of interdependent spatially embedded networks. Nat. Phys. 2013, 9, 667–672. [Google Scholar] [CrossRef]
- Huang, C.N.; Liou, J.J.; Chuang, Y.C. A method for exploring the interdependencies and importance of critical infrastructures. Knowl.-Based Syst. 2014, 55, 66–74. [Google Scholar] [CrossRef]
- Alguacil, N.; Delgadillo, A.; Arroyo, J.M. A trilevel programming approach for electric grid defense planning. Comput. Oper. Res. 2014, 41, 282–290. [Google Scholar] [CrossRef]
- Holmgren, Å.J. Using graph models to analyze the vulnerability of electric power networks. Risk Anal. 2006, 26, 955–969. [Google Scholar] [CrossRef] [PubMed]
- Holmgren, A.J.; Jenelius, E.; Westin, J. Evaluating strategies for defending electric power networks against antagonistic attacks. IEEE Trans. Power Syst. 2007, 22, 76–84. [Google Scholar] [CrossRef]
- Bompard, E.; Gao, C.; Napoli, R.; Russo, A.; Masera, M.; Stefanini, A. Risk assessment of malicious attacks against power systems. IEEE Trans Syst. Man Cybern. Part A Syst. Hum. 2009, 39, 1074–1085. [Google Scholar] [CrossRef]
- Huang, Z.; Wang, C.; Ruj, S.; Stojmenovic, M.; Nayak, A. Modeling cascading failures in smart power grid using interdependent complex networks and percolation theory. In Proceedings of the 8th IEEE Conference on Industrial Electronics and Applications (ICIEA), Melbourne, Australia, 19–21 June 2013; pp. 1023–1028.
- Nasiruzzaman, A.; Pota, H.; Anwar, A.; Islam, F. Modified centrality measure based on bidirectional power flow for smart and bulk power transmission grid. In Proceedings of the 2012 IEEE International Power Engineering and Optimization Conference (PEDCO), Melaka, Malaysia, 6–7 June 2012; pp. 159–164.
- Luo, L.; Rosas-Casals, M. Correlating empirical data and extended topological measures in power grid networks. Int. J. Crit. Infrastruct. 2015, 11, 82–96. [Google Scholar] [CrossRef]
- Pagani, G.A.; Aiello, M. Towards decentralization: A topological investigation of the medium and low voltage grids. IEEE Trans. Smart Grid 2011, 2, 538–547. [Google Scholar] [CrossRef]
- Nasiruzzaman, A.; Pota, H.; Barik, M. Implementation of bidirectional power flow based centrality measure in bulk and smart power transmission systems. In Proceedings of the 2012 IEEE Innovative Smart Grid Technologies-Asia (ISGT Asia), Tianjin, China, 21–24 May 2012; pp. 1–6.
- Nasiruzzaman, A.; Pota, H.R. Transient stability assessment of smart power system using complex networks framework. In Proceedings of the 2011 IEEE Power and Energy Society General Meeting, San Diego, CA, USA, 24–29 July 2011; pp. 1–7.
- Cui, L.; Kumara, S.; Albert, R. Complex networks: An engineering view. IEEE Circuits Syst. Mag. 2010, 10, 10–25. [Google Scholar] [CrossRef]
- Barabási, A.L. The architecture of complexity. IEEE Control Syst. 2007, 27, 33–42. [Google Scholar] [CrossRef]
- Barabási, A.L.; Albert, R.; Jeong, H. Mean-field theory for scale-free random networks. Phys. A Stat. Mech. Its Appl. 1999, 272, 173–187. [Google Scholar] [CrossRef]
- Amaral, L.A.N.; Scala, A.; Barthelemy, M.; Stanley, H.E. Classes of small-world networks. Proc. Natl. Acad. Sci. USA 2000, 97, 11149–11152. [Google Scholar] [CrossRef] [PubMed]
- Solé, R.V. Redes Complejas: Del Genoma a Internet; Tusquets Editores: Barcelona, Spain, 2009. [Google Scholar]
- Jamakovic, A.; Uhlig, S. Influence of the network structure on robustness. In Proceedings of the 15th IEEE International Conference on Networks, 2007 (ICON 2007), Adelaide, Australia, 19–21 November 2007; pp. 278–283.
- Zhang, Z.Z.; Xu, W.J.; Zeng, S.Y.; Lin, J.R. An effective method to improve the robustness of small-world networks under attack. Chin. Phys. B 2014, 23, 088902. [Google Scholar] [CrossRef]
- Newman, M.E.; Watts, D.J. Renormalization group analysis of the small-world network model. Phys. Lett. A 1999, 263, 341–346. [Google Scholar] [CrossRef]
- Wang, X.F.; Chen, G. Complex networks: Small-world, scale-free and beyond. IEEE Circuits Syst. Mag. 2003, 3, 6–20. [Google Scholar] [CrossRef]
- Sun, Y.; Wen, X.M.; Zhao, Z.M.; Li, Y. Using complex network theory in the Internet engineering. In Proceedings of the 7th International Conference on Computer Science & Education (ICCSE), Melbourne, VIC, Australia, 14–17 July 2012; pp. 390–394.
- Wu, X.; Yu, K.; Wang, X. On the growth of Internet application flows: A complex network perspective. In Proceedings of the 30th IEEE International Conference on Computer Communications (IEEE INFOCOM 2011), 10–15 April 2011; pp. 2096–2104.
- Bagler, G. Analysis of the airport network of India as a complex weighted network. Phys. A Stat. Mech. Its Appl. 2008, 387, 2972–2980. [Google Scholar] [CrossRef]
- Ferrer-Cancho, R.; Janssen, C.; Solé, R.V. Topology of technology graphs: Small world patterns in electronic circuits. Phys. Rev. E 2001, 64, 046119. [Google Scholar] [CrossRef]
- Varela, L.M.; Rotundo, G.; Ausloos, M.; Carrete, J. Complex Network Analysis in Socioeconomic Models. In Complexity and Geographical Economics; Springer: Berlin, Germany, 2015; pp. 209–245. [Google Scholar]
- Tëmkin, I.; Eldredge, N. Networks and hierarchies: Approaching complexity in evolutionary theory. In Macroevolution; Springer: Berlin, Germany, 2015; pp. 183–226. [Google Scholar]
- Guimera, R.; Amaral, L.A.N. Functional cartography of complex metabolic networks. Nature 2005, 433, 895–900. [Google Scholar] [CrossRef] [PubMed]
- Braun, P.; Gingras, A.C. History of protein–protein interactions: From egg-white to complex networks. Proteomics 2012, 12, 1478–1498. [Google Scholar] [CrossRef] [PubMed]
- Montoya, J.M.; Solé, R.V. Small world patterns in food webs. J. Theor. Biol. 2002, 214, 405–412. [Google Scholar] [CrossRef] [PubMed]
- Aven, T. On some recent definitions and analysis frameworks for risk, vulnerability, and resilience. Risk Anal. 2011, 31, 515–522. [Google Scholar] [CrossRef] [PubMed]
- Haimes, Y.Y. On the definition of vulnerabilities in measuring risks to infrastructures. Risk Anal. 2006, 26, 293–296. [Google Scholar] [CrossRef] [PubMed]
- Latora, V.; Marchiori, M. Efficient behavior of small-world networks. Phys. Rev. Lett. 2001, 87, 198701. [Google Scholar] [CrossRef] [PubMed]
- Motter, A.E.; Lai, Y.C. Cascade-based attacks on complex networks. Phys. Rev. E 2002, 66, 065102. [Google Scholar] [CrossRef]
- Motter, A.E. Cascade control and defense in complex networks. Phys. Rev. Lett. 2004, 93, 098701. [Google Scholar] [CrossRef] [PubMed]
- Lai, Y.C.; Motter, A.E.; Nishikawa, T. Attacks and cascades in complex networks. In Complex Networks; Springer: Berlin, Germany, 2004; pp. 299–310. [Google Scholar]
- Moreno, Y.; Gómez, J.; Pacheco, A. Instability of scale-free networks under node-breaking avalanches. Europhys. Lett. 2002, 58, 630. [Google Scholar] [CrossRef]
- Crucitti, P.; Latora, V.; Marchiori, M. Model for cascading failures in complex networks. Phys. Rev. E 2004, 69, 045104. [Google Scholar] [CrossRef]
- Carreras, B.; Newman, D. Initial evidence for self-organized criticality in electric power blackouts. In Proceeedings of the 33rd Hawaii International Conference on System Sciences, Maui, HI, USA, 4–7 January 2000.
- Albert, R.; Albert, I.; Nakarado, G.L. Structural vulnerability of the North American power grid. Phys. Rev. E 2004, 69, 025103. [Google Scholar] [CrossRef]
- Crucitti, P.; Latora, V.; Marchiori, M. A topological analysis of the Italian electric power grid. Phys. A Stat. Mech. Its Appl. 2004, 338, 92–97. [Google Scholar] [CrossRef]
- Wang, B.; Kim, B.J. A high-robustness and low-cost model for cascading failures. Europhys. Lett. 2007, 78, 48001. [Google Scholar] [CrossRef]
- Zhao, L.; Park, K.; Lai, Y.C.; Ye, N. Tolerance of scale-free networks against attack-induced cascades. Phys. Rev. E 2005, 72, 025104. [Google Scholar] [CrossRef]
- Chassin, D.P.; Posse, C. Evaluating North American electric grid reliability using the Barabási–Albert network model. Phys. A Stat. Mech. Its Appl. 2005, 355, 667–677. [Google Scholar] [CrossRef]
- Crucitti, P.; Latora, V.; Marchiori, M. Locating critical lines in high-voltage electrical power grids. Fluct. Noise Lett. 2005, 5, L201–L208. [Google Scholar] [CrossRef]
- Kinney, R.; Crucitti, P.; Albert, R.; Latora, V. Modeling cascading failures in the North American power grid. Eur. Phys. J. B Condens. Matter Complex Syst. 2005, 46, 101–107. [Google Scholar] [CrossRef]
- Kim, C.J.; Obah, O.B. Vulnerability assessment of power grid using graph topological indices. Int. J. Emerg. Electr. Power Syst. 2007, 8, 1–15. [Google Scholar] [CrossRef]
- Rosato, V.; Bologna, S.; Tiriticco, F. Topological properties of high-voltage electrical transmission networks. Electr. Power Syst. Res. 2007, 77, 99–105. [Google Scholar] [CrossRef]
- Rosas Casals, M.; Corominas Murtra, B. Assessing European power grid reliability by means of topological measures. WIT Trans. Ecol. Environ. 2009, 122, 515–525. [Google Scholar]
- Bak, P.; Tang, C.; Wiesenfeld, K. Self-organized criticality. Phys. Rev. A 1988, 38, 364. [Google Scholar] [CrossRef] [PubMed]
- Per Bak, T.; Wiesenfeld, K. Self-organized criticality: and explanation of 1/f noise. Phys. Rev. Let 1987, 59, 381–384. [Google Scholar]
- Wang, J.W.; Rong, L.L. Cascade-based attack vulnerability on the US power grid. Saf. Sci. 2009, 47, 1332–1336. [Google Scholar] [CrossRef]
- Wu, Z.X.; Peng, G.; Wang, W.X.; Chan, S.; Wong, E.W.M. Cascading failure spreading on weighted heterogeneous networks. J. Stat. Mech. Theory Exp. 2008, 2008, P05013. [Google Scholar] [CrossRef]
- Wang, W.X.; Chen, G. Universal robustness characteristic of weighted networks against cascading failure. Phys. Rev. E 2008, 77, 026101. [Google Scholar] [CrossRef]
- Wei, D.Q.; Luo, X.S.; Zhang, B. Analysis of cascading failure in complex power networks under the load local preferential redistribution rule. Phys. A Stat. Mech. Its Appl. 2012, 391, 2771–2777. [Google Scholar] [CrossRef]
- Rosas-Casals, M. Power grids as complex networks: topology and fragility. In Proceedings of the Complexity in Engineering, 2010 (COMPENG’10), Rome, Italy, 22–24 February 2010; pp. 21–26.
- Prieto, F.; Sarabia, J.M.; Sáez, A.J. Modelling major failures in power grids in the whole range. Int. J. Electr. Power. Energy Syst. 2014, 54, 10–16. [Google Scholar] [CrossRef]
- Tahir, M.; Cordeiro, G.M.; Mansoor, M.; Zubair, M. The Weibull-Lomax distribution: Properties and Applications. Hacet. Univ. Bull. Nat. Sci. Eng. Ser. B: Math. Stat. 2014. [Google Scholar] [CrossRef]
- Newman, M.E. Power laws, Pareto distributions and Zipf’s law. Contemp. Phys. 2005, 46, 323–351. [Google Scholar] [CrossRef]
- Martinez-Anido, C.B.; Bolado, R.; de Vries, L.; Fulli, G.; Vandenbergh, M.; Masera, M. European power grid reliability indicators, what do they really tell? Electr. Power Syst. Res. 2012, 90, 79–84. [Google Scholar] [CrossRef]
- Bompard, E.; Wu, D.; Xue, F. Structural vulnerability of power systems: A topological approach. Electr. Power Syst. Res. 2011, 81, 1334–1340. [Google Scholar] [CrossRef]
- Pepyne, D.L. Topology and cascading line outages in power grids. J. Syst. Sci. Syst. Eng. 2007, 16, 202–221. [Google Scholar] [CrossRef]
- Guohua, Z.; Ce, W.; Jianhua, Z.; Jingyan, Y.; Yin, Z.; Manyin, D. Vulnerability assessment of bulk power grid based on complex network theory. In Proceedings of the Third International Conference on Electric Utility Deregulation and Restructuring and Power Technologies (DRPT 2008), Nanjuing, China, 6–9 April 2008; pp. 1554–1558.
- Dwivedi, A.; Yu, X.; Sokolowski, P. Analyzing power network vulnerability with maximum flow based centrality approach. In Proceedings of the 8th IEEE International Conference on Industrial Informatics (INDIN), Osaka, Japan, 13–16 July 2010; pp. 336–341.
- Pahwa, S.; Hodges, A.; Scoglio, C.; Wood, S. Topological analysis of the power grid and mitigation strategies against cascading failures. In Proceedings of the 4th Annual IEEE Systems Conference, San Diego, CA, USA, 5–8 April 2010; pp. 272–276.
- Hines, P.; Blumsack, S.; Sanchez, E.C.; Barrows, C. The topological and electrical structure of power grids. In Proceedings of the 43th Hawaii International Conference on System Sciences (HICSS), Honolulu, HI, USA, 5–8 January 2010; pp. 1–10.
- Han, P.; Zhang, S. Analysis of cascading failures in small-world power grid. Int. J. Energy Sci. 2011, 1, 99–104. [Google Scholar]
- Correa, G.J.; Yusta, J.M. Grid vulnerability analysis based on scale-free graphs versus power flow models. Electr. Power Syst. Res. 2013, 101, 71–79. [Google Scholar] [CrossRef]
- Bompard, E.; Fulli, G.; Ardelean, M.; Masera, M. It’s a Bird, It’s a Plane, It’s a... Supergrid!: Evolution, Opportunities, and Critical Issues for Pan-European Transmission. IEEE Power Energy Mag. 2014, 12, 40–50. [Google Scholar]
- Filatrella, G.; Nielsen, A.H.; Pedersen, N.F. Analysis of a power grid using a Kuramoto-like model. Eur. Phys. J. B-Condens. Matter Complex Syst. 2008, 61, 485–491. [Google Scholar] [CrossRef]
- Stott, B.; Jardim, J.; Alsaç, O. DC power flow revisited. IEEE Trans. Power Syst. 2009, 24, 1290–1300. [Google Scholar] [CrossRef]
- Akter, M.N.; Nasiruzzaman, A.; Mahmud, M.A.; Pota, H.R. Topological resiliency analysis of the Australian electricity grid with increased penetration of renewable resources. In Proceedings of the 2014 IEEE International Symposium on Circuits and Systems (ISCAS), Melbourne, Australia, 1–5 June 2014; pp. 494–497.
- Ding, M.; Han, P. Reliability assessment to large-scale power grid based on small-world topological model. In Proceedings of the International Conference on Power System Technology, Chongqing, China, 22–26 October 2006; pp. 1–5.
- Hines, P.; Blumsack, S. A centrality measure for electrical networks. In Proceedings of the 41st Annual Hawaii International Conference on System Sciences, Waikoloa, HI, USA, 7–10 January 2008; pp. 185–185.
- Blumsack, S.; Hines, P.; Patel, M.; Barrows, C.; Sanchez, E.C. Defining power network zones from measures of electrical distance. In Proceedings of the Power & Energy Society General Meeting, 2009 (PES’09. IEEE), Calgary, AB, Canada,, 26–30 July 2009; pp. 1–8.
- Wang, Y.; Zhao, J.; Zhang, F.; Lei, B. Study on structural vulnerabilities of power grids based on the electrical distance. In Proceedings of the 2012 IEEE Innovative Smart Grid Technologies-Asia (ISGT Asia), Tianjin, China, 21–24 May 2012; pp. 1–5.
- Dwivedi, A.; Yu, X.; Sokolowski, P. Identifying vulnerable lines in a power network using complex network theory. In Proceedings of the IEEE International Symposium on Industrial Electronics (ISIE 2009), Seoul, Korea, 5–8 July 2009; pp. 18–23.
- Nasiruzzaman, A.; Pota, H.; Islam, F. Complex network framework based dependency matrix of electric power grid. In Proceedings of the 21st Australasian Universities Power Engineering Conference (AUPEC), Brisbane, Australia, 25–28 September 2011; pp. 1–6.
- Nasiruzzaman, A.; Pota, H.; Anwar, A. Comparative study of power grid centrality measures using complex network framework. In Proceedings of the 2012 IEEE International Power Engineering and Optimization Conference (PEDCO), Melaka, Malaysia, 6–7 June 2012; pp. 176–181.
- Koç, Y.; Warnier, M.; Kooij, R.; Brazier, F. Structural vulnerability assessment of electric power grids. In Proceedings of the 11th IEEE International Conference on Networking, Sensing and Control (ICNSC), Miami, FL, USA, 7–9 April 2014; pp. 386–391.
- Arianos, S.; Bompard, E.; Carbone, A.; Xue, F. Power grid vulnerability: A complex network approach. Chaos Interdiscip. J. Nonlinear Sci. 2009, 19, 013119. [Google Scholar] [CrossRef] [PubMed]
- Kirschen, D.S.; Jayaweera, D.; Nedic, D.P.; Allan, R.N. A probabilistic indicator of system stress. IEEE Trans. Power Syst. 2004, 19, 1650–1657. [Google Scholar] [CrossRef]
- Chen, J.; Thorp, J.S.; Dobson, I. Cascading dynamics and mitigation assessment in power system disturbances via a hidden failure model. Int. J. Electr. Power Energy Syst. 2005, 27, 318–326. [Google Scholar] [CrossRef]
- Anghel, M.; Werley, K.A.; Motter, A.E. Stochastic model for power grid dynamics. In Proceedings of the 40th Annual Hawaii International Conference on System Sciences (HICSS 2007), Waikoloa, HI, USA, 3–6 January 2007; p. 113.
- Wang, G.Z.; Kong, X.F.; Zhu, C.Z.; Xu, J.P.; Cao, Y.J. Identification of key lines in complex power grid based on power flow entropy. In Procedings of the 2010 China International Conference on Electricity Distribution (CICED), Nanjing, China, 13–16 September 2010; pp. 1–6.
- Dwivedi, A.; Yu, X.; Sokolowski, P. Analyzing power network vulnerability with maximum flow based centrality approach. In Proceedings of the 8th IEEE International Conference on Industrial Informatics (INDIN), Osaka, Japan, 1–16 July 2010; pp. 336–341.
- Dobson, I.; Carreras, B.A.; Lynch, V.E.; Newman, D.E. Complex systems analysis of series of blackouts: Cascading failure, critical points, and self-organization. Chaos Interdiscip. J. Nonlinear Sci. 2007, 17, 026103. [Google Scholar] [CrossRef] [PubMed]
- Clauset, A.; Shalizi, C.R.; Newman, M.E. Power-law distributions in empirical data. SIAM Rev. 2009, 51, 661–703. [Google Scholar] [CrossRef]
- Pahwa, S.; Youssef, M.; Schumm, P.; Scoglio, C.; Schulz, N. Optimal intentional islanding to enhance the robustness of power grid networks. Phys. A Stat. Mech. Its Appl. 2013, 392, 3741–3754. [Google Scholar] [CrossRef]
- Trodden, P.; Bukhsh, W.A.; Grothey, A.; McKinnon, K. Optimization-based islanding of power networks using piecewise linear AC power flow. IEEE Trans. Power Syst. 2014, 29, 1212–1220. [Google Scholar] [CrossRef]
- Trodden, P.; Bukhsh, W.; Grothey, A.; McKinnon, K. MILP formulation for controlled islanding of power networks. Int. J. Electr. Power Energy Syst. 2013, 45, 501–508. [Google Scholar] [CrossRef]
- Arends, M.; Hendriks, P.H. Smart grids, smart network companies. Util. Policy 2014, 28, 1–11. [Google Scholar] [CrossRef]
- Aiello, M.; Pagani, G.A. The smart grid’s data generating potentials. In Proceedings of the 2014 Federated Conference on Computer Science and Information Systems (FedCSIS), Warsaw, Poland, 7–10 Septemebr 2014; pp. 9–16.
- Pagani, G.A.; Aiello, M. From the Grid to the Smart Grid, Topologically. Available online: http://arxiv.org/pdf/1305.0458v2.pdf (accessed on 1 May 2015).
- Siano, P. Demand response and smart grids—A survey. Renew. Sustain. Energy Rev. 2014, 30, 461–478. [Google Scholar] [CrossRef]
- Pagani, G.A.; Aiello, M. A complex network approach for identifying vulnerabilities of the medium and low voltage grid. Int. J. Crit. Infrastruct. 2015, 11, 36–61. [Google Scholar] [CrossRef]
© 2015 by the authors; licensee MDPI, Basel, Switzerland. This article is an open access article distributed under the terms and conditions of the Creative Commons Attribution license (http://creativecommons.org/licenses/by/4.0/).