3.2. Effect of Operating Parameters: Current Density and Temperature
HT-SOFCs typically display a linear
V-
I curve, which is explained considering that the 1
/Rp of their electrodes is independent of the applied current. This is due to the fact that diffusive losses (non-linear) are often negligible, and activation losses are linear due to the high operating temperature [
43]. Instead, in IT-SOFC electrodes, due to the reduced operating temperature, depending on the electrode characteristics, diffusive losses can play a major role, and also activation losses can be non-linear [
51], and actually both linear and non-linear IT-SOFC
V-
I curves are reported experimentally. In the case of the bi-layered IT-SOFC anodes under consideration, the effect of the current density is investigated in
Figure 2, which reports 1
/Rp simulation results for different applied currents and different operating temperatures.
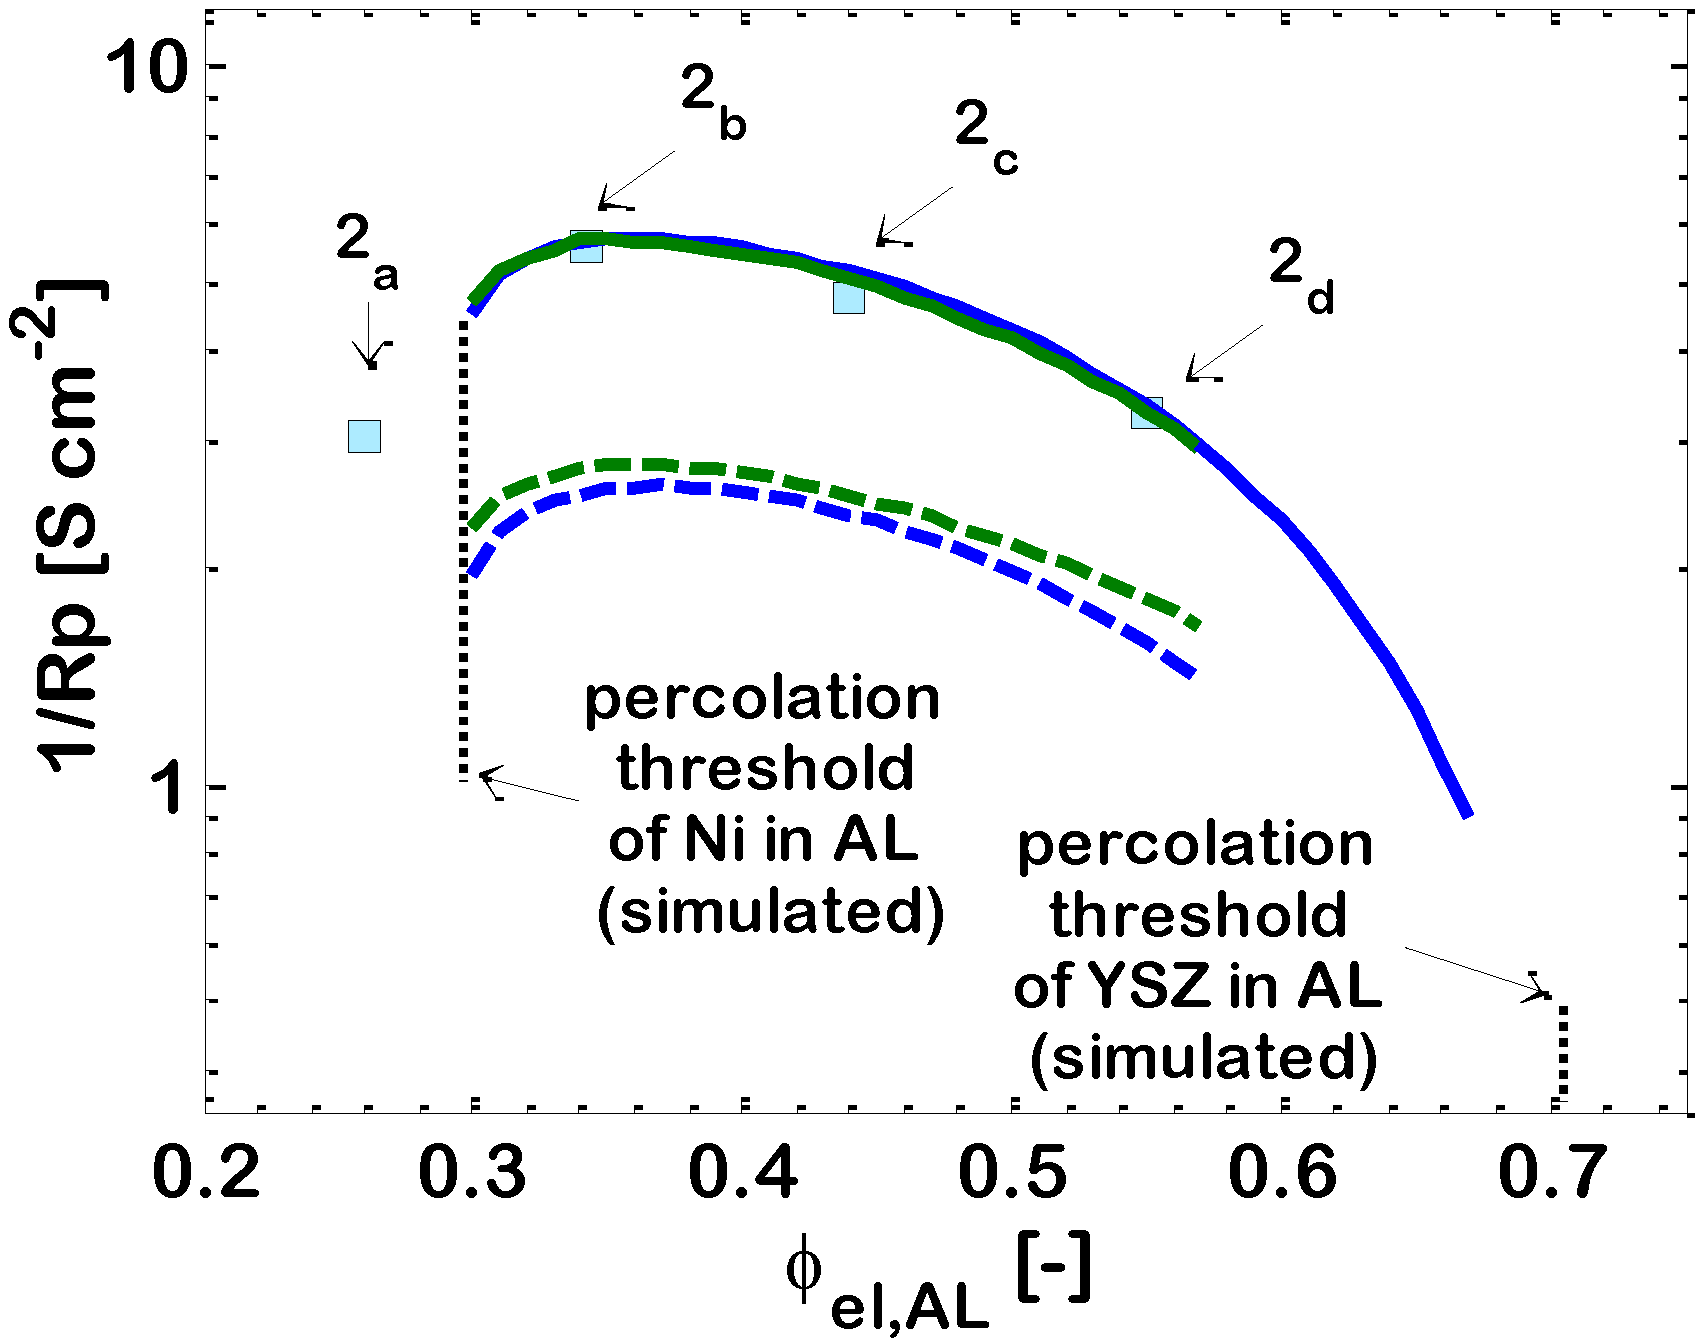
Figure 2 displays that, for the bi-layer electrode under analysis here, the simulation results indicate that the electrode 1
/Rp is practically identical for both the simulated operating currents (1 A/cm
2 and 0.5 A/cm
2), at each simulated operating temperature (973 K and 1073 K). Other simulations run for different current densities and not reported here confirm this result. This is validated by further literature experimental data collected from complete IT-SOFC cells employing anodes similar to those simulated in
Figure 2 [
50]. These literature results report
V-
I characteristic curves which clearly display that the anodic loss is a main source of cell loss, and at the same time show linear behavior up to 2 A/cm
2 and further.
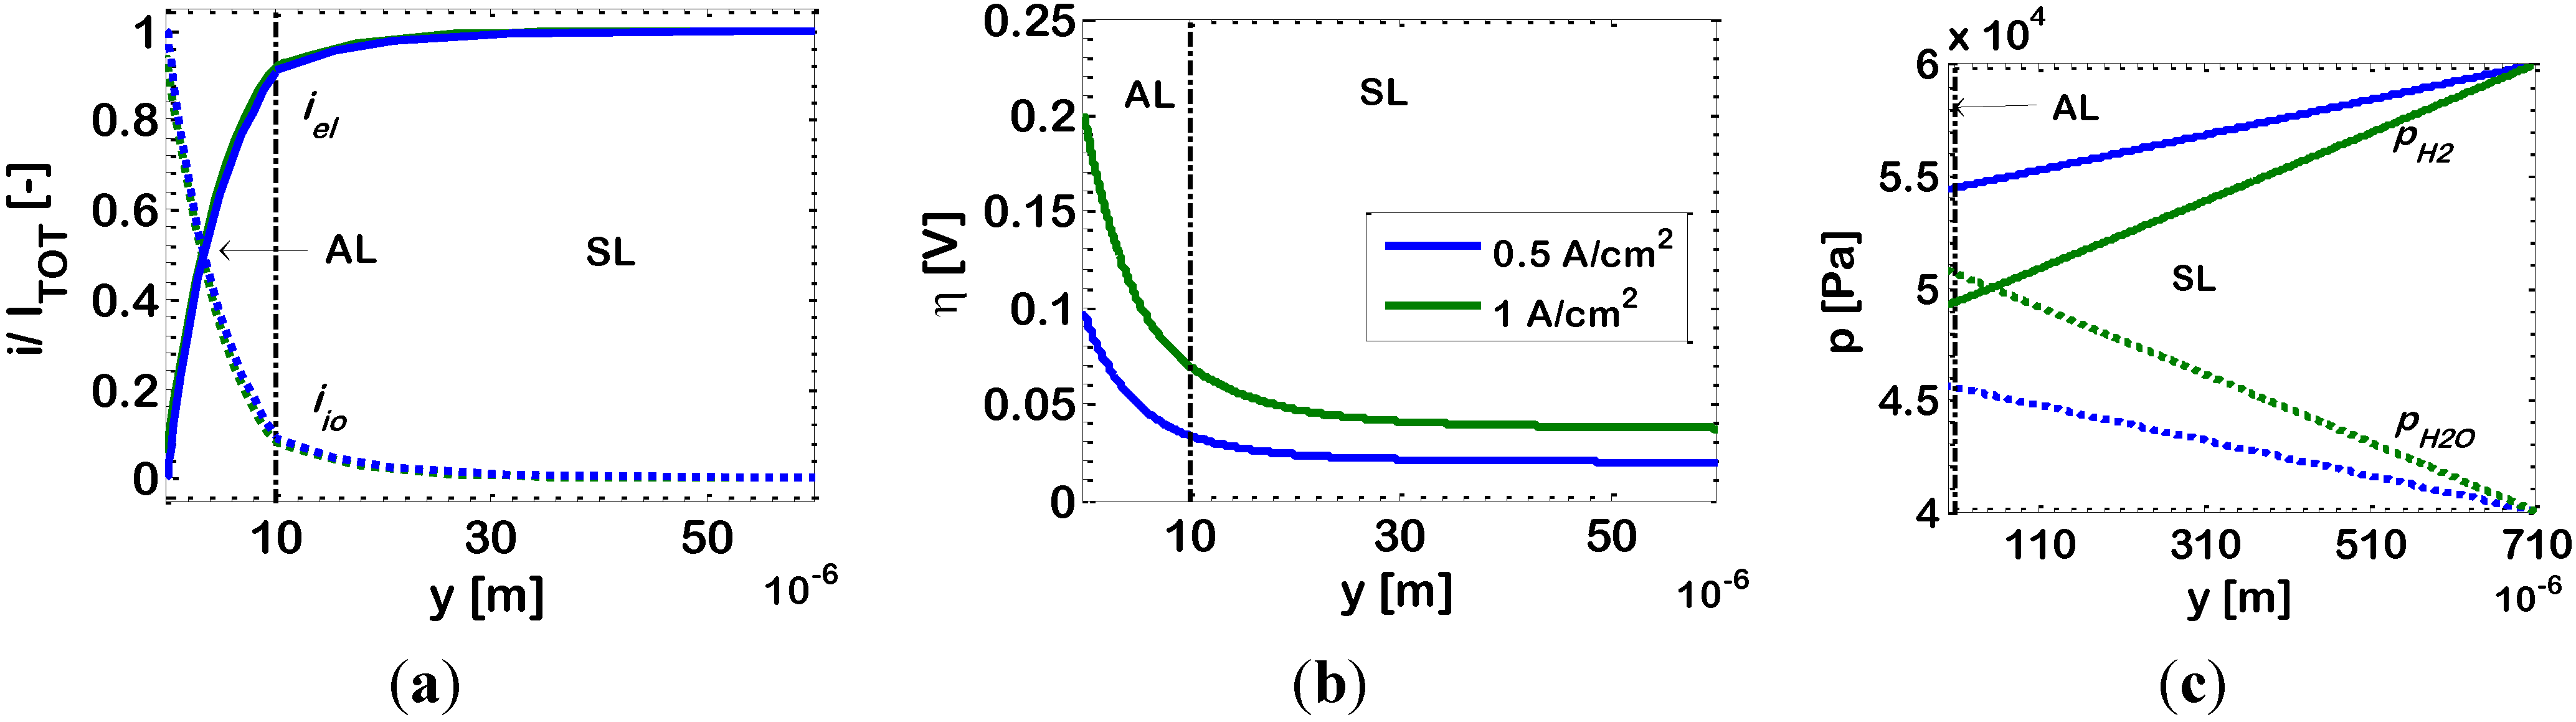
In order to explain this result, in
Figure 3 we report simulations for the distributions of dimensionless current density
i/Itot, overpotential η, and partial pressures of hydrogen (
pH2) and water (
pH2O), along the anode thickness. Simulations are performed for an AL composition 2
c (ϕ
el,AL = 0.44), temperature of 1073 K and for the operating currents already investigated in
Figure 2, namely 1 A/cm
2 and 0.5 A/cm
2. The simulated distributions of
i/Itot, η and
P are discussed further in subsequent sections of this paper (in particular,
Section 3.3.); here, we point the attention on the effects that the applied current has on the different sources of loss. Indeed, increasing the operating current density, two main effects occur at the same time, both related to the higher electrochemical reaction rate,
i.e., (i) a decrease of
pH2, coupled to an increase of
pH2O (
Figure 3c); and (ii) higher values of the overpotential η along the electrode (
Figure 3b). The previous, is a diffusion-limitation effect, which normally leads to an increase of 1
/Rp by increasing the current density (downward concavity of the
V-
I curve). The latter, is an activation effect, which normally leads to a decrease of 1
/Rp by increasing the current density (upward concavity of the
V-
I curve). Here, these two effects compensate each other and the resulting
i/Itot profile along the electrode thickness is practically identical in both cases, as displayed in
Figure 3a, and, thus, also the electrode 1
/Rp is practically identical for both currents, as displayed in
Figure 2.
Figure 3.
Bi-layered Ni-YSZ anode with Ni volumetric fraction in the AL ϕ
el,AL = 0.44 (Case 2
c). Simulation results at temperature
T = 1073 K; overall current density:
![Energies 07 05647 i001]() Itot
Itot = 1 A/cm
2, and
![Energies 07 05647 i002]() Itot
Itot = 0.5 A/cm
2: (
a) ionic (dotted lines) and electronic (solid lines) currents densities; (
b) overpotential (η); and (
c) partial pressures of hydrogen (
pH2) and water (
pH2O).
For the anode under analysis, a compensation between activation and diffusive effects leads to linear behavior; however, for sake of completeness, we remark that also different behaviors are reported in the literature for experimental bi-layered IT-SOFC anodes with characteristics different from those reported in
Table 2. Depending on the morphology and thickness of the various layers,
V-
I curves, collected from complete IT-SOFCs in case where the anode is a main source of loss, can display a visible departure from linearity, with upward concavity (typical of activation effects and more visible at low operating current densities) [
18,
52], or downward concavity (typical of diffusion limitation effects and more visible at high operating current densities) [
9]. In some cases, the
V-
I characteristic curves are very similar to those of low-temperature fuel cells, with a low-current density region with upward concavity related to activation losses, a linear intermediate region dominated by ohmic losses, and a high-current density region with downward concavity related to diffusive losses [
53,
54]. In other cases [
9], experiments run with various electrodes with increasing porosity of the anode SL show that the concavity of the
V-
I curves changes from downward to upward, confirming the relationship between microstructure, relative importance of diffusion and activation losses, and shape of the
V-
I characteristic curves.
3.3. Effect of Ni-(ZrO2)x(Y2O3)1−x Ratio in Active Layer
Figure 3 shows that, in bi-layered anodes, the electrochemical reaction takes place mainly in the AL. This is visible in particular from
Figure 3a, which shows that the ionic current
iio entering the AL at the AL/electrolyte interface (
y = 0), is quickly converted into electronic current
iel, due to the electrochemical reaction (Equation (4)). At the AL/SL interface (
y = 10 μm), the ionic current is practically zero, and the electrochemical reaction is almost complete; the EAT is about 16 μm, slightly larger than the AL. Since the electrochemical reaction occurs almost completely in the AL, the effect of the morphological and geometrical parameters of the AL on the overall electrode 1/
Rp is somehow analogous to that reported previously for single-layer electrodes [
16,
33]. In particular, the composition of the AL in terms of Ni-YSZ content needs careful design, in order to remain in the window of compositions where both the ionic and the electronic conductors percolate, and this is clearly displayed in
Figure 2, which reports the effect of varying ϕ
el in the AL, and also exhibits the simulated percolation thresholds of Ni and YSZ in the AL. From a theoretical point of view, in the case where the Ni and YSZ particles have the same dimensions, the percolation theory predicts percolation of the electronic conducting particles to occur for ϕ
el = 0.294. Our model cannot simulate an electrode with Ni volumetric fraction lower than this value, because, in this situation, our model predicts that there are no clusters of electronic conducting particles spanning though the whole AL thickness. On the contrary, the literature experimental data reported in
Figure 2 show that the real electrode with AL Ni content ϕ
el,AL = 0.26 (slightly below the percolation threshold), tested in the experimental campaign, shows satisfactory performance. This indicates an imprecision in the evaluation of the theoretical percolation thresholds through the correlations of the classical percolation theory applied to SOFC electrodes, which has already been discussed in previous papers [
33]. This imprecision can be due to a number of reasons,
i.e., (i) the correlations for the evaluation of percolation thresholds hold for a random packing of spheres with bimodal size: in reality, in the experimental electrodes, the particles are not perfectly spherical. Further, there is a particle size distribution for both the ionic and the electronic conductor, and also the average particle size is known with a certain measurement error; and (ii) in the experimental electrodes, when the ratio between the layer thickness and the particle size is below 20 (in the case under analysis, it is about 20) some short clusters of particles, which would not lead to percolation in thick electrodes, can nevertheless span throughout the whole layer. As a consequence, the variation of properties across the percolation threshold is smooth, instead of being sharp. The consequences of this imprecision in the evaluation of percolation thresholds are expected to be significant only in a narrow range of compositions around the percolation thresholds themselves.
As displayed in
Figure 2, the percolation theory predicts the percolation threshold of YSZ to occur for ϕ
el = 0.706 (
i.e., ϕ
io = 0.294), but, unluckily, no experimental data are available to confirm this result. Instead, other simulation results reported in
Figure 2 are confirmed by the available experimental data, and show that the 1
/Rp values obtained for compositions intermediate between the two percolation thresholds are very satisfactory for IT-SOFC applications. The behavior of 1
/Rp versus ϕ
el,AL is qualitatively similar to that reported previously for Pt-YSZ single-layer HT-SOFC electrodes [
55]. In particular,
Figure 2 shows that a maximum is obtained around Point 2
b (ϕ
el,AL = 0.34) for a Ni content in the AL about 10% higher than the theoretical percolation threshold; a similar finding was previously obtained also for single-layer HT-SOFC electrodes [
55].
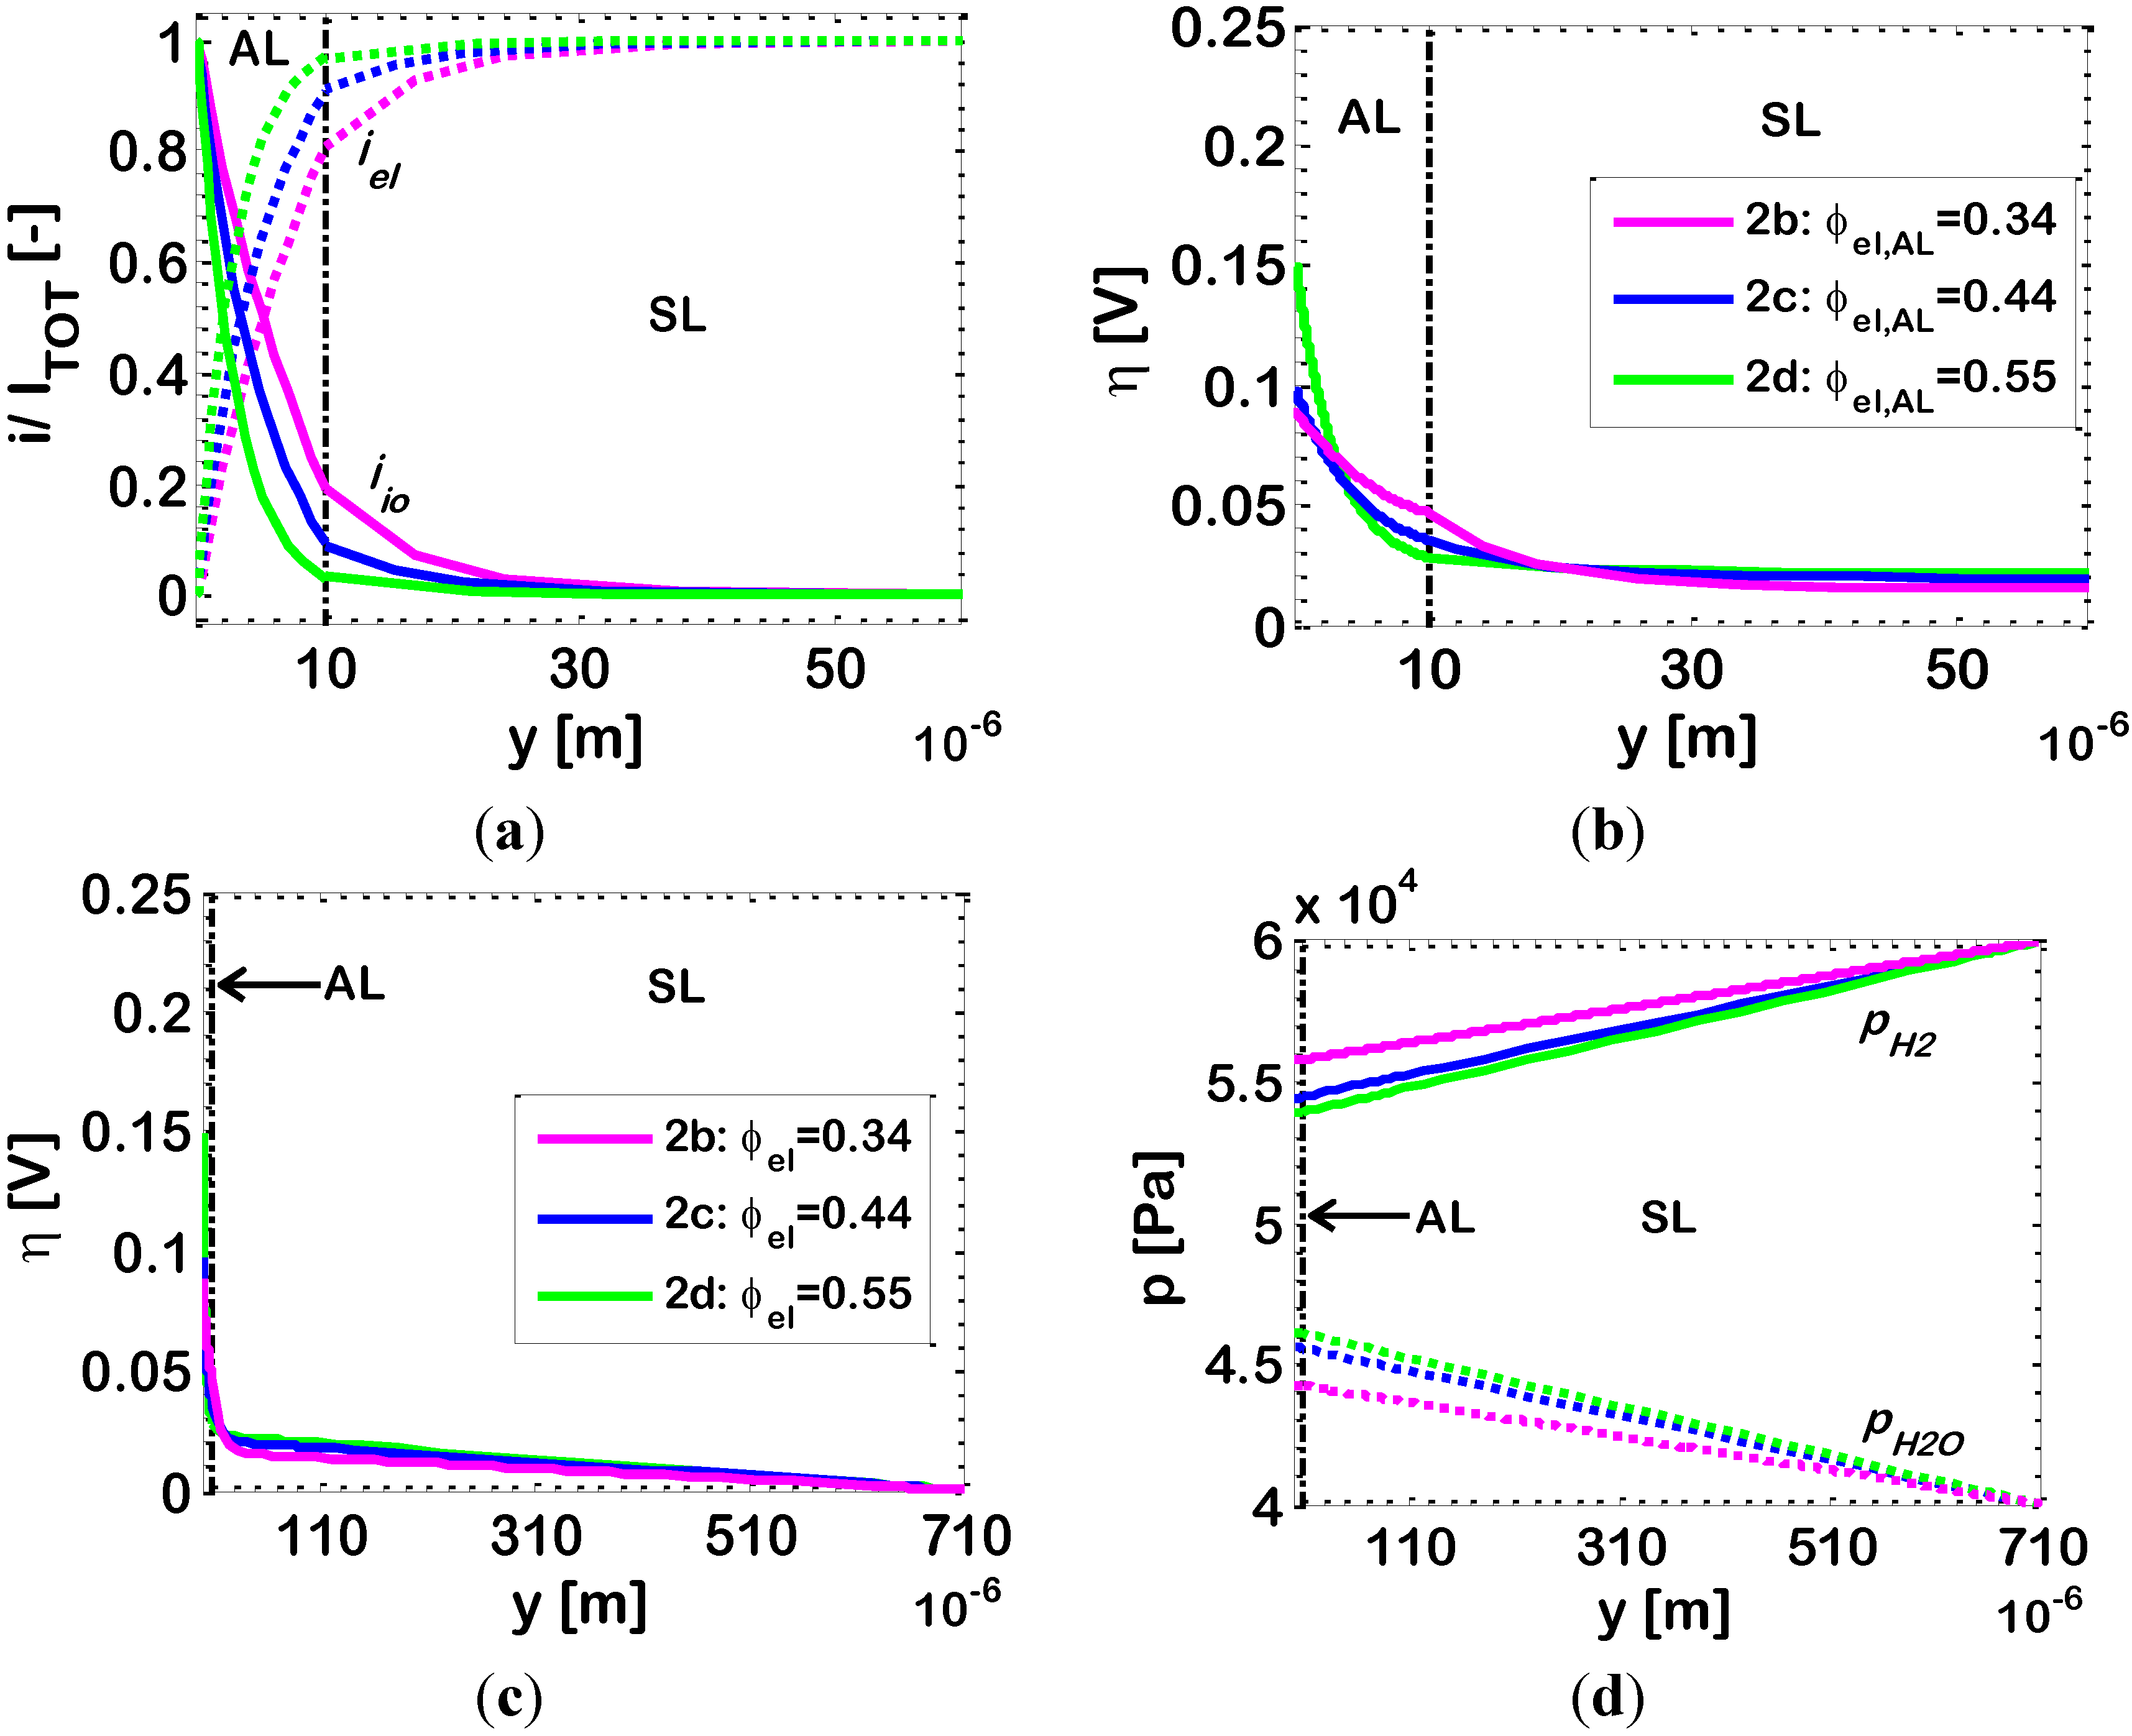
In
Figure 4, we investigate this in further detail by analyzing the simulated distributions of dimensionless current density
i/Itot, overpotential η and partial pressures of hydrogen (
pH2) and water (
pH2O) along the electrode thickness. We simulate three different AL compositions corresponding to the Points 2
b, 2
c, and 2
d highlighted in
Figure 2. For these simulations, we assume a current density of 0.5 A/cm
2.
Figure 4.
Bi-layered Ni-YSZ anodes at temperature
T = 1073 K (other data in
Table 2). Varying parameter: Ni volumetric fraction in the AL (ϕ
el,AL). Simulated distributions along the electrode thickness of: (
a) ionic (
iio) and electronic (
iel) currents; (
b,
c) overpotential (η); and (
d) partial pressures of hydrogen (
pH2) and water (
pH2O).
As already remarked, the results show that in all cases the electrochemical reaction occurs mostly in the AL (
Figure 4a), with the SL providing mainly a path for the electronic current from the AL to the current collector, while accomplishing its primary function of mechanical support for the whole fuel cell. In our simulations, the composition of the SL is within the percolation thresholds of both Ni and YSZ, so that, in principle, some electrochemical reaction might occur also in the SL. Indeed, our simulations show that this actually takes place for the AL composition 2
b (ϕ
el,AL = 0.34), within the first 20–30 m of SL thickness adjacent to the AL, while, for the other AL compositions, practically no electrochemical reaction occurs in the SL (the simulated EAT values are reported in
Table 3). This latter result is due to the fact that at typical IT-SOFC operating temperatures (here, 1073 K) the bulk YSZ ionic resistivity is of the order of ≈5 × 10
−3 Ω·cm (from the data in
Table 2, [
40]), which is several orders of magnitude higher than the bulk Ni electronic resistivity (≈5 × 10
−9 Ω·cm,
Table 2). As a consequence, the oxygen ions entering the AL, face a very high resistance in their path along the ionic conductor, and this forces them to react electrochemically with hydrogen (Equation (4)) within a short thickness of the AL. In the light of these considerations, the lower the effective ionic resistivity of the AL, the thicker the layer where the electrochemical reaction takes place, which might eventually lead to an extension of the electrochemical reaction into the SL. In turn, as already remarked in
Section 2, the effective ionic resistivity of the AL strongly depends on its YSZ content, and it is lower for high YSZ volumetric fractions (corresponding to low Ni volumetric fraction: Case 2
b, where ϕ
el = 0.34, is about 10% above the Ni percolation threshold).
Table 3.
Simulated 1/Rp, electrochemically active thickness (EAT) and effective electronic and ionic resistivities of the AL, for three different Ni-YSZ compositions, at 1073 K.
Table 3.
Simulated 1/Rp, electrochemically active thickness (EAT) and effective electronic and ionic resistivities of the AL, for three different Ni-YSZ compositions, at 1073 K.
| AL | 2b | 2c | 2d |
|---|
| ϕel,AL (-) | 0.34 | 0.44 | 0.55 |
| ρeffio,AL (Ω·cm) | 156 | 294 | 856 |
| ρeffel,AL (Ω·cm) | 0.02 | 2.3 × 10⁻³ | 7.6 × 10⁻⁴ |
| EAT (μm) | 26 | 16 | 9 |
| 1/Rp (S·cm−2) | 5.97 | 5.18 | 3.34 |
The results reported in
Table 3 show that there is a correlation between the effective ionic resistivity ρ
effio,AL of the AL, the EAT and the electrode 1/
Rp in the range of AL compositions taken into consideration (2
b–2
d): the lower ρ
effio,AL, the larger the EAT and 1/
Rp. This finding is in agreement with the results reported by [
36] for single-layer SOFC electrodes. However,
Figure 2 shows that a further reduction of Ni content of the AL below that of Case 2
b, leads to a decreased 1/
Rp. In this latter case, the effective ionic conductivity increases over that of Case 2
b, but a significant reduction of the active area
A available for the electrochemical reaction (which tends to zero at the percolation thresholds) occurs, increasing activation losses and decreasing 1/
Rp. Thus, the correlation between the effective ionic resistivity ρ
effio,AL of the AL and the electrode 1/
Rp demonstrated by
Table 3, does not hold for compositions very close to the percolation thresholds.
The profile of electrode overpotential η, displayed in
Figure 4b,c, is qualitatively similar in Cases 2
c and 2
d, while a slightly different behavior is reported for Composition 2
b. Indeed,
Figure 4b shows that, for Compositions 2
c and 2
d, the profile of overpotential η at the AL/SL interface does not change slope (
i.e., the first order derivative of η is continuous), while for Composition 2
b, a change in slope is visible (
i.e., the first order derivative of η has a discontinuity). From a mathematical (and physical) point of view, this is due to the boundary conditions at the AL/SL boundary (Equation (11)): the electronic and ionic currents
iel and
iio must be unchanged across the AL/SL boundary. The derivative of η, which is (from Equation (1)):
is, thus, discontinuous across the AL/SL interface, due to the change in morphology and, thus, in effective resistivity ρ
effio and ρ
effel from the AL to the SL. In Cases 2
c and 2
d, being
iio close to zero at the AL/SL interface, and also being ρ
effel very small in both the AL and SL layers, the slope of the curve representing η in
Figure 4b is close to zero as well, and no change of slope is visible across the AL/SL interface. On the contrary, in Case 2
b, as already remarked, a relevant part of the electrochemical reaction takes place within the SL, and
iio is significant at the AL/SL interface. Thus, the change in ionic resistivity ρ
effio across the AL/SL interface results in a marked discontinuity of the slope of η.
Additionally,
Figure 4b shows that in Case 2
b, the extension of the
EAL into the electrode thickness is related to a smoother profile of η compared to the other Cases 2
c and 2
d. In turn, this is related to a lower value of the overall electrode overpotential η
tot and to the already discussed higher value of 1/
Rp.
Figure 4c shows that, in all cases, the overpotentials vary linearly in the SL, since here, as already discussed, only ohmic electronic conduction along the percolating clusters of Ni particles occurs.
Figure 4c shows that, in the SL, η values are not completely negligible; however, the related electrochemical reaction rate is negligible, since the active area for the electrochemical reaction
A is very small due to the relatively large size of the particles employed in the SL (
r = 0.5 μm). As already remarked in the discussion of
Figure 4a, the electrochemical reaction rate is significant only in the AL, where values of η in the range 0.03–0.16 V, are associated to a large active area
A due to the small size of the AL particles (
r = 0.25 μm).
Profiles of hydrogen/water partial pressure in Cases 2
b, 2
c and 2
d are reported
Figure 4c, showing again practically identical results in Cases 2
c and 2
d, and a different behavior in Case 2
b. Again, the difference is explained considering that in Cases 2
c and 2
d the electrochemical reaction occurs mostly in the AL, while in Case 2
b it is shifted towards the SL. In addition, it must be kept in mind that the AL has smaller particles, and thus smaller pores (Equation (7)) than the SL, resulting in slower diffusion (Knudsen diffusivity is the limiting diffusivity in the AL). As a result, if the electrochemical reaction occurs close to the AL/electrolyte interface (Cases 2
c and 2
d), then the water generated by the electrochemical reaction tends to remain entrapped into the AL itself, hindering also the access to hydrogen. On the contrary, if the electrochemical reaction is shifted towards the AL/SL interface, or even into the SL (Case 2
b), then diffusion of water and hydrogen to/from the SL/current collector (=gas distributor) interface is expedited. This is the reason why, in Cases 2
c and 2
d, the partial pressure of water (
pH2O) in the AL is higher than in Case 2
b and, symmetrically, the partial pressure of hydrogen (
pH2) is lower.
Figure 4c shows that this holds also for the SL. As a final remark, in the SL, for 30 μm <
y < 710 μm, the fluxes of hydrogen and water are sidentical in all the three cases, because they are associated to the overall current density
Itot, which is the same. These identical fluxes are related to different profiles of hydrogen and water partial pressures (
Figure 4c), and this is explained by considering that diffusivities are different as well, since Knudsen diffusivities have an impact also in the SL, and H
2 and H
2O Knudsen diffusivities are different from each other (
). Thus, in Case 2
b, where the partial pressure of water (
pH2O) is the lowest and, symmetrically, the partial pressure of hydrogen (
pH2) is the highest, the effective diffusivity of the gaseous mixture is the highest, and the partial pressure profiles are flatter (Equation (6)).
3.4. Effect of Active Layer Thickness
Considering bi-layer electrodes with the characteristics reported in
Table 2,
Figure 5 shows simulation results investigating the effect of an increase of the AL thickness above 10 μm (ALs with thickness below 10 μm have received little attention from an experimental point of view). In principle, an increase of the AL thickness is expected to affect adversely the various sources of loss. Ohmic and diffusive losses are expected to increase due to an increase of the length of the charge conducting and gas diffusion paths. On the contrary, activation losses are expected to decrease due to an extension of the thickness available for the electrochemical reaction. The effect of an increase of the AL above values of 10 μm, up to 50–60 μm, was investigated experimentally by several literature studies. Some experimental results from the literature, obtained from the EIS technique [
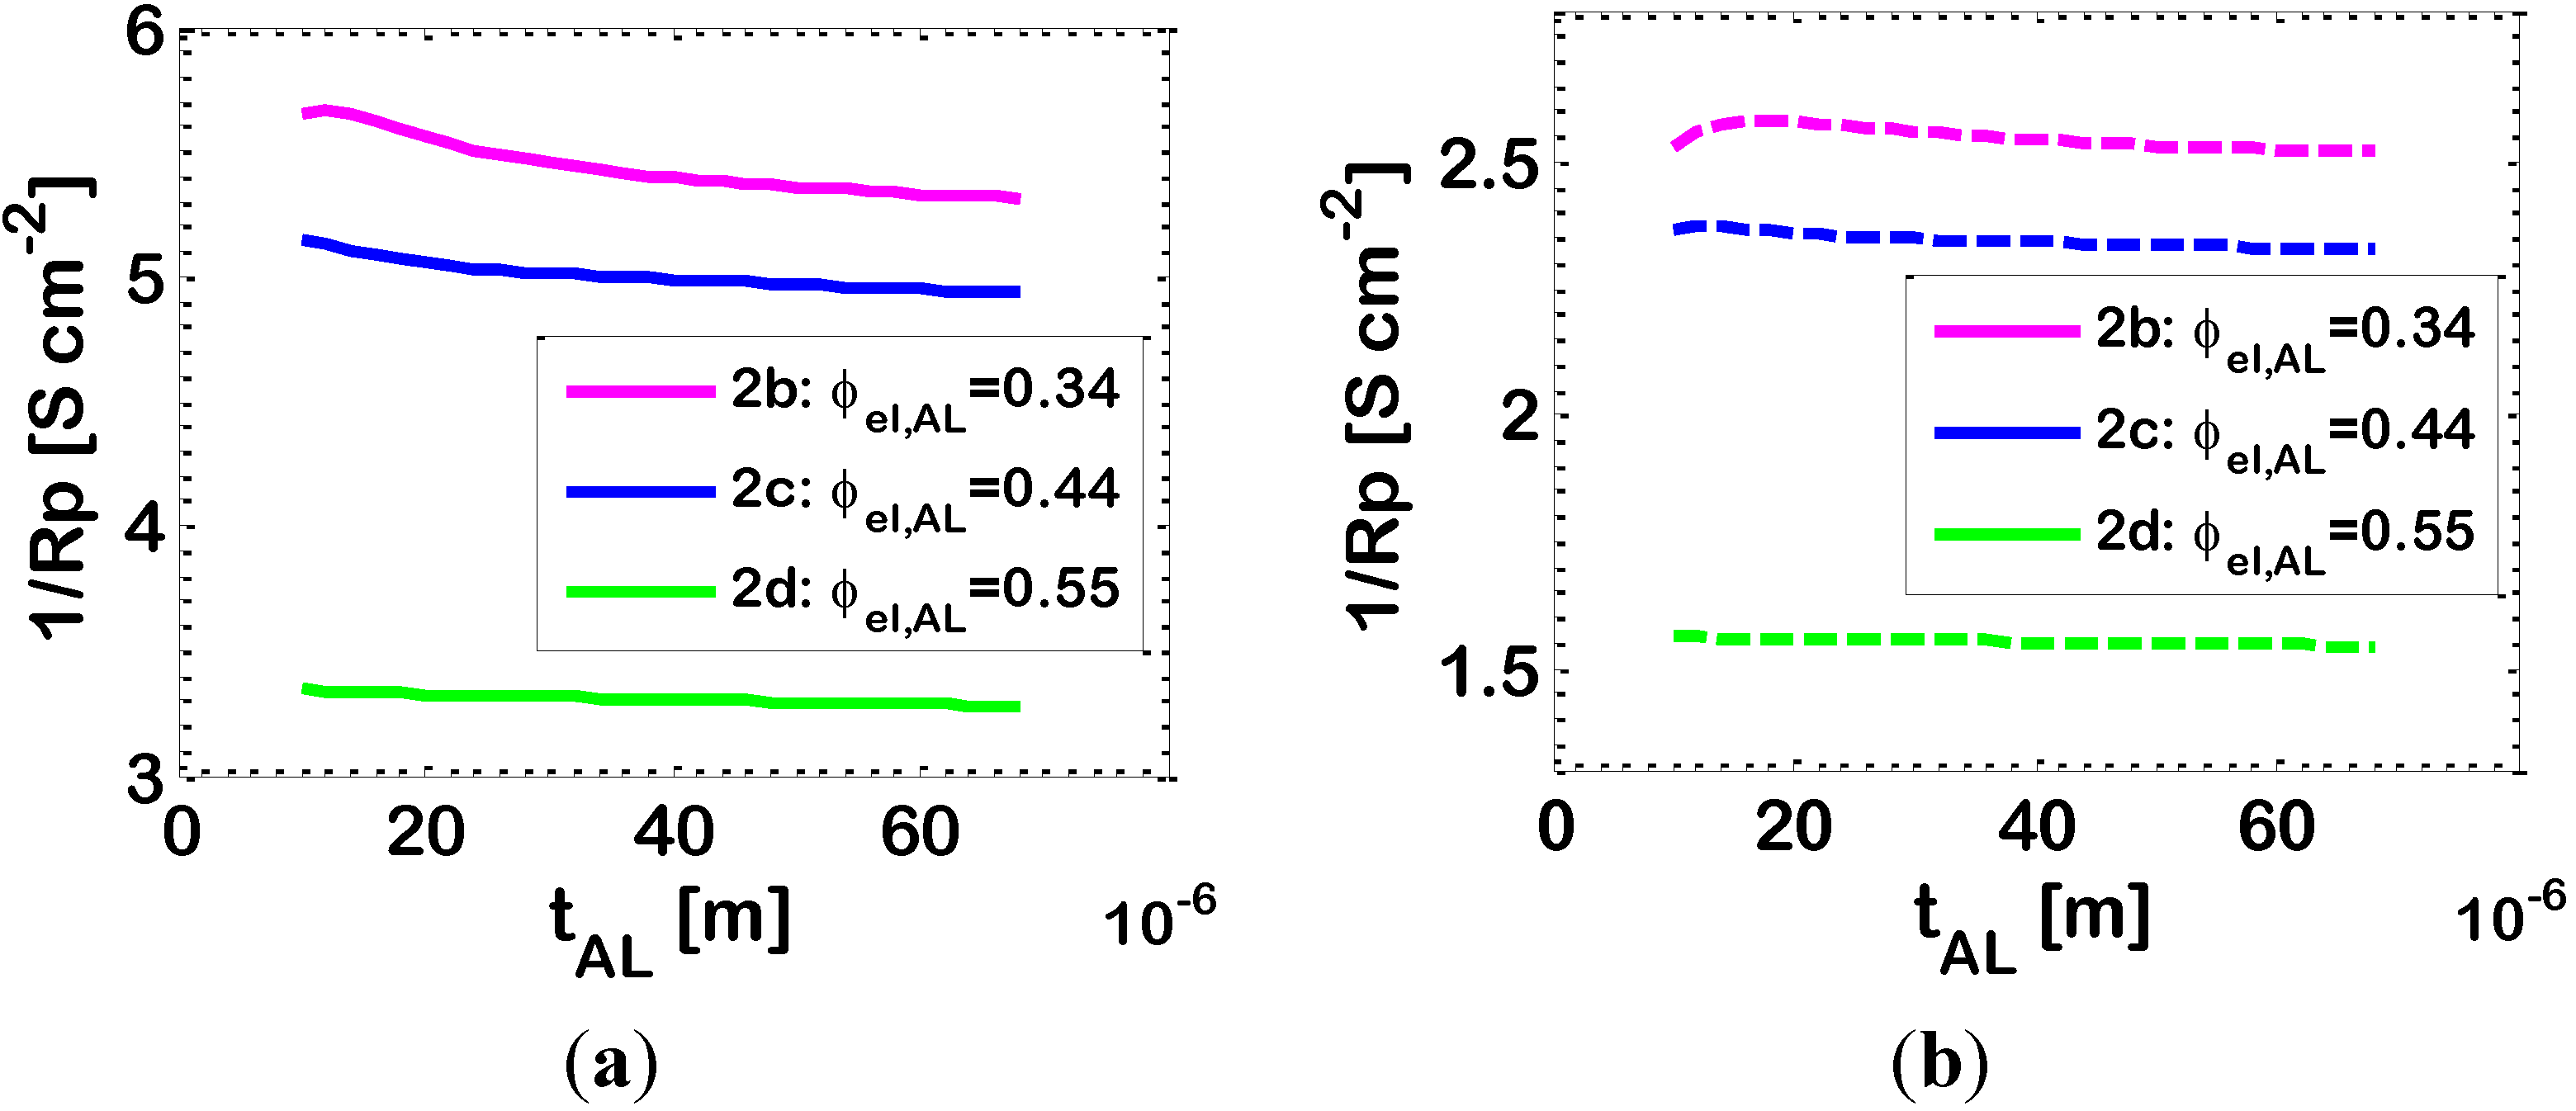
52], report no influence from this parameter, and explain this effect as a consequence of a compensation between reduced activation losses and increased diffusive losses. Our simulation results are displayed in
Figure 5 for the three AL Compositions 2
b, 2
c and 2
d, defined in
Figure 2. In particular,
Figure 5 displays a well visible plateau for composition 2
d (ϕ
el,AL = 0.55), which agrees qualitatively well with the literature experimental data discussed above.
Figure 5.
Effect of AL thickness on the 1/
Rp of bi-layered Ni-YSZ anodes (data in
Table 2). Varying parameter: Ni volumetric fraction in the AL (ϕ
el,AL). Simulations at temperature: (
a)
T = 1073 K; and (
b)
T = 973 K.
Figure 5.
Effect of AL thickness on the 1/
Rp of bi-layered Ni-YSZ anodes (data in
Table 2). Varying parameter: Ni volumetric fraction in the AL (ϕ
el,AL). Simulations at temperature: (
a)
T = 1073 K; and (
b)
T = 973 K.
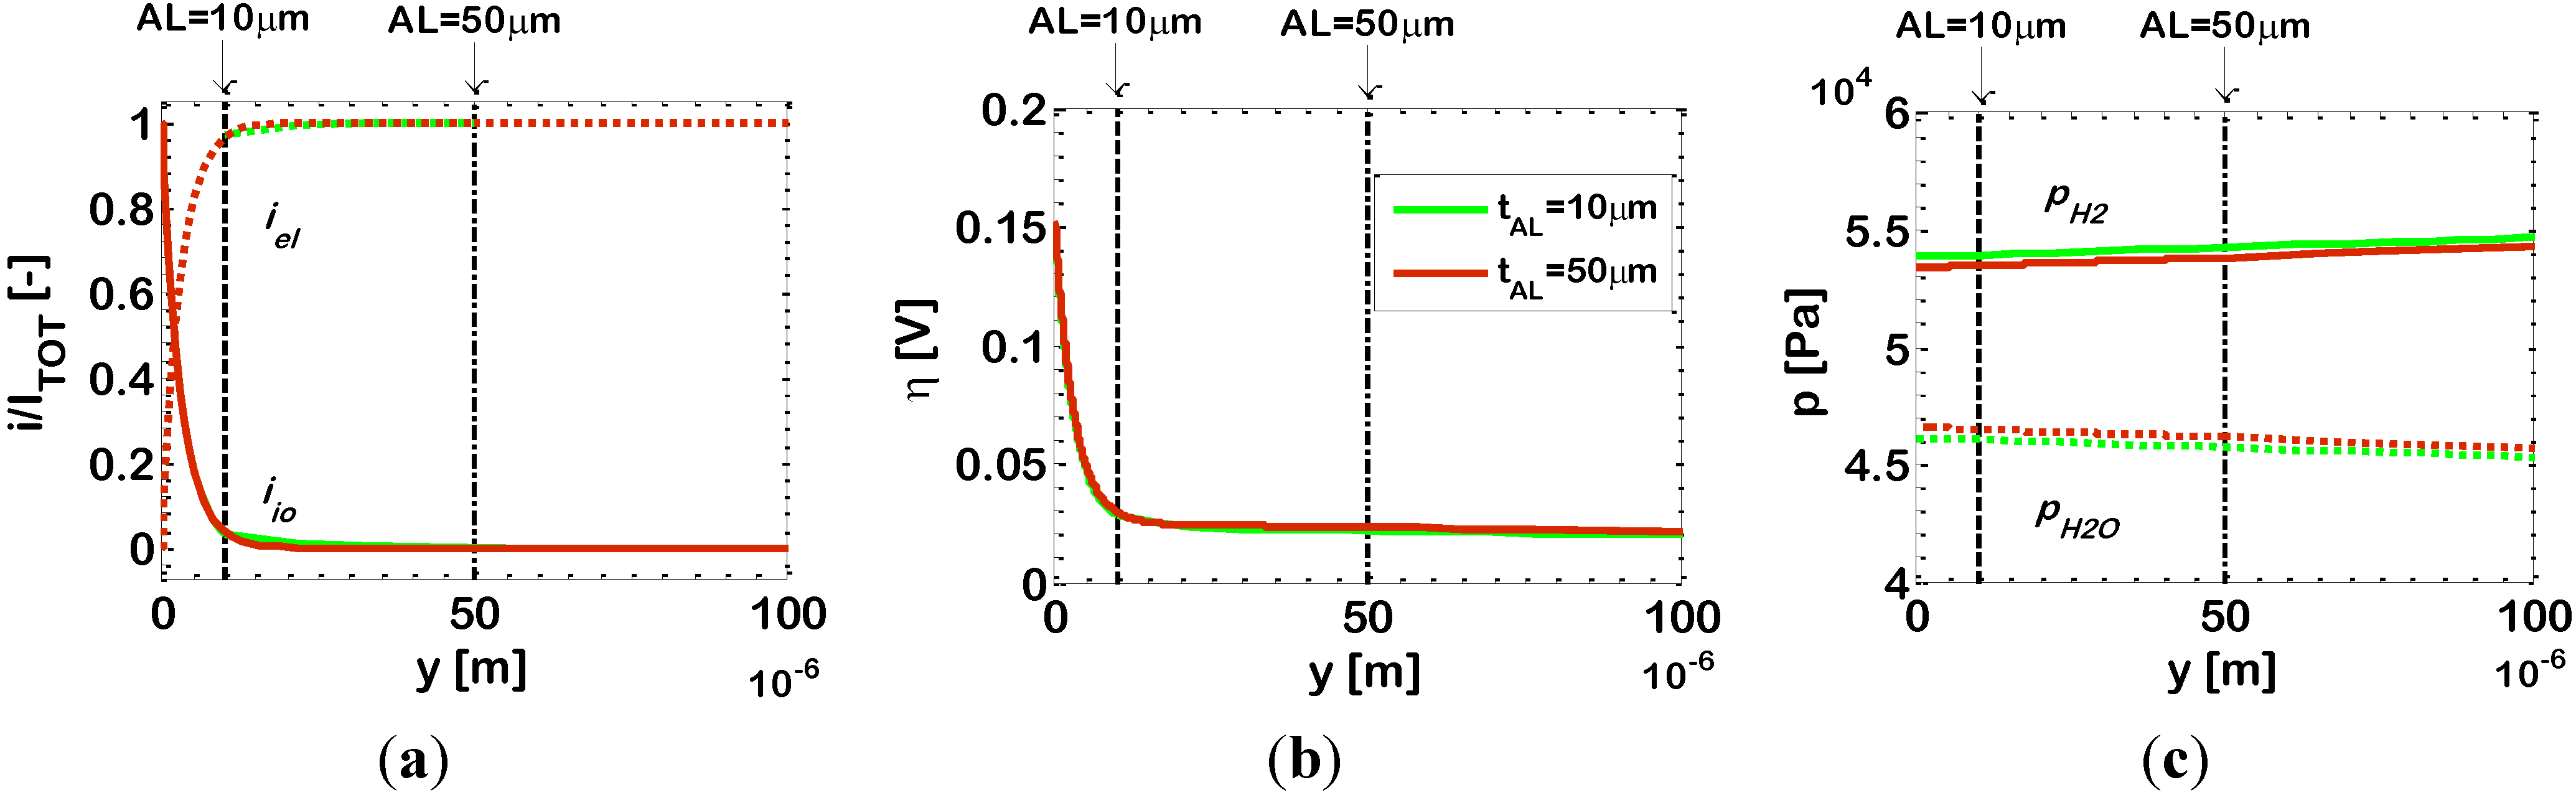
In order to investigate further this behavior, in
Figure 6 we report the simulated distributions of dimensionless current density
i/Itot, overpotential η and partial pressures of hydrogen (
pH2) and water (
pH2O) along the electrode thickness for two different bi-layered electrodes with different AL thicknesses (10 μm and 50 μm), with ϕ
el,AL = 0.55 and operating at
T = 1073 K. The results for
tAL = 10 μm and 50 μm are plotted in the same figures, and in both cases the
y co-ordinate has its origin located at the AL/electrolyte interface.
Figure 6a displays an enlargement of the AL, showing that, for both ALs (10 μm and 50 μm), the distributions of current density
i/Itot are superimposed; the EAT is the same,
i.e., about 9 μm adjacent to the E/E interface. Indeed, as already remarked, the width of the EAT is related to the effective ionic resistivity ρ
effio of the AL, and an increase of the AL thickness does no bring any changes: it is only an additional AL portion where conduction of electrons on the Ni clusters occurs with no electrochemical reaction. We also investigate the distributions of hydrogen and water partial pressures, which again are very close to each other with both the ALs under consideration (
Figure 6c). The results show just a slightly lower
pH2 and higher
pH2O in the case of 50 μm AL, explained by the increased diffusion length. In this scenario, obviously also the distribution of the overpotential η along the electrode thickness is the same for both ALs (10 μm and 50 μm), which is reported in
Figure 6b, and also the value of 1/
Rp is the same, as displayed in
Figure 5.
Figure 6.
Bi-layered Ni-YSZ anodes at temperature
T = 1073 K; Ni volumetric fraction in the AL ϕ
el,AL = 0.55 (Case 2
d). Other data reported in
Table 2. Varying parameter: AL thicknesses:
tAL = 10 μm and 50 μm. Simulated distributions along the electrode thickness of: (
a) ionic (
iio) and electronic (
iel) currents; (
b) overpotential (η); and (
c) partial pressures of hydrogen (
pH2) and water (
pH2O).
Thus, our simulation results for ϕel,AL = 0.55 are in agreement with literature data reporting that an increase of the AL thickness over 10 μm is practically non-influential, but the explanation we propose for this behavior is different from that reported in the literature, since simulation results show that increase of the AL thickness does not modify any of the sources of losses, neither activation nor diffusive.
The literature reports also slightly different results for electrodes with different characteristics. For example, some literature studies [
54], based on the experimental evaluation of
V-
I characteristic curves of full scale IT-SOFCs deploying bi-layer anodes, demonstrate a decrease of the overall anode 1/
Rp when increasing the anode AL thickness, and this is explained as a result of diffusive losses being more sensitive to a variation of the AL thickness than the other sources of losses. This is captured, in our simulations, in a qualitative manner, by the results displayed in
Figure 5 by the curves for Composition 2
c (ϕ
el,AL = 0.44), which show a slight decrease of 1/
Rp when increasing the anode AL thickness. Actually, in this case, the slight increase of diffusion limitations by increasing the AL thickness, demonstrated in
Figure 6c, becomes more effective.
Further, some other literature works [
18,
56] report for 1/
Rp an increase up to AL thicknesses in the order of 15 μm, followed by a decrease. This is consistent with experimental literature data for single-layer HT-SOFC electrodes [
57], and is captured, in our simulations, by the results in
Figure 5, curves with ϕ
el,AL = 0.34 (Case 2
b), which show a maximum for an AL thicknesses in the order of 15 μm. Here, the scenario is slightly different, because the ionic conductivity of the AL is more than five times higher than in the case with ϕ
el,AL = 0.55, and thus the EAT is significantly larger (26 μm, from
Table 3). As a consequence, an increase of the thickness of the AL from 10 μm to 15 μm brings an improvement of the electrode microstructure, and thus increases of the active area available for the electrochemical reaction
A, exactly where the major part of the electrochemical reaction takes place, and this leads to an increase of 1/
Rp. In
Figure 5, the decrease displayed by the simulation results for
tAL > 15 μm, is due, again, to an increase of diffusion limitations.
3.5. Effect of Active Layer Particle Dimensions
Usually, AL particles are quite small (
Table 1), because this region is devoted to the electrochemical reaction, which is enhanced in presence of a large active area
A, which is obtained with small particles rather than with large ones.
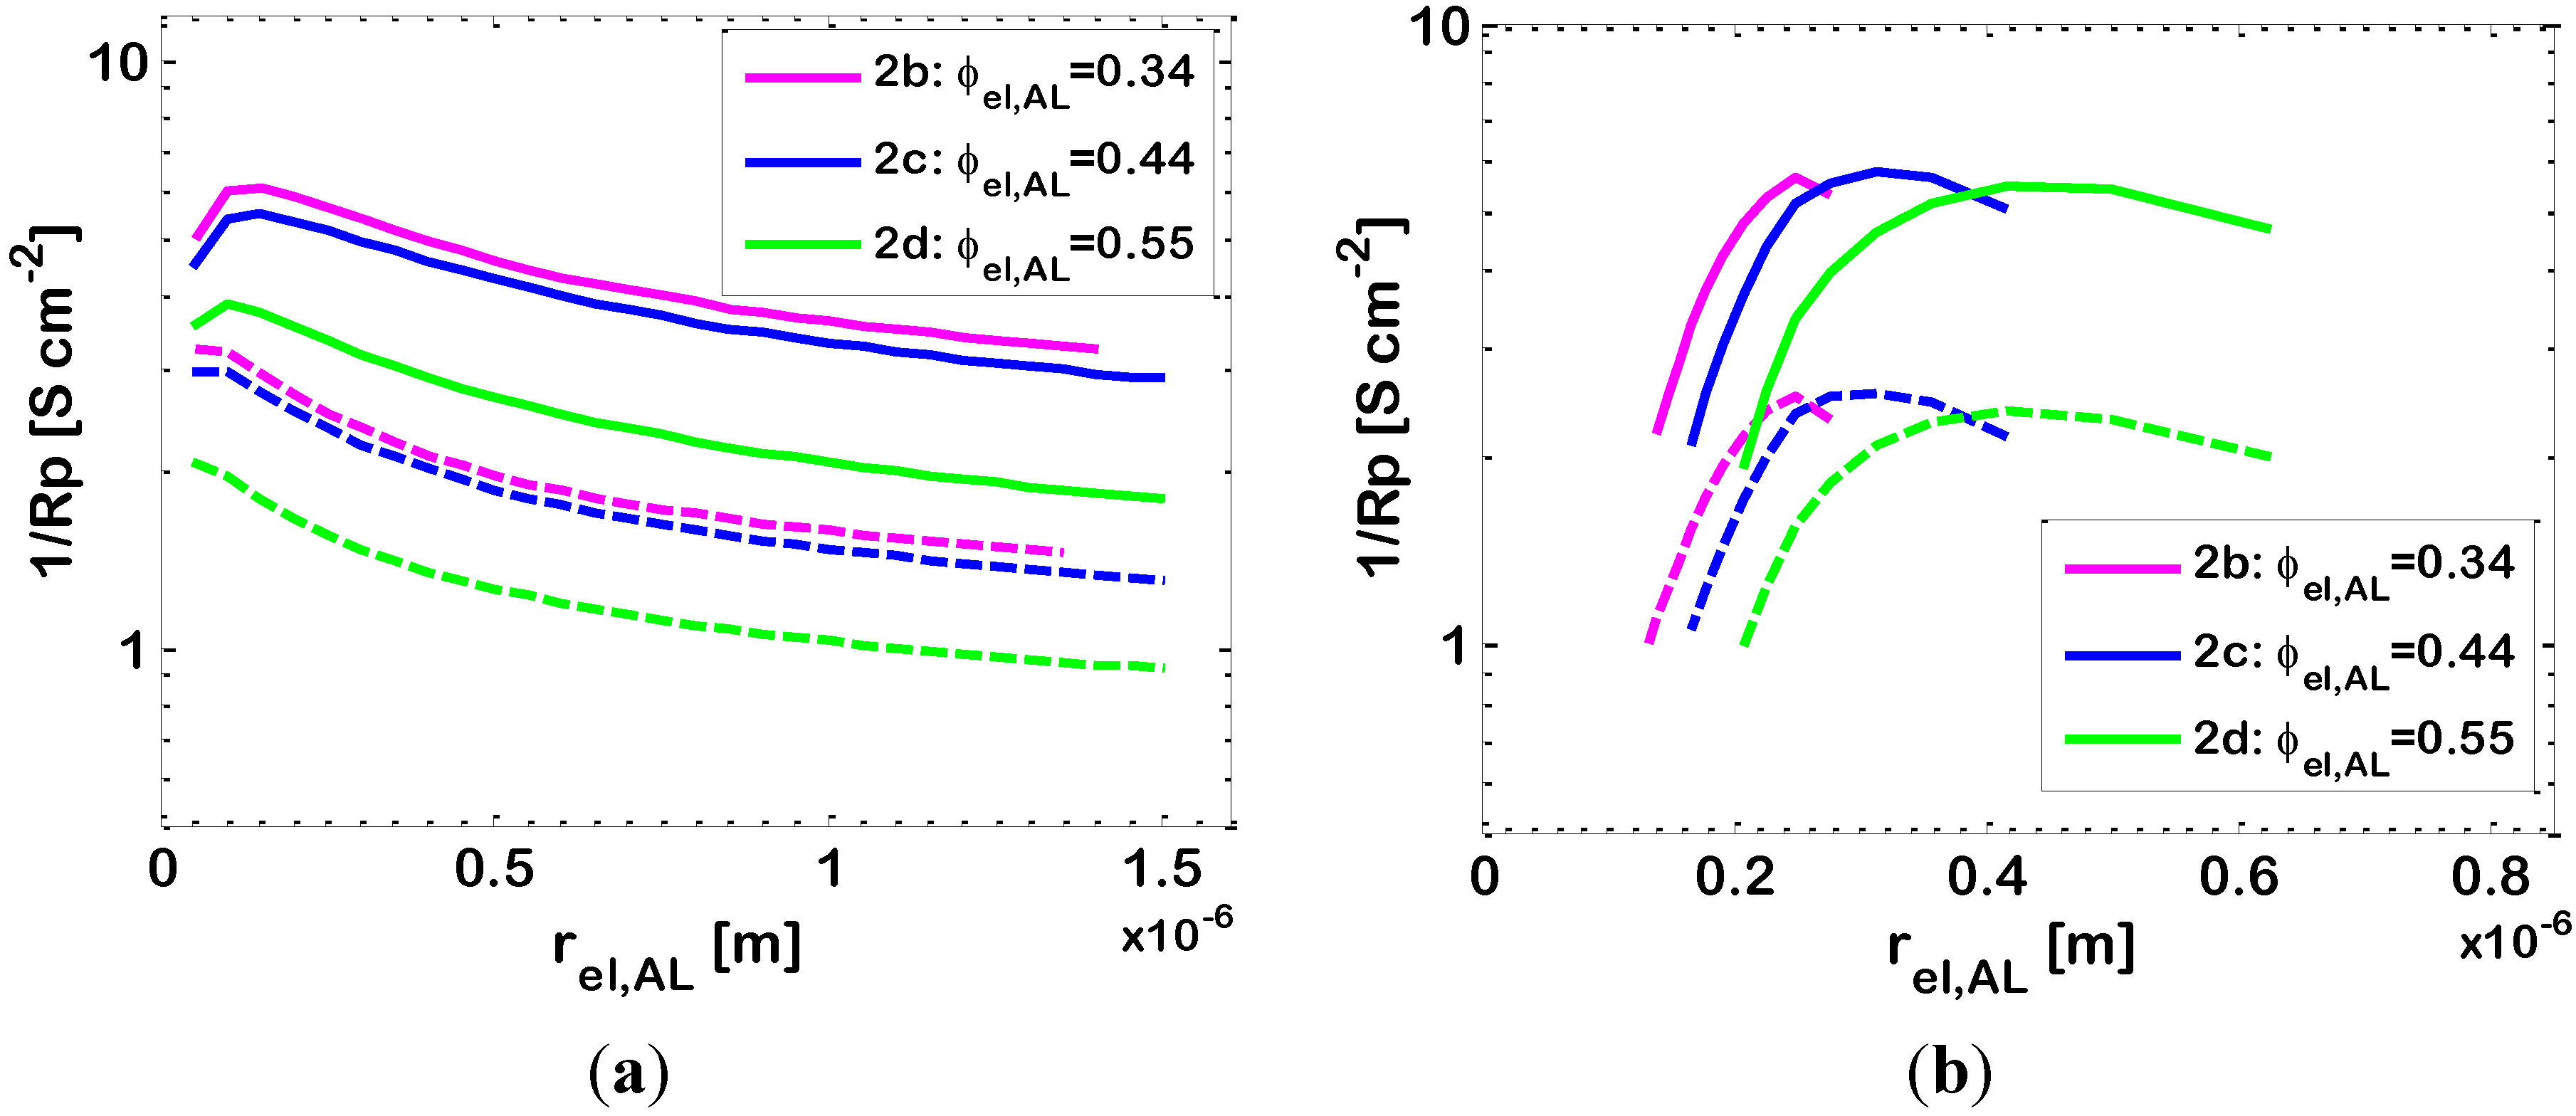
In a first simulation, we analyze the electrode behavior with AL particle radii in the range 0.1–1.5 μm, considering the ionic and electronic particle radii identical (
). Simulations are run at temperatures
T = 973 K and 1073 K; all the other parameters have the values reported in
Table 2. The simulation results are reported in
Figure 7a, which shows a maximum of 1/
Rp for particle radii of 0.2–0.3 μm, which is a trade-off between the effect of diffusive losses (which are relevant for particles with radius smaller than 0.1–0.2 μm: the smaller the particles, the smaller the AL pores, which decreases Knudsen diffusivities) and activation losses (which are relevant for large particle radii, since the active area for the electrochemical reaction
A is reduced).
Figure 7.
Effect of AL Ni particle radius
rel,AL on the 1
/Rp of bi-layered Ni-YSZ anodes. Temperatures:
T = 973 K (dashed lines) and
T = 1073 K (solid lines); other data in
Table 2. Varying parameter: Ni volumetric fraction in the AL (ϕ
el,AL). Simulations results: (
a)
rio is varied together with
rel so that
rio = rel (
p = 1); and (
b)
rio is kept at the constant value of 0.25 μm through all the simulations.
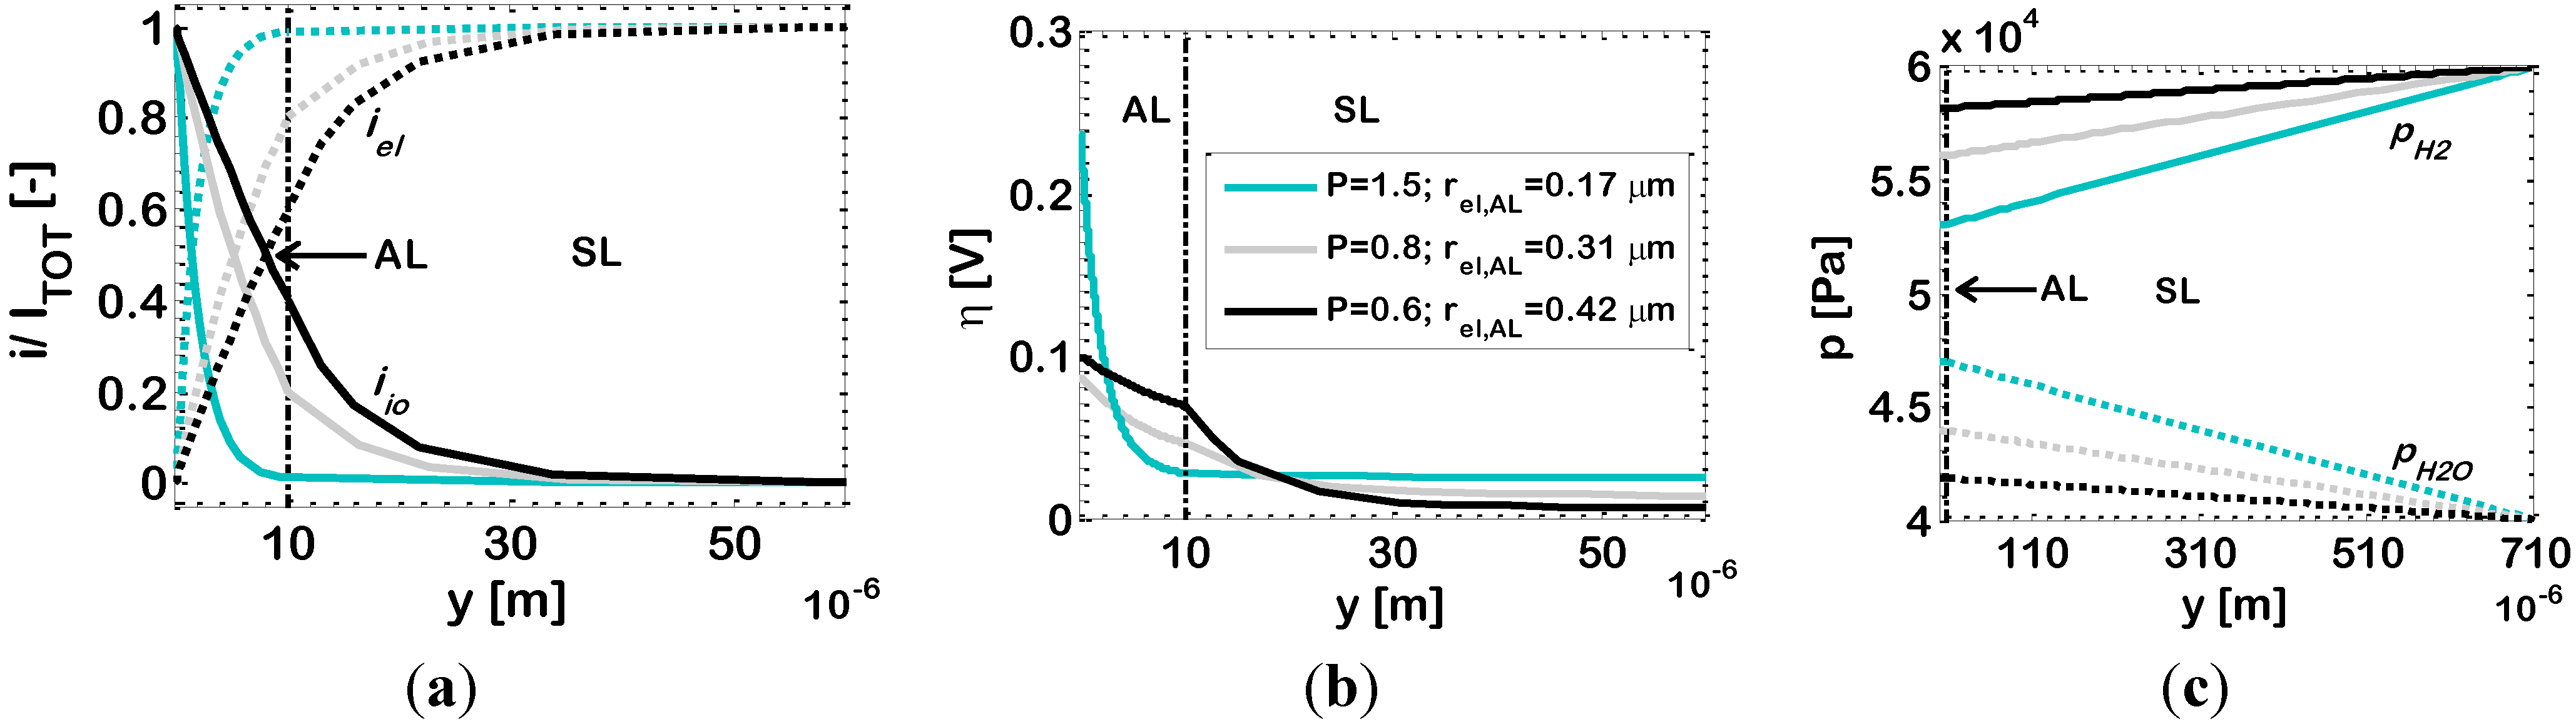
We also investigate the case where the ionic and electronic conducting particles of the AL have different size. In particular, we analyze the effect of employing Ni particles of various radii in the range 0.1–0.7 μm, by keeping the YSZ particle radius at 0.25 μm. The simulation results are reported in
Figure 7b, and, again, show a maximum. For a further investigation of this behaviour, in
Figure 8 we draw the simulated distributions of dimensionless current density
i/Itot, overpotential η and partial pressures of hydrogen (
pH2) and water (
pH2O) along the electrode thickness for an anode with ϕ
el,AL = 0.44 (Case 2
c),
T = 1073 K and for three different Ni radii:
rel = 0.17, 0.31 and 0.42 μm, corresponding to
P = 1.5, 0.8 and 0.6, respectively. In this case, a change in the Ni particle radius
rel, results in a change of
P and also in a change of the percolation thresholds of both Ni and YS; in a binary mixture of bi-modal particles, the larger particles require a higher volume fraction to percolate. In the light of this, we discuss
Figure 8 by considering, at first, the results reported for
rel = 0.17 μm (
p = 1.5). Here, the YSZ particles are larger than the Ni ones, and the percolation thresholds are about ϕ
el = 0.23 and ϕ
el = 0.62 (
i.e., ϕ
io = 0.38) for the electronic and ionic conductors, respectively. Thus, the electrode under analysis, with ϕ
el,AL = 0.44, has an ionic volumetric fraction which is quite far from the electronic percolation threshold, and, thus, its effective ionic resistivity is quite high (about 2.15 × 10
3 Ω·cm, simulation result). As a consequence, as displayed by
Figure 8a, the length of penetration of the electrochemical reaction inside the AL is not very high (EAT ≈ 6 μm, simulation result). Thus, the overpotential η is high (
Figure 8b), as well as η
tot, and the value of 1/
Rp is low (
Figure 7b). The low value of 1/
Rp is also explained by the fact that here the particles are rather small, and thus the electrode pores are small as well, causing significant diffusion limitations, as displayed by
Figure 8c which shows high values of
pH2O and low values of
pH2 in the AL. If now we consider
rel = 0.31 μm,
P is decreased to 0.8, the percolation thresholds move to about ϕ
el = 0.33 and ϕ
el = 0.74 (
i.e., ϕ
io = 0.26) for the electronic and ionic conductors respectively, and thus our ϕ
el = 0.44 is closer to the percolation threshold of the electronic conductor, resulting in a higher ionic conductivity. As a consequence,
Figure 8a shows that the penetration of the electrochemical reaction inside the electrode thickness is higher, reaching the SL and displaying some electrochemical reaction occurring even in the SL (EAT ≈ 28 μm). This increased penetration of the electrochemical reaction leads to a lower value of η (principally at the AL/electrolyte interface,
Figure 8b) and of η
tot, and finally to a higher value of 1/
Rp.
Finally, if
rel is further increased to 0.42 μm (corresponding to
P = 0.6), the percolation thresholds move to about ϕ
el = 0.42 and ϕ
el = 0.80 (
i.e., ϕ
io = 0.20) for the electronic and ionic conductors, respectively, and thus our ϕ
el,AL = 0.44 is now very close to the percolation threshold of the electronic conductor, resulting in a further increased ionic conductivity.
Figure 8a shows that the penetration of the electrochemical reaction inside the electrode thickness increases again (EAT ≈ 33 μm), but the value of η is now slightly increased, compared to the previous case (principally at the AL/electrolyte interface,
Figure 8b). As already remarked, this is due to the fact that, since we are getting very close to one of the percolation thresholds, another effect becomes important,
i.e., the active area per unit volume
A is reduced, and this explains the higher value of η, which leads to a higher value of η
tot and finally to a lower value of 1/
Rp compared to the previous case.
Concerning the partial pressure profiles reported in
Figure 8c, our simulation results show again that, if we compare the case where the electrochemical reaction occurs close to the AL/electrolyte interface, to the case where the electrochemical reaction is shifted towards the AL/SL interface or even inside the SL, then in the previous case: (i) the partial pressure of water (
pH2O) in the AL is higher; (ii) symmetrically, the partial pressure of hydrogen (
pH2) is lower; and (iii) the profiles of partial pressures in the SL are steeper.
Figure 8.
Bi-layered Ni-YSZ anodes at temperature
T = 1073 K; Ni volumetric fraction in the AL ϕ
el,AL = 0.44 (Case 2
c). Other data reported in
Table 2. Varying parameter: AL Ni particle radius
rel,AL. Simulated distributions along the electrode thickness of: (
a) ionic (
iio) and electronic (
iel) currents; (
b) overpotential (η); and (
c) partial pressures of hydrogen (
pH2) and water (
pH2O).
3.6. Effect of Support Layer Characteristics
The effect of the characteristics of the SL on the electrode 1/
Rp are presented in
Figure 9. In these simulations the parameters of the AL are kept at the values reported in
Table 2.
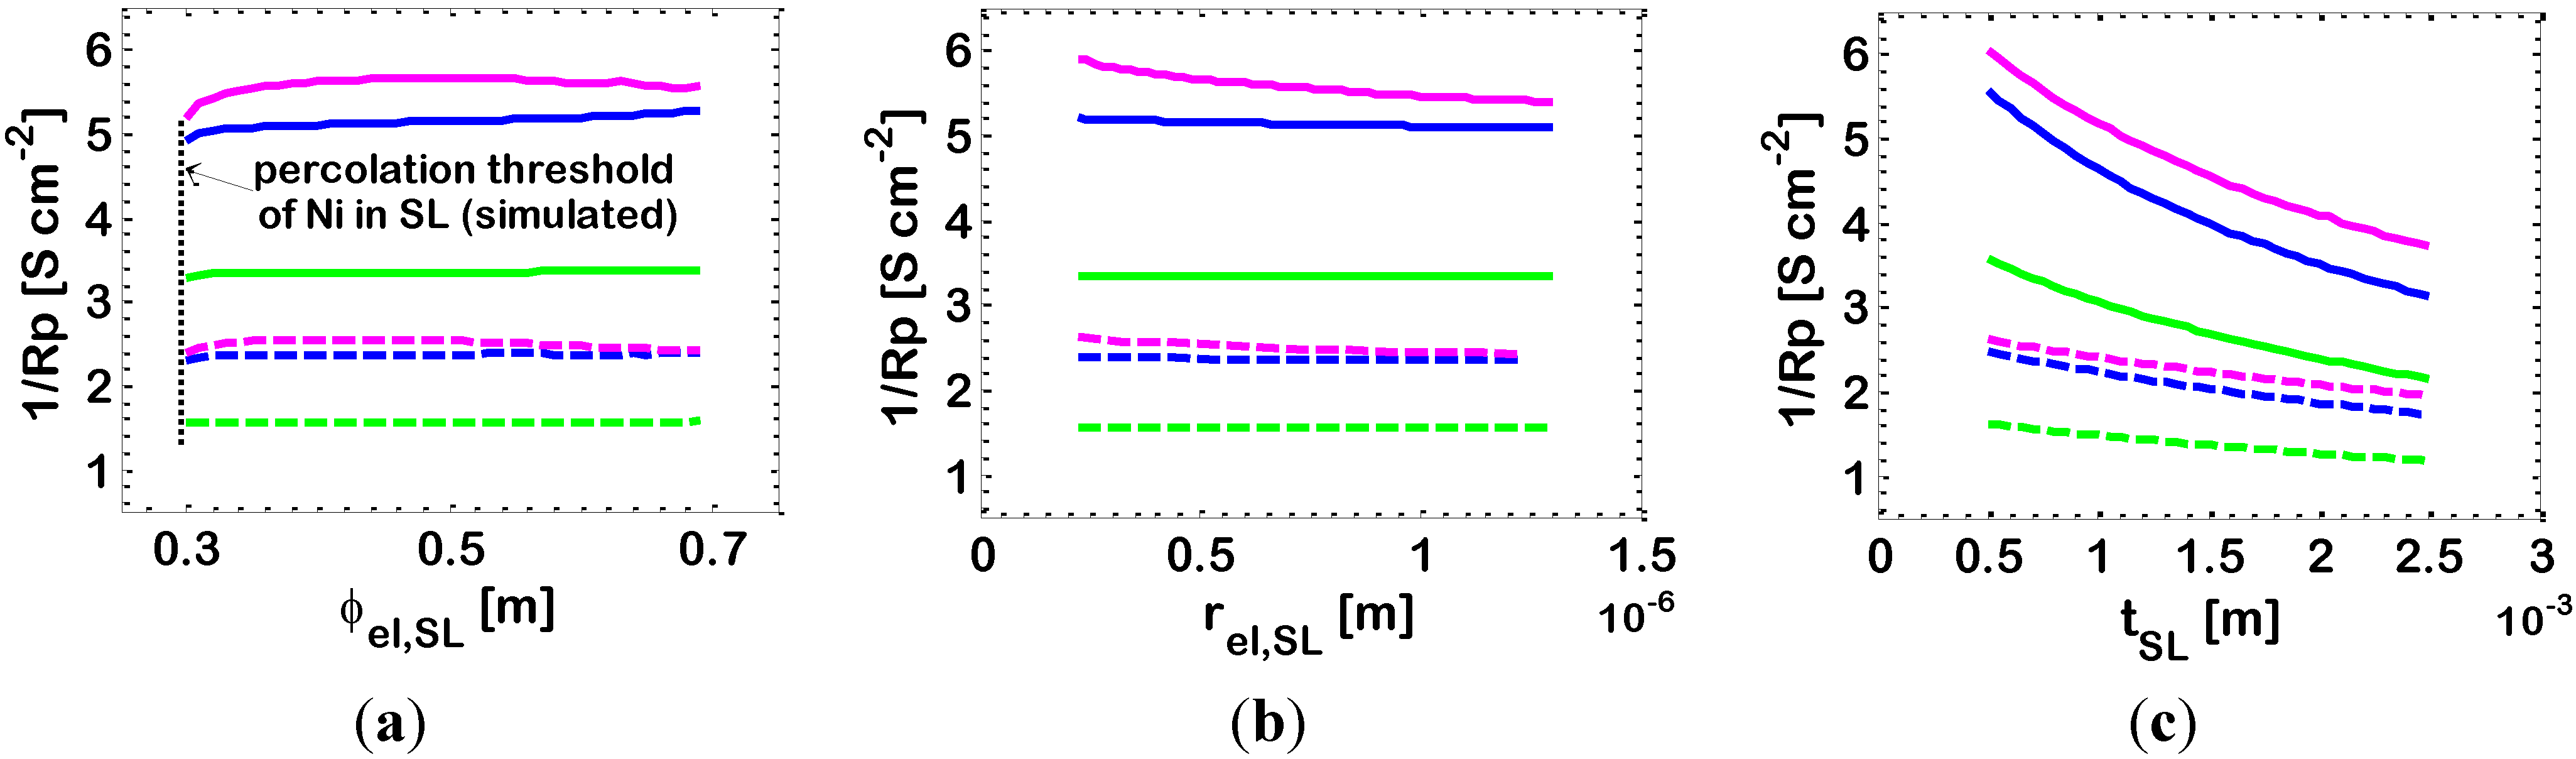
Figure 9.
Effect of SL characteristics on the
1/Rp of bi-layered Ni-YSZ anodes operating at temperatures:
T = 973 K (dashed lines) and
T = 1073 K (solid lines). Other data are reported in
Table 2. Varying parameter: Ni volumetric fraction in the AL:
![Energies 07 05647 i003]()
Case 2
b (ϕ
el,AL = 0.34);
![Energies 07 05647 i002]()
Case 2
c (ϕ
el,AL = 0.44); and
![Energies 07 05647 i004]()
Case 2
d (ϕ
el,AL = 0.55). Simulations results of the impact of: (
a) SL Ni volumetric fraction (ϕ
el,SL); (
b) SL particle dimensions (
rel,SL =
rio,SL); and (
c) SL thickness (
tSL).
In principle, it is not strictly necessary for the YSZ phase to percolate through the SL, because the main electrochemical role of the SL is to provide a path for the electrons from the AL to the current collector. However, as already discussed, the presence YSZ particles into the SL, above the percolation threshold, is beneficial from the point of view of the electrochemical performance, allowing a possible extension of the electrochemical reaction also into the SL. In addition, the presence of YSZ into the SL avoids Ni agglomeration and ensures that the TEC is as close as possible to that of the AL [
24]. Due to the importance of this last issue, the Ni content of the SL is usually around 50%, and in some cases another additional layer is introduced between the AL and the SL [
58,
59], which allows a smoother transition.
On the basis of our simulation model, we investigate the effect of Ni volumetric fraction (ϕ
el,SL), particle dimensions (
rel,SL) and thickness (
tSL) of the SL.
Figure 9a shows that the effect of a variation of the SL Ni content is related to the AL characteristics. Indeed, if we are in a case where the electrochemical reaction does not occur entirely in the AL, but is shifted towards the AL/SL interface and occurs also in part in the SL, then the characteristics of the SL impact the overall electrode electrochemical performance. In particular,
Figure 9a shows that, for ϕ
el,AL = 0.34 (Case 2
b), the electrode 1/
Rp is maximum for ϕ
el,SL = 0.5. On the contrary,
Figure 9a shows that if the electrochemical reactions occurs entirely in the AL, for ϕ
el,AL = 0.44 (Case 2
c) and ϕ
el,AL = 0.55 (Case 2
d), then there is no influence of the SL Ni content on the overall electrode electrochemical performance.
Analogously,
Figure 9b shows the effect of a variation of the radius of the SL particles in the range of 0.25–1.2 μm (keeping identical the dimensions of the ionic and electronic particles:
). Radii in the order of 0.5–1 μm are reported in the literature [
60]. More in detail,
Figure 9b shows a slight decrease of electrode performance with increasing the size of the SL particles. Again, this effect is visible only in the case where the properties of the AL allow the electrochemical reaction to occur in part in the SL (ϕ
el,AL = 0.34, Case 2
b). Here, the increase of the SL particle dimensions reduces the active area
A for the SL electrochemical reaction in the SL, and this decreases the overall electrode 1/
Rp. This effect, of course, is not visible for ϕ
el,AL = 0.44 (Case 2
c) and ϕ
el,AL = 0.55 (Case 2
d), where the electrochemical reaction occurs almost entirely in the AL. Concerning a possible impact on diffusive losses we remark that, at 1073 K, with SL particle radii larger than about 1 μm, pores (Equation (7)) are large enough to be practically outside the Knudsen regimen at the operating temperatures under consideration, which means that diffusivity values are typical of molecular diffusivity, which is independent of pore radius. Likewise, also a variation of the radius of SL Ni particles in the range of 0.25–1 μm has a minor impact on diffusive losses.
Finally,
Figure 9c shows the negative effect of an increase of the SL thickness
tSL from 700 μm to 2500 μm, demonstrating that this is expected to lead to a decrease of the electrode 1/
Rp of about 30%.
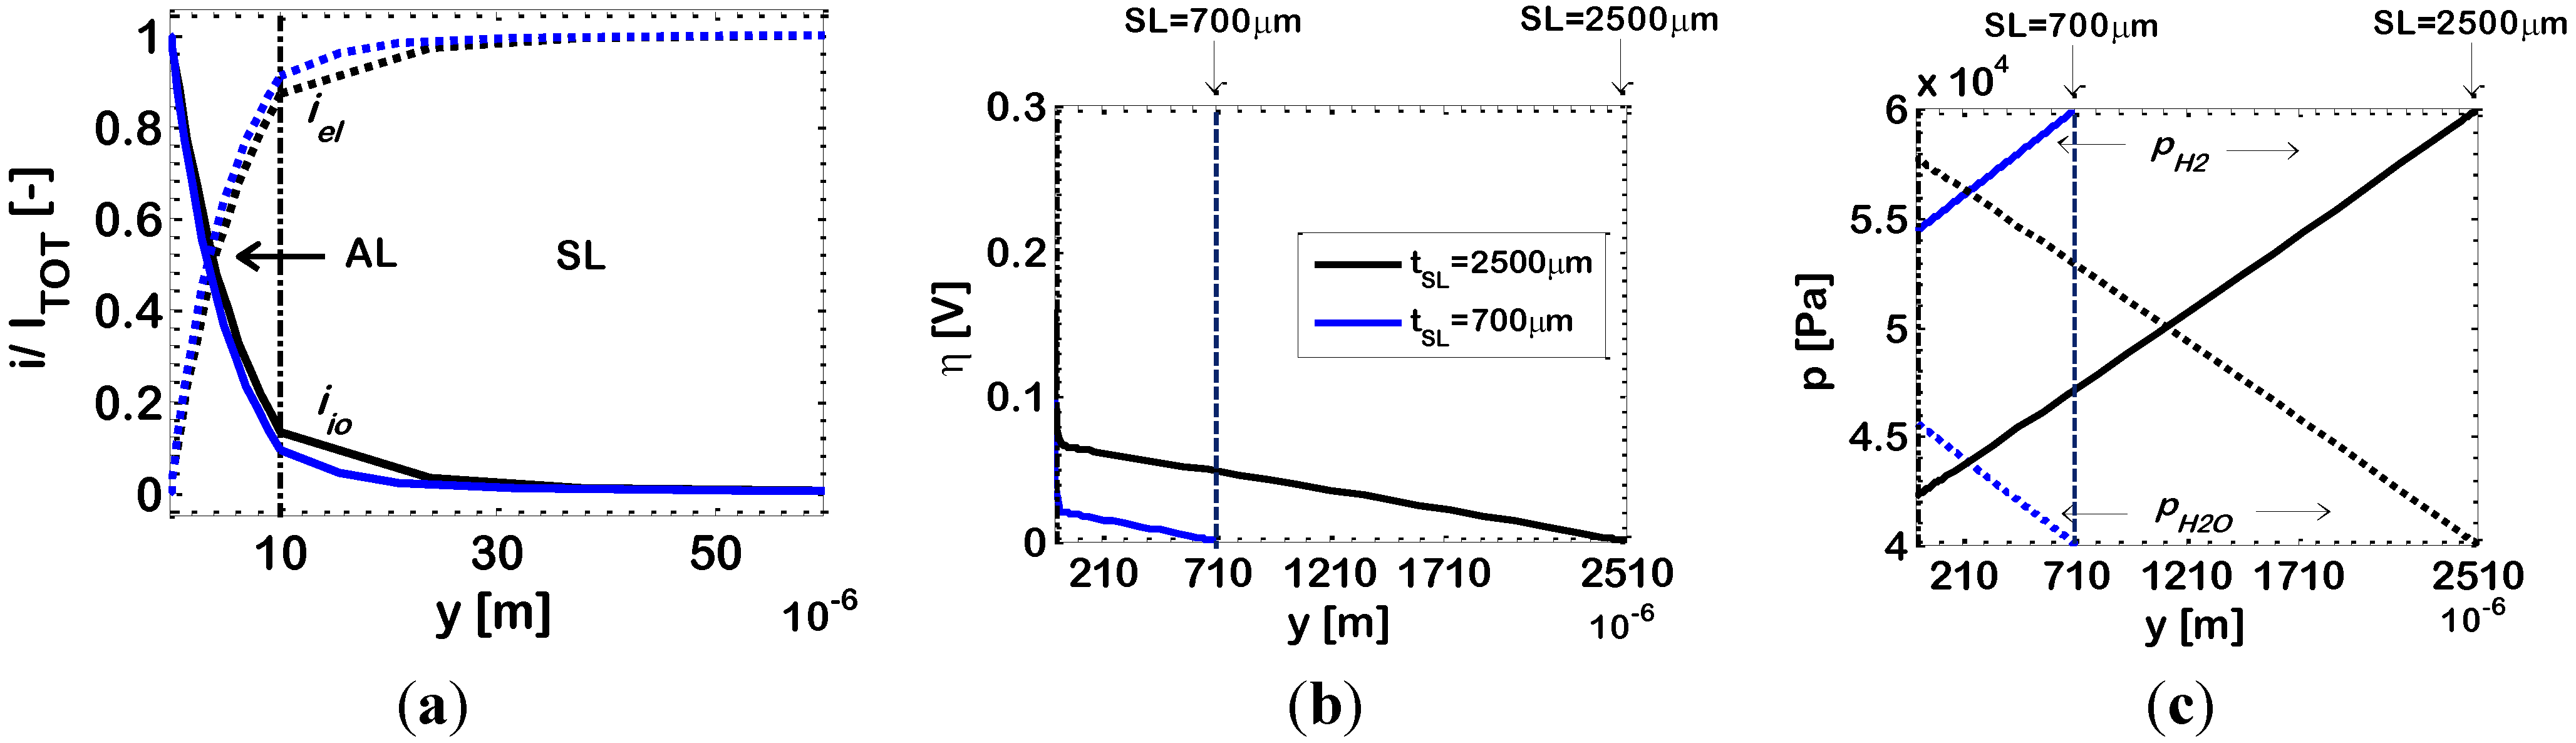
For a further investigation of this result, in
Figure 10 we draw the simulated distributions of dimensionless current density
i/Itot, overpotential η and partial pressures of hydrogen (
pH2) and water (
pH2O) along the electrode thickness for ϕ
el,AL = 0.44 (Case 2
c) and for two different SL thicknesses (700 μm and 2500 μm). The results for
tSL = 700 μm and 2500 μm are plotted on the same figures, and in both cases the
y co-ordinate has its origin at the AL/electrolyte interface.
Figure 10a shows that the penetration of the electrochemical reaction inside the electrode does not change significantly by increasing the SL thickness (EAT ≈ 16 μm with
tSL = 700 μm; EAT ≈ 21 μm with
tSL = 2500 μm). On the contrary, by increasing the SL thickness there is an increase in the length of the diffusion path through which hydrogen and water must migrate in the SL, which leads to lower hydrogen and higher water concentrations in the AL (
Figure 10c), with a consequent decrease of the electrochemical kinetics (Equation (1)), resulting thus in an increased η in the AL (
Figure 10b), which finally leads to a lower 1/
Rp value.
Figure 10.
Bi-layered Ni-YSZ anodes at temperature
T = 1073 K; Ni volumetric fraction in the AL ϕ
el,AL = 0.44 (Case 2
c). Other data reported in
Table 2. Varying parameter: SL thickness (
tSL). Simulated distributions along the electrode thickness of: (
a) ionic (
iio) and electronic (
iel) currents; (
b) overpotential (η); and (
c) partial pressures of hydrogen (
pH2) and water (
pH2O).
Even if our results suggest that bi-layered electrodes with thin SL display better electrochemical performance, nevertheless, the choice of geometrical and morphological parameters of the SL must be made taking into account not only the electrode electrochemical performance, but also the desired mechanical features. In this sense, a thickness as high as 0.7–1.5 mm is often reported for SLs of bi-layered IT-SOFC anodes [
61,
62]. Cathode thicknesses as high as 2.2 mm were adopted for tubular cathode-supported HT-SOFCs [
3], in order to ensure adequate mechanical stability.


 Itot = 1 A/cm2; and
  Itot = 0.5 A/cm2. Lines: simulation. Points: literature experimental data (2a, 2b, 2c and 2d) [50].


 Case 2b (ϕel,AL = 0.34);
  Case 2d (ϕel,AL = 0.55). Simulations results of the impact of: (a) SL Ni volumetric fraction (ϕel,SL); (b) SL particle dimensions (rel,SL = rio,SL); and (c) SL thickness (tSL).