1. Introduction
The increasing demand for secondary batteries with high energy density has spurred research by scientists and engineers to improve existing systems as well as to explore new battery systems in an effort to supply power to continuously updated electronic devices. With a number of remarkable advantages, lithium ion batteries have played an important role in the rechargeable battery market. However, after several decades of rapid developments with this technology, it has become difficult to engineer additional significant improvements in the energy density of these batteries. Consequently, there is a pressing need to develop new battery systems, in order to satisfy the increasingly demanding market requirements. Due to their remarkably high S capacity (1675 mAh g
−1), a high theoretical energy density (2600 Wh kg
−1, 4.5 times that of LiCoO
2/C batteries and 6.6 times that of LiFePO
4/C batteries), low cost of manufacture and general environmental friendliness, Li/S batteries have shown very promising potential and have recently attracted attention [
1,
2].
However, some technical difficulties must still be overcome, which include the problem of insulating the active material S (5 × 10
−3 S cm
−1 at 25 °C) and the so-called shuttle phenomenon, caused by dissolved polysulfide, which results in a high self-discharge rate and low cycle life [
3] for these types of batteries. To date, the bulk of the research has focused on improving S electrode performance [
4,
5,
6] by increasing the conductivity between conductor and S, and on the selection of an appropriate additive for S cathodes to prevent polysulfide from dissolving in the electrolyte. Owing to their highly porous structure and good conductivity, a number of carbon materials have been considered as conducting additives for S cathodes; these include acetylene black (AB) [
4], activated carbon [
7], carbon fiber [
8], carbon nanotubes [
5], mesoporous carbon [
2], and graphite [
9]. In addition, the methods to prepare sulfur/carbon composites have presented an ongoing challenge to the development of Li/S batteries. One type of approach involves solid phase preparation methods, such as ball milling techniques or thermal treatments. However, poor dispersibility, the agglomeration of S, and low S loading levels has meant that the actual performance of S cathodes manufactured in this manner has not shown any obvious improvement. Other schemes are based on liquid-phase preparation methods, such as a solvent exchange method [
10] and the solution infiltration method [
11], and these methods do seem to result in better electrochemical performance of the final materials. All the composites in the foregoing studies were prepared by simply mixing S particles with carbon materials. Using a repetitive soakage/drying procedure for a S/CS
2 solution [
12], the sulfur/carbon composite with S loading of 11.7 wt % had a good electrochemical performance, with a discharge specific capacity of 1584.56 mAh g
−1 at the initial cycle, and 804.94 mAh g
−1 after 30 cycles (2.5 A g
−1, 1.0–3.6 V). However, both the discharge specific capacity and the cycle performance decreased gradually with increased loading of S, characterized by a discharge specific capacity of approximately 820 mAh g
−1 in the initial cycle and only approximately 260 mAh g
−1 after 30 cycles [
12].
Comparing the three aforementioned liquid-phase preparation methods [
10,
11,
12], we find that the repetitive soakage/drying method results in reasonably good performance of the material, but has the disadvantages of being very time-consuming and being capable of producing only low values of S-loading. Moreover, the multi-layered S that is prepared by a repeated soakage/drying procedure offers a poor inter-layer conductivity, which may be the reason why a high S-loading leads to a low discharge capacity. In efforts to improve upon the repeated soakage/drying procedure, we have developed a novel solution evaporation concentration crystallization method. Sulfur/carbon composites were prepared in this way at two different solvent evaporation rates, and then compared using structural characterizations and electrochemical performance parameters as metrics. Our results show that these composites have excellent electrochemical properties, with the discharge specific capacity reaching 1609.67 mAh g
−1 in the initial cycle and 1115.69 mAh g
−1 after 100 cycles (for the AB/S material prepared at a lower solvent evaporation rate with 50 wt % S content). More importantly, the preparation method is simple and inexpensive.
2. Experimental Section
Sublimed S (Aladdin, Shanghai, China) and AB (Battery Grade, Jingxin, Jiaozuo, China) were dried for 2 h at 80 °C under vacuum (−0.1 MPa) before use. As shown in
Table 1, the dried AB was dispersed into S/CS
2 solutions with stirring. The CS
2 solvent then evaporated at 25 °C under atmospheric pressure with different evaporation rates by controlling ventilation pore area. The resulting black composites were dried for 12 h at 60 °C under vacuum (−0.1 MPa) before we performed structural and electrochemical characterizations. The S/AB composite materials were designated as AB/S-1, AB/S-2, AB/S-3, AB/S-4, AB/S-5 and AB/S-6 (see
Table 1).
Table 1.
Formulas of the composite materials.
Table 1.
Formulas of the composite materials.
| Samples | S (wt %) | AB (wt %) | CS2 (cm3) | Evaporation Rate (cm3 h−1) |
|---|
| AB/S-1 | 36 | 64 | 40 | 10 |
| AB/S-2 | 36 | 64 | 40 | 2 |
| AB/S-3 | 50 | 50 | 40 | 10 |
| AB/S-4 | 50 | 50 | 40 | 2 |
| AB/S-5 | 85 | 15 | 40 | 10 |
| AB/S-6 | 85 | 15 | 40 | 2 |
A homogeneous slurry composed of 70 wt % of the AB/S composite materials, 20 wt % of AB, and 10 wt % of polyvinylidene fluoride (PVDF) binder in N-methyl-2-pyrrolidinone (NMP) was cast onto Al foil (10 µm foil thickness) to fabricate the test electrodes. Each test electrode was dried for 24 h at 60 °C under vacuum (−0.1 MPa) and then rolled. Test cells were assembled into 2016-type coin cells in an Ar-filled glove box with the test electrodes (discs with a diameter of 15 mm, a thickness of 100 µm, and a weight of 15 mg), a Li metal (Ganfeng Lithium, Xinyu, China) counter electrode, an organic electrolyte (1.0 M LiN(CF3SO2)2 in a solvent mixture of dioxolane (DIOX)/dimethoxyethane (DME) (1:1, v/v) as the electrolyte (Battery Grade, Ferro, Suzhou, China), and a polypropylene membrane separator (Celgard 2300, Charlotte, NC, USA).
The test cells were operated on battery test equipment (BT2000, Arbin, College Station, TX, USA) over a 1.5–3.0 V range at 0.05 mA cm−2. An electrochemical workstation (VMP3, Bio-logic, Claix, France) was used for cyclic voltammetry (CV) in the voltage range of 1.5–3.0 V at a scanning rate of 0.05 mV s−1. Electrochemical impedance spectroscopy (EIS) was performed using the same VMP3 electrochemical workstation in the frequency range of 105–10−2 Hz with potentiostatic signal amplitudes of 5 mV. All our experiments were conducted at room temperature. Specific capacities were calculated on the basis of S loading.
X-ray diffraction (XRD) patterns of AB, sublimed S, and AB/S were collected on a powder diffraction system (D8-FOCUS, Bruker, Karlsruhe, Germany) using Cu-Kα radiation (λ = 0.15406 nm). We examined the microstructures with an environmental scanning electron microscope (ESEM; Quanta 200, FEI, Hillsboro, OR, USA) and a transmission electron microscope (TEM; CM12, Philips, Woerden, The Netherlands). After determination of the BET specific surface area and micropore volume, we compared these with results from nitrogen adsorption at 77 K using a specific surface area analyzer (ASAP2020, Micromeritics, Norcross, GA, USA). A UV-Vis spectrophotometer (UV-2600, Shimadzu, Kyoto, Japan), operating in the wavelengths 200–800 nm, was employed to study the soluble polysulfide species in electrolyte after different discharge states.
Lastly, the AB/S-4 sample electrode was thoroughly studied to investigate the process kinetics of AB/S composite materials. Points at 2.80 V, 2.35 V, 2.15 V, 2.05 V, 1.95 V and 1.50 V on the initial discharge curve of the electrode were marked as D280, D235, D215, D205, D195 and D150, and points at 2.40 V and 3.00 V on the initial charge curve for this electrode were marked as C240 and C300. The electrodes were tested by ESEM with polypropylene thin film and came from the test batteries after disassembly in glove box. The electrolyte was sealed in cuvette and tested by UV-Vis.
3. Results and Discussion
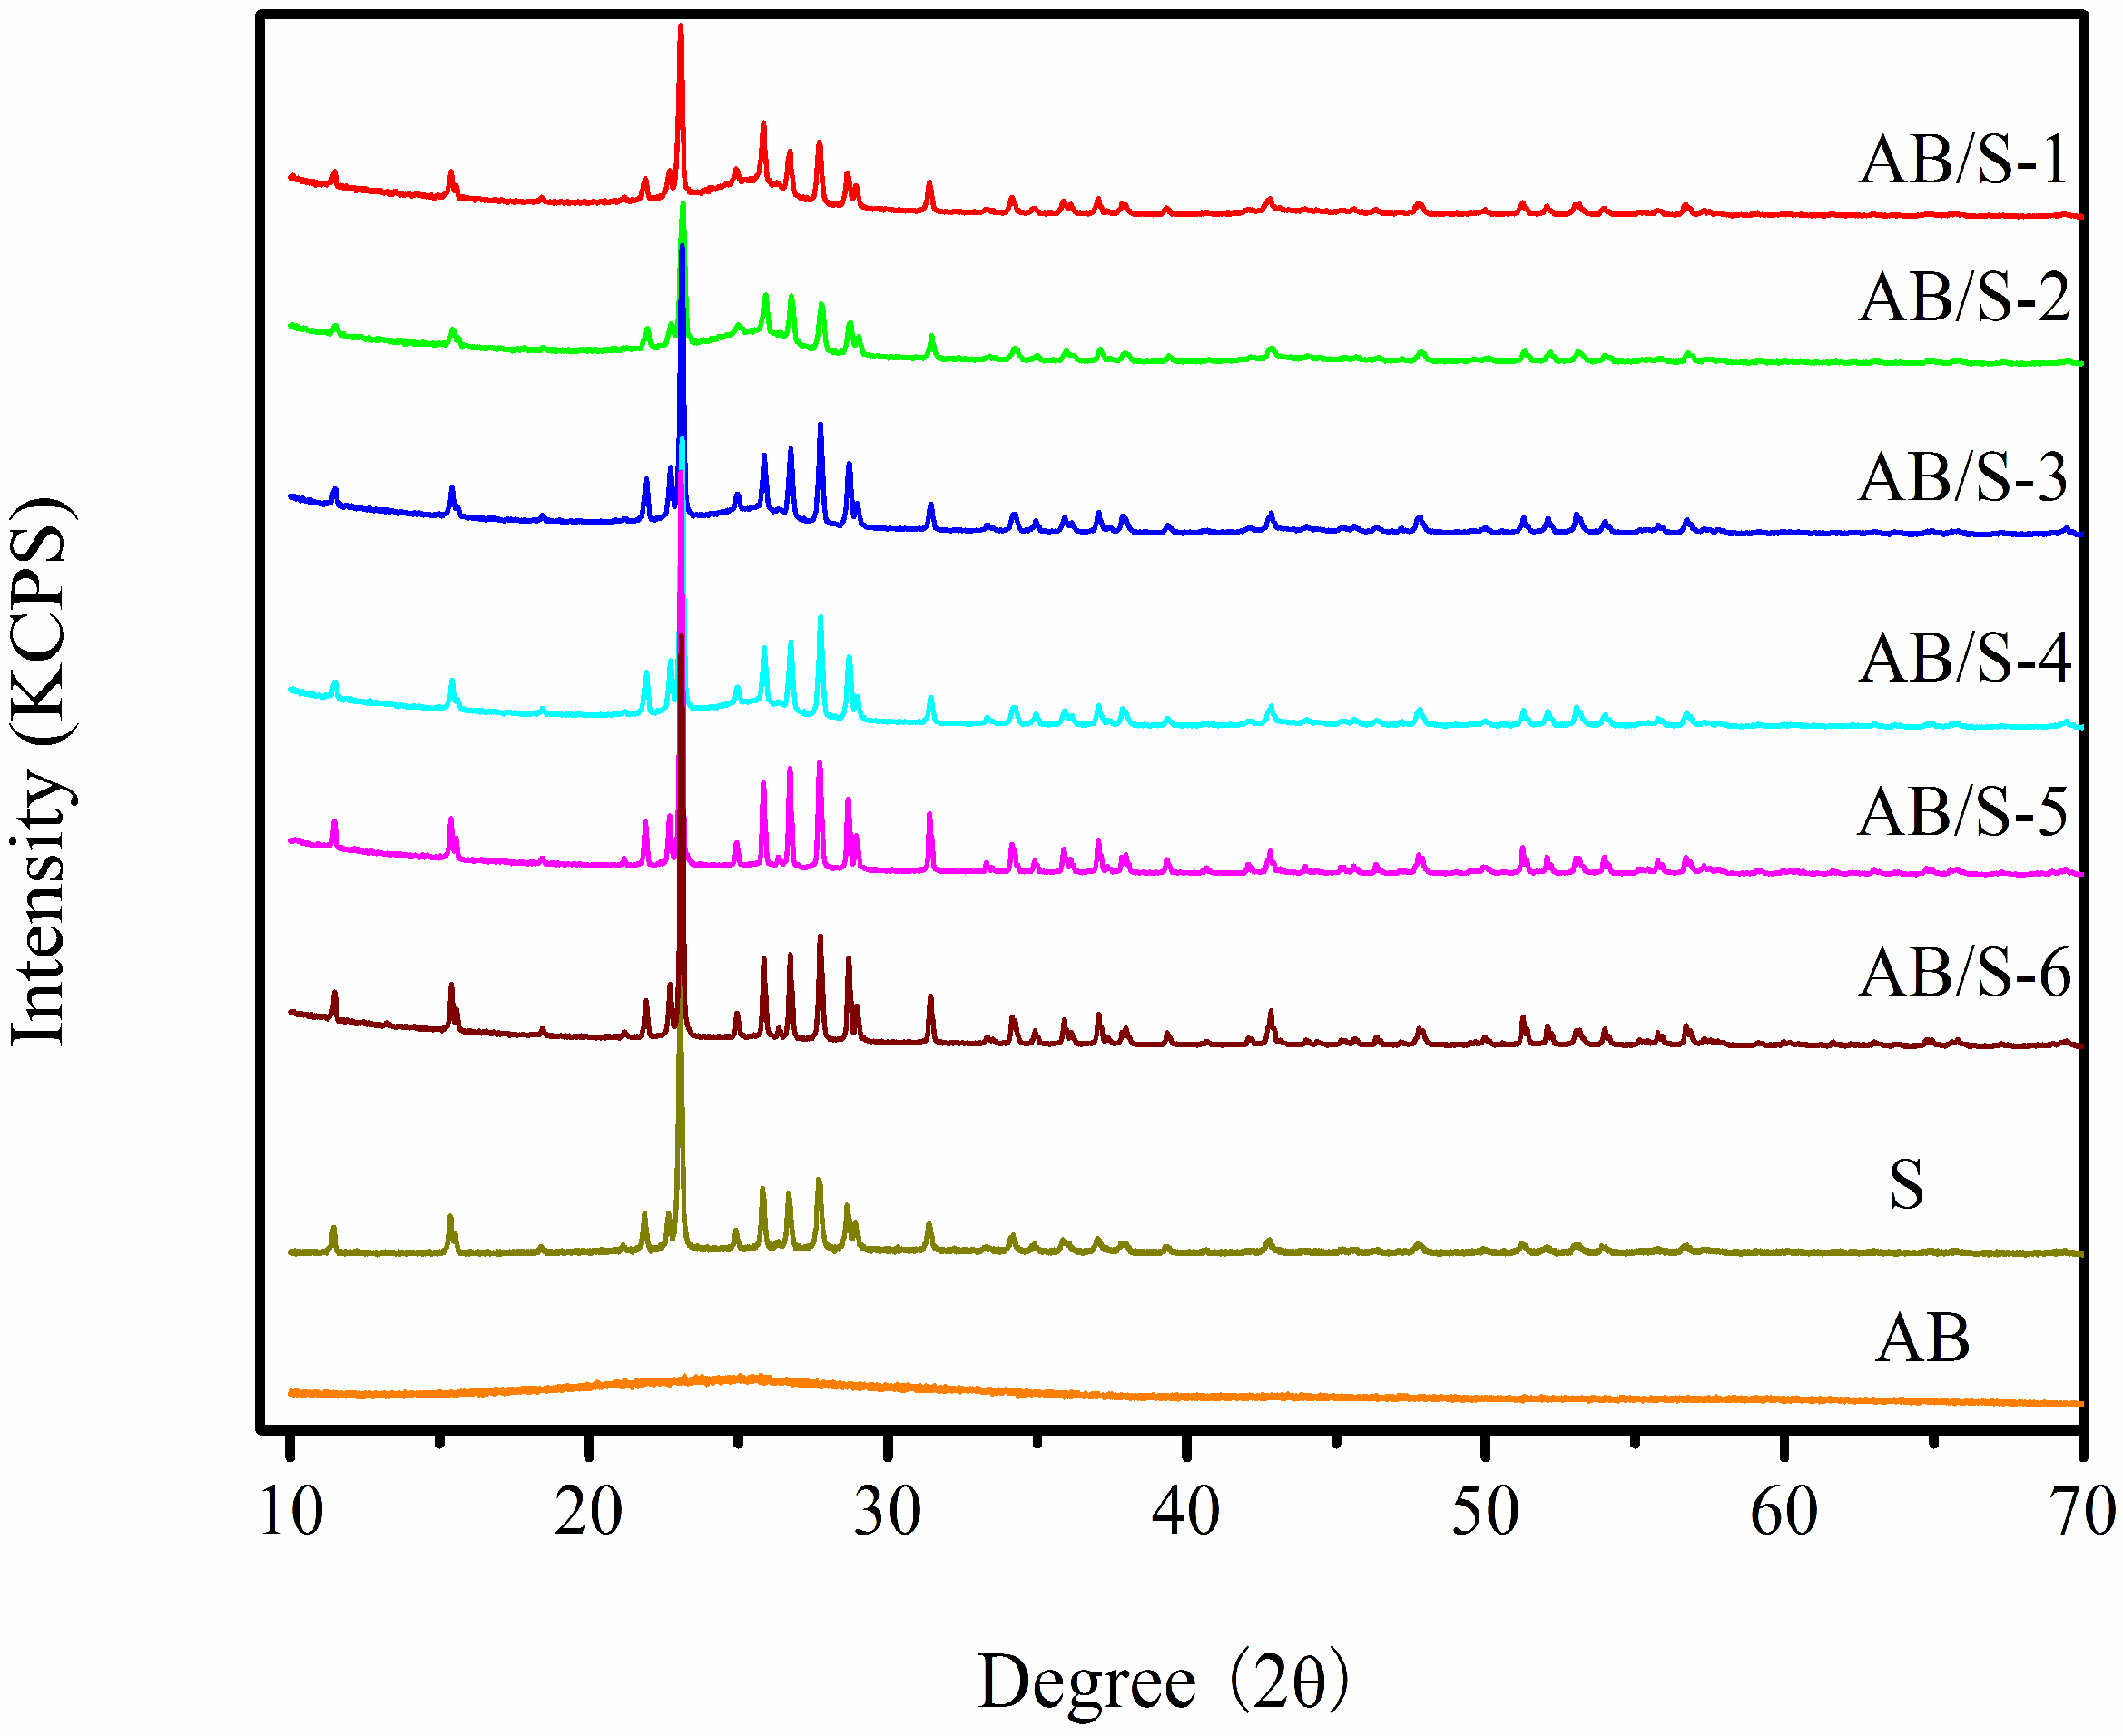
XRD patterns of sublimed S, AB and AB/S are shown in
Figure 1. The XRD pattern of sublimed S shows strong peaks at 22.9° and 27.4°, consistent with a Fddd orthorhombic structure [
13]. The XRD pattern of AB only shows a broad peak, indicating an amorphous structure. The XRD spectra of AB/S show a very similar pattern to that of sublimed S, which confirms that no phase transformation occurs during the solvent evaporation and concentrating crystallization process. For different S loadings and solvent evaporation rates, the XRD peak intensities of S are weakened to a different extent, depending on the S loadings and solvent evaporation rates. For the same S loading, the peak intensities of AB/S that had been prepared at a low solvent evaporation rate are lower than those prepared at a high solvent evaporation rate.
Figure 1.
XRD patterns of the composite materials.
Figure 1.
XRD patterns of the composite materials.
The AB/S composites in our study clearly exhibit high initial discharge specific capacities as compared with AB/S composites prepared by other methods [
4,
12]. However, the initial discharge specific capacity decreases with an increase in S loading. At an S loading of 85 wt %, the initial discharge specific capacities for samples AB/S-5 and AB/S-6 were only 1556.78 and 1574.66 mAh g
−1. We believe that a high S loading reduces the thickness of the AB shell layer, leaving some S particles exposed on the composite surface, which in turn results in a poor contact between S and AB.
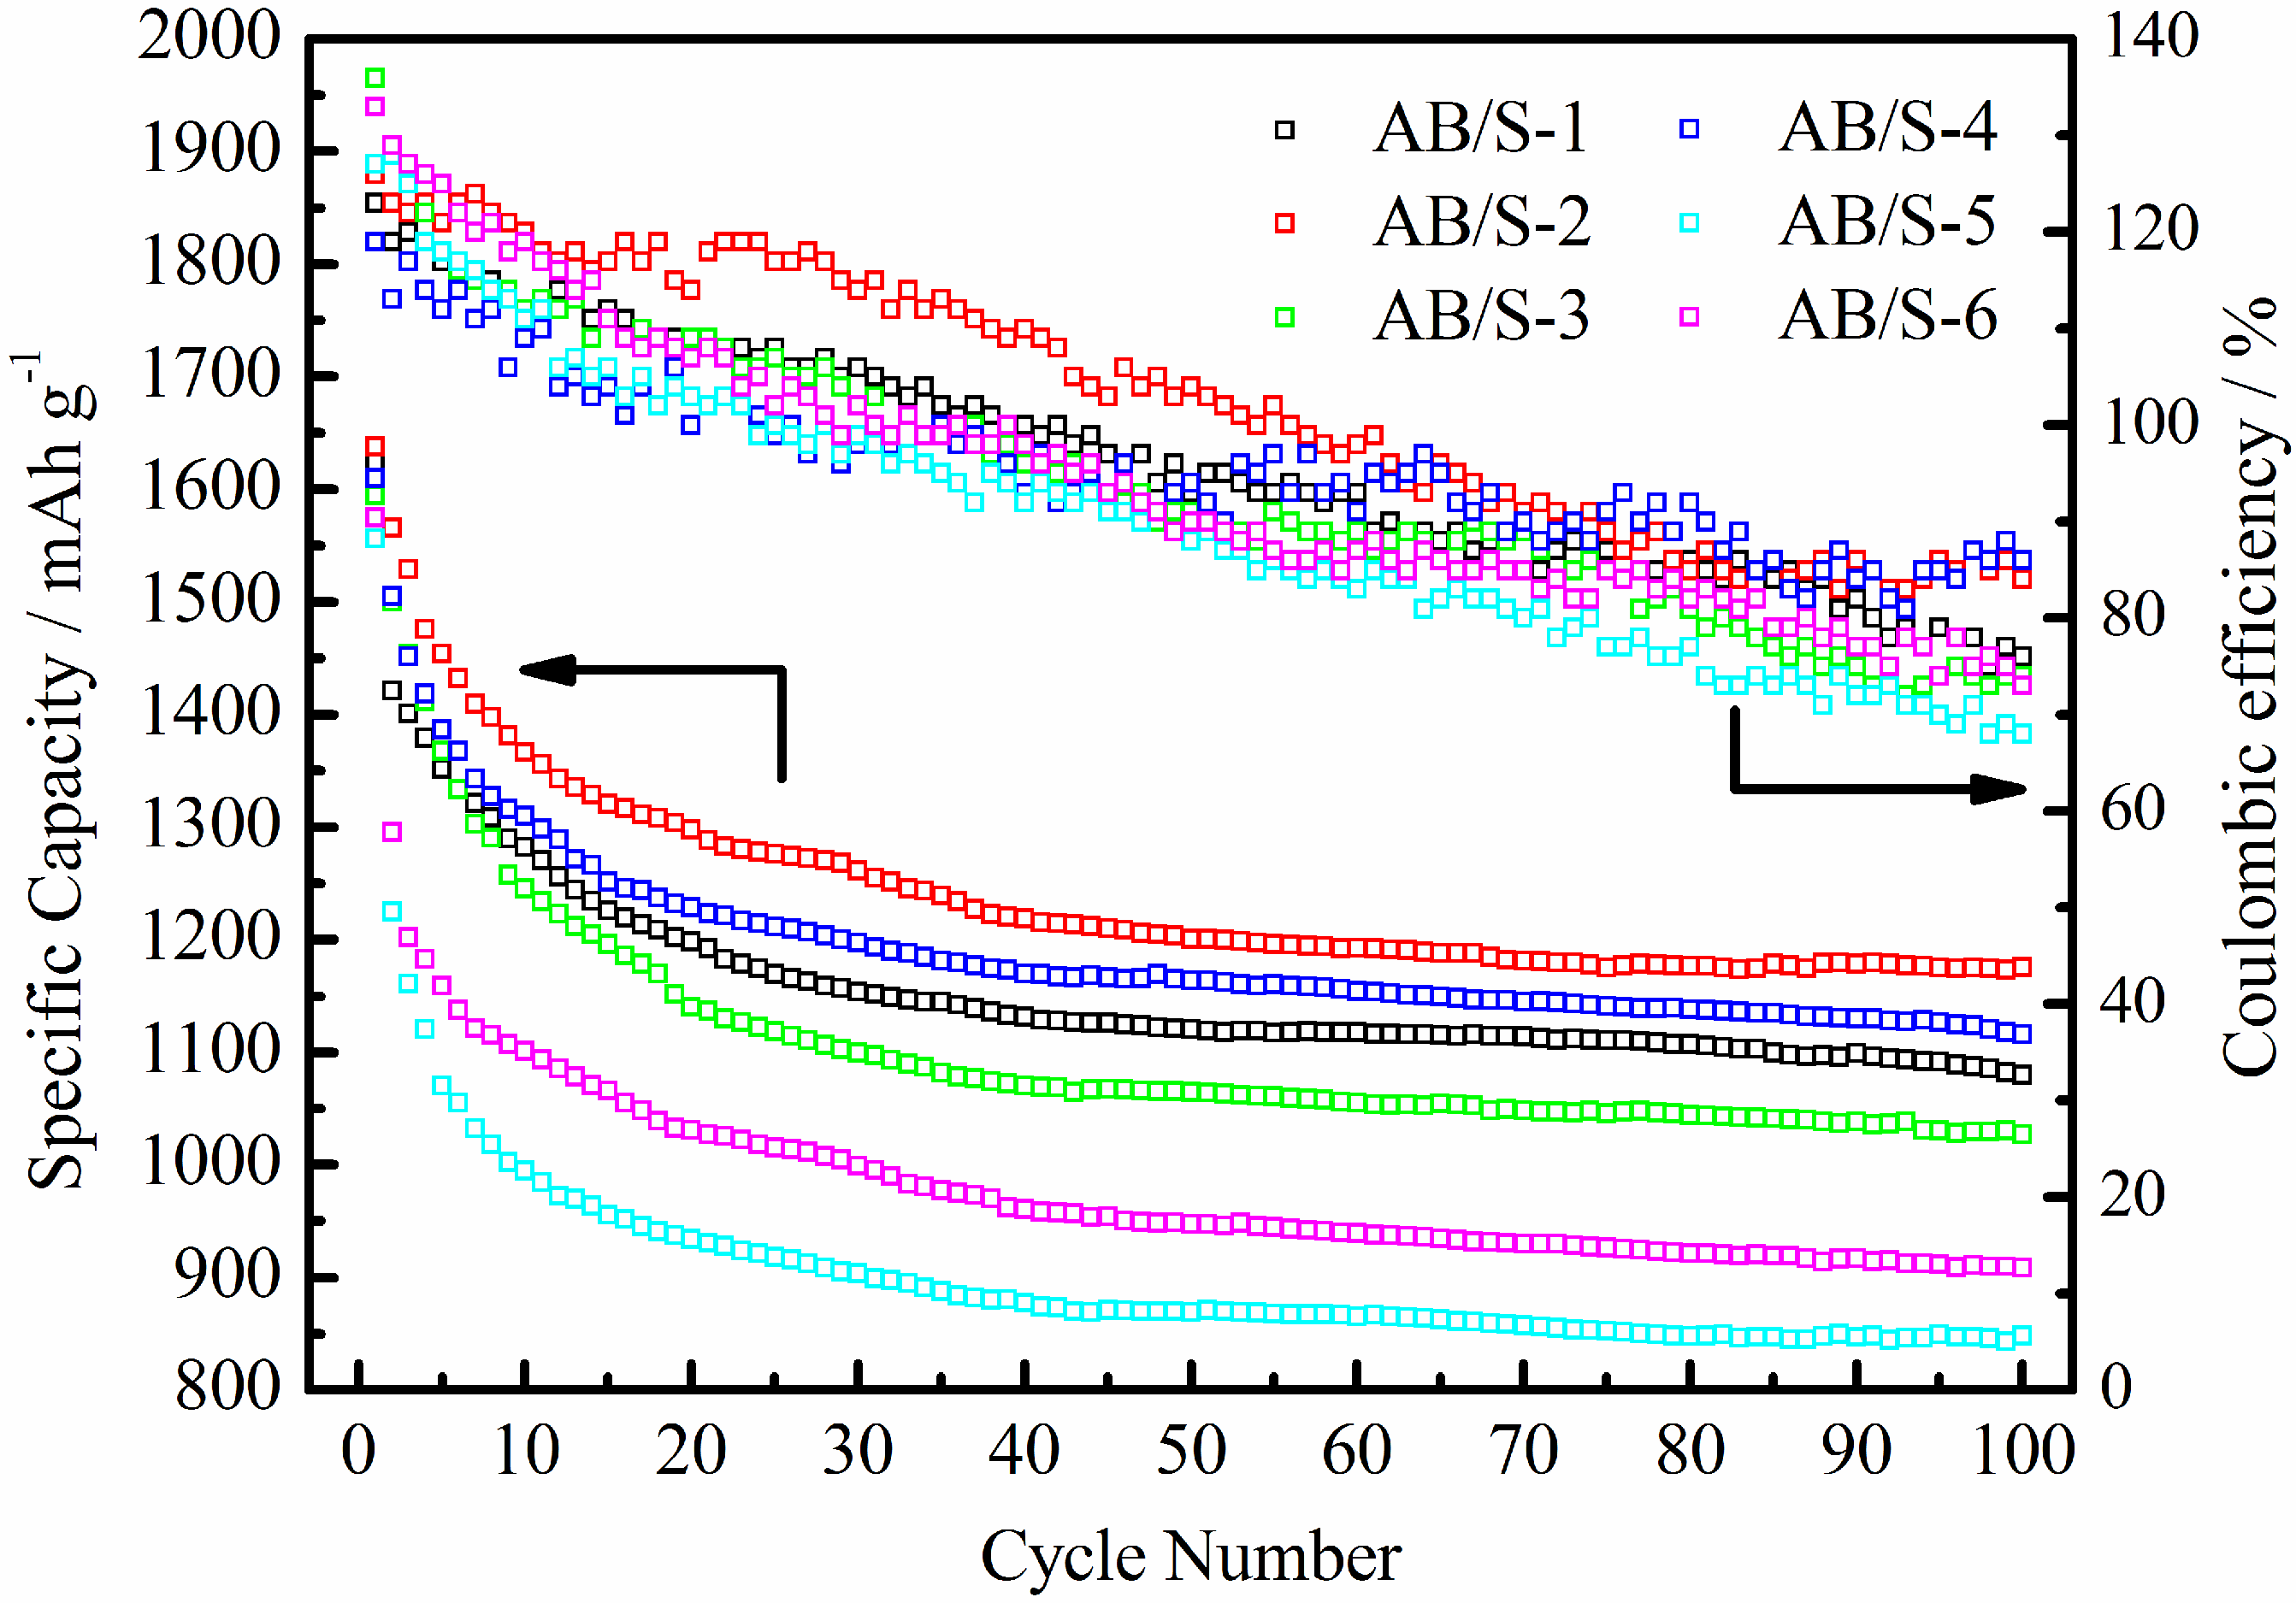
The cycle performance and coulombic efficiencies for several composites as electrodes of Li/S batteries are shown in
Figure 2. The plots for all composites feature a fast drop in the inchoate cycles, which then gradually stabilize in the later cycles. This implies that the AB/S composite material prepared by a solution nucleation-growth method can inhibit polysulfides from dissolving in the electrolyte and can prevent the shuttle phenomenon. We found that composite materials that had been prepared at a slow CS
2 evaporation rate had better cycle performance. The discharge specific capacity of sample AB/S-2 was 1176.20 mAh g
−1 after 100 cycles, which surpassed that of sample AB/S-1 (prepared with a quick CS
2 evaporation rate) as well as that of a sulfur/carbon composite that had S content of 36 wt % and which was prepared by ball milling and thermal treatment [
4]. Sample AB/S-4 had a discharge specific capacity of 1115.69 mAh g
−1 after 100 cycles, which is higher than that of sulfur/carbon composites prepared via the solution infiltration method with S content of 45.8 wt % and 51.5 wt % [
12].
Figure 2.
Cycle performance and coulombic efficiency curves of the composite materials.
Figure 2.
Cycle performance and coulombic efficiency curves of the composite materials.
Figure 3 shows ESEM and TEM images of an AB/S sample with 50% S loading (AB/S-4). The flocculent material on the surface of the composite (shown in
Figure 3a) is AB, and S appears to be buried. The images demonstrate a sulfur core/AB-shell structure, with S as the core and AB as the shell layer. The diameter of the composite particles is 10-20 μm, according to both ESEM and TEM images.
The adsorption–desorption isotherms of AB/S and AB are shown in
Figure 4. All isotherms indicate a rapid increasing volume adsorption at a higher relative pressure, which is a feature of type III adsorption. It means that AB/S contains numerous porous structures, even with a high S loading. The absorbed volume of AB is larger than those of the six AB/S composite materials, and the pore volume shows a similar trend (as shown in
Table 2). However, at the same S loading it is apparent that the BET specific surface area will be lower when the solvent evaporation rate is lower. Both the BET specific surface area and the pore volume of AB/S decreased with an increase in S loading for samples produced at the same evaporation rate. From this one can infer that the nucleation and crystallization of S can proceed both on the surface of AB and also within its porous structure when CS
2 is evaporating.
Figure 3.
ESEM and TEM images of AB/S-4. (a) ESEM; (b) TEM.
Figure 3.
ESEM and TEM images of AB/S-4. (a) ESEM; (b) TEM.
Figure 4.
Adsorption isotherms of AB and the composite materials.
Figure 4.
Adsorption isotherms of AB and the composite materials.
Table 2.
BET specific surface area, pore volume and average pore diameter of AB and AB/S.
Table 2.
BET specific surface area, pore volume and average pore diameter of AB and AB/S.
| Samples | AB | AB/S-1 | AB/S-2 | AB/S-3 | AB/S-4 | AB/S-5 | AB/S-6 |
|---|
| BET (m2 g−1) | 54.66 | 27.24 | 23.55 | 17.88 | 17.18 | 4.48 | 3.85 |
| Pore volume (cm3 g−1) | 0.21 | 0.13 | 0.12 | 0.054 | 0.044 | 0.028 | 0.028 |
| Average pore diameter(nm) | 9.08 | 17.82 | 11.58 | 12.07 | 10.22 | 28.92 | 13.44 |
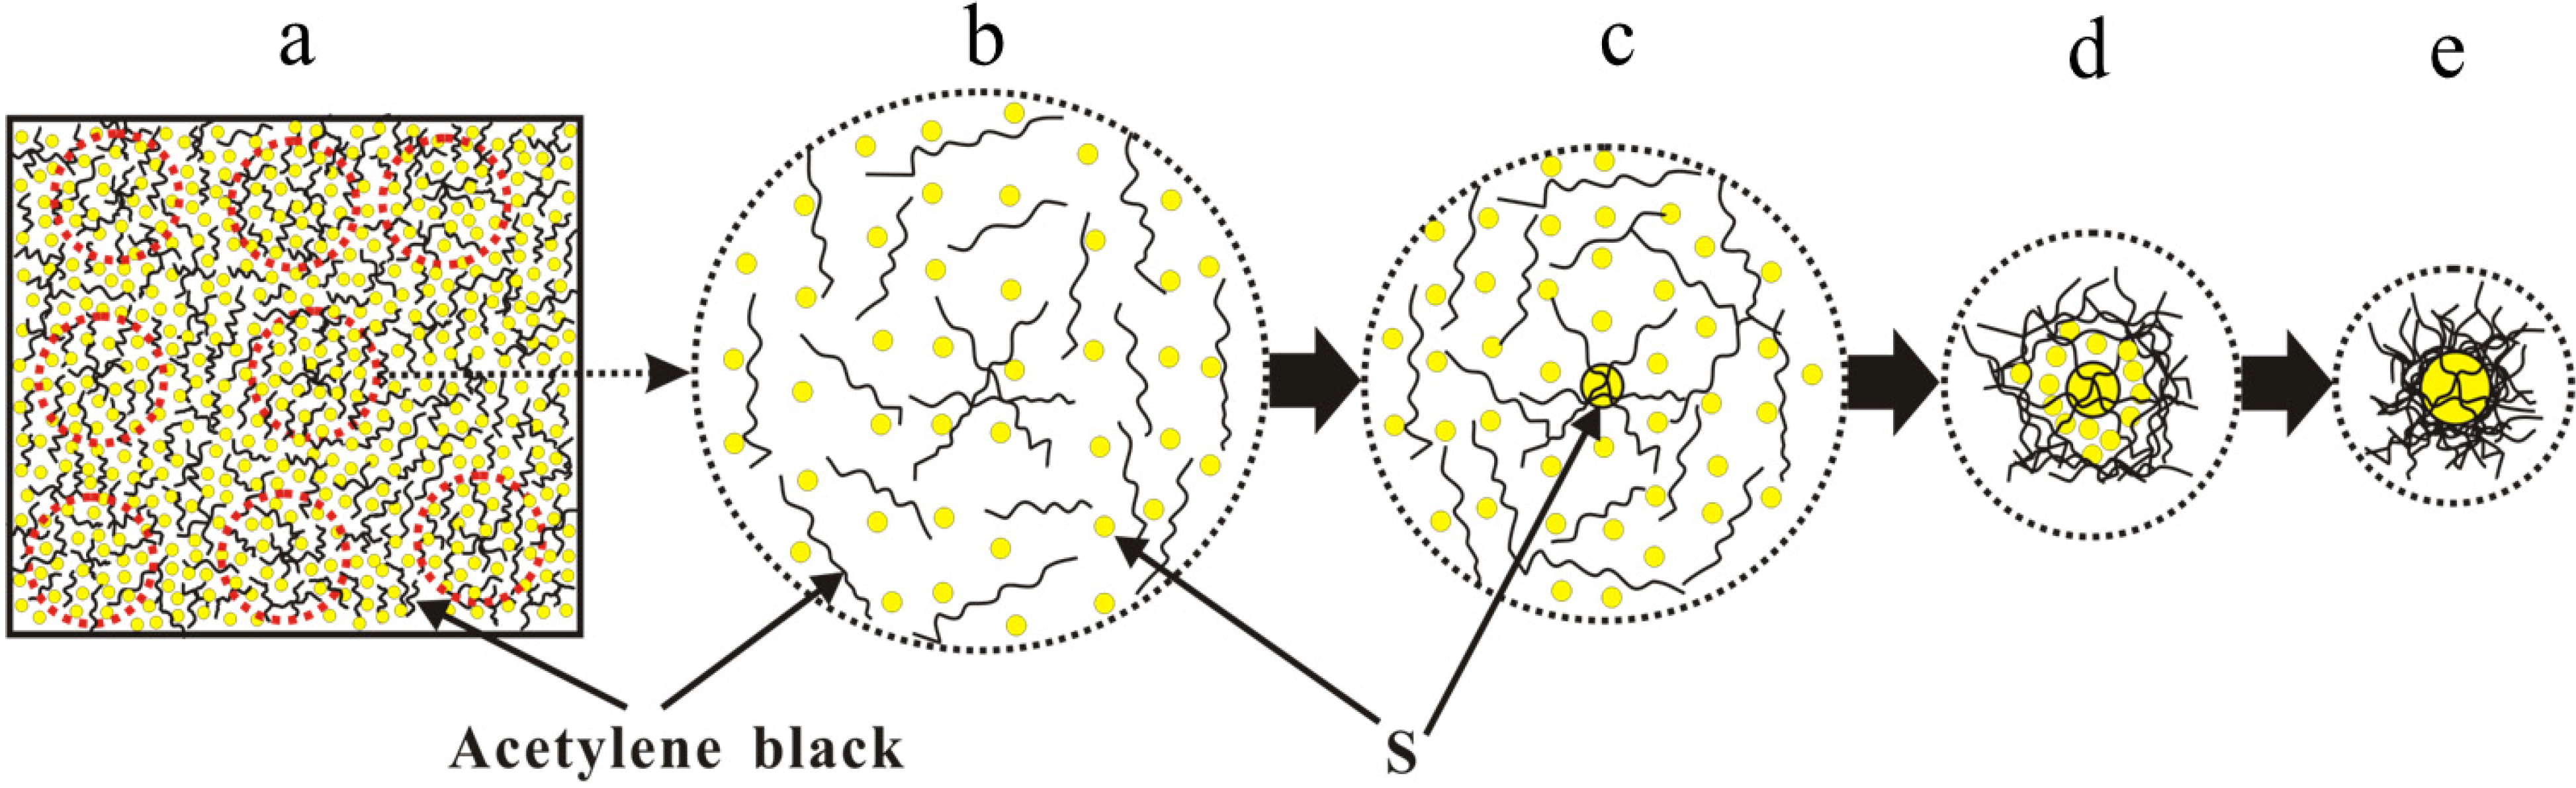
According to the kinetics theory of nucleation and crystallization [
14], we propose a nucleation and crystal growth schematic as shown in
Figure 5. As the solvent evaporates, the S/CS
2 solution is gradually concentrated and eventually becomes saturated. The cyclic molecule S
8 [
15] first nucleates on those sites where a high concentration of fibers or pores exist (as shown in
Figure 5a,b), and here S crystals will grow constantly (see
Figure 5c). In the end, this yields the AB/S structural composite materials which are depicted in
Figure 5d,e.
Figure 5.
The nucleation and crystal growth schematic diagram of S8 in the CS2 solution containing AB at a low solvent evaporation rate and AB concentration process. (a) and (b) nucleation site; (c) nucleation; (d) and (e) grain growth and AB concentration coating.
Figure 5.
The nucleation and crystal growth schematic diagram of S8 in the CS2 solution containing AB at a low solvent evaporation rate and AB concentration process. (a) and (b) nucleation site; (c) nucleation; (d) and (e) grain growth and AB concentration coating.
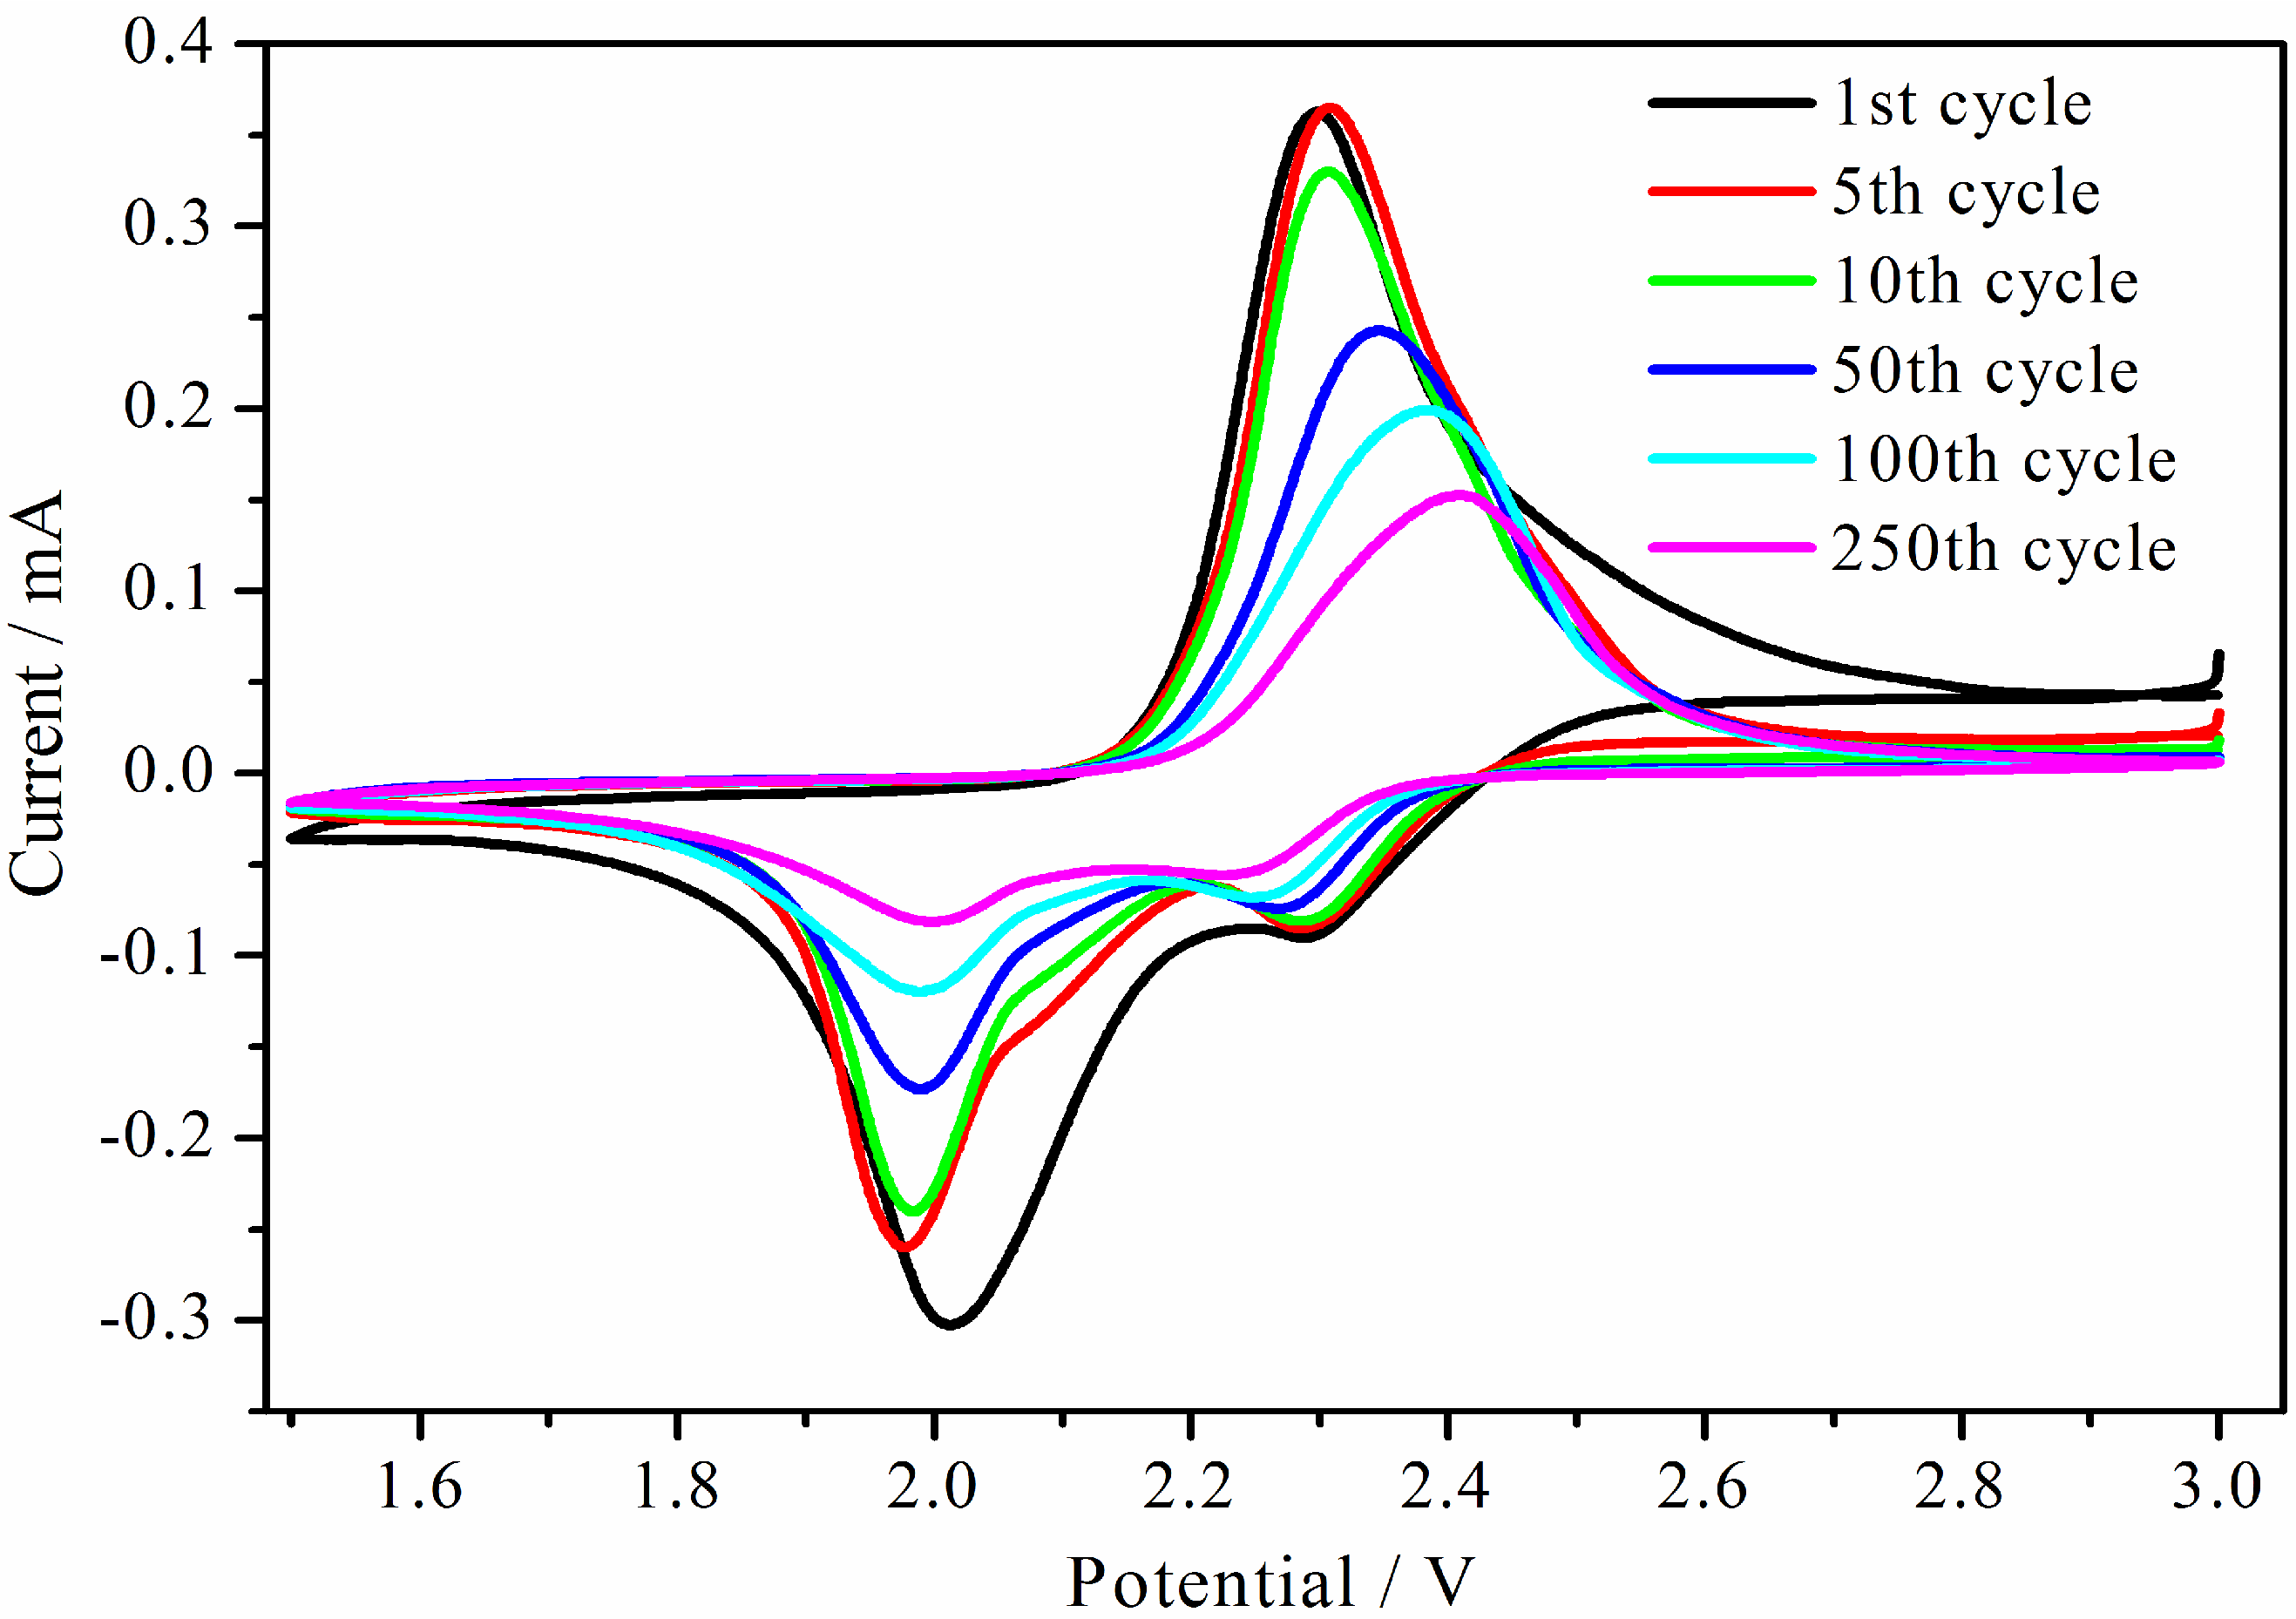
Figure 6 shows results from cyclic voltammetry with 0.05 mV s
−1 for sample AB/S-4. There are two reduction peaks at 2.35 V and 2.05 V (
vs. Li/Li
+) when scanning in the negative direction in the first cycle, which is consistent with the literature for a two-step reaction between S and Li [
16,
17]. An oxidation peak is observed at 2.3 V (
vs. Li/Li
+) when scanning in the positive direction. The 2.35 V reduction peak is caused by the set of reactions (
/S
8c,
/
), which is based on the successive one-electron reduction (2 × 1 e) of the cyclic molecule S
8c (Here, c in the subscripts denotes cyclic structure for the S or the polysulfide in question). This is followed by the open ring reaction
and a series of chemical reactions (disproportionation reactions and cracking reactions), generating the anion radical
(
n = 3–4). The 2.05 V reduction peak in our data is related to the redox couples
/
, and
(
n = 3–4), where another series of chemical reactions will occur to finally create Li
2S and Li
2S
2 [
18,
19]. The 2.3 V oxidation peak arises from reactions wherein Li
2S and Li
2S
2 are involved in a series of chemical and electrochemical reactions to generate long-chain polysulfides
(4 <
n ≤ 8) [
16,
20], but these are not completely oxidized to form S [
16]. In the cycles which follow, the 2.35 V and 2.0 V reduction peaks see their potential shifted toward the negative direction, while the 2.3 V oxidation peak has its potential shifted toward the positive direction. However, the scope in their variation is small and the ∆E (difference between 2.3 V oxidation peak potential and 2.0 V reduction peaks potential) is also small (compared with other results as reported in the literature [
4]). Our CV results indicate that the AB/S-4 composite maintains good reversibility, even after 250 cycles.
Figure 6.
Cyclic voltammograms of AB/S-4.
Figure 6.
Cyclic voltammograms of AB/S-4.
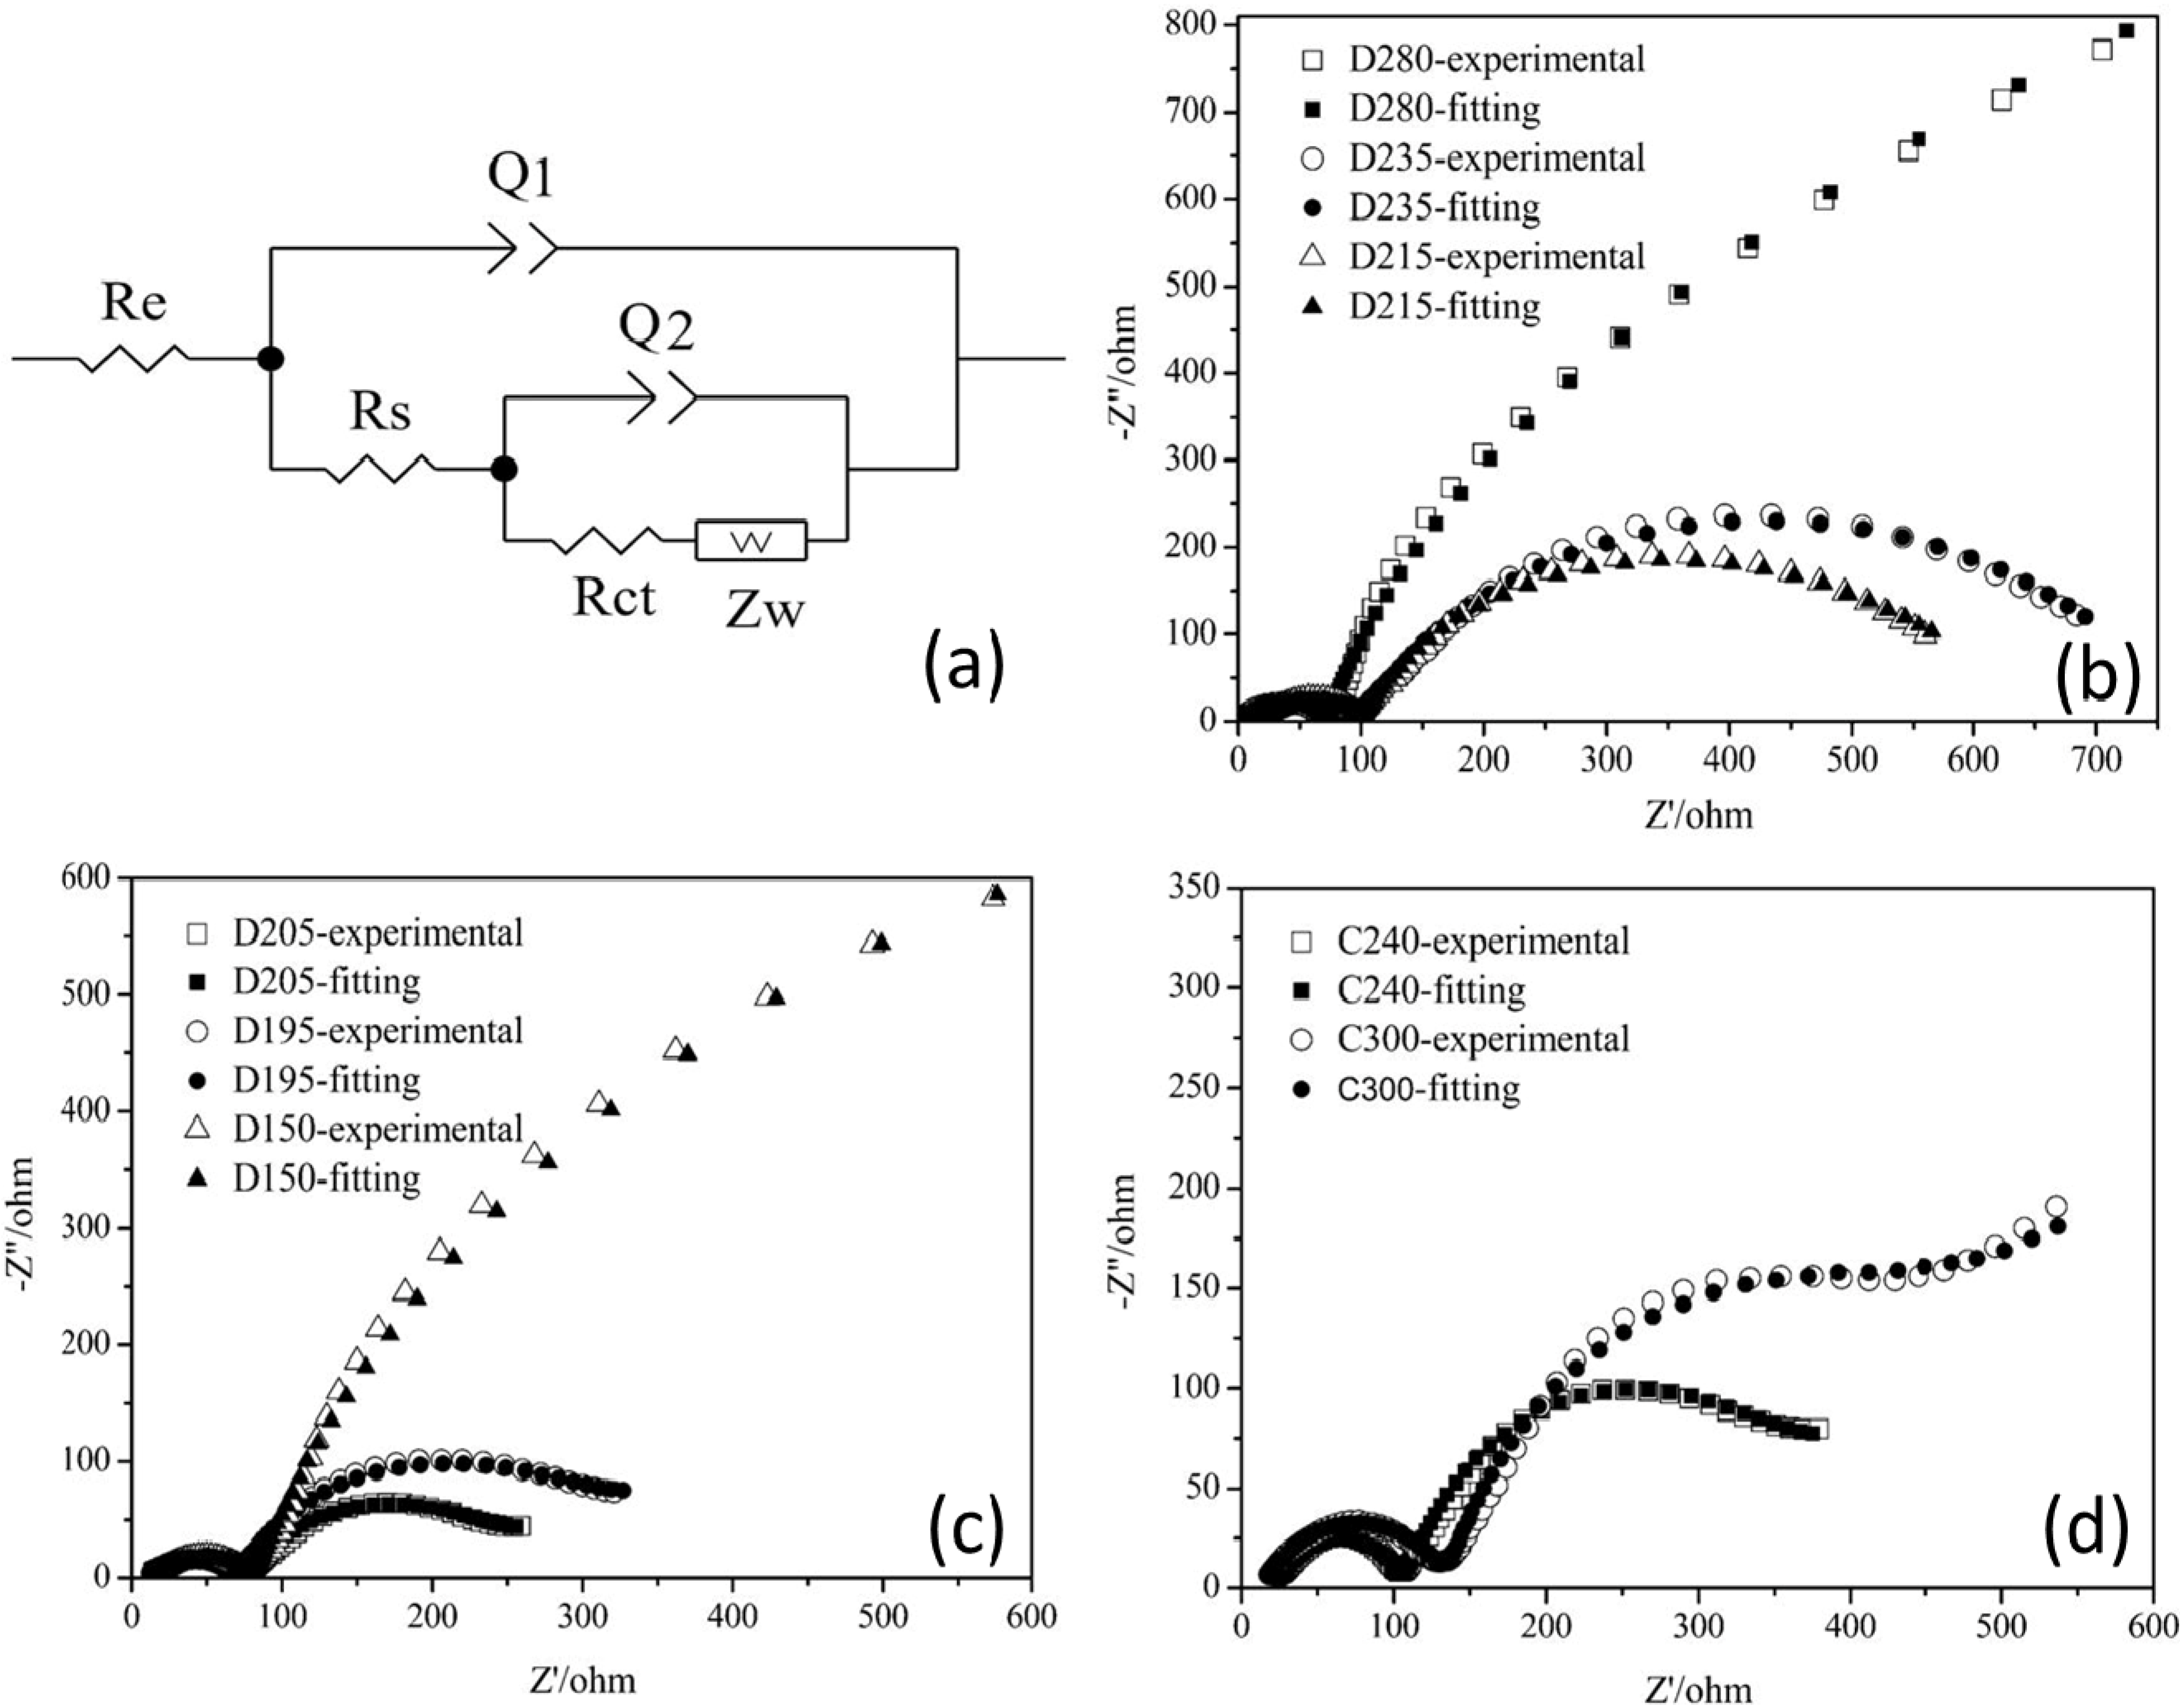
Before analyzing sample AB/S-4 electrodes by EIS, an equivalent circuit should be established, as shown in
Figure 7a. EIS measurements for the composite cathodes in different discharge/charge states were carried out, and the results are shown in
Figure 7b–d. We used the electrochemical impedance modeling software ZSimpwin to fit curves to the experimental EIS curves, using the equivalent circuit, and show the results in
Figure 7b–d and
Table 3. Compared with the state of charging to 2.4 V, the impedance curve in the high frequency region of the composite cathode when charging to 3.0 V showed no obvious change, while both the depressed semicircle in the mid frequency region and the inclined line in the low frequency region followed a trend of changing toward the impedance spectra of the initial composite cathode. But the impedance spectra, although still composed of two depressed semicircles in the high and mid frequency regions and a short inclined line in the low frequency region, is markedly different from the impedance spectra of the composite cathode that contains elemental S (the first and the second types of impedance spectra). These spectra reveal that Li
2S
2 and Li
2S are not completely oxidized to produce elemental S, consistent with results from the literature [
21,
22,
23].
Table 3.
Fitted values of the various elements in the equivalent circuit at different discharge/charge state.
Table 3.
Fitted values of the various elements in the equivalent circuit at different discharge/charge state.
| Codes | Potential/V | Re/Ω | Q1 | Rs/Ω | Q2 | Zw/Ω | Rct/Ω |
|---|
| C1/F | n1 | C2/F | n2 |
|---|
| D280 | 2.80 | 4.775 | 1.38 × 10⁻⁵ | 0.7414 | 68.39 | 0.005819 | 0.8597 | 0.004567 | 1337 |
| D235 | 2.35 | 12.30 | 4.39 × 10⁻⁵ | 0.6208 | 93.8 | 0.002463 | 0.7859 | 0.2296 | 642.4 |
| D215 | 2.15 | 14.45 | 5.201 × 10⁻⁵ | 0.6071 | 91.01 | 0.003007 | 0.8192 | 0.09192 | 480.5 |
| D205 | 2.05 | 11.25 | 6.812 × 10⁻⁵ | 0.5958 | 71.61 | 0.005709 | 0.8035 | 0.104 | 163.9 |
| D195 | 1.95 | 10.52 | 8.082 × 10⁻⁵ | 0.5871 | 63.04 | 0.005102 | 0.8122 | 0.06631 | 246.5 |
| D150 | 1.50 | 11.97 | 1.033 × 10⁻⁵ | 0.5669 | 72.96 | 0.005259 | 0.8265 | 0.03935 | 1759 |
Figure 7.
EIS of AB/S-4 electrodes. (a) Equivalent circuit used in fitting the data; (b) Nyquist plots for 2.80 V (D280), 2.35 V (D235) and 2.15 V (D215) for initial discharge; (c) Nyquist plots for 2.05 V (D205), 1.95 V (D195) and 1.50 V (D150) for initial discharge; (d) Nyquist plots for 2.40 V (C240) and 3.00 V (C300) for initial charge.
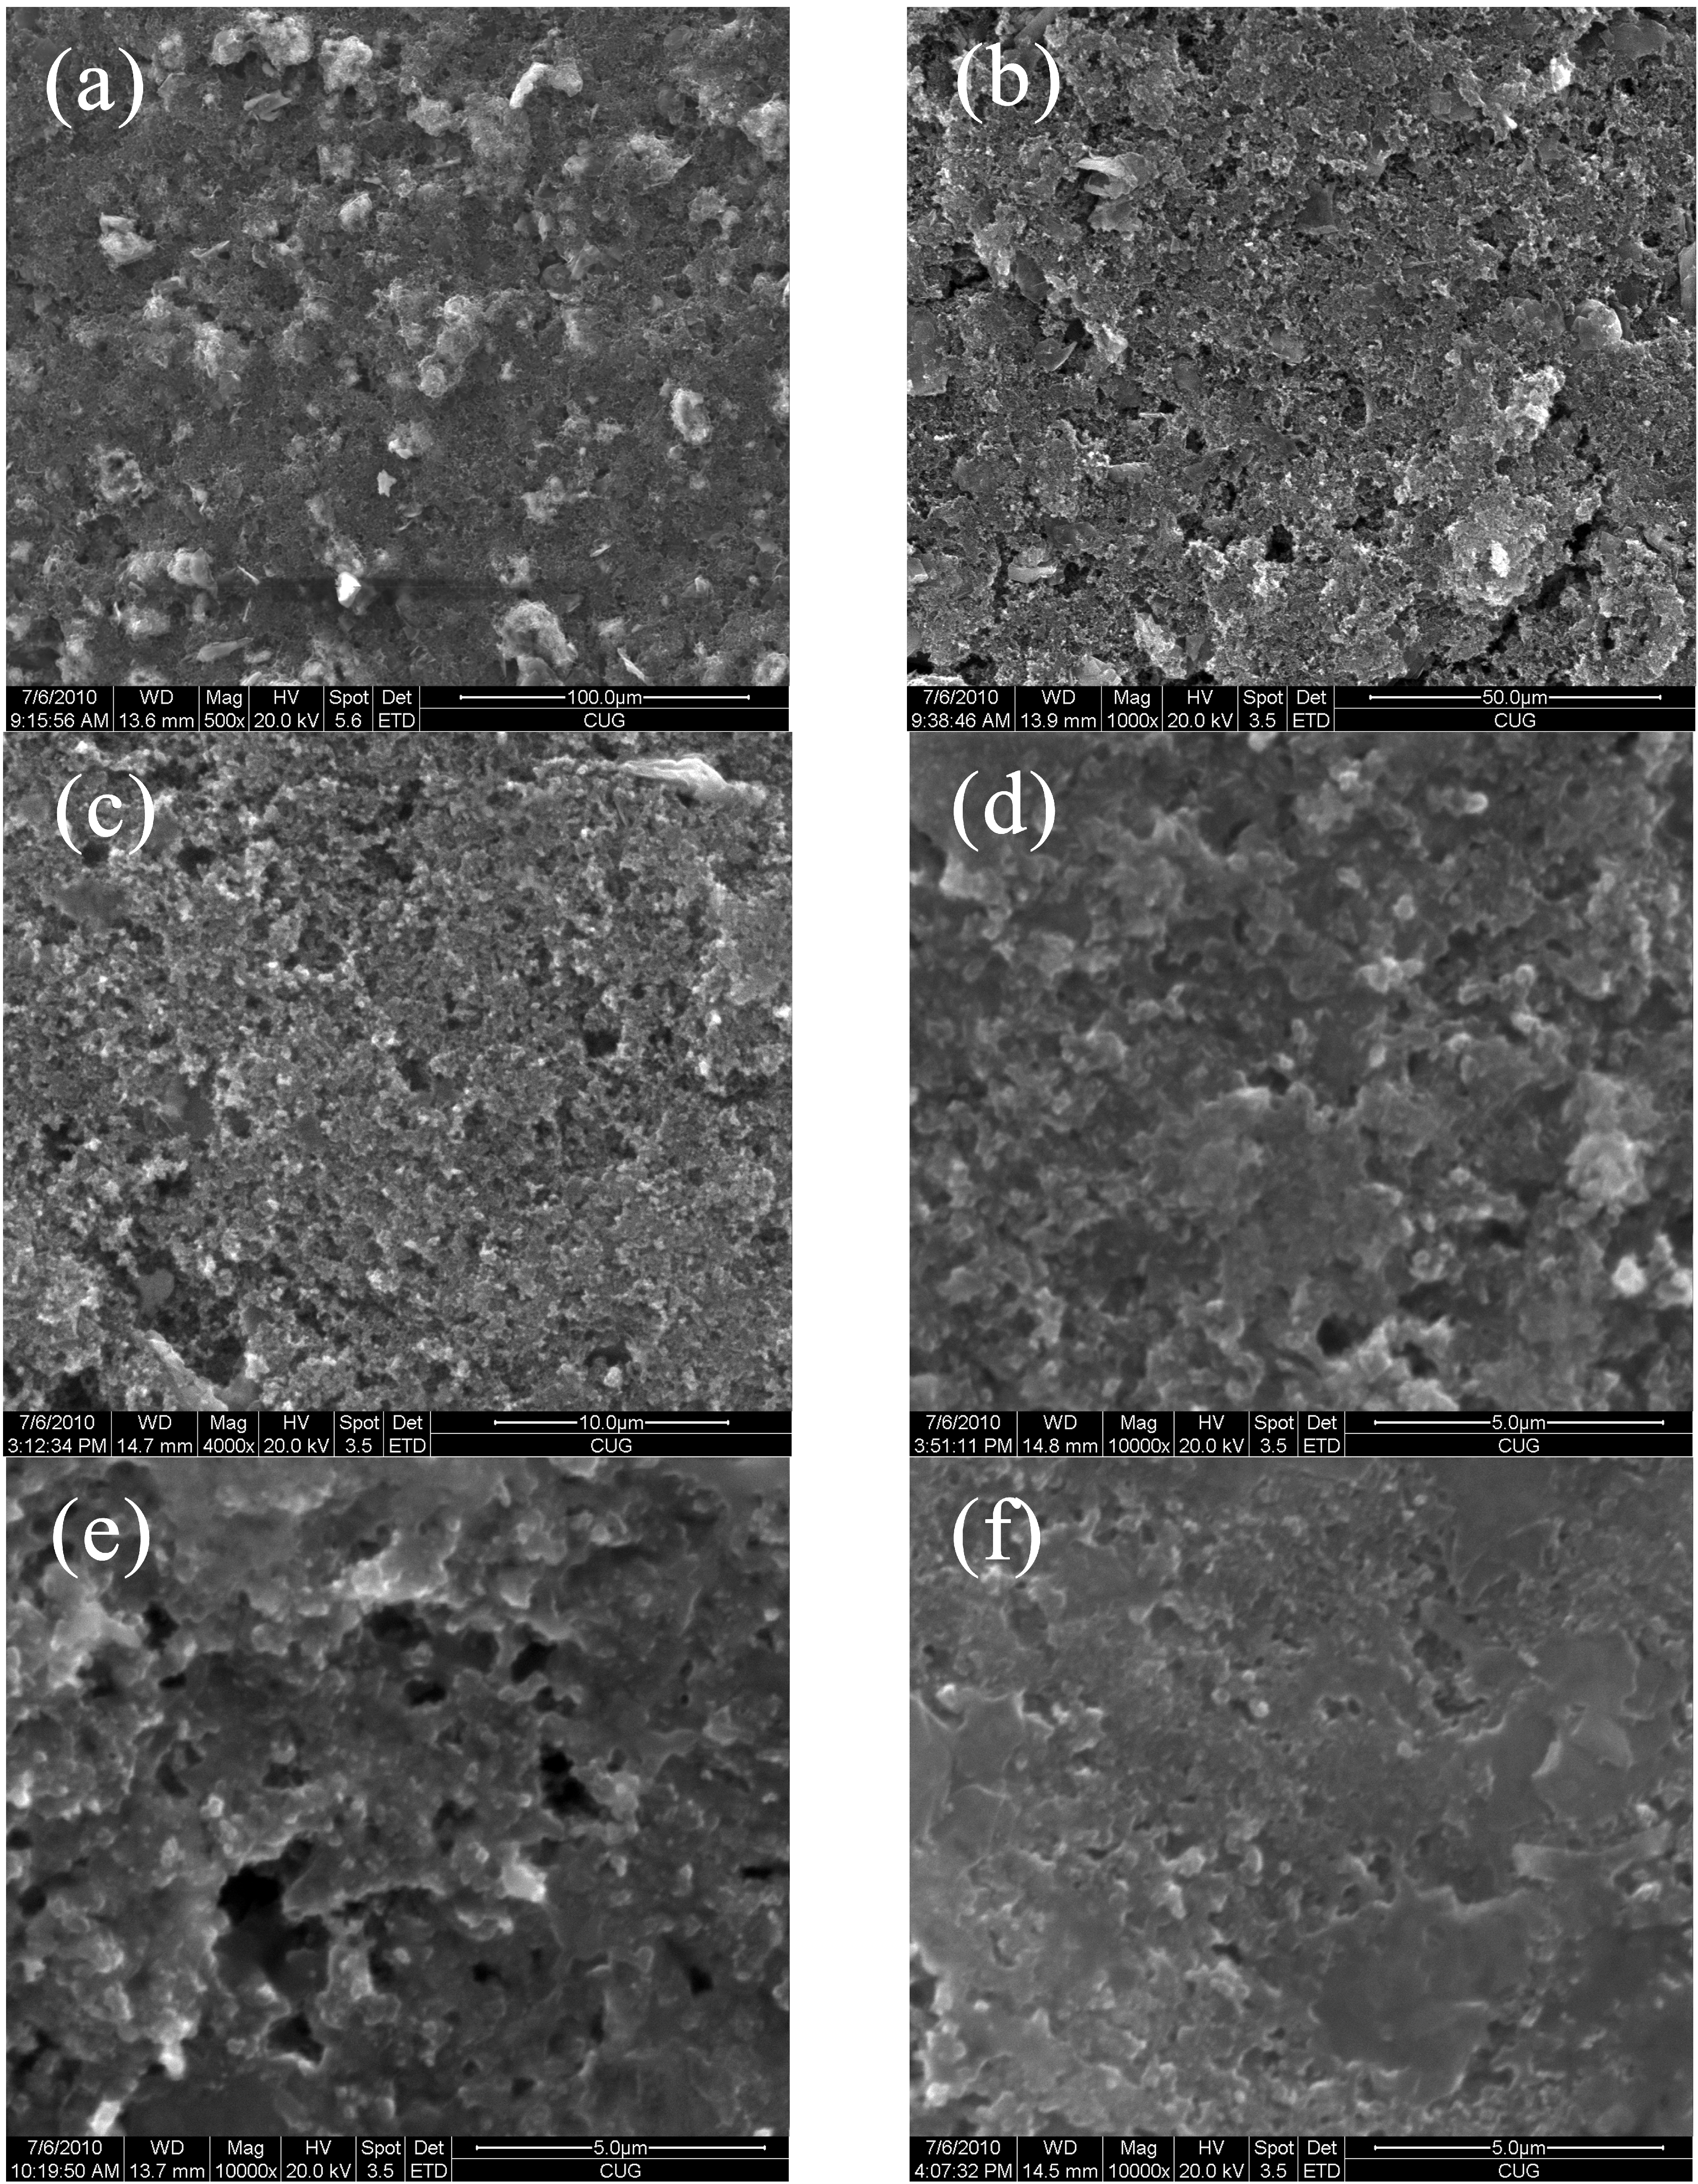
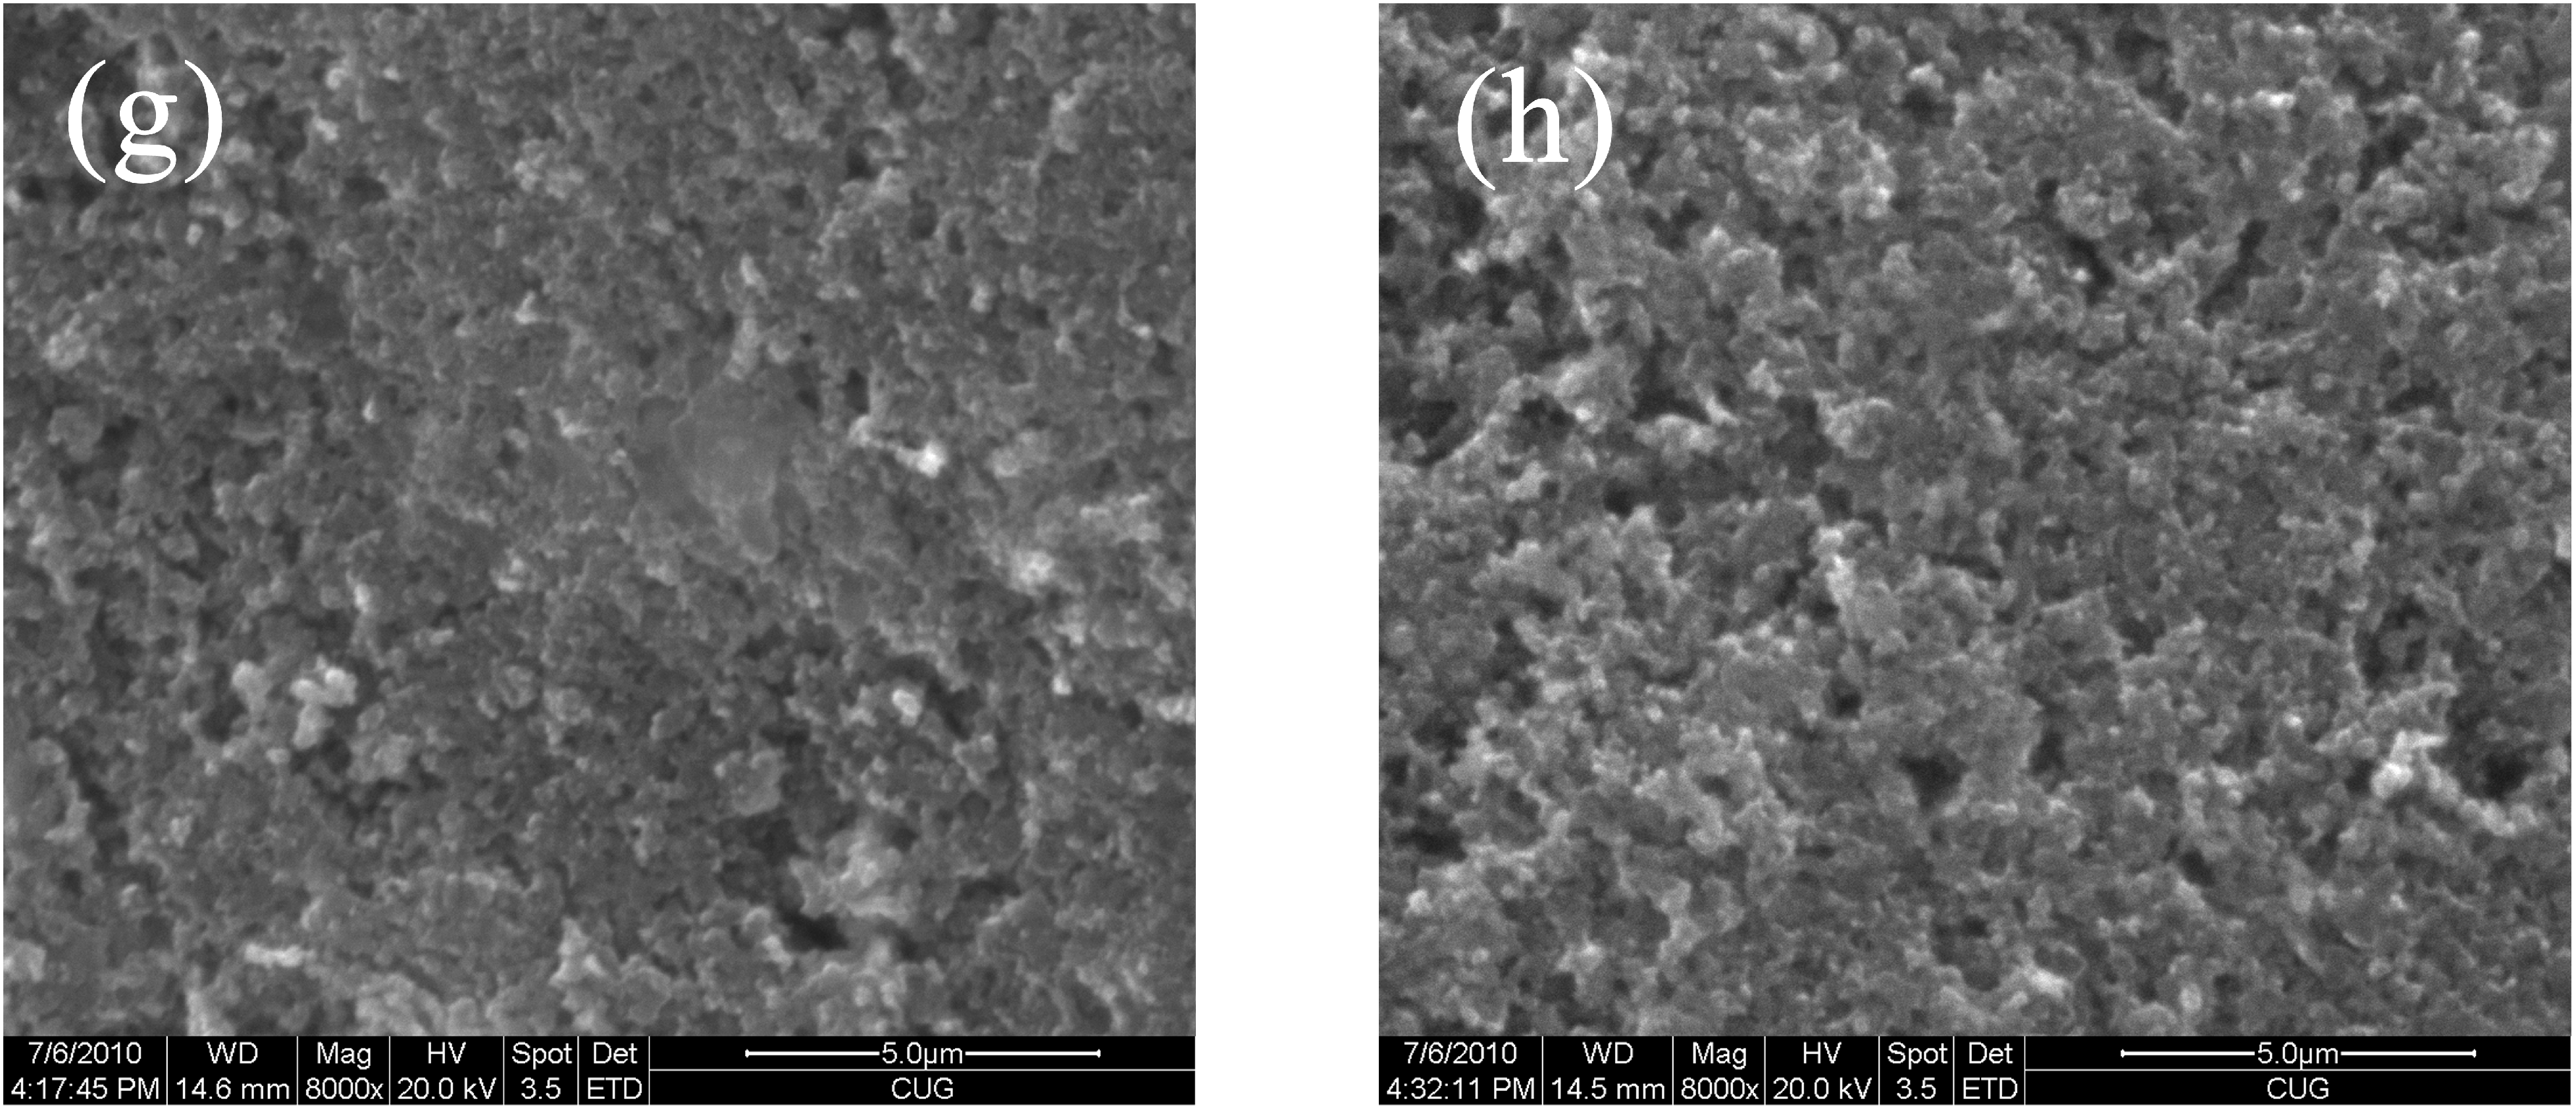
The ESEM images of sample electrode AB/S-4 at different charge-discharge states are displayed in
Figure 8. Prior to ESEM measurements, the remaining soluble polysulfides in the electrodes were completely washed away with dimethoxyethane, so that only solid compounds were observed in the ESEM images. Before a discharge, the original composite cathode was comprised of a homogenous mix of the S/AB composite, AB, and PVDF (see
Figure 8a). During the upper voltage plateau, with the discharge reactions going on, the S/AB composite particles in the cathode shrink and only a carbon matrix can be observed (
Figure 8b,c). At the end of the first discharge cycle, most of the S in S/AB composite particles has disappeared. At the beginning of the lower voltage plateau region, the solid film on the surface of the cathode first appears (
Figure 8d) and then becomes more dense during the following discharge process (
Figure 8e,f) [
23]. When charging to 2.4 V, the solid film covering on the surface of the cathode is significantly reduced (
Figure 8g), and no solid film layer or S particles in the cathode are apparent (
Figure 8h) after charging to 3.0 V, which means that the conversion of Li
2S
2 and Li
2S into soluble polysulfide has occurred. These results are consistent with the analysis of EIS.
Figure 8.
ESEM images of AB/S-4 electrodes during the initial discharge and charge process. (a) point D280 with 2.80 V; (b) point D215 with 2.15 V; (c) point D205 with 2.05 V; (d) point D195 with 1.95 V; (e) point D150 with 1.50 V; (f) point D280 with 2.80 V; (g) point C240 with 2.40 V; (h) point C300 with 3.00 V.
At the beginning of the upper voltage plateau, electrochemical reactions probably occurred at the interface between S and AB, owing to the ease of electron transport from AB to S. However, in the following discharge reactions, the interfacial connection between S and AB is broken after the connection disappears. Despite the fact that electron transfer to S is impossible after the interfacial contact is lost, chemical reactions between S and polysulfides still convert S particles to polysulfides [
17]. From the upper voltage plateau to the lower voltage plateau, S is further reduced and the final products are the Li
2S
2 and Li
2S. Their formation can proceed in two ways: one is wherein those lithium polysulfides that are adsorbed on the surface of the cathode receive electrons and are reduced to Li
2S
2 and Li
2S, the other one is when lithium polysulfides, dissolved in the electrolyte, diffuse to the surface of the cathode and are there reduced. These reduction products then diffuse into the electrolyte again and where they drive a series of chemical reactions. Finally, the products of said chemical reactions combine with Li
+ and are deposited on the surface of the cathode.
Figure 9 depicts UV-VIS spectroscopy results for the soluble polysulfide solutions that form when the system is discharged to 2.35 V, 2.05 V and 1.50 V at the first cycle for sample electrode AB/S-4, corresponding to the points D235, D205 and D150, respectively. Before UV-VIS spectroscopy measurements, the discharged cathodes were immersed into a solvent identical to the one used in the cell, so as to obtain polysulfide solutions for taking measurements. When the cell is discharged to 2.35 V (the upper plateau region), the absorption peaks of the solution lie mainly in the wavelength range of 200-400 nm (see D235 in
Figure 9), indicative of long chain polysulfides (Li
2S
x, 4 <
x ≤ 8) [
24,
25]. The wavelengths of these absorption peaks are increased when discharging to 2.05 V and 1.5 V (the lower plateau region), revealing that some of the long chain polysulfides have transformed to short chain polysulfides (Li
2S
x,
x ≤ 4) in the presence of discharge reactions. As shown on D205 and D150 in
Figure 9, both of the two polysulfide solutions corresponding to the lower plateau region exhibit different intensity absorbances at 316 nm (
), 365 nm (
), 420 nm (
), 460 nm (
) and 600 nm (
) [
25].
Figure 9.
UV-visual spectroscopy of soluble polysulfides solutions at initial discharging to 2.35 V (D235), 2.05V (D215) and 1.50 V (D150), respectively.
Figure 9.
UV-visual spectroscopy of soluble polysulfides solutions at initial discharging to 2.35 V (D235), 2.05V (D215) and 1.50 V (D150), respectively.
Upon inspection of
Table 3, it can be seen that polysulfides dissolving in the electrolyte in the initial discharges to 1.5 V are
,
,
,
and
, which produce a loss in the discharge capacity. Both of the absorption peaks of
and
appear in the UV-VIS spectroscopy data, which indicate that electrochemical reactions occurring during the lower plateau region should contain the reaction
/
. The reaction
and
may also be occurring, as evidenced by the existence of the absorption peak for
[
22,
26,
27]. However, the weak dissociation of
, even at room temperature, leads to low concentrations of
and thus produces an only non-obvious absorption peak for
. Its disproportionation is moderate, and the concentration of
is significantly larger than that of
at room temperature [
26]. Consequently, the electrochemical reactions that take place during the lower plateau region are mainly
/
. With a
increase and other polysulfide decreases in the electrolyte, there is a reduction in the intensity of the absorption peak as the discharge state changes from 2.05 V to 1.5 V, and
has good stability in the solution [
27]. We can infer that a series of chemical reactions in the system should eventually generate mostly
, and that electrochemical reactions consist mainly of
/
in the time interval of the lower plateau regions.
With knowledge of the structure of AB/S and armed with the results discussed above, one may deduce the nature of the chemical reactions taking place in the charge–discharge process of S electrodes. During the first discharge, the elemental S is transformed into long chain polysulfides (Li2Sx, 4 <x ≤8) via a series of chemical reactions and electrochemical reactions that occur at the time of the upper plateau region, as well as short chain polysulfides (Li2Sx, x ≤ 4) that are derived from long chain polysulfides. A series of chemical reactions and electrochemical reactions occur, which result in a combination with Li+ that has diffused into the AB/S composite via paths in the AB shell layer, leading ultimately to the generation of a solid film (Li2S2 and Li2S) during the lower plateau time. Over the course of a whole discharge process, the volume of our AB/S composite gradually expands. Even at 100% depth of charge, Li2S2 and Li2S are only oxidized to form long chain polysulfides, instead of elemental S.

