A Novel Miniature Culture System to Screen CO2-Sequestering Microalgae

Abstract
1. Introduction
2. Experimental Section
2.1. Organisms and Culture Media
2.2. Pre-Culture of Inocula and Measurement of Cell Growth

| Strains | Regression function | R2 |
|---|---|---|
| Chlorella sp. SJTU-3 | y = 1.7083x − 0.1254 | 0.997 |
| Chlorella pyrenoidosa SJTU-2 | y = 2.1024x − 0.0985 | 0.989 |
| Scenedesmus obliquus SJTU-3 | y = 2.3207x − 0.1104 | 0.998 |
| Chlamydomonas sajao | y = 2.8956x − 0.0948 | 0.998 |
| Selenastrum capricornutum | y = 2.1067x − 0.1107 | 0.981 |
| Dunaliella primolecta | y = 2.6777x − 0.0657 | 0.996 |
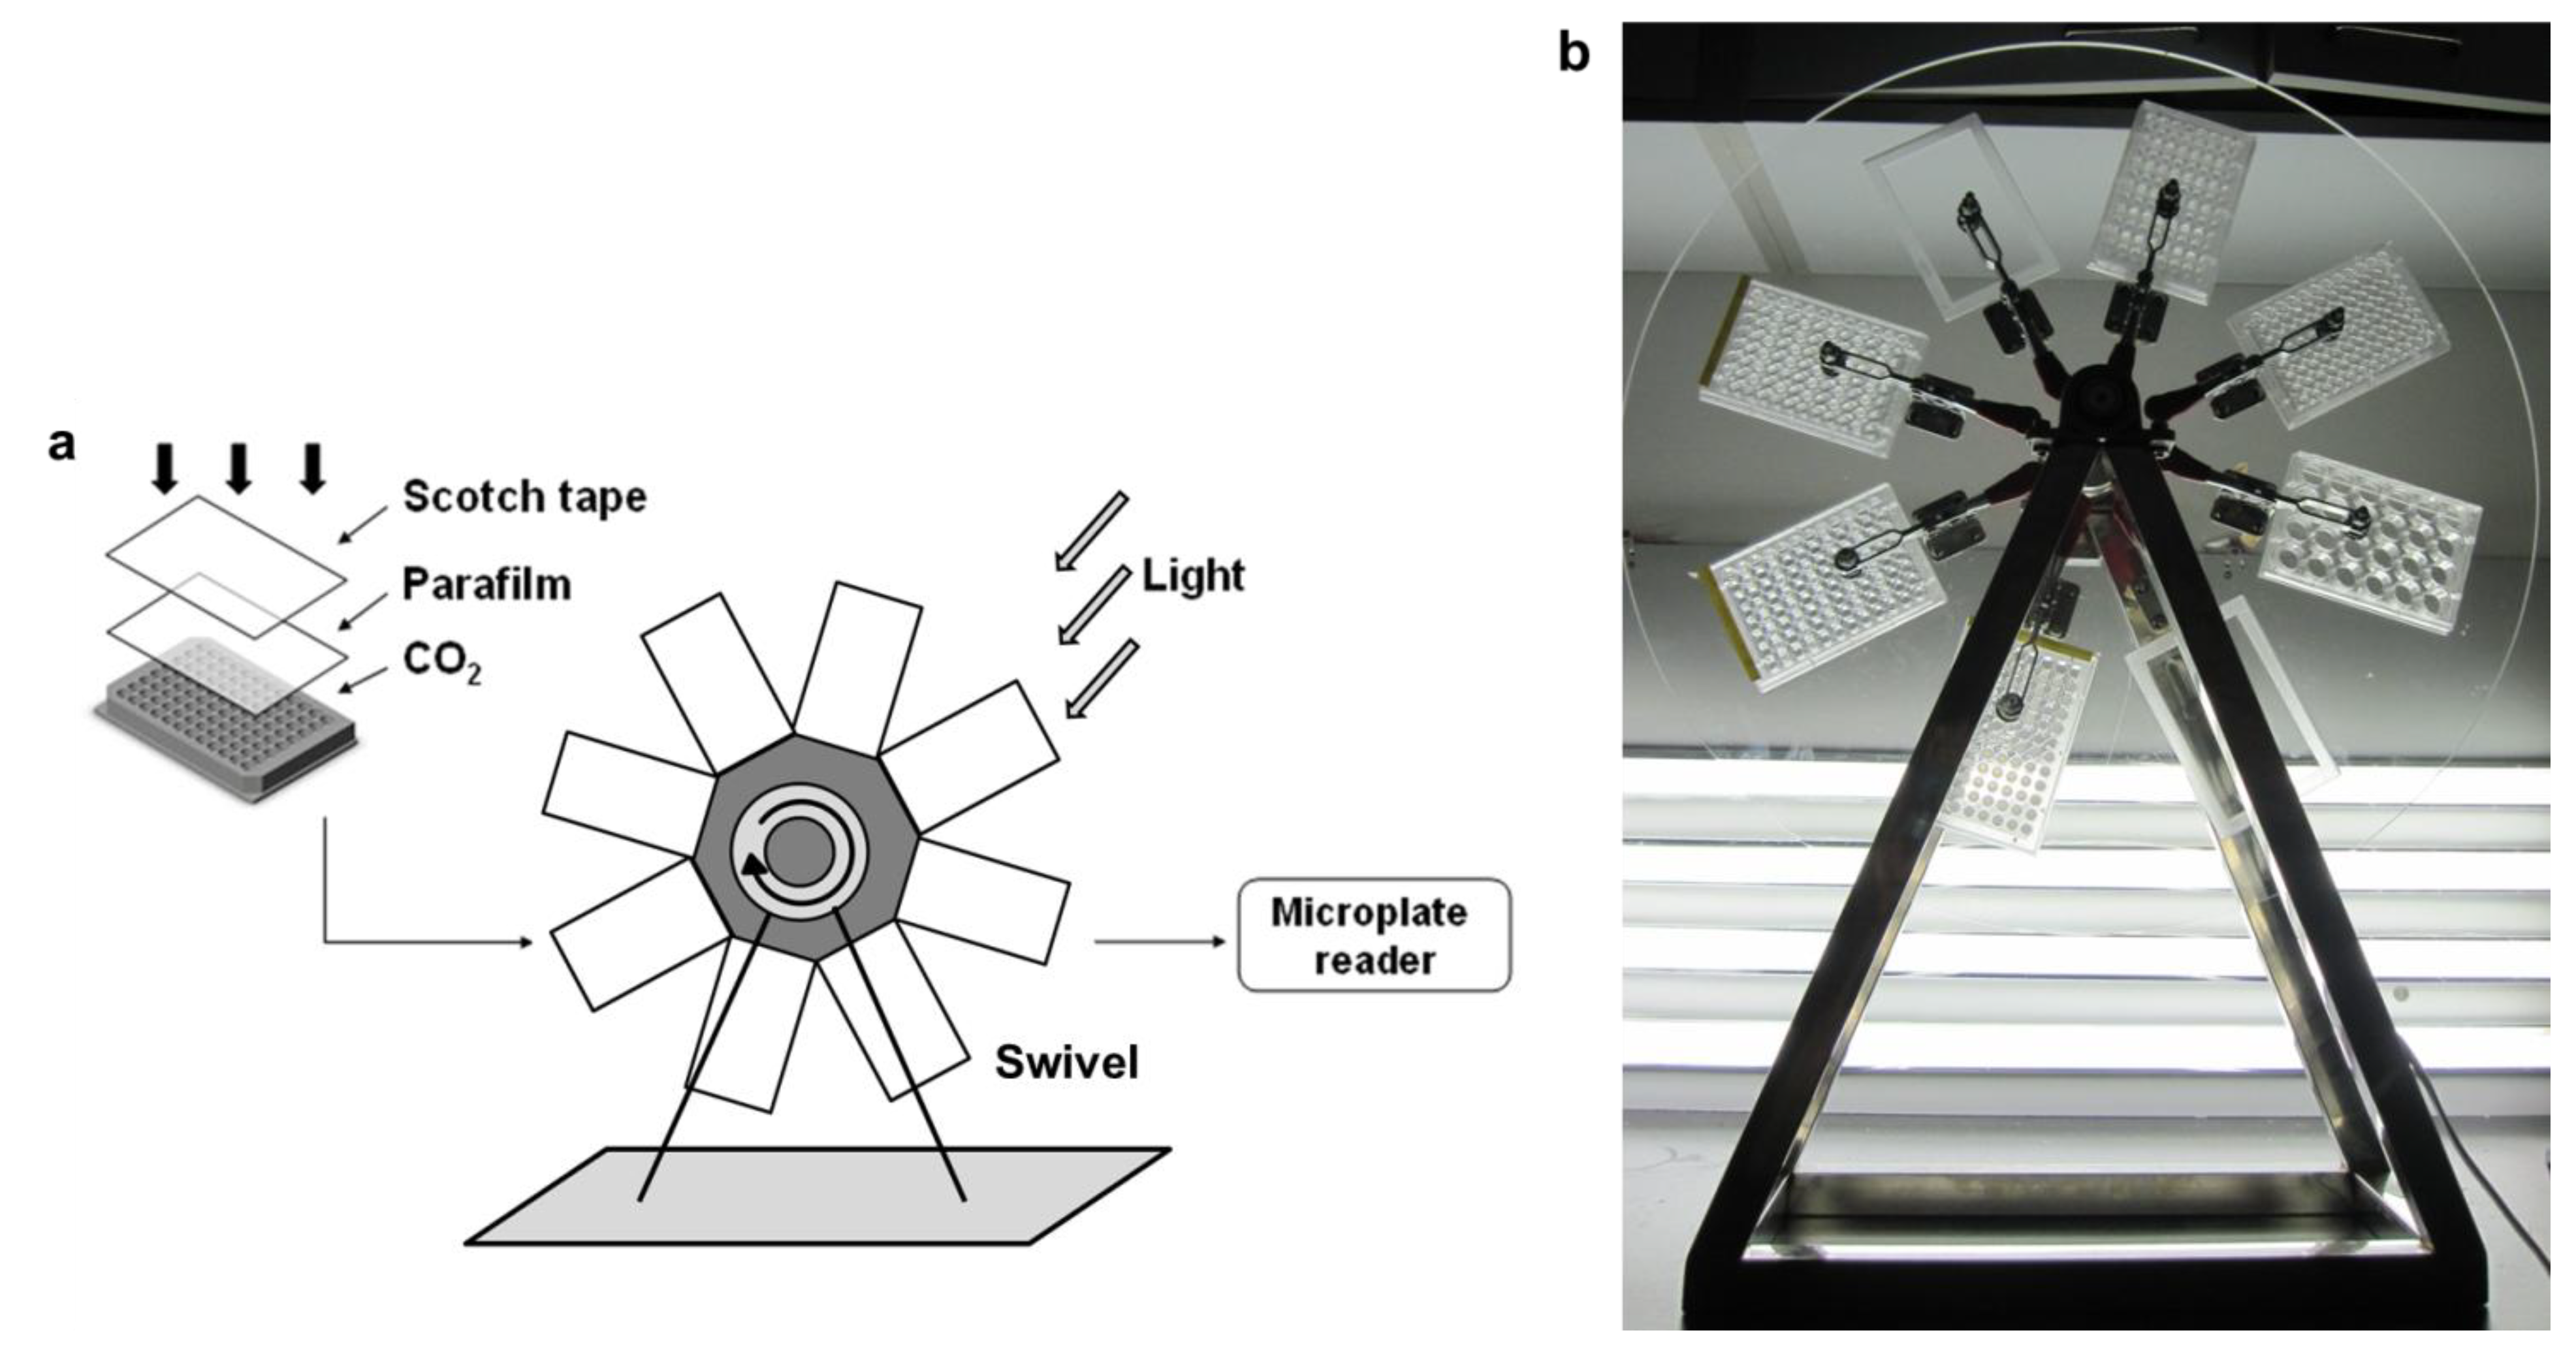
2.3. Design of the 96-Well Microplate Swivel System
2.4. Flask Cultivation System
2.5. Experimental Design to Verify the Reliability of the M96SS
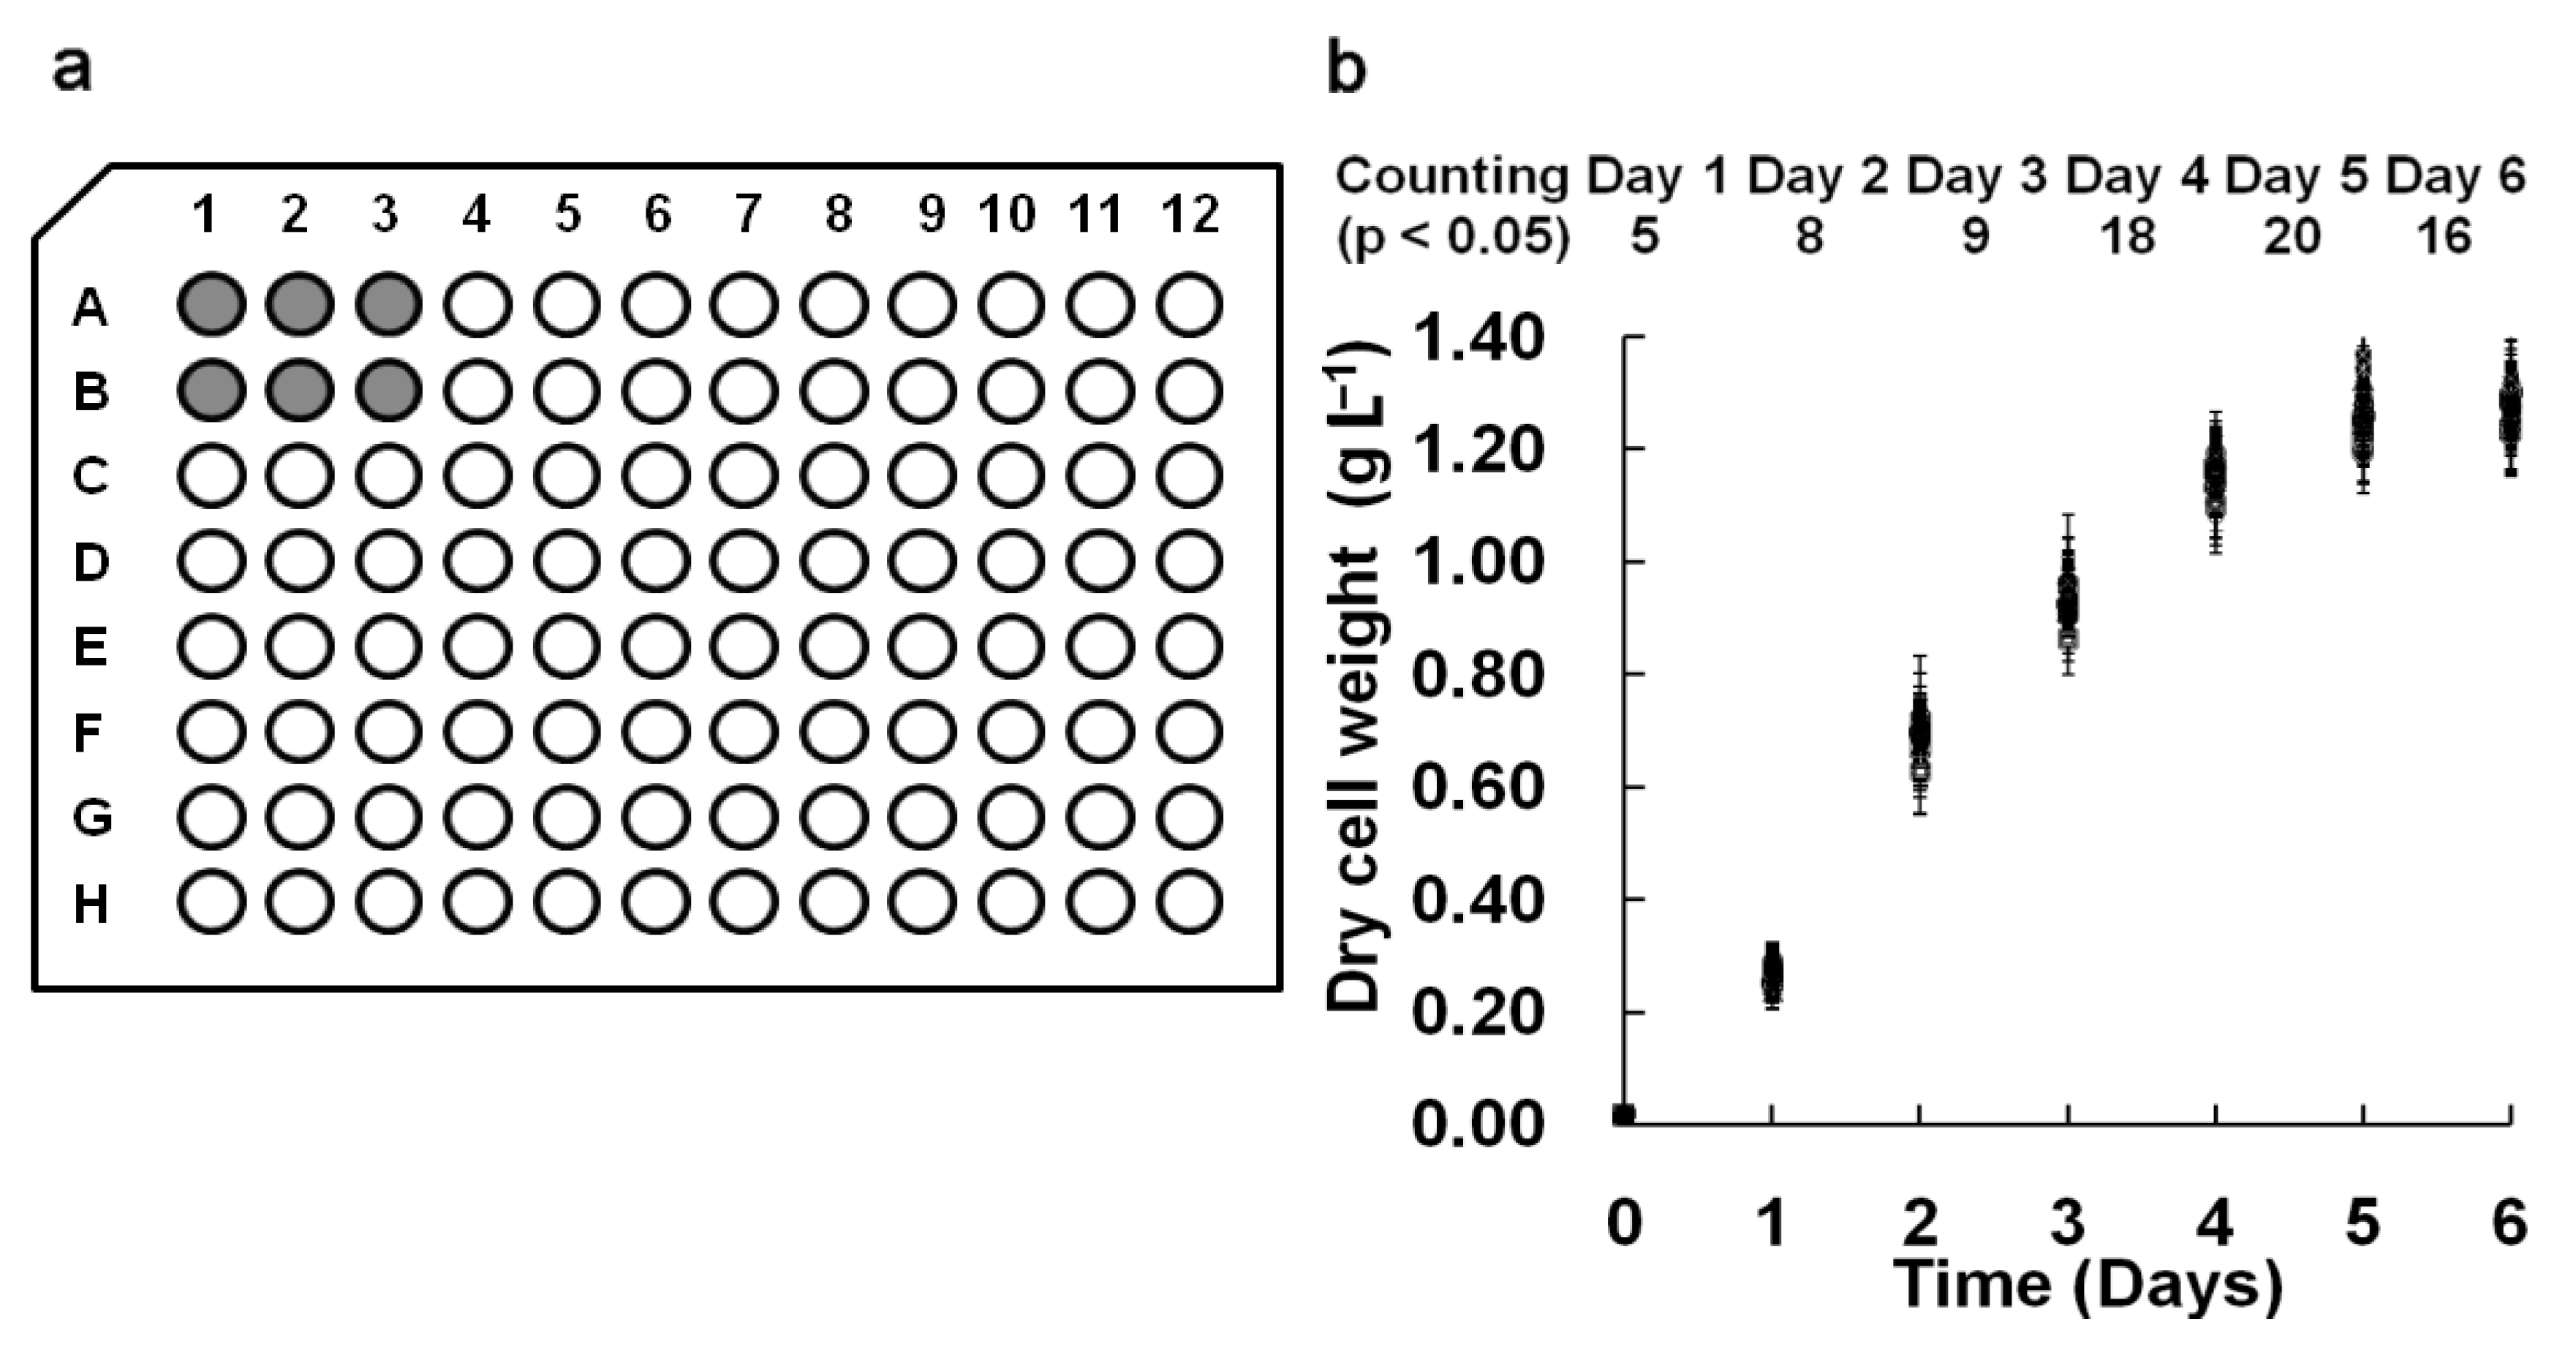
2.5.1. Reproducibility of Parallel Samples in the M96SS
2.5.2. Agreement between M96SS and Flask Cultures
2.6. Sample Evaporation in M96SS and Shaken Microplates
2.7. Comparison of Flask and M96SS Cultures for Screening for CO2 Fixation
2.8. CO2 Supply Conditions
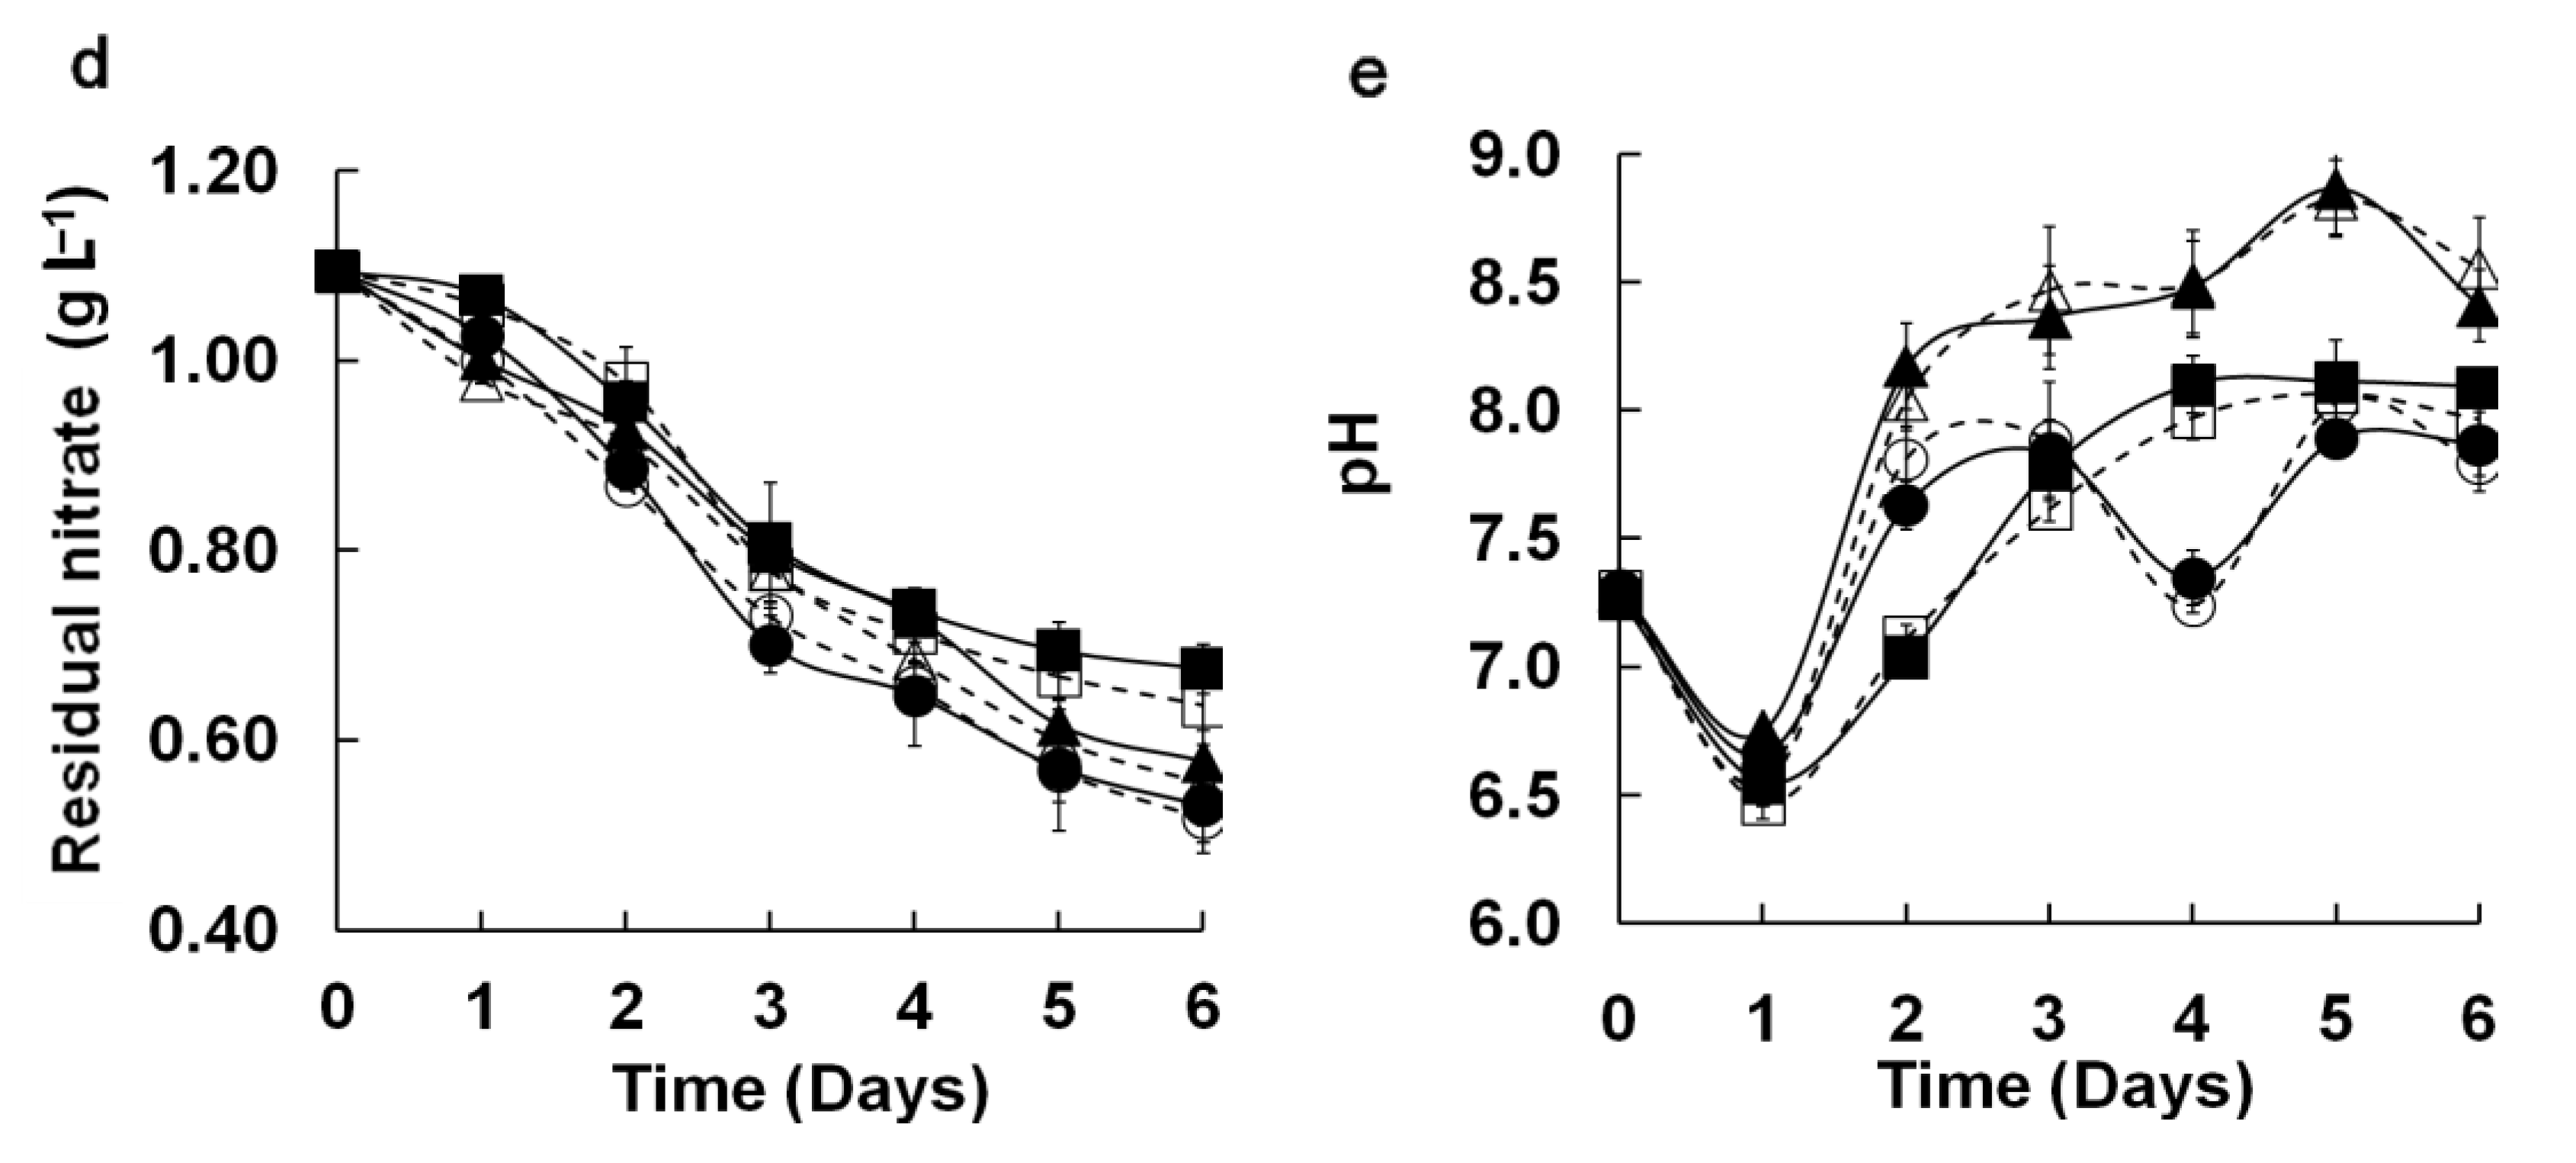
2.9. Measurement of Residual Nitrate in Medium
2.10. Measurement of pH in Flask and M96SS Cultures
2.11. Measurement of CO2 Fixation in Microalgae
3. Results and Discussion
3.1. Verification of the Reliability of M96SS
3.1.1. Consistency of Parallel Samples in M96SS
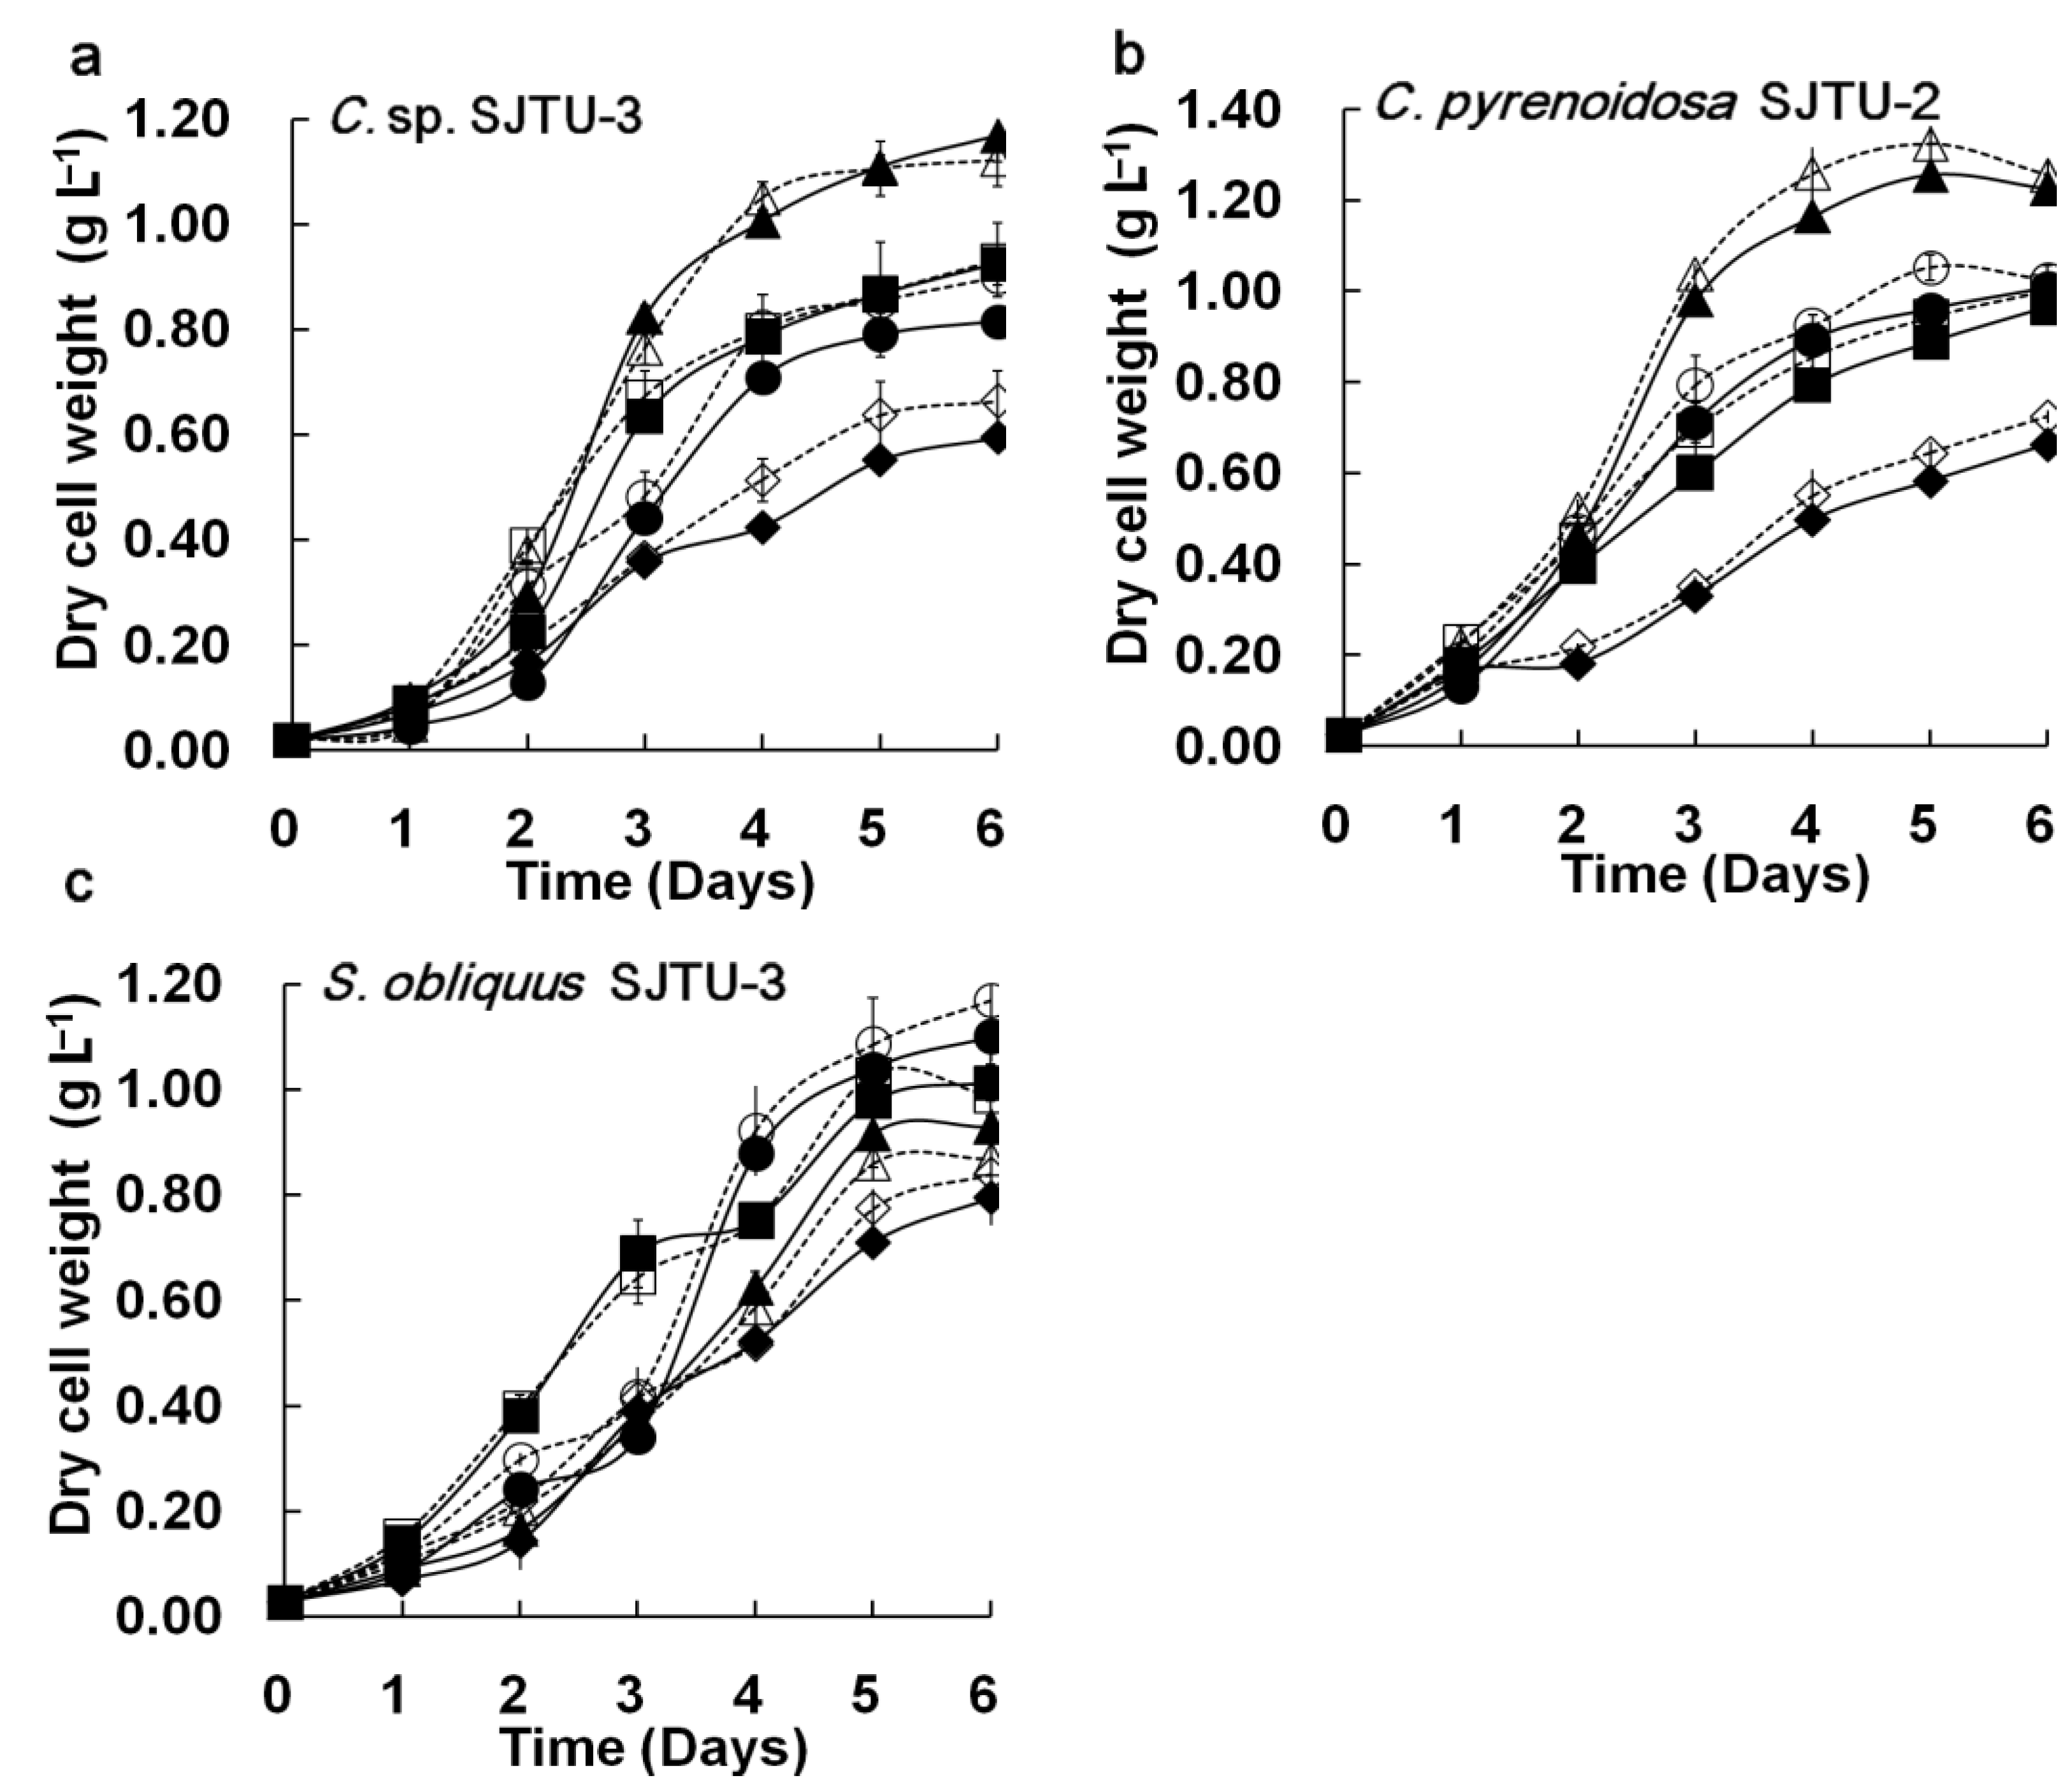
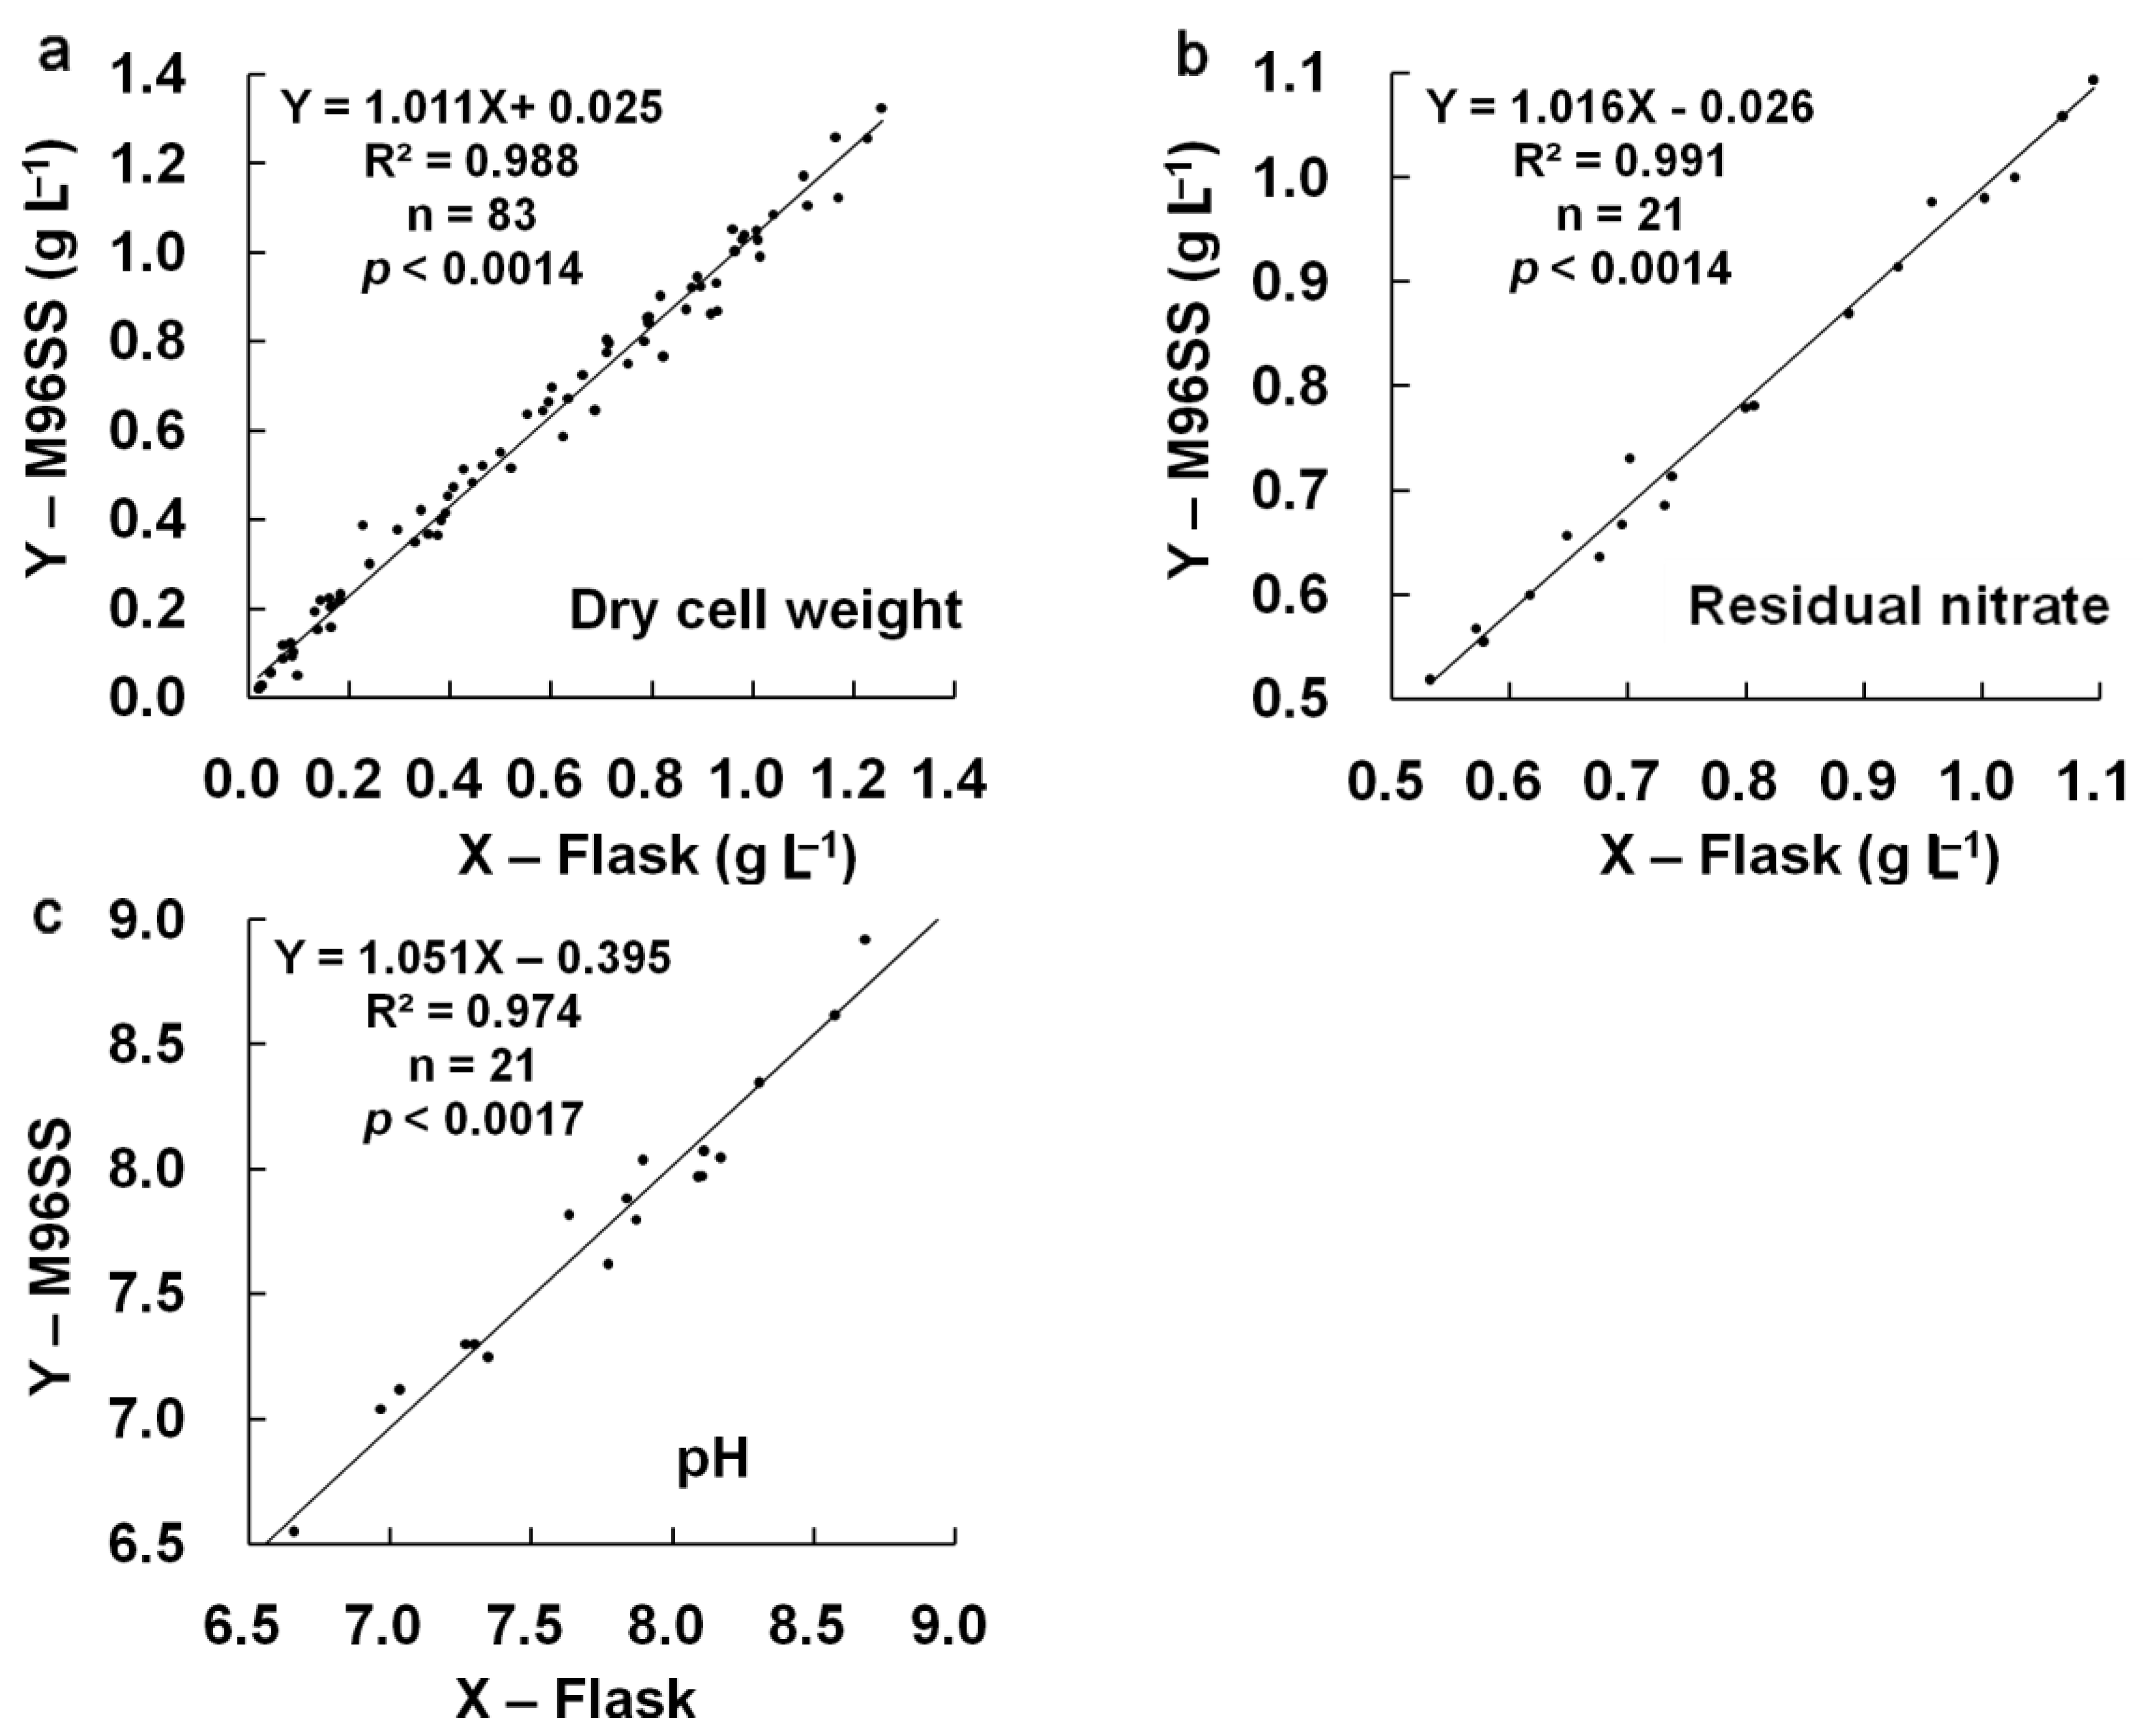
3.1.2. Agreement between M96SS and Traditional Flask Culture
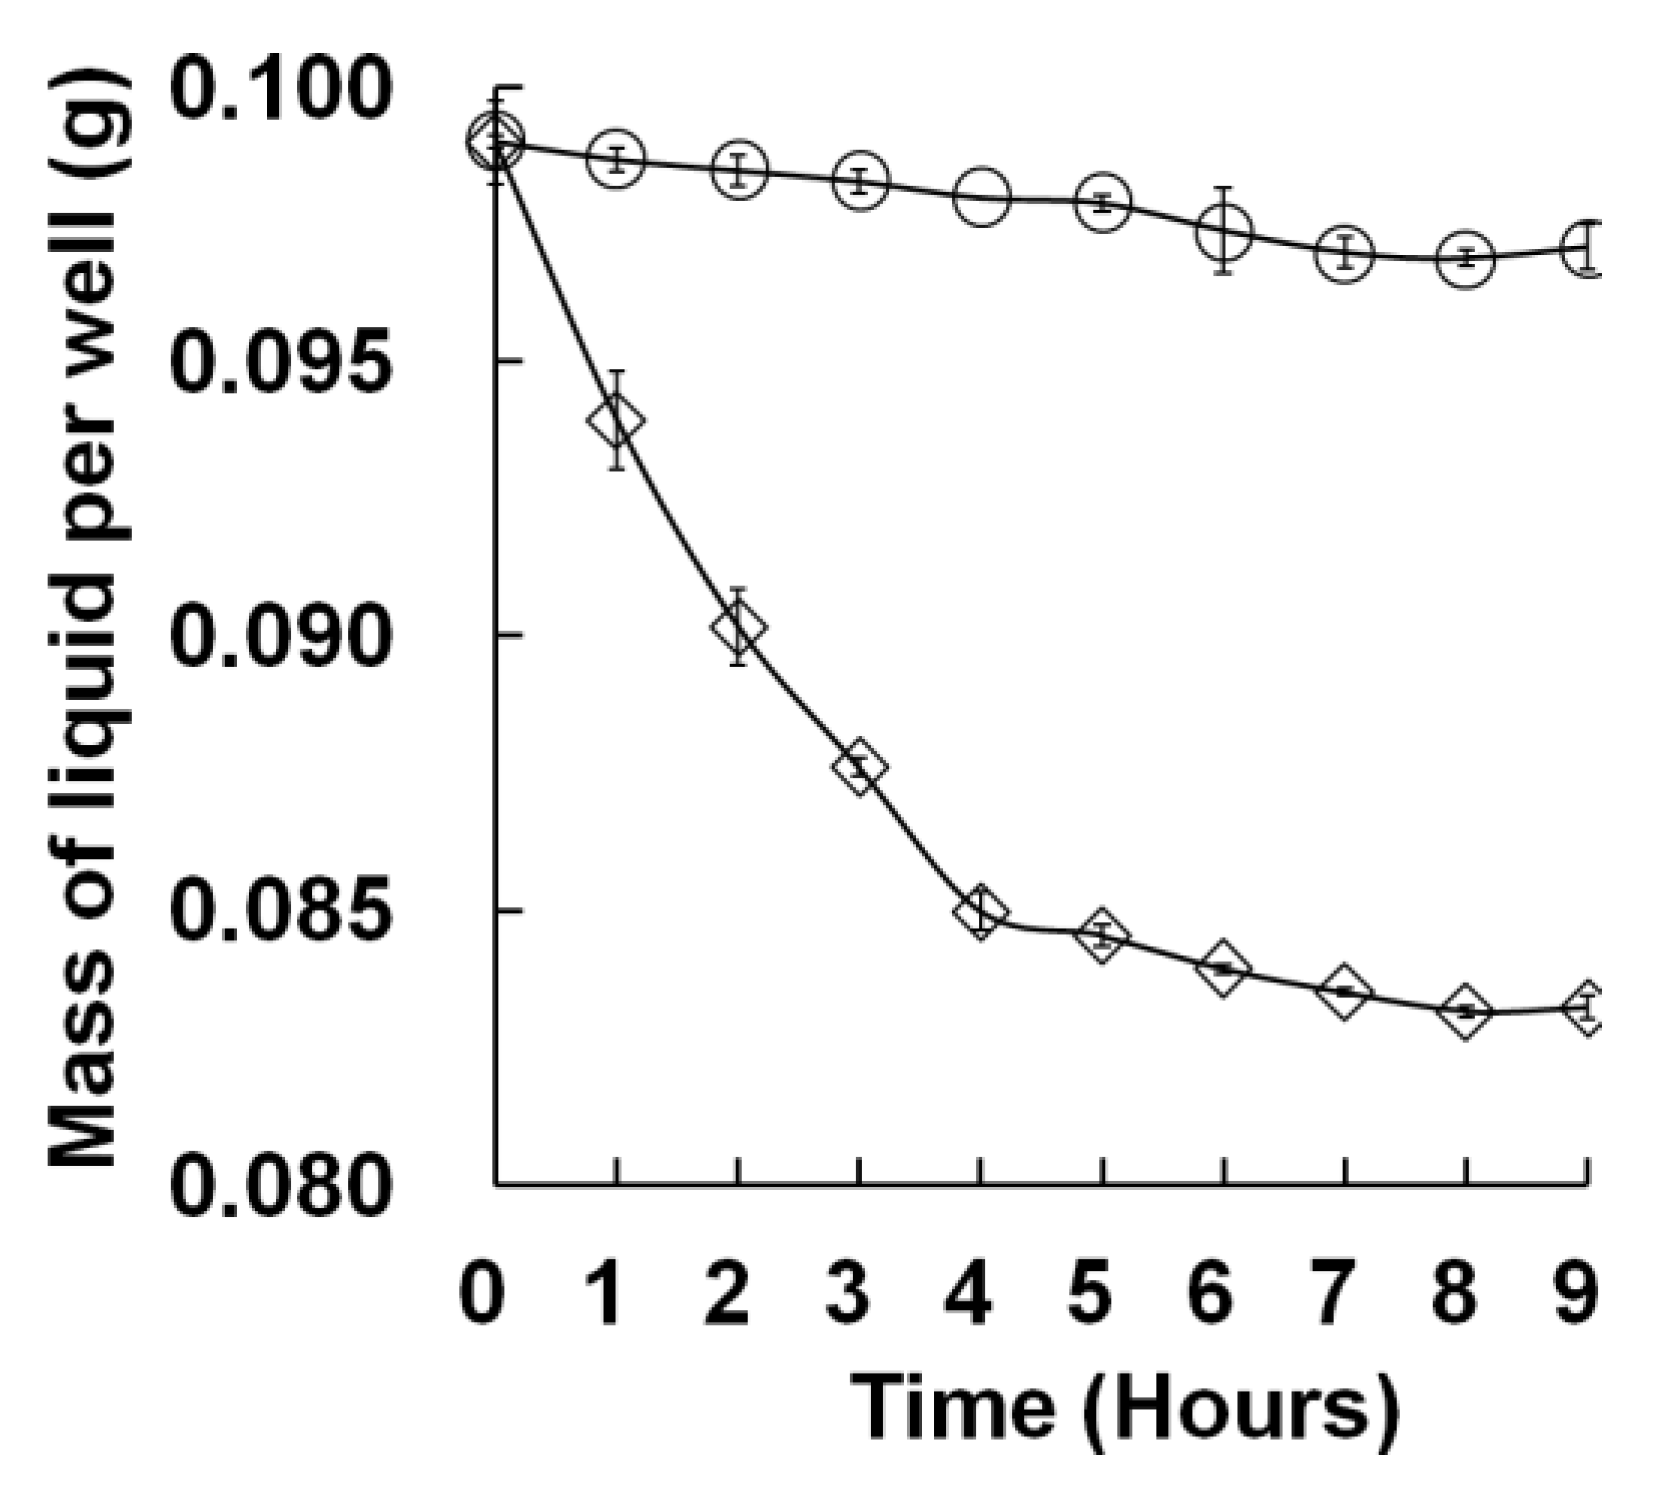
3.2. Intra-Well Mixing and Sample Evaporation in the M96SS
3.3. Screening Flasks and M96SS Cultures for CO2 Fixation
3.3.1. Screening Criterion of Microalgae for CO2 Fixation
3.3.2. Screening Results
| Microalgal Strains | 0.2 L−1 d−1 CO2 | 0.4 L−1 d−1 CO2 | 0.8 L−1 d−1 CO2 | 1.2 L−1 d−1 CO2 | ||||||||
|---|---|---|---|---|---|---|---|---|---|---|---|---|
| AM a | O b | A c | AM a | O b | A c | AM a | O b | A c | AM a | O b | A c | |
| Chlorella sp. SJTU-3 | 0.455 | 0.549 | 0.806 | 0.764 | 0.528 | 1.015 | 1.194 | 0.447 | 0.795 | 0.667 | 0.334 | 0.512 |
| Chlorella pyrenoidosa SJTU-2 | 0.440 | 0.329 | 0.465 | 0.692 | 0.436 | 0.584 | 1.230 | 0.345 | 0.467 | 0.704 | 0.302 | 0.354 |
| Scenedesmus obliquus SJTU-3 | 0.597 | 0.354 | 0.366 | 1.092 | 0.632 | 1.037 | 1.157 | 0.856 | 0.616 | 1.004 | 0.787 | 0.556 |
| Chlamydomonas sajao | 0.458 | 0.312 | 0.302 | 0.514 | 0.765 | 1.106 | 0.714 | 0.747 | 1.328 | 0.576 | 0.676 | 0.917 |
| Selenastrum capricornutum | 0.557 | 0.654 | 0.712 | 0.587 | 0.627 | 0.946 | 1.105 | 0.627 | 0.759 | 0.898 | 0.589 | 0.646 |
| Dunaliella primolecta | 0.423 | – | – | 0.596 | – | – | – | – | – | – | – | – |
| Microalgal Strains | 0.2 L−1 d−1 CO2 | 0.4 L−1 d−1 CO2 | 0.8 L−1 d−1 CO2 | 1.2 L−1 d−1 CO2 | ||||||||
|---|---|---|---|---|---|---|---|---|---|---|---|---|
| AM a | O b | A c | AM a | O b | A c | AM a | O b | A c | AM a | O b | A c | |
| Chlorella sp. SJTU-3 | 0.793 | 0.965 | 1.435 | 1.358 | 0.926 | 1.817 | 2.145 | 0.778 | 1.415 | 1.181 | 0.571 | 0.897 |
| Chlorella pyrenoidosa SJTU-2 | 0.765 | 0.562 | 0.811 | 1.226 | 0.758 | 1.029 | 2.211 | 0.591 | 0.815 | 1.248 | 0.513 | 0.608 |
| Scenedesmus obliquus SJTU-3 | 1.053 | 0.608 | 0.630 | 1.958 | 1.117 | 1.858 | 2.077 | 1.526 | 1.087 | 1.797 | 1.400 | 0.977 |
| Chlamydomonas sajao | 0.798 | 0.531 | 0.513 | 0.901 | 1.360 | 1.984 | 1.267 | 1.327 | 2.390 | 1.014 | 1.197 | 1.638 |
| Selenastrum capricornutum | 0.979 | 1.157 | 1.263 | 1.034 | 1.107 | 1.691 | 1.982 | 1.107 | 1.349 | 1.603 | 1.038 | 1.142 |
| Dunaliella primolecta | 0.734 | – | – | 1.051 | – | – | – | – | – | – | – | – |
| Microalgal Strains | 0.2 L−1 d−1 CO2 | 0.4 L−1 d−1 CO2 | 0.8 L−1 d−1 CO2 | 1.2 L−1 d−1 CO2 | ||||||||
|---|---|---|---|---|---|---|---|---|---|---|---|---|
| AM a | O b | A c | AM a | O b | A c | AM a | O b | A c | AM a | O b | A c | |
| Chlorella sp. SJTU-3 | 0.464 | 0.587 | 0.784 | 0.774 | 0.565 | 1.007 | 1.229 | 0.456 | 0.818 | 0.675 | 0.328 | 0.497 |
| Chlorella pyrenoidosa SJTU-2 | 0.437 | 0.316 | 0.474 | 0.685 | 0.452 | 0.557 | 1.216 | 0.368 | 0.498 | 0.717 | 0.295 | 0.367 |
| Scenedesmus obliquus SJTU-3 | 0.609 | 0.365 | 0.388 | 1.107 | 0.678 | 0.997 | 1.149 | 0.889 | 0.624 | 0.997 | 0.745 | 0.531 |
| Chlamydomonas sajao | 0.220 | 0.328 | 0.337 | 0.275 | 0.787 | 1.094 | 0.685 | 0.759 | 1.437 | 0.526 | 0.642 | 0.895 |
| Selenastrum capricornutum | 0.574 | 0.647 | 0.696 | 0.562 | 0.654 | 0.977 | 1.145 | 0.618 | 0.736 | 0.846 | 0.575 | 0.632 |
| Dunaliella primolecta | 0.457 | – | – | 0.614 | – | – | – | – | – | – | – | – |
| Microalgal Strains | 0.2 L−1 d−1 CO2 | 0.4 L−1 d−1 CO2 | 0.8 L−1 d−1 CO2 | 1.2 L−1 d−1 CO2 | ||||||||
|---|---|---|---|---|---|---|---|---|---|---|---|---|
| AM a | O b | A c | AM a | O b | A c | AM a | O b | A c | AM a | O b | A c | |
| Chlorella sp. SJTU-3 | 0.809 | 1.034 | 1.395 | 1.376 | 0.994 | 1.803 | 2.209 | 0.794 | 1.457 | 1.195 | 0.560 | 0.870 |
| Chlorella pyrenoidosa SJTU-2 | 0.760 | 0.538 | 0.827 | 1.214 | 0.787 | 0.979 | 2.185 | 0.633 | 0.871 | 1.272 | 0.500 | 0.632 |
| Scenedesmus obliquus SJTU-3 | 1.074 | 0.628 | 0.670 | 1.986 | 1.201 | 1.785 | 2.063 | 1.587 | 1.102 | 1.785 | 1.323 | 0.932 |
| Chlamydomonas sajao | 0.363 | 0.560 | 0.577 | 0.463 | 1.400 | 1.962 | 1.214 | 1.349 | 2.590 | 0.923 | 1.135 | 1.598 |
| Selenastrum capricornutum | 1.010 | 1.144 | 1.234 | 0.988 | 1.157 | 1.748 | 2.055 | 1.091 | 1.307 | 1.508 | 1.012 | 1.117 |
| Dunaliella primolecta | 0.796 | – | – | 1.084 | – | – | – | – | – | – | – | – |
3.3.3. Comparison of M96SS versus Traditional Screening Methods
| System | Flask culture | M96SS | Microplates in CO2-filled box | Microplate shaker system |
|---|---|---|---|---|
| Purpose | Standard method of strains screening and toxin bioassay | Screening of microalgae for CO2 fixation | Miniaturized algal bioassay for toxins | Miniaturized algal bioassay for toxins |
| Equipment requirements | Numerous shakers and flasks | 96-well microplates; a swivel | 96-well microplates; a closed flat box | 96-well microplates; Microplate shaker |
| Resources consumption for the screening in section 3.3 | 6 shakers (36 flasks), 216 flasks 4 h’ work time for daily data collection | 4 microplates, a swivel, 40 min’ work time for daily data collection | – | – |
| Agreement versus flask culture | Standard method | Good agreement in dynamic growth characteristics | Not studied | Good agreement in the toxin bioassay (without dynamic comparison) |
| Mixing | Low speed horizontal shaking (110 rpm) | Vertical mixing (20 rpm) | Manually mixing (Twice per day) | High speed horizontal shaking (>400 rpm) |
| Culture liquid loss by evaporation (no additional cooling devices) | Almost no culture liquid loss by evaporation found during this study | <3% culture liquid loss by evaporation during a screening process | Culture liquid loss by evaporation was not supposed to be an issue in this system. | >15% culture liquid loss by evaporation in 4 h (data tested in this study) |
| Temperature in culture systems (no additional cooling devices) | RT: 25 °C ST: 26 ± 0.1 °C | RT: 25 °CST: 25.5 ± 0.5 °C | Controlled by RT | RT: 25 °C ST: 32 ± 0.5 °C (data tested in this study) |
| Source | This study | This study | [9] | [10,11] |
4. Conclusions
Acknowledgements
References
- Intergovernmental Panel on Climate Change (IPCC). Climate Change 2001: The Scientific Basis. Contribution of Working Group I to the Third Assessment Report of the Intergovernmental Panel on Climate Change; Cambridge University Press: Cambridge, UK, 2001. [Google Scholar]
- Stephenson, P.G.; Moore, C.M.; Terry, M.J.; Zubkov, M.V.; Bibby, T.S. Improving photosynthesis for algal biofuels: Toward a green revolution. Trends Biotechnol. 2011, 29, 615–623. [Google Scholar] [CrossRef] [PubMed]
- Satyanarayana, K.G.; Mariano, A.B.; Vargas, J.V.C. A review on microalgae, a versatile source for sustainable energy and materials. Int. J. Energy Res. 2011, 35, 291–311. [Google Scholar] [CrossRef]
- Rodolfi, L.; Zittelli, G.C.; Bassi, N.; Padovani, G.; Biondi, N.; Bonini, G.; Tredici, M.R. Microalgae for oil: Strain selection, induction of lipid synthesis and outdoor mass cultivation in a low-cost photobioreactor. Biotechnol. Bioeng. 2009, 102, 100–112. [Google Scholar] [CrossRef] [PubMed]
- Rojickova, R.; Dvorakova, D.; Marsalek, B. The use of miniaturized algal bioassays in comparison to the standard flask assay. Environ. Toxicol. Water Qual. 1998, 13, 235–241. [Google Scholar] [CrossRef]
- Nowack, E.C.M.; Podola, B.; Melkonian, M. The 96-well twin-layer system: A novel approach in the cultivation of microalgae. Protist 2005, 156, 239–251. [Google Scholar] [CrossRef] [PubMed]
- Jiraskova, D.; Poulickova, A.; Novak, O.; Sedlakova, K.; Hradecka, V.; Strnad, M. High-throughput screening technology for monitoring phytohormone production in microalgae. J. Phycol. 2009, 45, 108–118. [Google Scholar] [CrossRef]
- Eisentraeger, A.; Brinkmann, C.; Michel, K.; Hahn, S.; Huettner, M.; Weber, G. Development of automated high-throughput ecotoxicity and genotoxicity test systems and fields of application. Water Sci. Technol. 2004, 50, 109–114. [Google Scholar] [PubMed]
- Lukavsky, J. The evaluation of algal growth-potential (AGP) and toxicity of water by miniaturized growth bioassay. Water Res. 1992, 26, 1409–1413. [Google Scholar] [CrossRef]
- Paixao, S.M.; Silva, L.; Fernandes, A.; O’Rourke, K.; Mendonca, E.; Picado, A. Performance of a miniaturized algal bioassay in phytotoxicity screening. Ecotoxicology 2008, 17, 165–171. [Google Scholar] [CrossRef] [PubMed]
- Eisentraeger, A.; Dott, W.; Klein, J.; Hahn, S. Comparative studies on algal toxicity testing using fluorometric microplate and Erlenmeyer flask growth-inhibition assays. Ecotoxicology and Environmental Safety 2003, 54, 346–354. [Google Scholar] [CrossRef] [PubMed]
- Guillard, R.R.; Ryther, J.H. Studies of marine planktonic diatoms. 1. Cyclotella nana hustedt, and Detonula confervacea (cleve) gran. Can. J. Microbiol. 1962, 8, 229–239. [Google Scholar] [CrossRef]
- Stanier, R.; Kunisawa, R.; Mandel, M.; Cohen-Bazire, G. Purification and properties of unicellular blue-green algae (order Chroococcales). Bacteriol. Rev. 1971, 35, 171. [Google Scholar]
- Collos, Y.; Mornet, F.; Sciandra, A.; Waser, N.; Larson, A.; Harrison, P.J. An optical method for the rapid measurement of micromolar concentrations of nitrate in marine phytoplankton cultures. J. Appl. Phycol. 1999, 11, 179–184. [Google Scholar] [CrossRef]
- De Morais, M.G.; Costa, J.A.V. Biofixation of carbon dioxide by Spirulina sp. and Scenedesmus obliquus cultivated in a three-stage serial tubular photobioreactor. J. Biotechnol. 2007, 129, 439–445. [Google Scholar]
- Wang, B.; Li, Y.; Wu, N.; Lan, C.Q. CO2 bio-mitigation using microalgae. Appl. Microbiol. Biotechnol. 2008, 79, 707–718. [Google Scholar] [CrossRef] [PubMed]
- Chiu, S.Y.; Kao, C.Y.; Chen, C.H.; Kuan, T.C.; Ong, S.C.; Lin, C.S. Reduction of CO2 by a high-density culture of Chlorella sp. in a semicontinuous photobioreactor. Bioresour. Technol. 2008, 99, 3389–3396. [Google Scholar] [CrossRef]
- Taylor, M.W.; Radax, R.; Steger, D.; Wagner, M. Sponge-associated microorganisms: Evolution, ecology, and biotechnological potential. Microbiol.Mol. Biol. Rev. 2007, 71, 295–347. [Google Scholar] [CrossRef] [PubMed]
- Morales, E.; Rodriguez, M.; Garcia, D.; Loreto, C.; Marco, E. Effect of ph and CO2 on growth, pigments and exopolysaccharides production from cianobacteria. Anabaena sp. PCC 7120. Interciencia 2002, 27, 373–378. [Google Scholar]
- IUPAC (International Union of Pure and Applied Chemistry). Quantities, Units and Symbols in Physical Chemistry, 2nd ed.; Blackwell Science: Oxford, UK, 1993. [Google Scholar]
- Mook, W.; De Vries, J. Volume I: Introduction: Theory, Methods, Review. In Environmental Isotopes in the Hydrological Cycle: Principles and Applications; International Atomic Energy Agency (IAEA): Paris, France, 2000. [Google Scholar]
- Zhang, K.; Kurano, N.; Miyachi, S. Optimized aeration by carbon dioxide gas for microalgal production and mass transfer characterization in a vertical flat-plate photobioreactor. Bioprocess. Biosyst. Eng. 2002, 25, 97–101. [Google Scholar] [CrossRef] [PubMed]
- Doig, S.D.; Pickering, S.C.R.; Lye, G.J.; Baganz, F. Modelling surface aeration rates in shaken microtitre plates using dimensionless groups. Chem. Eng. Sci. 2005, 60, 2741–2750. [Google Scholar] [CrossRef]
- Chisti, Y. Biodiesel from microalgae. Biotechnol. Adv. 2007, 25, 294–306. [Google Scholar] [CrossRef] [PubMed]
- Chakraborty, M.; Miao, C.; McDonald, A.; Chen, S. Concomitant extraction of bio-oil and value added polysaccharides from Chlorella sorokiniana using a unique sequential hydrothermal extraction technology. Fuel 2012, 95, 63–70. [Google Scholar] [CrossRef]
- Henry, E.C. Handbook of microalgal culture: Biotechnology and applied phycology. J. Phycol. 2004, 40, 1001–1002. [Google Scholar] [CrossRef]
- Mirón, A.S.; Garcı́a, M.C.C.; Gómez, A.C.; Camacho, F.G.A.; Grima, E.M.; Chisti, Y. Shear stress tolerance and biochemical characterization of Phaeodactylum tricornutum in quasi steady-state continuous culture in outdoor photobioreactors. Biochem. Eng. J. 2003, 16, 287–297. [Google Scholar] [CrossRef]
- Huss, V.A.R.; Ciniglia, C.; Cennamo, P.; Cozzolino, S.; Pinto, G.; Pollio, A. Phylogenetic relationships and taxonomic position of Chlorella-like isolates from low pH environments (pH < 3.0). BMC Evol. Biol. 2002, 2, 13. [Google Scholar]
- Murakami, M.; Ikenouchi, M. The biological CO2 fixation and utilization project by rite (2) Screening and breeding of microalgae with high capability in fixing CO2. Energy Convers. Manag. 1997, 38, S493–S497. [Google Scholar] [CrossRef]
- Raven, J.A. Inorganic carbon acquisition by eukaryotic algae: Four current questions. Photosynth. Res. 2010, 106, 123–134. [Google Scholar] [CrossRef] [PubMed]
- Balkos, K.D.; Colman, B. Mechanism of CO2 acquisition in an acid-tolerant Chlamydomonas. Plant Cell Environ. 2007, 30, 745–752. [Google Scholar] [CrossRef] [PubMed]
- Binaghi, L.; Del Borghi, A.; Lodi, A.; Converti, A.; Del Borghi, M. Batch and fed-batch uptake of carbon dioxide by Spirulina platensis. Process. Biochem. 2003, 38, 1341–1346. [Google Scholar] [CrossRef]
- Soletto, D.; Binaghi, L.; Ferrari, L.; Lodi, A.; Carvalho, J.C.M.; Zilli, M.; Converti, A. Effects of carbon dioxide feeding rate and light intensity on the fed-batch pulse-feeding cultivation of Spirulina platensis in helical photobioreactor. Biochem. Eng. J. 2008, 39, 369–375. [Google Scholar] [CrossRef]
- Tang, D.; Han, W.; Li, P.; Miao, X.; Zhong, J. CO2 biofixation and fatty acid composition of Scenedesmus obliquus and Chlorella pyrenoidosa in response to different CO2 levels. Bioresour. Technol. 2011, 102, 3071–3076. [Google Scholar] [CrossRef] [PubMed]
- Santín-Montanyá, I.; Sandín-España, P.; García Baudín, J.M.; Coll-Morales, J. Optimal growth of Dunaliella primolecta in axenic conditions to assay herbicides. Chemosphere 2007, 66, 1315–1322. [Google Scholar] [CrossRef] [PubMed]
- Lewin, R.A. Chlamydomonas sajao nov. sp.(Chlorophyta, Volvocales). Chin. J. Oceanol. Limnol. 1984, 2, 92–96. [Google Scholar] [CrossRef]
- Metting, B. Population dynamics of Chlamydomonas sajao and its influence on soil aggregate stabilization in the field. Appl. Environ. Microbiol. 1986, 51, 1161–1164. [Google Scholar] [PubMed]
© 2012 by the authors; licensee MDPI, Basel, Switzerland. This article is an open access article distributed under the terms and conditions of the Creative Commons Attribution license (http://creativecommons.org/licenses/by/3.0/).
Share and Cite
Han, W.; Li, C.; Miao, X.; Yu, G. A Novel Miniature Culture System to Screen CO2-Sequestering Microalgae. Energies 2012, 5, 4372-4389. https://doi.org/10.3390/en5114372
Han W, Li C, Miao X, Yu G. A Novel Miniature Culture System to Screen CO2-Sequestering Microalgae. Energies. 2012; 5(11):4372-4389. https://doi.org/10.3390/en5114372
Chicago/Turabian StyleHan, Wei, Chunying Li, Xiaoling Miao, and Guangxin Yu. 2012. "A Novel Miniature Culture System to Screen CO2-Sequestering Microalgae" Energies 5, no. 11: 4372-4389. https://doi.org/10.3390/en5114372
APA StyleHan, W., Li, C., Miao, X., & Yu, G. (2012). A Novel Miniature Culture System to Screen CO2-Sequestering Microalgae. Energies, 5(11), 4372-4389. https://doi.org/10.3390/en5114372