Some Chemical Compositional Changes in Miscanthus and White Oak Sawdust Samples during Torrefaction


Abstract
:1. Introduction
1.1. Biomass Challenges
1.2. Torrefaction
2. Material and Methods
2.1. Chemical Composition

| Chemical Composition (%) | ASTM Standard |
|---|---|
| Moisture content | ASTM D3173 |
| Carbon and hydrogen content | ASTM D3178 |
| Nitrogen | ASTM D3179 |
| Volatiles | ASTM D3175 |
| H/C: Number of hydrogen atoms/number of Carbon atoms = (%H/1)/(%C/12) | |
| S. No | Chemical composition | Miscanthus | White oak sawdust |
|---|---|---|---|
| 1 | Moisture content (%) | 7.97 | 8.53 |
| 2 | Volatiles (%) | 83.29 | 80.75 |
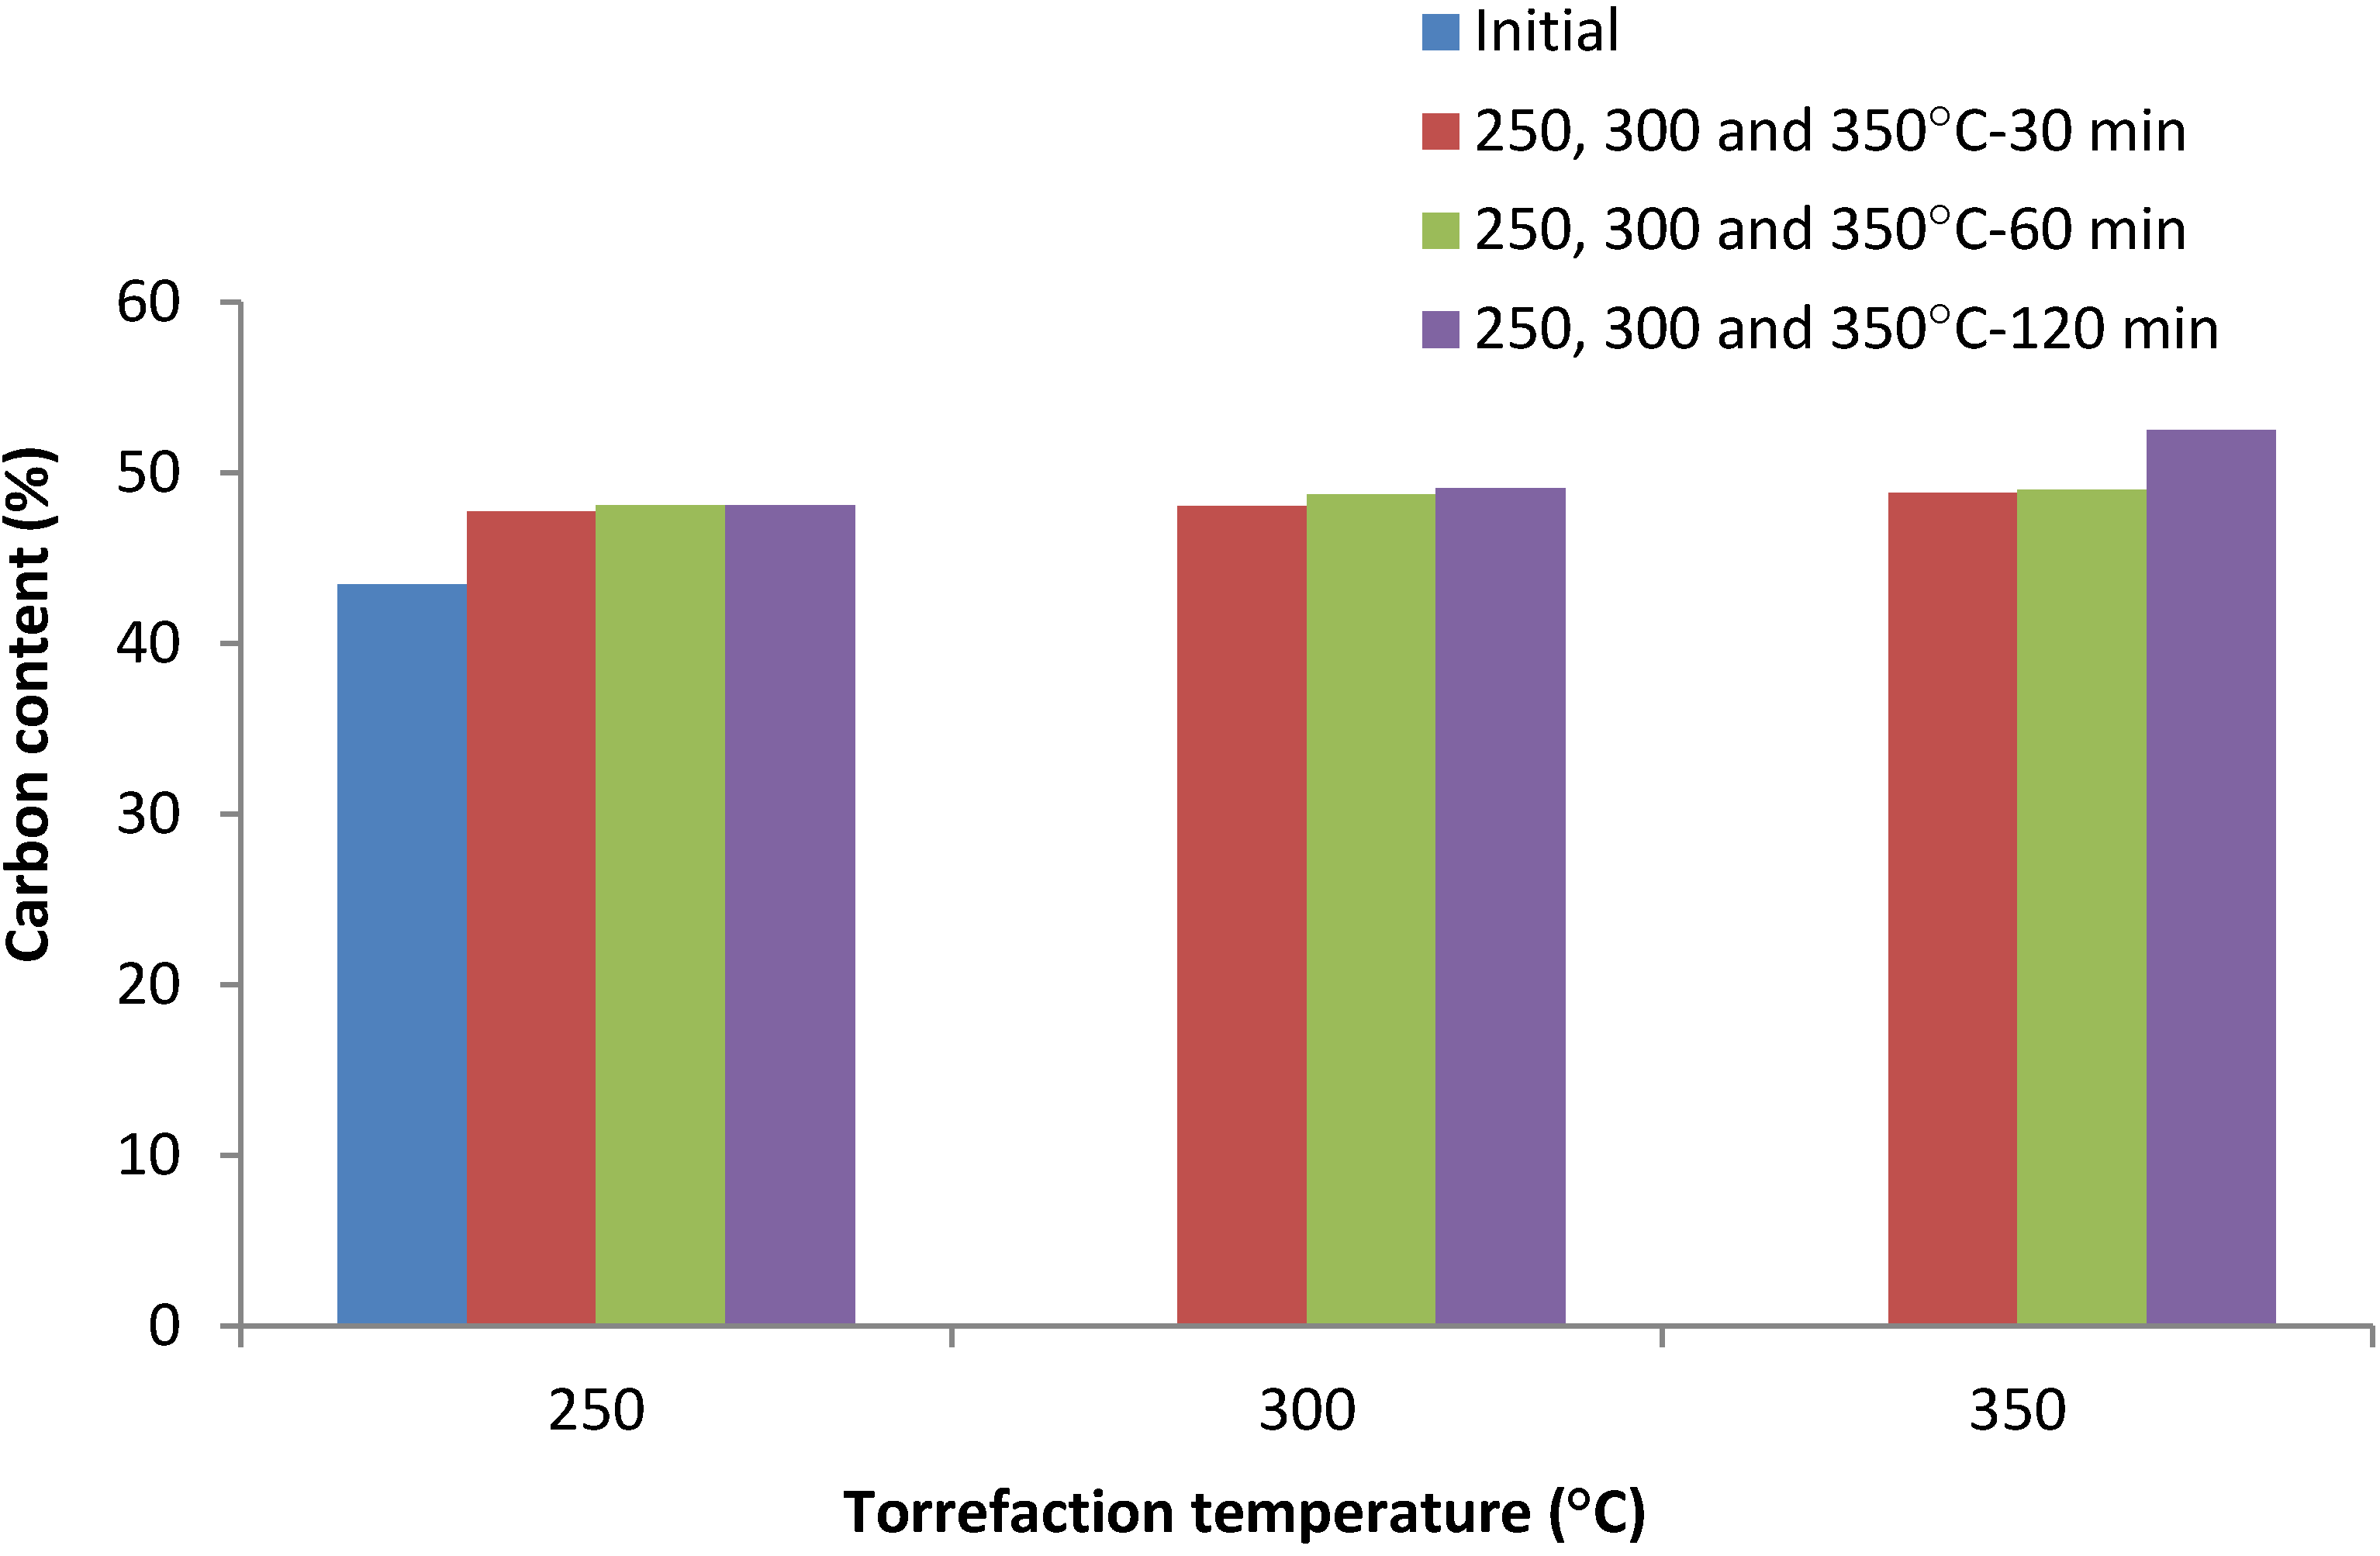
| 3 | Carbon content (%) | 43.45 | 50.28 |
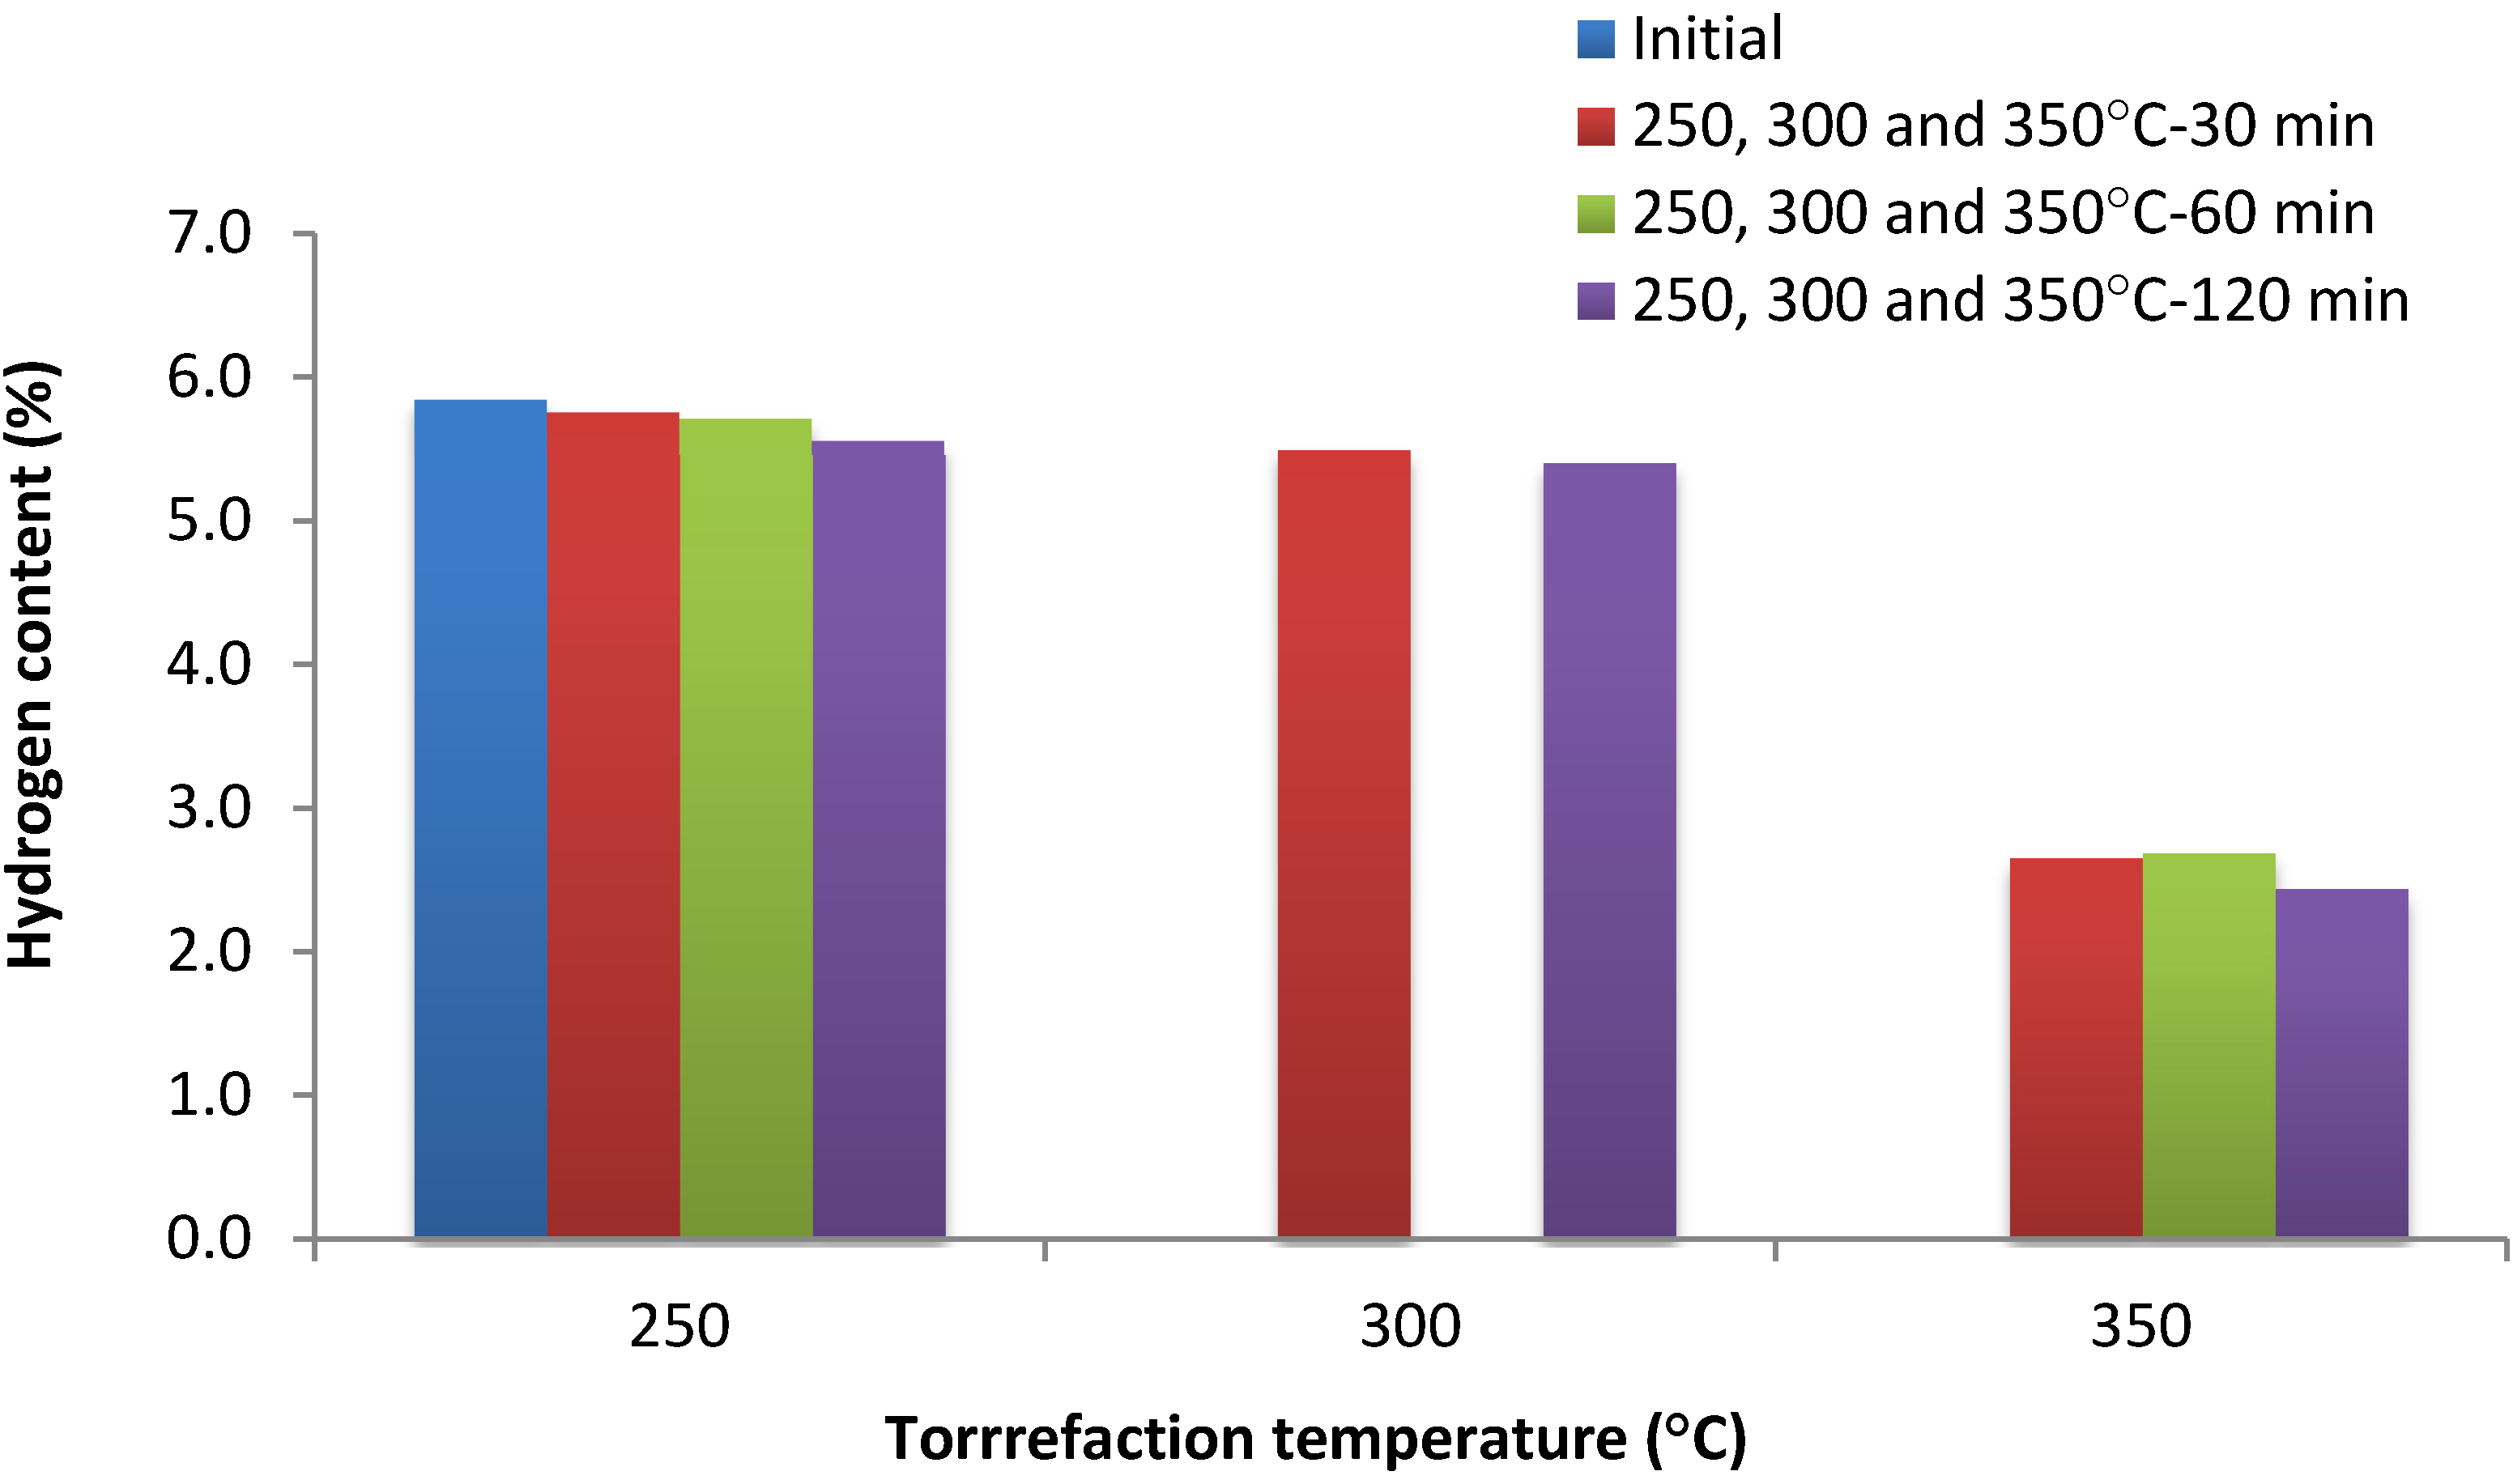
| 4 | Hydrogen content (%) | 5.85 | 5.91 |
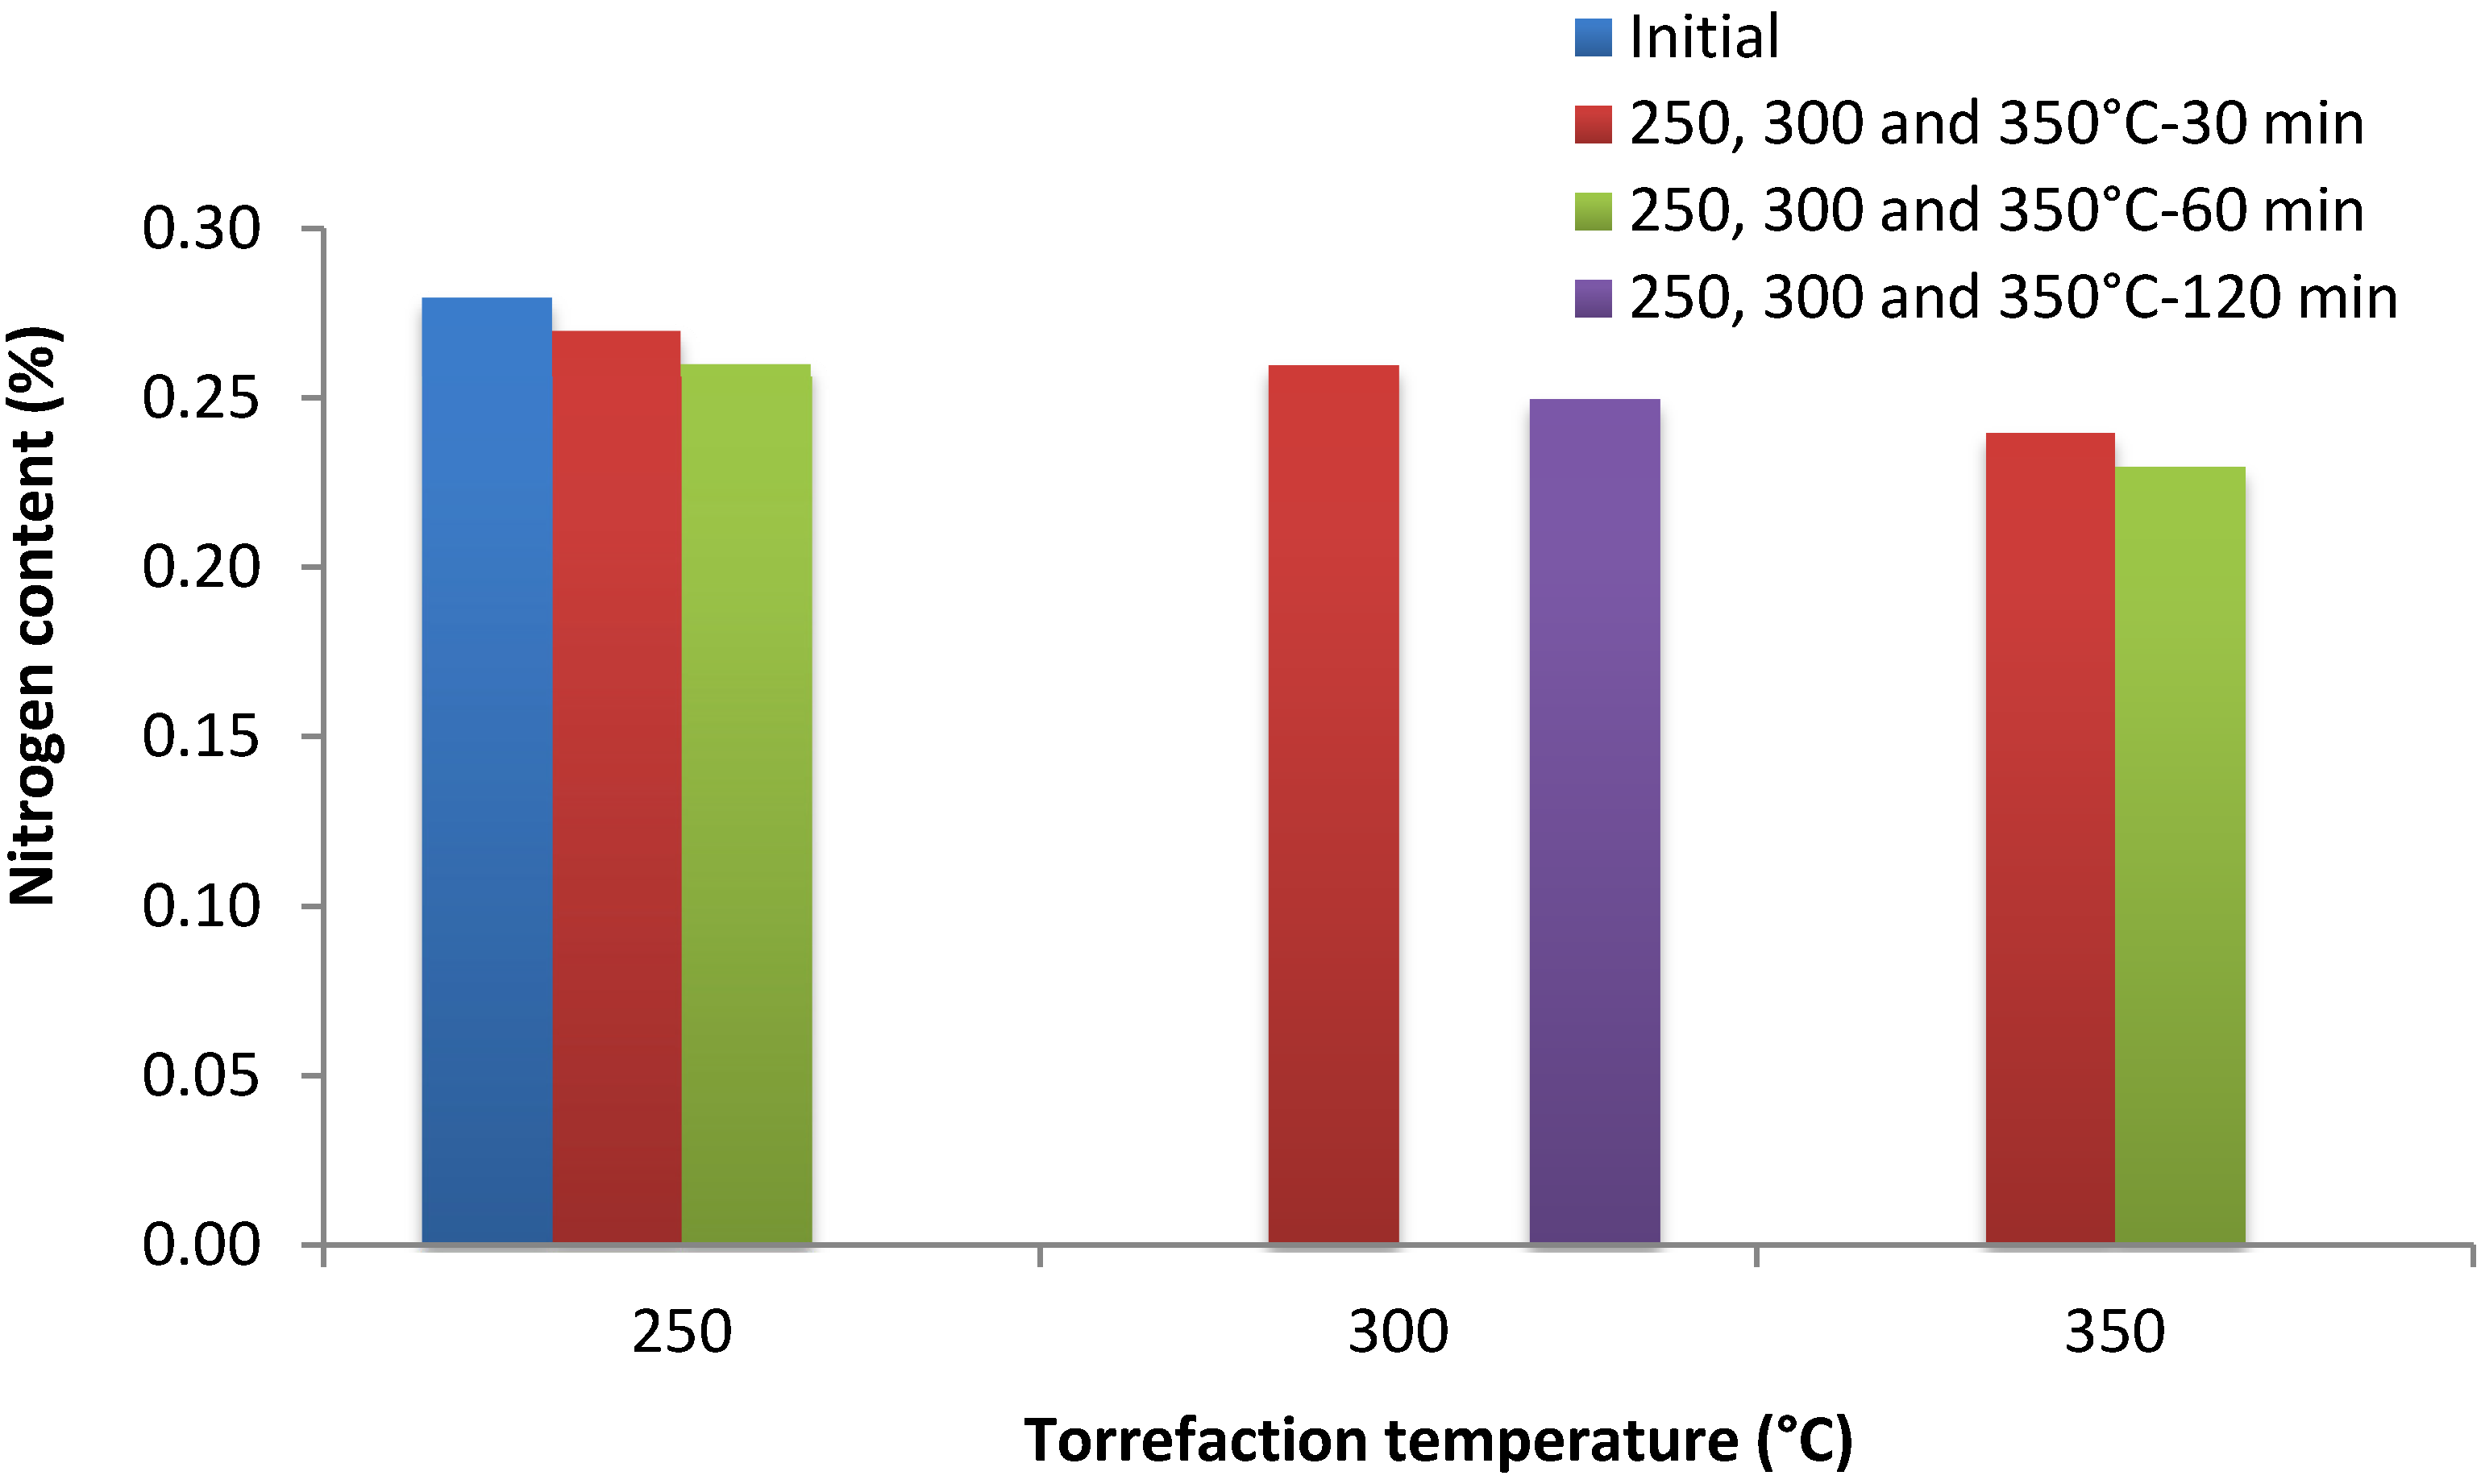
| 5 | Nitrogen content (%) | 0.28 | 0.17 |
2.2. Torrefaction Process Design
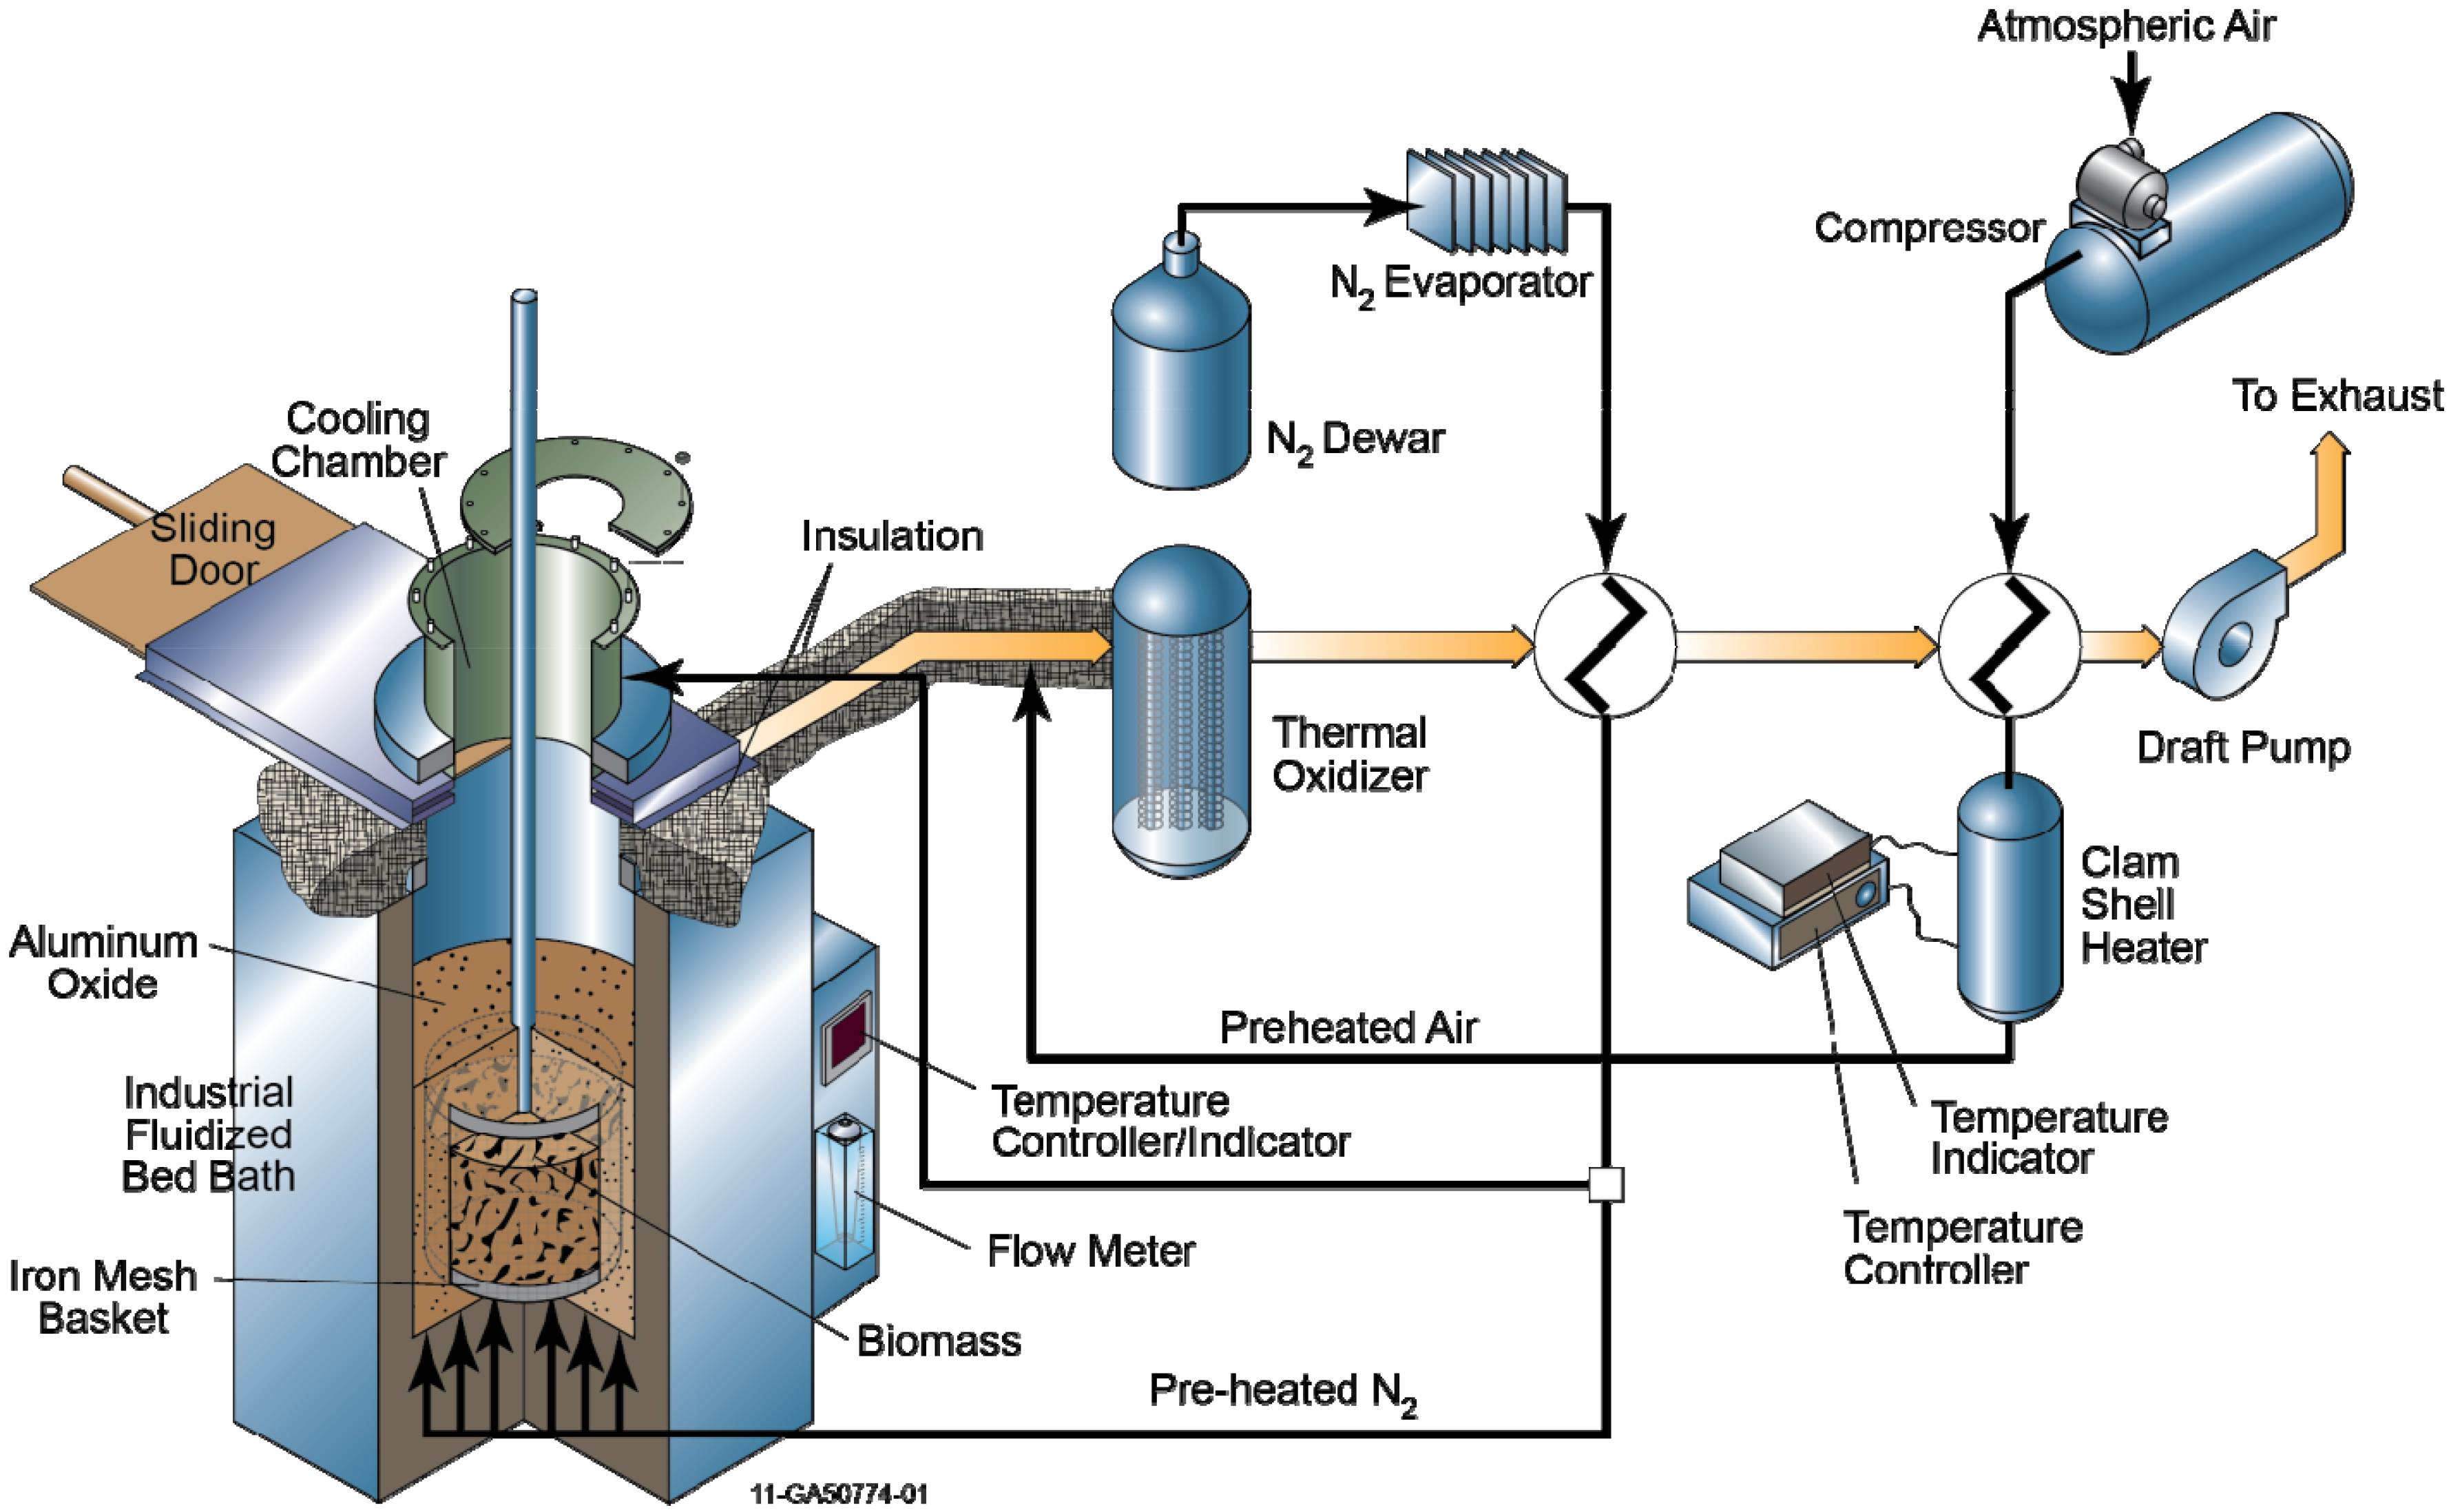
2.3. Experimental Procedure
2.4. Response Surface Analysis
| Miscanthus | Torrefaction Process Conditions | |
|---|---|---|
| Torrefaction Temperature (°C) | Torrefaction Time (min) | |
| 1 | 250 | 30 |
| 2 | 250 | 60 |
| 3 | 250 | 120 |
| 4 | 300 | 30 |
| 5 | 300 | 60 |
| 6 | 300 | 120 |
| 7 | 350 | 30 |
| 8 | 350 | 60 |
| 9 | 350 | 120 |
| White Oak Sawdust | ||
| 1 | 230 | 30 |
| 2 | 270 | 30 |
3. Results
3.1. Miscanthus Experimental Data
3.2. Regression Equations
| Chemical Composition | |||||
|---|---|---|---|---|---|
| Process Variable | Moisture Content (%) | Carbon Content (%) | Hydrogen Content (%) | Volatile Content (%) | H/C Ratio |
| Linear | |||||
| x1 | NS | NS | (+) * | (+) * | (+) * |
| x2 | (−) * | (−) * | NS | NS | NS |
| Quadratic | |||||
| x12 | NS | NS | (−) * | (−) * | (−) * |
| x22 | NS | NS | NS | NS | NS |
| Interactive | |||||
| x1x2 | (+) * | (+) * | NS | NS | NS |
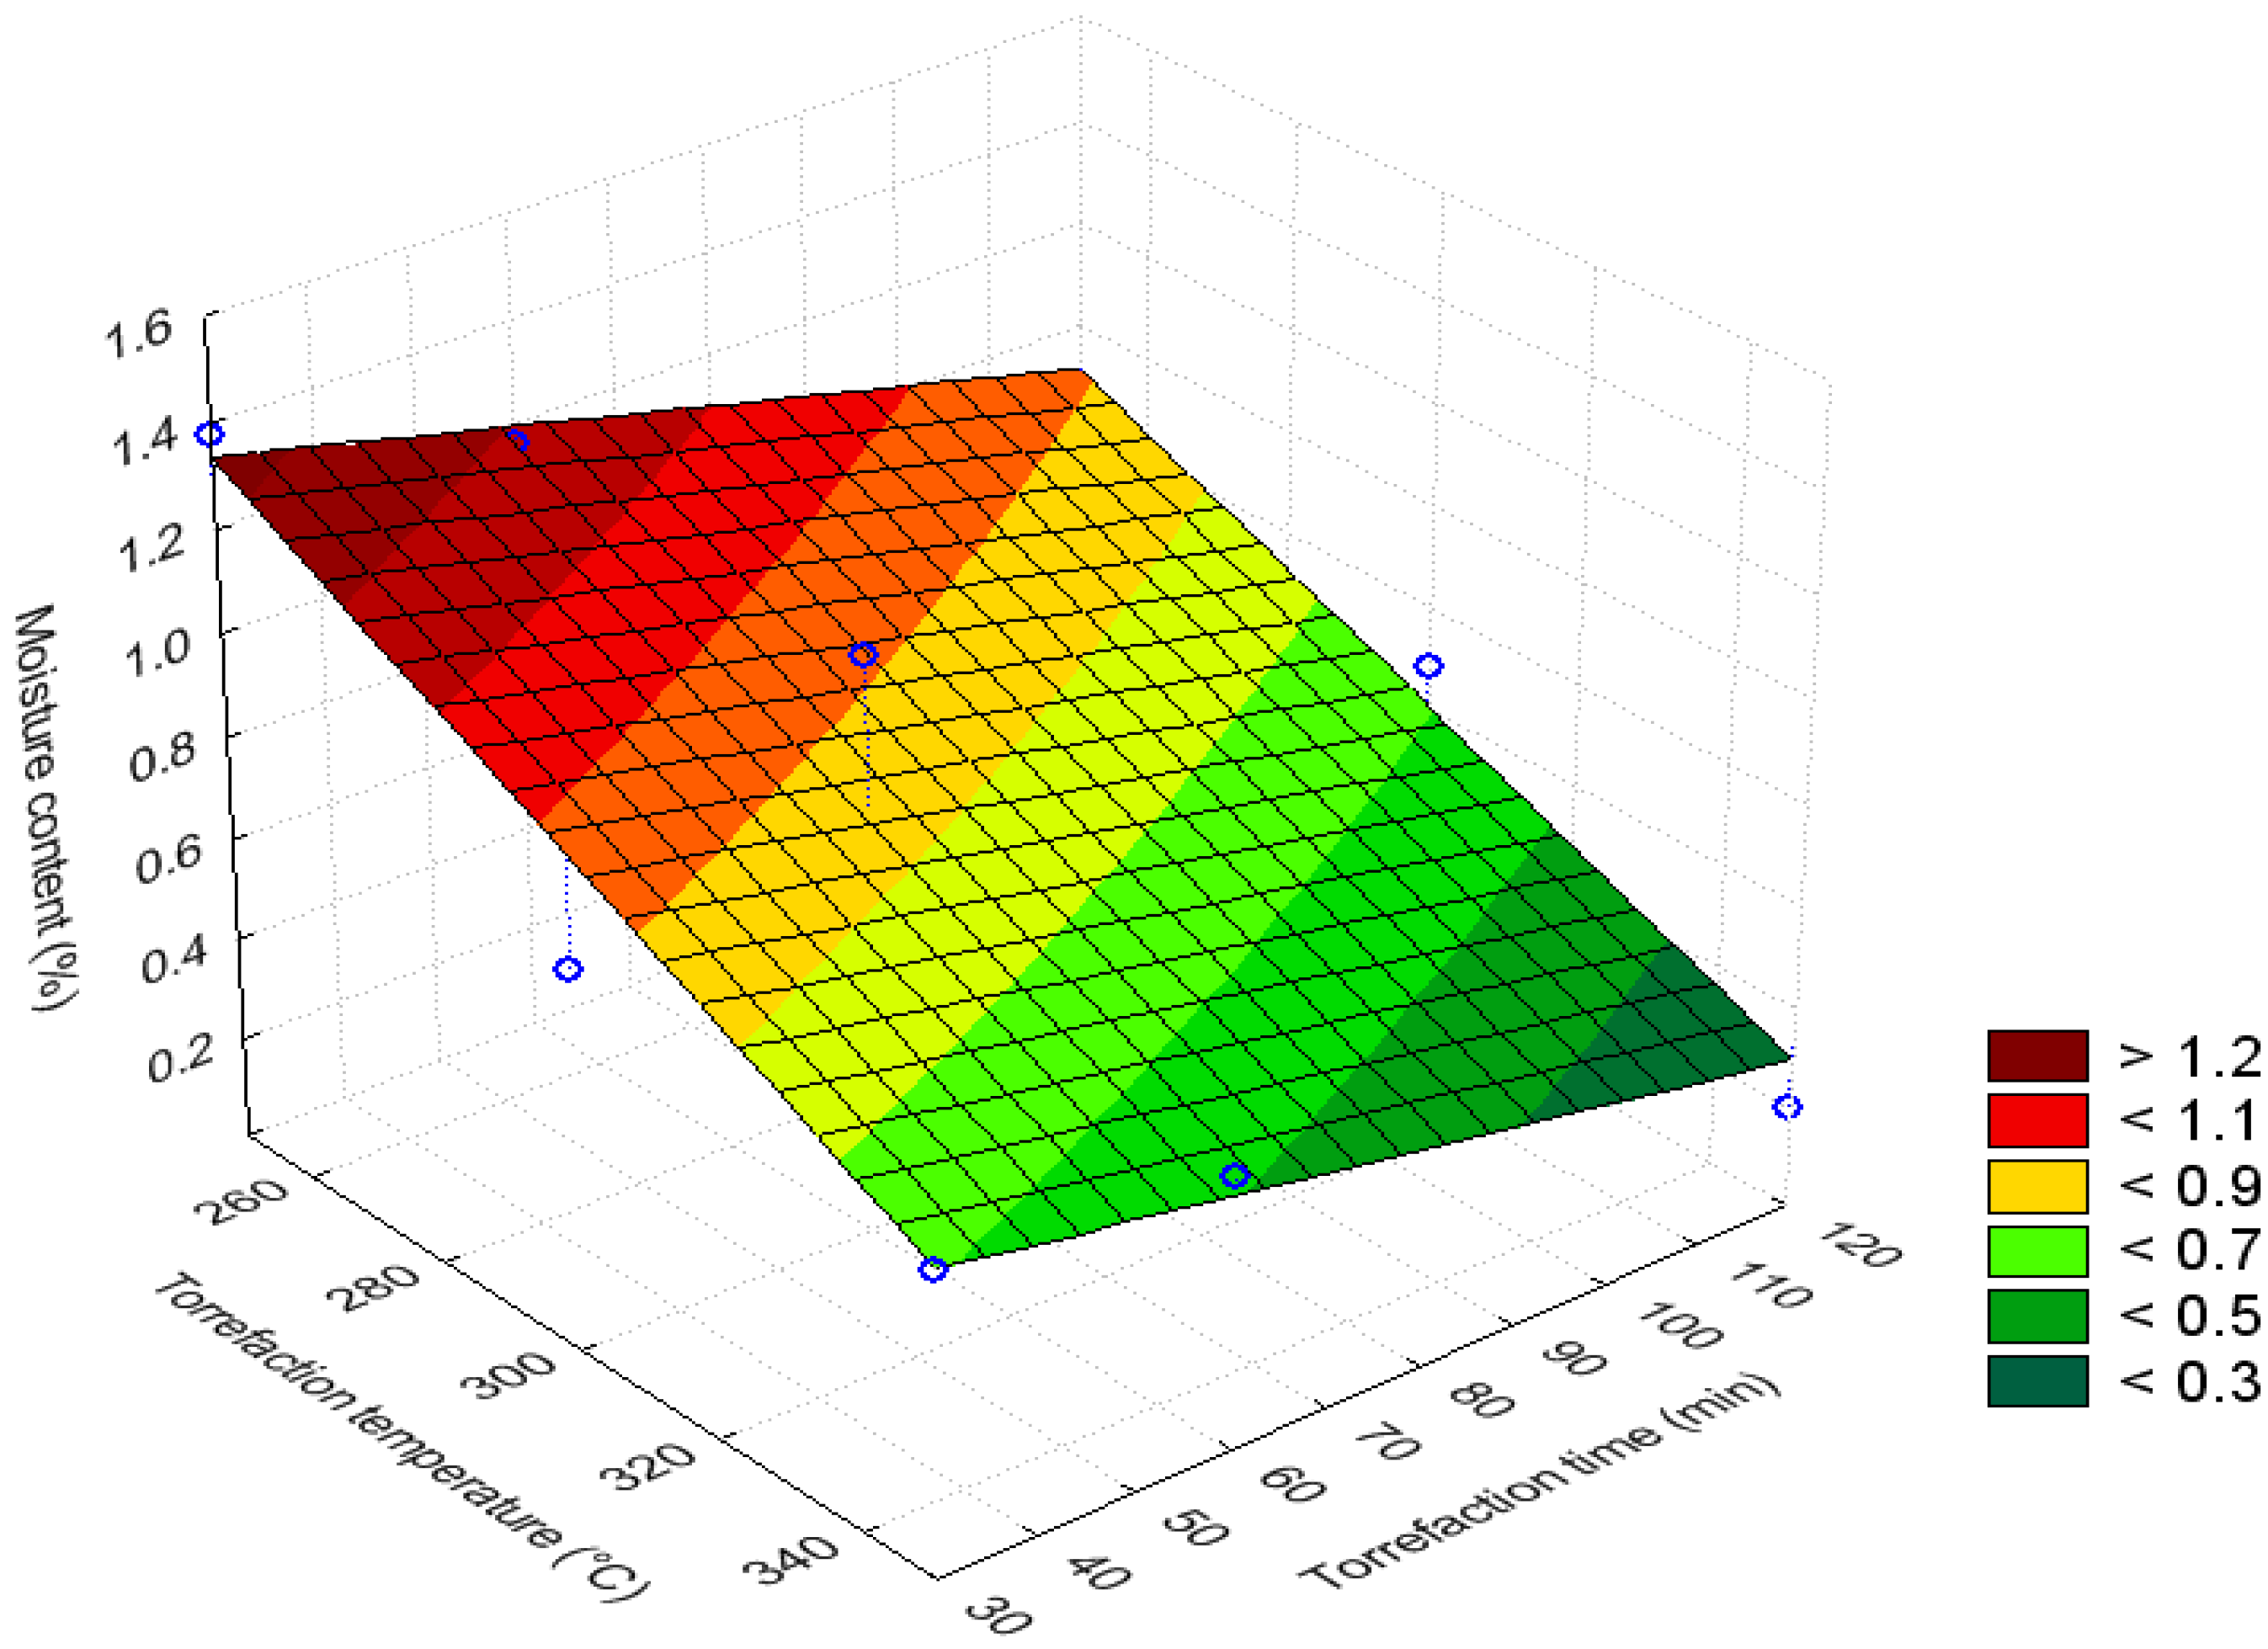
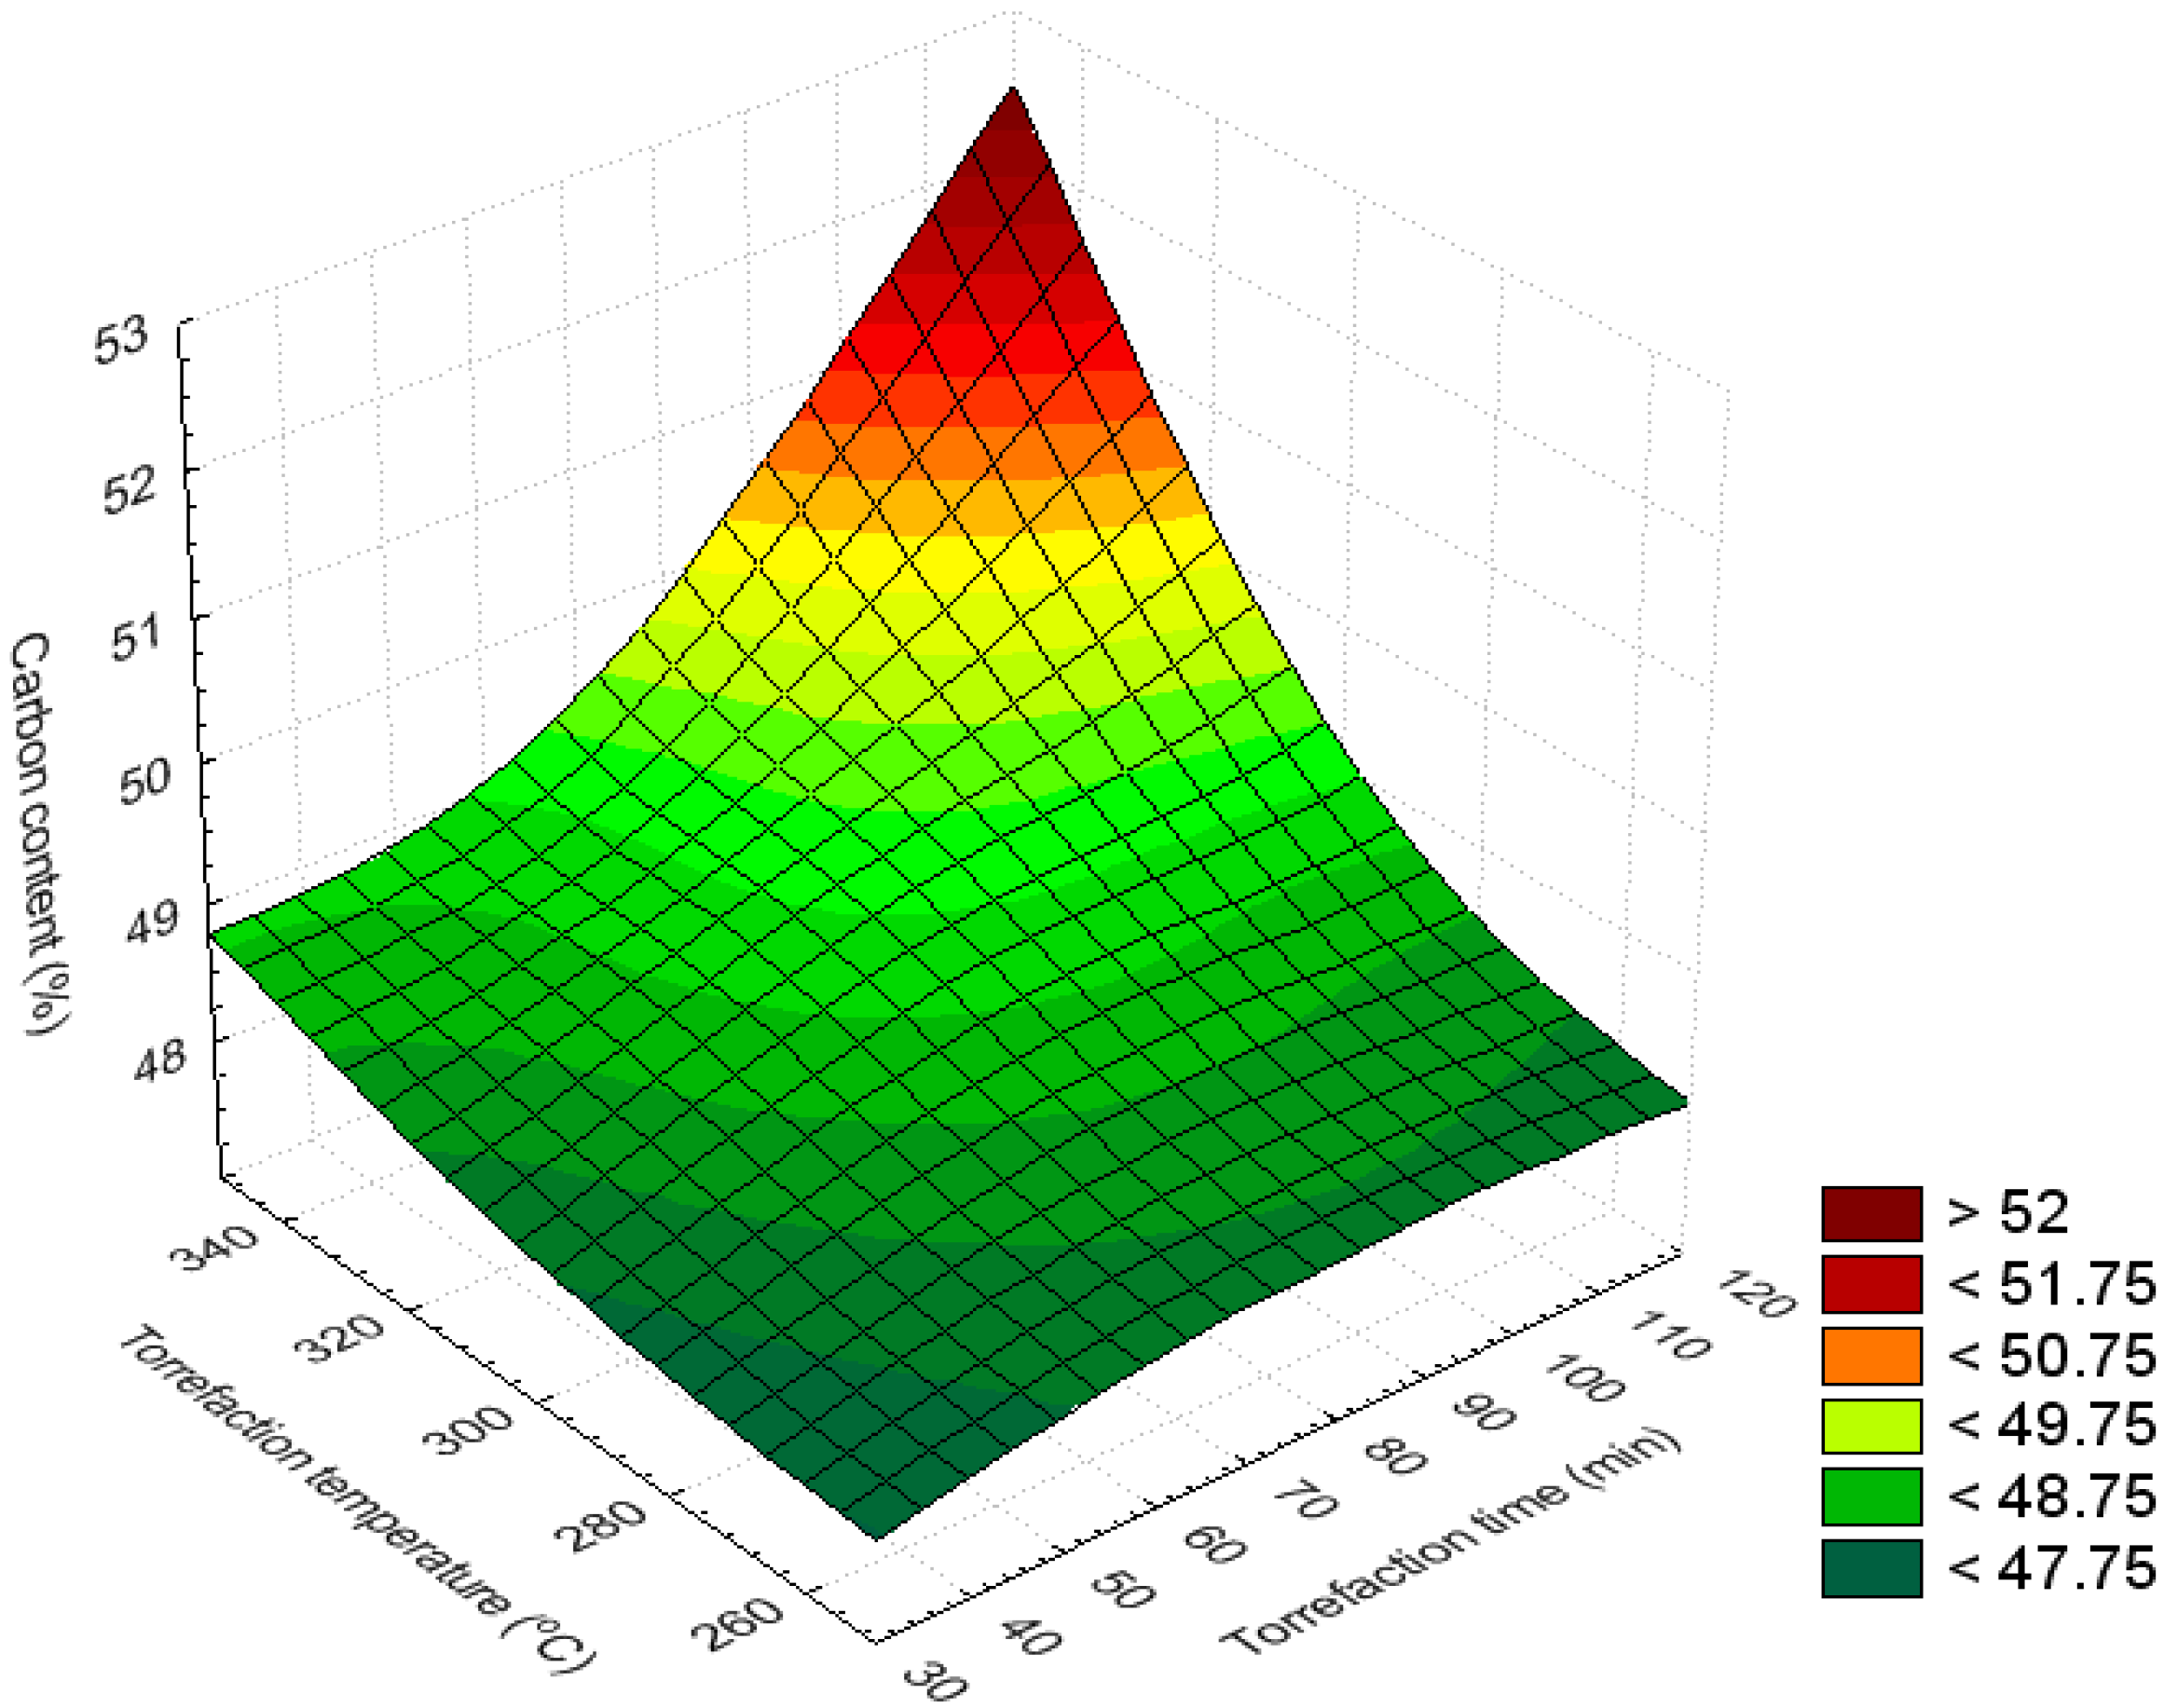
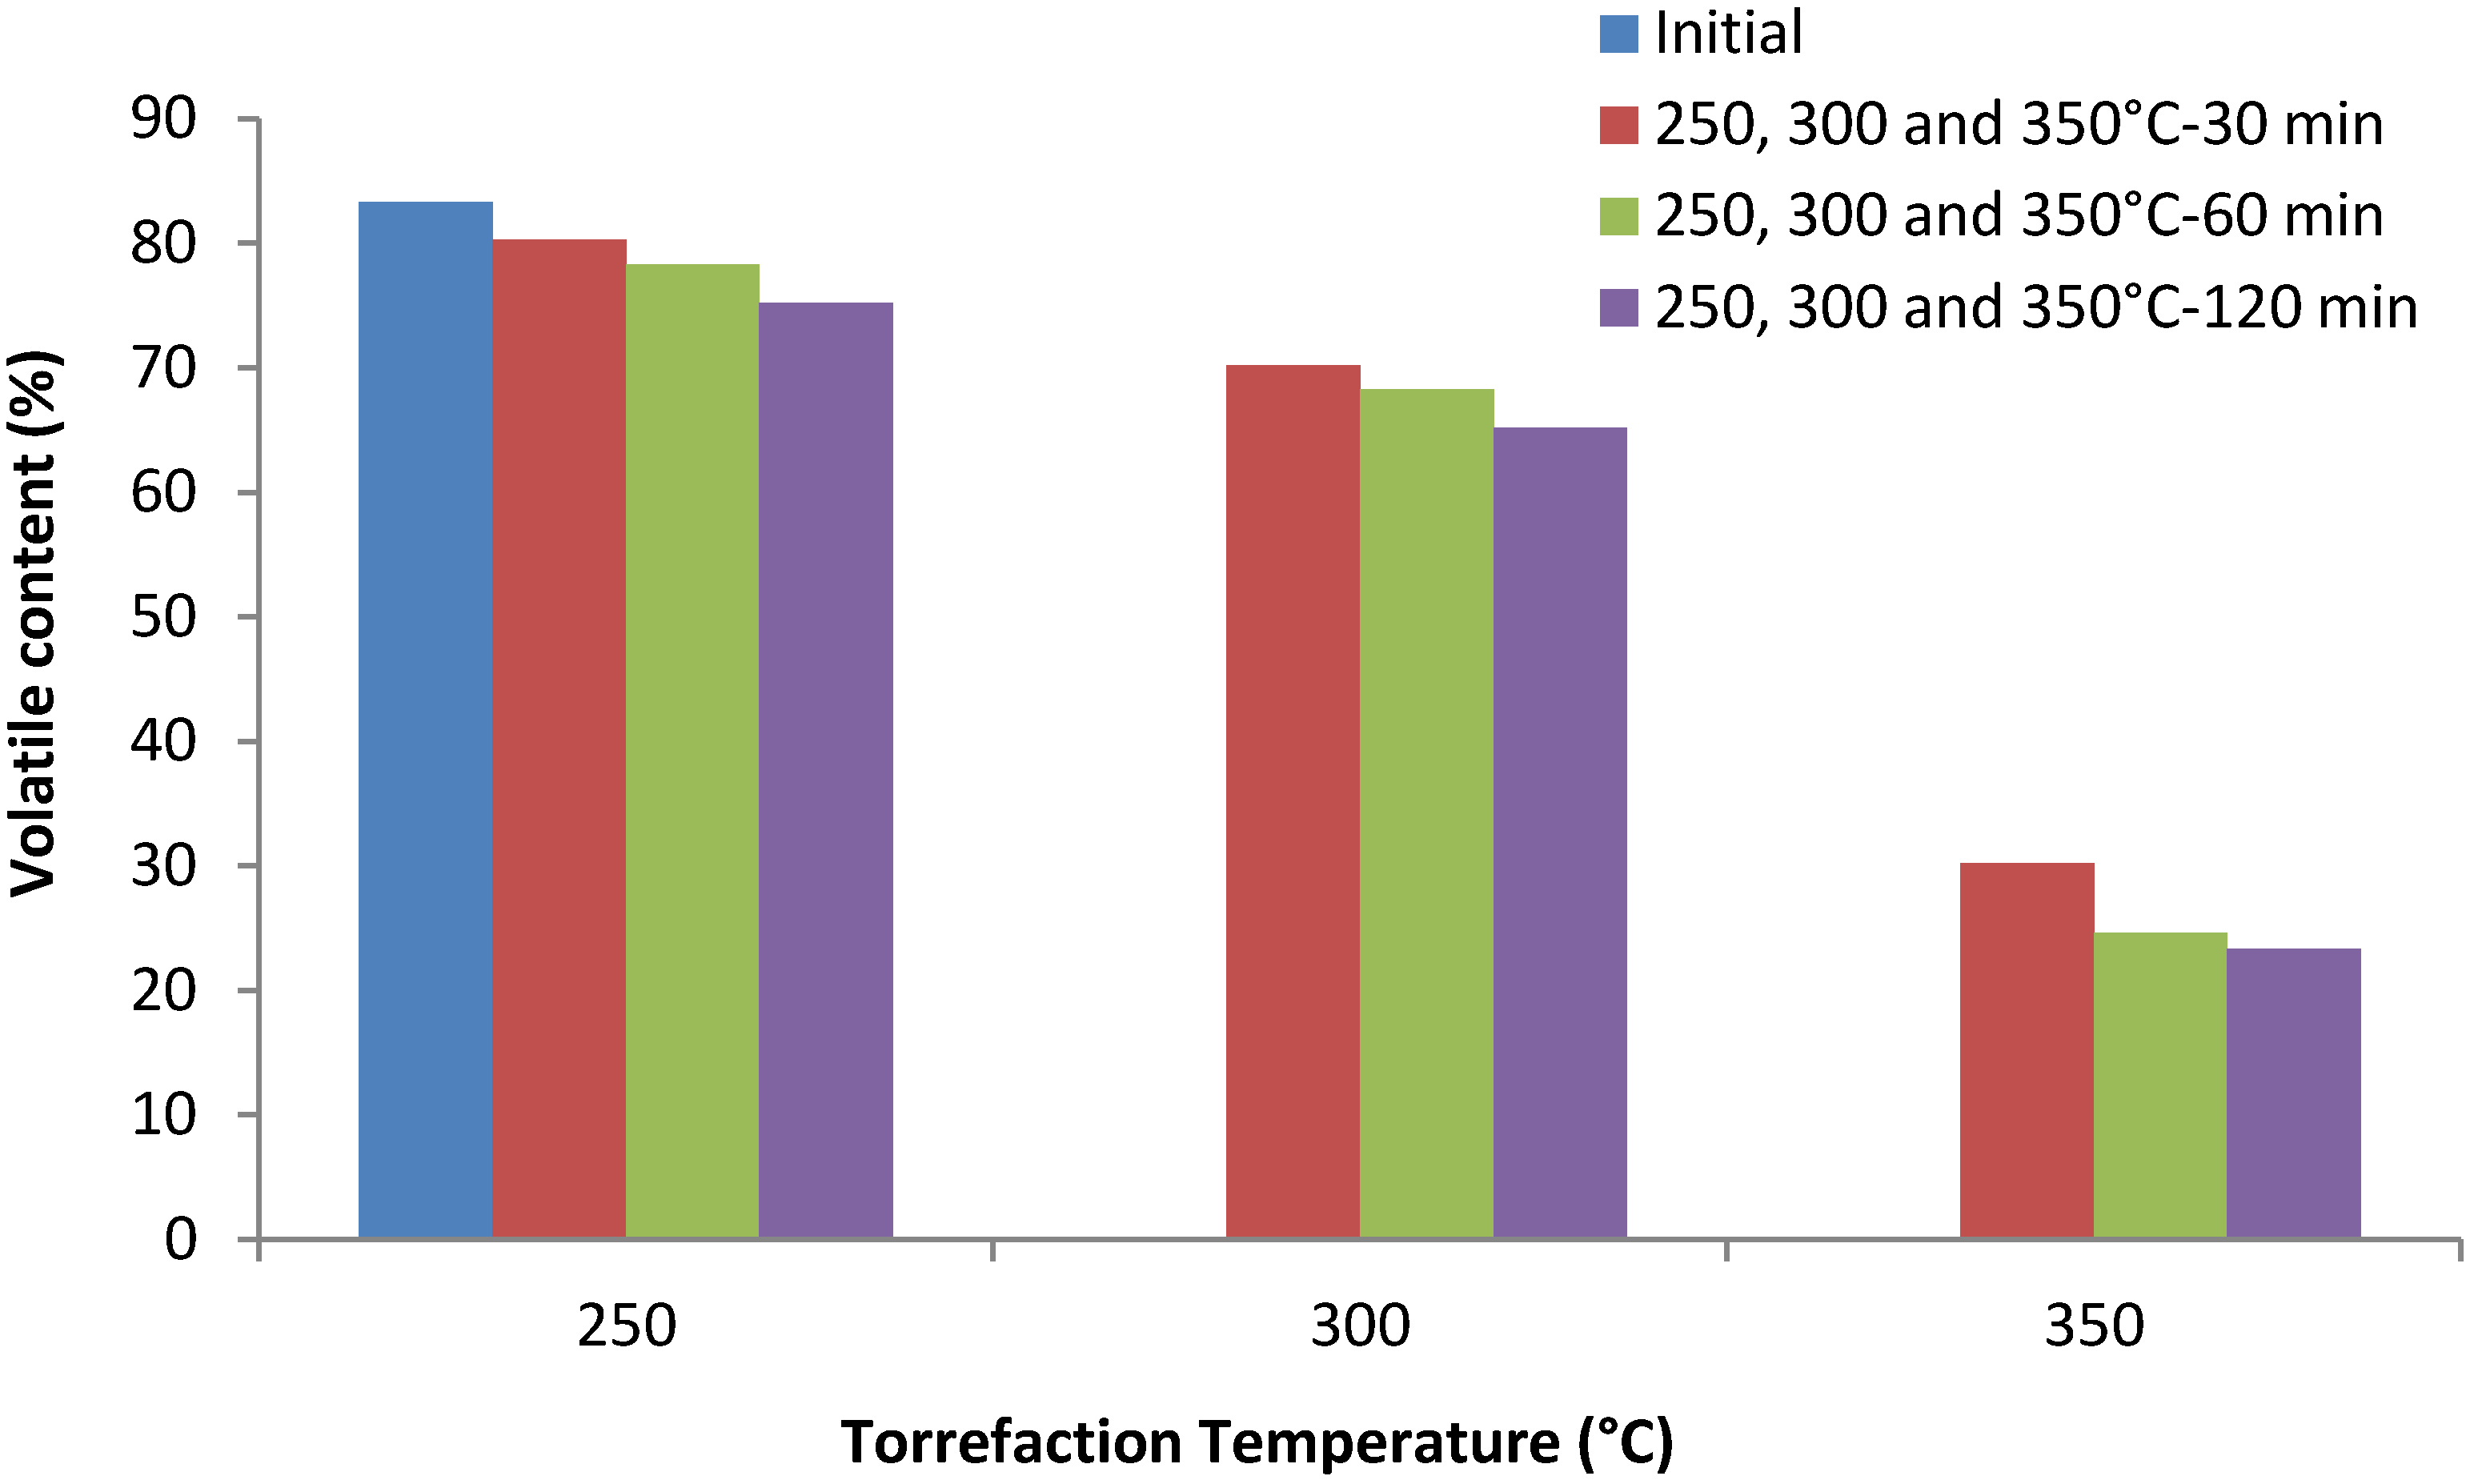
3.3. Bar and Surface Plots


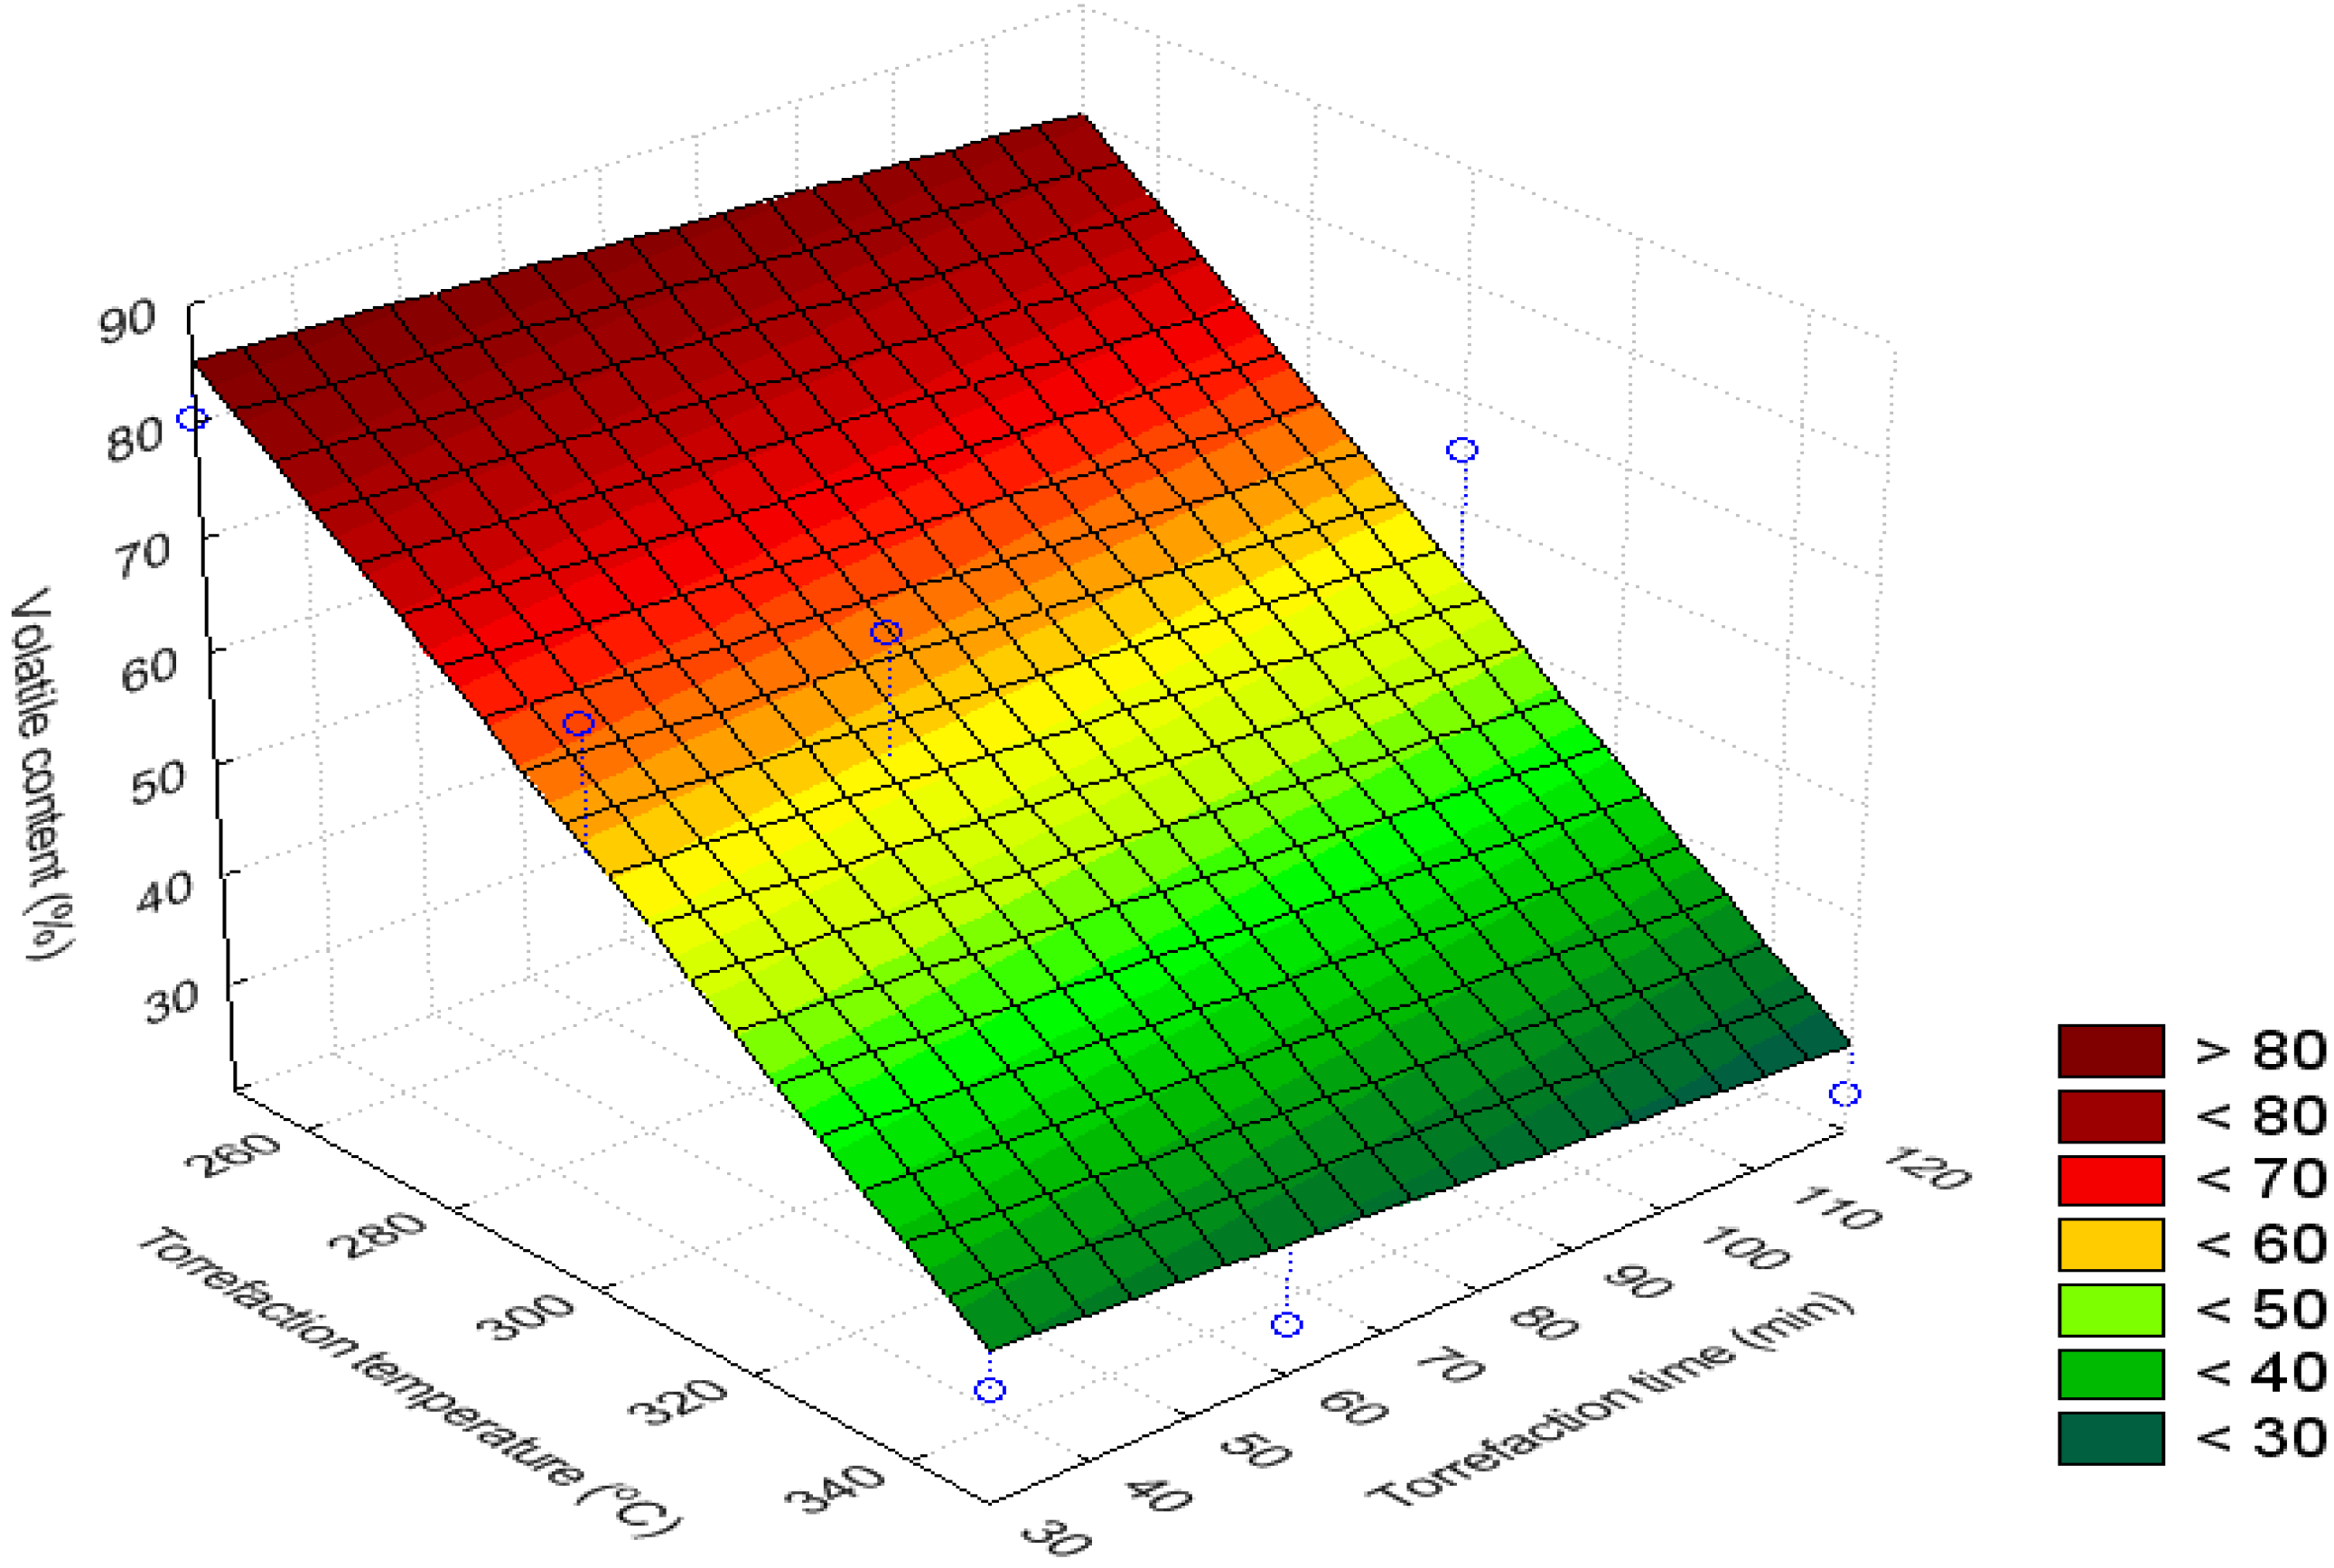
3.4. Volatile Content (%)
3.5. H/C Ratio
| Chemical composition | Torrefaction temperature (°C) | Torrefaction time (min) | Range | Objective |
|---|---|---|---|---|
| Moisture content (%) | 250 | 30–120 | >1.025 | Maximum |
| 300–350 | 30–120 | 0.525–0.725 | Minimum | |
| Carbon content (%) | 320–350 | 90–120 | >49.4 | Maximum |
| 250–350 | 30–120 | 47.8–48.6 | Minimum | |
| Hydrogen content (%) | 250–280 | 30–120 | >4.9 | Maximum |
| 300–350 | 30–120 | 2.9–3.9 | Minimum | |
| Volatile content (%) | 250–300 | 30–120 | 80–50 | Maximum |
| 300–350 | 30–120 | 50–30 | Minimum | |
| H/C ratio | 250–280 | 30–120 | >1.4 | Maximum |
| 300–350 | 30–120 | 0.6–1.4 | Minimum |
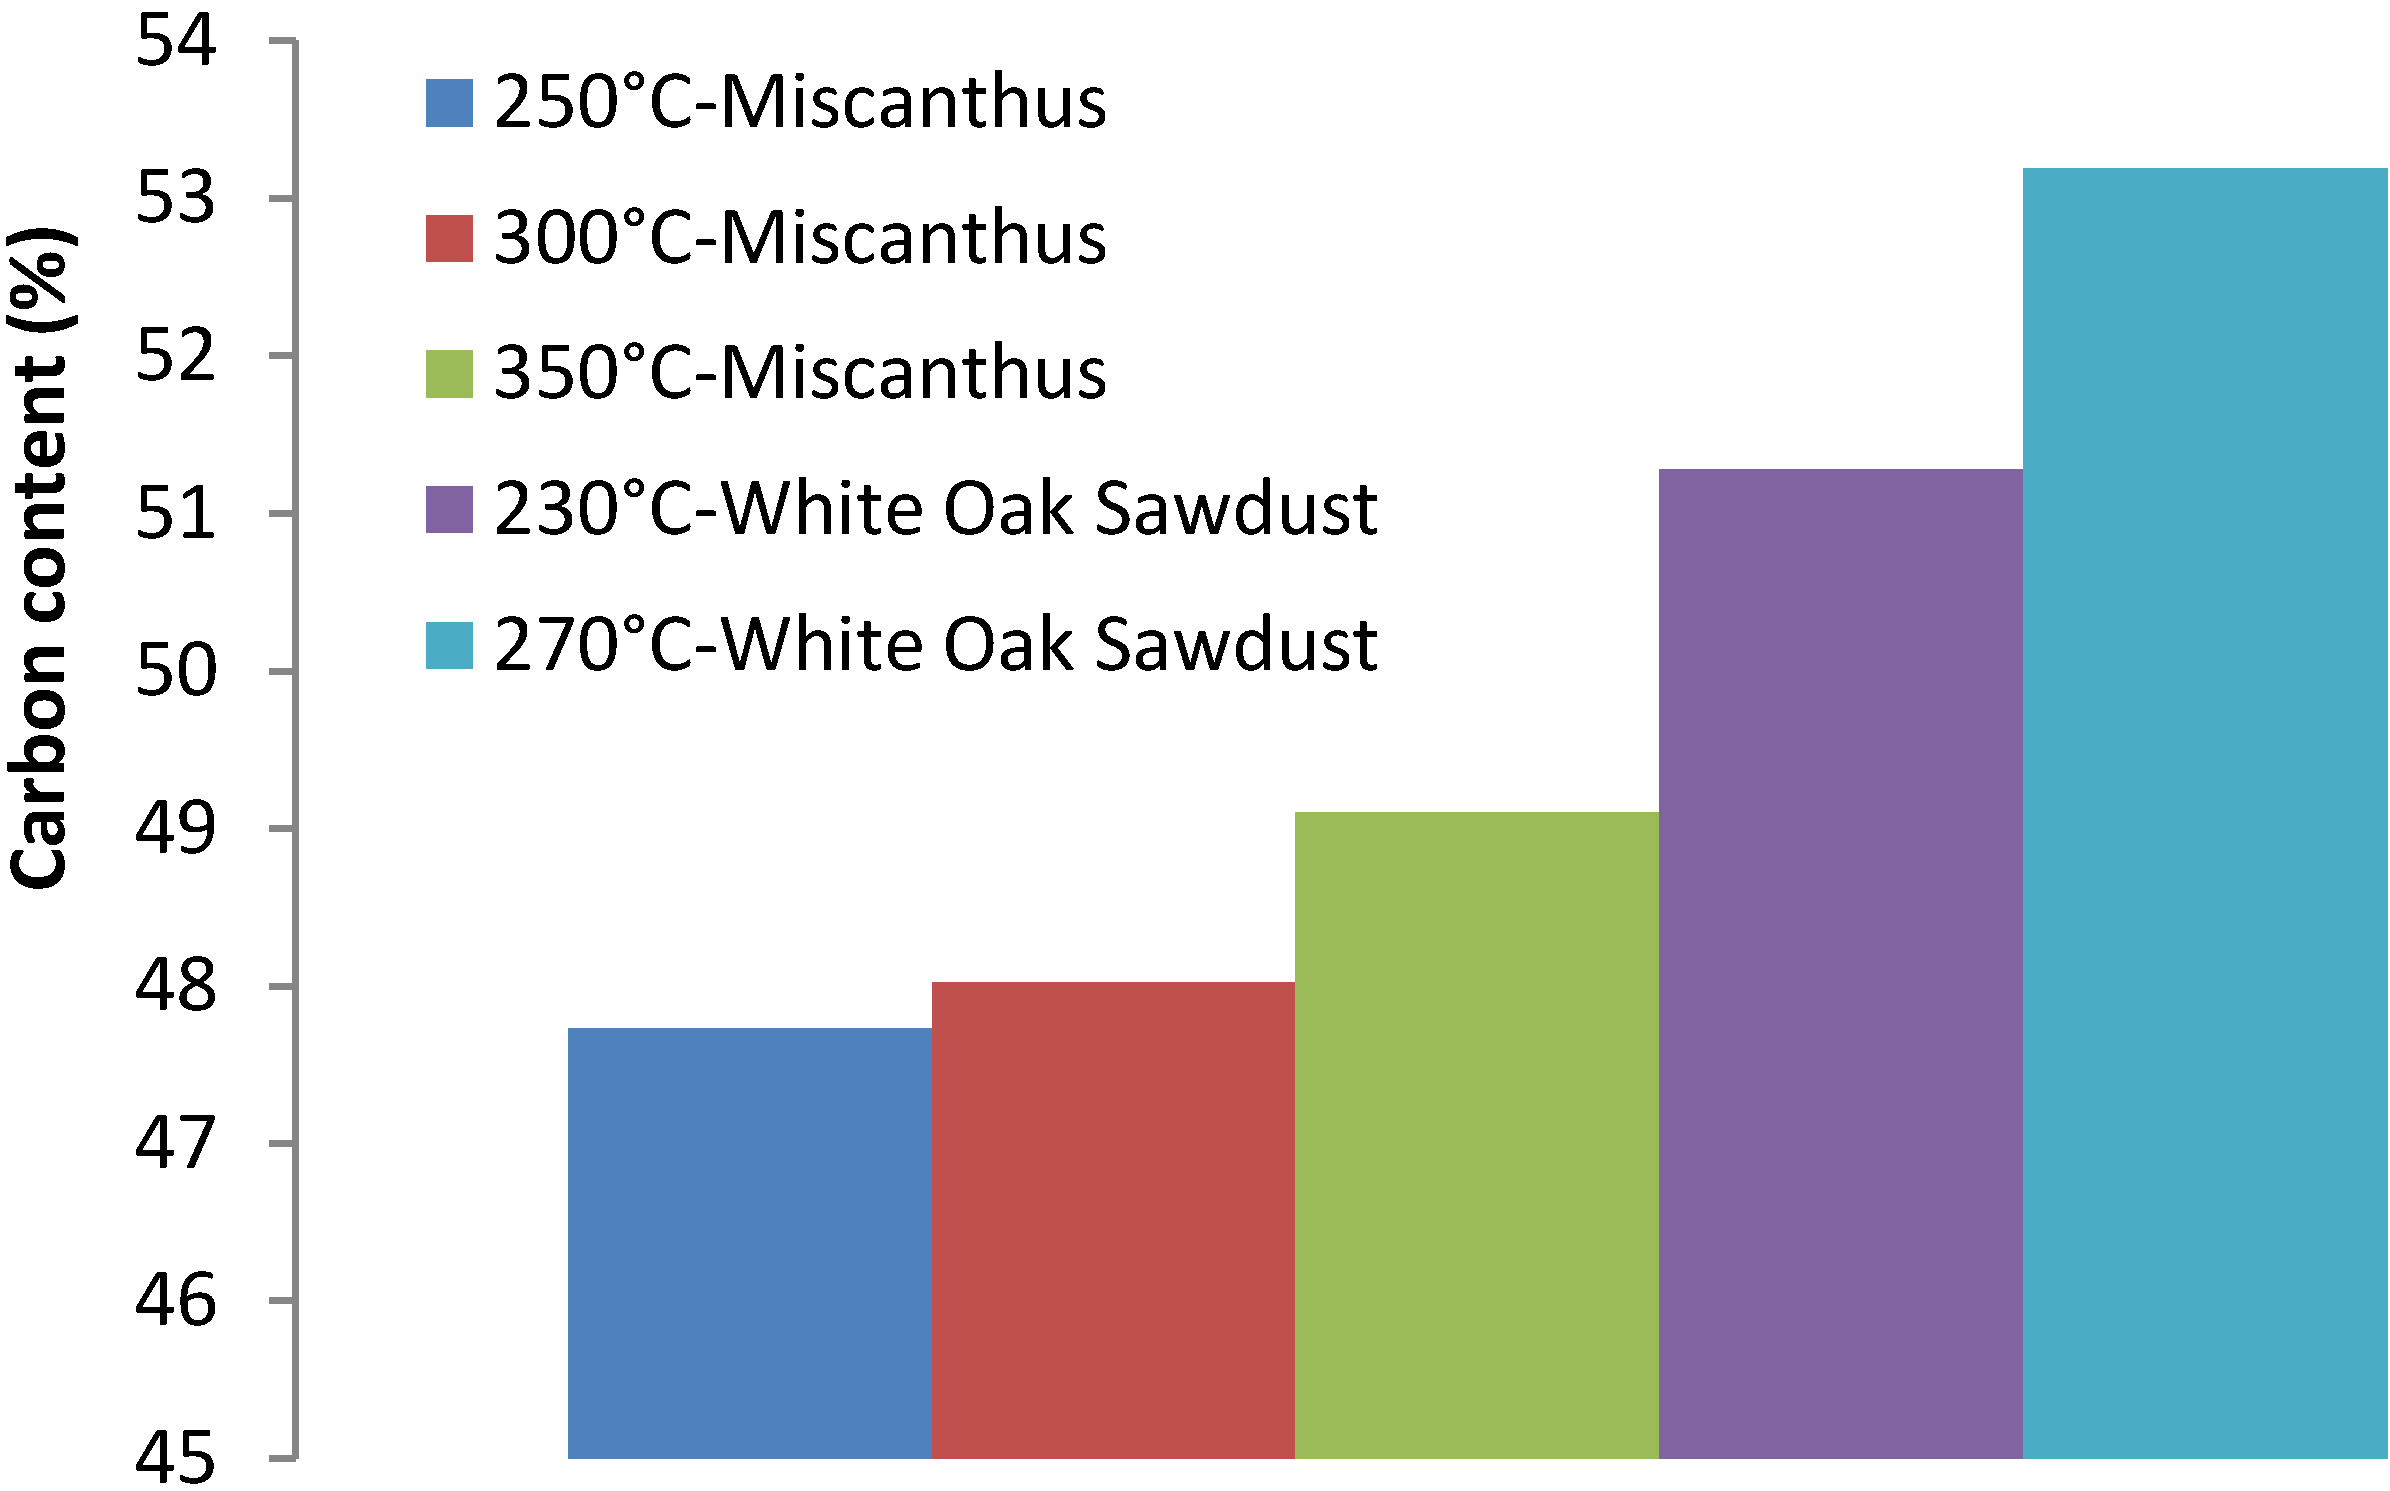
3.6. White Oak Sawdust
| S. No | Chemical Composition | 220 °C, 30 min | % Change | 270 °C, 30 min | % Change |
|---|---|---|---|---|---|
| 1 | Moisture content (%, w.b) | 2.11 | (−)75.263 | 1.79 | (−)79.01 |
| 2 | Volatile content (%) | 76.90 | (−) 4.76 | 66.31 | (−) 17.88 |
| 3 | Carbon content (%) | 51.28 | (+) 1.95 | 53.10 | (+) 3.54 |
| 4 | Hydrogen content (%) | 5.14 | (−) 3.54 | 4.67 | (−) 20 |
| 5 | Nitrogen content (%) | 0.17 | 0.0 | 0.16 | (−) 5.88 |

4. Discussion
5. Conclusions
Acknowledgments
U.S. Department of Energy Disclaimer
References
- Cherubini, F.; Peter, G.P.; Berntsen, T.; Stromman, A.H.; Hertwich, E. CO2 emissions from biomass combustion for bioenergy: Atmospheric decay and contributuon to global warming. GCB Bioenergy 2011, 3, 413–426. [Google Scholar] [CrossRef]
- Pimentel, D.; Patzek, T.W. Ethanol production using corn, switchgrass, and wood; biodiesel production using soybean and sunflower. Nat. Resour. Res. 2005, 14, pp. 65–75. Available online: http://journeytoforever.org/biofuel_library/Pimentel-Tadzek.pdf (accessed on 12 September 2012). [CrossRef]
- Sheehan, J.; Camobreco, V.; Duffield, J.; Graboski, M.; Shapouri, H. Life Cycle Inventory of Biodiesel and Petroleum Diesel for Use in an Urban Bus (May 1998); Report NREL/SR-580-24089. National Renewable Energy Laboratory: Golden, CO, USA, 1998; p. 33. Available online: http://www.biodiesel.org/reports/19980501_gen-339.pdf (accessed on 12 September 2012).
- Shapouri, H.; Duffield, J.; Wang, M. The Energy Balance of Corn Ethanol: An Update (July 2002); Agricultural Economic Report (AER) Number 814. United States Department of Agriculture (USDA): Washington, DC, USA, 2002; p. 8. Available online: http://ageconsearch.umn.edu/bitstream/34075/1/ae020814.pdf (accessed on 12 September 2012).
- Arias, B.R.; Pevida, C.G.; Fermoso, J.D.; Plaza, M.G.; Rubiera, F.G.; Pis-Martinez, J.J. Influence of torrefaction on the grindability and reactivity of woody biomass. Fuel Process Technol. 2008, 89, 169–175. [Google Scholar] [CrossRef]
- Demirbas, A. Electricity from biomass and hydroelectric development projects in Turkey. Energy Explor. Exploit. 2002, 20, 325–335. [Google Scholar] [CrossRef]
- Panwar, N.L.; Kothari, R.; Tyagi, V.V. Thermo chemical conversion of biomass-eco friendly energy routes. Renew. Sustain. Energy Rev. 2012, 16, 1801–1816. [Google Scholar] [CrossRef]
- Zhang, X.-Z.; Zhang, Y.H.P. One-step production of biocommodities from lignoicellulosic biomass by recombinanat celluloltic bacillus subtilis: Opportunities and challenges. Eng. Life Sci. 2010, 10, 398–406. [Google Scholar] [CrossRef]
- Tumuluru, J.S.; Sokhansanj, S.; Hess, R.J.; Wright, C.T.; Boardman, R.D. A review on biomass torrefaction process and product properties for energy applications. Ind. Biotechnol. 2011, 7, 384–401. [Google Scholar] [CrossRef]
- Jensen, P.A.; Sander, B.; Dam-Johasen, K. Pretreatment of straw for power production by pyrolysis and char wash. Biomass Bioenergy 2001, 20, 431–446. [Google Scholar] [CrossRef]
- Jenkins, B.M.; Baxter, L.L.; Miles, T.R., Jr.; Miles, T.R. Combustion properties of biomass. Fuel Process. Technol. 1998, 54, 17–46. [Google Scholar] [CrossRef]
- Tumuluru, J.S.; Hess, R.J.; Boardman, R.D.; Wright, C.T.; Westover, T.L. Formulation, pretreatment, and densification options to improve biomass specifications for co-firing high percentages with coal. Ind. Biotechnol. 2012, 8, 113–132. [Google Scholar] [CrossRef]
- Ionel, I.; Popescu, F.; Trif-Tordai, G.; Cebrucean, D.; Cioabla, A.; Constantin, C.; Savu, A. Experimental results concerning the co-combustion of biomass in a stationary fludized bed pilot with biogas support and CO2 capture. In Proceedings of the Sixteenth European Conference and Exhibition, Valencia, Spain, 2–6 June 2008.
- Evergreen Renewables, LLC. Biomass torrefaction as a preprocessing step for thermal conversion: Reducing costs in the biomass supply chain. White paper. Available online: http://evergreenrenewable.com/welcome_files/Biomass%20torrefaction.pdf (accessed on 11 June 2012).
- Van Loo, S.; Koppejan, J. Handbook of Biomass Combustion and Co-Firing; Twente University Press: Enschede, The Netherlands, 2004. [Google Scholar]
- Kavalov, S.; Peteves, S.D. Bioheat Applications in the European Union: An Analysis and Perspective for 2010; European Commission DG JRC Report EUR 21401EN; Directorate General Joint Research Centre (DG JRC) Institute for Energy: Petten, The Netherland, 2004. [Google Scholar]
- Foster, D.J.; Livingston, W.R.; Wells, J.; Williamson, J.; Gibb, W.H.; Bailey, D. Particle Impact Erosion and Abrasion Wear—Predictive Methods and Remedial Measures; Report No. COAL R241 DTI/Pub URN 04/701; Mitsui Babcock Energy Limited: Renfrew, UK, 2004. [Google Scholar]
- Saddawi, A.; Jones, J.M.; Williams, A.; Le Coeur, C. Commodity fuels from biomass through pretreatment and torrefaction: Effects of mineral content on torrefied fuel characteristics and quality. Energ Fuel 2012, in press. [Google Scholar]
- Uslu, A.; Faaij, A.P.C.; Bergman, P.C.A. Pretreatment technologies and their effect on international bioenergy supply chain logistics: Techno-economic evaluation of torrefaction, fast pyrolysis, and pelletization. Energy 2008, 33, 1206–1223. [Google Scholar] [CrossRef]
- Zanzi, R.; Ferro, D.T.; Torres, A.; Soler, P.B.; Bjornbom, E. Biomass Torrefaction. In Proceedings of the 6th Asia-Pacific International Symposium on Combustion and Energy Utilization, Kuala Lumpur, Malaysia, 20–22 May 2002.
- Bourgois, J.P.; Doat, J. Torrefied Wood from Temperate and Tropical Species: Advantages and Prospects. In Bioenergy 84, Proceedings of the International Conference on Bioenergy, Goteborg, Sweden, 15–21 June 1984; Egneus, H., Ellegard, A., O’Keefe, P., Kristofferson, L., Eds.; Elsevier Applied Science: London, UK, 1984; pp. 153–159, ISBN: 978-085-3343-51-6. [Google Scholar]
- Shafizedeh, F. Pyrolytic Reactions and Products of Biomass. In Fundamentals of Biomass Thermochemical Conversion; Overend, R.P., Milne, T.A., Mudge, L.K., Eds.; Elsevier Applied Science: London, UK, 1985; pp. 183–217. [Google Scholar]
- Williams, P.T.; Besler, S. The influence of temperature and heating rate on the slow pyrolysis of biomass. Renew. Energ. 1996, 7, 233–250. [Google Scholar] [CrossRef]
- Lipinsky, E.S.; Arcate, J.R.; Reed, T.B. Enhanced Wood Fuels via Torrefaction. Fuel Chem. Div. Prepr. 2002, 47, 408–410. [Google Scholar]
- Bergman, P.C.A.; Boersma, A.R.; Zwart, R.W.H.; Kiel, J.H.A. Torrefaction for Biomass Co-firing in Existing Coal-fired Power Stations; Report ECN-C--05-013; Energy Research Centre of the Netherlands (ECN): Petten, The Netherlands, 2005. [Google Scholar]
- Bergman, P.C.A.; Boersma, A.R.; Kiel, J.H.A.; Prins, M.J.; Ptasinski, K.J.; Janssen, F.G.G.J. Torrefied Biomass for Entrained-flow Gasification of Biomass; Report ECN-C--05-026; Energy research Centre of the Netherlands (ECN): Petten, The Netherlands, 2005. [Google Scholar]
- Bridgeman, T.G.; Jones, J.M.; Shield, I.; Williams, P.T. Torrefaction of reed canary grass, wheat straw, and willow to enhance solid fuel qualities and combustion properties. Fuel 2008, 87, 844–856. [Google Scholar] [CrossRef]
- Prins, M.J.; Ptasinski, K.J.; Janssen, F.G.G.J. Torrefaction of wood: Part 1—Weight loss kinetics. J.Anal. Appl. Pyrolysis 2006, 77, 28–34. [Google Scholar] [CrossRef]
- Prins, M.J.; Ptasinski, K.J.; Janssen, F.G.G.J. Torrefaction of wood: Part 2—Analysis of products. J.Anal. Appl. Pyrolysis 2006, 77, 35–40. [Google Scholar] [CrossRef]
- Sadaka, S.; Negi, S. Improvements of biomass physical and thermochemical characteristics via torrefaction process. Environ. Progress Sustain. Energy 2009, 28, 427–434. [Google Scholar] [CrossRef]
- Mohd, M.A. GC Analysis of Volatiles and Other Products from Biomass Torrefaction Process. Advanced Gas Chromatography—Progress in Agricultural, Biomedical, and Industrial Applications; InTech Open Access Publishing Company: Shanghai, China, 2012. ISBN: 978-953-51-0298-4. Available online: http://www.intechopen.com/books/advanced-gas-chromatography-progress-in-agricultural-biomedical-and-industrial-applications/gc-analysis-of-volatiles-and-other-products-from-biomass-torrefaction-process (accessed on 11 June 2012).
- Medic, D.; Darr, M.; Shah, A.; Rahn, S. The effects of particle size, different corn stover components, and gas residence time on torrefaction of corn stover. Energies 2012, 5, 1199–1214. [Google Scholar] [CrossRef]
- Shah, A.; Darr, M.J.; Medic, D. Techno-economic analysis of a production-scale torrefaction system for cellulosic upgrading. Biofuels Bioprod. Biorefin. 2012, 6, 45–57. [Google Scholar] [CrossRef]
- Van der Stelt, M.J.C.; Gerhauser, H.; Kiel, J.H.A.; Ptasinski, K.J. Biomass upgrading by torrefaction for the production of biofuel: A review. Biomass Bioenergy 2011, 35, 3748–3762. [Google Scholar]
- Peng, J.H.; Bi, X.T.; Sokhansanj, S.; Lim, J.C. A study of particle size effect on biomass torrefaction and densification. Energy Fuels 2012. [CrossRef]
- Chew, J.J.; Doshi, V. Recent advances in biomass pretreatment, torrefaction fundamentals, and technology. Renew. Sustain. Energy Rev. 2012, 15, 4212–4222. [Google Scholar] [CrossRef]
- Tumuluru, J.S.; Boardman, R.D.; Wright, C.T. Response surface analysis of elemental composition and energy properties of corn stover during torrefaction. J. Biobased Mater. Bioenergy 2012, 6, 1–12. [Google Scholar] [CrossRef]
- Shankar, T.J.; Bandyopadhyay, S. Optimization of extrusion process variables using a genetic algorithm. Food Bioprod. Process. 2004, 82, 143–150. [Google Scholar] [CrossRef]
- Shankar, T.J.; Bandyopadhyay, S. Process variables during single screw extrusion of fish and rice flour blends. J. Food Process. Preserv. 2005, 29, 151–164. [Google Scholar] [CrossRef]
- Shankar, T.J.; Shahab, S.; Bandyopadhyay, S.; Bawa, A.S. A case study on optimization of biomass flow during single-screw extrusion cooking using genetic algorithm (ga) and response surface method (RSM). Food Bioprocess Technol. 2010, 3, 498–510. [Google Scholar] [CrossRef]
- Michel, R.; Mischler, N.; Azambre, B.; Finqueneisel, G.; Machnikowski, J.; Rutkowski, P.; Zimny, T.; Weber, J.V. Miscanthus × Giganteus Straw and Pellets as Sustainable Fuels and Raw Material for Activated Carbon. Environ. Chem. Lett. 2006, 4, 185–189. [Google Scholar] [CrossRef]
- Khuri, A.Z.; Cornell, J.A. Response Surface Designs and Analysis; Marcel Dekker: New York, NY, USA, 1987. [Google Scholar]
- Pach, M.; Zanzi, R.; Björnbom, E. Torrefied Biomass: A Substitute for Wood and Charcoal. In Proceedings of the 6th Asia-Pacific International Symposium on Combustion and Energy Utilization, Kuala Lumpur, Malaysia, 20–22 May 2002.
- Bergman, P.C.A.; Keil, J.H.A. Torrefaction for Biomass Upgrading. In Proceedings of the 14th European Biomass Conference & Exhibition, Paris, France, 17–21 October 2005.
- Prins, M.J. Thermodynamic Analysis of Biomass Gasification and Torrefaction. Ph.D. Thesis, Technische Universiteit Eindhoven, Eindhoven, The Netherland, 2005. [Google Scholar]
- Mani, S. Recent Developments in Biomass Densification Technology. In Proceedings of Annual Conference of the Institute of Biological Engineering, Athens, GA, USA, 8 March 2008; Available online: http://openwetware.org/images/e/e0/2008-03-08_IBE_Presentation_Mani.pdf (accessed on 7 June 2012).
- Mani, S. Integrating Biomass Torrefaction with Thermo-Chemical Conversion Processes. In Proceedings of the 2009 AIChE Annual Meeting, Nashville, TN, USA, 8–13 November 2009. Paper No. 160229.
© 2012 by the authors; licensee MDPI, Basel, Switzerland. This article is an open access article distributed under the terms and conditions of the Creative Commons Attribution license (http://creativecommons.org/licenses/by/3.0/).
Share and Cite
Tumuluru, J.S.; Boardman, R.D.; Wright, C.T.; Hess, J.R. Some Chemical Compositional Changes in Miscanthus and White Oak Sawdust Samples during Torrefaction. Energies 2012, 5, 3928-3947. https://doi.org/10.3390/en5103928
Tumuluru JS, Boardman RD, Wright CT, Hess JR. Some Chemical Compositional Changes in Miscanthus and White Oak Sawdust Samples during Torrefaction. Energies. 2012; 5(10):3928-3947. https://doi.org/10.3390/en5103928
Chicago/Turabian StyleTumuluru, Jaya Shankar, Richard D. Boardman, Christopher T. Wright, and J. Richard Hess. 2012. "Some Chemical Compositional Changes in Miscanthus and White Oak Sawdust Samples during Torrefaction" Energies 5, no. 10: 3928-3947. https://doi.org/10.3390/en5103928
APA StyleTumuluru, J. S., Boardman, R. D., Wright, C. T., & Hess, J. R. (2012). Some Chemical Compositional Changes in Miscanthus and White Oak Sawdust Samples during Torrefaction. Energies, 5(10), 3928-3947. https://doi.org/10.3390/en5103928