Article

A Well-to-Wheel Comparative Life Cycle Assessment (LCA) of First- and Second-Generation Bioethanol as Alternatives to Gasoline in Motorsport Races


1
Department of Environmental and Prevention Sciences, University of Ferrara, Via Luigi Borsari 46, 44121 Ferrara, Italy
2
Department of Life Sciences, University of Modena and Reggio Emilia, Via Giuseppe Campi, 287, 41125 Modena, Italy
3
Engineering Department “Enzo Ferrari”, University of Modena and Reggio Emilia, Via Pietro Vivarelli, 10, 41125 Modena, Italy
4
Biogest-Siteia, University of Modena and Reggio Emilia, c/o Tecnopolo di Reggio Emilia Capannone 19 Area Ex Officine Reggiane Piazzale Europa, 1, 42124 Reggio Emilia, Italy
*
Authors to whom correspondence should be addressed.
Energies 2026, 19(9), 2155; https://doi.org/10.3390/en19092155
Submission received: 10 March 2026 / Revised: 16 April 2026 / Accepted: 27 April 2026 / Published: 29 April 2026
(This article belongs to the Special Issue Advanced and Improved Biofuels for Enhanced Engines Performance)

Abstract

Emissions from transportation are rapidly increasing, representing the second-largest source within the energy sector. Switching to biofuels is a promising strategy to mitigate these environmental impacts. The main aim of this study is to evaluate and compare the environmental performance of fossil gasoline and bioethanol blends in a high-performance Formula SAE race car using a comprehensive well-to-wheel (WTW) life cycle assessment (LCA) approach. The vehicle was tested under three fuel scenarios: (i) 100% fossil gasoline, (ii) a blend of 85% first-generation bioethanol (1G-pure bioethanol) derived from corn and 15% fossil gasoline (E85-1G), and (iii) a blend of 85% second-generation bioethanol (2G-pure bioethanol) derived from grape pomace, a winemaking waste product, and 15% fossil gasoline (E85-2G). The novelty of this work lies in the combined experimental and LCA-based comparison of crop-based and waste-derived bioethanol under identical high-performance operating conditions, enabling a direct assessment of feedstock influence on environmental impacts. The well-to-tank (WTT) results show that 2G bioethanol achieves the lowest environmental burdens across all impact categories, while 1G-pure bioethanol is significantly affected by emissions from corn cultivation. Fossil gasoline exhibits the highest impacts in terms of global warming potential (GWP) and Abiotic Resource Depletion (ARD). The tank-to-wheel (TTW) analysis confirms the superior environmental performance of the E85-2G blend. Despite requiring 6–16% more fuel to complete the race, E85-2G maintains its environmental advantage, and both biofuel blends produce lower air emissions than conventional gasoline.

1. Introduction

The imperative for sustainable mobility mandates a substantial reduction in both CO2 and pollutant emissions within the transportation sector [1]. Despite the nine years that have elapsed since the ratification of the Paris Agreement and the growing interest in electric vehicles, progress has been gradual in the transition toward clean energy [2]. Although significant progress has been made in the European transport sector through the introduction of stricter emission regulations, such as Euro 7, and the implementation of low-emission zones (LEZs), i.e., urban areas where the circulation of more polluting vehicles is restricted, the decarbonization of transport remains a major challenge, particularly with regard to greenhouse gas emissions [3,4]. Interest in biofuels is also driven by the need to reduce dependence on finite crude oil resources and related geopolitical risks [5,6]. This topic is also highly relevant in light of the revised Renewable Energy Directive (RED III), which strengthens the role of renewable energy in transport and promotes the deployment of advanced biofuels as part of the EU decarbonization strategy [7,8].
Bioethanol is among the most widely used renewable liquid fuels, can be produced from a wide range of feedstocks, and is commonly classified into three generations: 1G-pure bioethanol (food crops), 2G-pure bioethanol (non-food biomass), and 3G-pure bioethanol (algae) [9,10]. While 1G-pure bioethanol is commercially mature and cost-effective, its reliance on edible resources raises the well-known food-versus-fuel concern [11]. In fact, under the RED II framework, first-generation biofuels are capped at 7% of transport energy, while advanced biofuels are promoted through dedicated sub-targets. The revised RED III directive further strengthens this approach by increasing the role of advanced biofuels and renewable fuels of non-biological origin, while maintaining strict limits on food-based biofuels [12].
Conversely, 2G and 3G feedstocks rely on diverse sources, including agricultural waste and algae, which are often considered carbon-neutral or even carbon-negative in cases where the feedstock consumes atmospheric CO2 [10,13]. While 3G bioethanol is considered highly promising because of its potential sustainability advantages, its production is still constrained by elevated costs that hinder broad commercial implementation [14,15]. By contrast, 2G bioethanol produced from waste and residue streams has, in many cases, already achieved practical and industrial relevance, demonstrating that waste-based conversion pathways are more technologically mature and closer to large-scale deployment [16]. Interesting and valuable applications have been obtained using cereal waste [17], date palm waste [18], sugar cane bagasse [19] and rice straw [20] as raw materials.
Bioethanol is mainly produced via fermentation by Saccharomyces cerevisiae, following hydrolysis of polysaccharides into fermentable sugars [21]. The key difference between 1G-pure bioethanol and 2G-pure bioethanol processes lies in substrate preparation, as 2G feedstocks require pretreatment to separate cellulose and hemicellulose from lignin, which is not fermentable [22,23].
Delignification can be achieved through chemical, physicomechanical, or biological approaches, each differing in efficiency, selectivity, and environmental impact [24]. Chemical methods, such as alkaline, acidic, or organosolv treatments, are generally highly effective in lignin removal but may require harsh reagents and significant energy input [25].
Recent advances in lignocellulosic biomass conversion include process configurations such as SHCF and SSCF, which improve sugar utilization and ethanol yields [26], along with innovative pretreatments like heavy-ion irradiation that enhance enzymatic accessibility and saccharification efficiency [23].
From an environmental perspective, the main distinction lies between crop-based routes, which may involve land, water, and agrochemical burdens, and waste-derived routes, which can reduce these upstream burdens but may be more sensitive to logistics and pretreatment requirements. These differences motivate a comparative life cycle assessment under controlled operating conditions [27].
This comprehensive tool is the well-to-wheel (WTW) method, which tracks the process from the energy carrier source (“well”) to the vehicle wheel (“wheel”). It represents a specialized application of the life cycle assessment (LCA) methodology for motor fuels [28]. LCA is a standardized tool for assessing environmental impacts across a product or process life cycle, widely adopted in decision-making since the early 1990s [29].
WTW analysis is based on inventorying the set of input and output data related to the materials and energy involved in a specific process that impacts the environment [30]. It is a quantitative and qualitative assessment of environmental impacts across the entire fuel life cycle, identifying hotspots and cleaner pathways, and is divided into well-to-tank (WTT) and tank-to-wheel (TTW) stages [31].
The MoRe Modena Racing (MMR) team of the University of Modena and Reggio Emilia (Italy) was founded in 2004 and is committed to building a single-seater race car to challenge university teams from all over the world in Formula SAE competitions. This study applies a WTW-LCA to evaluate the environmental impact of different fuels used in a Formula SAE race car, testing three scenarios: 100% fossil gasoline, 85% 1G-pure bioethanol (from corn) blended with gasoline, and 85% 2G bioethanol (from grape pomace, a fibrous residue from grape processing) [32]. It is typically considered a low-economic-value waste product and is often used as animal feed or a source of grape oil [33]. The LCA analysis encompassed both the fuel production stage and the fuel’s use during a 22 km race.
This case study was selected because motorsports provide a demanding platform to test renewable fuels and drive their transfer to the broader transport sector, while also responding to growing societal expectations for sustainability. Historically, motorsports have paved the way for pioneering innovations in the automotive industry [34], with numerous racing-originated technologies finding their way into road vehicles [35]. While WTW-LCA enables comprehensive fuel evaluation, studies comparing first- and second-generation bioethanol with gasoline under real racing conditions remain limited [36]. Therefore, the main aim of this study is to experimentally and systematically compare the environmental performance of fossil gasoline and first- and second-generation bioethanol blends under real racing conditions using a well-to-wheel LCA approach.
The novelty lies in the integrated experimental and WTW-LCA comparison of crop-based and waste-derived bioethanol under identical high-performance conditions, providing new evidence on the role of feedstock and demonstrating the environmental advantages of second-generation biofuels. These findings may support the development of more sustainable fuel strategies, contributing to the advancement of waste-based biofuels within future decarbonization pathways.
This study does not address compliance with on-road regulations (e.g., Euro standards or RDE), but focuses on a Formula SAE prototype as a case study to compare fuel pathways under high-performance conditions. While motorsport is not representative of general transport, it offers a demanding test environment to assess alternative fuels. The findings are therefore limited to this context and should not be directly extended to road vehicles without further validation.

2. Materials and Methods

2.1. The Case Study

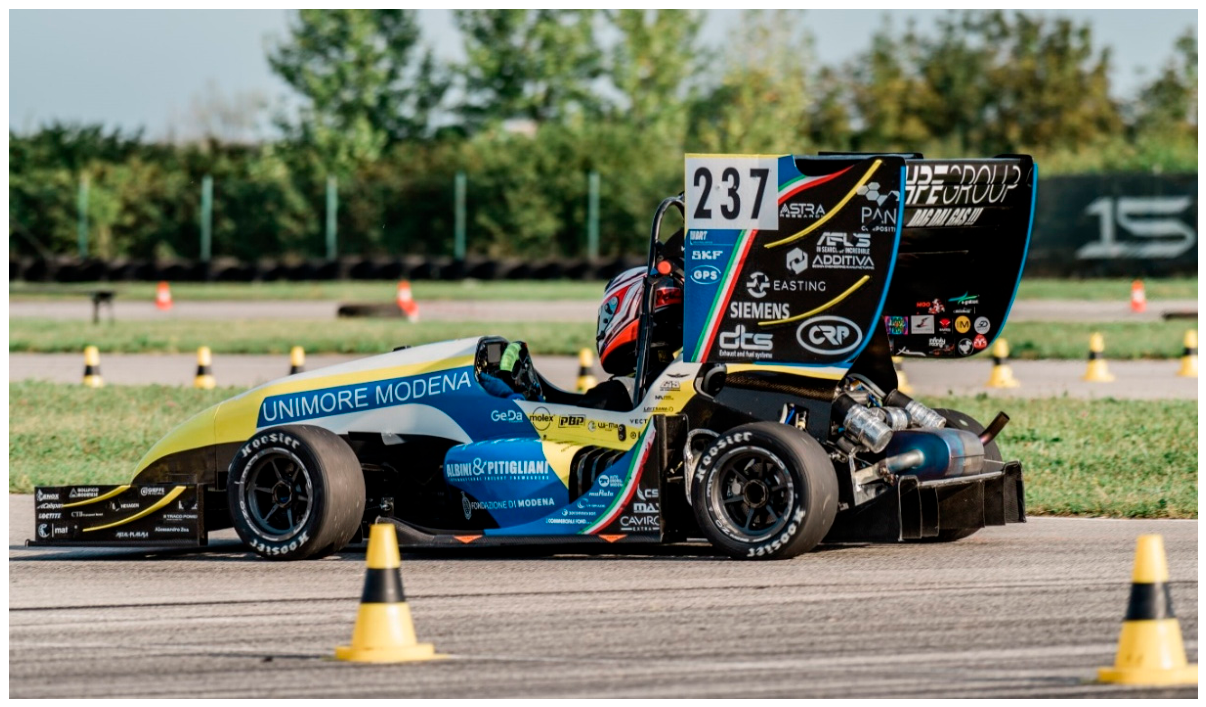
The MoRe Modena Racing (MMR) team has designed and developed a hybrid prototype, M24-LH (shown in Figure 1), which weighs 210 kg, featuring a monocoque chassis and the wide use of carbon fibers. The vehicle accelerates from 0 to 100 km/h in 2.6 s and reaches a maximum speed of 130 km/h. The car is equipped with a 4-cylinder in-line internal combustion engine derived from a Suzuki GSX-R motorcycle (Suzuki, Hamamatsu, Japan), specifically customized to reach a displacement of 708 cc, delivering 95 hp.
The M24-LH Formula SAE vehicle was used in this study as prototype not representing a road-legal production vehicle.
The engine was originally designed to run on 98 RON gasoline but was later converted to also operate on E85 bioethanol, comprising approximately 85% ethanol and 15% gasoline. Gasoline and E85 operation was managed through separate ECU (Engine Control Unit) calibrations developed for the respective fuels, so the experimental results for each fuel refer to its dedicated calibration. In this work, 100% fossil gasoline was adopted as the reference fossil scenario against which the ethanol-rich blends were compared. In fact, the prototype has been used for testing and data collection, comparing the results across three fuel types: 100% fossil gasoline, first-generation (1G) and second-generation (2G) bioethanol blends. The experimental data refer to the 22 km endurance race during three recent events held in Austria, Croatia, and Italy.
The well-to-tank stage of the analysis has incorporated the fuel preparation stage, which covers the acquisition of raw materials, fuel production and transport as a finished product, whereas the tank-to-wheel stage includes fuel use during the competition.

2.2. The Scope, Functional Units and System Boundaries

The primary goal of this life cycle assessment (LCA) was to compare the environmental impacts associated with the production and subsequent use of three distinct fuels in a Formula SAE vehicle during a 22 km endurance event.
The study employed two separate functional units (FUs): for the WTT stage, the FU was defined as 1 ton of fuel produced, whereas for the TTW stage, the FU was defined as the 22 km race length completed.
These dual FUs were chosen to reflect the study objective and ensure a fair comparison over the 22 km race, attributing differences in environmental impacts solely to fuel characteristics and life cycles. Fuel consumption data are reported in Table 1.
The TTW comparison refers to fuel use during the 22 km endurance event. Since E85-1G and E85-2G differ only in ethanol origin and not in final blend composition, the same on-track fuel-consumption data were used for both E85 scenarios, whereas their environmental difference is generated in the WTT stage. Differences in fuel consumption among the three events are attributable to differences in track layout and average vehicle speed, which affect the operating conditions and fuel demand over the same 22 km race distance.
Furthermore, the data presented in Table 2 illustrate how the differing intrinsic properties of the fuels result in varying consumption rates for the same vehicle and route. This FU definition thus enables an accurate comparison of the environmental impact of fuels, incorporating both the operational performance of the vehicle and the specific characteristics of each fuel.
In this comparative analysis of the fuels utilized by the MMR team, the system boundaries were carefully delineated to encompass the most significant and pertinent stages necessary for evaluating the environmental impacts associated with the three fuels under consideration: conventional gasoline, 1G-pure bioethanol, and 2G-pure bioethanol.
This study employs cradle-to-grave system boundaries, which are based on Alessa et al. [34] and focus on the life cycle stages from fuel production to fuel utilization.
Specifically, the system boundaries include the following:
  • Feedstock procurement, which involves crude oil extraction for gasoline, biomass cultivation for 1G-pure bioethanol, and wine waste collection for 2G-pure bioethanol.
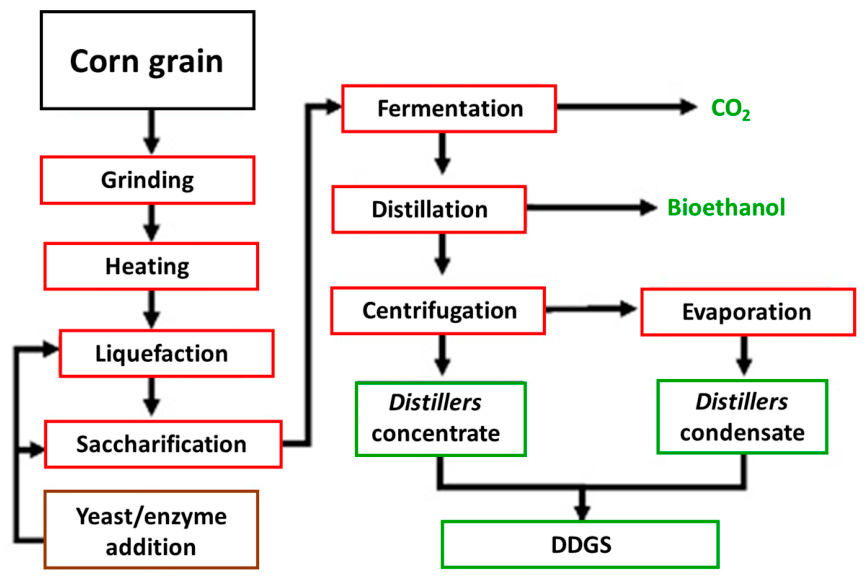
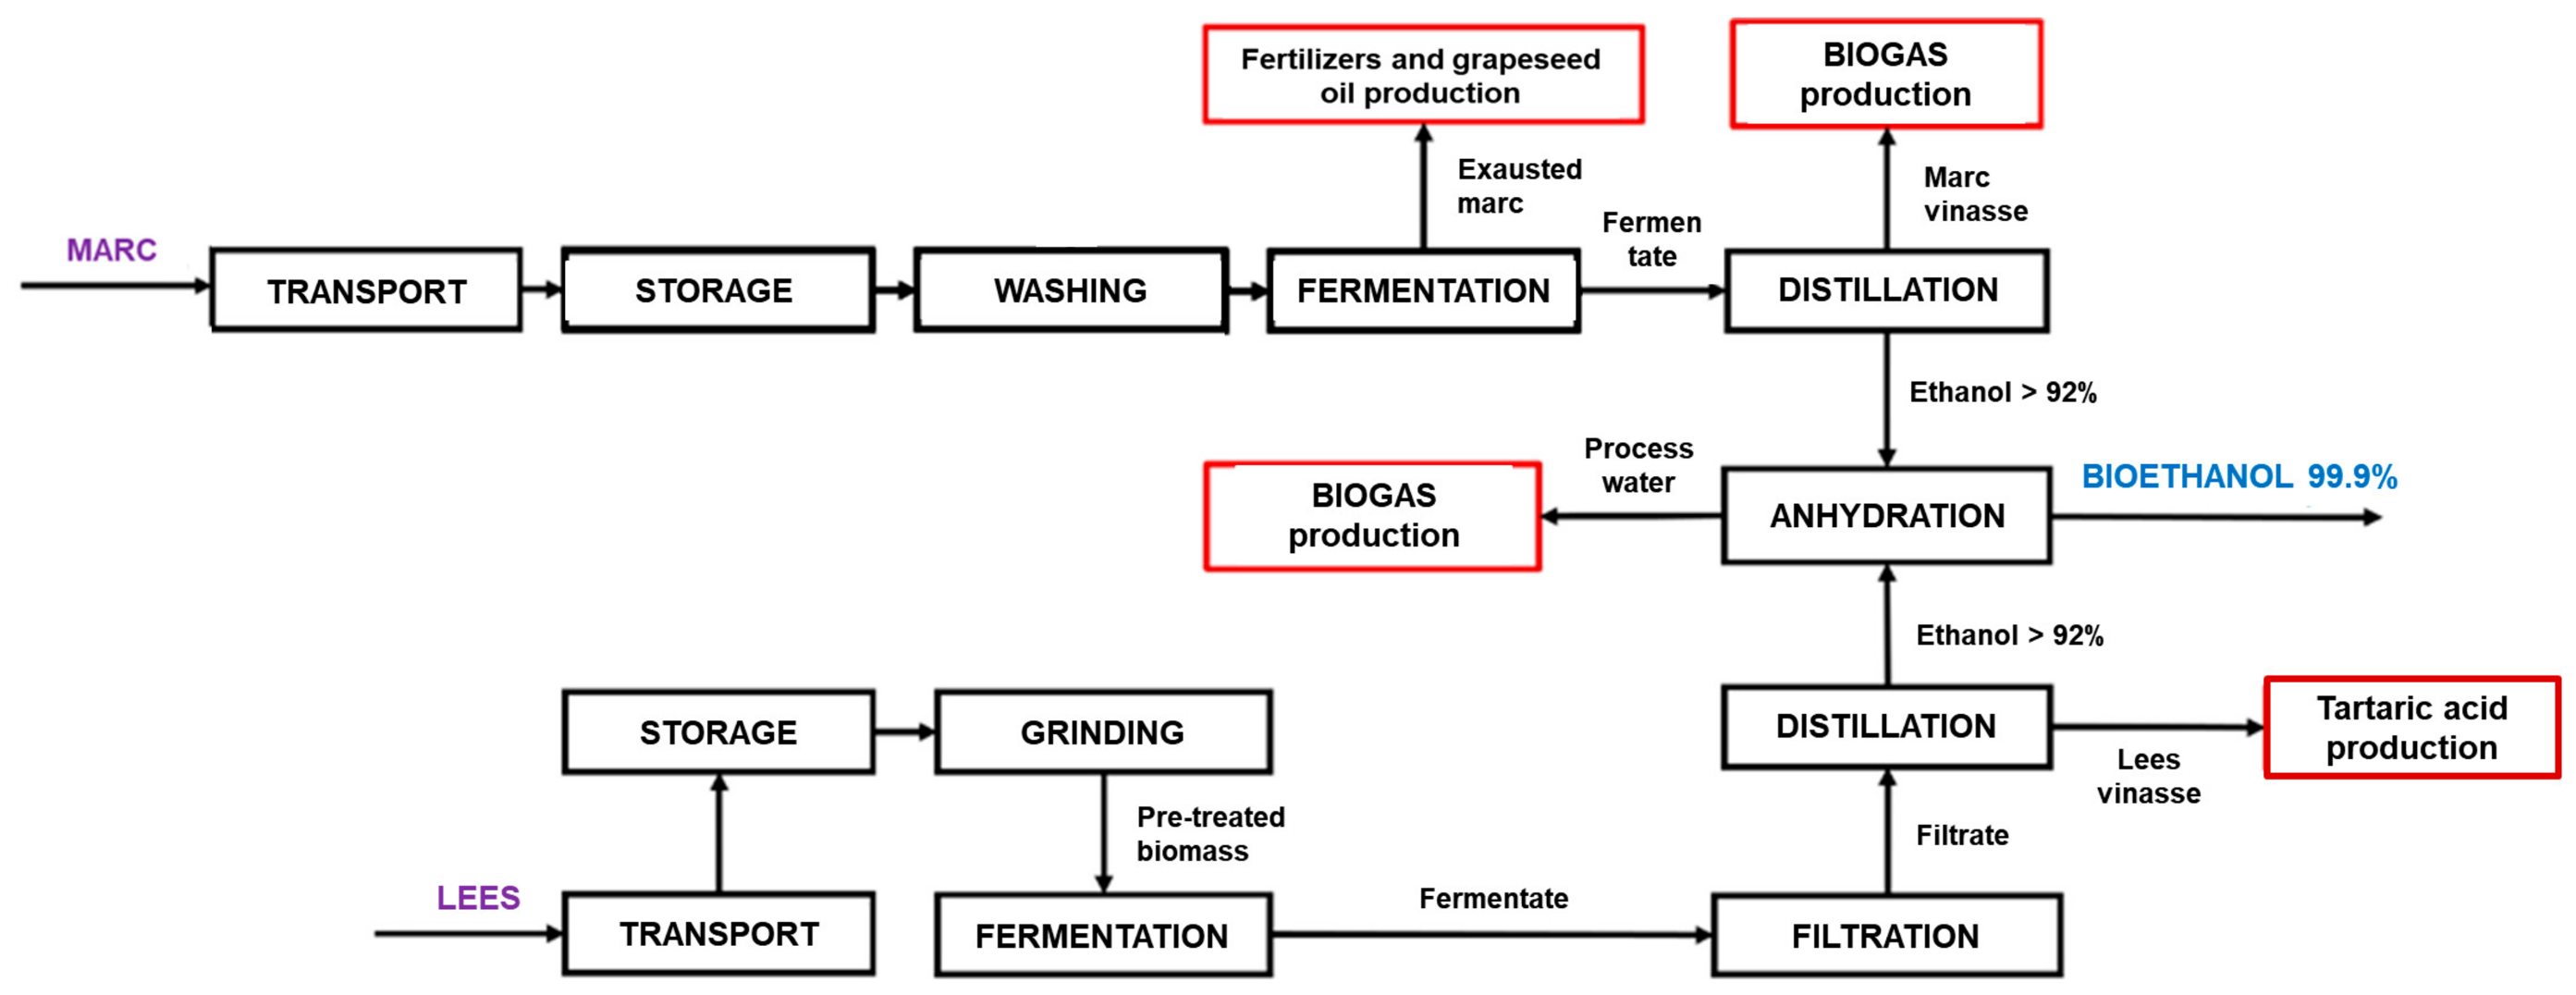
  • Fuel production, encompassing the refining process and blending additives for gasoline; for 1G-pure bioethanol, this includes fermentation, distillation, and anhydrification; and for 2G-purebioethanol, this involves the collection and transportation of grape pomace, physical pretreatments (i.e., washing), enzymatic hydrolysis, fermentation, distillation, and anhydrification (see Figure 2 and Figure 3).
  • Race emissions generated from fuel combustion during the 22 km race by the MMR vehicle.
Conversely, certain processes were excluded from the analysis:
  • For 1G-pure bioethanol, the transportation of raw materials from fields to the plant and of bioethanol from the plant to Italy, due to the unavailability of detailed data.
  • MMR vehicle production, as it is assumed that the same vehicle is used for all three fuels, thereby nullifying its impact in comparison.
  • The construction and maintenance of infrastructure (i.e., energy, refineries, bioethanol infrastructures, roads), owing to the difficulty of accurately allocating these impacts to individual fuels and the lack of specific data.
  • The end-of-life of fuels, assuming their complete combustion during the race.

2.3. Life Cycle Inventories

2.3.1. Production of 2G Bioethanol from Grape Pomace: Primary Data

Grape pomace, generated as a waste stream by the CAVIRO cooperative in Emilia Romagna (Italy), consists of marc (skins, seeds, and stalks) and lees (spent yeast, salts, and lignocellulosic residues). The 2G bioethanol process, fully developed by CAVIRO as an integrated biorefinery based on circular economy principles, allowed access to primary data (Figure 2). Pomace was transported over 120–140 km by trucks (~15 t per trip), stored in tanks, and then processed: lees underwent continuous fermentation, while marc was washed and fermented separately under controlled temperature conditions.
The transportation of corn from the field to the plant and of bioethanol from the plant to Italy was excluded from the system boundaries because of the lack of precise primary data, as the available data were secondary. The fermentation conditions and microbial biomass consortium employed by CAVIRO are confidential and cannot be reported herein. Distillation was carried out at ~85 °C, producing ethanol (>92%) that was further purified to 99%. Residues were valorized: lees for calcium tartrate extraction and biogas production, and marc for fertilizers, mushroom cultivation, and energy recovery after oil extraction. The inventory of 2G bioethanol production is reported in Table 3.

2.3.2. Production of 1G-Pure Bioethanol and Fossil Gasoline: Secondary Data

The gasoline refining process was modeled using the EcoinventTM v3.7.1 dataset (Zurich, Switzerland), adapted to reflect European conditions and gasoline formulations. The reference fuel is 98 RON gasoline, produced through standard refining processes to ensure high engine performance. As the process is treated as an elementary flow in EcoinventTM, a detailed inventory is not available [42].
To produce 1G-pure bioethanol from corn, both the AgribalyseTM (Agence de la transition écologique, Angers, France) and EcoinventTM v.3.7.1 datasets were employed. These datasets are representative of the maize agricultural supply chain, encompassing cultivation, agricultural practices, and agronomic inputs, as well as the industrial process of converting maize to ethanol, including biochemical transformation and purification processes, and the production of co-products such as Distillers Dried Grains with Solubles (DDGS).
The production of 1G-pure bioethanol from corn is a well-established process, so standardized operations were used for this analysis (Figure 3).
The process includes corn cultivation, transport, and conversion into anhydrous ethanol for E85 production. Cultivation is resource-intensive, involving fertilizers, pesticides, and irrigation, followed by transport to processing facilities. Ethanol is produced via dry milling, hydrolysis, and fermentation using Saccharomyces cerevisiae, with DDGS as a co-product. After distillation, ethanol is blended with gasoline to produce E85 for use in spark-ignition engines specifically calibrated for high-ethanol blends.

2.3.3. Life Cycle Impact Assessment

The ReCiPe Midpoint (H) v.1.11 (PRé Consultants, Amersfoort, The Netherlands) method and the open-source package OpenLCATM v.1.8 (GreenDelta, Berlin, Germany) equipped with the databases EcoinventTM 3.7.1 and AGRIBALYSE 3.1 were used for the life cycle inventory assessment (LCIA). The results are discussed in terms of their characterized and normalized values, as are the process contributions and inventory substances with environmental impacts. The midpoint impact categories and relative units are reported in Table 4. Allocation was not necessary because we considered the race as the unique process output.

2.3.4. Uncertainty Analysis

Uncertainties in LCA are associated with input data in the LCI (e.g., data variability, incorrect estimates, outdated or unrepresentative data, measurement errors), modeling assumptions, and characterization and/or normalization factors [43]. We performed 1000 Monte Carlo simulations, the method most applied in LCA uncertainty analysis. In Monte Carlo analysis, the values of inputs and outputs are dependently sampled from unit process distributions for a fixed number of iterations and then aggregated into LCA results to produce a range of possible results [44].

3. Results and Discussion

3.1. Well-to-Tank (WTT) Assessment

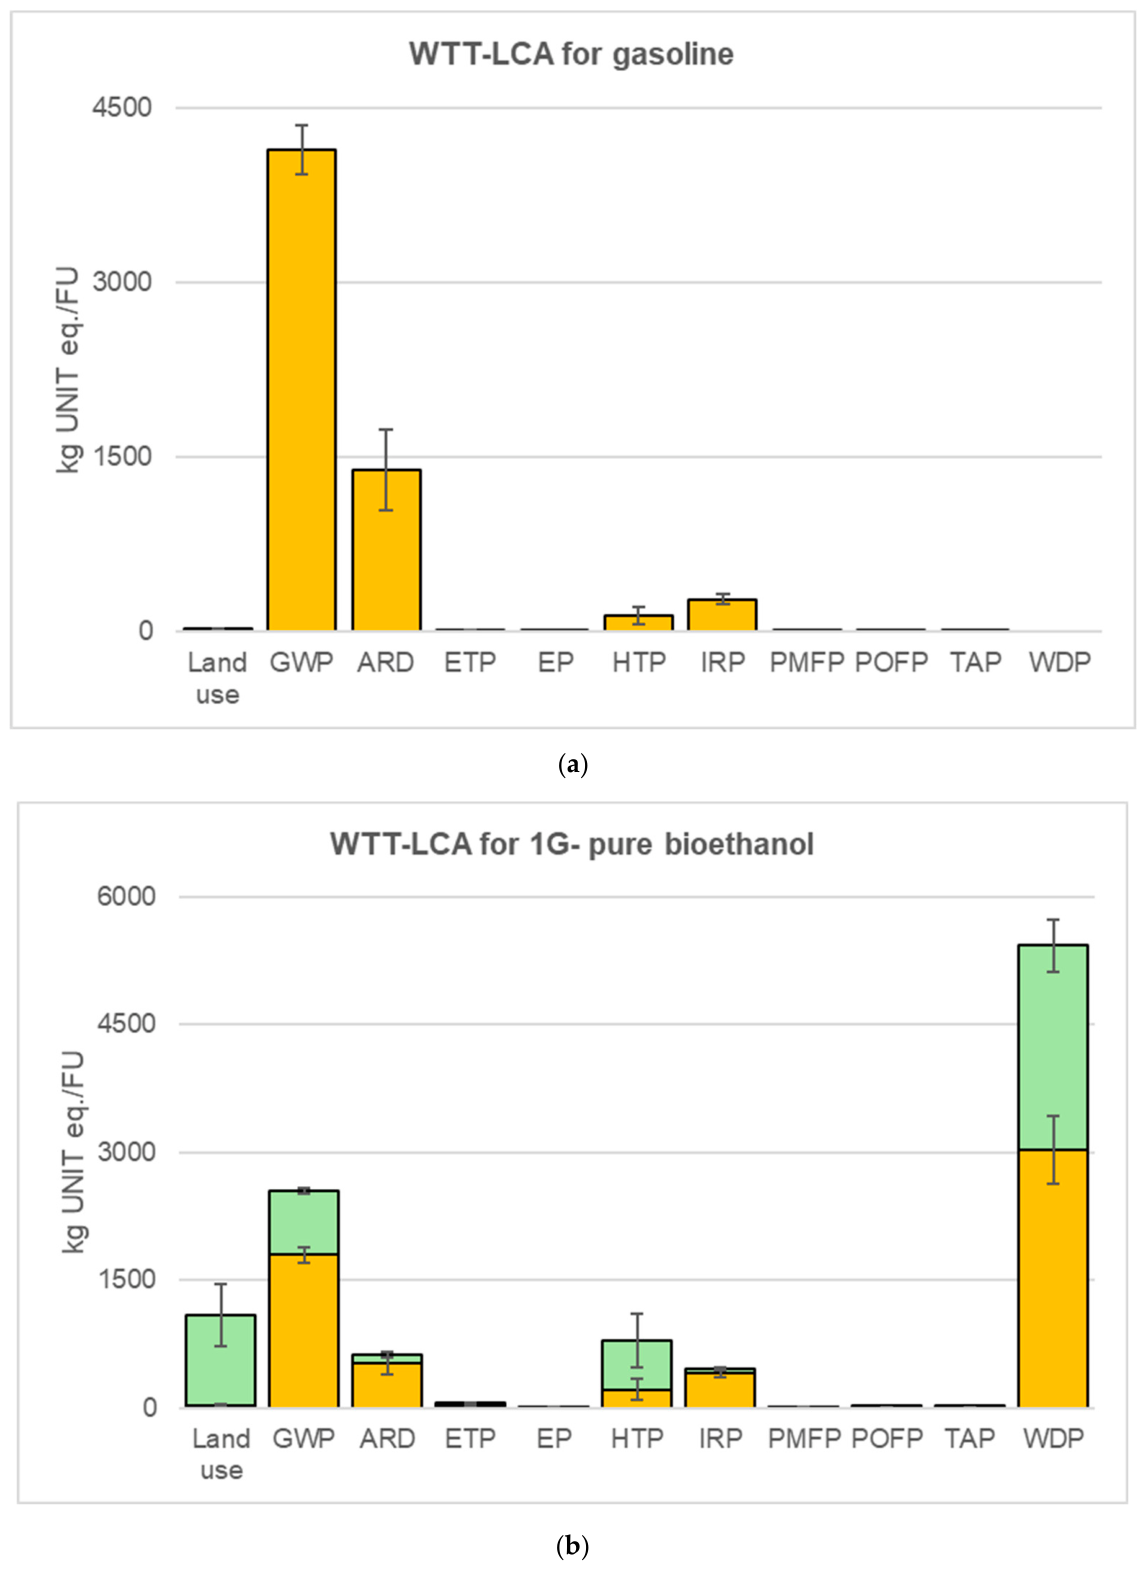
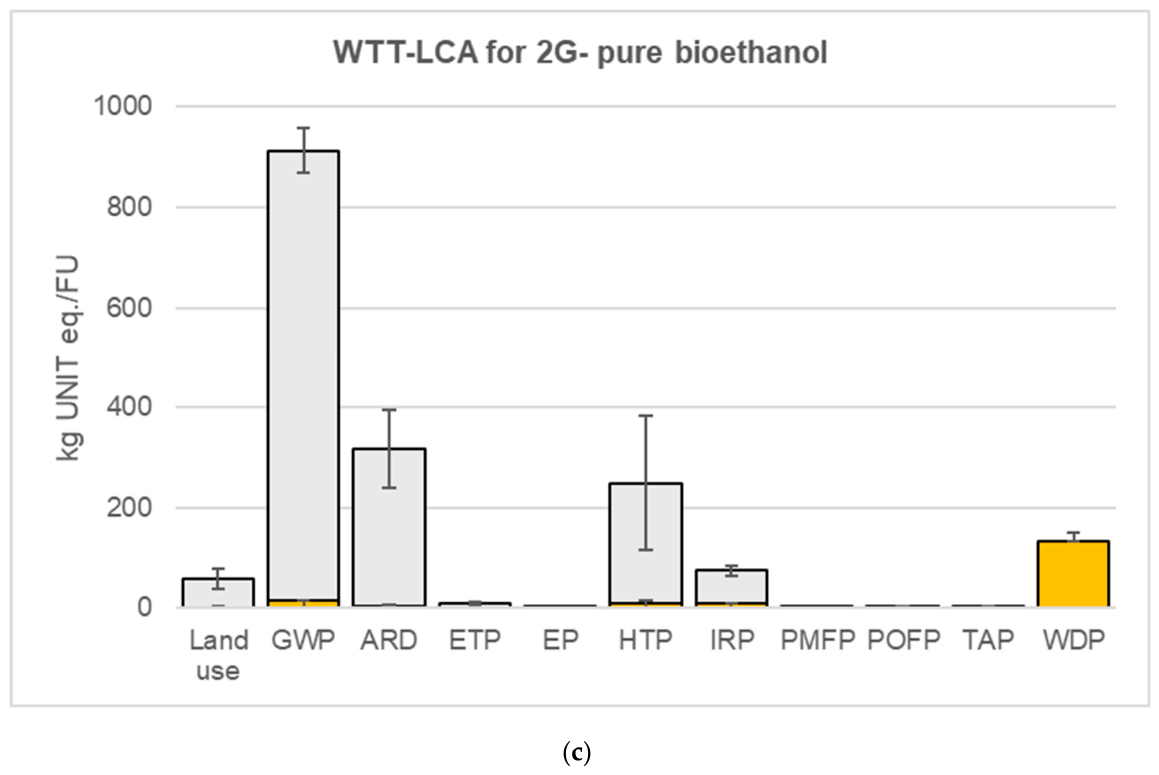
The environmental impact of biofuels is contingent upon various factors, including the raw materials utilized, the production processes employed, and the ultimate application of the biofuels. The environmental equilibrium associated with the introduction of biofuels is fundamentally determined by these elements. The biofuel supply chain adheres to the conventional framework of biomass production, biofuel processing, distribution, and consumption. An LCA has been conducted for fossil gasoline, E85-1G, and E85-2G. The environmental impacts associated with the WTT stage are illustrated in Figure 4, where the environmental profiles of the three fuels are compared across the various impact categories considered in this study. The results for the global warming potential (GWP) across the entire chain demonstrate the environmental advantages of bioethanol production (2549.5 and 912.9 tonCO2/FU for 1G- and 2G-pure bioethanol, respectively) over fossil gasoline production (4140.6 tonCO2/FU). The impacts of gasoline production have been calculated as aggregated elementary flows, meaning that individual process breakdowns are unavailable. As anticipated, the GWP and antibiotic resource depletion (ARD) were the highest for gasoline, which was attributable to the production process and oil depletion, respectively (Figure 4a). The environmental benefits of biobased fuels over gasoline are evident.
However, while the use of 1G-pure bioethanol instead of fossil gasoline yields environmental benefits, it also introduces impacts arising from agricultural operations, such as impacts on land use (Figure 4b). Several climatological factors, including soil type and weather conditions, significantly influence the environmental footprint of 1G-pure bioethanol, affecting the water depletion potential (WDP) and human toxicity potential (HTP). The WDP (5400 m3/FU) is attributed to both the fossil energy production necessary for ethanol processing and corn irrigation, whereas the HTP results from the extensive use of pesticides. ARD is significantly influenced by the process of inoculum preparation, which requires substantial quantities of ammonium phosphate as a nutrient input [45].
Superior environmental performance can be unequivocally attributed to 2G bioethanol, which has significantly lower impacts than gasoline and 1G-pure bioethanol, primarily due to substantial reductions in GWP. It is estimated that for every ton of 2G-pure bioethanol produced, approximately 915 tons of CO2 equivalent is emitted into the atmosphere (Figure 4c), with 95% of these emissions resulting from the transportation of grape pomace to the plant. Notably, the transportation phase represents the primary environmental hotspot, despite the transportation distances being less than 150 km for both lees and marc. Conversely, the production processes contribute minimally to impacts across all categories, except for WDP (132 m3/FU), which is attributed to the water used for waste washing and fermentation. The energy impact is negligible because the energy utilized is renewable and self-produced by the plant through anaerobic digestion of fermentation waste.
As illustrated in Figure 4c, the GWP of 2G bioethanol is calculated to be approximately one-third that of 1G-pure bioethanol. The relatively high carbon footprint of 1G-pure bioethanol is driven primarily by corn cultivation and the supplementary energy demand, which, in the LCA model, is assumed to be met through the incineration of natural gas [46]. Since 2G-pure bioethanol utilizes only waste from the winemaking process, no land use is allocated to grape pomace.
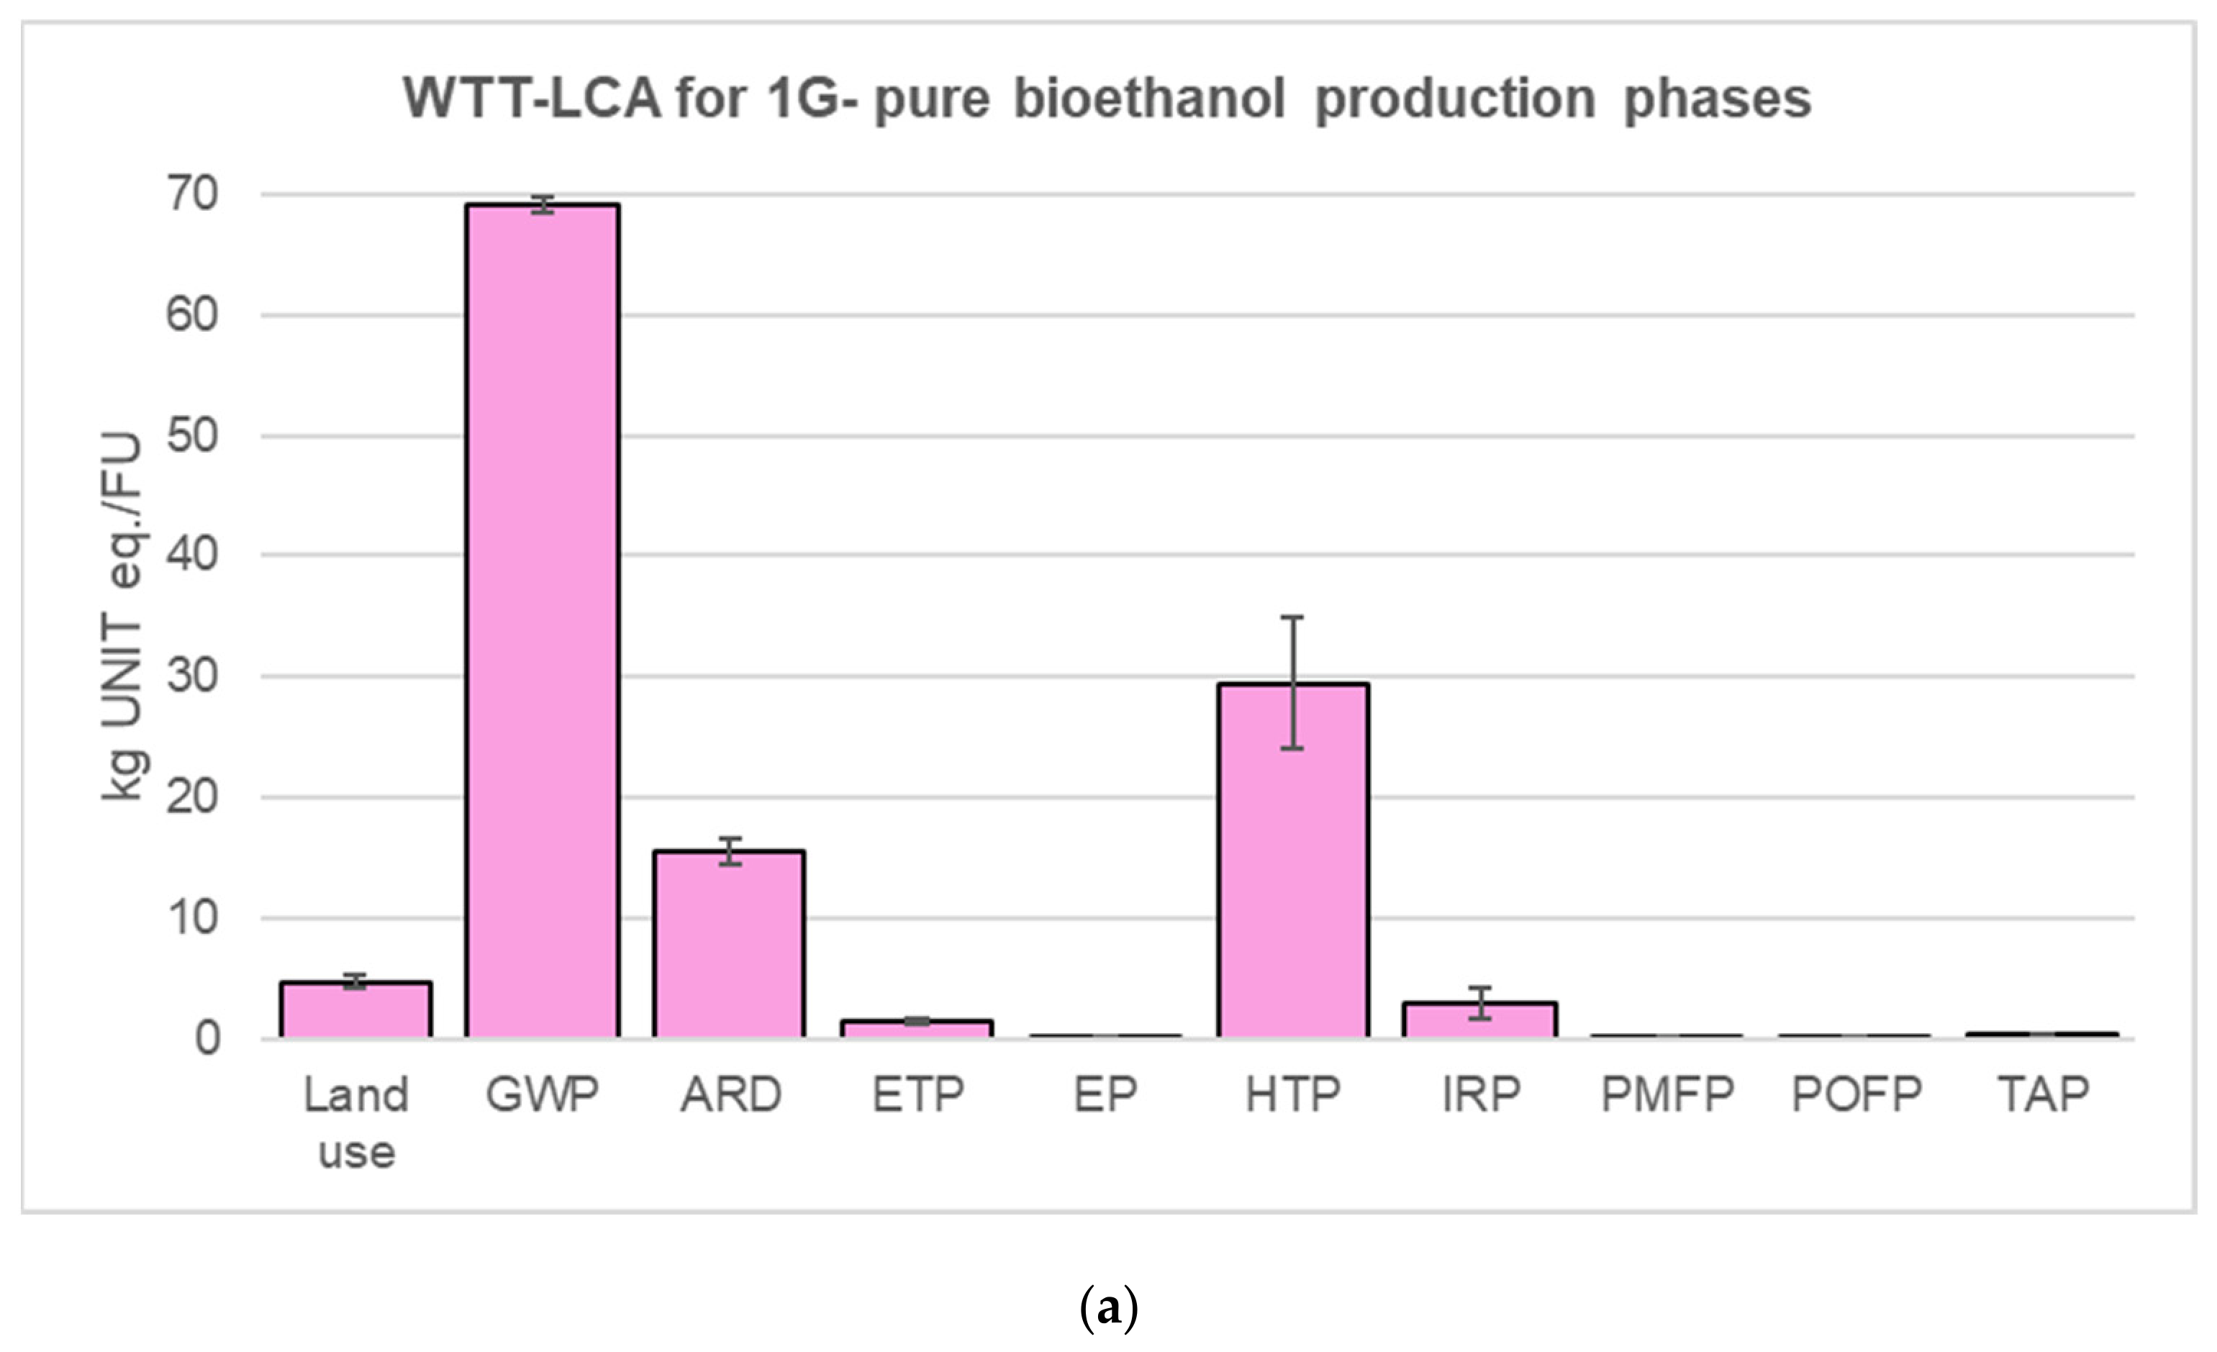
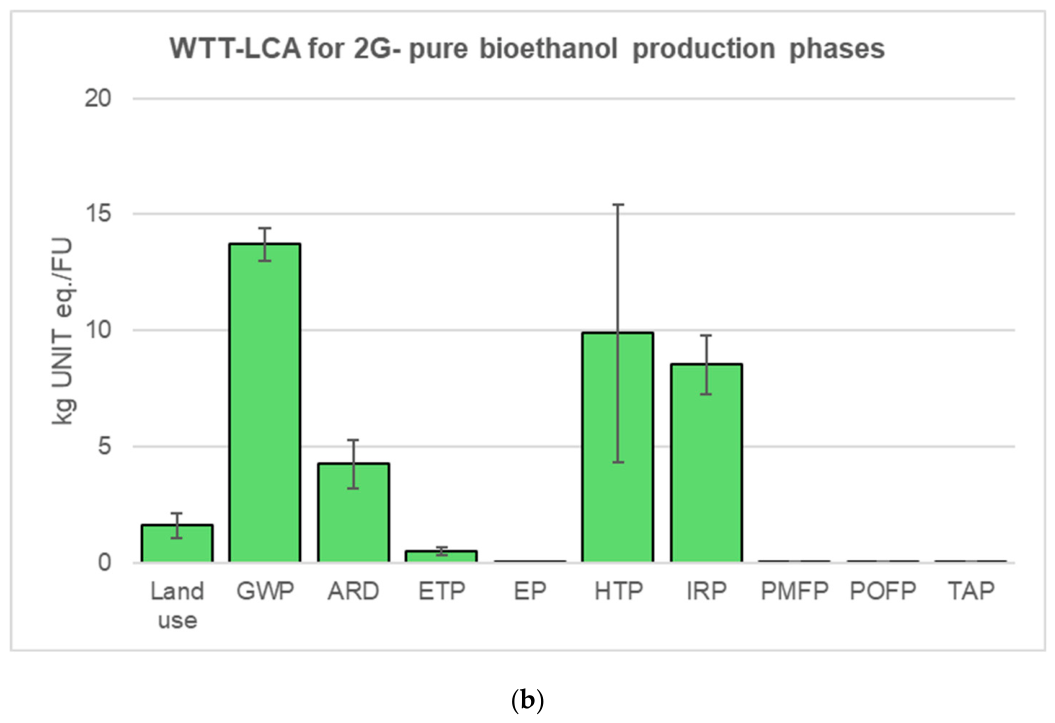
When the contribution of bioethanol production was isolated, excluding corn cultivation in one case and transportation in the other, 2G bioethanol was confirmed to be more sustainable across all categories (Figure 5). This advantage is likely due to the self-produced renewable energy supply for the overall process, which optimizes the environmental performance of the plant and facilitates an efficient circular economy system. However, the primary challenge remains the transportation of waste and the acceptable distance from the production site to the plant.
Agricultural residues used as feedstock for biorefineries do not compete directly with food production or indirectly through land competition. Nevertheless, the utilization of agricultural or agrifood residues presents inherent environmental challenges that need to be addressed. The low density and economic value of lignocellulose make feedstock transportation challenging in the planning of production networks. Unlike those for large fossil refineries, the disproportionately increasing feedstock transportation costs for large biorefineries may negate economies of scale, which is why biorefinery production networks tend to be more decentralized with smaller individual refineries [47].
The WTT results obtained in this study are consistent with previous literature showing that the environmental performance of bioethanol strongly depends on feedstock type and upstream process configuration. Recent reviews have highlighted that waste-based feedstocks generally exhibit the lowest environmental burdens, whereas crop-based pathways are more affected by land occupation, agrochemical use, and water demand [48,49]. The same reviews also confirmed that residues and by-products are generally more favorable than dedicated crops in terms of land-use impacts. Accordingly, the lower burdens observed here for 2G bioethanol from grape pomace, compared with 1G-pure bioethanol from corn, are in line with the broader trend reported for waste-derived pathways.
With specific reference to greenhouse gas emissions, the JEC [39] well-to-wheel study reports that ethanol pathways can provide GHG savings ranging from about 30% to about 90% relative to conventional gasoline, depending on feedstock and process route, while lignocellulosic pathways such as straw-based ethanol are among the lowest-carbon options [39]. Similarly, the USDA [50] corn–ethanol life cycle analysis reports that the current GHG profile of U.S. corn ethanol is, on average, 39% lower than gasoline, with further reductions possible as process efficiency improves. In this context, our finding that 1G-pure bioethanol performs better than gasoline but worse than 2G bioethanol is fully consistent with the literature.
At the same time, our results identify transportation of grape pomace as the main hotspot for 2G bioethanol, despite relatively short distances [39]. This aspect is also coherent with the broader bioethanol literature, which emphasizes that residue-based pathways can be environmentally advantageous, but that logistics and transport of low-density lignocellulosic feedstocks remain critical parameters influencing overall sustainability [51].

3.2. Tank-to-Wheel (TTW) Assessment

In the TTW stage (Formula SAE race), the analysis was conducted on a motorsport prototype that was specifically converted and calibrated for the comparison between gasoline and E85 operation. To comprehensively assess the potential impacts, the study considered not only fuel production but also the emissions produced during the combustion phase, as outlined in the research conducted by Delgado and Paz [52].
The use of ethanol in gasoline has become a worldwide tendency as an alternative strategy to reduce net CO2 emissions to the atmosphere, increase the gasoline octane rating, and mitigate dependence on fossil fuels. If the mechanical efficiency of the engine remains unaffected by the fuel change, the mechanical power generated by the engine increases with increasing ethanol content in the fuel. This is because ethanol, despite possessing a lower heating value per unit volume than gasoline does, has a higher-octane rating, permitting a higher compression ratio and potentially improving combustion efficiency. Consequently, when E85 is utilized instead of gasoline, the engine’s power output increases. These power changes result from the compensatory effect generated by the reduction in the air/fuel ratio (A/FE85 = 9.8 vs. A/FGasoline = 14.7), counteracting the negative effect of the lower energy content of ethanol (LHVE85 = 22.8 MJ/L vs. LHVGasoline = 32.08 MJ/L) (see Table 2) [53]. The engine required a reduced amount of air to combust the same mass of fuel, thereby necessitating an increased quantity of fuel injected into the combustion chamber per engine cycle, which subsequently increased the power output during each cycle. When operating with E85, the engine utilized fuel with a lower energy content than gasoline, leading to an 6–16% increase in fuel consumption over the 22 km distance (see Table 1). As indicated in Table 2, ethanol contains approximately 34.7% oxygen, which contributes to higher combustion efficiency.
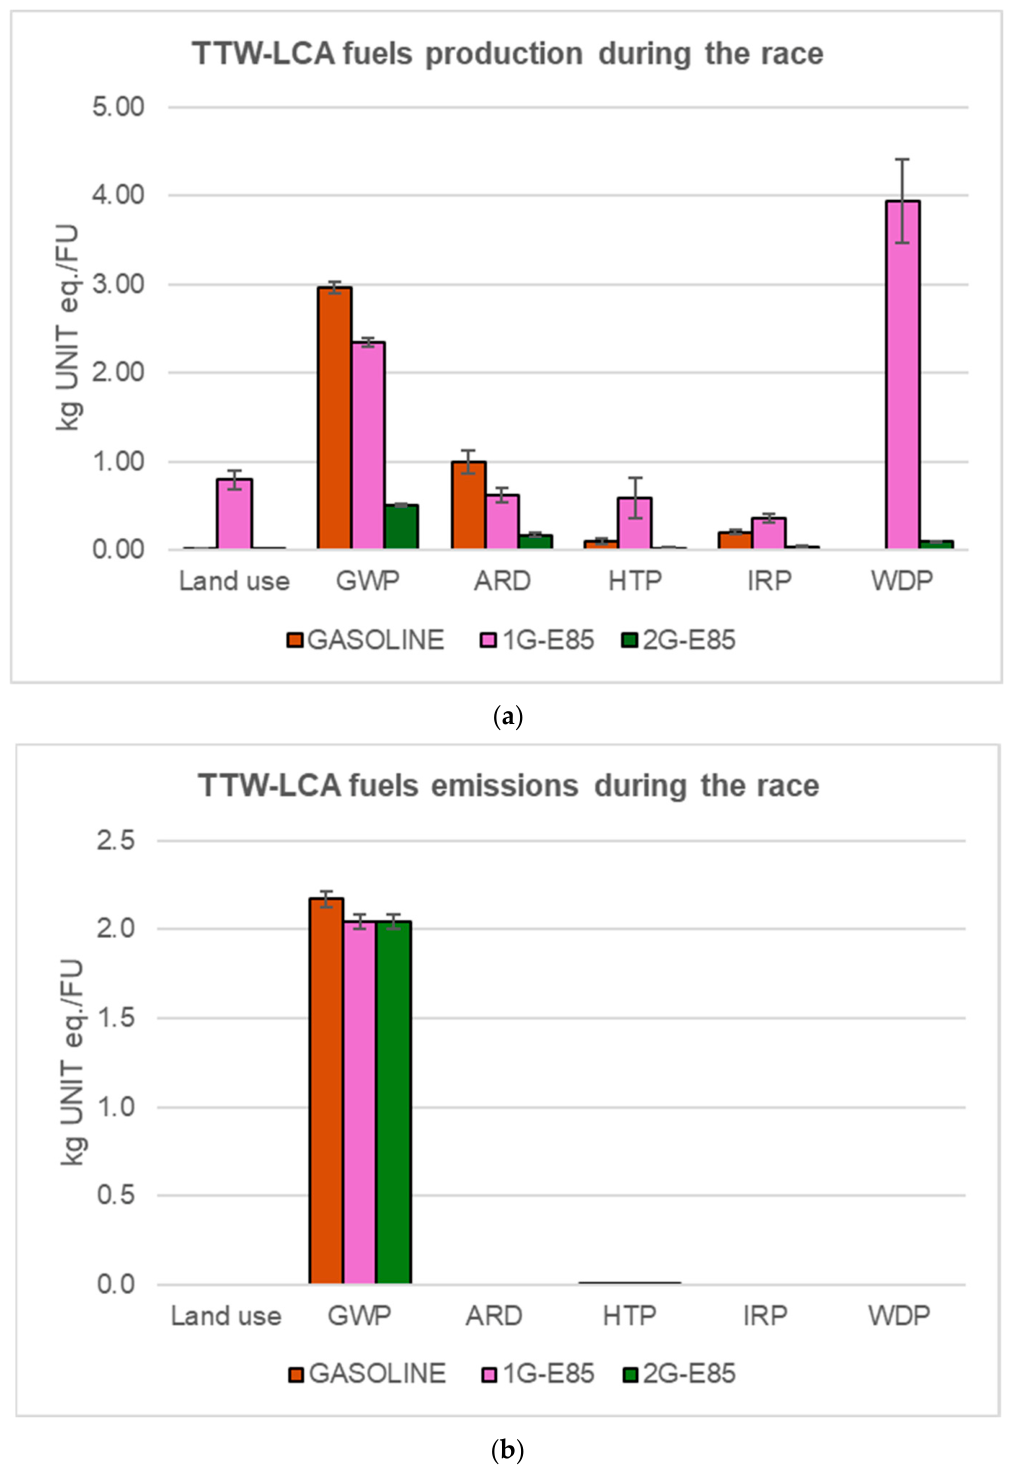
Owing to the increased oxygen content in ethanol/gasoline blends, a more complete and consistent combustion process, along with elevated combustion temperatures, can be achieved compared with the use of pure gasoline. Although gasoline was used in relatively small quantities during the race, it presented the highest GWP and ARD. In contrast, 1G-pure bioethanol was impacted by land use, HTP, and WDP due to the cultivation of raw materials (Figure 6a).
The most favorable environmental outcomes were achieved with 2G bioethanol, underscoring the significance of the production phase. Emissions to air of gaseous pollutants have been calculated based on the effective quantity of fuels used during the race, and as depicted in Figure 6b, during the race they primarily contributed to the GWP and, to a lesser extent, to the HTP. The GWP for E85 is 6% lower than that for gasoline, as a result of the TTW analysis. With the E85 fuel blend, emissions of NOx and volatile organic compounds (VOCs) were reduced, whereas emissions of carbon monoxide (CO) and unburned hydrocarbons increased [54].
In our LCA, the photochemical ozone formation potential (POFP) values for both gasoline and E85 were in the order of magnitude of 10−5; thus, they are not presented. Overall, our results indicate that the use of E85 leads to higher fuel consumption compared to vehicles fueled with fossil gasoline; however, it results in an overall lower contribution to emissions to air.
The TTW results are also broadly consistent with previous studies on ethanol–gasoline blends. The lower energy density of E85 generally leads to a reduction in volumetric fuel economy relative to gasoline; for example, the U.S. Alternative Fuels Data Center reports that E85 containing 83% ethanol has about 27% less energy per gallon than gasoline, while laboratory measurements on flexible-fuel vehicles reported fuel-economy penalties of about 25% for E80 relative to gasoline [55,56]. In our case, fuel consumption increased by 6–16% over the race distance, indicating the same general trend but with a smaller penalty, likely because the tested high-performance engine can partially exploit the favorable combustion characteristics and octane number of ethanol. Although E85 required 6–16% more fuel by volume, the corresponding total chemical energy input over the race was lower than that of gasoline. This suggests that, under the dedicated E85 calibration adopted in this study, the engine was able to partially compensate for the lower LHV of the fuel by exploiting ethanol’s higher knock resistance and charge-cooling effects.
Regarding exhaust emissions, the literature generally confirms that E85 can reduce some regulated pollutants, although the magnitude and even direction of change may depend on vehicle technology, engine calibration, and driving conditions. Zhai et al. [57] reported, on average, lower CO emissions (−22%) for E85 than for gasoline. Hubbard et al. [58] likewise observed that fuel economy declined as ethanol content increased. Therefore, the pattern observed here—higher fuel consumption but overall lower contribution to emissions to air for E85—fits within the range of outcomes already reported in the literature [59].
Table 5 summarizes the main findings of the present study in comparison with selected literature data on the environmental performance, fuel consumption, and emission trends of gasoline and bioethanol blends.
Overall, the comparison shows that the trends observed in the present study are consistent with the literature, particularly with regard to the lower environmental burden of waste-derived bioethanol and the trade-off between higher fuel consumption and improved emission performance for E85 blends. Although the present TTW analysis was based on total fuel consumption over the 22 km race, future studies should include more detailed telemetry and repeatability-related parameters to improve the interpretation of track-dependent variability.

4. Conclusions

Two technological scenarios to produce advanced ethanol from corn and lignocellulosic material, which serve as alternatives to fossil gasoline in a motor race, have been delineated. The reference scenario, gasoline, was modeled on background data, as was 1G-pure bioethanol, based on current ethanol production in the United States. In contrast, the 2G bioethanol product from grape pomace was constructed based on primary data provided by CAVIRO. As demonstrated in this study, the 2G bioethanol scenario has distinct advantages across all the analyzed environmental impact categories, particularly in terms of GWP, ARD, HTP, WDP, and land use. These impacts, conversely, impose significant burdens to varying degrees on both gasoline and 1G-pure bioethanol. Nevertheless, certain optimizations in the waste supply chain of the 2G-pure bioethanol system are warranted, particularly concerning the transportation of raw materials, which accounts for over 95% of all impacts. Such optimizations could lead to further enhancements in environmental performance. In the context of practical application during the race, 2G-pure bioethanol confirmed superior environmental performance compared with that of 1G-pure bioethanol, despite requiring 12% more fuel than gasoline.
Moreover, the air emissions from the E85 fuel blend were lower than those from gasoline alone. Despite being obtained on limited data referring to a single motor race, the findings of this study could help to inform strategic decision-making processes for future transport energy policy and contribute to identifying key areas for further technological research and development within the EU biofuel system. The well-to-wheel analysis of biofuels is a valuable tool, offering flexibility in system parameterization and facilitating the integrated evaluation of environmental impacts and overall performance. The use of LCA can significantly alter the approach planners take in making strategic and operational decisions by more effectively identifying improvement opportunities that may not have been previously apparent.
Overall, these findings support the development of more sustainable fuel strategies and contribute to the advancement of waste-based biofuels within future decarbonization pathways. Furthermore, the advancement of 2G-pure bioethanol production in the EU is anticipated to optimize the entire supply chain of bioethanol production, thereby enhancing its competitiveness in the EU fuel market. The novelty of this manuscript lies in the integrated experimental and well-to-wheel LCA comparison of first- and second-generation bioethanol under real racing conditions; future research should broaden the analysis to additional races, vehicle configurations, and waste-derived feedstocks to confirm the robustness and wider applicability of these findings.

Author Contributions

Conceptualization, supervision and writing—review and editing: A.A. and E.T.; methodology and formal analysis: D.S.; validation: S.R. and D.S.; data curation: V.M.; writing—original draft: E.T. and M.G.; writing—review and editing and supervision: E.T. and M.G. All authors have read and agreed to the published version of the manuscript.

Funding

This study was partially funded by Fondazione di Modena, “Unimore learning by doing 2023–2024 bioraffinerie e biocombustibili” Sime n. 2023.0362 and “Unimore learning by doing 2025 bioraffinerie, biocarburanti e sostenibilità” Sime n. 2025.0013.

Data Availability Statement

The datasets used and/or analyzed during the current study are available from the corresponding author on reasonable request. The data are not publicly available due to patent restrictions.

Conflicts of Interest

The authors declare no conflicts of interest.

References

  1. Winkler, L.; Pearce, D.; Nelson, J.; Babacan, O. The Effect of Sustainable Mobility Transition Policies on Cumulative Urban Transport Emissions and Energy Demand. Nat. Commun. 2023, 14, 2357. [Google Scholar] [CrossRef] [Scilit]
  2. Sileo, A.; Bonacina, M. Why the EU risks missing its 2050 carbon neutrality target by focusing only on new (electric) car sales. Econ. Policy Energy Environ. 2024, 2024, 97–114. [Google Scholar] [CrossRef] [Scilit]
  3. European Environment Agency (EEA). Sustainability of Europe’s Mobility Systems 2025. Available online: https://www.eea.europa.eu/en/analysis/publications/sustainability-of-europes-mobility-systems-2025?utm_source=chatgpt.com (accessed on 31 March 2026).
  4. Perez-Bravo, M.; Linares, P.; Rodriguez-Matas, A.F.; Romero, J.C. Modeling the Decarbonization of Transport: The Relevance of Disaggregating Transport Demand. Int. J. Sustain. Transp. 2025, 20, 496–512. [Google Scholar] [CrossRef] [Scilit]
  5. Yadav, V.G.; Yadav, G.D.; Patankar, S.C. The Production of Fuels and Chemicals in the New World: Critical Analysis of the Choice between Crude Oil and Biomass Vis-à-Vis Sustainability and the Environment. Clean Technol. Environ. Policy 2020, 22, 1757–1774. [Google Scholar] [CrossRef] [Scilit]
  6. Patidar, A.K.; Jain, P.; Dhasmana, P.; Choudhury, T. Impact of Global Events on Crude Oil Economy: A Comprehensive Review of the Geopolitics of Energy and Economic Polarization. GeoJournal 2024, 89, 50. [Google Scholar] [CrossRef] [Scilit]
  7. Bouter, A.; Hurtig, O.; Besseau, R.; Buffi, M.; Kulisic, B.; Scarlat, N. Updating the Greenhouse Gas Emissions of Liquid Biofuels from Annex V of the Renewable Energy Directive II (RED II): An Overview. Biomass Bioenergy 2025, 199, 107886. [Google Scholar] [CrossRef] [Scilit]
  8. Banerjee, N. Biomass to Energy—An Analysis of Current Technologies, Prospects, and Challenges. Bioenerg. Res. 2023, 16, 683–716. [Google Scholar] [CrossRef] [Scilit]
  9. Duarah, P.; Haldar, D.; Patel, A.K.; Dong, C.-D.; Singhania, R.R.; Purkait, M.K. A Review on Global Perspectives of Sustainable Development in Bioenergy Generation. Bioresour. Technol. 2022, 348, 126791. [Google Scholar] [CrossRef] [Scilit]
  10. Hoang, A.T.; Sirohi, R.; Pandey, A.; Nižetić, S.; Lam, S.S.; Chen, W.-H.; Luque, R.; Thomas, S.; Arıcı, M.; Pham, V.V. Biofuel Production from Microalgae: Challenges and Chances. Phytochem. Rev. 2023, 22, 1089–1126. [Google Scholar] [CrossRef] [Scilit]
  11. Krishna, K.V.; Bhavana, S.; Koujalagi, K.; Malaviya, A. Biofuels From Bio-Waste and Biomass. In Biomass and Bioenergy Solutions for Climate Change Mitigation and Sustainability; IGI Global Scientific Publishing: Hershey, PA, USA, 2023; pp. 75–118. ISBN 978-1-6684-5269-1. [Google Scholar]
  12. Shubhnam; Garg, D. Renewable Energy Policies and Their Impact on Biofuel Development. In Biowaste to Biofuel; CRC Press: Boca Raton, FL, USA, 2025. [Google Scholar]
  13. Liang, K. Second-Generation Biofuels: Utilization of Agricultural Waste and Non-Food Parts. J. Energy Biosci. 2024, 15, 277–288. [Google Scholar] [CrossRef] [Scilit]
  14. Karimi, M.; Simsek, H.; Kheiralipour, K. Advanced Biofuel Production: A Comprehensive Techno-Economic Review of Pathways and Costs. Energy Convers. Manag. X 2025, 25, 100863. [Google Scholar] [CrossRef] [Scilit]
  15. Wang, M.; Ye, X.; Bi, H.; Shen, Z. Microalgae Biofuels: Illuminating the Path to a Sustainable Future amidst Challenges and Opportunities. Biotechnol. Biofuels 2024, 17, 10. [Google Scholar] [CrossRef] [Scilit] [PubMed]
  16. Zhang, J.; Rentizelas, A.; Zhang, X.; Li, J. Sustainable Production of Lignocellulosic Bioethanol towards Zero Waste Biorefinery. Sustain. Energy Technol. Assess. 2022, 53, 102627. [Google Scholar] [CrossRef] [Scilit]
  17. Hassan, G.; Shabbir, M.A.; Ahmad, F.; Pasha, I.; Aslam, N.; Ahmad, T.; Rehman, A.; Manzoor, M.F.; Inam-Ur-Raheem, M.; Aadil, R.M. Cereal Processing Waste, an Environmental Impact and Value Addition Perspectives: A Comprehensive Treatise. Food Chem. 2021, 363, 130352. [Google Scholar] [CrossRef] [Scilit]
  18. Ahmad, A.; Naqvi, S.A.; Jaskani, M.J.; Waseem, M.; Ali, E.; Khan, I.A.; Faisal Manzoor, M.; Siddeeg, A.; Aadil, R.M. Efficient Utilization of Date Palm Waste for the Bioethanol Production through Saccharomyces Cerevisiae Strain. Food Sci. Nutr. 2021, 9, 2066–2074. [Google Scholar] [CrossRef] [Scilit]
  19. Pan, S.; Zabed, H.M.; Wei, Y.; Qi, X. Technoeconomic and Environmental Perspectives of Biofuel Production from Sugarcane Bagasse: Current Status, Challenges and Future Outlook. Ind. Crops Prod. 2022, 188, 115684. [Google Scholar] [CrossRef] [Scilit]
  20. Nazar, M.; Xu, Q.; Zahoor; Ullah, M.W.; Khan, N.A.; Iqbal, B.; Zhu, D. Integrated Laccase Delignification with Improved Lignocellulose Recalcitrance for Enhancing Enzymatic Saccharification of Ensiled Rice Straw. Ind. Crops Prod. 2023, 202, 116987. [Google Scholar] [CrossRef] [Scilit]
  21. Tse, T.J.; Wiens, D.J.; Reaney, M.J.T. Production of Bioethanol—A Review of Factors Affecting Ethanol Yield. Fermentation 2021, 7, 268. [Google Scholar] [CrossRef] [Scilit]
  22. Zhou, Z.; Liu, D.; Zhao, X. Conversion of Lignocellulose to Biofuels and Chemicals via Sugar Platform: An Updated Review on Chemistry and Mechanisms of Acid Hydrolysis of Lignocellulose. Renew. Sustain. Energy Rev. 2021, 146, 111169. [Google Scholar] [CrossRef] [Scilit]
  23. Wang, C.; He, G.; Meng, J.; Wang, S.; Kong, Y.; Jiang, J.; Hu, R.; Zhou, G. Improved Lignocellulose Saccharification of a Miscanthus Reddish Stem Mutant Induced by Heavy-Ion Irradiation. GCB Bioenergy 2020, 12, 1066–1077. [Google Scholar] [CrossRef] [Scilit]
  24. Liu, Y.; Ding, Y.; Li, Y.; Wang, X.; Sun, Y.; Chen, C. A Comprehensive Review of Recent Advances in Delignification Technology. J. Text. Inst. 2024, 115, 2489–2504. [Google Scholar] [CrossRef] [Scilit]
  25. Vaidya, A.A.; Murton, K.D.; Smith, D.A.; Dedual, G. A Review on Organosolv Pretreatment of Softwood with a Focus on Enzymatic Hydrolysis of Cellulose. Biomass Conv. Biorefin. 2022, 12, 5427–5442. [Google Scholar] [CrossRef] [Scilit]
  26. Zabed, H.M.; Akter, S.; Tian, Y.; Dar, M.A.; Yun, J.; Zhao, M.; Ragauskas, A.J.; Li, J.; Qi, X. Assessing Microbial Systems and Process Configurations for Improved Ethanol Production from Sugary Stovers by Integrating Soluble Sugars and Holocellulose. Ind. Crops Prod. 2024, 212, 118269. [Google Scholar] [CrossRef] [Scilit]
  27. Dvorak, Z.; Rehak, D.; David, A.; Cekerevac, Z. Qualitative Approach to Environmental Risk Assessment in Transport. Int. J. Environ. Res. Public Health 2020, 17, 5494. [Google Scholar] [CrossRef] [Scilit]
  28. Elgowainy, A.; Wang, M.; Reddi, K. Sustainable Vehicle Fuels, Well-to-Wheel Analysis. In Electric, Hybrid, and Fuel Cell Vehicles; Elgowainy, A., Ed.; Springer: New York, NY, USA, 2021; pp. 225–252. ISBN 978-1-0716-1492-1. [Google Scholar]
  29. Pieragostini, C.; Mussati, M.C.; Aguirre, P. On Process Optimization Considering LCA Methodology. J. Environ. Manag. 2012, 96, 43–54. [Google Scholar] [CrossRef] [Scilit]
  30. Baldelli, M.; Bartolucci, L.; Cordiner, S.; De Maina, E.; Mulone, V. Toward Carbon Neutral Fuels: Process Analysis of Integrated Biomass Conversion Routes for Sustainable Biofuels Production. Energy 2025, 324, 136077. [Google Scholar] [CrossRef] [Scilit]
  31. Lombardi, S.; Tribioli, L.; Guandalini, G.; Iora, P. Energy Performance and Well-to-Wheel Analysis of Different Powertrain Solutions for Freight Transportation. Int. J. Hydrogen Energy 2020, 45, 12535–12554. [Google Scholar] [CrossRef] [Scilit]
  32. Ilyas, T.; Chowdhary, P.; Chaurasia, D.; Gnansounou, E.; Pandey, A.; Chaturvedi, P. Sustainable Green Processing of Grape Pomace for the Production of Value-Added Products: An Overview. Environ. Technol. Innov. 2021, 23, 101592. [Google Scholar] [CrossRef] [Scilit]
  33. Chowdhary, P.; Gupta, A.; Gnansounou, E.; Pandey, A.; Chaturvedi, P. Current Trends and Possibilities for Exploitation of Grape Pomace as a Potential Source for Value Addition. Environ. Pollut. 2021, 278, 116796. [Google Scholar] [CrossRef] [Scilit]
  34. Alessa, R.; Almunefi, S.; Alnajdi, N. Comparative Life Cycle Assessment on Fuel Types for a Formula 1 Engine in Belgian Grand Prix. J. Eng. Res. 2024, 13, 1820–1825. [Google Scholar] [CrossRef] [Scilit]
  35. Abdelkader, G.; Elgazzar, K.; Khamis, A. Connected Vehicles: Technology Review, State of the Art, Challenges and Opportunities. Sensors 2021, 21, 7712. [Google Scholar] [CrossRef] [Scilit]
  36. Öztopcu, A. Environmental Sustainability in Sport: Formula 1’s SDGs Responsiveness. Environ. Dev. Sustain. 2024, 26, 31075–31097. [Google Scholar] [CrossRef] [Scilit]
  37. Delavarrafiee, M.; Frey, H.C. Real-World Fuel Use and Gaseous Emission Rates for Flex Fuel Vehicles Operated on E85 versus Gasoline. J. Air Waste Manag. Assoc. 2018, 68, 235–254. [Google Scholar] [CrossRef] [Scilit]
  38. Usman, M.R. Hydrogen Storage Methods: Review and Current Status. Renew. Sustain. Energy Rev. 2022, 167, 112743. [Google Scholar] [CrossRef] [Scilit]
  39. Prussi, M.; Yugo, M.; De Prada, L.; Padella, M.; Edwards, R. JEC Well-to-Wheels Report v5; EUR 30284 EN; JRC121213; Publications Office of the European Union: Luxembourg, 2020; ISBN 978-92-76-20109-0. [Google Scholar] [CrossRef]
  40. Wyman, C.E.; Hinman, N.D. Ethanol. Appl. Biochem. Biotechnol. 1990, 24, 735–753. [Google Scholar] [CrossRef] [Scilit]
  41. Kheiralla, A.F.; Tola, E.; Bakhit, J.M. Performance of Ethanol-Gasoline Blends of up to E35 as Alternative Automotive Fuels. Adv. Bioresearch 2017, 8, 130–140. [Google Scholar] [CrossRef]
  42. Edelen, A.; Ingwersen, W.W.; Rodríguez, C.; Alvarenga, R.A.F.; de Almeida, A.R.; Wernet, G. Critical Review of Elementary Flows in LCA Data. Int. J. Life Cycle Assess. 2018, 23, 1261–1273. [Google Scholar] [CrossRef] [Scilit]
  43. Reap, J.; Roman, F.; Duncan, S.; Bras, B. A Survey of Unresolved Problems in Life Cycle Assessment. Int. J. Life Cycle Assess. 2008, 13, 290–300. [Google Scholar] [CrossRef] [Scilit]
  44. Heijungs, R.; Lenzen, M. Error Propagation Methods for LCA—A Comparison. Int. J. Life Cycle Assess. 2014, 19, 1445–1461. [Google Scholar] [CrossRef] [Scilit]
  45. Maga, D.; Thonemann, N.; Hiebel, M.; Sebastião, D.; Lopes, T.F.; Fonseca, C.; Gírio, F. Comparative Life Cycle Assessment of First- and Second-Generation Ethanol from Sugarcane in Brazil. Int. J. Life Cycle Assess. 2019, 24, 266–280. [Google Scholar] [CrossRef] [Scilit]
  46. Ayodele, B.V.; Alsaffar, M.A.; Mustapa, S.I. An Overview of Integration Opportunities for Sustainable Bioethanol Production from First- and Second-Generation Sugar-Based Feedstocks. J. Clean. Prod. 2020, 245, 118857. [Google Scholar] [CrossRef] [Scilit]
  47. Wietschel, L.; Messmann, L.; Thorenz, A.; Tuma, A. Environmental Benefits of Large-Scale Second-Generation Bioethanol Production in the EU: An Integrated Supply Chain Network Optimization and Life Cycle Assessment Approach. J. Ind. Ecol. 2021, 25, 677–692. [Google Scholar] [CrossRef] [Scilit]
  48. Soleymani Angili, T.; Grzesik, K.; Rödl, A.; Kaltschmitt, M. Life Cycle Assessment of Bioethanol Production: A Review of Feedstock, Technology and Methodology. Energies 2021, 14, 2939. [Google Scholar] [CrossRef] [Scilit]
  49. Shakelly, N.; Pérez-Cardona, J.R.; Deng, S.; Maani, T.; Li, Z.; Sutherland, J.W. Comparative Life Cycle Assessment of Bioethanol Production from Different Generations of Biomass and Waste Feedstocks. Procedia CIRP 2023, 116, 630–635. [Google Scholar] [CrossRef] [Scilit]
  50. Cai, H.; Dunn, J.B.; Wang, Z.; Han, J.; Wang, M.Q. Life-Cycle Energy Use and Greenhouse Gas Emissions of Production of Bioethanol from Sorghum in the United States. Biotechnol. Biofuels 2013, 6, 141. [Google Scholar] [CrossRef] [Scilit]
  51. Contributions of Life Cycle Assessment on Cellulosic Ethanol Production from Harvest Residues: Environmental Impacts and Public Policies in Brazil. In Production of Top 12 Biochemicals Selected by USDOE from Renewable Resources; Elsevier: Amsterdam, The Netherlands, 2022; pp. 81–108.
  52. Delgado, R.; Paz, S. Effect of Different Ethanol-Gasoline Blends on Exhaust Emissions and Fuel Consumption; SAE International: Warrendale, PA, USA, 2012. [Google Scholar]
  53. Iodice, P.; Cardone, M. Ethanol/Gasoline Blends as Alternative Fuel in Last Generation Spark-Ignition Engines: A Review on CO and HC Engine Out Emissions. Energies 2021, 14, 4034. [Google Scholar] [CrossRef] [Scilit]
  54. Tutak, W. Bioethanol E85 as a Fuel for Dual Fuel Diesel Engine. Energy Convers. Manag. 2014, 86, 39–48. [Google Scholar] [CrossRef] [Scilit]
  55. Alternative Fuels Data Center: Ethanol Benefits and Considerations. Available online: https://afdc.energy.gov/fuels/ethanol-benefits (accessed on 31 March 2026).
  56. Gerbrandt, K.; Chu, P.L.; Simmonds, A.; Mullins, K.A.; MacLean, H.L.; Griffin, W.M.; Saville, B.A. Life Cycle Assessment of Lignocellulosic Ethanol: A Review of Key Factors and Methods Affecting Calculated GHG Emissions and Energy Use. Curr. Opin. Biotechnol. 2016, 38, 63–70. [Google Scholar] [CrossRef] [Scilit]
  57. Zhai, H.; Frey, H.C.; Rouphail, N.M.; Gonçalves, G.A.; Farias, T.L. Comparison of Flexible Fuel Vehicle and Life-Cycle Fuel Consumption and Emissions of Selected Pollutants and Greenhouse Gases for Ethanol 85 Versus Gasoline. J. Air Waste Manag. Assoc. 2009, 59, 912–924. [Google Scholar] [CrossRef] [Scilit]
  58. Hubbard, C.P.; Anderson, J.E.; Wallington, T.J. Ethanol and Air Quality: Influence of Fuel Ethanol Content on Emissions and Fuel Economy of Flexible Fuel Vehicles. Environ. Sci. Technol. 2014, 48, 861–867. [Google Scholar] [CrossRef] [Scilit]
  59. Yuan, W.; Frey, H.C.; Wei, T.; Rastogi, N.; VanderGriend, S.; Miller, D.; Mattison, L. Comparison of Real-World Vehicle Fuel Use and Tailpipe Emissions for Gasoline-Ethanol Fuel Blends. Fuel 2019, 249, 352–364. [Google Scholar] [CrossRef] [Scilit]
  60. Frey, H.C.; Unal, A.; Rouphail, N.M.; Colyar, J.D. On-Road Measurement of Vehicle Tailpipe Emissions Using a Portable Instrument. J. Air Waste Manag. Assoc. 2003, 53, 992–1002. [Google Scholar] [CrossRef] [Scilit]
Figure 1. The hybrid M24-LH prototype designed by MMR and used as a case study.
Energies 19 02155 g001
Figure 2. System boundaries of the industrial process for producing ethanol from maize, including milling, distillation, and recovery of co-products. Processes are shown in red boxes, input materials in black boxes, and products in green boxes. Secondary data from EcoinventTM; 3.7 and AgribalyseTM database.
Energies 19 02155 g002
Figure 3. System boundaries of the process set up at CAVIRO for the production of 2G-bioethanol from grape pomace (marc and lees). Process steps are shown in black boxes and production of co-products in red boxes.
Energies 19 02155 g003
Figure 4. Environmental impacts of the well-to-tank LCA (a) for gasoline; (b) for 1G-pure bioethanol, with cultivation of corn (green bars) and production process (yellow bars); and (c) 2G-pure bioethanol, with transportation of grape pomace from production site to plant (gray bars) and production process (yellow bars). Results are expressed as Mean ± Std.Dev. based on Monte Carlo simulation. The y-axis units are presented in a generic format as they vary across the impact categories shown on the x-axis. For the specific units corresponding to each category, please refer to Table 4.
Energies 19 02155 g004aEnergies 19 02155 g004b
Figure 5. Environmental impacts of the well-to-tank LCA for (a) 1G-pure bioethanol and (b) 2G-pure bioethanol including only the production phases (hydrolysis, fermentation, distillation and anhydrification). Results are expressed as Mean ± Std.Dev. based on Monte Carlo simulation. The y-axis units are presented in a generic format as they vary across the impact categories shown on the x-axis. For the specific units corresponding to each category, please refer to Table 4.
Energies 19 02155 g005aEnergies 19 02155 g005b
Figure 6. Environmental impacts of the tank-to-wheel LCA during the 22 km race of the MMR vehicle fueled with gasoline (orange bars), E85-1G (pink bars) and E85-2G (green bars), including fuel production (a) and fuel emissions (b). Results are expressed as Mean ± Std.Dev. based on Monte Carlo simulation. The y-axis units are presented in a generic format as they vary across the impact categories shown on the x-axis. For the specific units corresponding to each category, please refer to Table 4.
Energies 19 02155 g006
Table 1. Fuel consumption in the three motorsport races, expressed as L/22 km.
RaceFuel Consumption (L/22 km)
GasolineE85-1GE85-2G
Croatia4.395.015.01
Italy4.704.994.99
Austria4.104.764.76
Table 2. Chemical–physical characteristics of the different fuels (gasoline, ethanol, and E85), showing the equivalent molecular formula; molecular weight; percentage by weight of carbon, hydrogen and oxygen; density; and lower heating value (LHV) [37].
FuelEquivalent Molecular FormulaEquivalent Molecular Weight (g/gmolC)Weight Percent of Carbon (%)Weight Percent of Hydrogen (%)Weight Percent of Oxygen (%)Density
(20 °C)
(kg/m3)
LHV
(MJ/L)
Ref.
GasolineCH1.87513.8786.513.5074032.2[38,39]
Pure ethanolCH3O0.523.0052.213.034.878021.1[40]
E85CH2.758O0.39221.0357.013.229.878222.8[41]
Table 3. Life cycle inventory of 2G bioethanol production from grape pomace at the CAVIRO plant. Fermentation parameters are not included because the industrial process is patented.
Production StageInput *Output *
Raw material supplyMarcLeesMarcLees
Amount: >70,000 tons
Distance: 137 km
Water: approximately
1 m3/ton
Storage: pile
Electricity: approximately 0.008 KWh/ton
Steam: approximately 0.05 tons/ton
Amount: >20,000 tons
Distance: 120 km
Water: approximately
1 m3/ton
Storage: iron tanks
Fermentate to distillation: 75,000–85,000 tons
Exhausted marc: 65,000–70,000 tons
Fermentate to distillation: 60,000–65,000 tons
Exhausted lees: 45,000–50,000 tons
DistillationElectricity: approximately 4 KWh/ton
Steam: approximately 0.1 tons/ton
Electricity: approximately 6 KWh/ton
Steam: approximately 0.2 tons/ton
Bioethanol > 92%: 1500–1800 tons
Marc vinasse: 80,000–85,000 tons
Bioethanol > 92%: 700–800 tons
Lees vinasse: 60,000–65,000 tons
AnhydrificationElectricity: approximately 35 KWh/tonBioethanol 99.9%: 2200–2600 tons
* some input and output values are reported as intervals because the industrial process is patented.
Table 4. The impact categories with the corresponding abbreviations calculated in this study and their general description.
Impact CategoryUnitGeneral Description
Global warming potential (GWP100)kg CO2 eqaccounts for the potential global warming due to emissions of greenhouse gases to air at a horizon of 100 years. Similar to carbon footprint indicator
Terrestrial Acidification Potential (TAP)kg SO2 eqaccounts for the potential acidification of soils and water due to the release in air of nitrogen and sulphur oxides that are precursors of acidic rain
Eutrophication Potential (EP)kg PO4 eqaccounts for the enrichment of the aquatic ecosystem with nutritional elements, due to the emission of nitrogen- or phosphorous-containing compounds, especially fertilizers
Photochemical Ozone Formation Potential (POFP)kg NMVOC eqaccounts for the emissions to air of particulate that potentially creates photochemical ozone in the lower atmosphere (smog) catalyzed by sunlight.
Ionizing Radiation Potential (IRP)kg U235eq/FUaccounts for the potential health hazards from radioactive releases, including decay products
Particulate Matter Formation Potential (PMFP)kg PM10eq/FUaccounts for the impact on human health due to fine particulates, which are major contributors to respiratory diseases and mortality
Abiotic Resource Depletion Potential (ARDP)kg Sb eqaccounts for the consumption of non-living, natural resources (minerals, metals, and fossil fuels) relative to their scarcity.
Human Toxicity Potential (HTP)kg 1,4-DCB eqaccounts for the potential effects of toxic substances on human health
Eco-Toxicity Potential (ETP)kg 1,4-DCB eqaccounts for the potential effects of toxic substances on ecosystems
Water Depletion Potential (WD)m3accounts for the amount of water required to dilute toxic elements emitted into water or soil; similar to water footprint indicator
Land Use Potential (LUP)m2 * a/FUaccounts for the land extension that is potentially subtracted to food production and thereby human health; similar to ecological footprint indicator of land use
Table 5. Comparison between the main findings of the present study and selected literature data on the WTT and TTW environmental performance, fuel consumption, and emission trends of gasoline and bioethanol blends.
AspectPresent StudyComparison with LiteratureReference
WTT GWP performanceGasoline showed the highest GWP; 1G-pure bioethanol was lower; 2G bioethanol was the lowestEthanol pathways generally provide ~30–90% GHG savings vs. gasoline depending on feedstock and route; lignocellulosic pathways are among the lowest-carbon options[39]
1G-pure vs. 2G-pure bioethanol1G-pure was penalized by corn cultivation; 2G performed better across categoriesReviews consistently report lower impacts for waste/residue-based ethanol than for crop-based ethanol[48]
Land/water/agrochemical burdens1G-pure bioethanol showed higher burdens for land use, WDP, and HTPThe literature reports that crop-based pathways are more affected by land use, water use, fertilizers, and pesticides, while waste materials are more favorable[48]
Transport hotspot in 2GPomace transport was the main hotspot for 2G-pure bioethanolThe literature notes that transport/logistics of low-density lignocellulosic residues can significantly affect environmental performance[56]
Fuel consumption with E85+6–16% fuel consumption vs. gasoline over 22 kmE85 generally reduces fuel economy because of lower energy density energy/gal, up to +25% fuel consumption for E80 vs. gasoline[28,55]
Emissions with E85Overall lower GWP contributionE85 often lowers GWP; however, emission trends vary across vehicle types and test conditions[57,58,60]
Disclaimer/Publisher’s Note: The statements, opinions and data contained in all publications are solely those of the individual author(s) and contributor(s) and not of MDPI and/or the editor(s). MDPI and/or the editor(s) disclaim responsibility for any injury to people or property resulting from any ideas, methods, instructions or products referred to in the content.