Article

Mechanism Analysis and Detection of Battery Nail Penetration Based on Dynamic Electrochemical Impedance Spectroscopy

1
China North Vehicle Research Institute, Beijing 100072, China
2
School of Automotive Engineering, Harbin Institute of Technology, Weihai 264209, China
*
Authors to whom correspondence should be addressed.
These authors contributed equally to this work.
Energies 2026, 19(9), 2152; https://doi.org/10.3390/en19092152
Submission received: 19 March 2026 / Revised: 11 April 2026 / Accepted: 23 April 2026 / Published: 29 April 2026

Abstract

To investigate the battery impedance variation after the occurrence of nail penetration, this paper adopts Dynamic Electrochemical Impedance Spectroscopy (DEIS) for real-time monitoring of the impedance changes of lithium-ion batteries during the nail penetration process. A piecewise multi-frequency superimposed sinusoidal excitation is designed, which not only complies with the stability principle of battery testing but also ensures the signal-to-noise ratio of the excitation signal. By injecting the designed excitation signal into the operating battery and combining it with the rapid DEIS generation technology, the acquisition of DEIS data within the target frequency band in a short time is realized. Based on the obtained DEIS data, a fractional-order model is established and fitted for analysis before and after nail penetration. The results show that the steel nail introduces inductive reactance and impedance to the battery. Due to the parallel connection between the steel nail and the internal resistance of the battery, the overall impedance decreases, exhibiting a short-circuit state, and both the real and imaginary parts of the impedance experience an abrupt change at the moment of nail penetration. Considering the characteristic of abrupt impedance change of the battery after nail penetration, a battery nail penetration detection method based on DEIS is proposed. Considering the abrupt change characteristics of battery impedance after nail penetration, this paper proposes a battery nail penetration detection method based on DEIS. This method can effectively solve the problem of low sensitivity of traditional voltage monitoring methods in detecting nail penetration during battery operation. It has higher sensitivity and faster response speed compared with traditional methods, enabling online monitoring of battery states. Additionally, this paper also explores its potential application in real-world vehicles.

1. Introduction

In recent years, the rapid development of electric vehicles, large-scale energy storage systems, and advanced portable electronic devices has led to a continuous expansion in both the installed capacity and application scenarios of high-performance lithium-ion batteries, which serve as key energy carriers. However, safety concerns associated with battery systems operating under complex conditions have become increasingly prominent. Incidents of fires and explosions caused by thermal runaway have been frequently reported, posing a significant challenge to the sustainable development of the industry [1,2,3,4]. Fundamentally, batteries in real-world applications are often exposed to multiple abnormal operating conditions, primarily including electrical abuse (e.g., overcharging, overdischarging, and high-rate charge–discharge cycles) [5,6], mechanical abuse (e.g., impact, compression, and nail penetration) [7,8], and thermal abuse (e.g., high-temperature environments) [9] (p. 563). These abusive conditions compromise the structural stability within the battery, triggering a cascade of irreversible failure processes such as internal short circuits and intensified side reactions. As a result, the rate of internal heat generation rises sharply, and the continuous accumulation of heat drives the battery into an irreversible thermal runaway state, ultimately leading to combustion or even explosion. Among them, severe thermal runaway is usually caused by mechanical abuse and thermal abuse [10] (p. 247). As a typical and extreme mechanical damage simulation method, nail penetration can cause the battery separator to tear and the electrodes to come into direct contact in an instant in the form of physical penetration, forming a continuous low-resistance short-circuit path, which can release high-density current in a very short time and cause a sharp local temperature rise [1]. This short-circuit process triggered directly by mechanical damage develops rapidly and is difficult to stop, making it very easy to cause local thermal runaway and quickly spread to the entire battery system, significantly increasing the risk of fire and explosion. Therefore, in-depth exploration of the multi-physical field coupling failure mechanism inside the battery under nail penetration conditions is of urgent practical significance for improving the safety design and accident prevention and control capabilities of lithium-ion batteries.
In recent years, numerous studies have investigated the effects of nail penetration on batteries through experiments and modeling. Ahmed Abaza et al. conducted nail penetration tests using nails made of three different materials, combined nail penetration experiments with external short-circuit tests to estimate the short-circuit resistance, and constructed the battery current curves for nail penetration experiments [11] (p. 213–216). Antonio García et al. proposed a method for correcting thermographic images, which was used to investigate the effects of nail penetration position, battery state of charge (SOC) and temperature on the thermal runaway behavior of NMC 811 batteries during nail penetration tests [12]. Ashish V. Shelke et al. performed radial and axial nail penetration tests on 21,700 batteries at 100% SOC, and compared the maximum thermal runaway temperature caused by the two types of tests and the time taken to reach this temperature [13]. Mengqi Ye et al. derived a semi-analytical solution at three different nail penetration positions based on the Green’s function, and established a three-dimensional battery model via COMSOL to simulate the characteristics of battery temperature distribution changes at different nail penetration positions [14]. Gang Zhou et al. built a coupled excitation thermal runaway experimental platform, and carried out experimental studies on the thermal runaway and flame ejection dynamics of 18,650 batteries under the coupled excitation of nail penetration and overcharge from both macroscopic and microscopic perspectives [15] (pp. 133–143). Lei Zhang et al. used a reaction propagation model and a fire propagation model to study the effect of nail penetration depth on the thermal runaway propagation speed of 18,650 batteries [16]. Hyojeong Kim et al. investigated the thermal runaway tolerance of lithium batteries by conducting nail penetration tests with different penetration depths [17]. Kuan-Cheng Chiu et al. proposed an electrochemical model that can accurately simulate battery nail penetration tests, through which the initiation time of battery thermal runaway after nail penetration and the battery temperature curve during the test can be obtained [18] (pp. 256–261). Yimao Ren et al. established a multi-layer electro-thermal coupling model consisting of five battery cells, which was used to reveal the layer-by-layer short-circuit process of batteries triggered by nail penetration [19].
These studies have systematically elucidated the evolution mechanism of battery behavior after nail penetration by comprehensively applying experimental tests and numerical simulations. Based on the changes in electrical and thermal signals, researchers have further proposed detection methods for battery nail penetration behavior.
For instance, Jiabo Zhang et al. measured multi-dimensional signals such as battery voltage and recoil force during nail penetration at different SOCs, conducted a quantitative evaluation of the thermal runaway and combustion characteristics of batteries caused by nail penetration, and proposed a radar chart-based risk assessment method based on the above analysis [20]. Chunjing Lin et al. [21] investigated the changes in battery voltage, temperature and expansion force caused by thermal runaway experiments such as nail penetration, and used the acquired data for thermal runaway detection. The results showed that the expansion force signal is more accurate and the detection is more timely compared with voltage and temperature signals [21]. Takumi Yamanaka et al. established a “triple combination model” for online lithium battery nail penetration tests, which considered the application of steel nails and thermal decomposition reactions, and defined the “combustion volume” to evaluate the risk of combustion after battery nail penetration [22] (pp. 133–138).
Nail penetration detection not only plays a key role in safety monitoring during the practical application of batteries, but also has important significance in the research and development as well as production stages. Considering the practical vehicle application, existing nail penetration detection methods mainly rely on the detection of battery electrical signals (voltage, current and impedance) and temperature signals, yet the changes in terminal voltage and temperature exists the problem of insufficient sensitivity. The voltage change caused by nail penetration is usually extremely slight in the initial stage. Especially when the battery is in certain specific working states or the nail penetration degree is mild, such tiny voltage fluctuations are often difficult to distinguish from normal fluctuations, which may lead to detection errors. In addition, the change in battery voltage is susceptible to interference from various factors such as self-discharge, temperature fluctuations and load changes, making it more difficult to accurately capture the voltage anomalies caused by nail penetration.
To address the problems of insufficient sensitivity and poor anti-interference ability of signals such as voltage and current in existing battery nail penetration detection technologies, this paper explores the effectiveness of impedance signals in the application of nail penetration detection. Conventional electrochemical impedance spectroscopy (EIS) requires sufficient time to reach equilibrium at a specific state of charge (SOC). However, some electrochemical reactions are completed within just a few seconds, making EIS incapable of accurately capturing these rapid changes. DEIS effectively addresses this limitation [23].
Dynamic electrochemical impedance spectroscopy (DEIS), as an innovative technique, enables the measurement of EIS data during the dynamic operation of electrochemical systems. Its principle involves superimposing an excitation current signal onto the charging or discharging current, allowing for in-depth analysis of the battery’s impedance characteristics without interfering with the charging or discharging process [24]. The use of DEIS helps researchers monitor certain electrochemical processes with higher precision. For example, Xinghao Du et al. [25] proposed a real-time detection framework for lithium plating in lithium-ion batteries based on DEIS. By leveraging the DEIS detection mechanism, they tracked the evolution of charge transfer resistance in real time during battery charging, thereby achieving precise monitoring of the electrochemical processes at the electrode/electrolyte interface. K. Darowicki et al. [26] utilized differential methods to analyze DEIS, linking changes in impedance response to variations in system parameters. This approach is highly valuable for characterizing various fundamental components that govern the behavior of electrochemical systems.
Nail penetration occurs within just a few seconds, and dynamic electrochemical impedance spectroscopy (DEIS) meets the requirement of rapid measurement for such transient events. Therefore, DEIS is employed to detect the impedance after nail penetration [23]. Based on the above analysis, this paper proposes a battery nail penetration detection method based on the changes in the real and imaginary parts of impedance in the medium and high frequency regions of DEIS. By injecting a designed piecewise multi-frequency superimposed excitation signal into the operating battery and combining it with rapid DEIS generation technology, the acquisition of DEIS data within the target frequency band in a short time is realized. During battery operation, by continuously collecting excitation response signals and monitoring the dynamic changes in the real and imaginary parts of DEIS impedance in the medium and high frequency regions in real time, thus quickly capturing the abnormal signals caused by changes in internal structure and electrochemical reactions when nail penetration occurs in the battery. Meanwhile, a fractional-order model of the battery before and after nail penetration is established to verify the effects on the battery after the steel nail fully penetrates it. Based on the aforementioned work, this paper further discusses the feasibility of implementing the DEIS-based nail penetration detection method in real vehicles.

2. Materials and Methods

2.1. Materials

The experimental subjects of this study are two types of lithium-ion batteries, and their specific parameters are shown in Table 1 and Table 2 below.
The steel nail adopted in this study strictly complies with the specifications for lithium-ion battery nail penetration tests specified in Chinese national standard GB/T 38031 [27] Safety Requirements for Traction Batteries for Electric Vehicles. A steel nail with excellent electrical conductivity, a diameter of 3 mm, and sufficient length to penetrate the battery is utilized for the penetration experiments.
The steel nail features high hardness, superior electrical conductivity, and robust structural strength. Its metallic nature can effectively pierce the battery separator and electrode structures, accurately simulating real faults such as the intrusion of metallic foreign objects and battery pack punctures by metal components caused by vehicle collisions. Meanwhile, the conductive property of the steel nail enables the formation of a stable short-circuit path, which is highly consistent with the characteristics of metal conductors that trigger battery thermal runaway under actual operating conditions. This ensures that the experimental results can truthfully reflect the response characteristics of the battery under practical safety risks.

2.2. Experiment

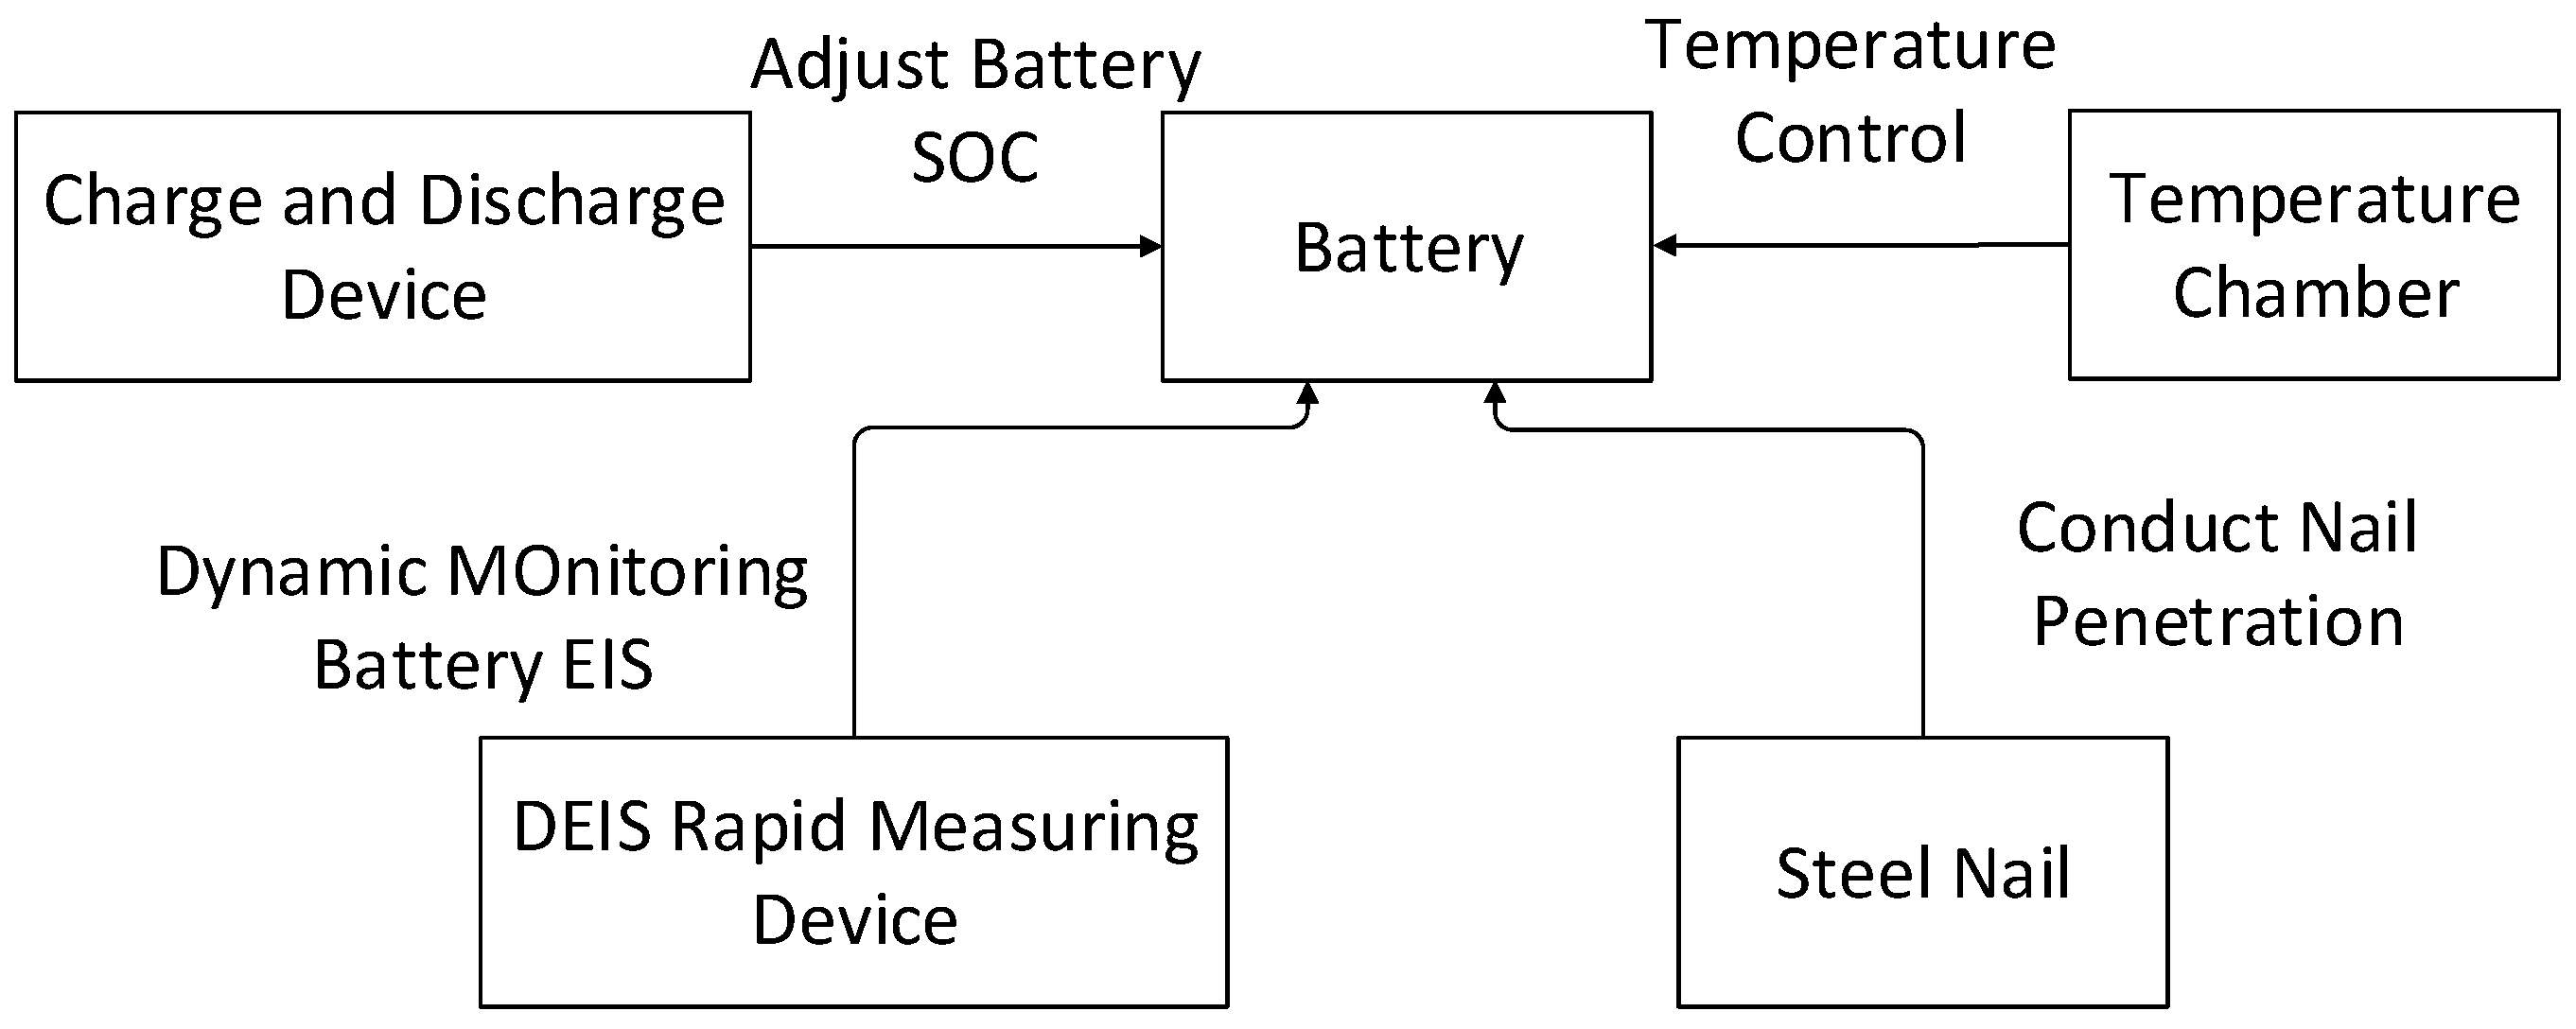
The schematic diagram of the experimental platform is illustrated in Figure 1. It mainly consists of a charge–discharge system, a thermostatic chamber, a nail penetration testing machine, and a DEIS rapid measurement device. Firstly, the charge–discharge system is employed to regulate the charging and discharging process of the tested battery, adjusting its State of Charge (SOC) to meet the requirements specified in GB/T 38031 for nail penetration tests. Meanwhile, to eliminate the influence of temperature on the measurement results of Electrochemical Impedance Spectroscopy, the battery is placed in the thermostatic chamber with the ambient temperature maintained at a constant 25 °C.
After eliminating the interference from the two key variables, namely SOC and temperature, the nail penetration testing machine is utilized to conduct the nail penetration operation on the battery. Simultaneously, the DEIS rapid measurement device is activated to dynamically collect the EIS data of the battery during the penetration process. In the experiments, the steel needle penetrates the target battery at a constant rate of 25 mm/s in the direction perpendicular to the central electrode sheet, ensuring complete penetration through the internal structure of the battery and the formation of a stable internal short-circuit path.
The entire experimental process lasted 450 s and was divided into two key phases. The first phase began at the start of the experiment, during which the Dynamic Electrochemical Impedance Spectroscopy (DEIS) testing system was activated to continuously collect dynamic impedance spectrum data of the battery in the state prior to nail penetration. This served as the initial baseline state and lasted for 150 s. The second phase commenced at the 150 s mark, during which the nail penetration action was executed while the DEIS testing continued uninterrupted. The steel nail was fully inserted into the battery, and thereafter, the dynamic response of the battery under the penetrated state was continuously monitored and recorded. The DEIS system was used to continuously collect dynamic electrochemical impedance spectrum data of the battery over the subsequent 300 s, enabling real-time tracking of the electrochemical state changes and impedance evolution within the battery induced by the short circuit until the conclusion of the experiment.
Considering that EIS measurement is susceptible to temperature and SOC, in addition to employing a thermostatic environment and timely charge–discharge control, each single impedance test in this experiment takes only 0.5 s. Within such a short testing period, no significant heat accumulation or concentration polarization occurs in the battery’s electrochemical system, and both temperature and SOC can be regarded as approximately constant. This further minimizes the interference from dynamic variations of these two factors on impedance results from the perspective of time scale.
By combining rapid sampling, thermostatic control, and electrochemical equilibrium preconditioning, the influences of temperature and SOC on impedance measurement have been successfully isolated, ensuring the reliability of the experimental data.
This experimental design effectively combines mechanical penetration with in situ electrochemical detection, simulating an internal short-circuit fault in the battery under controlled conditions. Through continuous monitoring of the dynamic impedance spectrum, it provides experimental data support for analyzing the impedance of the battery under short-circuit conditions.

2.3. Design of DEIS Rapid Measurement System

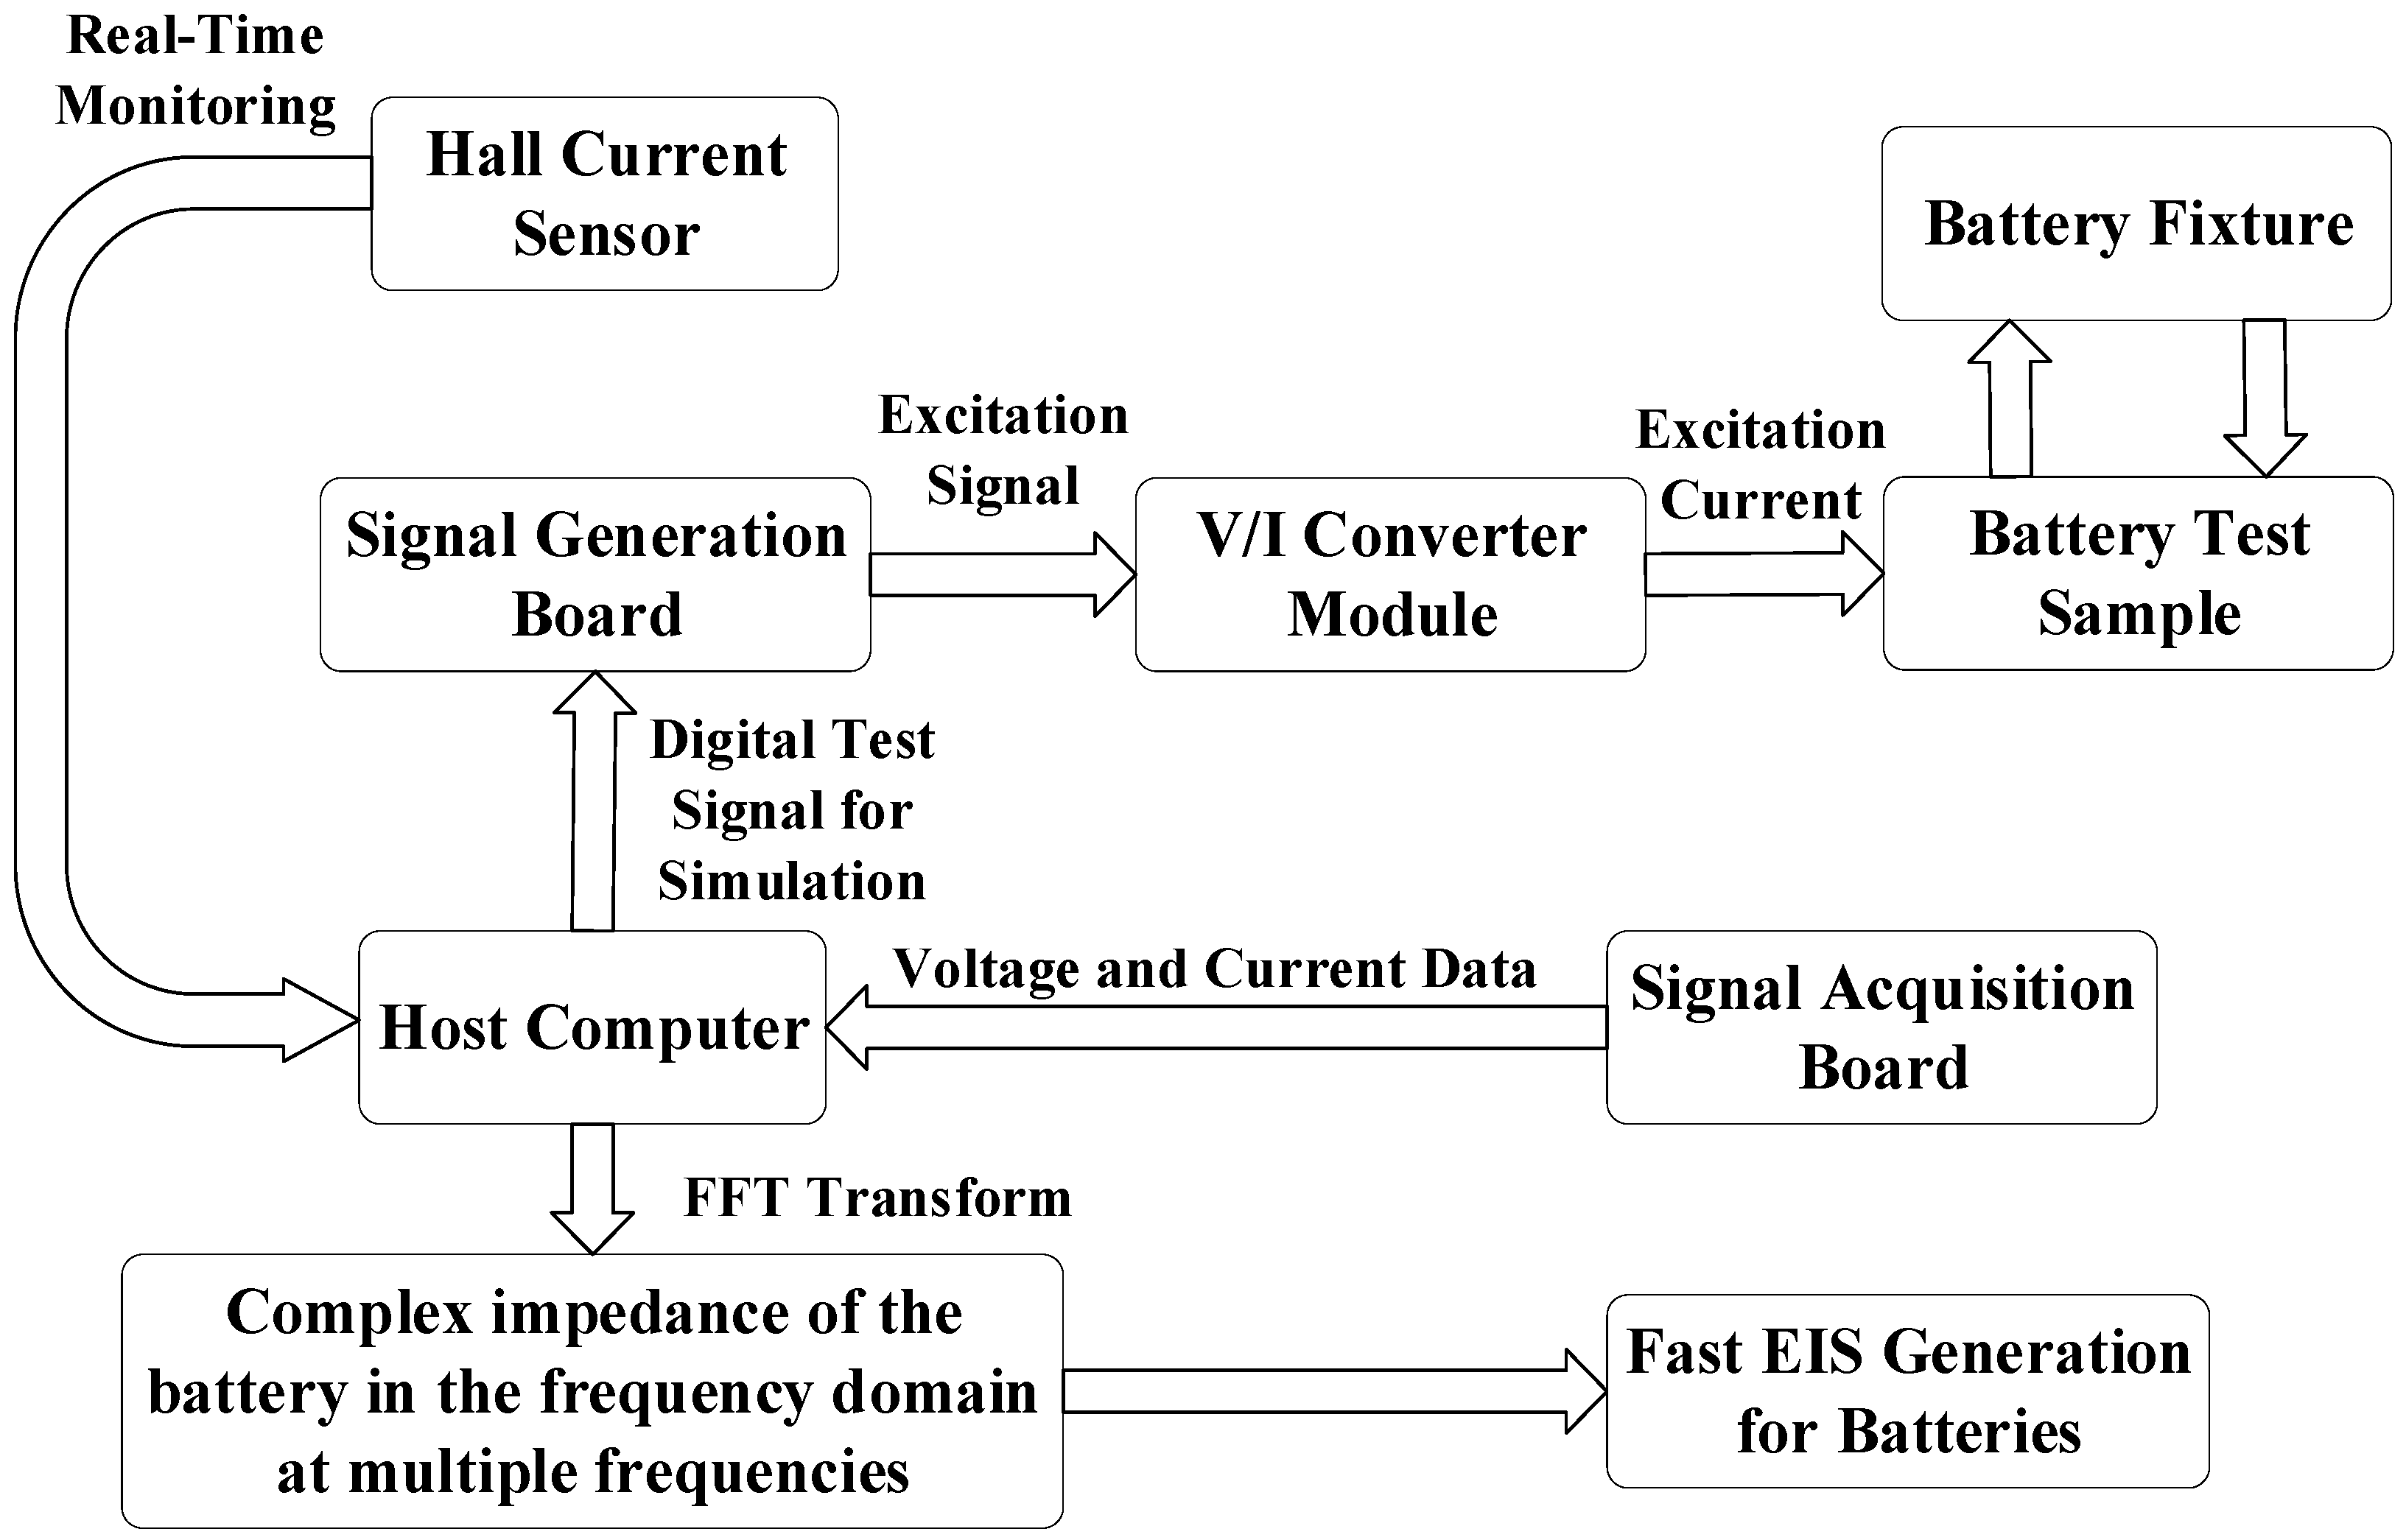
The DEIS rapid measurement system consists of four components: digital excitation synthesis, analog signal injection and response, high-precision synchronous data acquisition, and frequency-domain transformation with impedance calculation. By injecting excitation signals and processing the collected current and voltage signals, the system rapidly acquires the DEIS of the battery. Its working flow is illustrated in Figure 2 below.
In the system’s digital excitation signal synthesis and transmission module, the host computer employs a segmented multi-frequency sinusoidal superposition algorithm to generate a digital sequence defining the instantaneous amplitude at each time point within a 0.5 s time window. This sequence is accurately transmitted to the signal generation board via a communication bus. Subsequently, the signal generation board uses its internal digital-to-analog converter to reconstruct the received digital sequence point by point into a continuous-time voltage waveform. This voltage waveform is then input into a V/I conversion module, which, leveraging its voltage-controlled current source characteristics, linearly and precisely converts it into a proportional current signal. This controlled current excitation is ultimately injected stably into the battery under test through a battery fixture, strictly adhering to the current excitation paradigm of electrochemical impedance spectroscopy (EIS) measurements.
Simultaneously with the injection of the excitation current, the system’s synchronous monitoring and data acquisition unit is activated. A Hall current sensor, connected in series within the loop, monitors the actual waveform of the excitation current in real time in a non-contact manner and converts it into a voltage signal. At the same time, the signal acquisition board directly measures the response voltage across the battery terminals using high-precision differential input channels. All analog-to-digital conversion channels are driven by the same clock, ensuring strictly synchronized sampling of the current and voltage signals. The acquired high-capacity time-domain data is then packaged and transmitted back to the host computer.
Upon receiving the synchronized time-domain data streams i(n) and v(n), the host computer proceeds to the data processing stage. By performing fast Fourier transforms on both sets of data, the complex frequency spectra of the current I(f) and voltage V(f) are obtained. Following Ohm’s law in the frequency domain, the complex impedance Z(f) = V(f)/I(f) is calculated point by point for each frequency. Finally, a frequency-domain impedance spectrum is plotted. The entire process forms a closed loop encompassing excitation synthesis, signal injection, synchronous acquisition, and spectral analysis. This enables the rapid and automatic generation of a dynamic electrochemical impedance spectrum for battery consistency sorting, balancing measurement accuracy, execution efficiency, and operational reliability.

2.4. Design of DEIS Excitation Signal

The specific parameter design of the DEIS rapid measurement system in this paper is described as follows. Given that the entire nail penetration process lasts 3 s, it is required to accomplish as many DEIS tests as possible within this duration. To acquire sufficient frequency-point data while ensuring the accuracy of fault diagnosis, the time window should be neither excessively short nor overly long. If the window is too short, too few impedance points are obtained, leading to reduced measurement accuracy and consequently lower diagnostic accuracy for nail penetration. If the window is too long, while the frequency resolution improves, transient features may be smoothed out, fault detection time would be delayed, and the real-time performance of diagnosis would be compromised. Therefore, the excitation signal in the digital excitation synthesis module is designed to have a duration of 0.5 s.
Different frequency ranges in the impedance spectrum correspond to different electrochemical processes [28,29]: the low-frequency part below 1 Hz mainly corresponds to the diffusion process of the battery; the frequency range from 1 Hz to 100 Hz corresponds to the electric double-layer formation and charge transfer process of the battery; the frequency range from 3 Hz to 2000 Hz corresponds to the SEI film change process of the battery; and the inductive effect is related to the test harness and is more pronounced in the high-frequency part (typically above 1000 Hz).
Within such a short period of 0.5 s, nail penetration exerts no significant influence on the diffusion process of the battery, but imposes a considerable impact on the ohmic impedance, inductive effect, SEI film, electric double layer, and charge transfer process. To obtain the battery DEIS over a wide frequency range as much as possible, a multi-frequency superimposed sinusoidal signal covering the frequency range of 50–1000 Hz is designed for rapid DEIS generation according to the correlation between electrochemical processes and their corresponding frequency domains [25], so as to observe the impedance variations of the battery before and after nail penetration. This frequency range precisely covers the inductive effect, ohmic impedance variation, SEI film changes, electric double-layer variation, and charge transfer process of the battery, and is therefore able to effectively reflect the changes induced by nail penetration.
Meanwhile, within the brief testing period of 0.5 s, no obvious heat accumulation or concentration polarization occurs in the electrochemical system of the battery. Accordingly, temperature and SOC can be approximately regarded as constant, which minimizes the interference caused by their dynamic variations on impedance measurements from the perspective of time scale.
The digital sequences of the specific frequency components of the excitation signal are presented in Table 3.
After the frequency sequences are input into the signal generation board, sinusoidal signals at multiple frequencies are superimposed to form a multi-frequency superimposed sinusoidal signal. To achieve accurate measurement of the impedance at each frequency point in the battery’s DEIS, the amplitude of each sinusoidal signal must be sufficiently large to meet the signal-to-noise ratio (SNR) requirement for signal measurement. However, a concomitant problem is that the direct superposition of these sinusoidal signals often leads to an excessively high amplitude of the resultant multi-frequency superimposed sinusoidal signal, which would violate the stability principle for battery EIS measurement. Thus, a piecewise multi-frequency superimposed sinusoidal signal generation method is adopted in this study to construct the multi-frequency superimposed sinusoidal signal covering the desired frequency band. This method not only complies with the stability principle for battery EIS measurement but also ensures the SNR of the excitation signal, and the signal construction is expressed as Equation (1).
u t = i = 1 L 1 a i sin 2 π f i t + φ i + i = 1 L 2 a i sin 2 π f i t + φ i
where u t represents the piecewise multi-frequency superimposed sinusoidal signal. L 1 represents the number of frequency components contained in the first segment of the signal. L 2 represents the number of frequency components contained in the second segment of the signal. f i and φ i represent the amplitude and phase corresponding to the sinusoidal signal with frequency f i .
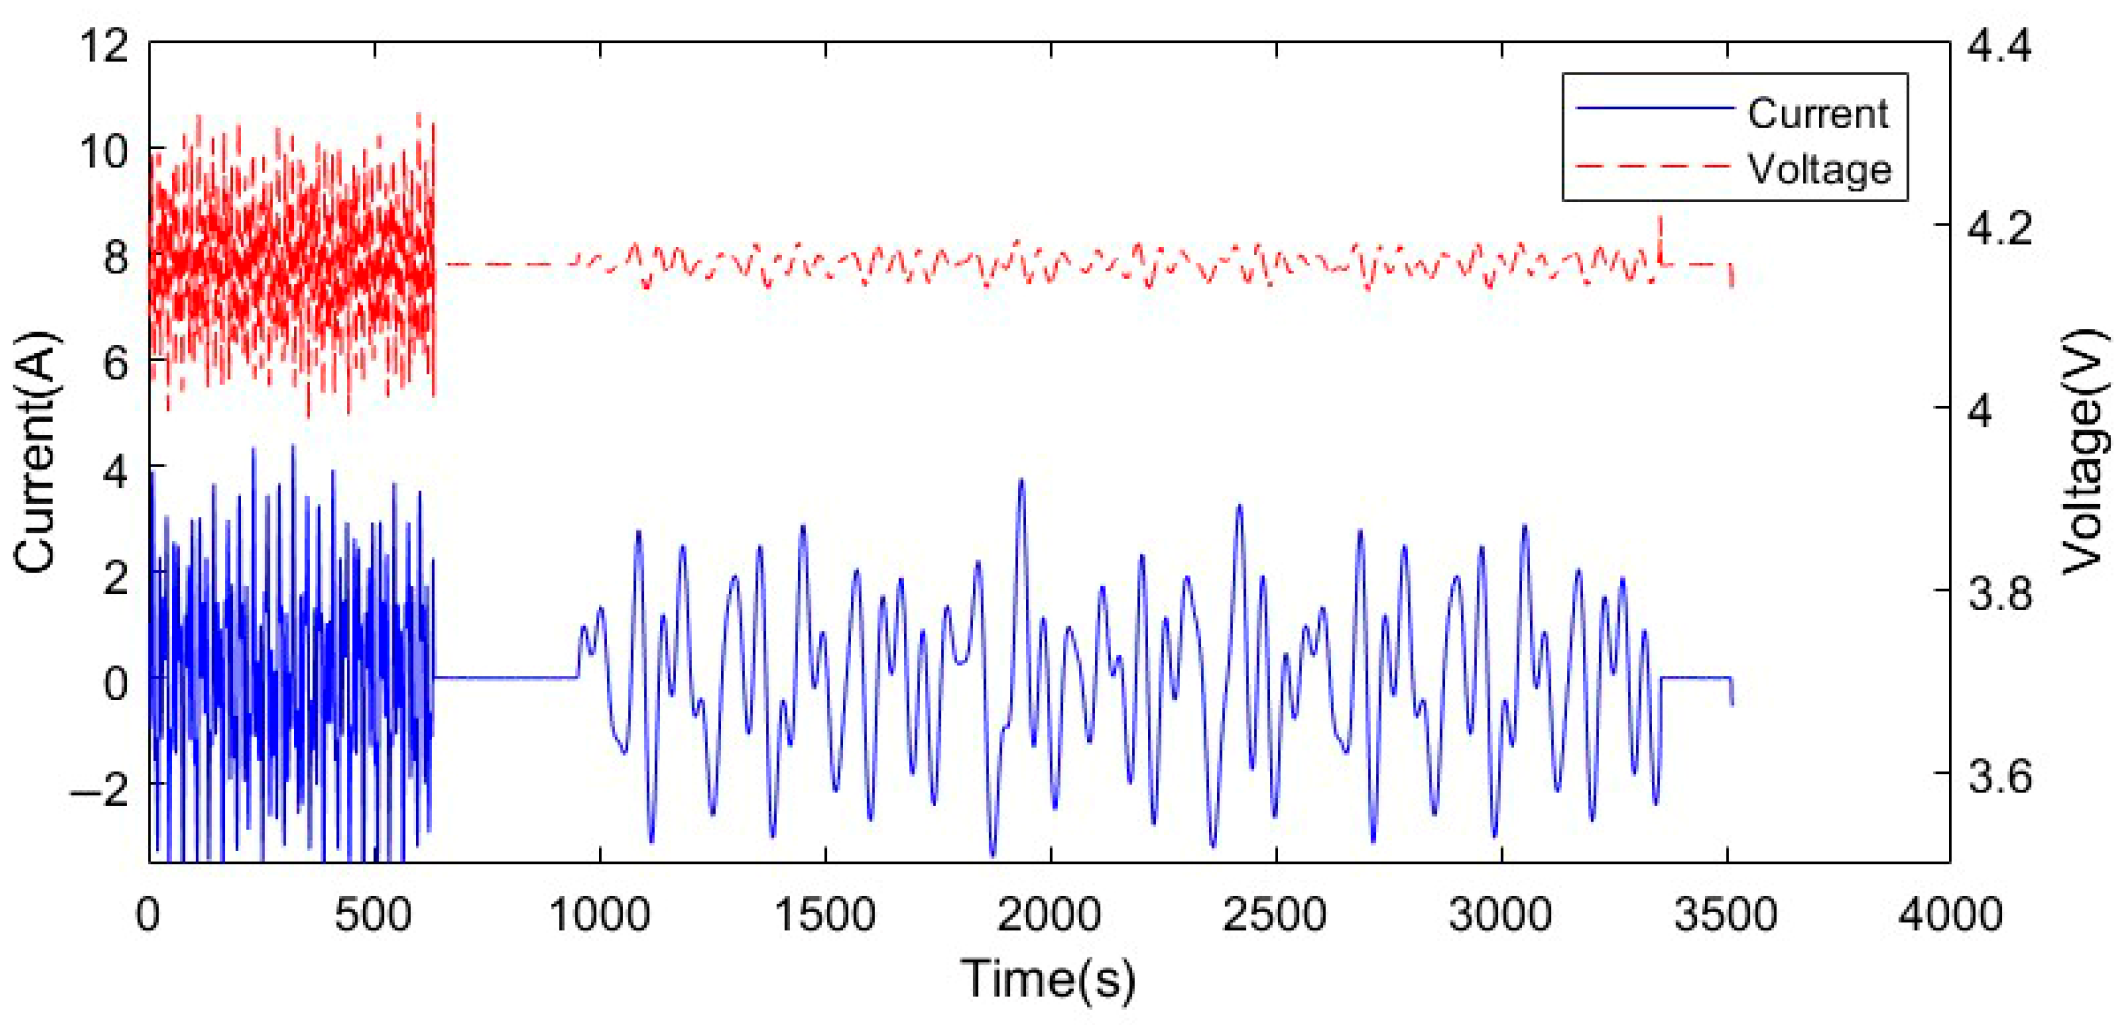
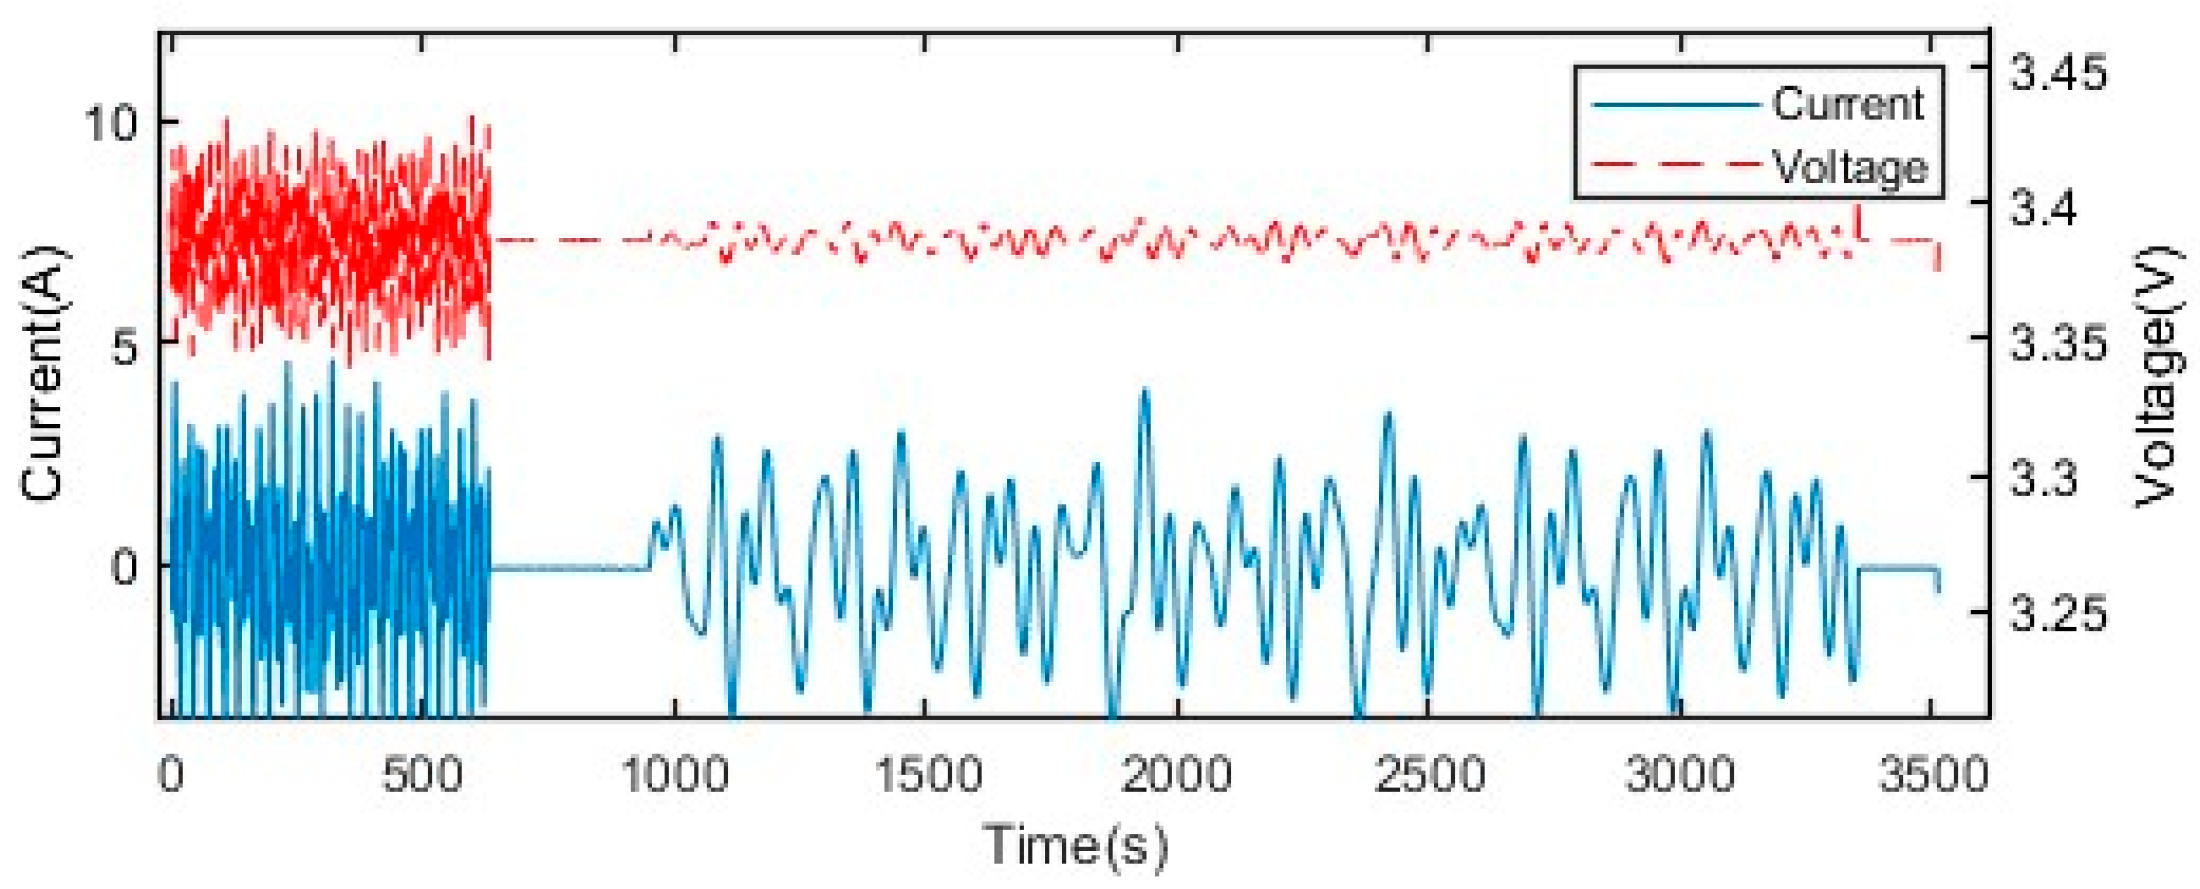
The implementation method for the piecewise multi-frequency superimposed design of the excitation signal is as follows: the signals in the 50–180 Hz band are first superimposed, followed by the superposition of those in the 280–1000 Hz band. Finally, the two superimposed signal segments are spliced together, with the total duration of the spliced signal being less than 0.5 s. After being converted by the V/I conversion module, the spliced signal yields the excitation current and response voltage. And the current and voltage signals of the two batteries are presented in Figure 3 and Figure 4 below, respectively.
Once the excitation current is obtained, it is injected into the sample battery to acquire the time-domain current and voltage signals of the battery. After the signal acquisition board collects the time-domain voltage and current signals of the battery, time-frequency domain conversion of the signals is required. Processing via the FFT algorithm enables the acquisition of the battery’s EIS. Based on this method, continuous injection of the excitation signal during battery operation allows for the rapid acquisition of the battery’s DEIS in the course of its operation.

3. Results

3.1. Impedance Characteristic of Nail Penetration

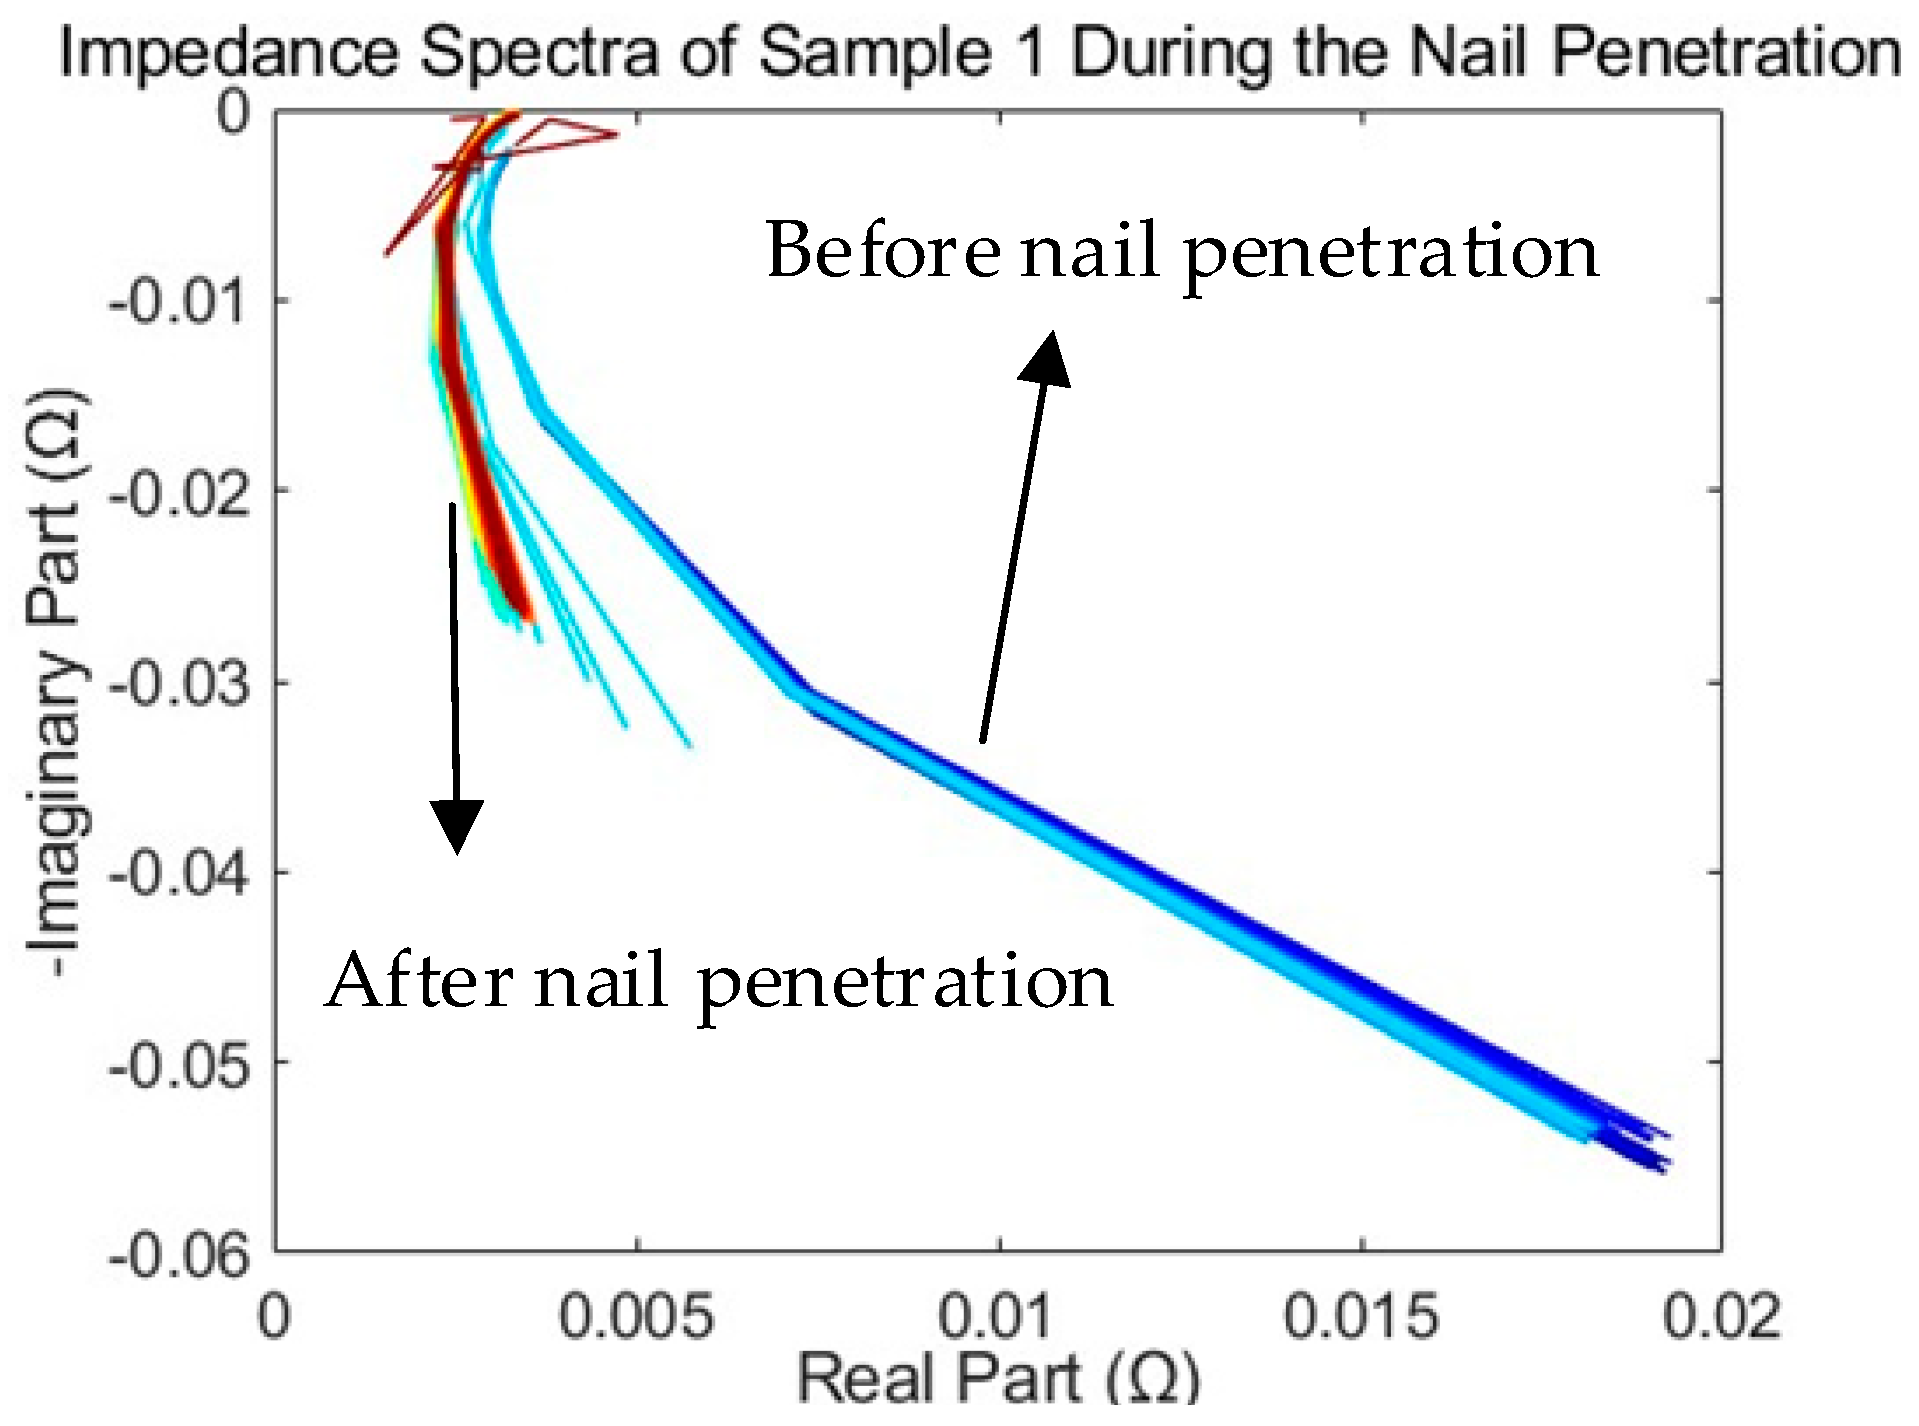
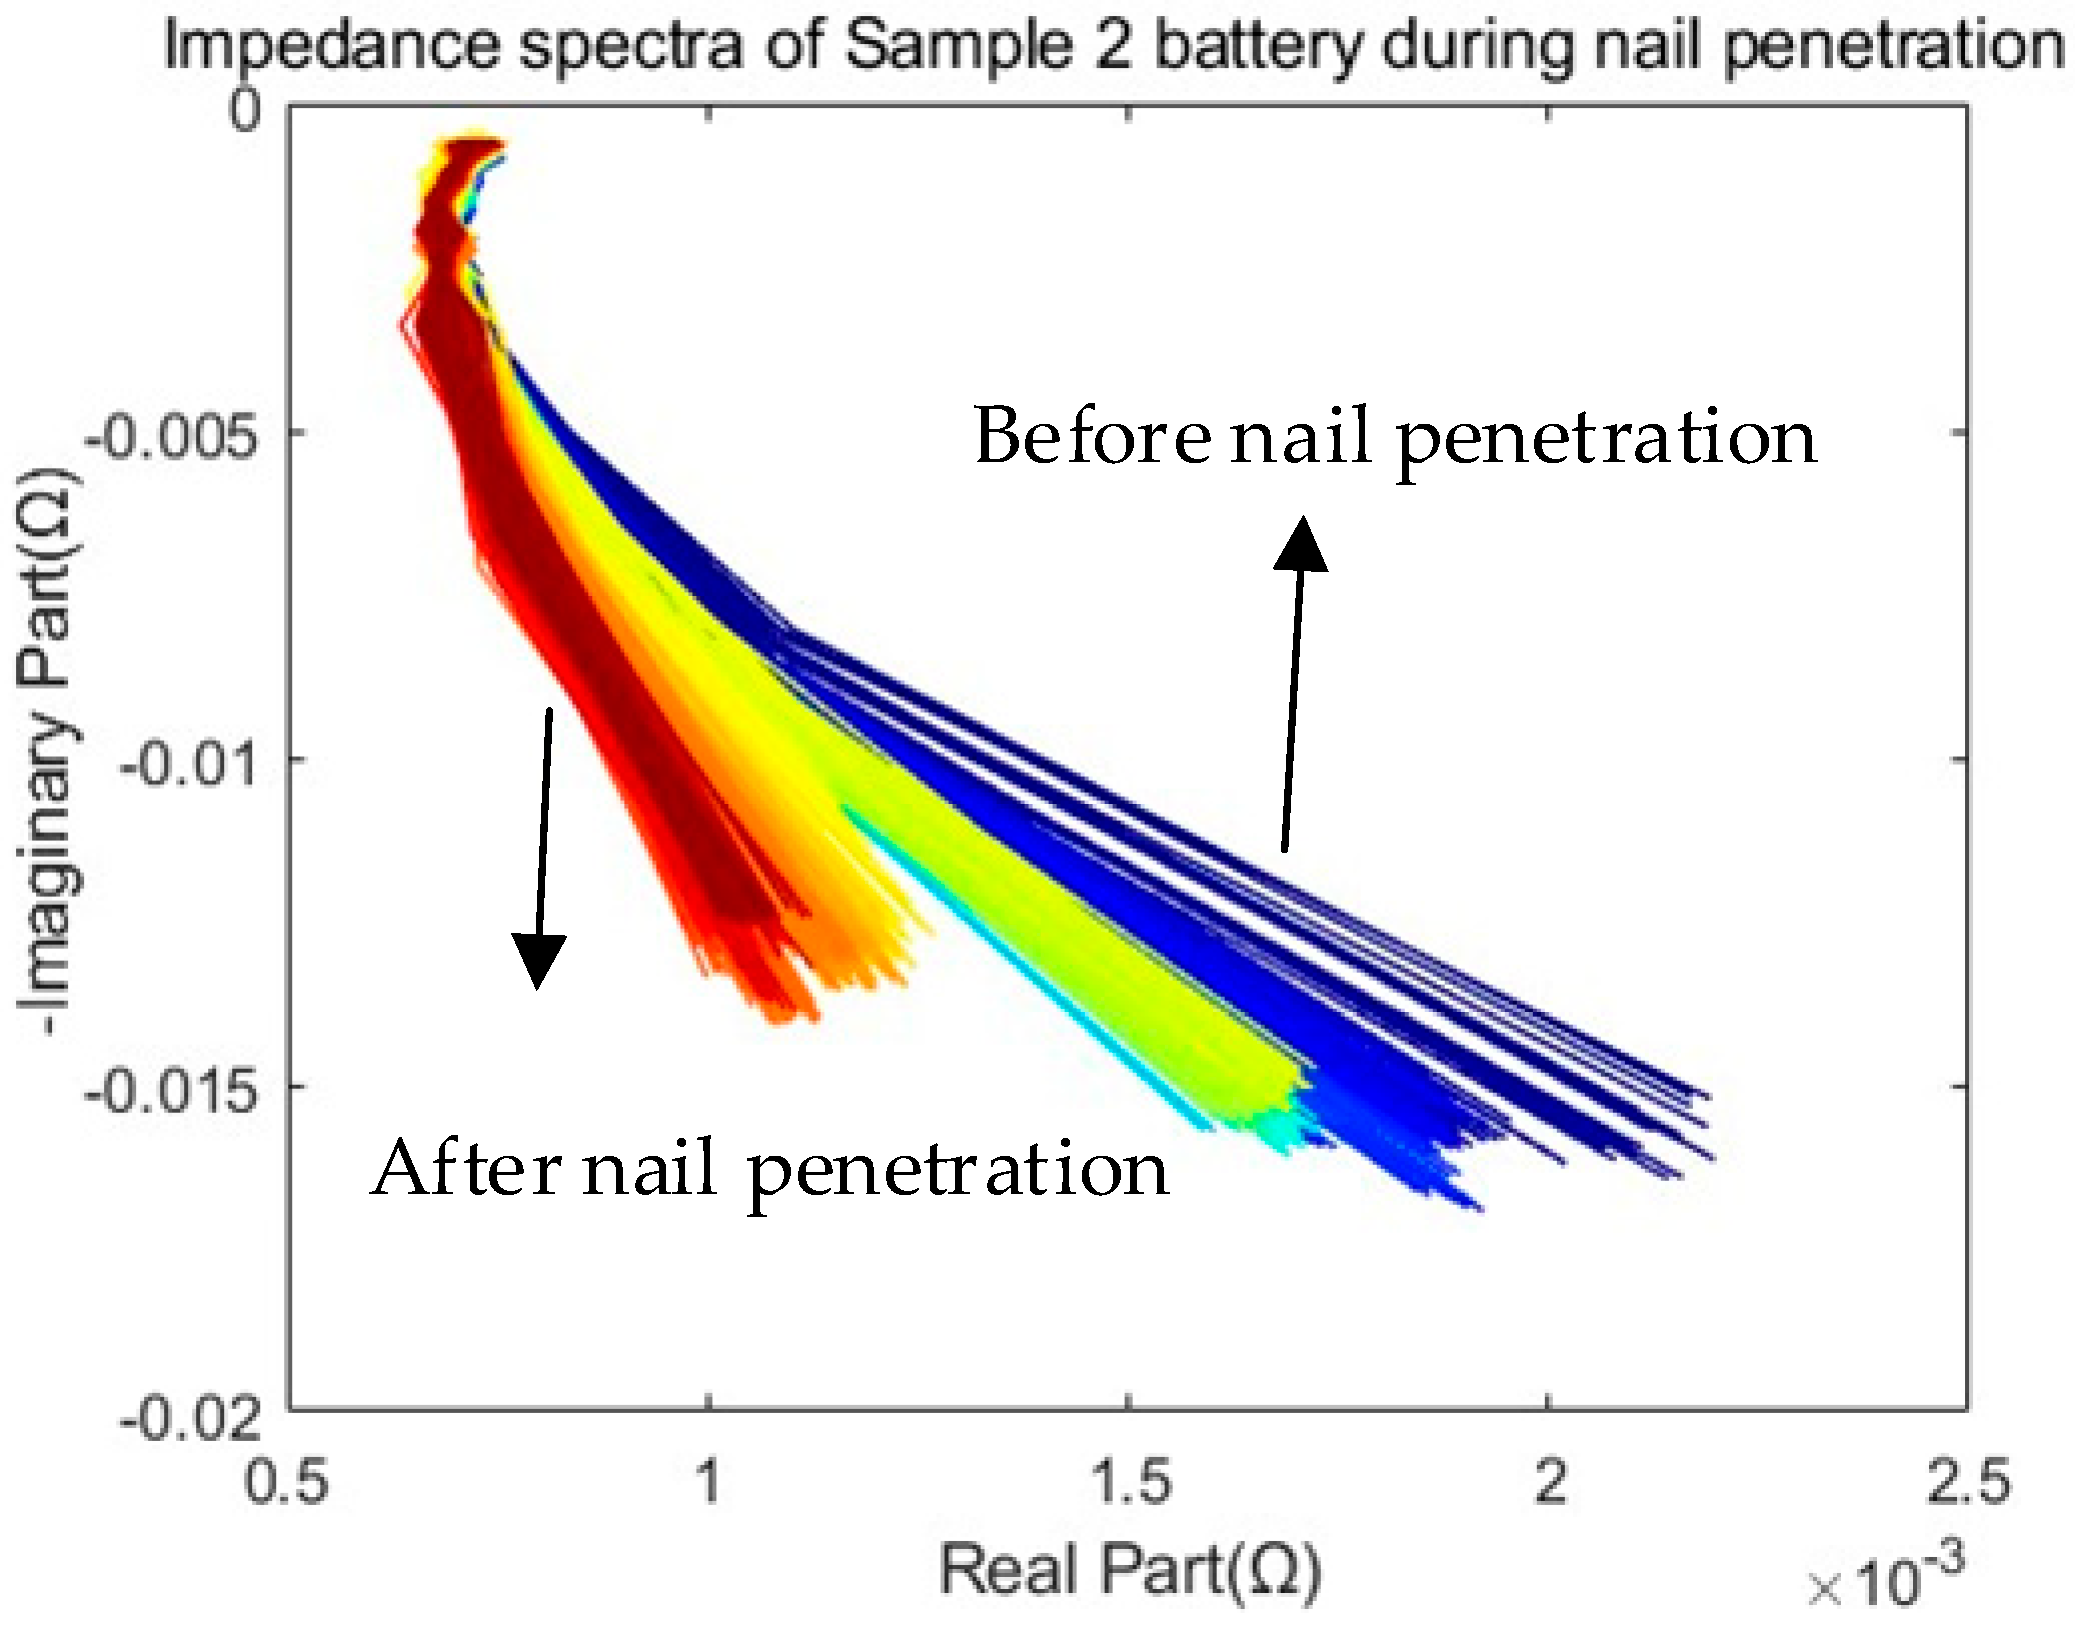
The dynamic impedance spectra of the two batteries during nail penetration tests, synchronously monitored by the DEIS rapid impedance measurement system, are presented in Figure 5 and Figure 6 below. Due to experimental safety considerations, the wiring harness used in this study is relatively long, which introduces a significant inductive effect into the impedance spectrum, causing the impedance spectrum to exhibit a trend of larger inductance.
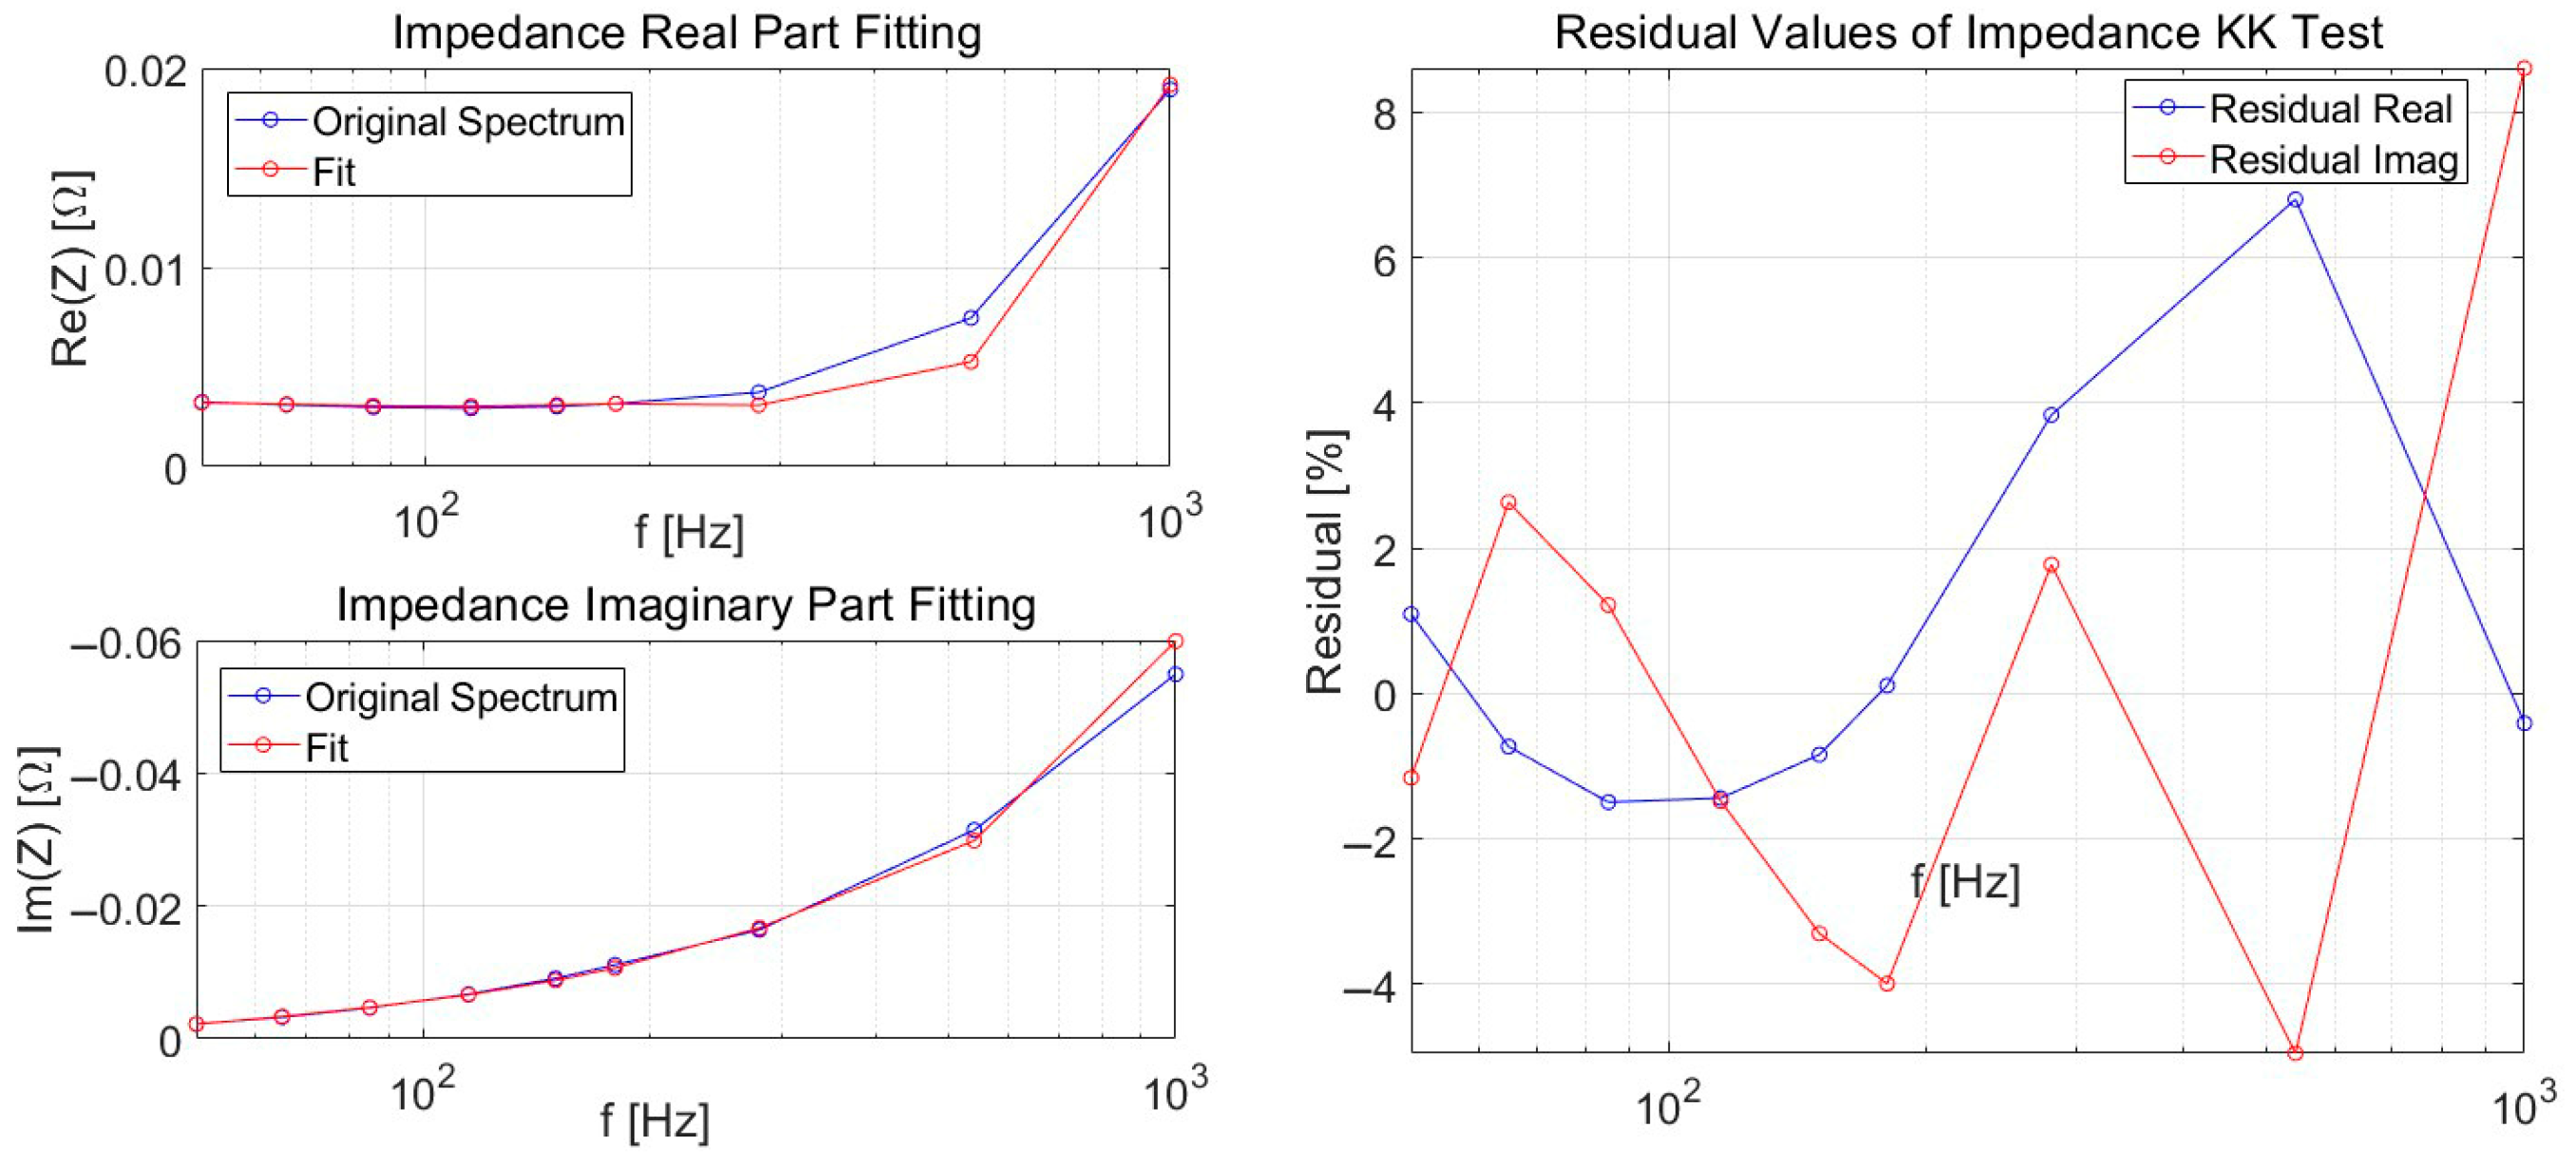
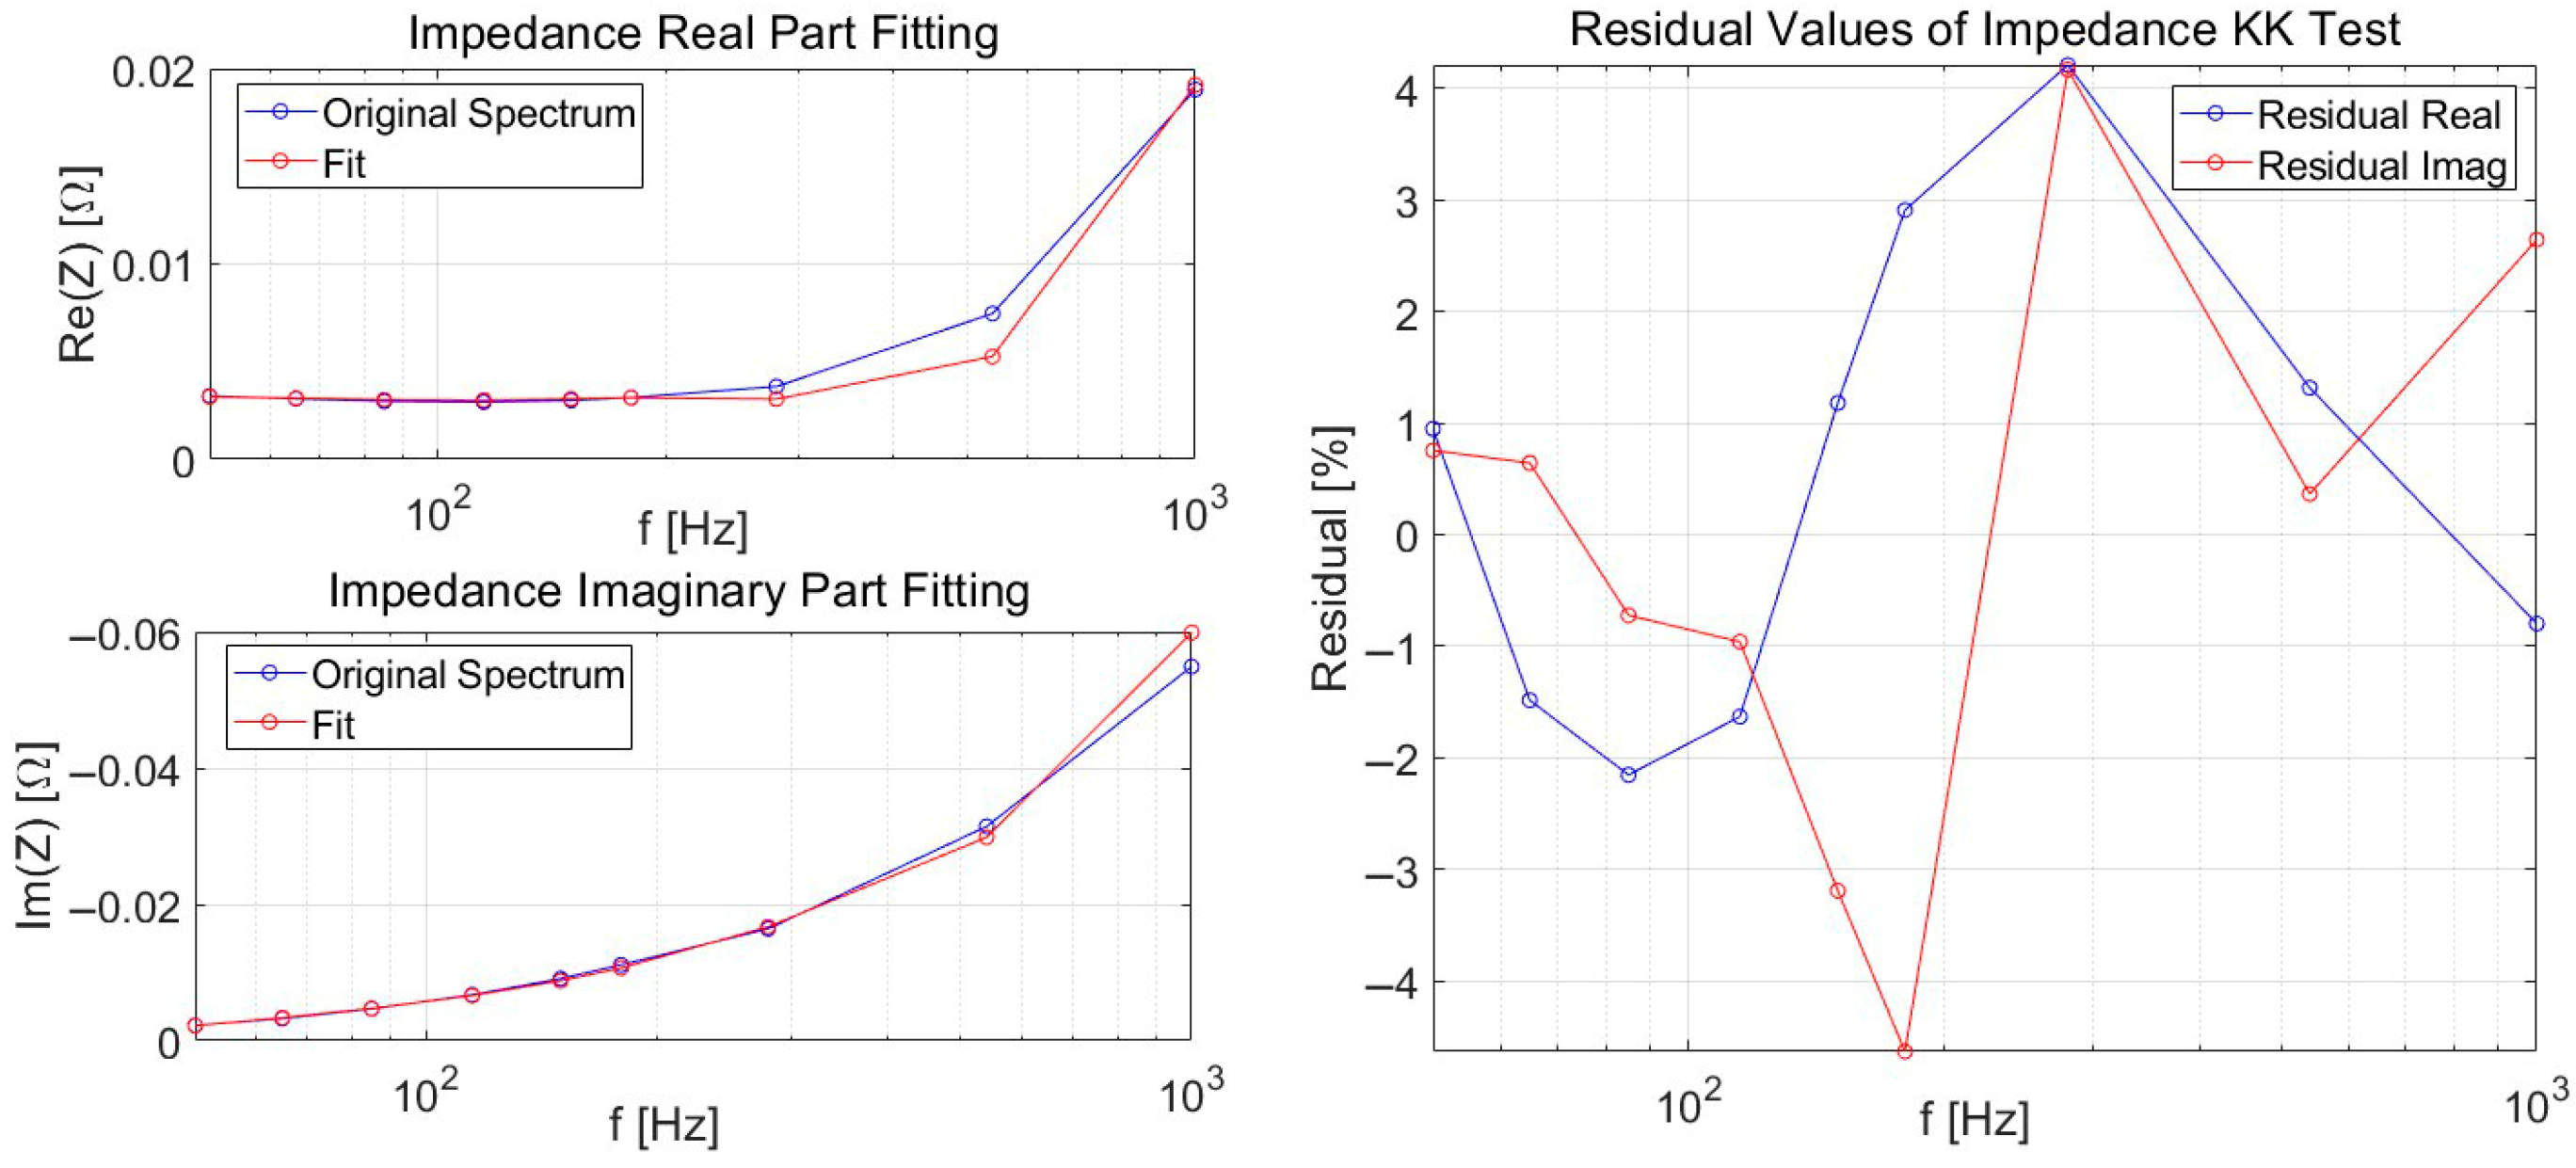
To ensure the reliability of the experimentally obtained impedance data, Kramers–Kronig (KK) tests were performed on the impedance data of the two battery samples before and after nail penetration. Two test cycles were selected for each battery before and after penetration, resulting in a total of 8 datasets. The detailed results are shown in Figure 7 and Figure 8 below.
It can be seen from the real and imaginary part fitting results in Figure 2 and Figure 3 that the impedance spectra are well fitted in both real and imaginary parts. Meanwhile, according to the KK test residual plots in Figure 2 and Figure 3, the measured impedance spectra of both battery samples pass the KK test, with the fitting residual values (RES) controlled within 10%. This proves the excellent reliability of the experimental data, which satisfies the prerequisites of causality and stability and can be used for subsequent analysis.
Based on the above analysis, it can be clearly observed that the characteristics of the battery impedance spectra in Figure 7 and Figure 8 exhibit significant changes before and after nail penetration. Prior to nail penetration, the imaginary impedance of Sample 1 battery was approximately 0.06 Ω, while that of Sample 2 battery was around 0.018 Ω. From the moment the steel needle penetrated the batteries, the structure of the impedance spectra for both batteries changed dramatically: the imaginary part decreased rapidly, and eventually stabilized at about 0.03 Ω for Sample 1 and 0.014 Ω for Sample 2, with reductions of 50% and 22.22% relative to their initial values, respectively.
This phenomenon can be explained as follows: after the steel needle penetrates the battery, a low-impedance metallic bypass is formed, which is connected in parallel with the original electrochemical pathway of the battery, resulting in a significant current shunting effect. A large proportion of the current is directly conducted between the positive and negative electrodes through the steel needle, leading to a substantial reduction in the effective current flowing across the electrode–electrolyte interface. Consequently, the number of charged particles participating in the interfacial redox reaction decreases sharply, the charge transfer process is significantly suppressed, and the degree of electrochemical polarization is greatly weakened.
Meanwhile, the inductive component introduced by the short-circuit loop further lowers the imaginary part of the impedance. These combined effects give rise to the reduction, and even halving, of the imaginary impedance observed in the experiments.
Simultaneously, the real part of the impedance spectrum for both batteries also exhibits a continuous downward trend. This is primarily attributed to the excellent conductivity of the steel nail itself and the stable short-circuit path it formed inside the battery, which reduced the bulk resistance of the battery and the contact resistances at various interfaces. The real part impedance ultimately decreased to about 20% and 45% of their initial value respectively, further confirming the substantial impact of the steel nail penetration on the internal conductive structure of the battery.
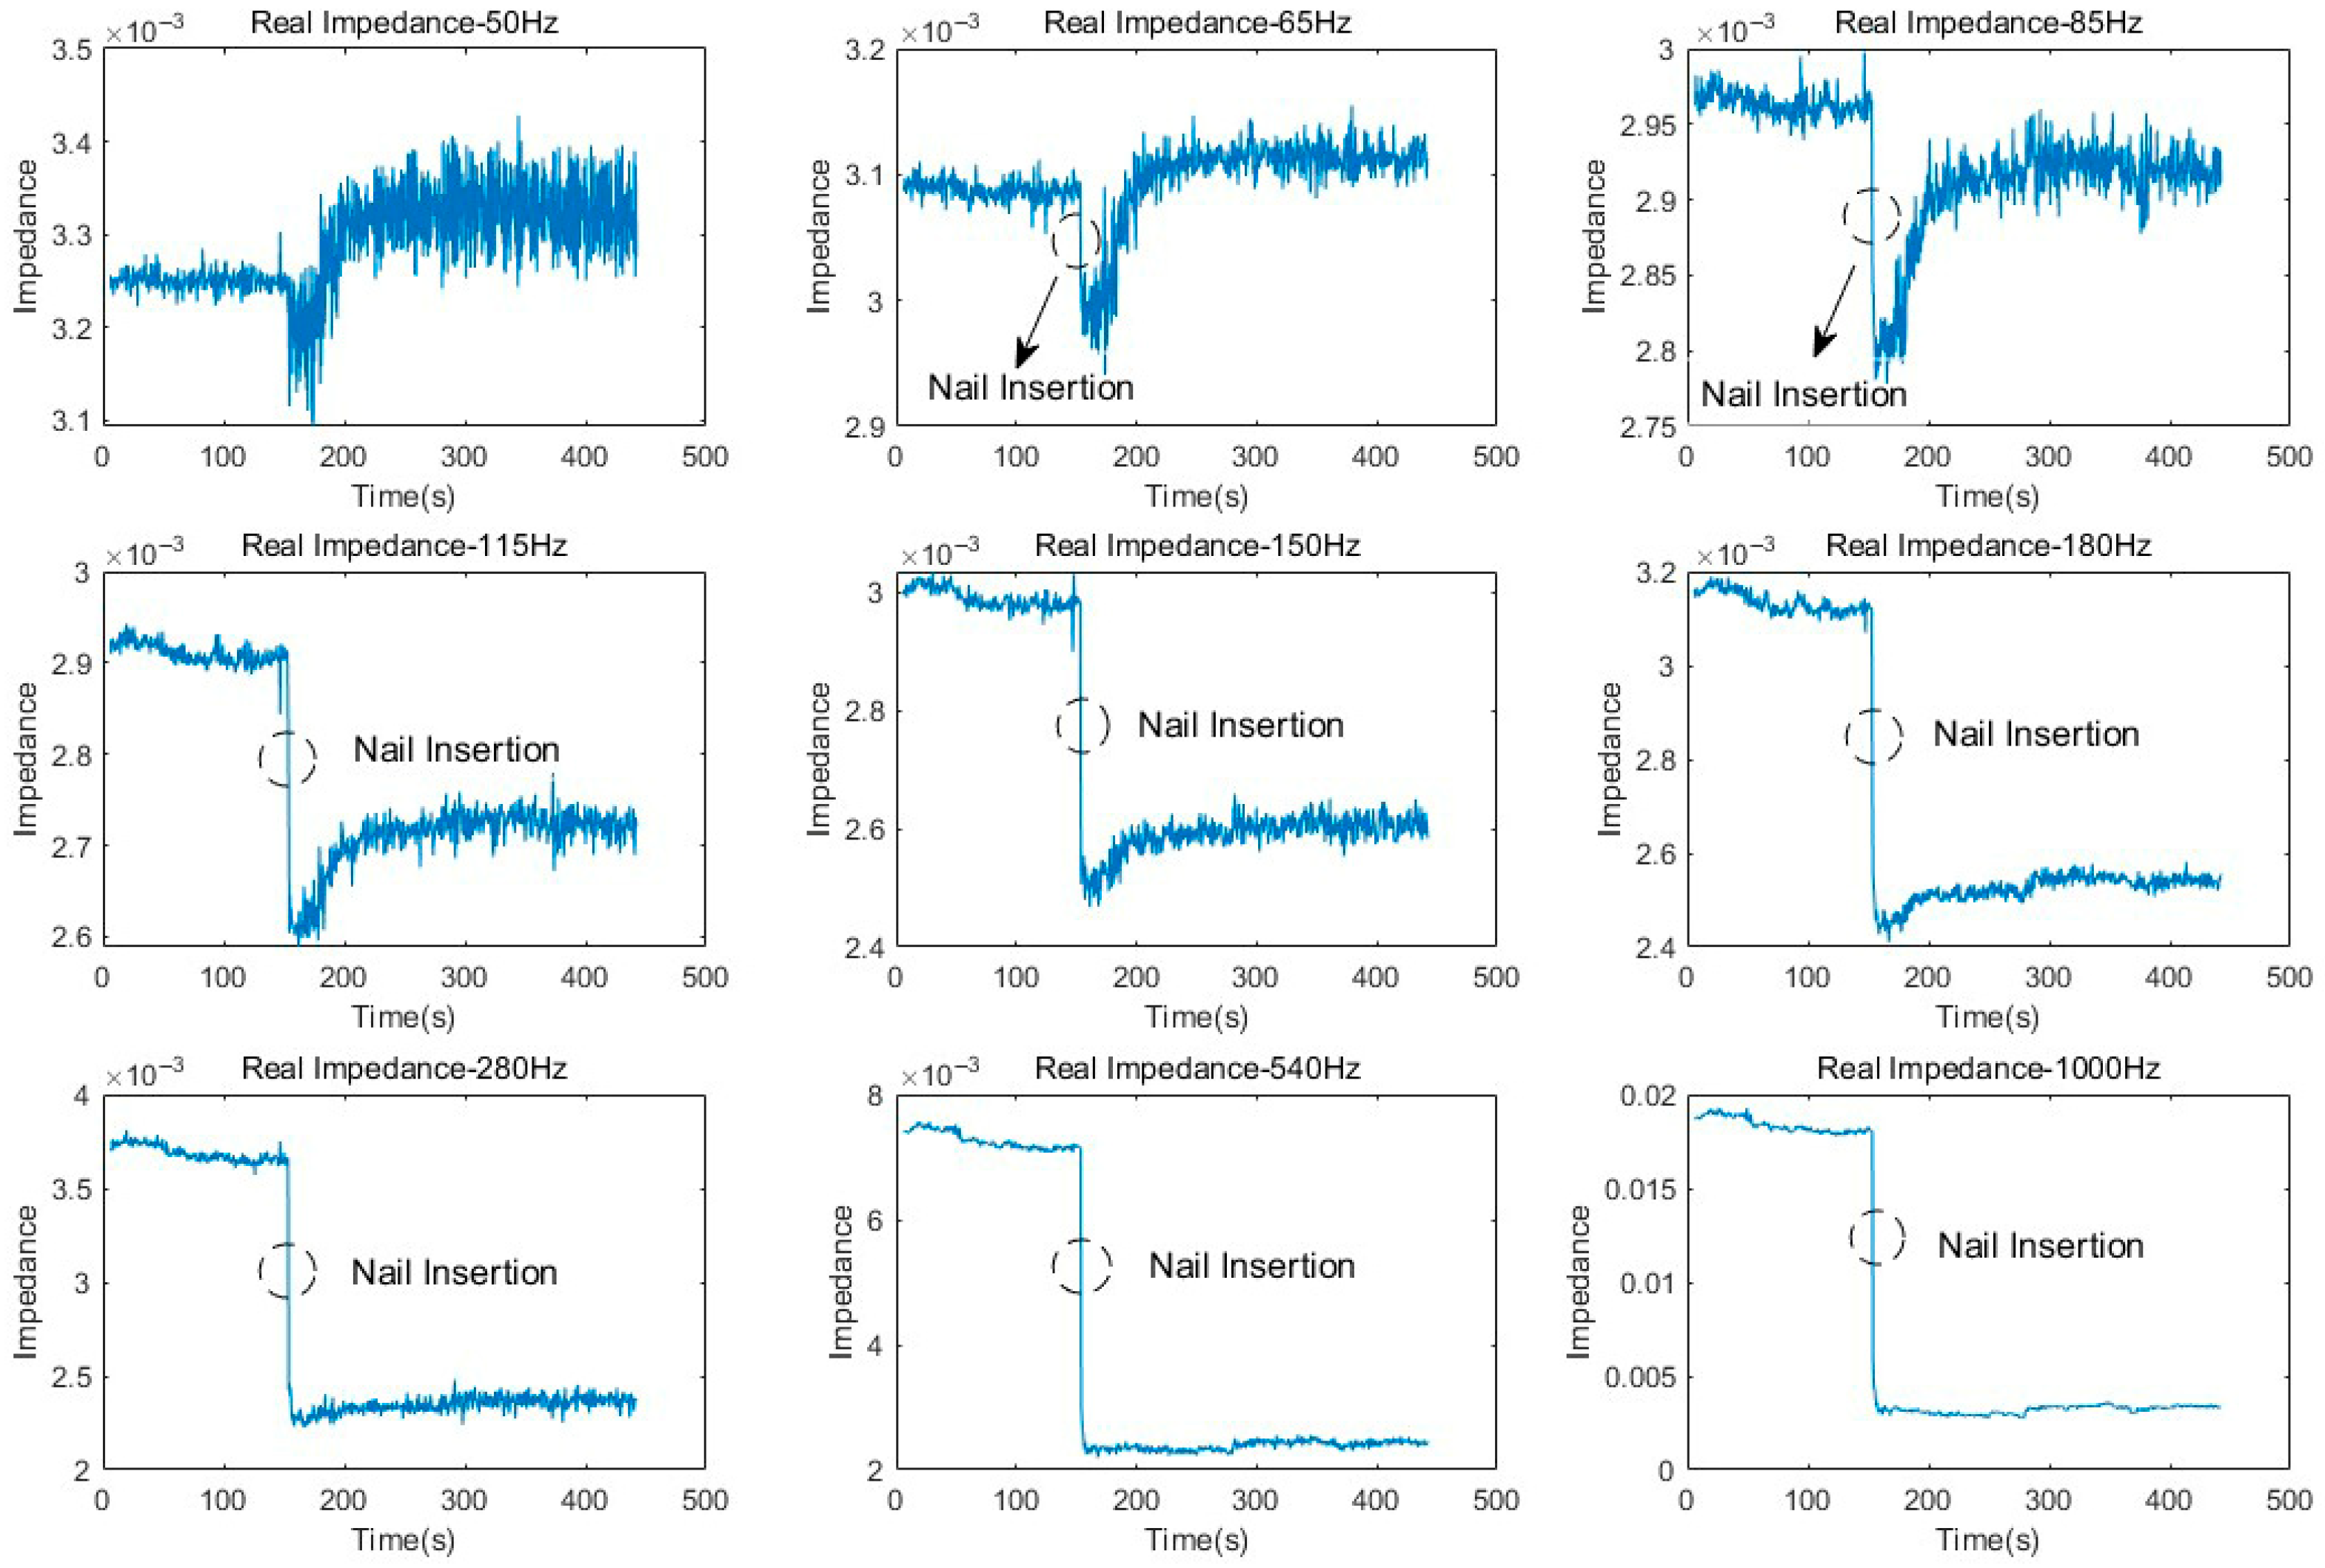
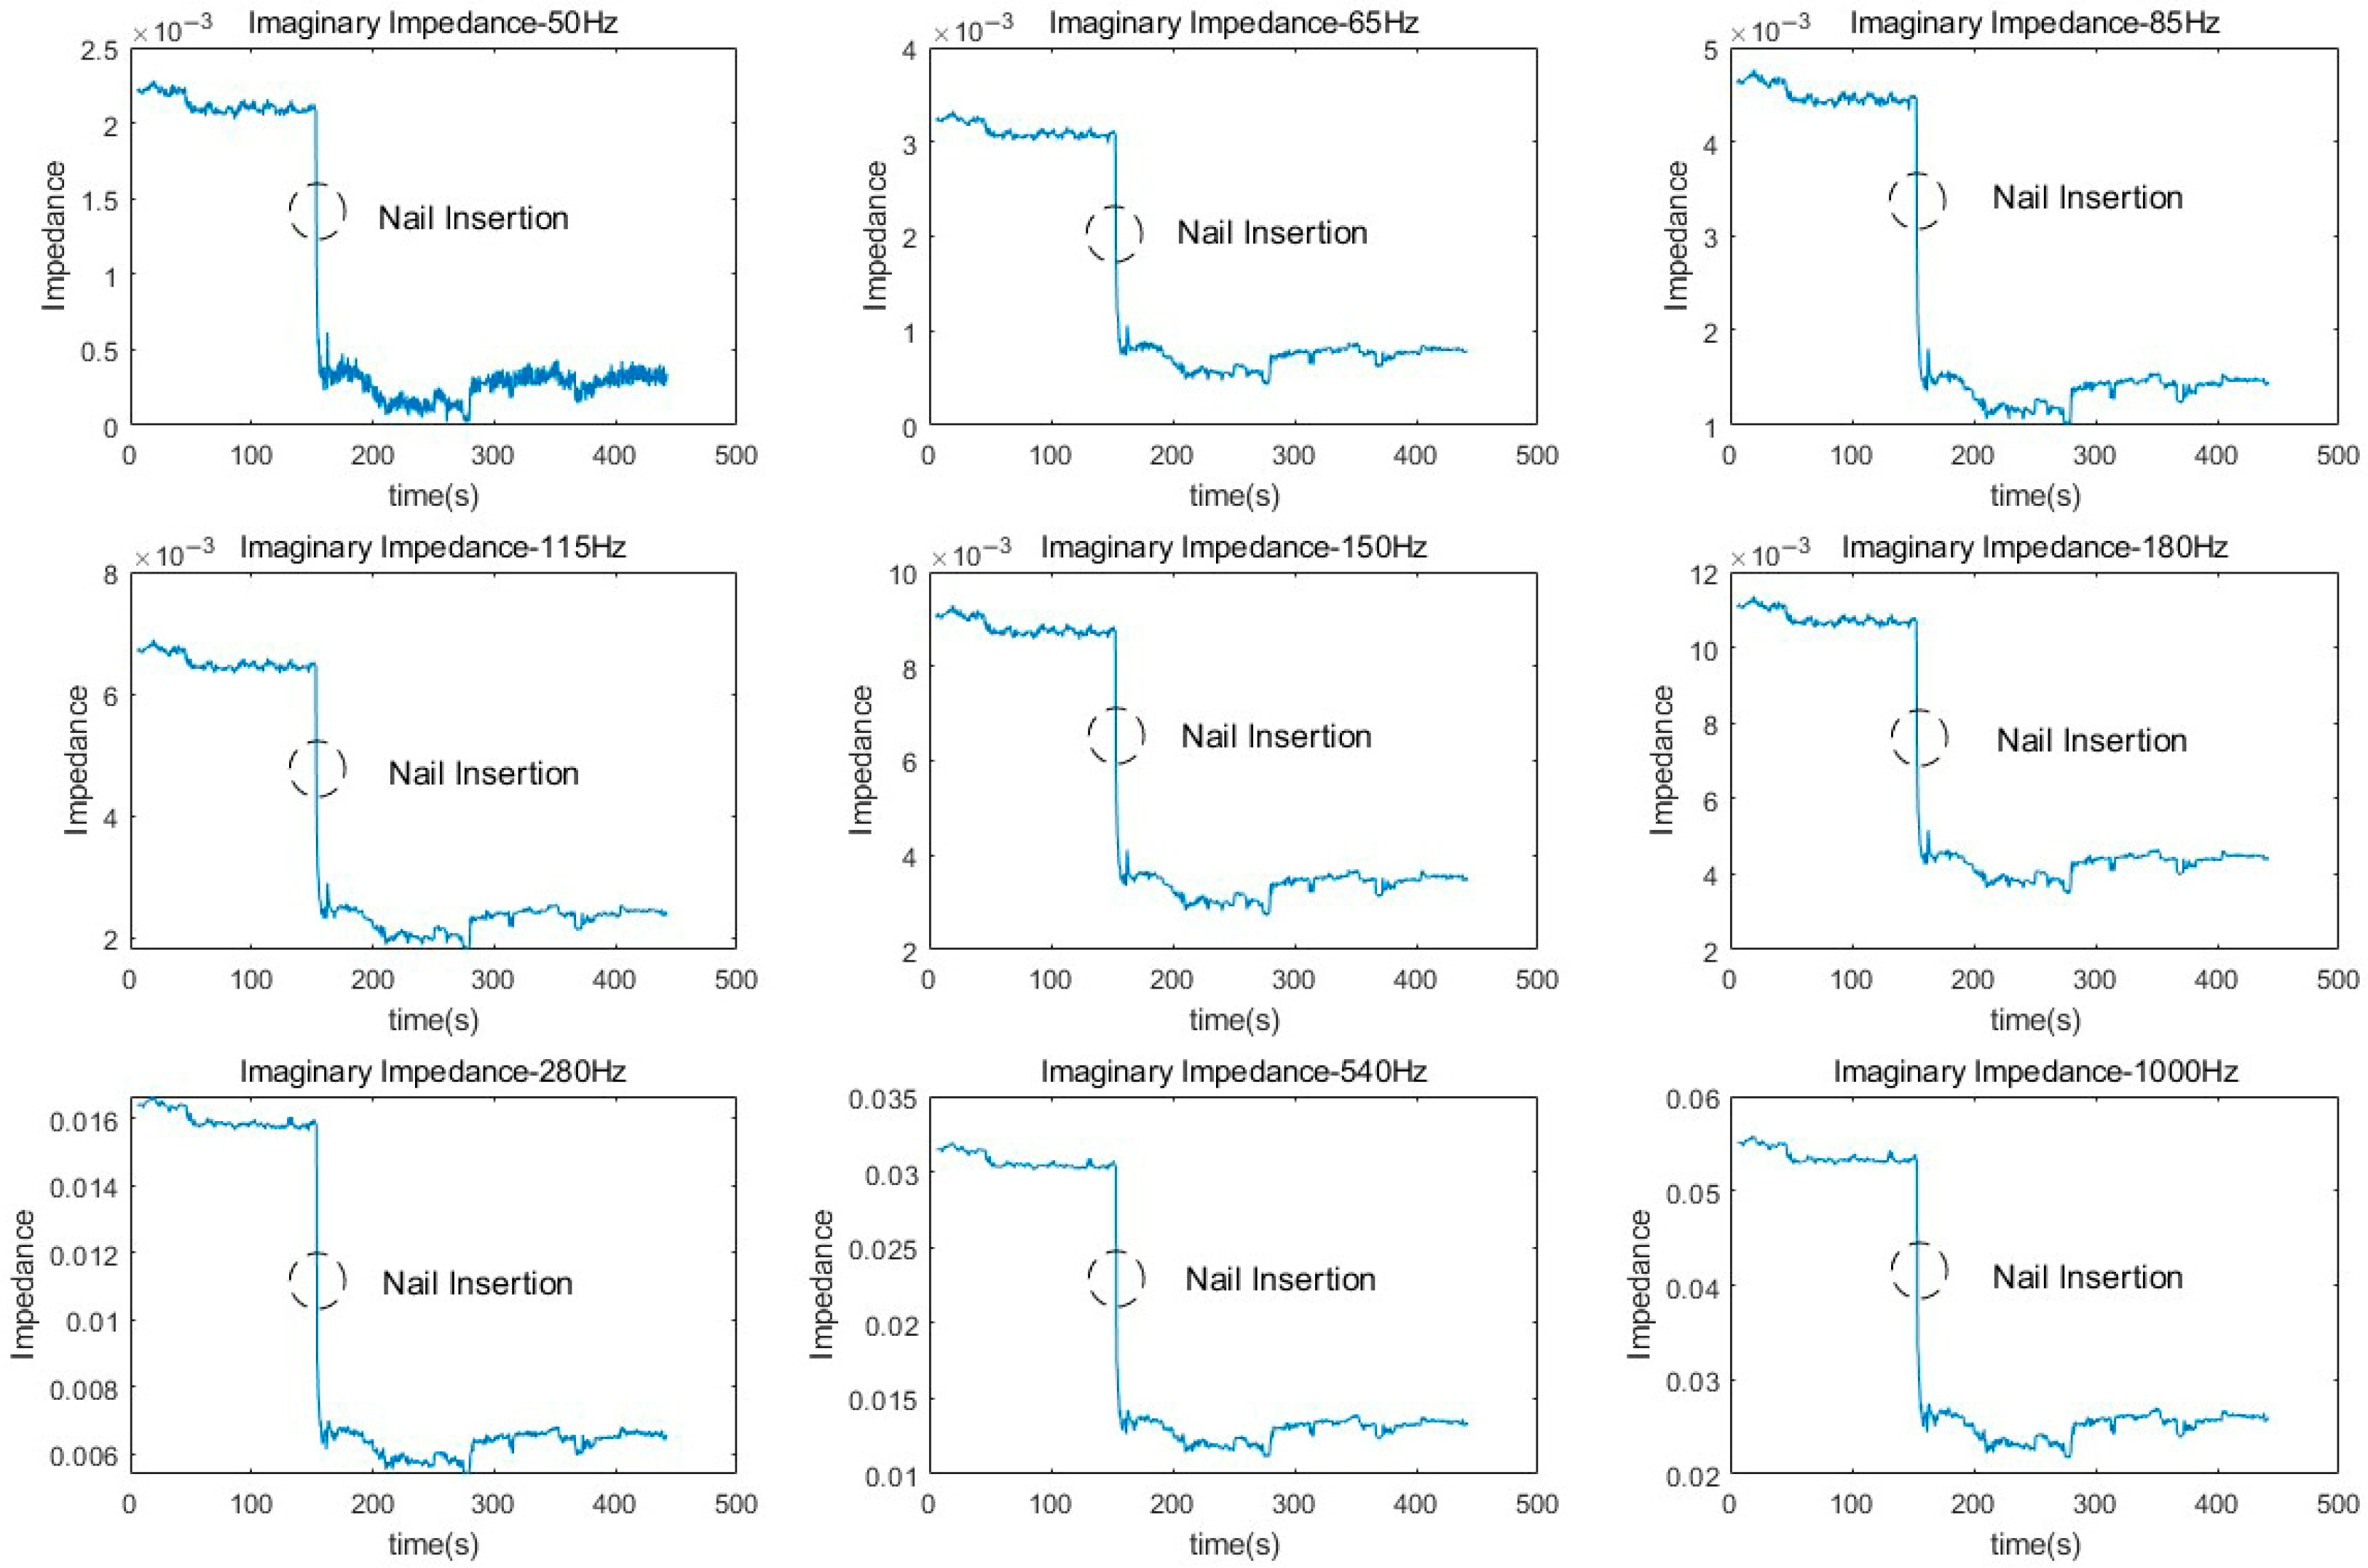
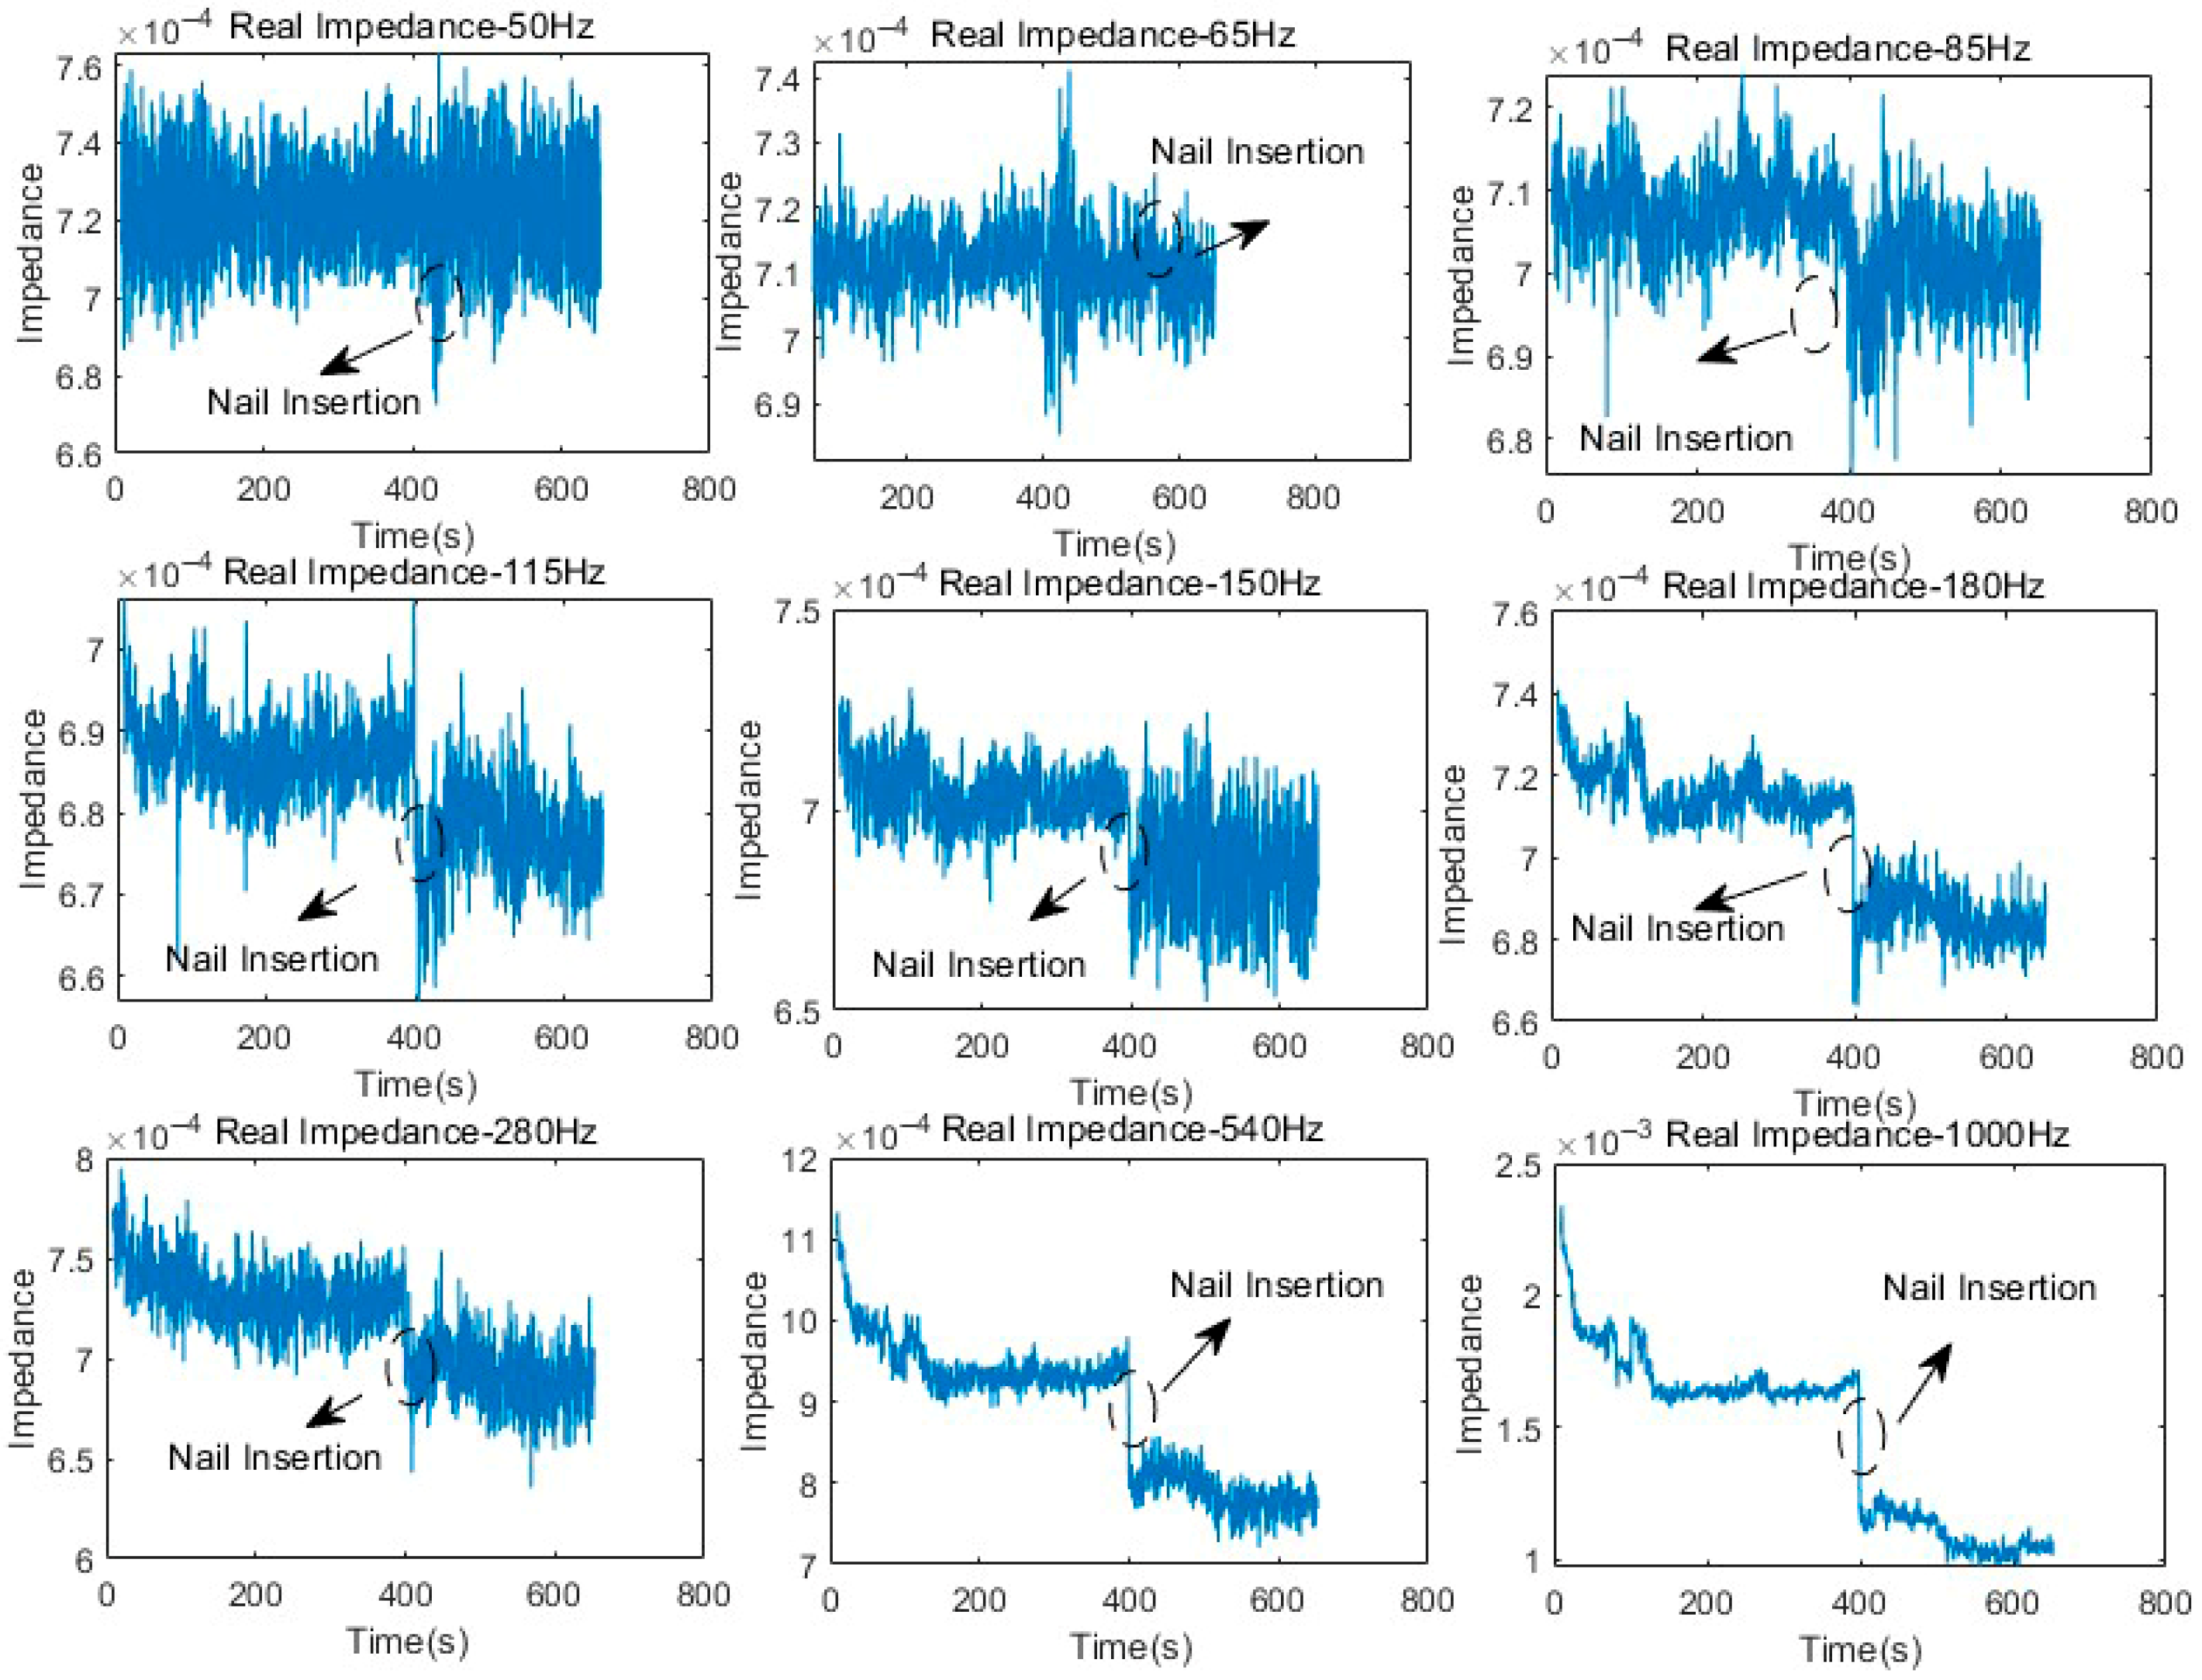
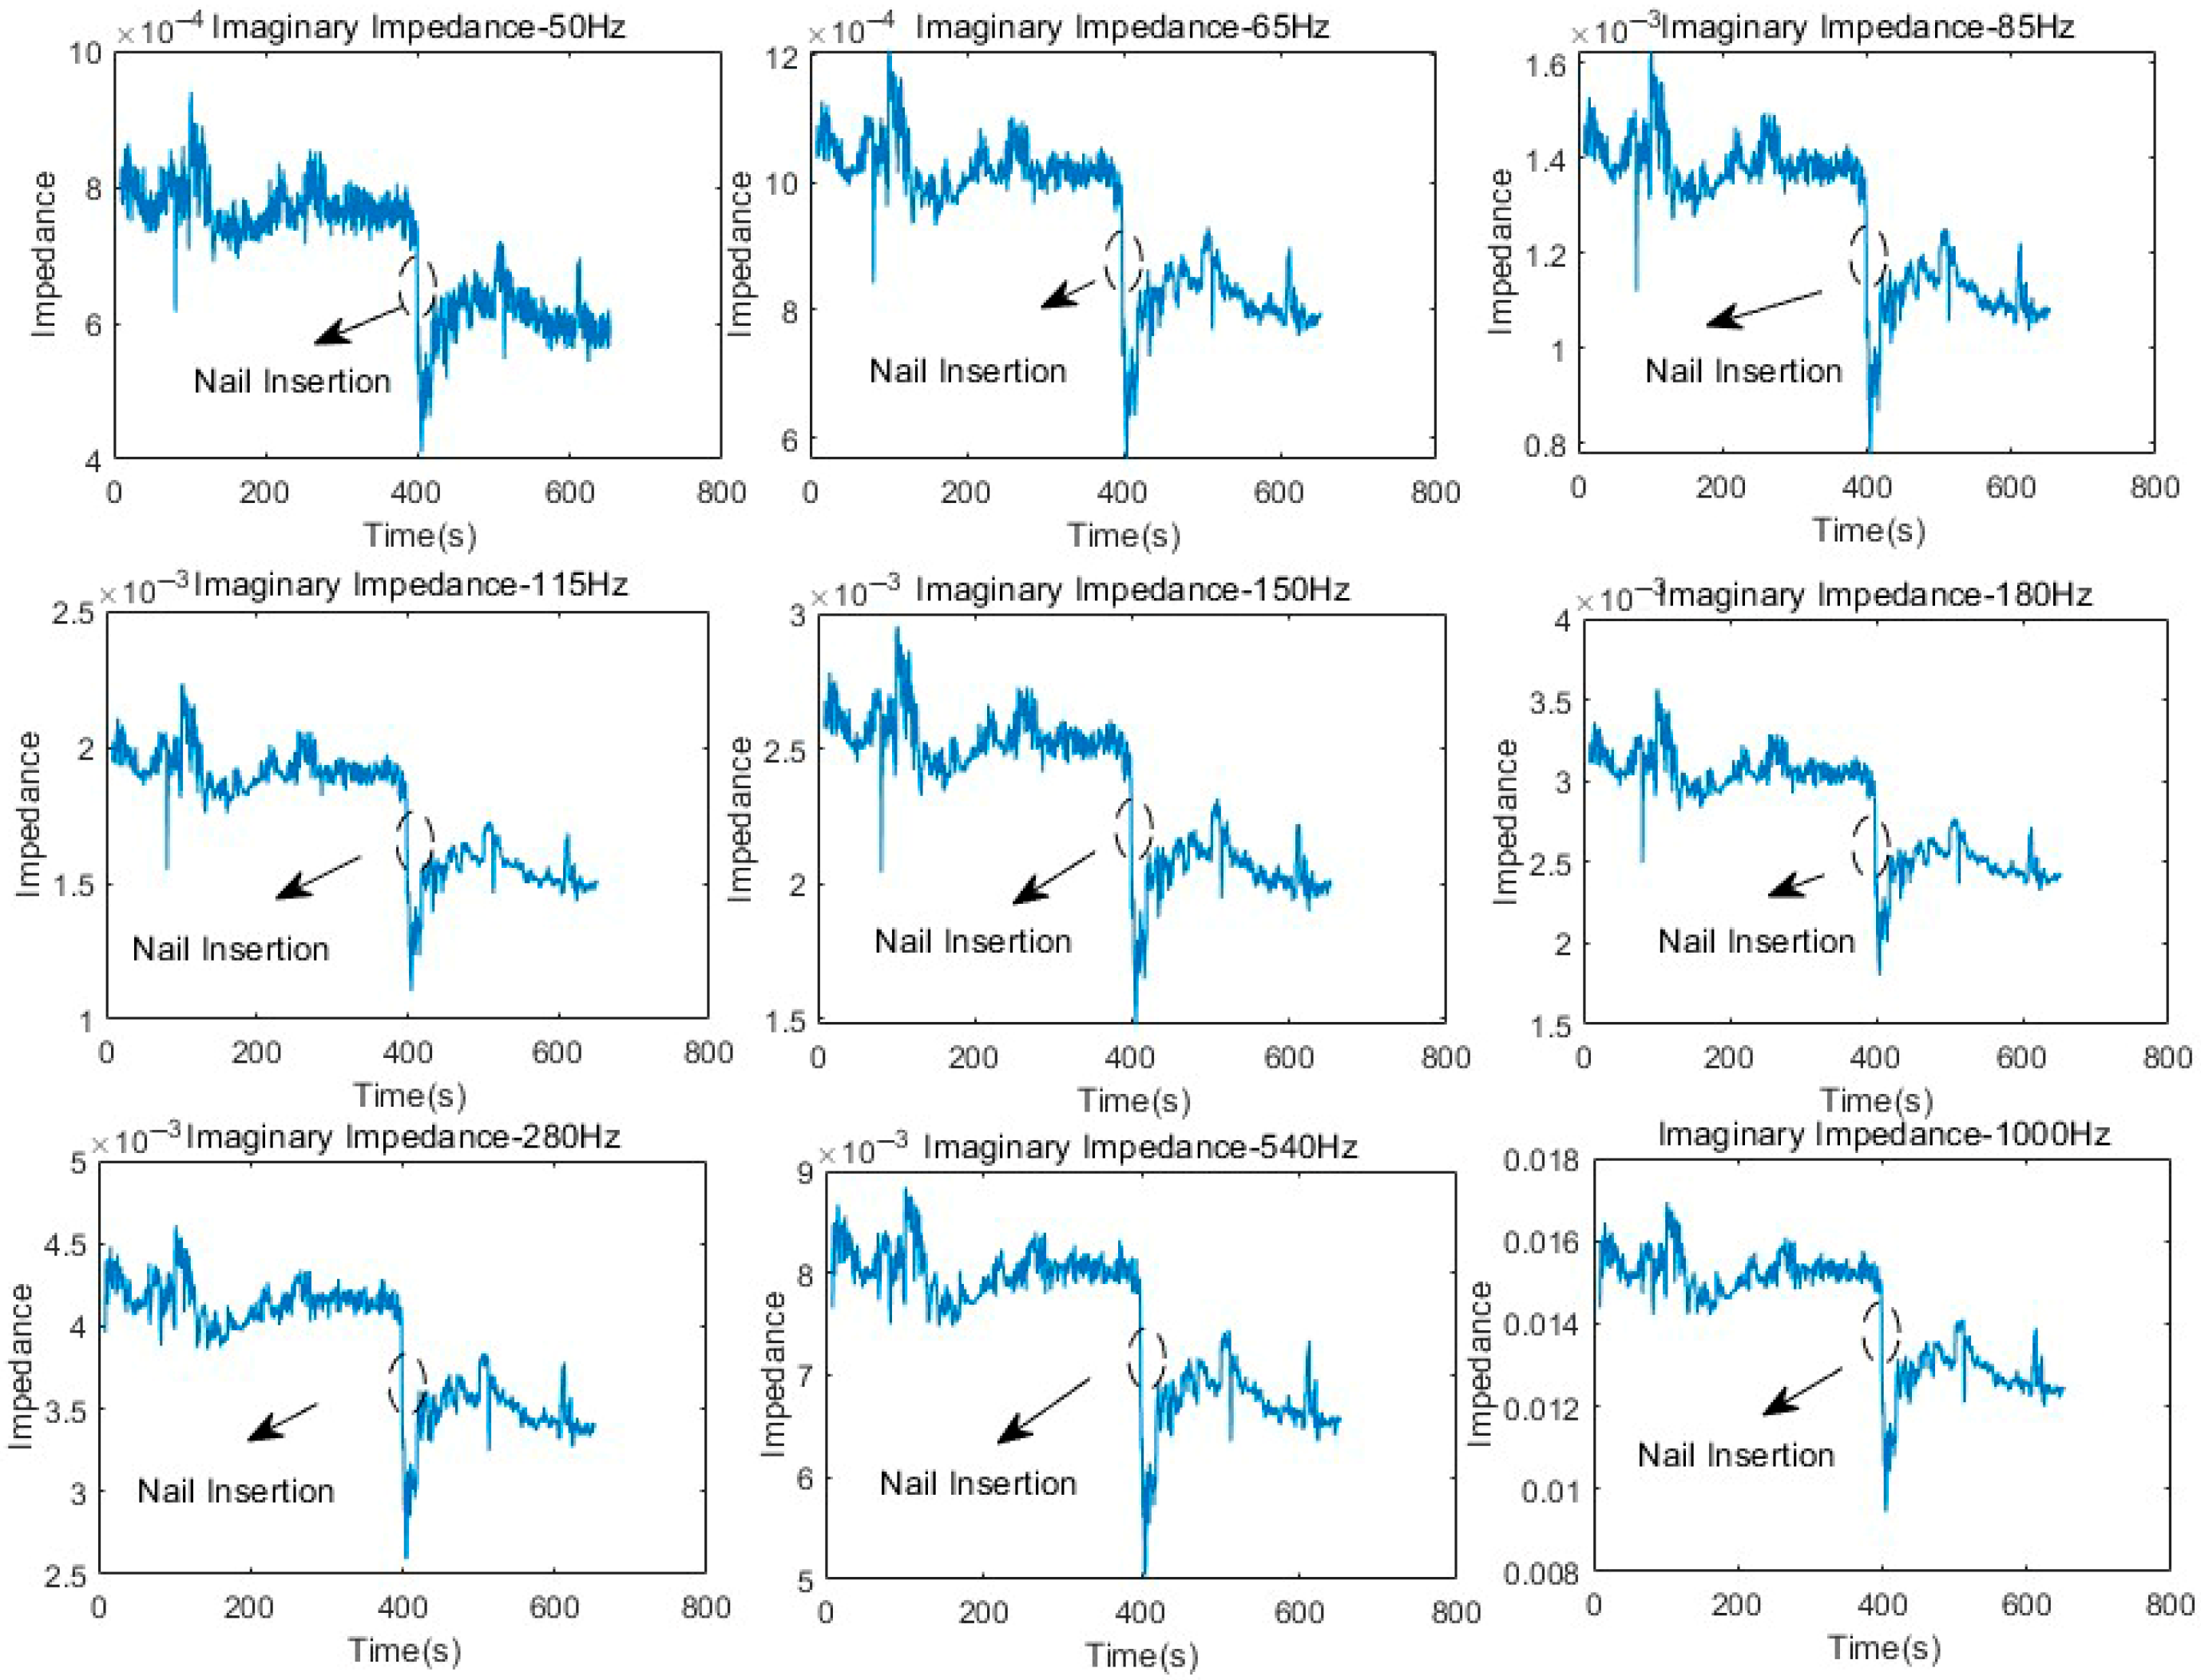
The real and imaginary parts of the battery impedance within the frequency range of 50–1000 Hz before and after nail penetration were further analyzed in the time domain, and their variation trends are presented in Figure 9, Figure 10, Figure 11 and Figure 12, respectively.
Analysis of the real impedance variation reveals that for the Sample 1 battery, the real part of the impedance exhibits no significant difference within the middle-frequency range of 50–85 Hz after nail penetration compared with the pre-penetration state. By contrast, no obvious change is observed in Sample 2 battery over the frequency band of 50–280 Hz. However, as the frequency continues to increase, starting from a specific frequency point (115 Hz for the Sample 1 battery, 540 Hz for the Sample 2 battery), a significant jump phenomenon appears in the real part impedance curves before and after penetration. Moreover, the higher the frequency, the greater the magnitude of the jump, demonstrating a clear frequency-dependent enhancement characteristic.
Analysis of the imaginary part impedance shows that throughout the observed mid-to-high frequency range (50–1000 Hz), the imaginary part impedance of both batteries exhibits distinct jump characteristics before and after nail penetration. Similarly, this difference further expands as the frequency increases, indicating that high-frequency signals have a more sensitive response capability to changes in the polarization process within the battery caused by nail penetration. This phenomenon further confirms that under the internal short-circuit conditions induced by nail penetration, the mid-to-high frequency impedance characteristics of the battery undergo systematic shifts, and the degree of change is positively correlated with frequency. This provides important data support for battery safety state monitoring and fault diagnosis based on impedance frequency response characteristics.

3.2. Voltage Characteristic of Nail Penetration

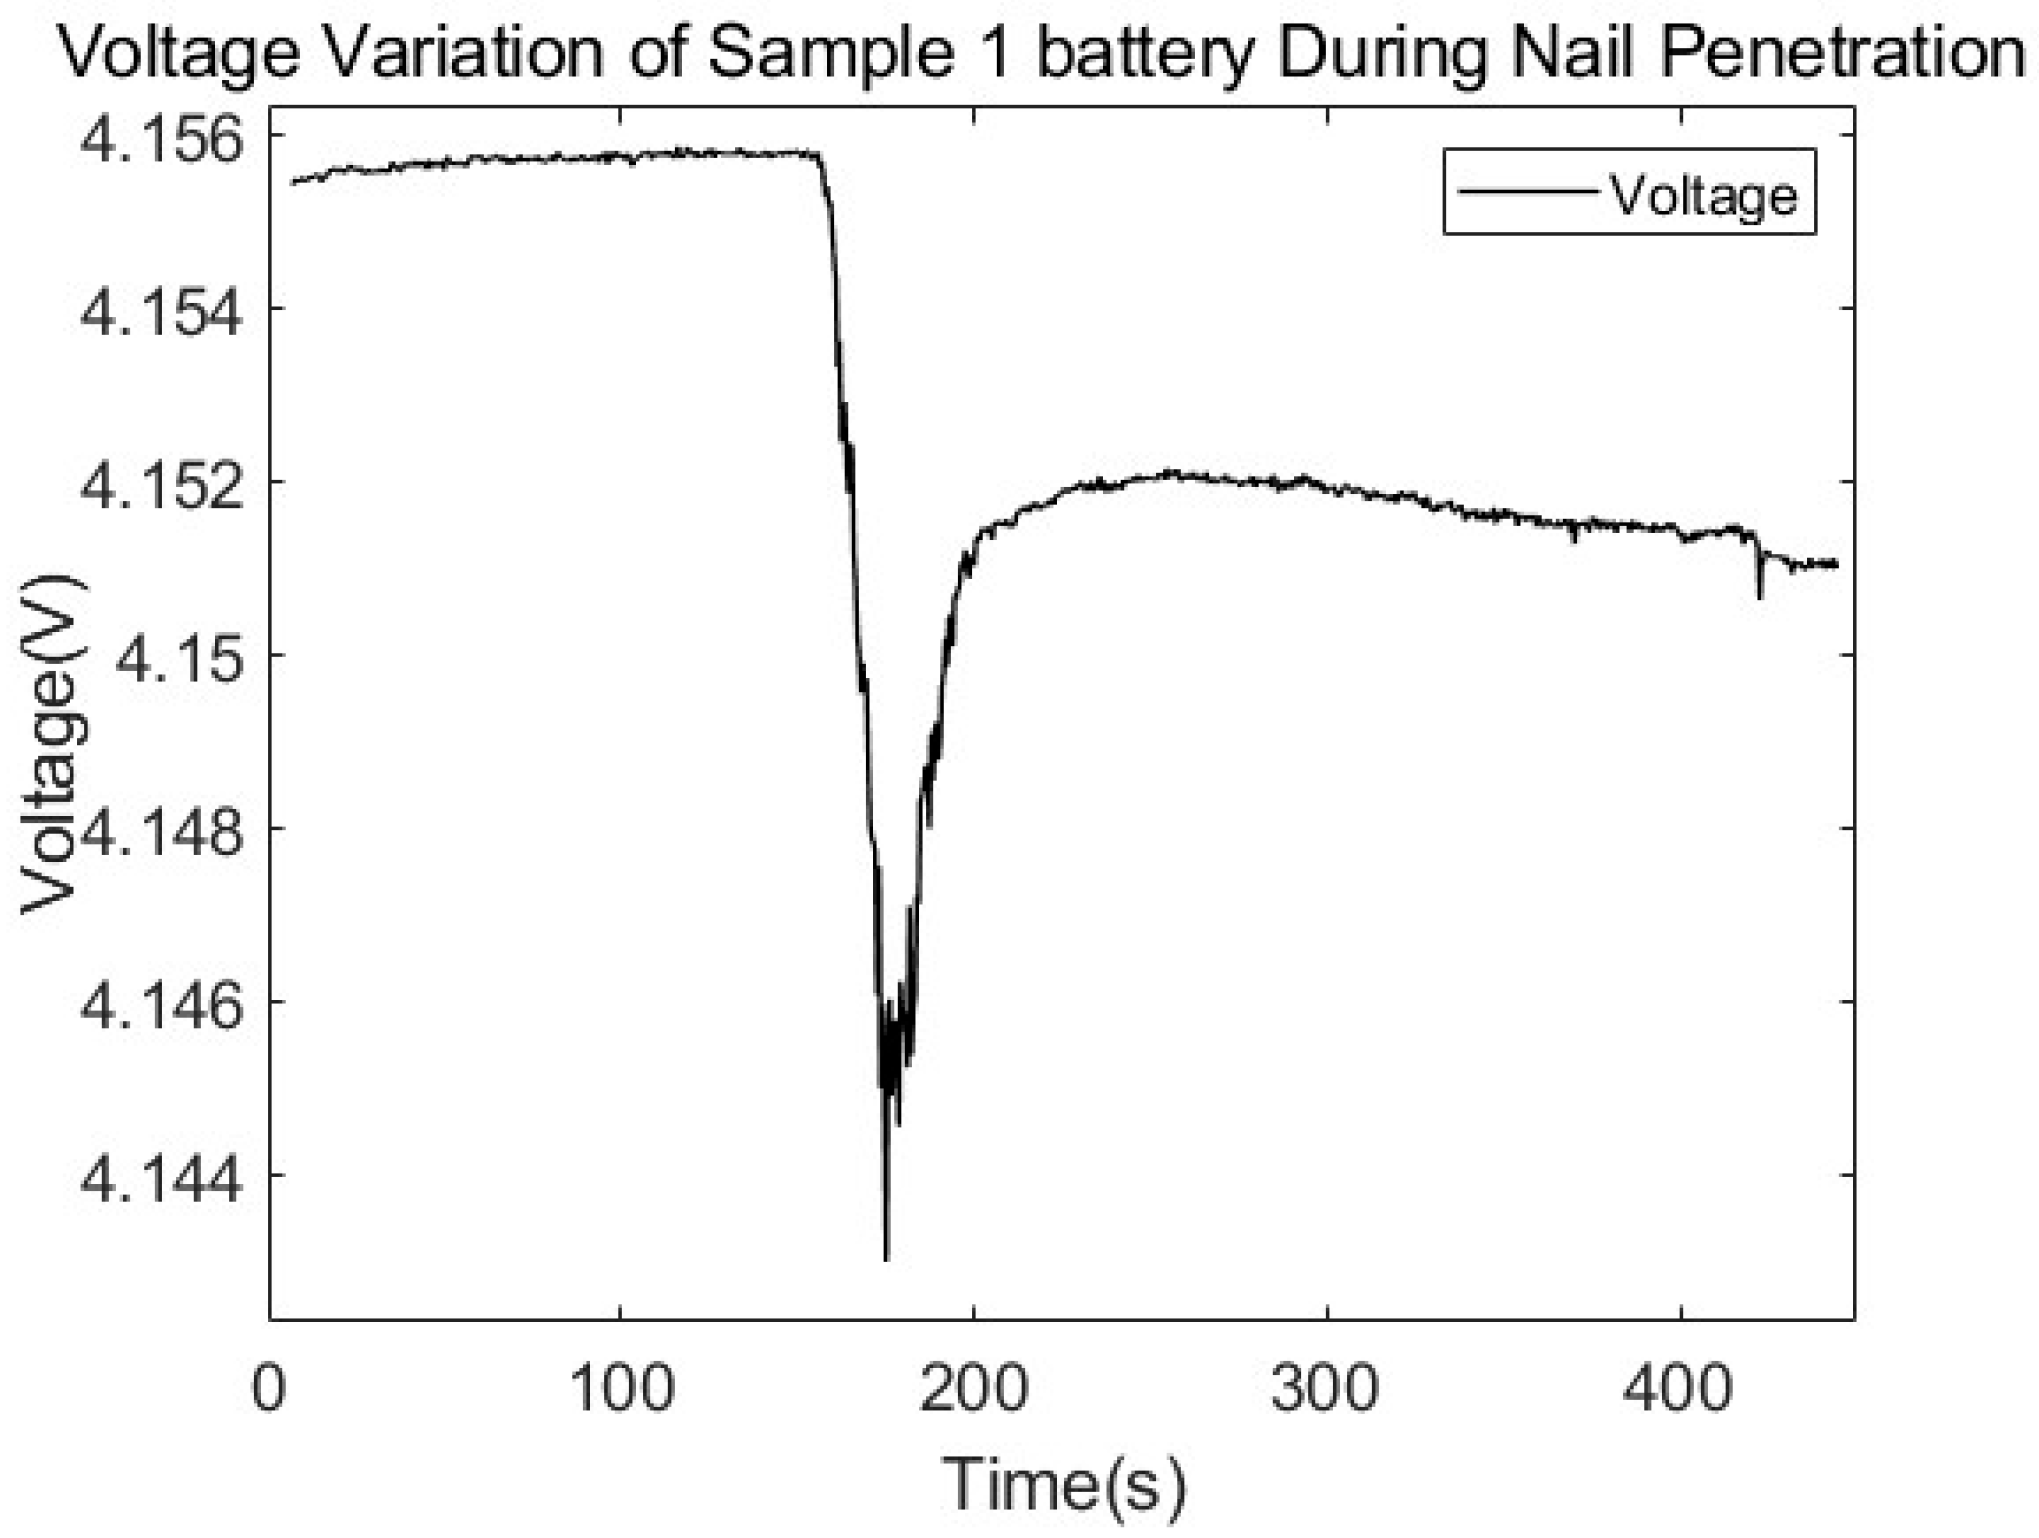
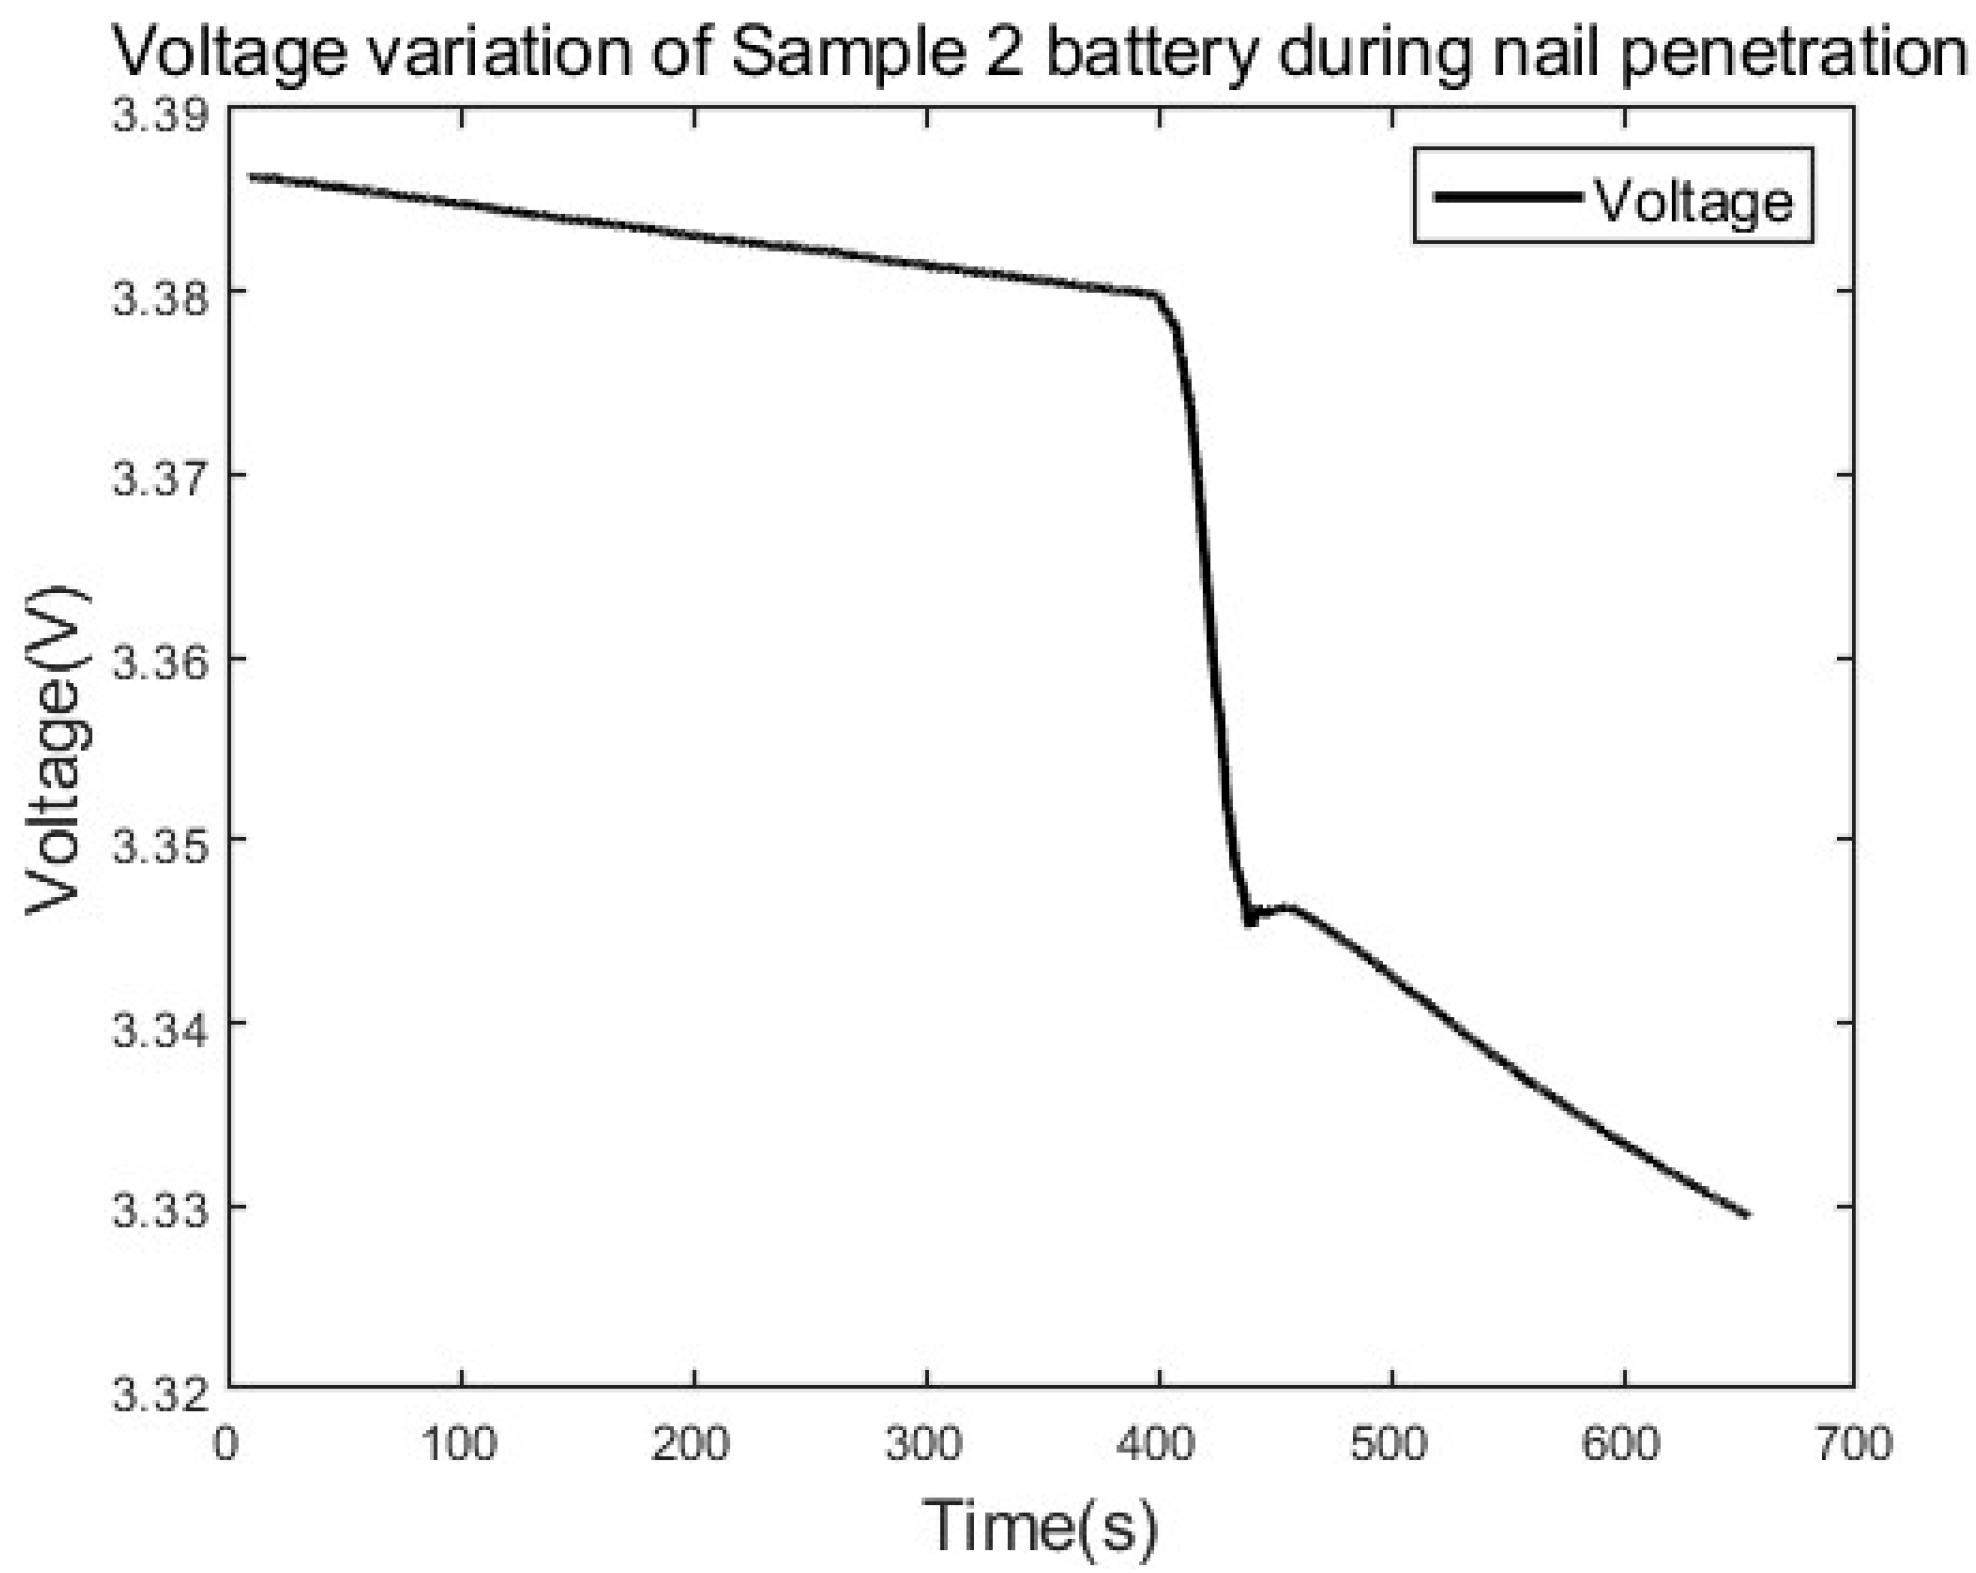
Time-domain voltage data of the battery before and after nail penetration is shown in Figure 13 and Figure 14. After nail penetration, the cell voltage drops sharply, then recovers slightly, and finally decreases slowly below the initial voltage.

4. Discussion

4.1. Mechanism Analysis and Simulation Verification of Nail Penetration

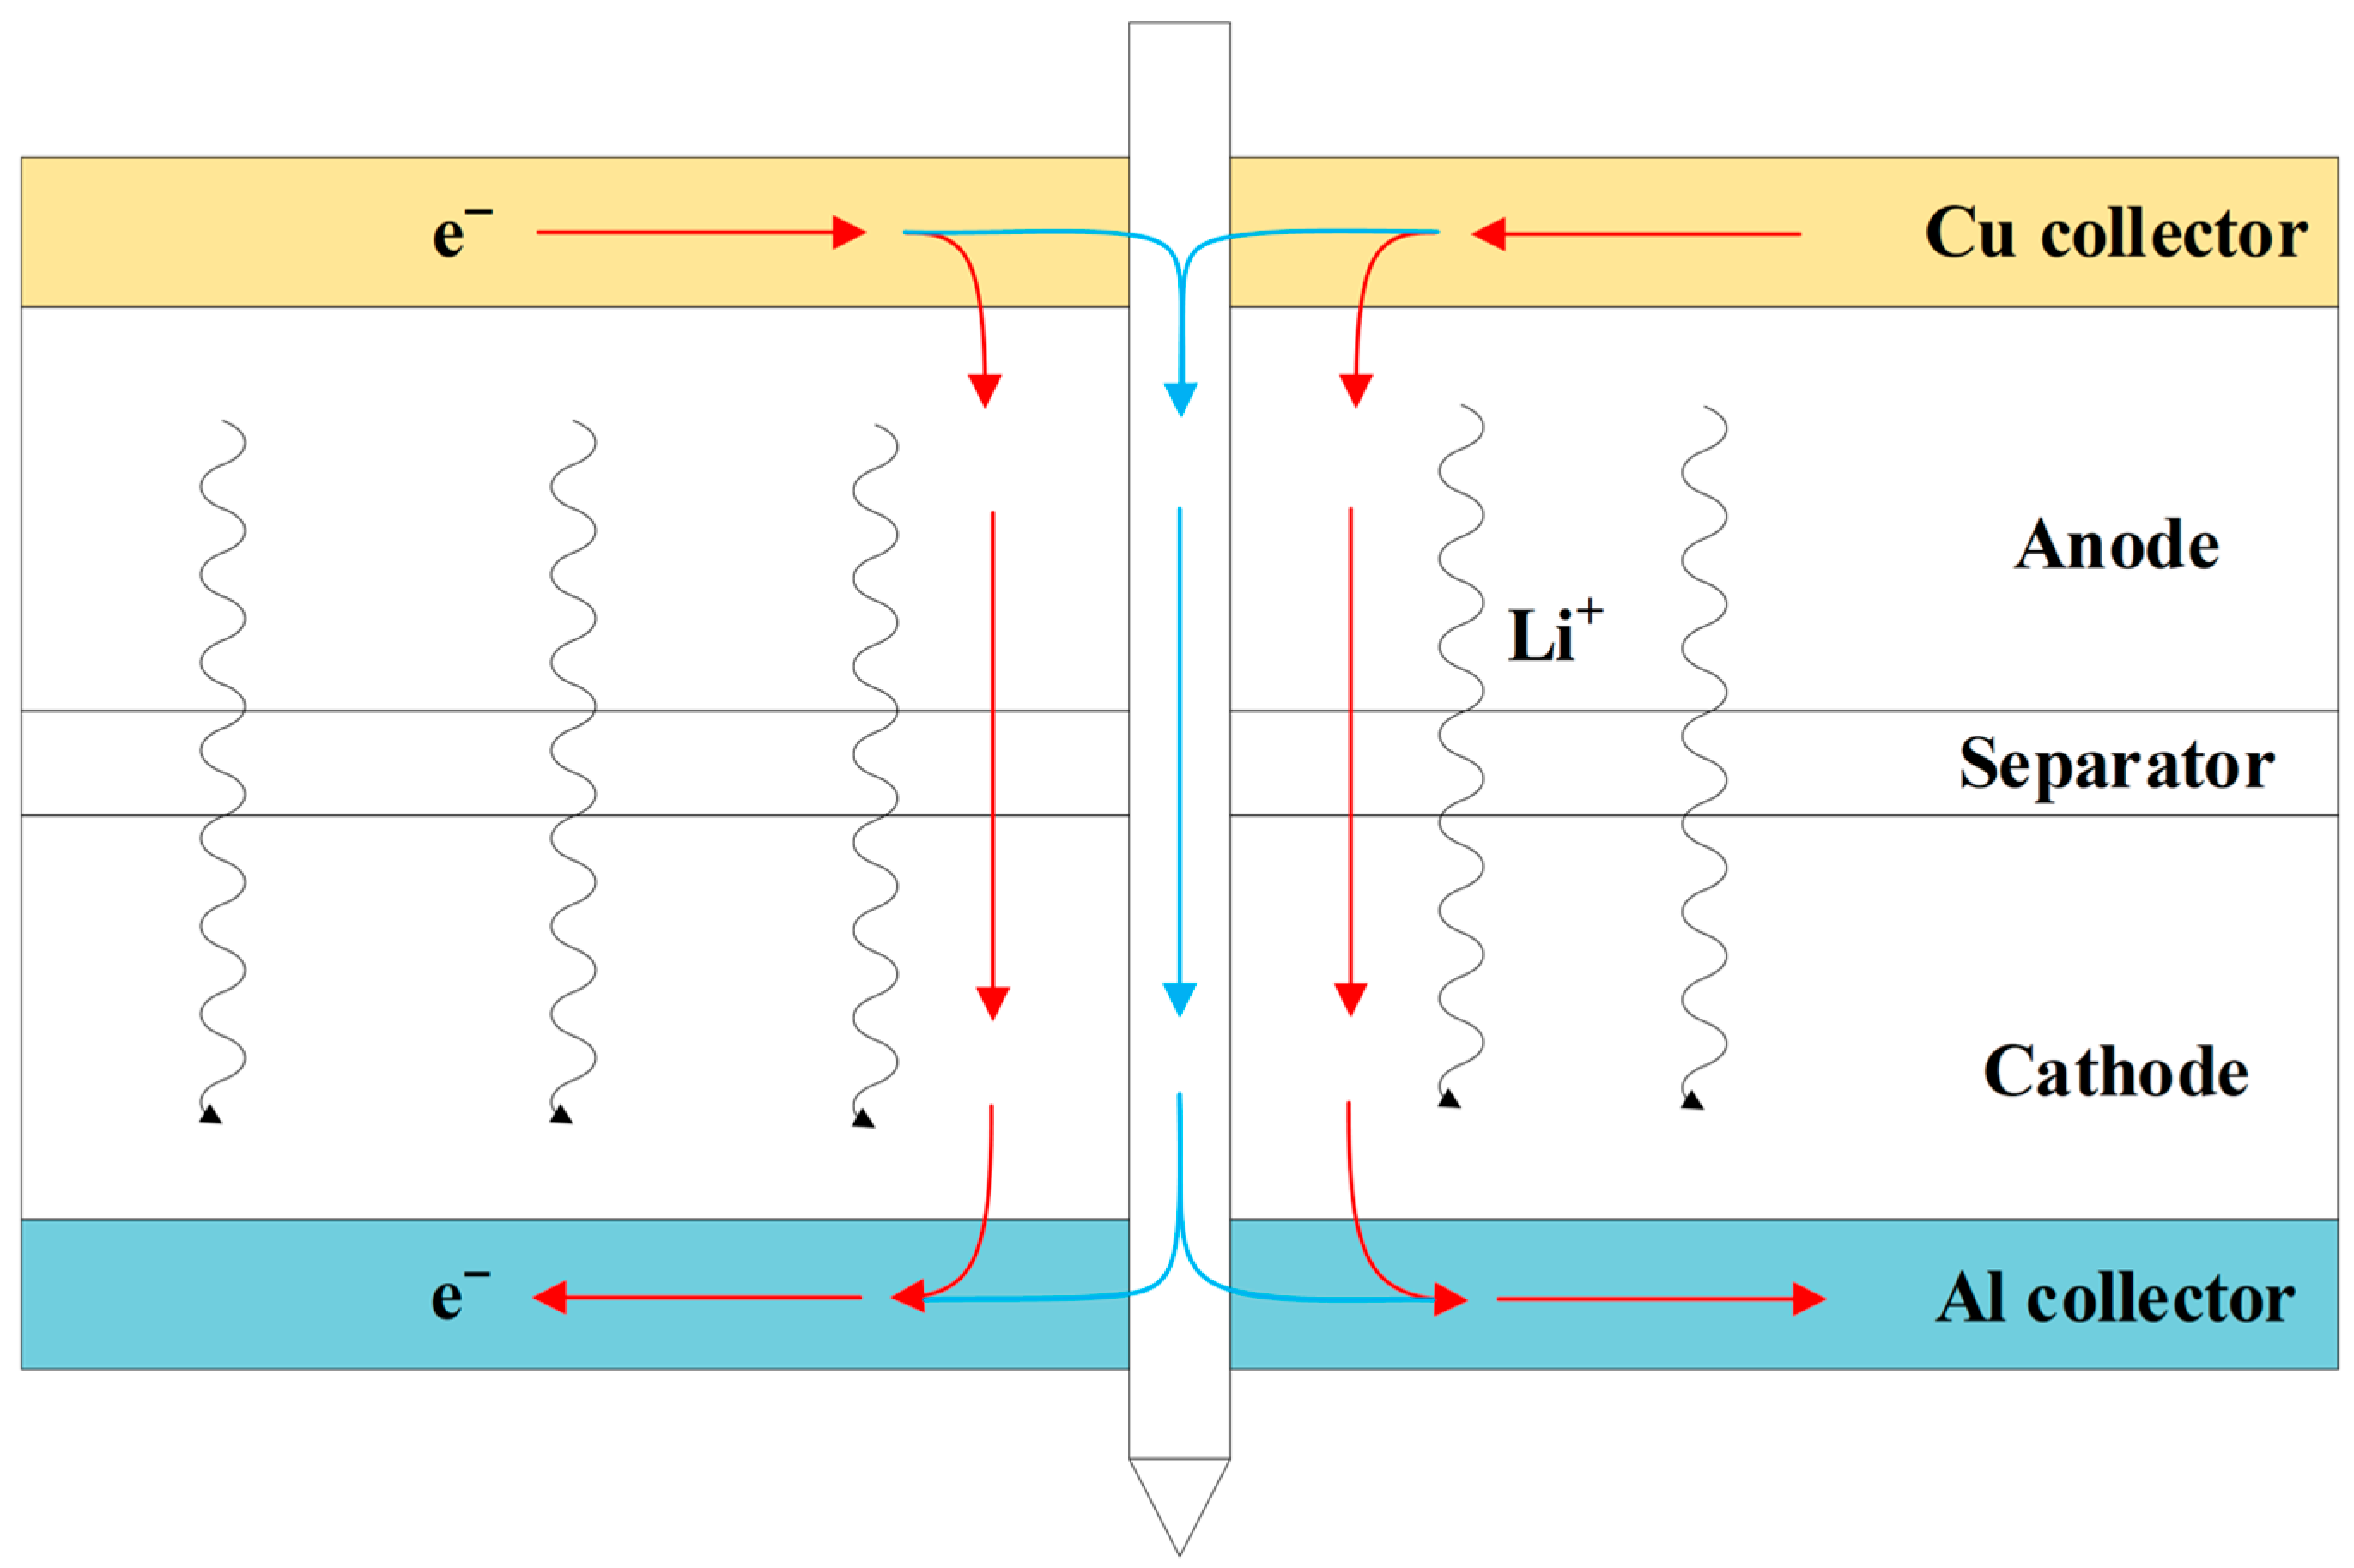
During the battery nail penetration test, the evolution of its internal structure is illustrated in Figure 15. When the steel needle fully penetrates the positive and negative electrodes of the battery, it establishes a low-impedance metallic conductive path inside the battery, forming a parallel shunt relationship with the original normal electrochemical pathway.
At this moment, the current splits into two branches: one branch travels along the original path, successively undergoing electrochemical processes including ion transport in the electrolyte and charge transfer at the electrode interface; the other branch directly connects the positive and negative electrodes through the steel needle, forming a short-circuit branch dominated by pure electrical conduction. These two branches are electrically parallel to each other, jointly constituting the overall equivalent circuit of the battery after nail penetration.
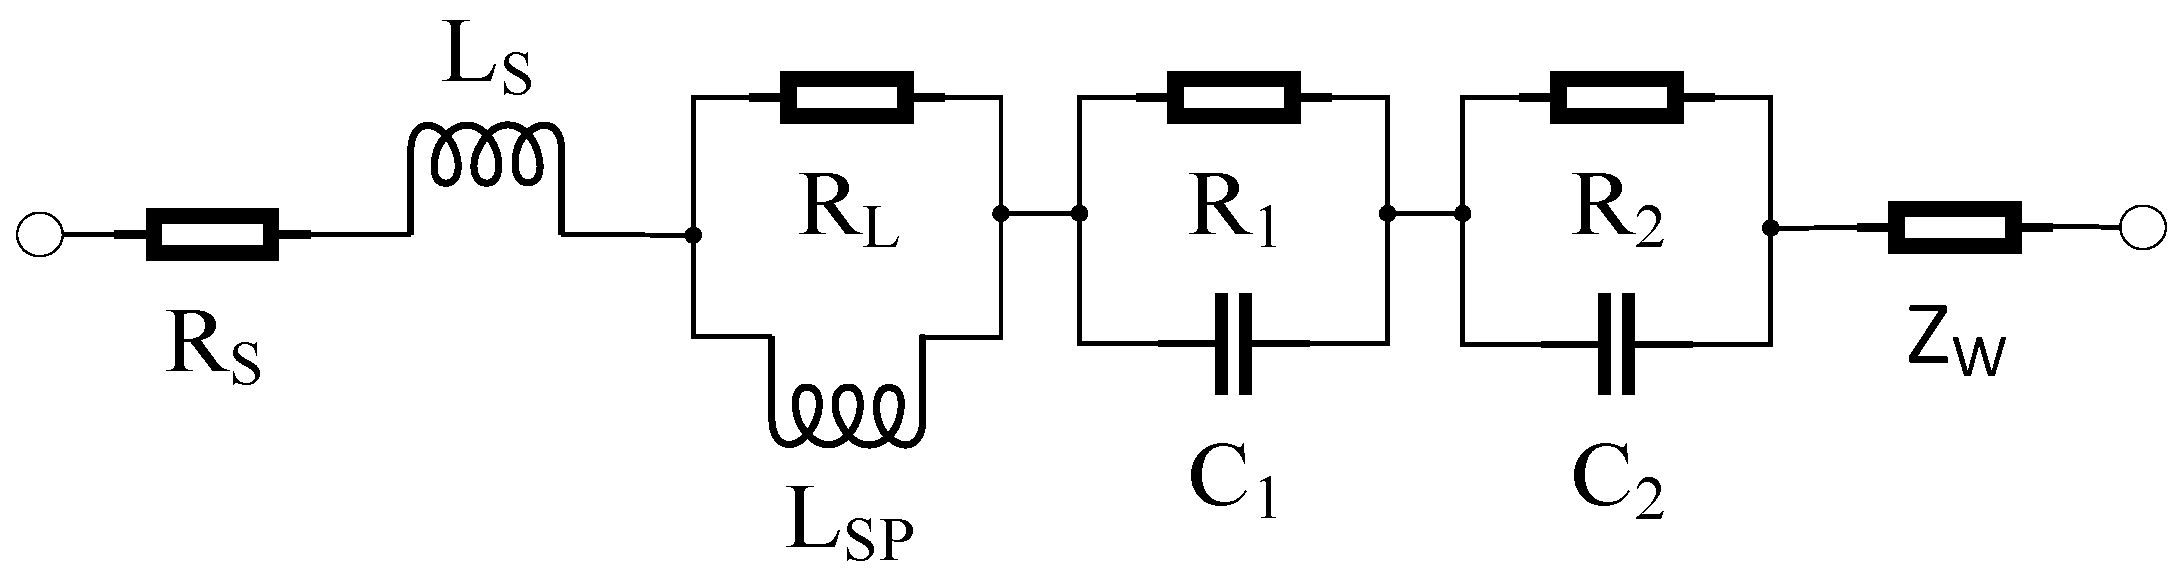
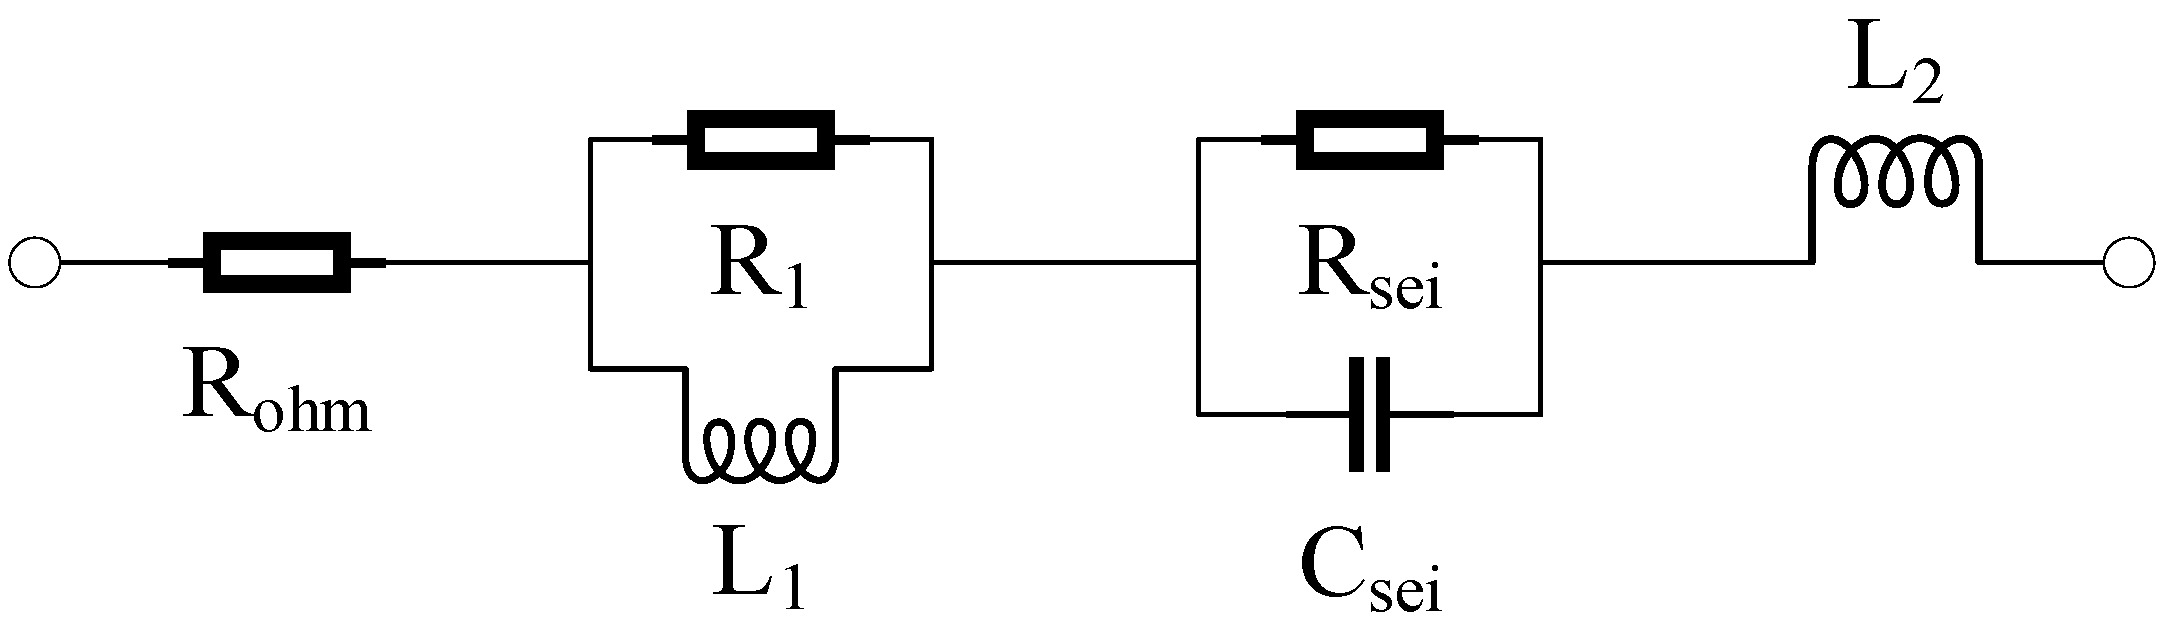
Under normal operating conditions, the battery impedance spectra can be modeled using the equivalent circuit shown in Figure 16 below, where represents the ohmic resistance. The branch along with the series inductor accounts for the inductive reactance component of the impedance. The branch is associated with the SEI film, charge transfer resistance, and electric double-layer capacitance, while the Warburg element simulates the diffusion phenomenon [30].
During battery charge and discharge, the current sequentially passes through the external circuit, tabs, current collectors, SEI film, electrode–electrolyte interface, and active material. Each physical process corresponds to an individual impedance element; thus, these elements are connected in series along the current path to fit the impedance corresponding to the battery’s electrochemical processes.
However, this study mainly focuses on the battery impedance within the 50–1000 Hz frequency range, which does not involve the low-frequency diffusion process of the battery. Therefore, the simplified model is illustrated in Figure 17 below, based on which further analysis of the impedance characteristics is conducted.
The model comprises a parallel RL unit, a parallel RC unit, an ohmic resistance element, and a series inductance unit. Each unit corresponds to the impedance contribution from different time scales or distinct physical mechanisms within the battery. The model impedance is given by Equation (2) below.
Z n o r = R o h m + Z R L 1 + Z R C s e i + Z L
R o h m represents the resistance of the current collectors, electrolyte, and connection parts.
The RL unit represents the contact interface properties between the electrode material and current collector. The resistance R 1 represents the ohmic contact resistance of the contact interface, reflecting the conduction resistance of current at the electrode-current collector interface. The inductance L 1 represents the parasitic inductance of the contact interface, which is introduced by factors such as the physical contact mode and wire connections between the electrode material and current collector, and reflects the electromagnetic induction effect at high frequencies. The impedance of this unit is given by Equation (3).
Z R L 1 = R 1 R 1 + j w · L 1
The RC unit represents the SEI film-related impedance. R s e i represents the transport resistance experienced by lithium ions when crossing the SEI film, and its value is directly related to the thickness, uniformity, and ionic conductivity of the SEI film. C s e i represents the electric double-layer charge storage behavior formed at the SEI film/electrode interface, and its capacitance value can reflect the effective electrode interface area and the dielectric properties of the film layer. The impedance of this unit is given by Equation (4).
Z R C s e i = R s e i 1 + j w · R s e i C s e i
The inductance L 2 simulates the parasitic inductance effect caused by the wires, fixtures in the test system and the current collector structure inside the battery, and its impedance expression is shown in Equation (5) below.
Z L = j w · L
Accordingly, the impedance expression (2) of the battery fractional-order model under normal operating conditions can be transformed into Equation (6).
Z n o r = R o h m + R 1 R 1 + j w · L 1 + R s e i 1 + j w · R s e i C s e i + j w · L 2
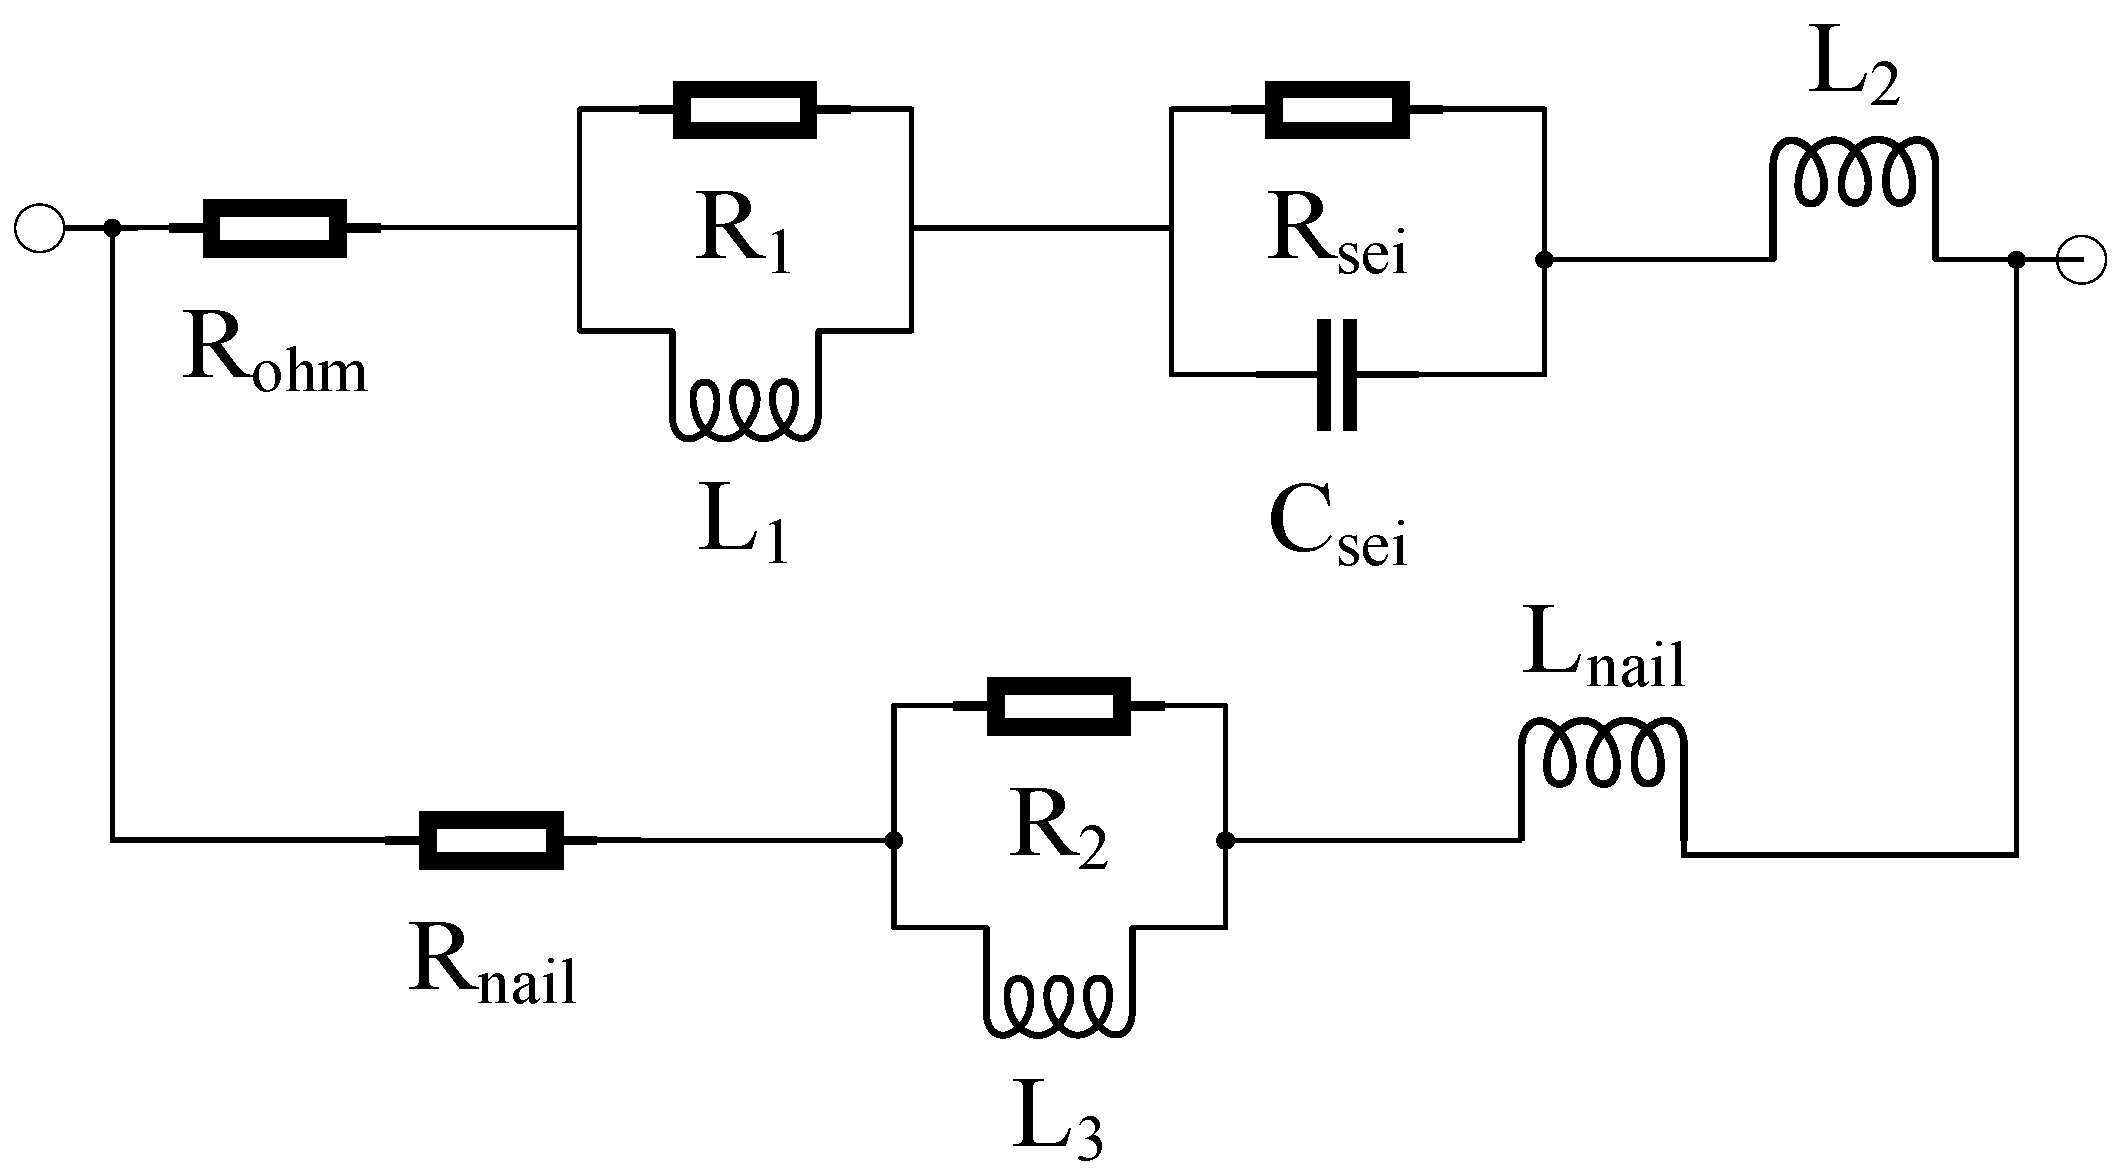
Based on the internal structure diagram of the battery after nail penetration as shown in Figure 18, a fractional-order equivalent circuit model for the battery post-penetration is obtained by adding a parallel branch to the fractional-order model under normal operating conditions. From the perspective of physical mechanism, the steel needle, as an excellent conductor, possesses inherent ohmic impedance. Meanwhile, the steel needle forms a closed metallic loop with the internal current collectors, exhibiting a significant inductive effect under the alternating excitation of current. Therefore, this study adopts a combination of ohmic resistance and inductor to fully characterize the electrical properties of the short-circuit branch caused by nail penetration. A parallel branch with an impedance denoted as Z n a i l is added to the fractional-order model under normal operating conditions, yielding the fractional-order equivalent circuit model of the battery after nail penetration as shown in Figure 18.
This branch impedance consists of three components: a parallel RL module, a series inductive element, and an ohmic resistance, with its expression given by Equation (7) below.
Z n a i l = R n a i l + Z R L 3 + j w · L n a i l
Among them, the parallel RL module is used to describe the possible eddy current effect and unsteady magnetic coupling behavior at the contact interface between the steel nail and electrode material, and its inductive component reflects the induced voltage caused by the instantaneous current change at the moment of short circuit. Equation (7) can be transformed into Equation (8) according to the specific impedance expressions of each module.
Z n a i l = R n a i l + R 3 R 3 + j w · L 3 + j w · L n a i l
By paralleling Z n o r and Z n a i l , the total impedance of the fractional-order model after nail penetration is obtained and given by Equation (9).
1 Z a l l = 1 R o h m + R 1 R 1 + j w · L 1 + R s e i 1 + j w · R s e i C s e i + j w · L 2 + 1 R n a i l + R 3 R 3 + j w · L 3 + j w · L n a i l
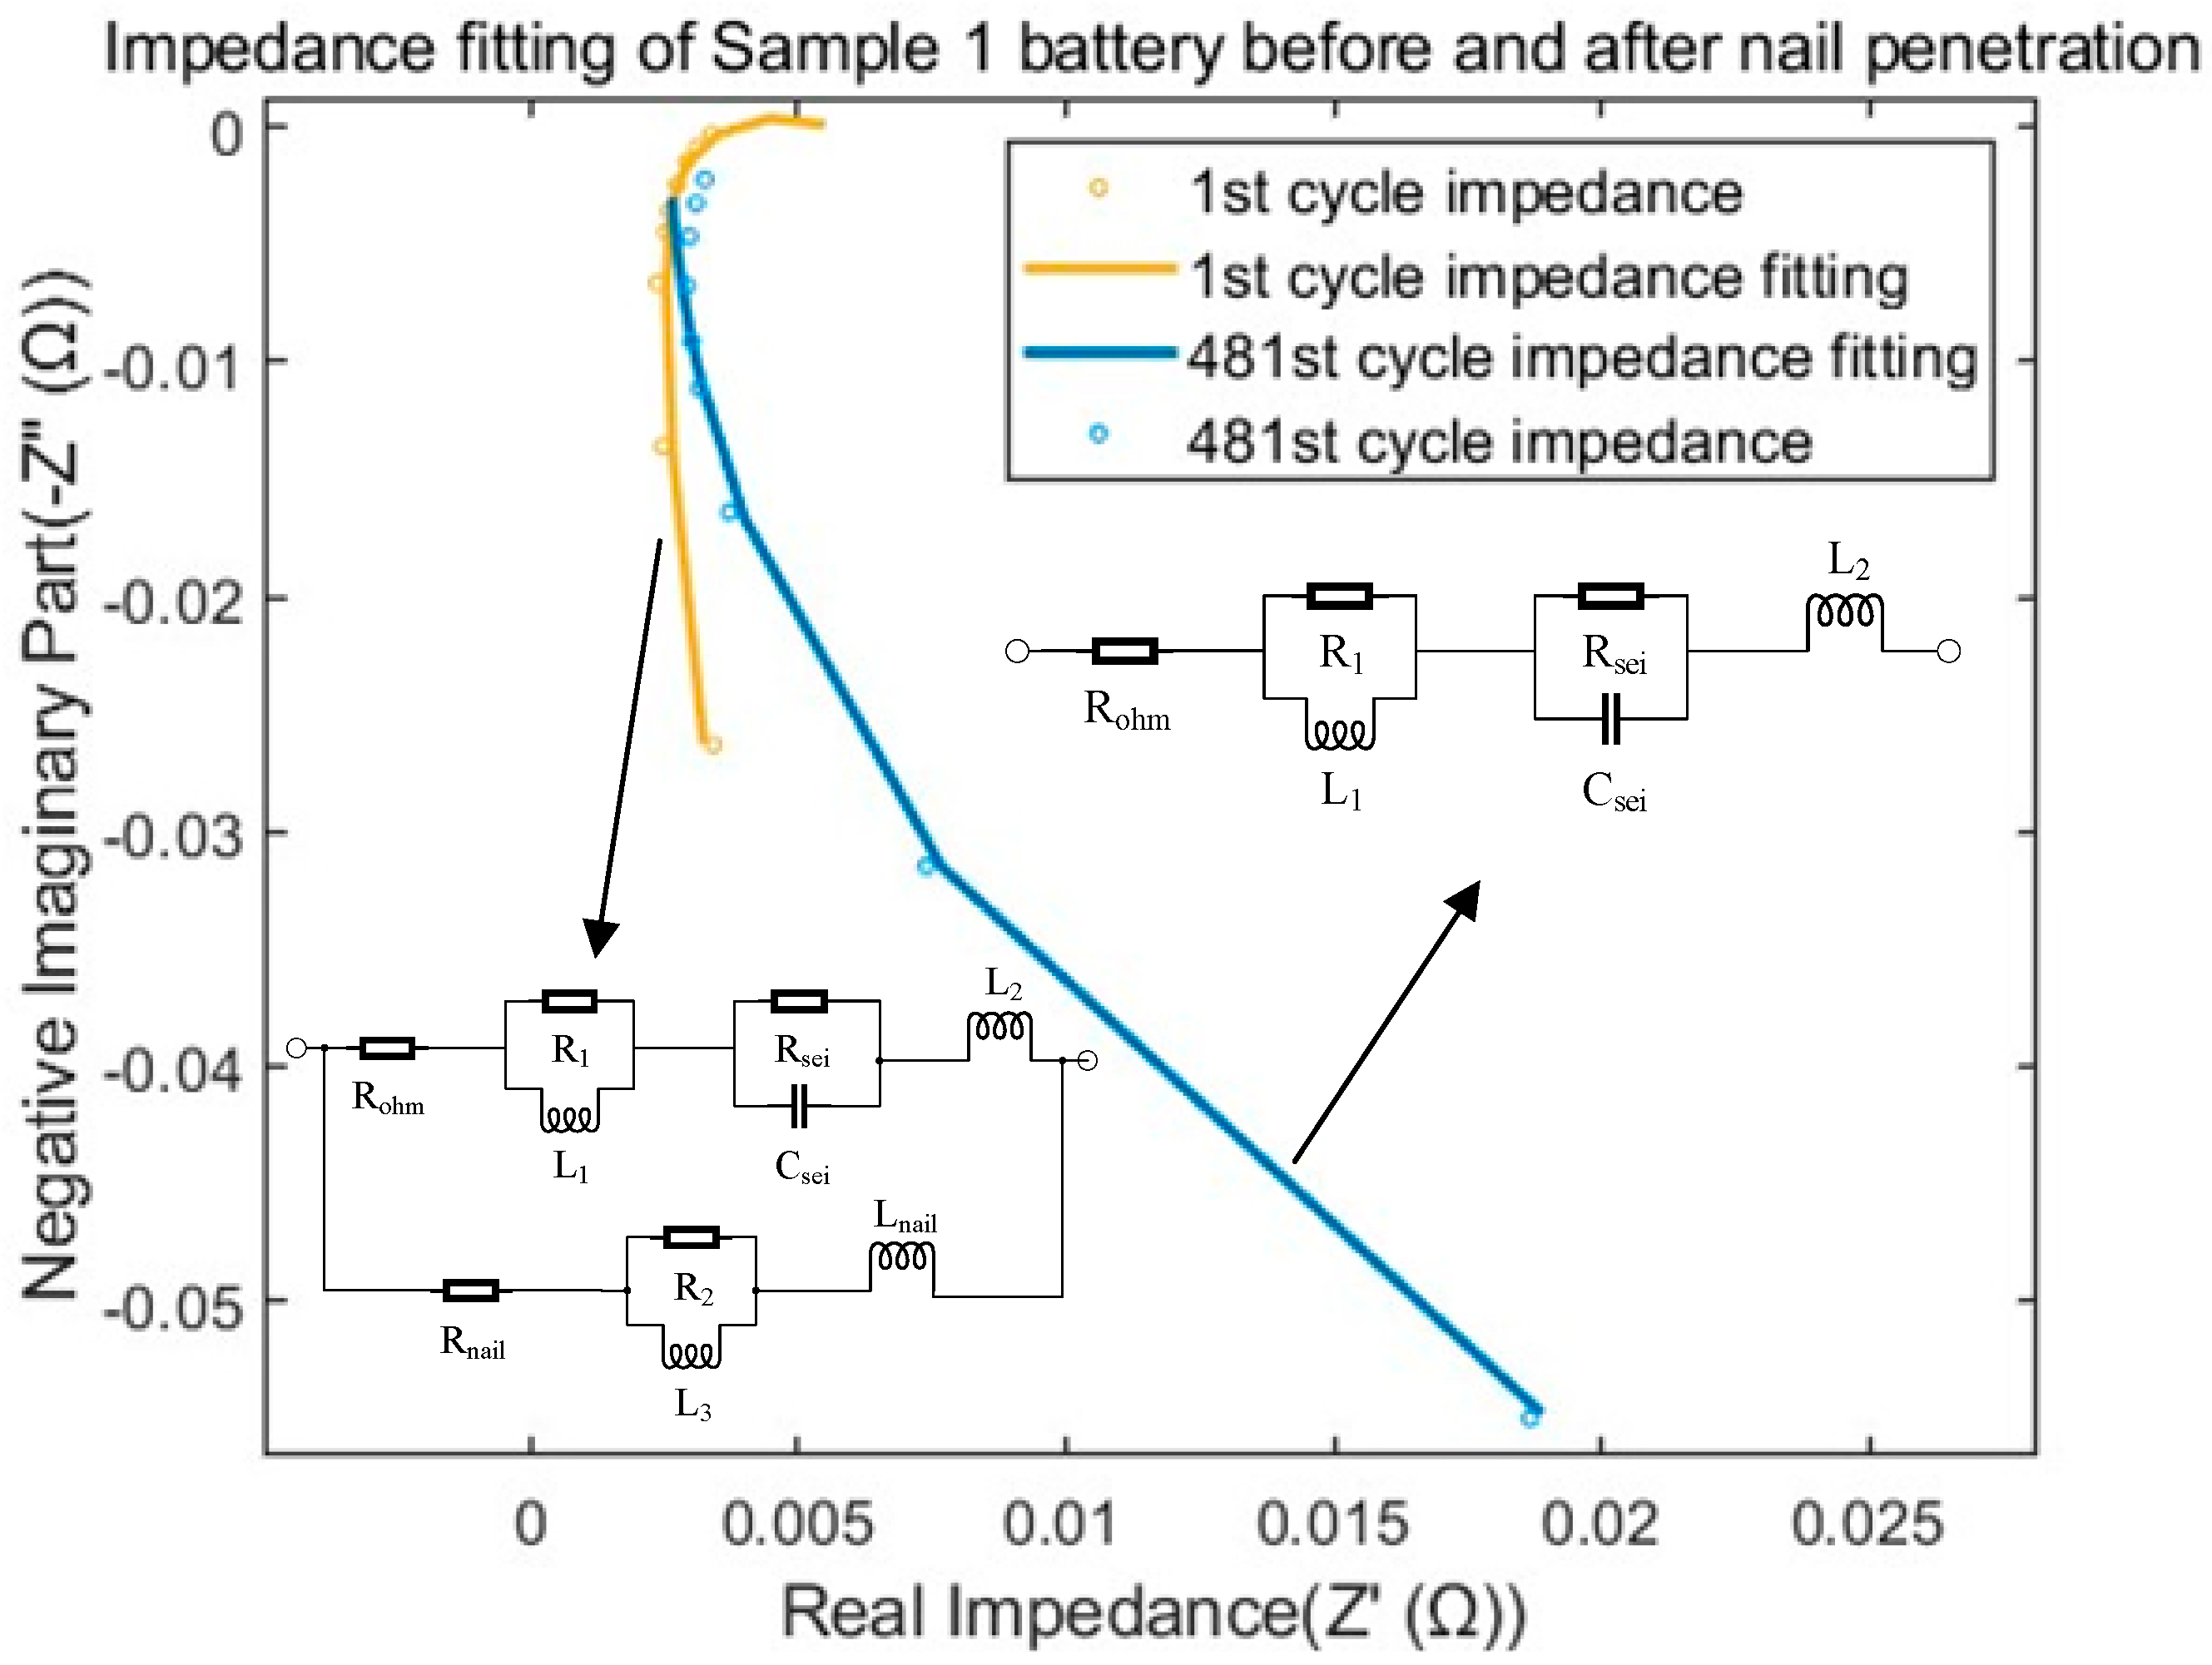
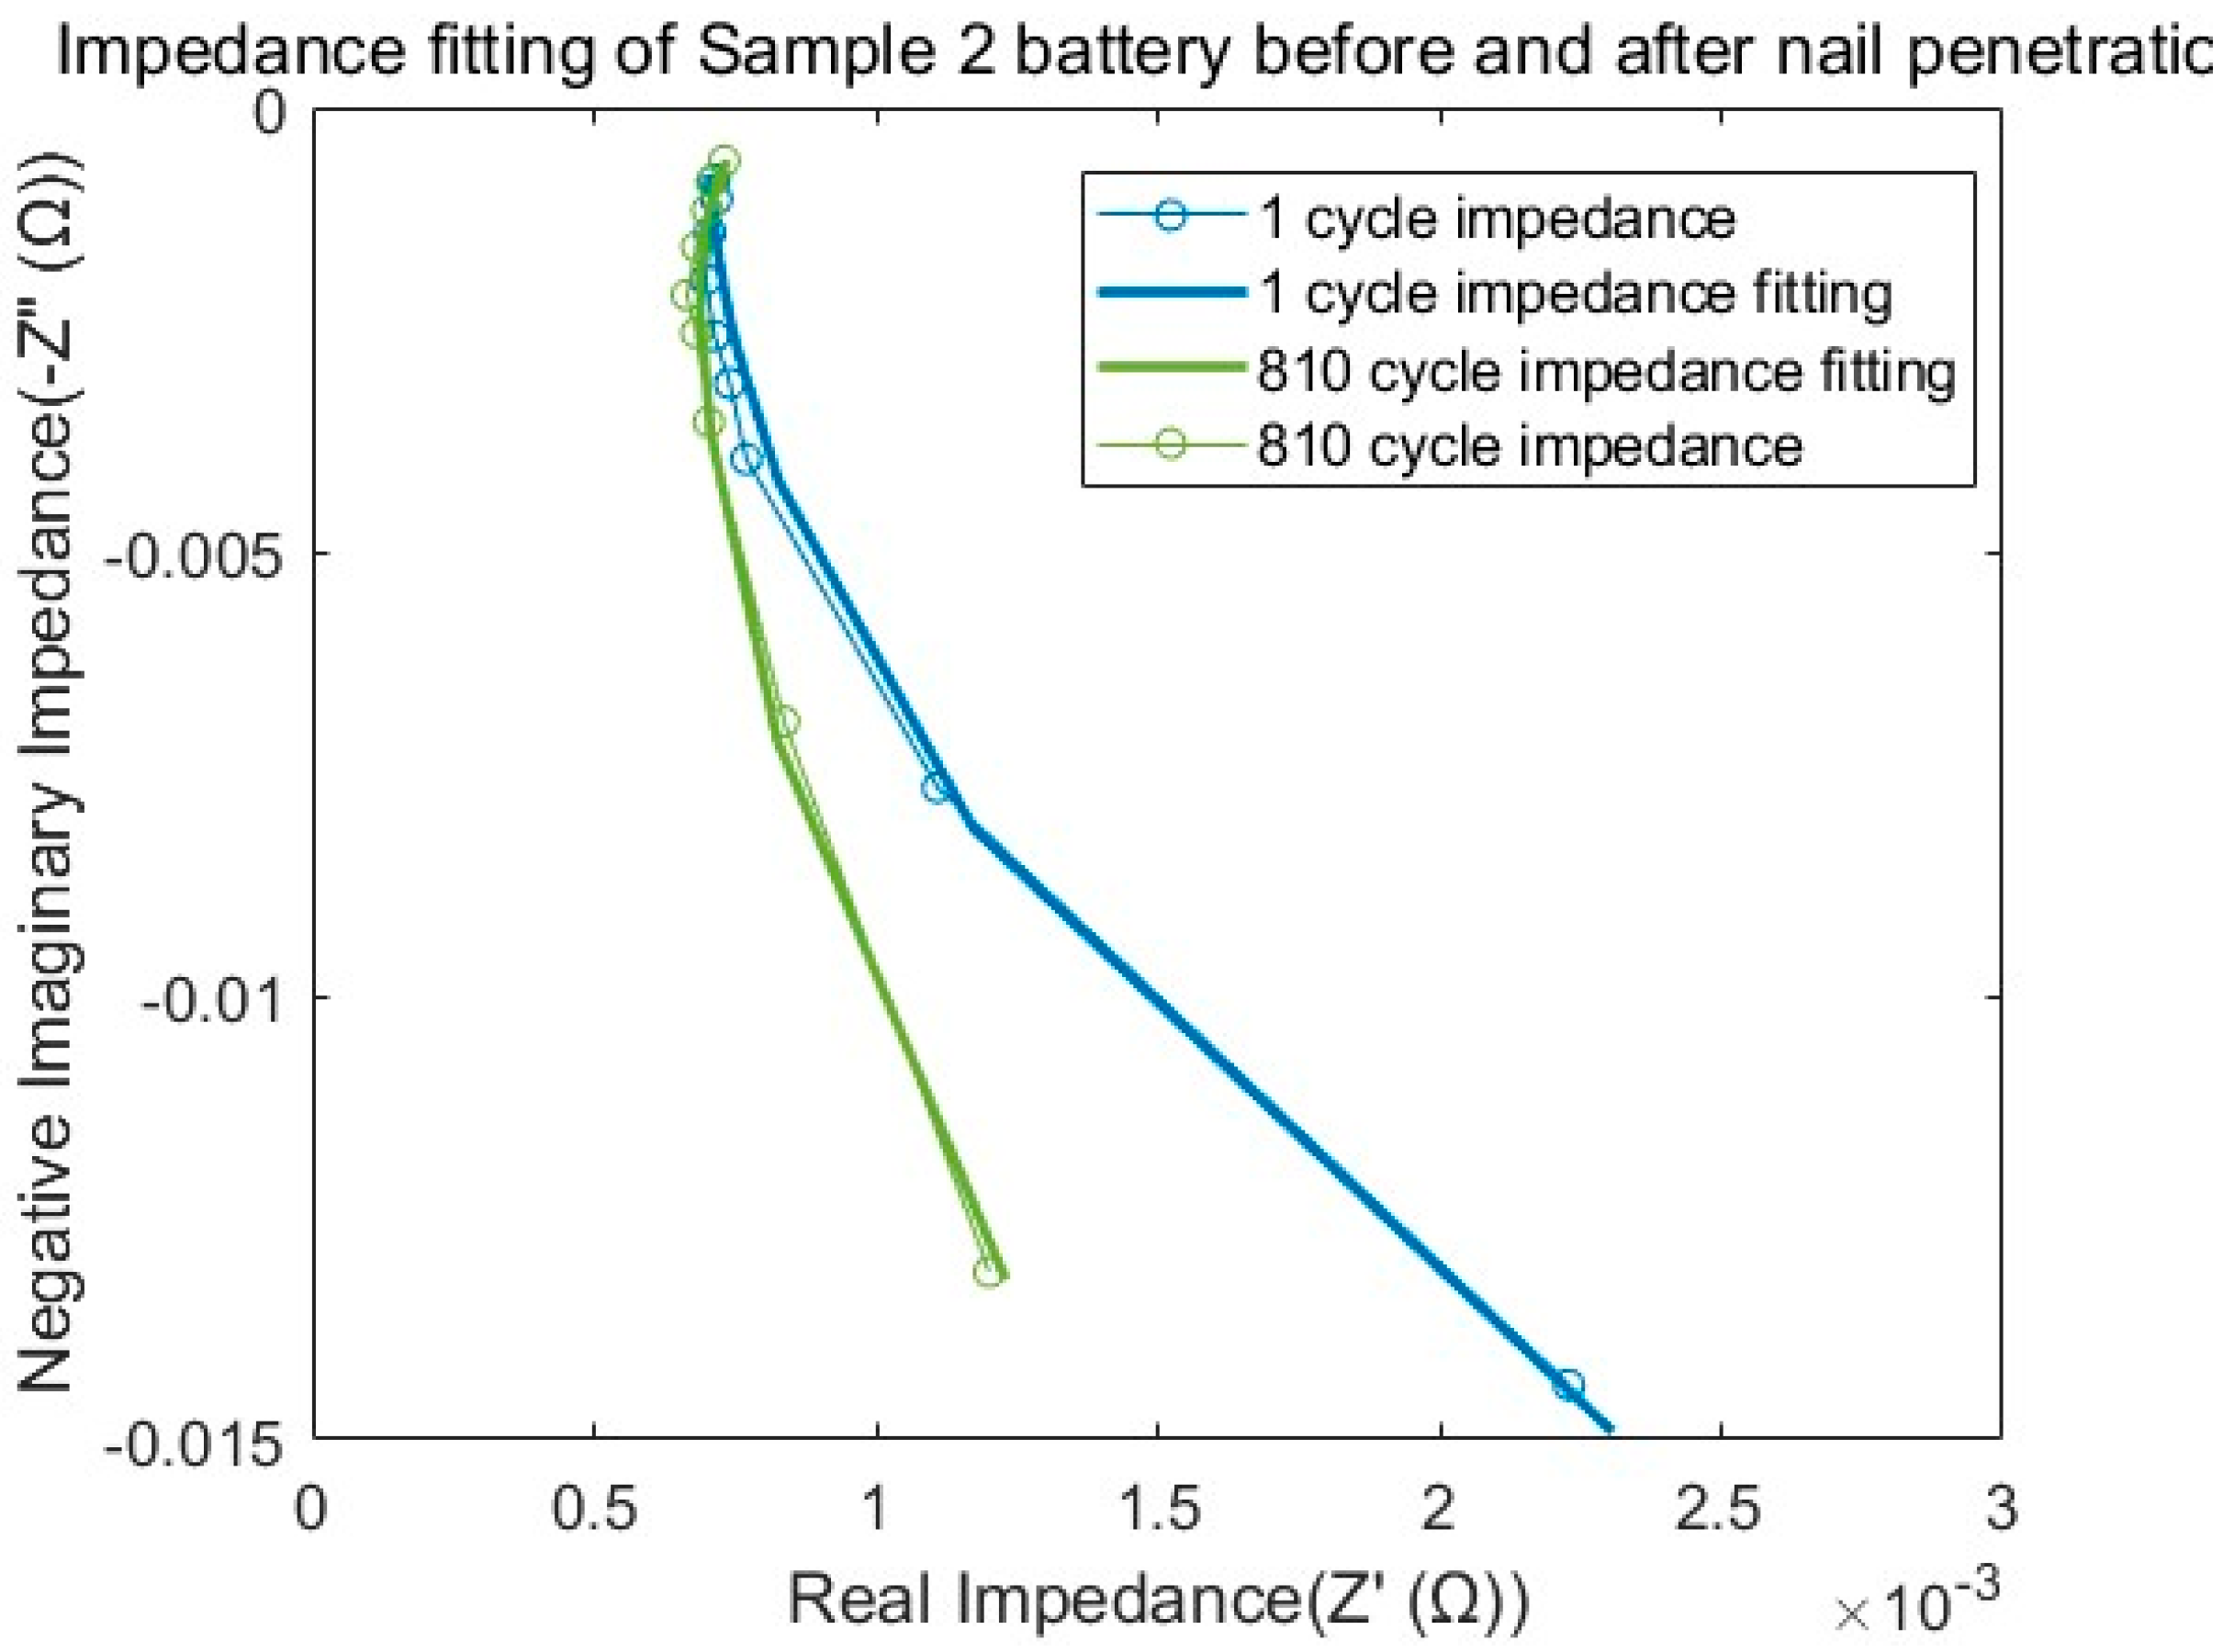
Based on the battery DEIS data extracted via FFT, parameter fitting was performed on the fractional-order equivalent circuit models of the batteries before and after nail penetration. The fitted parameters are listed in Table 4 and Table 5 below, and the corresponding fitting results are presented in Figure 19 and Figure 20. According to the fitted parameters and equivalent circuit diagrams, the inductive reactance of the circuits before and after penetration were obtained.
Within the frequency range of 50–1000 Hz, the inductive reactance range of the Sample 1 battery before nail penetration is 0.0184 0.368   Ω , while that after nail penetration is 5.3 × 10 3 0.106   Ω . For the Sample 2 battery, the inductive reactance range before penetration is 7.3 × 10 3 0.0147   Ω , while that after nail penetration is 5.85 × 10 4 0.0137   Ω .
The total inductance of the system exhibits a reduction of varying degrees after nail penetration, indicating that the metallic loop introduced by the steel needle does exert a certain inductive effect on the original circuit. It can be observed from the data in Table 4 and Table 5 that the total inductance in the equivalent circuit model decreases.
Under normal operating conditions, the root mean square error (RMSE) of the real part fitting for Sample 1 battery is only 0.03%, the RMSE of the imaginary part fitting is 4.50%, and the RMSE of the impedance magnitude fitting is 0.02%. For Sample 2 battery, the RMSE of the real part fitting is only 0.0004%, the RMSE of the imaginary part fitting is 1.17%, and the RMSE of the impedance magnitude fitting is 0.03%. After nail penetration, the RMSE of the real part fitting for Sample 1 battery is 0.06%, the RMSE of the imaginary part fitting is 2.27%, and the RMSE of the impedance magnitude fitting is 0.30%. For Sample 2 battery, the RMSE of the real part fitting is 0.0015%, the RMSE of the imaginary part fitting is 1.05%, and the RMSE of the impedance magnitude fitting is 0.013%. All errors are relatively small, demonstrating that the experimental impedance curves can be reproduced with high accuracy, thereby validating the reliability of the proposed model. These results indicate that the steel nail itself exhibits both resistive and inductive characteristics. When the nail completely penetrates the battery, forming an internal short-circuit path between the positive and negative electrodes, its equivalent impedance is incorporated into the original impedance network of the battery in parallel.
Further analysis of the fitting results reveals a significant change in the morphology of the battery’s impedance spectrum after the nail penetration test. The introduction of the steel nail’s impedance in parallel alters the overall impedance structure of the system, and its shunt effect causes the inductive response, ohmic internal resistance and interfacial contact impedance inherent to the battery to be partially offset or masked. This coupling mechanism leads to an obvious decreasing trend in both the real and imaginary part values of the battery’s impedance spectrum after nail penetration. The reduction in the real part is mainly attributed to the short-circuit path sharing a portion of the current, thereby lowering the overall ohmic voltage drop. The decrease in the imaginary part is closely related to the offset effect of the parallel inductive reactance on the original inductive reactance components, which reflects the redistribution of impedance responses across multiple frequency bands.

4.2. Nail Penetration Detection Method

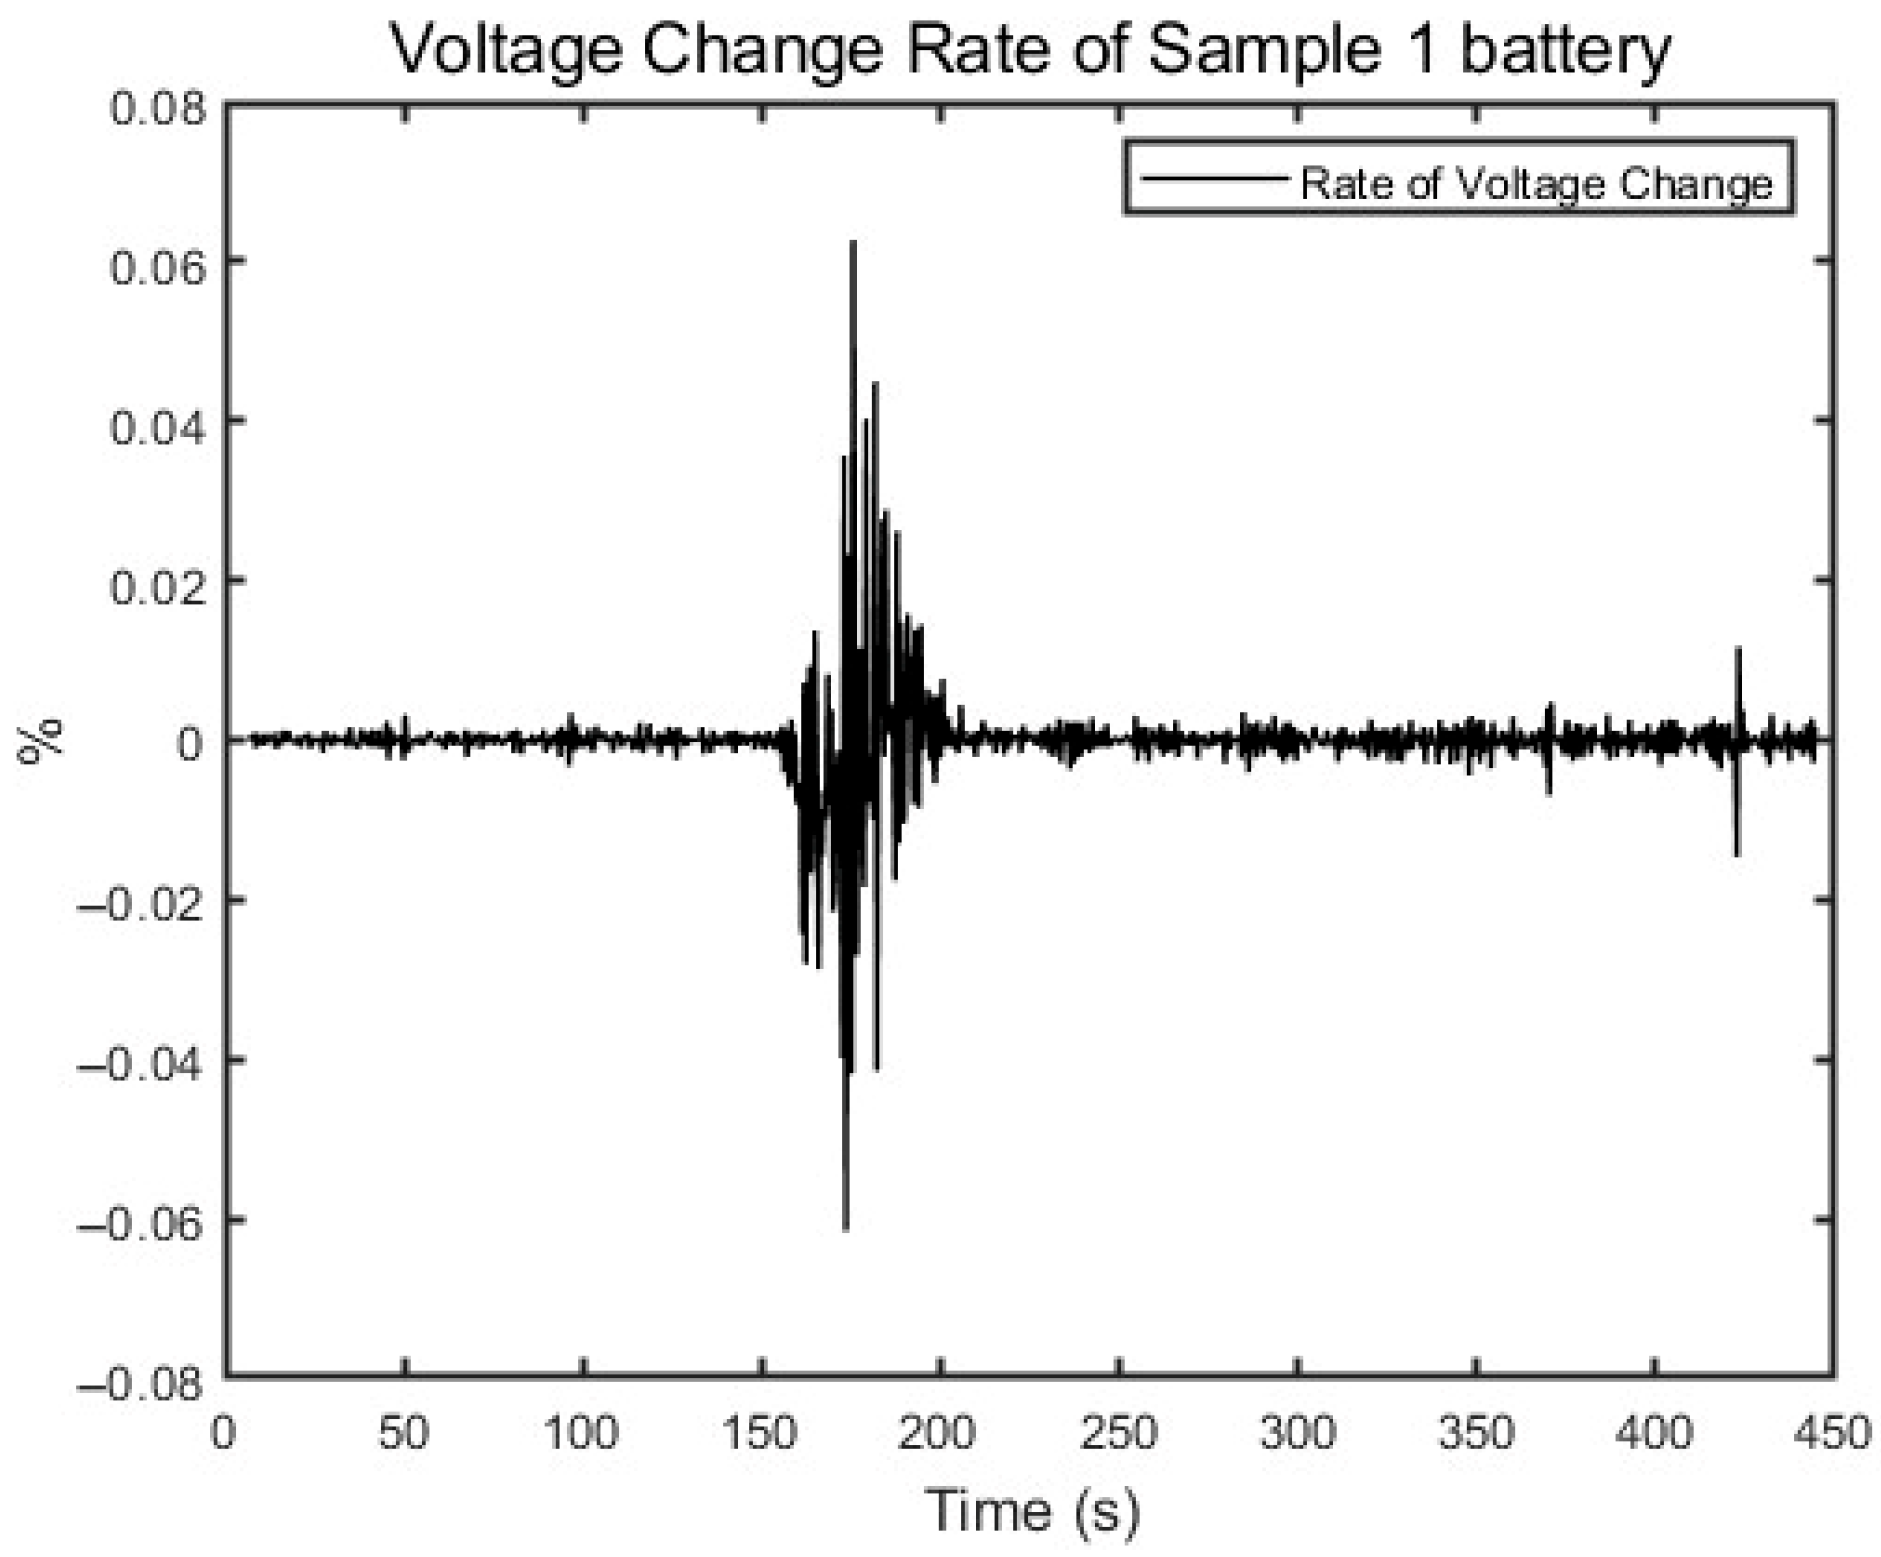
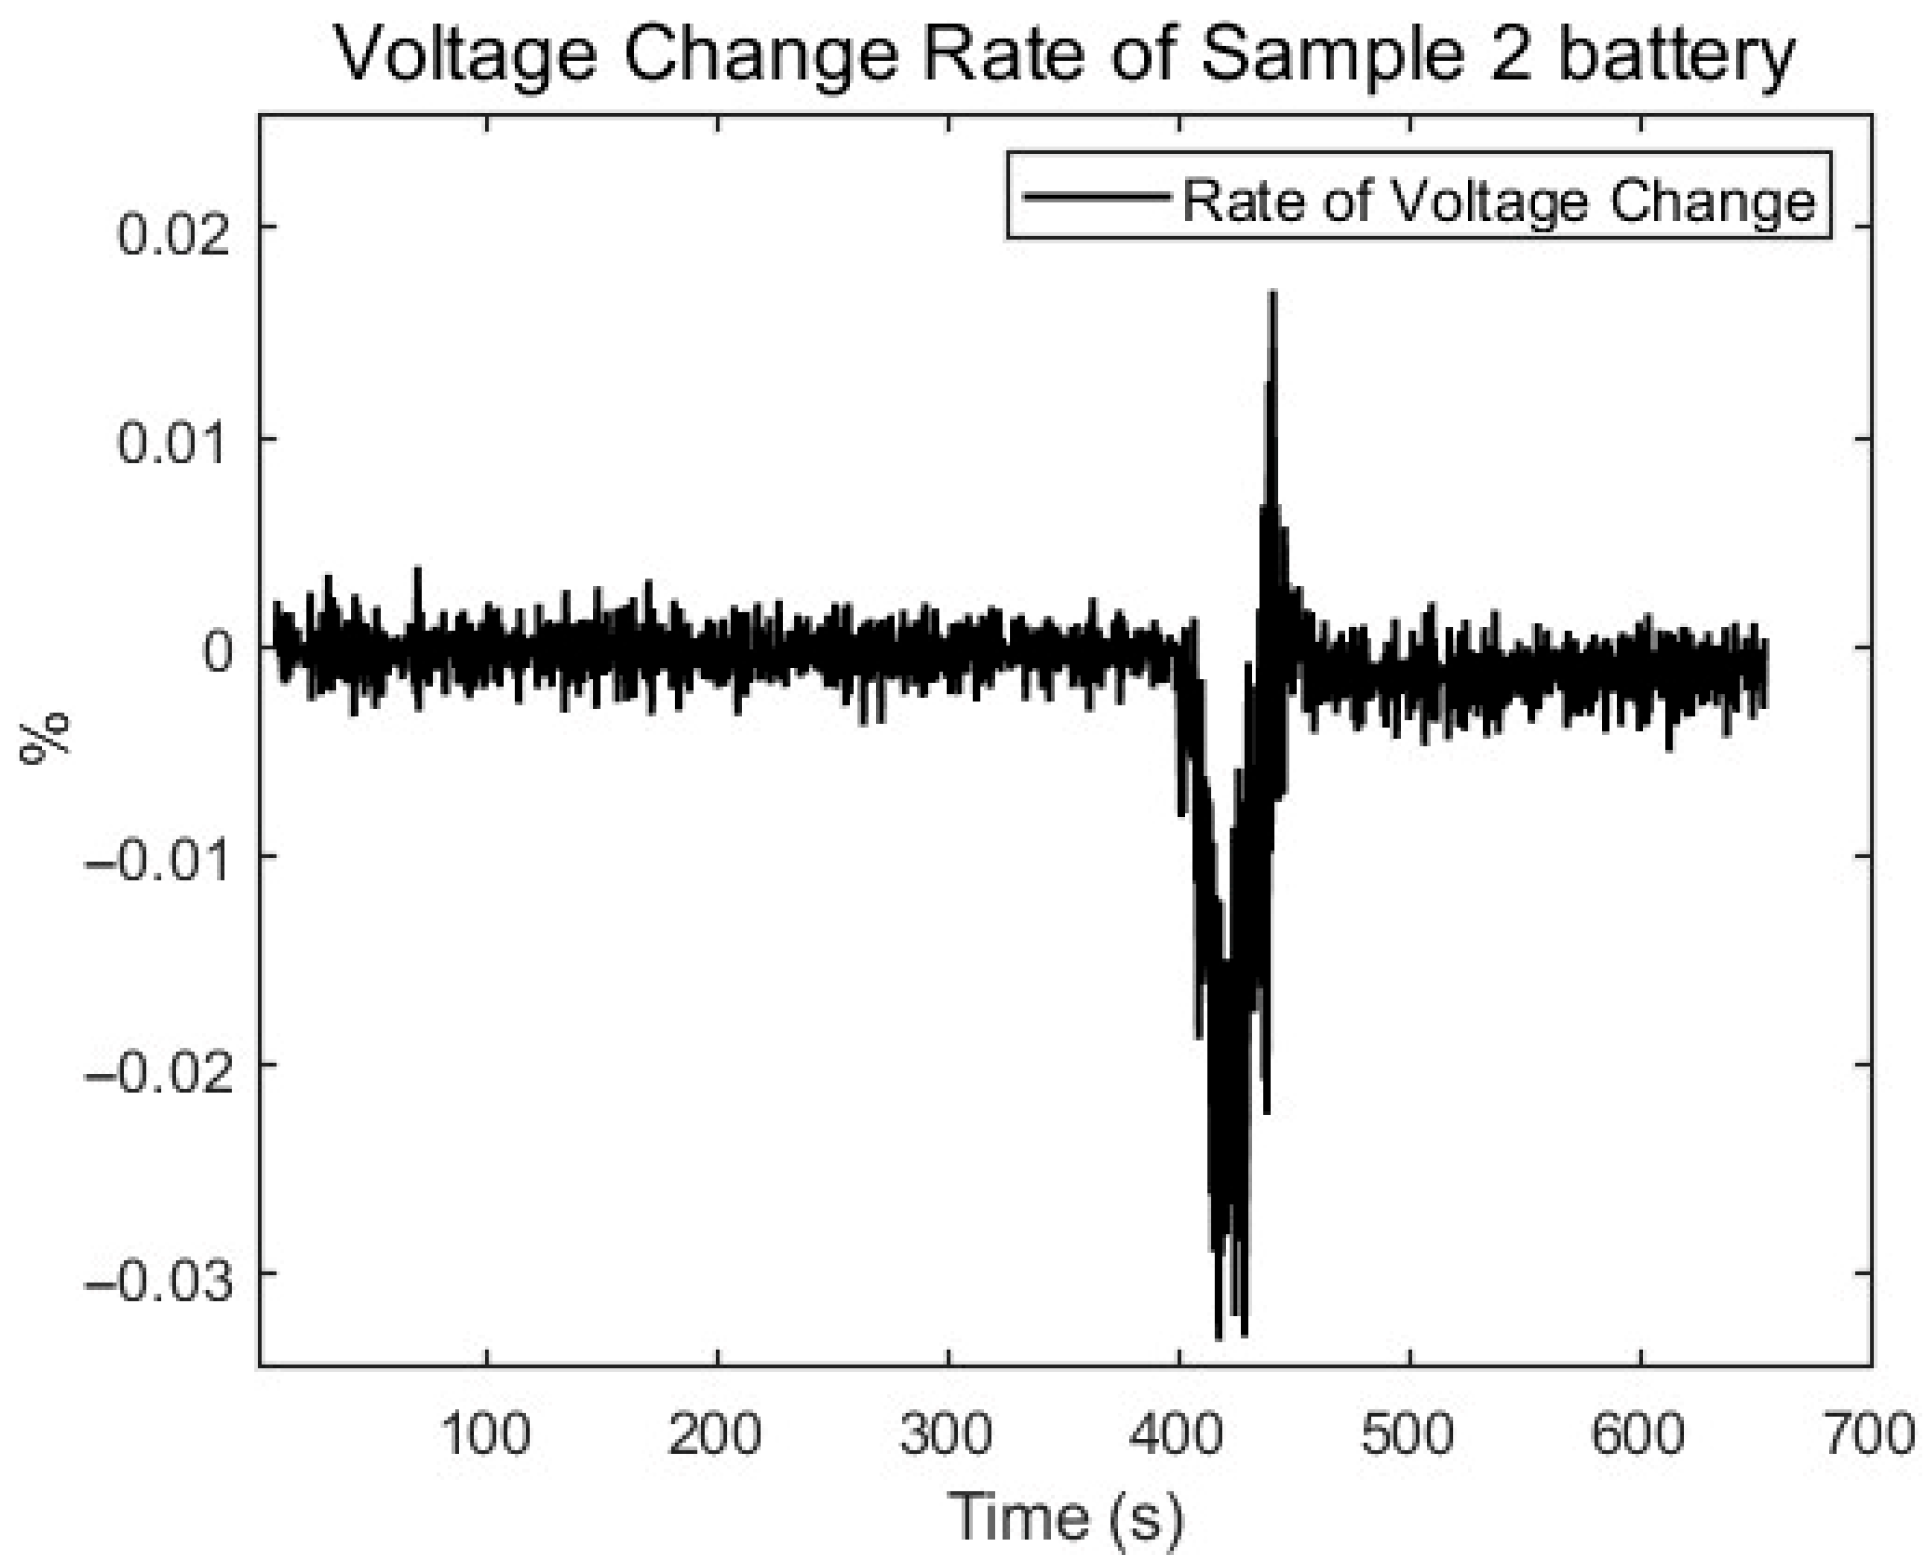
A comparative analysis of battery voltage and impedance variations before and after nail penetration was conducted in the time domain. As observed in Figure 13 and Figure 14, the voltage change is small before and after nail penetration. The voltage variation rate of two batteries is calculated by Equation (10), with the results shown in Figure 21 and Figure 22.
Δ = V i + 1 V i V i
Analysis of Figure 21 and Figure 22 reveals that the maximum absolute values of the voltage change rates for the two batteries before and after nail penetration are approximately 0.06% and 0.033%, respectively. Such small change rates indicate low detection sensitivity, which also implies that detecting nail penetration through voltage measurement is highly susceptible to interference.
The change rates of the real and imaginary parts of impedance at all frequency points were calculated based on the impedance spectra at each frequency point shown in Figure 9, Figure 10, Figure 11 and Figure 12. The calculation formulas are presented in Equations (11) and (12), and the calculated maximum change rates of the real and imaginary parts at each frequency point are summarized in Table 6.
Δ Z r e a l = Z r e a l i + 1 Z r e a l i Z r e a l i
Δ Z i m a g = Z i m a g i + 1 Z i m a g i Z i m a g i
According to Table 6, for the Sample 1 battery, the change rate of the real part reaches its maximum at 1000 Hz, while the change rate of the imaginary part is 646.09% at 50 Hz and ranges from 30% to 45% at other frequency points, with relatively small variations. To achieve relatively large change rates for both the real and imaginary parts, 1000 Hz is selected for diagnosis. For the Sample 2 battery, the change rate of the real part reaches its maximum at 1000 Hz, and the change rate of the imaginary part reaches its maximum at 50 Hz. Considering the inherent variability between batteries, the change rate should preferably exceed 10%; therefore, 1000 Hz is chosen as the optimal frequency for diagnosis. However, as shown in Figure 21 and Figure 22, the maximum change rates of both the real and imaginary parts of impedance are greater than the voltage change rates of the two batteries. Consequently, impedance-based diagnosis of nail penetration exhibits higher sensitivity compared to voltage-based diagnosis.
The difference in detection sensitivity between voltage and impedance for nail penetration diagnosis can be explained from two perspectives: numerical magnitude and electrochemical relaxation time.
From the perspective of numerical magnitude, the dynamic range of battery terminal voltage is typically on the order of volts (V), whereas the impedance change induced by nail penetration is often on the order of milliohms (mΩ). However, precisely because the impedance baseline is smaller, the relative change rate caused by minor physical or chemical variations is much higher for impedance than for terminal voltage, thereby endowing impedance detection with higher relative sensitivity.
From the perspective of electrochemical processes, nail penetration primarily affects the SEI film state, inductive characteristics, charge transfer process, and the charging/discharging behavior of the electric double-layer capacitance. The relaxation times of these interfacial processes are on the order of 10 6 10 1 s, allowing their changes to be rapidly reflected in the impedance spectrum, particularly in the medium-to-high frequency range. In contrast, the battery terminal voltage is determined by the potential difference between the positive and negative electrodes. According to the Nernst equation, the electrode potential is mainly governed by the lithium-ion concentration at the electrode surface, and the concentration change depends on the solid-state diffusion of lithium ions within the active material. The relaxation time of this diffusion process is on the order of seconds or even minutes, resulting in a significantly slower response. Therefore, changes in terminal voltage lag behind changes in impedance [31].
In summary, impedance-based diagnosis in the medium-to-low frequency range enables fault detection on a millisecond time scale, offering higher response speed and detection sensitivity compared to voltage-based diagnostic methods.
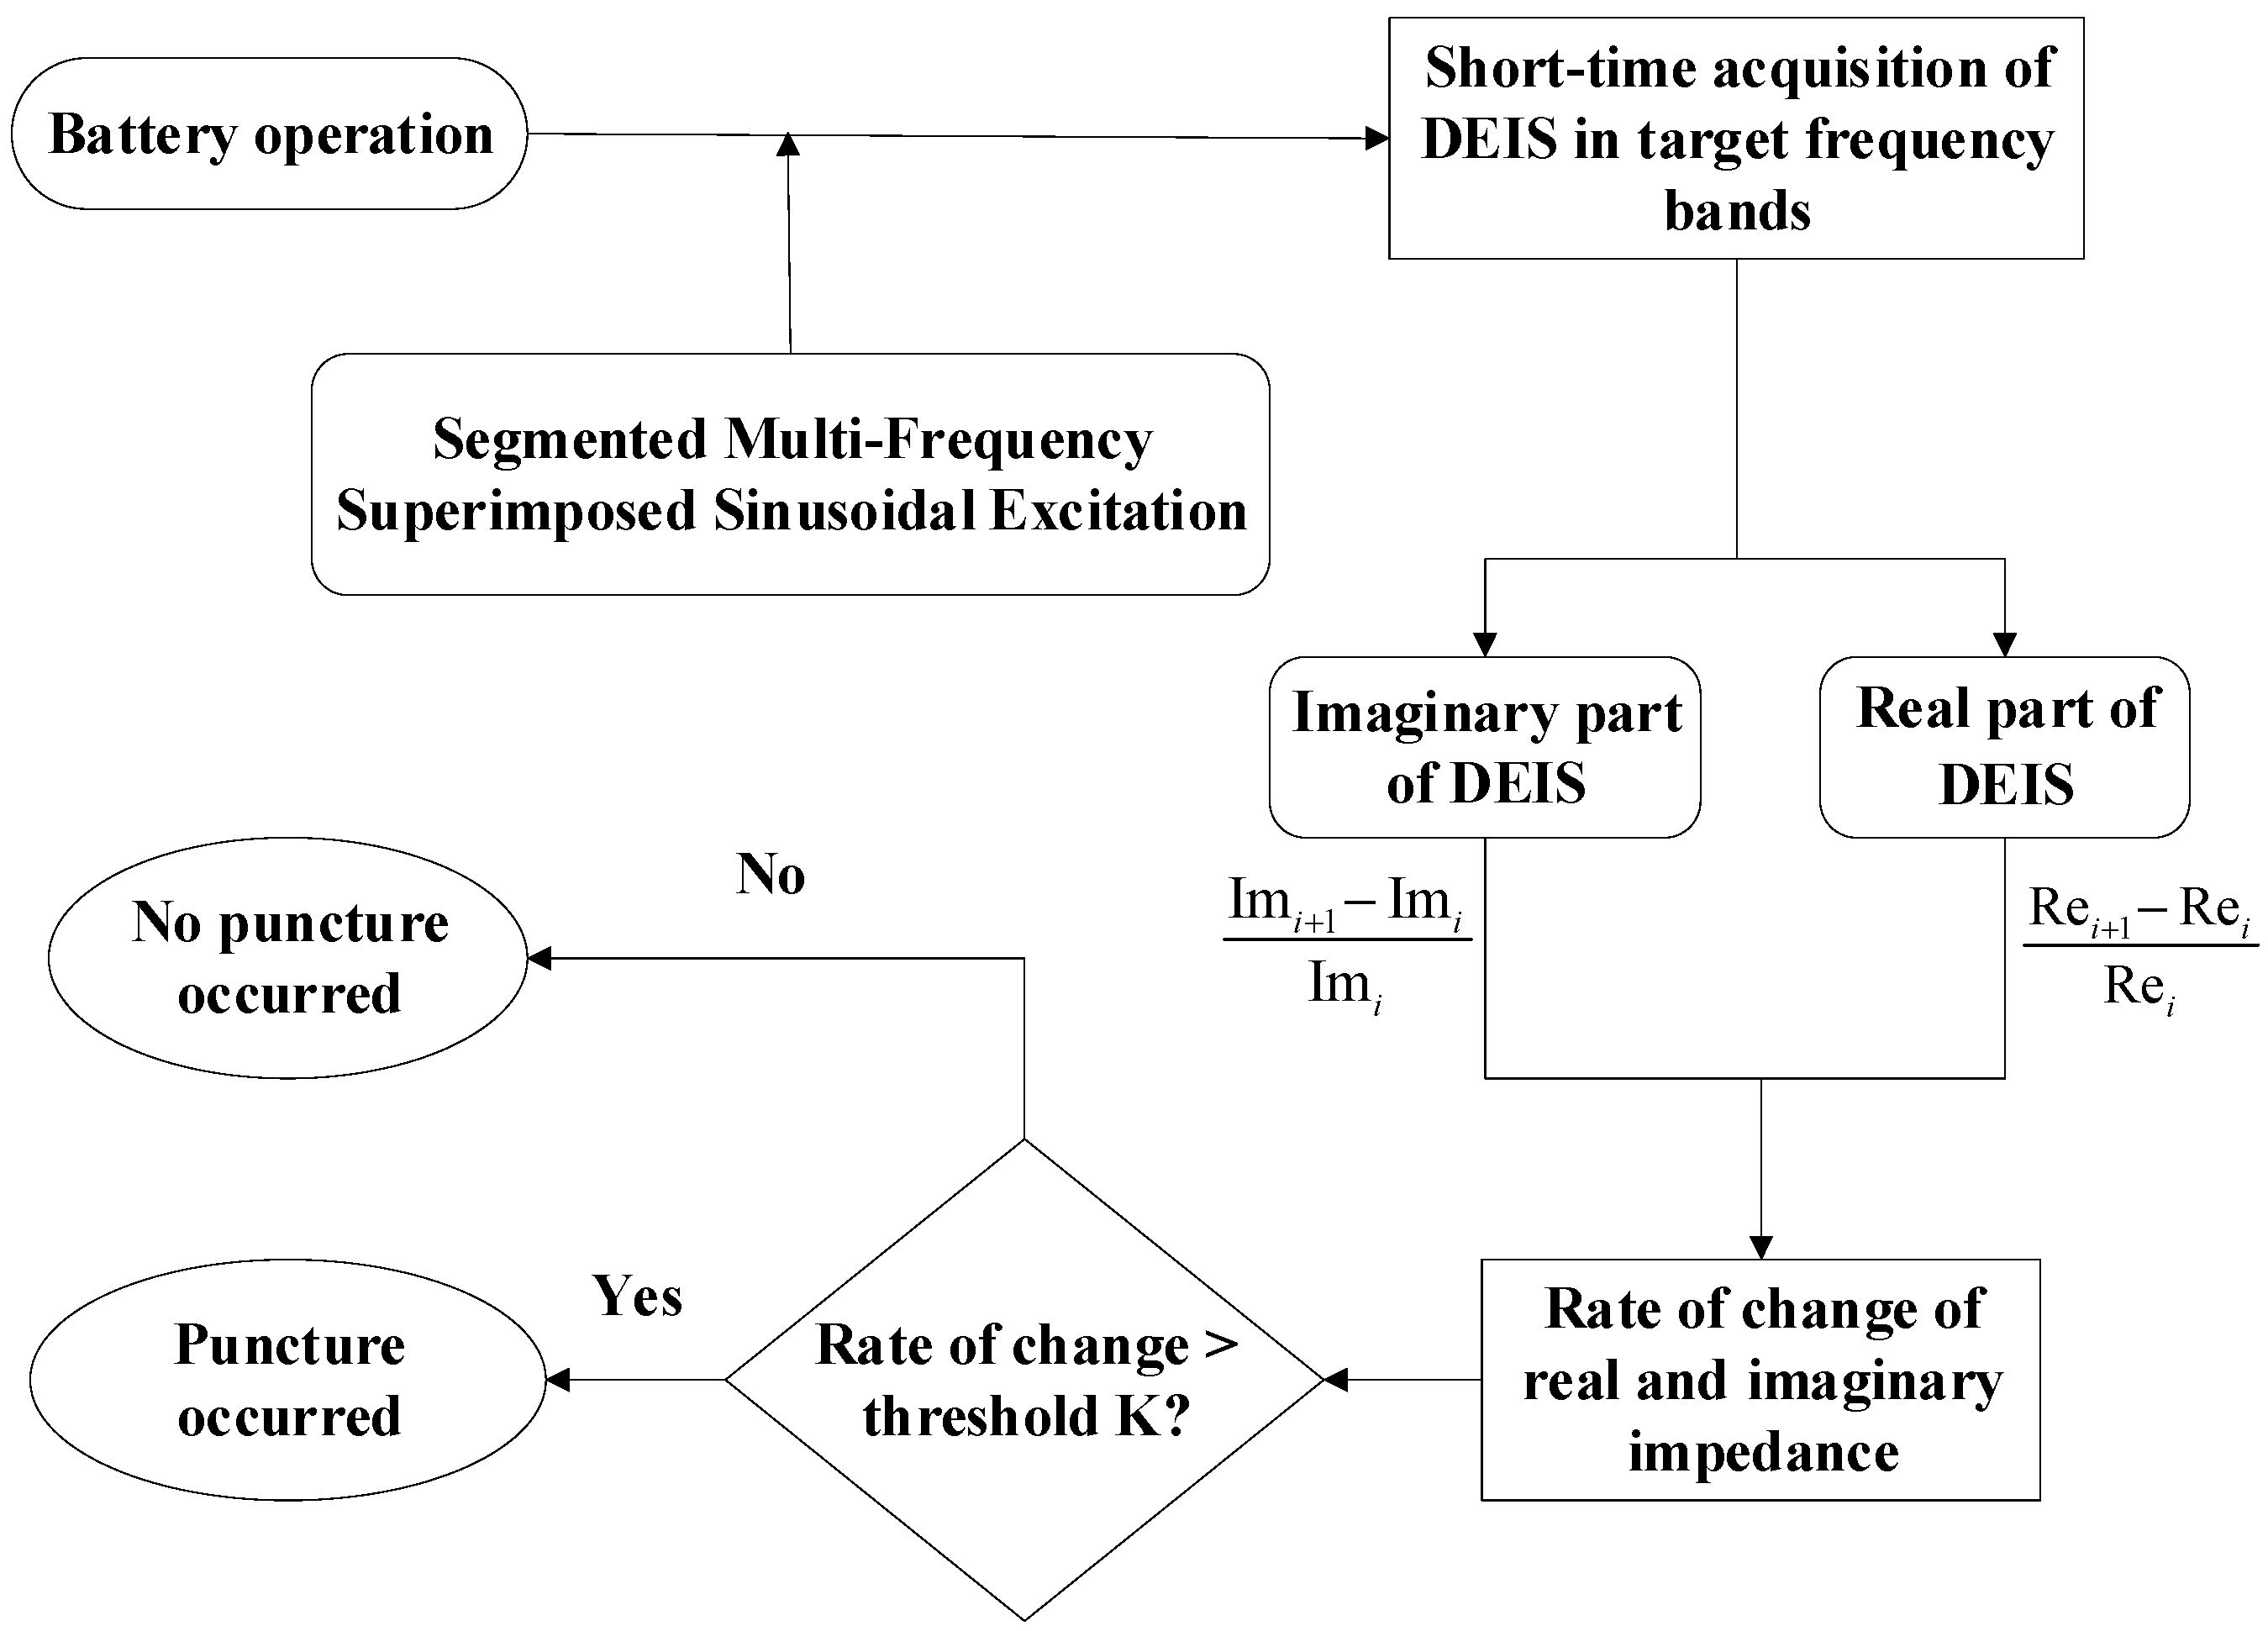
To enhance the anti-interference capability of nail penetration detection, a threshold K (e.g., 10%, 20%) for the change rates of the real and imaginary parts of the battery DEIS impedance is set according to their change rates before and after nail penetration. Specific thresholds K are set for different types of batteries corresponding to their respective variation characteristics before and after nail penetration. The threshold K is required to be much higher than the voltage change rate before and after nail penetration, while also meeting the detection requirements for the change rates of the real and imaginary parts of the battery DEIS impedance before and after nail penetration. Nail penetration is deemed to have occurred when the change rates of the real and imaginary parts of the battery DEIS impedance exceed the threshold K. The specific flowchart is illustrated in Figure 23 below.
During normal battery operation, a segmented multi-frequency superimposed sinusoidal excitation signal is applied to the battery to rapidly acquire DEIS data in the target frequency band. The real and imaginary parts of the DEIS are continuously extracted. By calculating the impedance change rate in real time and comparing it with a preset threshold K. If the change rate does not exceed the threshold, it is determined that “no nail penetration has occurred”, and the system continues monitoring. If the change rate exceeds the threshold, it is determined that “nail penetration has occurred”, triggering a safety warning or protection mechanism accordingly. The entire process forms a closed-loop online monitoring system, enabling rapid and sensitive detection of battery nail penetration faults.

4.3. Feasibility Analysis for Real Vehicle Application

The above methods discuss the DEIS-based battery nail penetration detection approach in a laboratory setting. However, for real-vehicle applications, it is difficult to actively apply segmented multi-frequency superimposed sinusoidal excitation. Therefore, this section addresses the application of nail penetration detection methods in real-vehicle scenarios without active excitation. Existing studies have shown that under actual driving conditions, the DC bus current is superimposed with a large number of high-frequency ripple signals, some of which originate from high-frequency switching inside the battery, and others from the vehicle’s drive motor.
During the operation of electric vehicles, switching devices (e.g., IGBTs, MOSFETs) in power electronic systems (such as DC-DC converters, inverters, etc.) perform high-frequency switching operations. These actions not only generate the required direct or alternating current at the load end but also produce harmonic components (referred to as current ripple). Although low-pass filters are installed at the output stage, the high-frequency components of the ripple can only be attenuated rather than completely eliminated. The residual high-frequency components propagate to the DC bus, typically at magnitudes above 10 kHz [32,33].
The traction motor in new energy vehicles is also a source of ripple. During operation, the non-sinusoidal components of the back electromotive force generate ripple at odd multiples of the motor’s fundamental frequency, while variations in the mutual inductance of the stator windings caused by rotor saliency produce ripple at even multiples of the fundamental frequency. Additionally, minor impedance differences among the three-phase windings prevent differential currents from fully canceling, thereby introducing further AC ripple onto the DC side [33] (pp. 143–144).
Based on the above analysis, it can be seen that the frequency range of the ripple current falls within the 50–1000 Hz detection range for nail penetration, preliminarily laying the foundation for the application of DEIS-based detection in real vehicles. However, in practical scenarios, the electromagnetic environment is relatively complex due to the operation of high-frequency switches and electric motors. To ensure that the signal-to-noise ratio (SNR) meets the requirements for impedance calculation, the H2 estimation method can be employed to mitigate the influence of noise. The H2 estimation method assumes that the output signal is noise-free and attributes all noise to the input signal (current excitation). Consequently, the acquired response voltage is considered accurate. Since there is no correlation between the current noise and the output voltage, the cross-power spectral density is zero. Thus, the impedance formula using the H2 method can be expressed as Equation (13):
Z ^ H 2 = S u u ( f ) S i u ( f )
where S u u ( f ) represents the auto-power spectral density of the voltage, and S i u ( f ) represents the cross-power spectral density of the current and voltage.
In the Welch method, due to the segmentation and windowing of the data, the auto-power spectral densities of the current and voltage, as well as their cross-power spectral density, can be expressed as shown in Equations (14) and (15).
S u u ( f ) = 1 M m = 1 M 1 N U [ m ] ω ( f ) · U [ m ] ω ( f )
S i u ( f ) = 1 M m = 1 M 1 N I [ m ] ω ( f ) · U [ m ] ω ( f )
By combining the H2 method and the Welch method, the impedance formula for a battery under bus ripple excitation under real vehicle operating conditions can be obtained, as shown in Equation (16).
Z ^ H 2 = 1 M m = 1 M 1 N U [ m ] ω ( f ) · U [ m ] ω ( f ) 1 M m = 1 M 1 N I [ m ] ω ( f ) · U [ m ] ω ( f )
Through the above method, the influence of noise generated by the operation of the traction inverter and power converters on the current excitation, and consequently on the impedance calculation, can be mitigated, ensuring that the signal-to-noise ratio (SNR) meets the requirements for impedance measurement [34]. Therefore, based on the DC ripple, the EIS of the battery in an actual vehicle can theoretically be obtained.
Several researchers have processed the DC bus ripple measured with current clamps to obtain the battery’s EIS. For instance, Bowen Yang et al. utilized the measured high-voltage DC bus current profile from a real vehicle, reproduced this current profile in the laboratory on a single cell, and obtained the corresponding impedance spectrum through procedures such as data segmentation, impedance calculation, averaging, and OPEIS preprocessing [35]. Shiqin Chen et al. [34] proposed an online passive EIS acquisition framework suitable for parallel battery modules under real driving conditions. They captured the DC bus current profile during actual driving of the Hongguang MINIEV using a DC current clamp, designed a laboratory current injection and voltage measurement system based on the current signal, and applied a physics-informed neural network (PINN) model to compensate for the inability to directly measure branch currents. By processing the voltage and current signals of the laboratory battery under excitation, they obtained impedance data at the branch level [34]. These studies have verified the feasibility of obtaining battery EIS from the DC bus ripple in real vehicles.
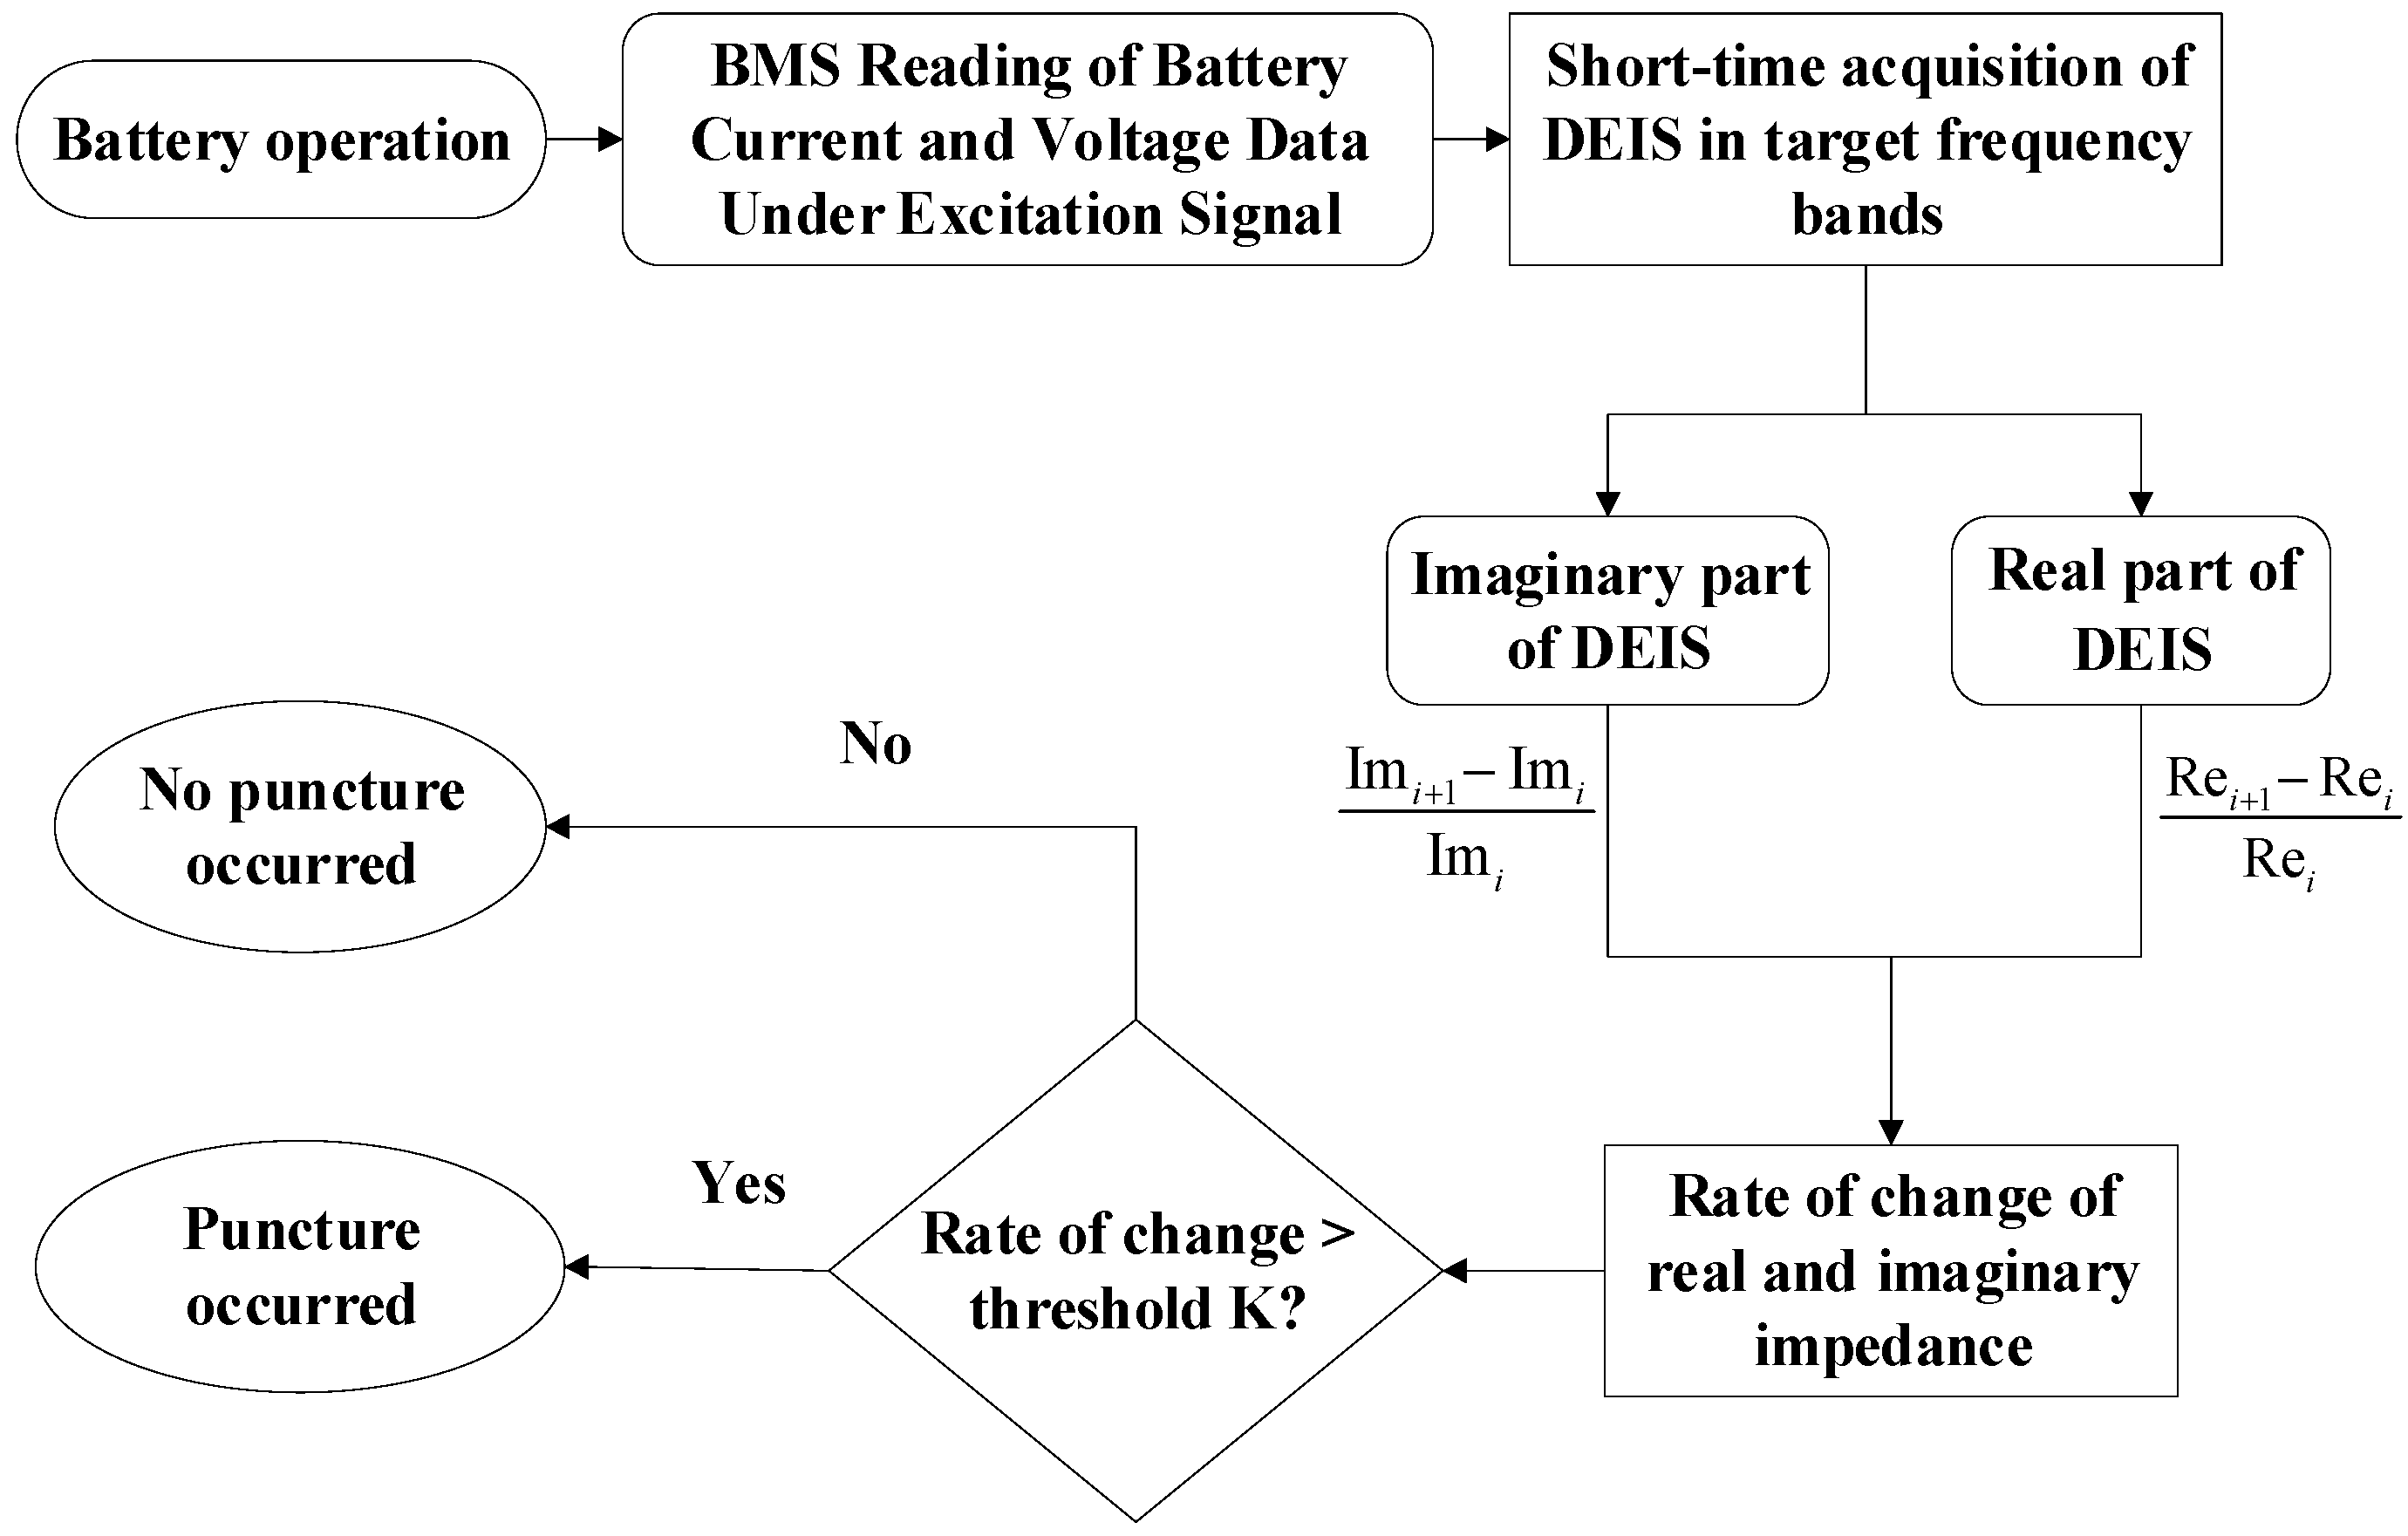
The vehicle Battery Management System (BMS) enables real-time monitoring of battery current and voltage. By performing FFT transformation on the voltage and current signals obtained under ripple excitation, the on-board DEIS can be acquired. Analysis of such DEIS allows the identification of battery nail penetration incidents. Therefore, the DEIS-based battery nail penetration detection method proposed in this paper exhibits high feasibility for real-vehicle applications.
Based on the existing research results of passive impedance spectroscopy and the above analysis, the real-vehicle battery nail penetration detection strategy shown in Figure 24 can be proposed. The battery current and voltage data under ripple excitation during vehicle operation are extracted to obtain the battery DEIS in a short time. The real and imaginary parts of DEIS are continuously extracted, and the change rates of the real and imaginary parts are compared with the threshold K to determine whether the battery suffers from nail penetration during real-vehicle operation.

5. Conclusions

First, to investigate the effects of steel nail penetration on the battery circuit, DEIS test technology is used to monitor the real-time impedance changes of the battery during the nail penetration process, yielding DEIS data within the target frequency band over a short period. Based on the acquired DEIS data, fractional-order models of the battery before and after nail penetration are established and subjected to fitting analysis. The results reveal that the steel nail introduces both inductive reactance and resistance to the battery. Owing to the parallel connection between the steel nail and the battery internal resistance, the overall impedance is significantly reduced, exhibiting a short-circuit state. Further analysis of the obtained DEIS data shows that for the real part of the impedance, there is no obvious variation in the medium frequency range (50–85 Hz) before and after nail penetration. However, with an increase in frequency, a distinct step change in the real part of the impedance emerges after 115 Hz between the pre- and post-penetration states, and the variation becomes more pronounced as the frequency rises. For the imaginary part of the impedance, a significant step change occurs across the entire medium-to-high frequency range (50–1000 Hz) before and after nail penetration, and this variation also intensifies with increasing frequency.
Compared with the voltage variation before and after nail penetration, the changes in the real and imaginary parts of the impedance are more pronounced, exhibiting higher sensitivity in battery nail penetration detection and thus being more suitable for nail penetration detection. Based on the characteristic step change of battery impedance before and after nail penetration, a DEIS-based nail penetration detection method is proposed. First, a threshold K for impedance variation before and after nail penetration is defined. When the impedance variation of the battery exceeds K during operation, a nail penetration incident can be determined to have occurred. At the same time, the DC bus ripple generated during real vehicle operation acts as an excitation source for the battery. Under this excitation signal, the real-time current and voltage data collected by the BMS are transformed via FFT to obtain the DEIS data of battery. The nail penetration detection method proposed in this paper can then be applied to analyze whether a battery has undergone nail penetration. However, since the sampling frequency of the on-board BMS can only reach the level of hundreds of hertz and cannot yet achieve the sampling frequency required for analyzing the 1000 Hz harmonics applied in this study, how to truly apply this research method to real vehicles while preserving the original hardware structure of the vehicle still requires further in-depth research in the future.

Author Contributions

Conceptualization, Y.L.; methodology, Y.L. and Z.Z.; software Y.L., Z.Z., D.S. and D.W.; validation, Z.Z., D.S. and D.W.; resources, F.W. and Q.Z.; writing—original draft, Y.L., Z.Z. and D.S.; supervision, F.W. and Q.Z.; project administration, F.W. and Q.Z.; funding acquisition, F.W. All authors have read and agreed to the published version of the manuscript.

Funding

This work was financially supported by the Natural Science Youth Foundation of Shandong Province (ZR2024QB165) and Grant for the Advancement of Young Teachers in 2023 of HIT (IDGA10002185).

Data Availability Statement

Due to the classified nature of the research, the data supporting this study cannot be made publicly available. Access is restricted in accordance with relevant national and institutional regulations.

Conflicts of Interest

Authors Yulin Luo, Deshuai Sun and Facheng Wang were employed by China North Vehicle Research Institute. The remaining authors declare that the research was conducted in the absence of any commercial or financial relationships that could be construed as a potential conflict of interest.

References

  1. Kang, S.; Tu, H. BattBee: Equivalent circuit modeling and early detection of thermal runaway triggered by internal short circuits for lithium-ion batteries. Appl. Energy 2026, 404, 127016. [Google Scholar] [CrossRef] [Scilit]
  2. Setta, J.; Lecocq, A. Internal short circuits in lithium-ion batteries; origins, detection, and experimental reproduction: A review. J. Power Sources 2025, 658, 238265. [Google Scholar] [CrossRef] [Scilit]
  3. Wang, J.; Mei, W. Experimental and numerical study on penetration-induced internal short-circuit of lithium-ion cell. Appl. Therm. Eng. 2020, 171, 115082. [Google Scholar] [CrossRef] [Scilit]
  4. Zhang, L.; Liu, Y. Dynamic thermal runaway evolution of Li-ion battery during nail penetration. Int. J. Heat Mass Transf. 2024, 233, 126020. [Google Scholar] [CrossRef] [Scilit]
  5. Jiang, J.; Liu, X. Electrochemical basis of internal short circuit in lithium-ion batteries induced by multiple lithium dendrites. J. Power Sources 2026, 661, 238641. [Google Scholar] [CrossRef] [Scilit]
  6. Mei, W.; Zhang, L. Experimental and numerical methods to investigate the overcharge caused lithium plating for lithium ion battery. Energy Storage Mater. 2020, 32, 91–104. [Google Scholar] [CrossRef] [Scilit]
  7. Liu, B.; Jia, Y. Safety issues and mechanisms of lithium-ion battery cell upon mechanical abusive loading: A review. Energy Storage Mater. 2020, 24, 85–112. [Google Scholar] [CrossRef] [Scilit]
  8. Huang, X.; Xue, J. Comprehensive evaluation of safety performance and failure mechanism analysis for lithium sulfur pouch cells. Energy Storage Mater. 2020, 30, 87–97. [Google Scholar] [CrossRef] [Scilit]
  9. Ren, D.; Feng, X. Investigating the relationship between internal short circuit and thermal runaway of lithium-ion batteries under thermal abuse condition. Energy Storage Mater. 2021, 34, 563–573. [Google Scholar] [CrossRef] [Scilit]
  10. Feng, X.; Ouyang, M. Thermal runaway mechanism of lithium ion battery for electric vehicles: A review. Energy Storage Mater. 2018, 10, 246–267. [Google Scholar] [CrossRef] [Scilit]
  11. Abaza, A.; Ferrari, S. Experimental study of internal and external short circuits of commercial automotive pouch lithium-ion cells. J. Energy Storage 2018, 16, 211–217. [Google Scholar] [CrossRef] [Scilit]
  12. García, A.; Monsalve-Serrano, J. Analysis of the thermal runaway phenomenon of Nickel-Manganese-Cobalt cells induced by nail penetration through high-speed infrared imaging. J. Energy Storage 2024, 75, 109709. [Google Scholar] [CrossRef] [Scilit]
  13. Shelke, A.V.; Buston, J.E.H. Characterizing and predicting 21700 NMC lithium-ion battery thermal runaway induced by nail penetration. Appl. Therm. Eng. 2022, 209, 118278. [Google Scholar] [CrossRef] [Scilit]
  14. Ye, M.; Hu, G. A novel semi-analytical solution for calculating the temperature distribution of the lithium-ion batteries during nail penetration based on Green’s function method. Appl. Therm. Eng. 2020, 174, 115129. [Google Scholar] [CrossRef] [Scilit]
  15. Zhou, G.; Lu, H. Experimental study on thermal runaway and flame eruption characteristics of NCM523 lithium-ion battery induced by the coupling stimulations of overcharge-penetration. Process Saf. Environ. Prot. 2024, 191, 131–145. [Google Scholar] [CrossRef] [Scilit]
  16. Zhang, L.; Liu, Y. Intra-cell thermal runaway propagation within a cylindrical battery induced by nail penetration. Int. J. Therm. Sci. 2025, 210, 109633. [Google Scholar] [CrossRef] [Scilit]
  17. Kim, H.; Seifert, H.J. A comparative study of commercial automotive prismatic Li-ion cells using nail penetration test, differential scanning calorimetry and thermogravimetric analysis. J. Power Sources 2024, 623, 235416. [Google Scholar] [CrossRef] [Scilit]
  18. Chiu, K.-C.; Lin, C.-H. An electrochemical modeling of lithium-ion battery nail penetration. J. Power Sources 2014, 251, 254–263. [Google Scholar] [CrossRef] [Scilit]
  19. Ren, Y.; Zhang, H. Multi-layer internal short-circuit mechanism and thermal runaway risk assessment of lithium-ion batteries using nail penetration simulation. J. Energy Storage 2024, 97, 112824. [Google Scholar] [CrossRef] [Scilit]
  20. Zhang, J.; Li, S. Multidimensional signal evolution during nail-penetration-induced thermal runaway in lithium-ion batteries with different states of charge: An optical investigation. Energy 2025, 334, 137320. [Google Scholar] [CrossRef] [Scilit]
  21. Lin, C.; Mao, J. Early warning for thermal runaway of Li [Ni0.5Co0.2Mn0.3]O2 and LiFePO4 batteries under external heating, penetration and overcharging conditions. J. Energy Storage 2025, 109, 115085. [Google Scholar] [CrossRef] [Scilit]
  22. Yamanaka, T.; Takagishi, Y. Modeling lithium ion battery nail penetration tests and quantitative evaluation of the degree of combustion risk. J. Power Sources 2019, 416, 132–140. [Google Scholar] [CrossRef] [Scilit]
  23. Chen, H.; Li, Z. Joint time-frequency physicochemical modeling and parameter sensitivity analysis on dynamic electrochemical impedance spectroscopy of lithium-ion batteries. J. Power Sources 2025, 626, 235762. [Google Scholar] [CrossRef] [Scilit]
  24. Zhang, X.Y.; Lu, Y.P. Dynamic Electrochemical Impedance Spectroscopy: A Forward Application Approach for Lithium-Ion Battery Status Assessment. EcoMat 2025, 7, e70018. [Google Scholar] [CrossRef] [Scilit]
  25. Du, X.; Meng, J. Exploring impedance spectrum for lithium-ion batteries diagnosis and prognosis: A comprehensive review. J. Energy Chem. 2024, 95, 464–483. [Google Scholar] [CrossRef] [Scilit]
  26. Darowicki, K.; Zieliński, A. Differential analysis of dynamic immittance spectra. Electrochem. Commun. 2020, 112, 106664. [Google Scholar] [CrossRef] [Scilit]
  27. GB/T 38031; Electric Vehicles Traction Battery Safety Requirements. State Administration for Market Regulation; National Standardization Administration: Beijing, China, 2025.
  28. Zhang, Q.; Wang, D.; Yang, B.; Dong, H.; Zhu, C.; Hao, Z. An electrochemical impedance model of lithium-ion battery for electric vehicle application. J. Energy Storage 2022, 50, 104182. [Google Scholar] [CrossRef] [Scilit]
  29. Salehian, S.; Mora, J.M. Experimental and Analytical Study of an Anode-Supported Solid Oxide Fuel. Cell 2026, 16, 1497. [Google Scholar] [CrossRef] [Scilit]
  30. Gismero, A.; Stroe, D.I. Calendar Aging Lifetime Model for NMC-based Lithium-Ion Batteries Based on EIS Measurements. In Proceedings of the 2019 Fourteenth International Conference on Ecological Vehicles and Renewable Energies (EVER), Monte-Carlo, Monaco, 8–10 May 2019. [Google Scholar]
  31. Rüther, T.; Hileman, W. Demystifying the Distribution of Relaxation Times: A Simulation-Based Investigation into the Limits and Possibilities of Interpretation for Lithium-Ion Batteries. J. Electrochem. Soc. 2024, 171, 060508. [Google Scholar] [CrossRef] [Scilit]
  32. Goldammer, E.; Droese, D. Batteries—Batteries General—Charge-Discharge | Alternating Currents and Ripples. In Encyclopedia of Electrochemical Power Sources, 2nd ed.; Garche, J., Ed.; Elsevier: Oxford, UK, 2025; pp. 758–768. [Google Scholar]
  33. Uddin, K.; Moore, A.D. The effects of high frequency current ripple on electric vehicle battery performance. Appl. Energy 2016, 178, 142–154. [Google Scholar] [CrossRef] [Scilit]
  34. Chen, S.; Zhang, Q. A framework for online passive electrochemical impedance spectroscopy acquisition in parallel-connected battery systems under real driving conditions. J. Clean. Prod. 2025, 536, 147170. [Google Scholar] [CrossRef] [Scilit]
  35. Yang, B.; Wang, D. Research on online passive electrochemical impedance spectroscopy and its outlook in battery management. Appl. Energy 2024, 363, 123046. [Google Scholar] [CrossRef] [Scilit]
Figure 1. Schematic diagram of the experimental platform.
Energies 19 02152 g001
Figure 2. Flowchart of the rapid DEIS measurement system.
Energies 19 02152 g002
Figure 3. Excitation current and corresponding voltage signals of Sample 1 battery in the time domain.
Energies 19 02152 g003
Figure 4. Excitation current and corresponding voltage signals of Sample 2 battery in the time domain.
Energies 19 02152 g004
Figure 5. Impedance spectra of Sample 1 battery before and after nail penetration.
Energies 19 02152 g005
Figure 6. Impedance spectra of Sample 2 battery before and after nail penetration.
Energies 19 02152 g006
Figure 7. KK Test Results of Sample 1 Battery.
Energies 19 02152 g007
Figure 8. KK Test Results of Sample 2 Battery.
Energies 19 02152 g008
Figure 9. Change in the real part of Sample 1 battery DEIS at various frequencies before and after nail penetration.
Energies 19 02152 g009
Figure 10. Change in the imaginary part of Sample 1 battery DEIS at various frequencies before and after nail penetration.
Energies 19 02152 g010
Figure 11. Change in the real part of Sample 2 battery DEIS at various frequencies before and after nail penetration.
Energies 19 02152 g011
Figure 12. Change in the imaginary part of Sample 2 battery DEIS at various frequencies before and after nail penetration.
Energies 19 02152 g012
Figure 13. Changes in Sample 1 battery voltage before and after nail penetration.
Energies 19 02152 g013
Figure 14. Changes in Sample 2 battery voltage before and after nail penetration.
Energies 19 02152 g014
Figure 15. Equivalent circuit schematic representing the internal structure of a post-nail penetration battery.
Energies 19 02152 g015
Figure 16. Battery fractional-order model under normal conditions.
Energies 19 02152 g016
Figure 17. Fractional-order model of the battery under medium-high frequency normal operating conditions.
Energies 19 02152 g017
Figure 18. Fractional-order model for a battery after nail penetration.
Energies 19 02152 g018
Figure 19. Fitting results of the fractional-order model for Sample 1 battery.
Energies 19 02152 g019
Figure 20. Fitting results of the fractional-order model for Sample 2 battery.
Energies 19 02152 g020
Figure 21. Voltage change rate of Sample 1 battery before and after nail penetration.
Energies 19 02152 g021
Figure 22. Voltage change rate of Sample 2 battery before and after nail penetration.
Energies 19 02152 g022
Figure 23. Flowchart of the battery nail penetration detection system based on dynamic electrochemical impedance spectroscopy.
Energies 19 02152 g023
Figure 24. Flowchart of battery nail penetration detection system during real-vehicle operation.
Energies 19 02152 g024
Table 1. Parameters of the Sample 1 lithium-ion battery.
No.ParametersParameter Description
1Battery TypePouch-type lithium-ion cell
2Battery ModelSP60118150
3Nominal Capacity12.0 Ah
4Nominal Voltage3.6 V
5Charge Cut-off Voltage4.2 V
Standard Charge Current1.0 C
Maximum Continuous Charge Current1.5 C (25 ± 3 °C)
Maximum Pulse Charge Current3.0 C (10 s, 25 ± 3 °C)
6Discharge Cut-off Voltage2.5 V
Standard Discharge Current1.0 C
Standard Discharge Current Maximum
Continuous Discharge Current
2.0 C (25 ± 3 °C)
Maximum Pulse Discharge Current4.0 C (10 s, 25 ± 3 °C)
Table 2. Parameters of the Sample 2 lithium-ion battery.
No.ParametersParameter Description
1Battery TypePouch-type lithium iron phosphate battery
2Battery ModelPP40F-L
3Nominal Capacity40.0 Ah
4Nominal Voltage3.2 V
5Charge Cut-off Voltage3.65 V
Standard Charge Current1.0 C
Maximum Continuous Charge Current2.0 V (25 ± 3 °C)
Maximum Pulse Charge Current3.0 C (10 s, 25 ± 3 °C)
6Discharge Cut-off Voltage2.5 V (T > 0 °C), 2.0 C (T < 0 °C)
Standard Discharge Current1.0 C
Standard Discharge Current Maximum
Continuous Discharge Current
3.0 C (25 ± 3 °C)
Maximum Pulse Discharge Current6.0 C (10 s)
Table 3. Frequency composition of a multi-frequency sinusoidal signal.
Frequency BandFrequencies Intended for Superposition
Medium-to-high Frequency Signals (50~1000 Hz)50, 65, 85, 115, 150, 180, 280, 540, 1000
Table 4. Equivalent circuit model fitting parameters of Sample 1 battery.
ElementBefore Nail PenetrationAfter Nail Penetration
Rohm0.00260.0039
Rsei1 × 10−61 × 10−8
C/F150.06
R_RL10.180.4049
L_RL1/H9.0365 × 10−68.0365 × 10⁻⁶
L2/H0.5 × 10−49 × 10−6
Rohm2\0.00381
R_Rn1\1.5288
L_n1/H\7.5070 × 10−6
L22/H\0.46
Table 5. Equivalent circuit model fitting parameters of Sample 2 battery.
ElementBefore Nail PenetrationAfter Nail Penetration
Rohm7 × 10−46.5 × 10⁻⁴
Rsei1 × 10−62 × 10−4
C/F1515
R_RL10.140.38
L_RL1/H2.4 × 10−62.18 × 10⁻⁶
L2/H2.2204 × 10−142.2204 × 10⁻¹⁴
Rohm2\0.00181
R_Rn1\1.5388
L_n1/H\6.3411 × 10−2
L22/H\0.0046
Table 6. Maximum change rates of the real and imaginary parts of impedance at each frequency point for the two batteries.
Frequency (Hz)Real Part of Y1Imaginary Part of Y1 Real Part of Y2Imaginary Part of Y2
506.52%646.09%10.21%26.79%
654.85%40.41%7.77%21.98%
853.57%35.73%5.26%23.50%
1154.70%36.28%4.39%23.09%
15011.04%31.95%11.10%23.14%
18012.57%31.18%6.79%22.63%
28033.67%44.53%13.73%12.59%
54057.80%42.08%12.76%12.86%
Disclaimer/Publisher’s Note: The statements, opinions and data contained in all publications are solely those of the individual author(s) and contributor(s) and not of MDPI and/or the editor(s). MDPI and/or the editor(s) disclaim responsibility for any injury to people or property resulting from any ideas, methods, instructions or products referred to in the content.