1. Introduction
The energy transition of road transport has become a pivotal challenge for climate policy in Europe. The decarbonisation of road transport in Europe increasingly depends not only on the diffusion of plug-in vehicles, but also on the timely expansion and effective functioning of public charging infrastructure. Despite the pervasive discourse surrounding the escalating role of electric vehicles (EVs), encompassing both battery electric vehicles (BEVs) and plug-in electric vehicles (PHEVs), and the concomitant advancements in technology, the efficacy of decarbonisation is contingent not solely on the provision of vehicles, but also on the existence of infrastructural and institutional frameworks that facilitate their widespread utilization [
1,
2,
3,
4,
5,
6,
7,
8]. The importance of public charging infrastructure lies in its role as a complementary good to the electric vehicle fleet from an economic perspective. However, it is also noteworthy that this infrastructure can potentially act as a bottleneck in the process of technology diffusion [
9,
10,
11,
12,
13,
14].
From the perspective of public policy and transition management, it is important to understand the relationship between the growth rate of the electric vehicle fleet and the pace of infrastructure development. In the event of infrastructure development outpacing the number of users, congestion ensues. This may take the form of queues, reduced availability of charging points, and increased time costs. Such congestion has the potential to reduce public acceptance and hinder further adoption. From a microeconomic perspective, this phenomenon can be interpreted as an escalation in transaction and usage costs. From a macroeconomic standpoint, its consequences may be seen as a deceleration in the dissemination of innovation and a diminution in environmental benefits [
15,
16,
17,
18,
19].
The selection of this topic is predicated on the fact that the source material (statistical dossier) provides: The following data is required:
series and quantitative information on the development of charging infrastructure in Europe and load indicators (e.g., the ratio of PHEVs to charging stations/points);
data on the structure of new passenger car registrations in Europe by drive type (BEV and PHEV shares); and
a synthetic measure of the environmental impact of the new fleet in the form of the average CO2 emissions of newly registered cars (g/km).
This data configuration facilitates the establishment of a coherent research framework, encompassing infrastructure dynamics, technology adoption, and quantifiable emissions outcomes at the level of new registrations.
Recent literature increasingly shows that the development of electromobility depends not only on vehicle uptake, but also on the spatial availability, technical structure and operational functionality of charging infrastructure. Public charging infrastructure remains especially important for battery electric vehicles (BEVs), for users without reliable home or workplace charging, and for long-distance travel. At the same time, actual pressure on the public network does not depend solely on the stock or share of plug-in vehicles. It is also shaped by charger type and power rating (e.g., AC, DC and high-power charging), home and workplace charging availability, temporal charging behaviour, and local concentration effects [
20,
21,
22,
23].
A second strand of the literature points to the growing relevance of spatial inequality in charging access. Even when aggregate indicators improve, average progress may coexist with regional bottlenecks, corridor gaps, or so-called charging deserts in peripheral and rural areas. This is particularly relevant in the European context, where the policy environment is increasingly structured by the Alternative Fuels Infrastructure Regulation (AFIR), interoperability requirements, and corridor-based deployment targets, but where national market conditions and energy-price environments still vary substantially [
24,
25,
26,
27].
Against this background, the research gap addressed in this article is narrower and more specific than in many broad discussions of EV transition. The paper does not attempt to estimate actual charger utilisation, queueing, or grid load. Nor does it offer a causal model of national policy effectiveness. Instead, it addresses the more limited but still policy-relevant question of whether aggregate public charging infrastructure in Europe has expanded at a pace broadly consistent with the recent acceleration of electrification. The novelty of the article lies in three elements: first, the use of a simple and replicable proxy of potential infrastructure strain (plug-in vehicles per public recharging point, VPP); second, the explicit distinction between a long-run descriptive window and a short diagnostic core; and third, the interpretation of ‘catch-up’ as an aggregate supply-to-user-base relationship rather than as a direct measure of actual operational performance.
Accordingly, the aim of this article is to assess the relationship between the development of public charging infrastructure in Europe and the dynamics of electrification of new passenger car registrations, with particular attention to whether aggregate infrastructure strain appears to ease or intensify during recent market expansion. Average CO2 emissions of newly registered cars are retained only as a contextual environmental indicator, not as a variable for strong inferential testing within the short analytical window.
To operationalise this objective, the following research questions are addressed: (1) How did the scale of public charging infrastructure and the VPP indicator evolve in Europe over the period analysed? (2) Did the recent growth in electrification coincide with rising or falling aggregate infrastructure strain? (3) How did average CO2 emissions of newly registered passenger cars evolve relative to electrification and infrastructure trends, and what are the limits of interpreting this relationship in a short aggregate time window?
In practical terms, the results can support higher-level policy discussion on infrastructure planning logic, including the balance between market demand, corridor obligations, accessibility in underserved areas, and the functional quality of the charging network. From a scientific perspective, the article offers a transparent indicator-based framework that can be extended in future work to national, regional or panel-based analyses with richer control variables and operational usage data.
2. Materials and Methods
2.1. Research Design and Analytical Logic
The study adopts a quantitative, indicator-based design intended primarily for descriptive and diagnostic analysis rather than causal identification. Its logic is sequential. First, long-run aggregate trends in electrification, public charging infrastructure and average CO2 intensity of newly registered passenger cars are described. Second, a shorter common analytical window is used to examine whether the proxy of potential infrastructure strain moves in a direction consistent with a catch-up interpretation. Third, simple correlations and parsimonious bivariate regressions are used only to assess the directional consistency of observed co-movements. The empirical strategy therefore combines a broad descriptive perspective with a limited diagnostic core. It is not designed to estimate policy effects, charger utilisation, queueing, or electricity-network load. All results should be interpreted accordingly.
2.2. Data Sources, Scope and Sample Definition
The empirical material consists of annual secondary data describing Europe’s public charging infrastructure, the market shares of electrified passenger vehicles in new registrations, and the average CO2 intensity of newly registered passenger cars. The long-run descriptive dataset covers 2015–2024 as historical observations. The value reported for 2025 is treated separately as a scenario/projection observation and is used only in the robustness section. The core analytical sample covers 2020–2024, which is the common time window for which the VPP indicator is available in a sufficiently consistent form. This distinction between the descriptive window, the core diagnostic window, and the scenario extension is fundamental for the revised analytical strategy and is maintained consistently across the tables, figures and interpretation of results.
2.3. Variables and Indicator Construction
The first group of variables captures the electrification of new passenger car registrations. Let BEV
t denote the annual share of battery electric vehicles in newly registered passenger cars, and let PHEV
t denote the annual share of plug-in hybrid electric vehicles, both expressed in percentage terms. To obtain a synthetic measure of plug-in electrification, the study defines total plug-in vehicle share as:
where
t denotes year.
The scale of public charging infrastructure was measured by the annual number of public recharging points (RP
t). To reduce the scale effect associated with the rapid growth of public charging infrastructure and to improve interpretability in the regression analysis, a logarithmic transformation of this variable was applied:
The key strain proxy is the VPP indicator, defined as the number of plug-in vehicles per public recharging point. Formally, if PEV
t denotes the stock of plug-in electric vehicles in year
t, then:
The VPP indicator is calculated using the actual annual values of plug-in vehicle stock and public recharging points. The logarithmic transformation is applied only in the regression specifications that use infrastructure scale as an explanatory variable.
In substantive terms, VPPt is interpreted in the article as a high-level proxy for potential congestion pressure or infrastructure strain, not as a direct measure of actual network use. This distinction is particularly important because the manuscript itself notes that VPP does not account for regional heterogeneity, charger power structure (alternating current—AC; direct current—DC; and high-power charging—HPC), or charging behaviour such as home or workplace charging.
The third group of variables captures the environmental context of the transition. CO2t denotes the source-reported average CO2 intensity of newly registered passenger cars, expressed in grams per kilometre. The series is taken directly from the secondary statistical source used in the study and is not estimated by the authors. Its exact averaging procedure follows the source methodology. In the present article, this indicator is used as a contextual market-level measure. It does not represent full life-cycle emissions and does not account for country-level electricity-generation mixes. Accordingly, it is used here to provide environmental context rather than to support strong causal interpretation within the short analytical window.
2.4. Year-on-Year Measures and Descriptive Dynamics
To describe the short-term pace of change in the main indicators, the study calculates year-on-year (YoY) dynamics. For any variable X
t the percentage annual change is defined as:
while the absolute annual change is defined as:
These measures are applied selectively depending on the interpretation of the variable. For example, public recharging points are naturally interpreted through percentage YoY growth, whereas changes in VPP are expressed in absolute units (vehicles per point), changes in PEV
t are interpreted in percentage points, and changes in CO
2t are expressed in g/km. This distinction is maintained in
Section 3, where the article separately reports growth in infrastructure scale and changes in strain, electrification and CO
2 intensity.
The use of YoY measures serves two purposes. First, it allows the analysis to capture asymmetry between infrastructure growth and changes in VPP, which is central to the article’s interpretation of a post-2021 “catch-up” phase. Second, it makes it possible to compare variables that are measured in different units by focusing on the direction and pace of annual changes rather than their levels alone. In this way, the descriptive part of the empirical analysis provides a bridge between long-run trends and the more formal core analysis.
2.5. Correlation Analysis
To quantify the direction and strength of co-movements among the main variables in the core sample, the study applies Pearson correlation analysis for the years 2020–2024. For two variables X
t and Y
t the Pearson correlation coefficient is computed as:
where
n denotes the number of annual observations in the core sample. In this study, n = 5, which requires particularly cautious interpretation of the coefficients. Accordingly,
Section 3 explicitly treats these correlations as indicators of direction and potential strength of co-variation, rather than as evidence of causal effects.
The set of correlations is used to examine several relationships that are central to the analytical framework of the article and to the discussion of the empirical results. These include the relationship between VPP and the number of recharging points, the relationship between VPP and PEV share, and the relationships between CO2 intensity and both infrastructure scale and electrification shares. Because the sample is small and all variables contain a strong time component, the role of the correlation matrix is diagnostic rather than confirmatory. It is used to assess whether the signs and relative magnitudes of pairwise co-movements are consistent with the catch-up interpretation advanced in the article.
2.6. Parsimonious Bivariate OLS Regressions
To complement the descriptive analysis, exploratory bivariate ordinary least squares (OLS) regressions were estimated for the 2020–2024 core sample. Because the number of observations is extremely small (N = 5), these models are used only as simplified diagnostic tools. They are not interpreted as causal models and they do not support strong inferential claims. Their purpose is limited to checking whether the signs and broad magnitudes of the associations are directionally consistent with the descriptive evidence. Particular caution is required in interpreting p-values, which in very small samples may change sharply after the addition of a single influential observation. For that reason, substantive plausibility and directional stability are emphasised more strongly than formal statistical significance.
The principal regression specification was used to assess the relationship between infrastructure strain and infrastructure scale. In this model, the dependent variable is the VPP indicator, while the explanatory variable is the logarithm of the number of public recharging points:
where
α denotes the intercept,
β is the slope coefficient, and
εt is the error term. This equation constitutes the core quantitative test of whether rapid infrastructure expansion after 2021 was associated with a reduction in infrastructure strain.
In addition to the main specification, several auxiliary bivariate OLS models were estimated in order to verify whether the direction of the association remained consistent across simple model variants. These additional specifications related VPP to total plug-in share and related CO2 intensity to both total plug-in share and the logarithm of public recharging points. Because of the very small sample size, these auxiliary models are treated as diagnostic only and are interpreted primarily in terms of coefficient sign and directional coherence rather than formal statistical significance.
These auxiliary models are treated as diagnostic rather than causal and are interpreted primarily in terms of coefficient sign and directional coherence rather than formal statistical significance.
2.7. Robustness Check Based on the 2025 Scenario
A separate robustness exercise extends the VPP series from 2020–2024 to 2020–2025 by adding the 2025 scenario observation. The purpose of this step is strictly limited: it checks whether the sign and broad interpretation of the VPP–infrastructure relationship remain stable after the inclusion of one additional non-historical point. Because the 2025 value is not treated as an observed historical datum and because the baseline sample is very small, the robustness test should be read only as a directional stability check. It does not strengthen causal interpretation and should not be understood as a formal validation exercise.
2.8. Software Environment and Implementation
The annual dataset was assembled and harmonised in a spreadsheet environment, where the raw series were aligned and the derived indicators were computed. Descriptive tables, YoY changes, and harmonised analytical series were first prepared in this environment. Correlations and bivariate OLS regression outputs were then generated using standard statistical routines consistent with the formulas and procedures described above. All computations were performed in Python 3.14.2 using pandas, NumPy, and statsmodels, and cross-checked for internal consistency. The same harmonised dataset was used to generate all tables and figures presented in
Section 3.
The adopted workflow ensures reproducibility at the level of annual indicators and allows the analytical design to be extended in future research to more detailed country-level, regional, or panel-based settings.
2.9. Methodological Limitations
The empirical design adopted in this study involves several important limitations. First, the core analytical window is based on only five annual observations, which severely constrains statistical inference. Second, the analysis is conducted at the aggregate European level and therefore masks country-level and regional heterogeneity. In addition, aggregate growth-rate comparisons do not substitute for country- or region-level assessment based on absolute circulating PEV stock and territorial infrastructure distribution. Third, the VPP indicator captures potential infrastructure strain only indirectly; it is not a direct measure of charger occupancy, waiting time, reliability or electricity-network load. Fourth, the dataset does not distinguish charger types and power classes (e.g., AC, DC, or high-power charging), nor does it account for public versus semi-public infrastructure. Fifth, the empirical framework does not control for home and workplace charging, user charging frequency, battery capacity, vehicle-segment mix, or spatial accessibility inequality. The use of market shares rather than absolute annual registration volumes is another simplification of the aggregate framework. Finally, the 2025 value is a scenario/projection and is used solely for robustness illustration. These constraints justify the revised descriptive and diagnostic positioning of the article and motivate future research using more disaggregated panel and operational data.
3. Results
3.1. Trends for 2015–2025: Electrification, Emissions and Infrastructure
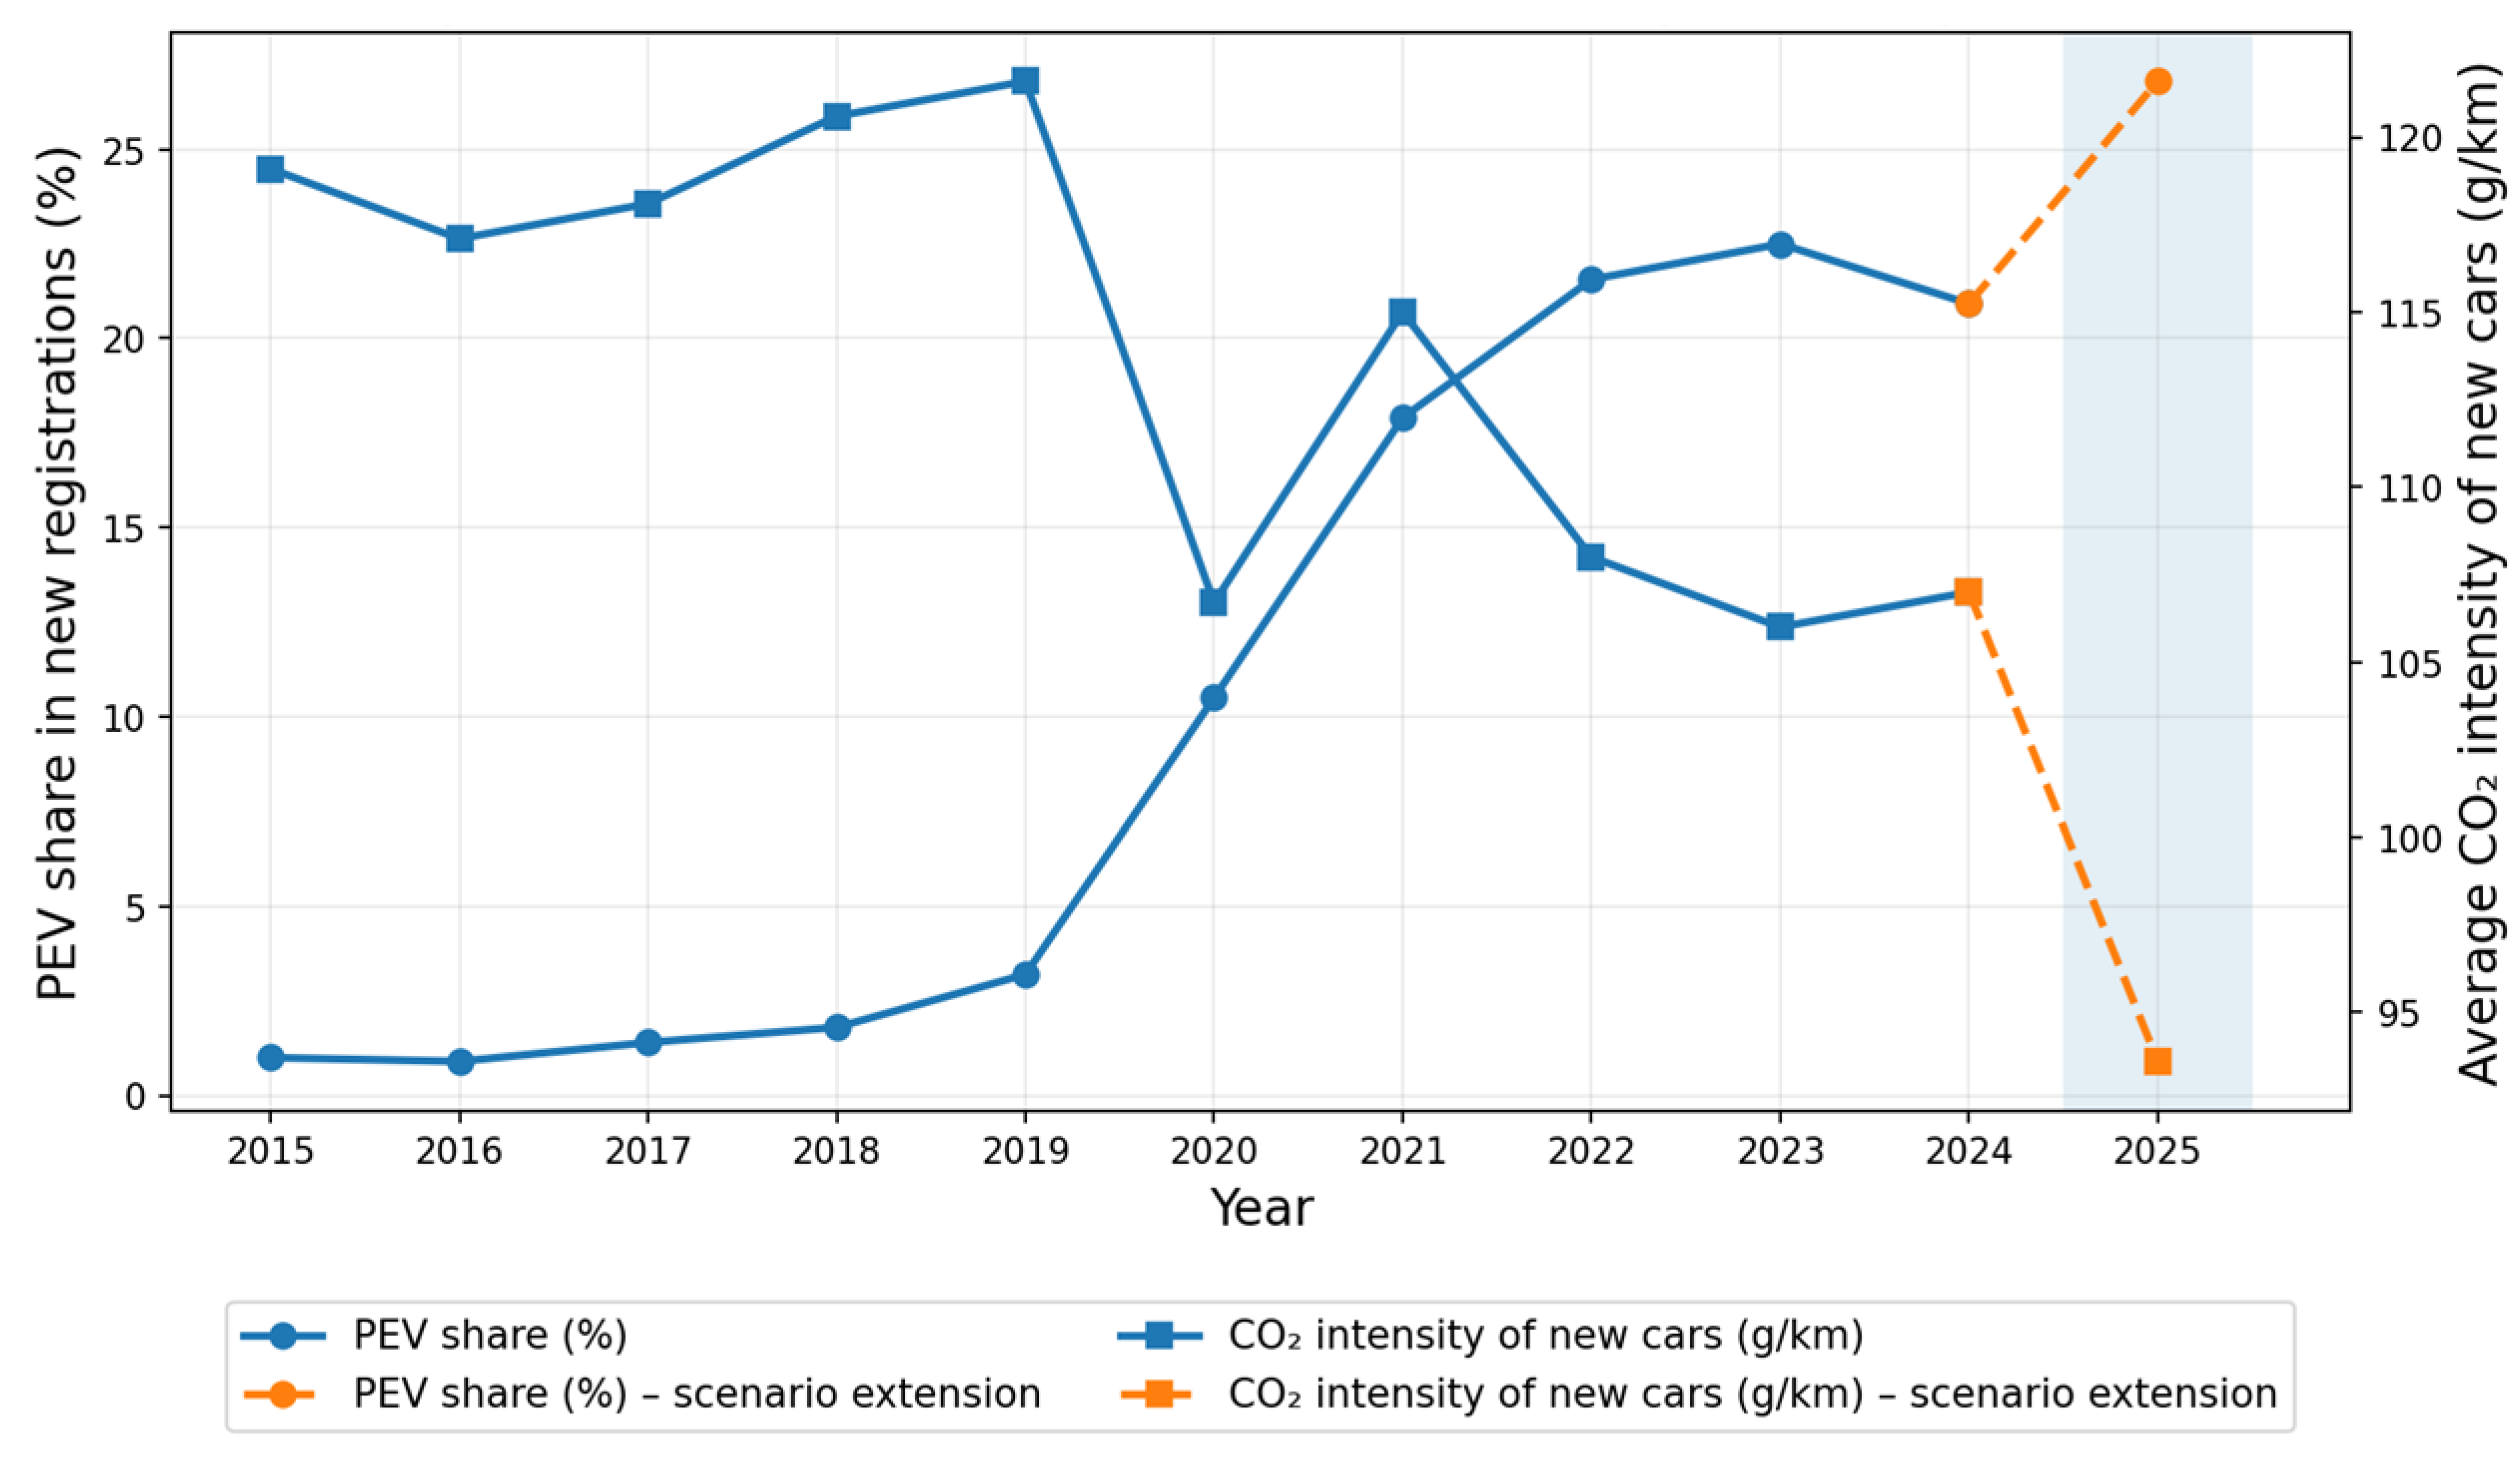
During the period under review, Europe experienced a marked acceleration in the electrification of new passenger car registrations, especially after 2019. At the same time, public charging infrastructure expanded rapidly. In the interpretation, it is important to distinguish historical observations from the scenario extension used for 2025. The values for 2015–2024 are treated as historical annual observations, whereas the values shown for 2025 are reported separately as a scenario/projection and are not used in baseline inference. This distinction is maintained in
Table 1 and
Figure 1.
At the same time, a change in the structure of PEVs is noticeable: in 2020–2022, growth was driven by both segments (BEVs and PHEVs), while in 2023–2024, BEVs are seen to have a relative advantage, with PHEVs losing market share (decline in PHEVs in 2023–2024 compared to 2022). This change may be relevant to the demand for public charging, as BEVs are more dependent on charging infrastructure than PHEVs (in terms of charging intensity and the inability to ‘sustain’ mobility with conventional fuel alone).
The average CO2 emissions of newly registered cars (g/km) show an overall downward trend, but with significant fluctuations over time. Between 2015 and 2019, the values remained relatively high and stable (from 117.1 g/km in 2016 to 121.6 g/km in 2019). In 2020, there was a very clear decrease to 106.7 g/km, which coincides with a significant increase in the share of PEVs.
In subsequent years, emissions did not fall monotonically: in 2021, an increase to 115.0 g/km was recorded, followed by a further decrease to 108.0 g/km in 2022 and a further improvement in 2023 (106.0 g/km). In 2024, the level remains similar (107.0 g/km), while in 2025 there is a very sharp decline to 93.6 g/km. This volatility suggests that the relationship between electrification of registrations and the average emissions of the new fleet may be modified by additional market and regulatory factors (including sales mix, vehicle segment structure, level of hybridisation of the non-PEV fleet, economic cycle, and changes in measurement/reporting procedures). Descriptively, periods of lower average CO2 intensity partly overlap with phases of faster electrification, although this pattern should not be interpreted as evidence of a direct short-run causal relationship.
Over the long term (2015–2025), there has been a clear acceleration in the electrification of new registrations in Europe, measured by the combined share of plug-in vehicles (PEV = BEV + PHEV). At the same time, the average CO
2 emissions of newly registered cars (g/km) show a downward trend over many years, although with significant fluctuations in short annual windows. These relationships are illustrated in
Figure 1, which shows the parallel evolution of PEV share and average CO
2 emissions in newly registered passenger cars. There is a particularly strong growth in the share of PEVs after 2019, while at the same time there is no complete monotonicity in CO
2 emissions year on year, which suggests the interaction of structural factors (sales segment mix, SUV share, manufacturer strategies) alongside the growth in the share of PEVs itself.
Over the long run, the combined PEV share increased from 1.0% in 2015 to 20.92% in 2024, while the number of public recharging points rose from 67,064 to 900,000. Average CO
2 emissions of newly registered passenger cars declined over the broader horizon, but not monotonically. This non-monotonicity is one reason why CO
2 is interpreted in the manuscript as a contextual environmental indicator rather than as a variable supporting strong short-window inference.
Figure 1 should therefore be read as a dual-axis descriptive overview. The dashed segment and shaded area indicate the separate 2025 scenario extension rather than an additional historical observation. It is important to note that the expansion in infrastructure is not solely a response to current demand; it is indicative of a more profound and long-term strategic intent. In practice, this may take the form of ‘pre-emptive’ investments aimed at lowering barriers to adoption (e.g., concerns about range and charging availability). In such cases, the short-term growth rate of charging points may periodically exceed the growth rate of the PEV fleet. This phenomenon is the subject of the core part of the analysis, which posits that such a discrepancy should lead to a decrease in infrastructure load indicators.
3.2. Empirical Core 2020–2024: The Burden on Public Charging Infrastructure in the Context of Electrification
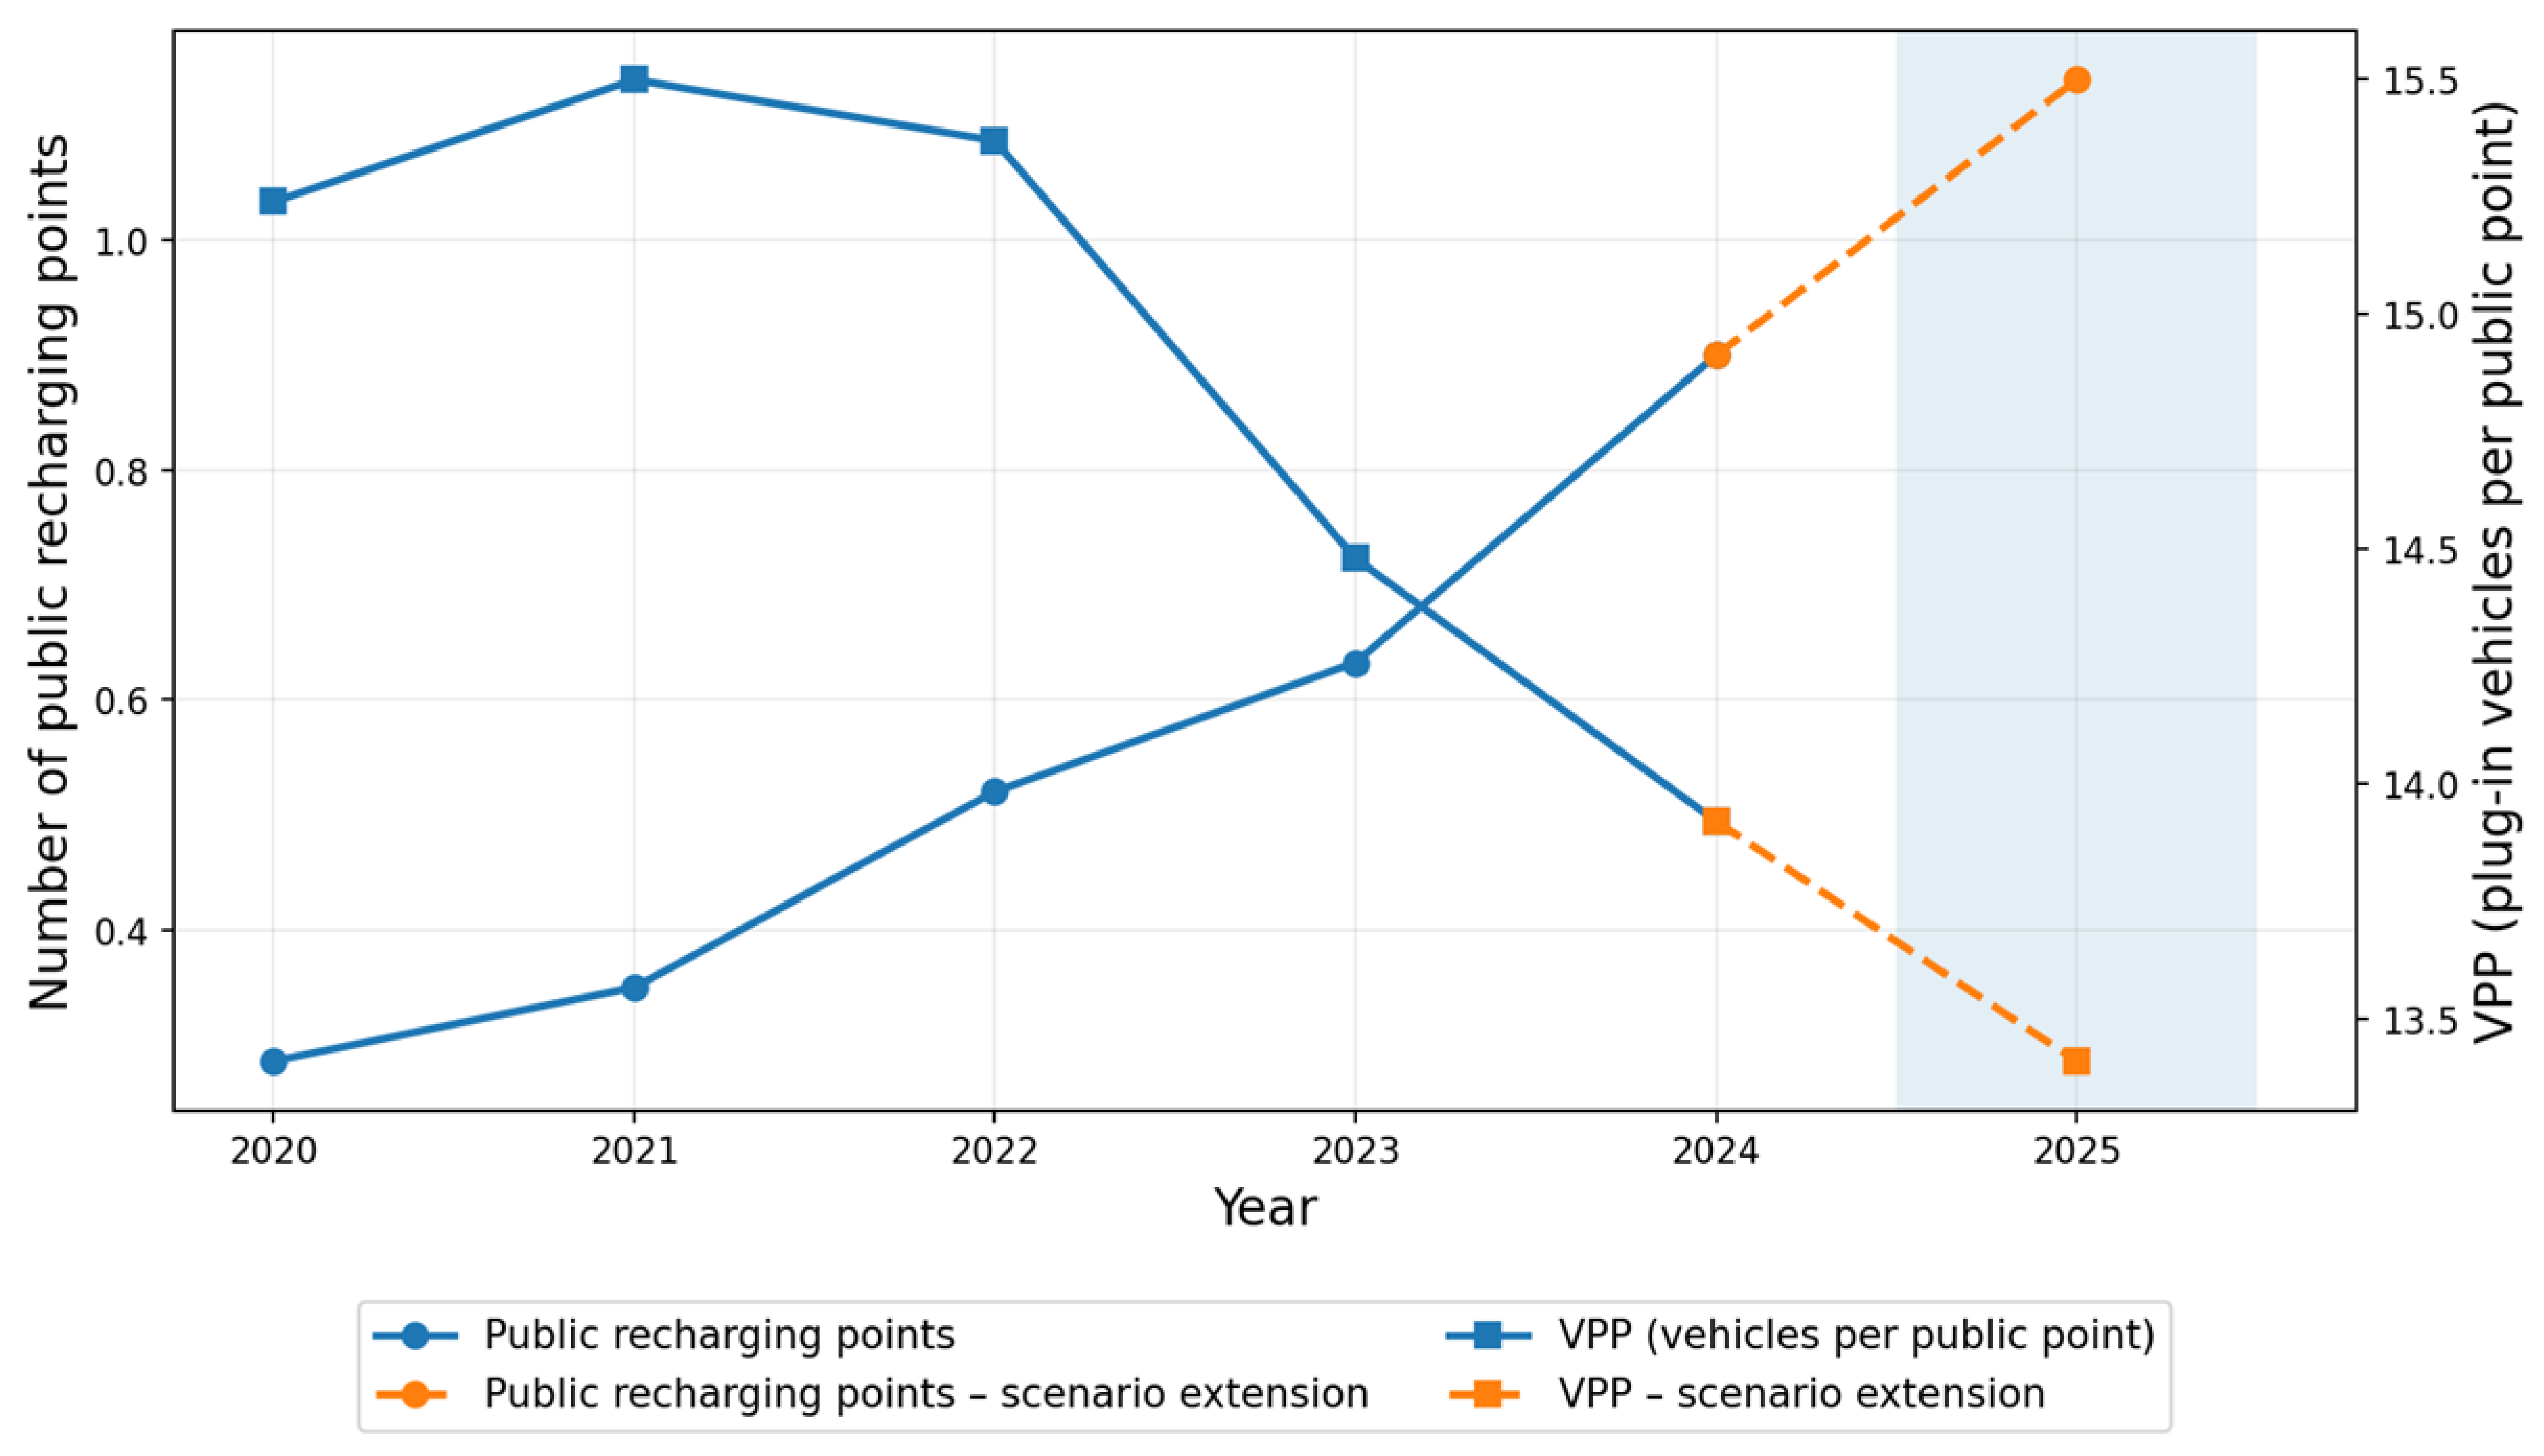
In the core diagnostic window (2020–2024), the VPP indicator increased slightly from 15.24 in 2020 to 15.50 in 2021 and then declined to 13.92 in 2024 (
Table 2). This pattern is consistent with, but does not by itself prove, an aggregate catch-up phase in infrastructure deployment after 2021. In other words, the expansion of public charging points appears to have outpaced the growth of the plug-in vehicle base in aggregate European terms during the later part of the core period. However, this interpretation should remain cautious because VPP is only a proxy of potential strain. It does not measure actual charger utilisation, queueing, reliability, the AC/DC/HPC mix, or the role of home and workplace charging.
Interpretatively, this trend is consistent with the catch-up mechanism: infrastructure developed so rapidly that the pressure generated by the plug-in fleet began to decrease in terms of charging points. From the perspective of the end user, this may be indicative of an improvement in the availability of charging points, given that there is a reduction in the number of vehicles competing for a single point. However, it is important to note that this is an aggregate indicator and does not take into account regional differences, the power structure of points (AC vs. DC/HPC) and charging behaviour (share of home/work charging).
The data indicate a substantial increase in the number of public recharging points between 2020 and 2024, alongside a decline in VPP. At the aggregate European level, this pattern is consistent with the interpretation that infrastructure expansion kept pace with, and in the later part of the period may have outpaced, the growth of the plug-in vehicle base. However, this conclusion should be treated cautiously. It does not replace assessment based on absolute circulating PEV stock at more disaggregated levels and does not rule out territorial mismatches, including cases in which some countries or regions combine relatively high PEV penetration with comparatively limited charging infrastructure.
The development of public recharging infrastructure in Europe is evidently increasing throughout the period 2015–2025, with a particular acceleration after 2020. Concurrently, in the 2020–2024 core sample, the infrastructure load index (VPP, number of plug-in vehicles per public recharging point) demonstrates a downward trend after 2021, which can be interpreted as a phase of infrastructure ‘catch-up’ in relation to the growing user base. The relationship between the scale of infrastructure (number of public recharging points) and the VPP indicator is demonstrated in
Figure 2. The juxtaposition of these two metrics on a shared timeline facilitates the discernment of the direction of change, whereby rapid infrastructure expansion concomitantly occurs with a diminution in load pressure as indicated by VPP.
As demonstrated in
Figure 2, this theoretical framework is supported by empirical evidence. The core empirical finding of the study, which is examined over the time window under review, suggests that the pace of infrastructure expansion may have exceeded the growth rate of ‘potential demand’ resulting from electrification. This theoretical framework suggests that this may have led to a decline in VPP.
The 2020–2024 trend suggests that a turning point may have occurred after 2021, when infrastructure development began to outpace the expansion of the plug-in vehicle base. A more detailed assessment of delayed relationships would require a longer time series and is therefore left for future research. At the same time, this post-2021 pattern may partly reflect the broader market normalization that followed the pandemic-related disruptions of 2020–2021.
The analysis period, which covers the years from 2020 to 2024, demonstrates a consistent upward trend in the total share of PEVs in new registrations, with a notable increase from approximately 10.5% in 2020 to approximately 22.5% in 2023. However, there is a slight decline in 2024, with the figure reaching approximately 20.92%. Concurrently, there has been a decline in VPPs since 2022. This coexistence of an increase in the share of PEVs and a decline in VPPs is consistent with the interpretation that the market is entering a phase in which infrastructure investments not only keep pace with but periodically outpace demand growth.
This finding has significant ramifications for the original conception of ‘mismatch’ in terms of its implications for congestion. The notion of mismatch does not necessarily imply a persistent increase in congestion; rather, it may evolve across different phases of market and infrastructure development. In practice, at least two regimes are identifiable: the initial regime is characterised by a rapid escalation in adoption, which outpaces the development of infrastructure. Concurrently, the VPP experiences a corresponding growth trajectory. In contrast, the subsequent regime, termed the catch-up regime, is marked by a concurrent acceleration in infrastructure expansion and a decline in the VPP. The 2020–2024 window indicates that the catch-up regime is likely to dominate after 2021.
In the period 2020–2024, it is projected that there will be a decrease in the emissions of newly registered cars from 2020 to 2023 (106.7 to 106.0) and a subsequent maintenance of a similar level in 2024 (107.0). Concurrently, the proportion of PEVs is projected to rise between 2020 and 2023, while the infrastructure (recharging points) is expected to undergo substantial expansion. Descriptively, this pattern is consistent with the view that the electrification of new registrations may be associated with a reduction in the CO2 intensity of newly registered cars, although the relationship is not fully monotonic from year to year.
The findings of this particular segment of the study suggest that, in the near term, the average emissions of the new fleet may be influenced by factors analogous to electrification, including segment structure, changes in SUV shares, regulatory factors, prices and preferences. This renders the employment of a model approach, in which the role of PEV share and infrastructure is tested whilst controlling for the time trend, all the more justifiable. The interpretation of this approach focuses on the consistency of the effects and their sign, rather than solely on formal statistical significance (especially with a small number of observations in the 2020–2024 core).
3.3. Year-on-Year Dynamics in the Core Sample
In order to capture more accurately the dynamics of charging infrastructure adaptation to growing electrification, the core analysis (2020–2024) has been supplemented with a year-on-year (YoY) comparison of key indicators. The indicators include the number of public charging points (recharging points), the infrastructure load index (VPP, number of plug-in vehicles per 1 public point), the total share of plug-in vehicles in new registrations (PEV share), and average CO
2 emissions of newly registered cars (g/km). The detailed values of levels and year-on-year changes in 2020–2024 are presented in
Table 3.
The YoY summary reveals a marked asymmetry in dynamics. The number of public charging points in the studied period is increasing rapidly, while after 2021, the VPP index shows a downward trend. This phenomenon aligns with the “catch-up” interpretation of infrastructure, wherein the rate of infrastructure expansion (denominator) surpasses the rate of growth in the number of plug-in vehicles (numerator), resulting in a reduction in the load per single point. From a pragmatic standpoint, this may be regarded as a prerequisite for enhancing the accessibility of public charging on a collective scale. It should be noted, however, that this indicator fails to differentiate between geographical variations or the quality of infrastructure (e.g., charger power, reliability).
Concurrently, YoY changes in the average CO2 emissions of new cars are non-monotonic, thereby confirming that the emissions of the newly registered fleet in the short term are shaped not only by progressive electrification, but also by structural and market factors (e.g., sales segment mix, share of heavier vehicles, manufacturer strategies, and regulatory conditions). Consequently, the interpretation of changes in CO2 in this article focuses on the consistency of the direction of these changes and their links to electrification and infrastructure development, rather than on simple year-on-year conclusions.
3.4. Robustness Check: Treating 2025 as a Scenario Observation for VPP
In accordance with the adopted methodological assumptions, the year 2025 in the VPP series is treated solely as a scenario/projection value, and the baseline conclusions are based on the years 2020–2024. As part of the sensitivity analysis, it was checked whether the inclusion of 2025 (scenario) changes the fundamental conclusion regarding the direction of changes in infrastructure load.
A comparison of the values for 2024 and 2025 indicates a continuation of the downward trend in VPP with a further increase in the number of public charging points and an increase in the share of PEVs in new registrations. A summary of levels and year-on-year changes for 2023–2025 (with 2025 as the scenario) is presented in
Table 4. In interpretative terms, this means that the 2025 scenario does not reverse the conclusions of the baseline scenario, but is consistent with them in terms of direction.
Furthermore, a comparison was made of the stability of the relationship between the VPP indicator and the infrastructure scale (measured by the logarithm of the number of public recharging points) in two variants: the baseline (2020–2024) and the extended 2025 scenario (2020–2025). The results of the comparison of parameters and model fit are presented in
Table 5. The sign of the relationship remains unchanged (negative), and the inclusion of 2025 does not lead to a reversal of the conclusion about infrastructure catch-up; on the contrary, the relationship becomes quantitatively stronger. However, it should be emphasised that, due to the limited sample size, these results serve to verify the consistency and stability of the direction of the relationship and do not constitute formal proof of causality.
The robustness exercise shows that adding the 2025 scenario point does not reverse the sign of the VPP–infrastructure relationship. The coefficient remains negative, which is directionally consistent with the catch-up interpretation. At the same time, the marked change in the p-value after adding a single scenario observation illustrates the extreme sensitivity of very small samples to one additional, potentially high-leverage point. For this reason, the manuscript does not treat the scenario-extended specification as stronger inferential evidence. Instead, it uses it only to verify directional stability.
3.5. Correlation Analysis in the Core Sample
In order to quantitatively capture the direction and strength of the relationship between key indicators of electrification and infrastructure development, a correlation analysis was performed for a core sample covering the years 2020–2024 (N = 5). In view of the negligible sample size, the correlations should be interpreted primarily as indicators of the direction and potential strength of co-variation, rather than as evidence of cause-and-effect relationships. A summary of Pearson’s correlation coefficients can be found in
Table 6.
The strongest and most intuitive relationship in the core sample is the negative correlation between the VPP infrastructure load indicator (number of plug-in vehicles per public charging point) and the number of public recharging points. The coefficient obtained is r = −0.908, which indicates a strong co-variation consistent with the catch-up mechanism: as the number of charging points increases, the load per single point decreases (
Table 6). This result reinforces the descriptive observation of trends presented earlier (
Figure 2 and
Table 2), suggesting that in the time window under study, the rate of infrastructure development may have exceeded the rate of growth of the plug-in user base in aggregate terms.
In the context of the relationship between VPP and the dynamics of electrification of new registrations (PEV share), a moderately negative correlation is observed (r = −0.431;
Table 6). However, it is imperative to exercise greater caution when interpreting this relationship, as both the PEV share and the number of charging points exhibit a pronounced time trend component. In practice, this suggests that the negative correlation between VPP and PEV share may be indicative of the predominant influence of infrastructure expansion (denominator) in the VPP relationship, as opposed to a straightforward relationship between PEV adoption and load.
For the average emissions of newly registered cars (CO
2, g/km) in the 2020–2024 sample, no significant linear co-variation with PEV share is observed (correlation close to zero: r = −0.065;
Table 6). This finding aligns with the preceding conclusion that the average emissions of the new fleet may be contingent on numerous factors concomitant with electrification (e.g., sales segment structure, SUV share, manufacturer strategies, and regulatory conditions), which may obscure the direct relationship between ‘more PEVs’ and “less CO
2”. Concurrently, the moderately negative correlation between CO
2 and the number of recharging points (r = −0.427;
Table 6) suggests a potential co-variation in the anticipated direction. Nevertheless, it is imperative to emphasise that the outcome may be significantly influenced by the trend and the limited sample size.
3.6. Minimalist Bivariate OLS Regressions in the Core Sample
In order to enhance the quantitative aspect of the results beyond simple correlations, a series of minimalist OLS linear regressions were conducted for the 2020–2024 core sample (N = 5). A deliberately simplified approach was adopted in order to limit the risk of overfitting the models with a very small number of observations. The regression results are summarised in
Table 7.
The most informative model was found to be the specification combining the infrastructure load index with the infrastructure scale measure. Level B1_VPP is defined as the logarithm of the recharging points.
The findings reveal a distinctly negative slope parameter (β = −1.26), indicating that an augmentation in infrastructure scale (as gauged by the logarithm of the number of public charging points) is concomitant with a decline in VPP, consequently leading to a reduction in the load per individual point (
Table 7). The model demonstrated a satisfactory fit, evidenced by a high R
2 value of 0.729; however, the statistical significance was marginal, with a
p-value of approximately 0.066. This is likely attributable to the limited sample size. In substantive terms, however, this result provides strong empirical support for the ‘catch-up’ interpretation: in 2020–2024, it is precisely the rapid growth of infrastructure that appears to be a key factor in reducing load pressure (in terms of the vehicle/point ratio).
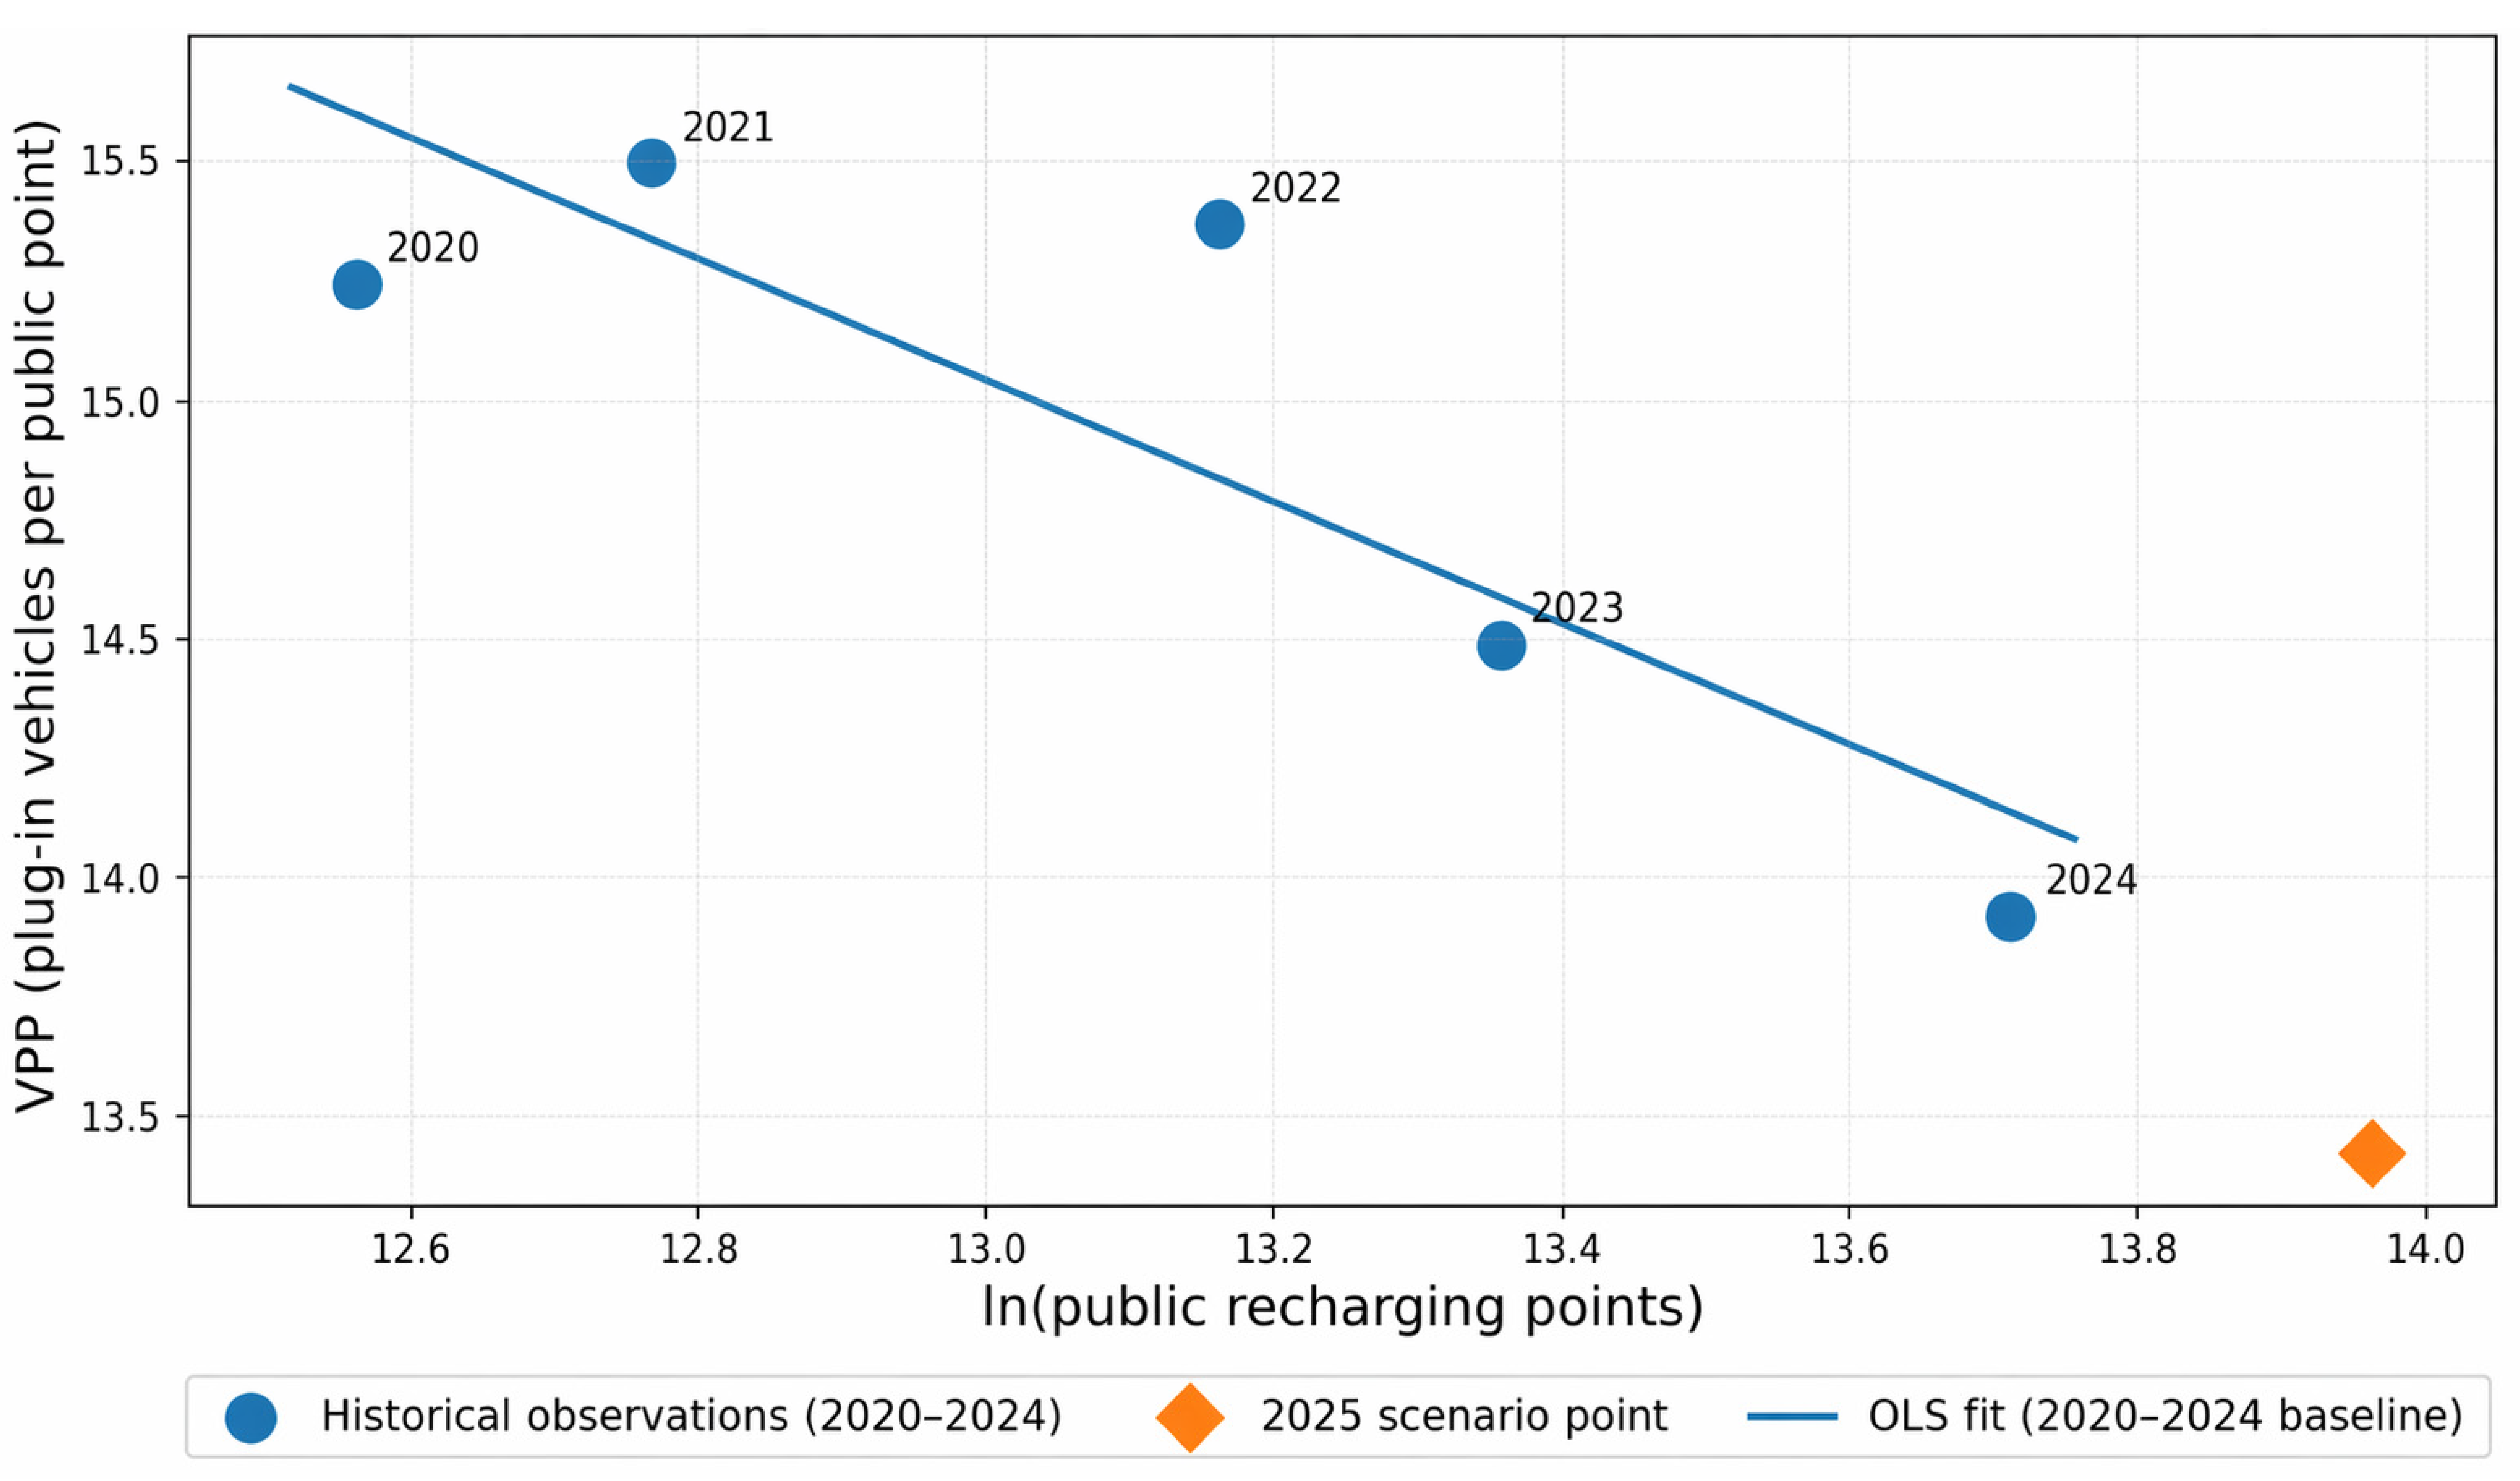
In order to verify whether the co-occurrence of infrastructure growth and VPP decline observed in the trends also has a quantitative dimension in the core data, the relationship between VPP and the scale of infrastructure expressed as the logarithm of the number of public charging points was analysed. As illustrated in
Figure 3, the scatter plot for the 2020–2024 period is presented, along with the fitted line. The findings of this study demonstrate a clear negative correlation, which is consistent with the results of the correlation and minimalist regression model (
Table 6 and
Table 7). From an economic and institutional interpretation perspective, this means that as the scale of the public charging network increases, the load per single point decreases, which is consistent with the infrastructure catch-up mechanism.
Figure 3 presents the baseline 2020–2024 scatter of VPP against the logarithm of public recharging points and shows a negative fitted relationship. The visual pattern is directionally coherent with the correlation results and with the exploratory bivariate OLS specification. The 2025 scenario point may be shown separately in the figure, but it should not be used to visually overstate the inferential power of the baseline relationship.
4. Discussion
The discussion can also be extended by considering wireless charging as an emerging technological direction. Although it remains outside the empirical scope of this article, wireless charging may become relevant for selected operational environments such as public transport, commercial fleets, logistics nodes, and convenience-oriented urban charging. Its current significance lies less in aggregate scale than in its potential to alter charging behaviour and reduce selected barriers to use. Future research could assess whether such technologies change the relationship between apparent infrastructure sufficiency and actual charging convenience [
28,
29].
The empirical evidence suggests that, between 2020 and 2024, Europe entered a phase that can be interpreted as a charging infrastructure “catch-up” relative to the expanding electrification of transport. In the 2020–2021 period, the VPP infrastructure load ratio (plug-in vehicles per one public charging point) remained broadly stable. After 2021, however, VPP gradually declined while the number of public recharging points increased substantially (
Table 2 and
Figure 2). This pattern is consistent with a simple system-level interpretation: if infrastructure expansion (the denominator) grows faster than the plug-in vehicle base (the numerator), pressure on each individual point declines [
30,
31,
32].
This finding is analytically significant because it shifts the discussion from the question of whether infrastructure is merely keeping pace to whether it is structurally catching up, and at what rate. A large body of literature and market reporting has long suggested that a mismatch between charging infrastructure and the growing EV fleet may act as a barrier to adoption [
7,
8]. This concern is closely related to range anxiety and charging anxiety, both of which affect users’ willingness to switch to electric mobility [
33,
34,
35,
36,
37]. Against this background, the present results indicate that Europe entered a period of accelerated infrastructure expansion, which contributed to a reduction in the pressure measured by the VPP indicator.
This interpretation is consistent with institutional and market evidence pointing to the acceleration of public charging deployment in Europe after 2020 [
34,
38]. Reports by the International Energy Agency also underline that the rapid expansion of public charging infrastructure is an important condition for the transition from early adoption to broader market diffusion in many regions, including Europe [
1,
4].
At the same time, the VPP metric has an important interpretive limitation. It provides a simple and intuitive approximation of infrastructure load, but it does not directly measure actual usage, such as charging sessions, occupancy time, queues, uptime, or service quality. This matters because the “vehicles per point” ratio is often used in reports and policy discussions as a rapid comparative metric, even though it cannot by itself distinguish between nominal infrastructure availability and effective infrastructure performance [
39,
40,
41].
A central interpretive caveat is that aggregate infrastructure counts do not reveal the technical or behavioural structure of charging demand. BEVs are generally more dependent on public charging than PHEVs, while charger power classes (AC, DC, and high-power charging) differ substantially in turnover potential and service function. Moreover, a large share of charging may still take place at homes and workplaces, which means that public infrastructure strain cannot be inferred solely from vehicle stock or registration shares. For this reason, the VPP indicator should be read as a proxy for potential infrastructure pressure rather than as a measure of actual utilisation.
This interpretation is supported by literature based on operational charging-network data, which shows that actual infrastructure use varies substantially across time and location [
42,
43,
44]. Charger type, charging power, price structure, and site characteristics all influence station performance. For example, studies of fast-charging networks indicate that utilisation patterns depend strongly on location and evolving demand conditions. This supports the view that VPP may serve as a useful aggregate “barometer” of system pressure, but it cannot replace operational metrics such as occupancy, reliability, waiting times, or delivered energy [
45,
46].
It is also important to note that European infrastructure statistics are based on a complex methodology of data collection, operator reporting, and verification. This increases the reliability of public charging-point data, but it does not eliminate definitional differences concerning points versus locations, public accessibility, and operational status. In this respect, EAFO methodological notes provide an important interpretive framework for reading the infrastructure series used in this article [
47,
48,
49,
50,
51].
The decline in VPP after 2021 can be interpreted as the result of several mutually reinforcing economic and institutional mechanisms. First, the data point to a marked acceleration in public charging deployment after 2020 (
Table 1), suggesting that infrastructure development was not merely reactive to already observed fleet growth, but also forward-looking and barrier-reducing in character. From an economic perspective, this implies a temporary phase in which the rate of infrastructure expansion exceeded the rate of growth in the potential user base. Under such conditions, a decline in VPP is a natural consequence of the denominator growing faster than the numerator [
25].
The policy relevance of these findings lies primarily at the system-design level. AFIR has shifted the European debate from general support for infrastructure expansion toward more concrete deployment requirements, especially along major transport corridors and in relation to minimum power provision, user information, and payment interoperability [
3]. In this context, the results of the present article support the view that infrastructure policy should not rely exclusively on aggregate point counts. Greater attention should be paid to the power structure of the network, interoperability, reliability, corridor continuity, and accessibility in underserved areas [
52].
A further mechanism concerns the changing composition of the electrified vehicle market. The data show an increase in the relative importance of BEVs compared with PHEVs in new registrations between 2022 and 2024 (
Table 2). From an infrastructure perspective, this matters because battery-electric vehicles are, in principle, more dependent on charging than plug-in hybrids, especially in user groups with limited access to private charging. Intuitively, a rising BEV share could therefore increase pressure on public infrastructure. However, if public charging deployment expands rapidly at the same time, including through larger and multi-point charging locations, the supply effect may outweigh the demand effect. Under such circumstances, a growing BEV share does not have to translate into higher VPP and may coexist with its decline [
5,
53,
54,
55].
An improving aggregate VPP ratio should not be interpreted as evidence that spatial accessibility problems have been resolved. Aggregate catch-up may coexist with charging deserts, rural under-provision, and uneven territorial coverage. In other words, average European improvement may conceal persistent local bottlenecks. A major implication is that future assessment frameworks should combine aggregate infrastructure indicators with territorial accessibility measures and regional distribution analysis [
56,
57,
58,
59].
Taken together, these mechanisms suggest that the decline in VPP after 2021 should not be interpreted as being at odds with growing electrification. Rather, it reflects a change in the relationship between the rate of infrastructure growth and the rate of growth in the plug-in vehicle market. In the context of accelerated investment, regulatory support, and market maturation, it becomes possible to move from a phase of potential infrastructure overload to a phase of gradual catch-up, in which pressure on individual charging points declines despite the continued growth of electrified vehicle shares [
3,
4,
14,
25].
The findings concerning CO
2 emissions of new cars (g/km) in the 2020–2024 core period do not indicate a robust linear relationship with the PEV share. This is visible both in the descriptive evidence (
Table 2) and in the elementary statistical results based on a very small number of annual observations. This outcome is consistent with broader literature and institutional analyses suggesting that average emissions of the new fleet depend not only on electrification, but also on sales mix, SUV penetration, hybridisation patterns, and supply-side strategies. Thus, even if the broader long-term relationship between electrification and lower average CO
2 emissions is theoretically plausible, it may be obscured in short annual windows by structural market factors [
1,
60,
61].
From a methodological perspective, this means that CO
2 is more appropriately treated here as a contextual environmental indicator than as a variable supporting strong causal claims within a five-observation core sample. At the same time, the longer-term pattern shown in
Figure 1 suggests that turning points in electrification broadly coincide with periods of lower average emissions, which may provide a useful starting point for future research using richer datasets, country panels, and additional control variables [
1].
More broadly, the findings of this study support the view that charging infrastructure is a necessary condition for large-scale EV diffusion, but that the number of charging points alone is not a sufficient indicator of infrastructure adequacy. Earlier analyses, including those by Transport & Environment, have emphasized that the ratio of electric vehicles to public charging points is important for assessing investment needs, but that the interpretation of this ratio depends on how quickly both the EV fleet and the charging network evolve [
1,
4]. In this respect, the present results suggest that between 2022 and 2024 Europe experienced a phase of accelerated aggregate infrastructure expansion, which reduced the average load per public charging point.
At the same time, evidence based on operational charging data indicates that system availability depends not only on the number of points, but also on their spatial distribution, power, pricing structure, and reliability. This means that the VPP indicator may improve at the aggregate level while local bottlenecks persist, for example during seasonal peaks or along heavily used corridors [
40,
62,
63,
64]. Therefore, infrastructure policy should not focus solely on increasing point counts, but should also address capacity, location, reliability, and service quality.
5. Limitations and Directions for Further Research
The findings presented in this article should be interpreted in light of several methodological and empirical limitations. First, the core analytical window for the VPP-based assessment covers only the years 2020–2024, which results in a very small annual sample. This severely limits the scope for formal statistical inference and requires that correlations and bivariate regressions be interpreted as descriptive and diagnostic tools rather than as a basis for strong causal claims. In particular, the sensitivity of coefficients and p-values to the inclusion of a single additional observation confirms the fragility of very small-sample estimates.
Second, the analysis is conducted at the aggregate European level. This makes it possible to identify broad systemic tendencies, but it also masks substantial heterogeneity across countries and regions. Aggregate growth-rate comparisons do not substitute for country- or region-level assessment based on absolute circulating PEV stock and territorial infrastructure distribution. As a result, an improving average European indicator may coexist with persistent local bottlenecks, corridor gaps, or rural under-provision in specific territories.
Third, the VPP indicator itself has important interpretive limits. It captures potential infrastructure strain only indirectly and should not be read as a direct measure of charger occupancy, queueing, utilisation intensity, reliability, delivered energy, or electricity-network load. Likewise, the aggregate framework does not distinguish between charger types and power classes, such as alternating current, direct current, and high-power charging, nor does it fully capture the functional differences between public, semi-public, and other charging environments.
Fourth, the empirical framework does not account for several behavioural and structural determinants of charging demand and emissions outcomes. These include home and workplace charging availability, user charging frequency, battery capacity, fleet composition, vehicle-segment mix, and spatial accessibility inequality. The use of market shares rather than absolute annual registration volumes is another simplification of the aggregate framework and may obscure changes in absolute market scale.
Fifth, the CO2 variable used in the article is a source-reported market-level indicator of the average emissions intensity of newly registered passenger cars. It is not estimated by the authors, does not represent full life-cycle emissions, and does not account for country-level electricity-generation mixes. For this reason, it should be interpreted only as a contextual environmental indicator and not as a basis for strong short-run causal conclusions concerning the impact of electrification or infrastructure expansion.
Finally, the 2025 values are treated only as scenario-based extensions and are not part of the baseline historical inference. Their role is limited to a directional robustness check and they should not be interpreted as strengthening the inferential power of the study.
6. Implications for Public Policy and Market Practice
6.1. From Quantitative Targets to Functional Targets
The findings of this study have several implications for public policy and market practice, particularly with regard to how charging infrastructure development should be monitored, prioritised, and evaluated. At the aggregate European level, the post-2021 decline in the VPP ratio, combined with the rapid growth in the number of public charging points, is consistent with a catch-up phase in infrastructure deployment. In the present article, however, VPP is interpreted as a proxy of potential infrastructure strain rather than as a direct measure of actual utilisation. For this reason, an improving VPP ratio should not be equated automatically with effective availability from the user’s perspective.
From a policy standpoint, this implies that infrastructure development should be assessed not only through point counts, but also through functional criteria. These include charging power, reliability, interoperability, payment accessibility, hub capacity, and spatial coverage. In this sense, the findings support an approach in which quantitative deployment targets are complemented by indicators of infrastructure performance and user relevance. This interpretation is consistent with the broader European regulatory direction, especially under AFIR, which places increasing emphasis on functionality, corridor continuity, and practical usability.
6.2. Territorial Accessibility and Infrastructure Disparities
A decline in the average VPP ratio does not mean that charging infrastructure is developing uniformly across Europe. Aggregate improvement may coexist with substantial territorial disparities, including persistent gaps in peripheral, rural, or less commercially attractive areas. In such cases, average European indicators may improve while local bottlenecks, limited accessibility, or charging deserts remain significant barriers to EV adoption.
For this reason, the design of charging networks should combine market logic with territorial cohesion. On the one hand, infrastructure naturally tends to concentrate in locations with stronger demand and higher commercial viability. On the other hand, public policy should address under-served areas where the market alone may not provide sufficient coverage. The practical implication is that transition monitoring should not rely exclusively on European averages, but should also incorporate territorial accessibility and distribution-sensitive measures.
6.3. Balancing the Risk of Infrastructure Gaps and Overbuilding
From the perspective of users, a declining VPP ratio may signal improving access to public charging and lower barriers to electromobility. From the perspective of operators and investors, however, the picture is more complex. Lower average load per point may also imply the risk that some newly installed infrastructure remains underutilised, especially in locations where demand growth is weaker or more volatile. This is particularly relevant for higher-cost infrastructure segments, such as DC fast charging and high-power charging.
Policy and market practice must therefore balance two opposing risks: the risk of an infrastructure gap that slows electrification, and the risk of overbuilding in locations where utilisation remains persistently low. This suggests the need for more data-driven siting and investment strategies, based on demand patterns, mobility flows, seasonality, and corridor relevance, rather than on administrative point-count targets alone. At the same time, public support mechanisms may remain justified in locations where commercial viability is weak but minimum accessibility standards are strategically important.
6.4. The VPP Indicator as an Early-Warning Tool
The analysis suggests that the VPP indicator can serve a useful diagnostic role as a simple measure of the relationship between the plug-in vehicle base and publicly available charging infrastructure. In this sense, it may function as an early-warning tool indicating whether infrastructure deployment is broadly keeping pace with market electrification at the aggregate level.
At the same time, VPP should not be treated as a standalone or sufficient measure of infrastructure adequacy. It does not capture charger quality, power, actual utilisation, reliability, queueing, or user experience. A more realistic monitoring framework should therefore combine VPP with additional indicators related to charging capacity, AC/DC/HPC structure, service quality, interoperability, and territorial accessibility. Only such a broader indicator set can support a more complete assessment of whether charging infrastructure is not only expanding, but also functioning effectively and equitably.
7. Conclusions
This article examined whether the recent expansion of public charging infrastructure in Europe has kept pace with the accelerating electrification of new passenger car registrations. The study combined a long-run descriptive perspective for 2015–2025 with a more focused core analytical window for 2020–2024, i.e., the period for which a consistent infrastructure strain proxy—plug-in vehicles per public charging point (VPP)—was available. Within this framework, the article sought to assess how the development of public charging infrastructure related to electrification dynamics and how these developments should be interpreted in a broader environmental and policy context.
The results indicate that the rapid growth of electromobility in Europe has been accompanied by a substantial expansion of public charging infrastructure. At the same time, the VPP ratio gradually declined after 2021, suggesting that the growth rate of public charging points exceeded the growth rate of the potential plug-in vehicle user base during the analysed period. From a system-level perspective, this pattern may be interpreted as a sign of infrastructural catch-up, that is, an improving alignment between infrastructure supply and the expanding scale of electrification.
The core empirical results for 2020–2024 are directionally consistent with this interpretation. Correlation analysis and parsimonious bivariate regressions point to a negative association between infrastructure scale and VPP, which is substantively plausible in light of the observed post-2021 expansion of charging points. However, these findings should be interpreted with caution. The core sample is very small, and the statistical results are therefore exploratory and diagnostic rather than confirmatory. For this reason, the article does not treat the estimated relationships as evidence of causality, but rather as an indication of the direction and coherence of the aggregate patterns observed in the European market.
The findings concerning average CO2 emissions of newly registered cars are more ambiguous. In the short 2020–2024 core window, the analysis does not show a robust relationship between CO2 intensity and either PEV share or infrastructure scale. This suggests that the emissions profile of newly registered vehicles is shaped not only by electrification, but also by a wider set of structural factors, including sales mix, SUV penetration, hybridisation patterns, and manufacturer strategies. In this study, CO2 should therefore be interpreted primarily as a contextual environmental indicator rather than as a variable supporting strong short-window inferential claims.
The article’s contribution lies in showing that a simple aggregate indicator such as VPP can be useful for describing the evolving relationship between electrification and charging infrastructure in a period of rapid market transformation. At the same time, the study also demonstrates the limits of relying on point counts alone. Public charging adequacy cannot be fully assessed without considering charger type and power, operational utilisation, reliability, interoperability, and spatial accessibility. An improvement in average aggregate indicators does not necessarily imply that local bottlenecks, corridor gaps, or rural charging deserts have been eliminated.
These conclusions also have implications for infrastructure policy. The results support the view that public policy should move beyond purely quantitative targets and place greater emphasis on functional deployment criteria, including network quality, power structure, continuity along corridors, and accessibility in underserved areas. In this sense, the findings are broadly consistent with the system-design logic reflected in AFIR and related European policy debates.
At the same time, the study has important limitations. First, the core empirical analysis is based on only five annual observations, which substantially limits inferential power. Second, the analysis is conducted at the aggregate European level, which makes it possible to identify broad systemic tendencies but masks cross-country and regional heterogeneity. Third, the VPP indicator is only a proxy for potential infrastructure strain and does not measure actual utilisation, queueing, occupancy, delivered energy, or service quality. Fourth, the analysis does not distinguish between charger types and power classes, nor does it separately model BEV- and PHEV-specific charging dependence. Finally, the 2025 values should be interpreted as scenario-based extensions rather than as part of the baseline historical inference.
Future research should therefore proceed in several directions. A particularly important next step would be to extend the analysis to the national or regional level, where infrastructure inequalities and accessibility gaps can be assessed more directly. Further studies should also distinguish between AC, DC, and high-power charging, incorporate operational indicators of actual network use, and explore BEV-specific infrastructure strain measures. In addition, more robust environmental assessment would require richer datasets with additional control variables capturing fleet composition and market structure. Such extensions would allow a more realistic evaluation not only of how much infrastructure exists, but also of how effectively it supports the practical and spatial requirements of Europe’s transport electrification.