Article

High-Efficiency Synthetic Natural Gas and Decarbonised Power Production from Biogenic Waste: Simulation, Energy Analysis and Thermal Optimisation of the Integrated System

1
Department of Engineering Sciences, Guglielmo Marconi University, via Plinio 44, 00193 Rome, Italy
2
Industrial Engineering Department, University of L’Aquila, Piazzale E. Pontieri 1, Monteluco di Roio, 67100 L’Aquila, Italy
*
Author to whom correspondence should be addressed.
Energies 2026, 19(8), 1887; https://doi.org/10.3390/en19081887
Submission received: 19 February 2026 / Revised: 31 March 2026 / Accepted: 2 April 2026 / Published: 13 April 2026
(This article belongs to the Special Issue Recent Advances in Biomass Energy Utilization and Conversion)

Abstract

This study presents a fully integrated process for the flexible conversion of biogenic waste into synthetic natural gas (bio-SNG) and electricity centred on a 100 kWth dual concentric bubbling fluidised bed steam gasifier. The raw syngas is processed in a high-temperature gas cleaning section, and the resulting clean, H2-rich syngas is directed to three alternative downstream configurations: (i) conventional methanation, (ii) enhanced methanation with external H2 supplied by a reversible solid oxide cell (rSOC), and (iii) electricity generation via the same rSOC operating in fuel cell mode. The overall process is modelled in Aspen Plus, in which the gasification section is constrained by experimentally derived syngas data, while downstream units are described through thermodynamic and kinetics-based models. Methanation is simulated using a plug-flow reactor model based on validated kinetic expressions, while the rSOC operating in electrolysis and fuel cell mode is modelled using performance parameters of commercial stacks. A plant-wide heat integration strategy based on composite curve analysis is implemented to maximise internal heat recovery and minimise external utilities. The enhanced methanation configuration enables the production of bio-SNG with high methane content (up to 93.3 vol.% dry, N2-free), with a yield 0.72 kg/kgBiomass and a fuel efficiency of 70.1%. In electricity production mode, the system reaches an electrical efficiency of 43.1% with complete elimination of auxiliary fuel through thermal integration. These results demonstrate the capability of a single integrated plant to flexibly switch between fuel synthesis and power generation, enhancing adaptability to fluctuating electricity and methane market conditions while maintaining high efficiency.

1. Introduction

The urgent need to mitigate the environmental footprint of energy systems and promote a sustainable circular economy has intensified research efforts into valorising sustainable resources, such as biogenic waste for energy production. These efforts have become even more critical given the increasing risks to energy security posed by the escalation of the Middle East conflict and Russia’s ongoing war in Ukraine. In this context, geopolitical tensions further underline the necessity of establishing a self-sufficient and resilient energy system. In addition, biogenic waste use fits perfectly into the concept of the circular economy, which is defined by the Ellen MacArthur Foundation as follows: “A circular economy is one that is restorative and regenerative by design and aims to keep products, components, and materials at their highest utility and value at all times, distinguishing between technical and biological cycles” [1].
The annual production of biogenic waste is estimated to be more than 9 billion tons globally, including 1.3 billion tons of food and agro-waste [2,3] and 2 billion tons of municipal solid waste [4]. Biogenic waste includes organic materials of biological origin, such as food waste, agricultural residues, forestry residues, and the organic fractions of municipal waste feedstocks. In 2015, the EU Commission adopted specific targets aiming at closing material cycles by promoting the treatment and reuse of waste. Among them, a 65% recycling rate for municipal waste and 75% for packaging waste by 2030 were established [5].
Historically, two main technological approaches have been used to enhance these wastes: aerobic biological degradation (composting), which transforms organic waste into soil improvers that can be used as biological fertilisers, and integrated energy recovery or direct generation for the production of energy or an intermediate energy vector. In Europe, although different technologies exist, the treatment of non-hazardous biogenic waste (both “bio” and “bio-based”, e.g., bioplastics) is mainly carried out through recycling by composting and anaerobic digestion. These methods account for about 79% on average [5]. Several other different technologies that integrate energy recovery can be used, such as pyrolysis, gasification, combustion, and other remarkable technologies such as plasma, hydrothermal carbonisation, or a combination of these technologies according to the biorefinery concept [6,7,8,9,10,11,12]. Among these processes, gasification is very flexible and highly efficient, which makes it one of the most important conversion technologies for highly heterogeneous materials [13]. Given these characteristics, gasification can use other types of feedstock such as polymeric compounds, also representing a valid treatment for waste streams containing plastics (municipal solid waste or organic fraction of municipal solid waste) or for standalone plastic waste, considered another crucial environmental concern [14]. In fact, there is a general effort to increase the circularity of plastics, and through gasification it is possible to produce synthesis gas (syngas) using steam as a gasifying agent (e.g., steam and oxygen) [15,16].
In this study, hazelnut shells were selected as feedstock, representing a widely available agro-industrial biogenic waste. Currently, the world’s main hazelnut producer and exporter country is Turkey, which covers approximately 70% and 80% of world hazelnut production and export, respectively. Notably, Italy has the highest per capita consumption of hazelnuts, with an average of 0.520 kg kernel per person per year [17]. In addition to being widely available, hazelnut shells are a dry biomass that well represents an extensive selection of lignocellulosic biomasses.
Thermochemical recovery is among the most promising technologies for the energy valorisation of biogenic waste. Operating at high temperatures (typically between 600 and 1000 °C), it enables the conversion of biomass into a syngas consisting mainly of hydrogen, carbon monoxide, carbon dioxide, and methane [18]. When properly treated and purified, mainly to reduce the content of contaminants, syngas can be used either for electricity generation in fuel cells, or as a feedstock for the synthesis of alternative fuels through catalytic processes. Fuel cell coupling makes the electricity production process from biomass highly efficiency, environmentally friendly and CO2-neutral [19]. Meanwhile, synthetic natural gas (SNG) as a gaseous fuel product is a versatile and high-value option. The overall efficiency of the process strongly depends on the syngas quality; for this reason, the integration of gasification units with high-temperature gas conditioning systems is essential to ensure the removal of harmful contaminants such as tars, particulates, sulphur, and chlorine/halides compounds [20], which otherwise compromise the performance and reliability of downstream applications [19].
In that context, an integrated and flexible system capable of producing either bio-SNG or electricity from biogenic waste has been developed within the AIRE project framework. It combines steam gasification, high-temperature gas conditioning, methanation, and reversible solid oxide cell (rSOC) technologies. The system presents different configurations depending on the clean syngas utilisation pathway followed: (i) conventional methanation, (ii) enhanced methanation by supplying additional H2 produced from the rSOC operating in electrolysis cell (SOEC) mode and powered by surplus electricity from renewable energy sources (RES), and (iii) power production using the rSOC in fuel cell (SOFC) mode. The rSOC integration provides a flexible platform for bidirectional energy conversion, potentially allowing the system to dynamically switch between methane and electricity production based on market requirements. This system concept not only proposes an alternative for the sustainable storage of bioenergy, but also of variable renewable energy (mainly PV and wind), aiming to solve an important problem in a future scenario with a high share of its generation. For example, variable renewable energy is expected to reach 80% of the total energy production in Germany by 2050 according to the Fraunhofer Institute [21].
According to the literature, the enhanced bio-SNG production process belongs to the Power- and Biomass-to-X (PBtX) concept, while the electricity production process belongs to the Biomass-to-Power (BtP) concept, both of which have been extensively studied over the years at the level of system and technology involved. Reviews [22,23] are examples of this. In addition, their integration through rSOC technology creates a flexible system capable of switching between electricity generation (fuel cell mode) and electricity-driven synthesis/storage (electrolysis/co-electrolysis mode). This approach is seen as a promising alternative, on one hand, for continuous up- and down-grid regulation [24] and, on the other hand, for maximising the utilisation of biogenic carbon in order to increase the production of chemicals and energy carriers [25], offering an enhanced plant economic performance due to the increase in annual operating hours.
Few studies have been conducted on the flexible thermochemical conversion of biomass into electricity and fuels other than syngas—e.g., SNG, Fischer–Tropsch (FT) fuels, dimethyl ether (DME) or methanol (MeOH)—integrating rSOCs. For instance, Butera et al. [26] analyse a “two-stage electro-gasifier” system that produces MeOH and/or electricity by integrating rSOC technology with an innovative two-stage gasifier (pyrolysis and char gasification). The system has five operating modes, ranging from MeOH-only production to electricity-only production, supported by a burner for heat and an internal combustion engine (ICE) for electricity generation. However, at the experimental level, the gasifier has not yet been integrated with the SOEC system. Furthermore, for the syngas cleaning tested in the SOFC system (fuelled with simulative syngas instead of current product gas), only an activated carbon filter was used in addition to a baghouse filter (for particle removal), although the conceptual process includes metal oxide sorbent beds (ZnO/CuO) to perform a hot-temperature cleaning that matches the temperatures of the gasifier.
Wang et al. [24] analyse a system that produces SNG or electricity according to three operating modes. The system can be fuelled by forestry/agricultural residues or municipal solid waste, using either entrained-flow (EFG) or fast internally circulating fluidised-bed (FICFBG) gasifiers with hot/cold gas cleaning and conditioning. Furthermore, the conceptual design is based on equilibrium simulation.
Finally, Rajaee et al. [25] analyse an integrated gasification solid oxide cell plant that produces combined MeOH and electricity from wood chips in two operating modes according to market prices, prioritising the generation of one of the products in each mode. The system utilises a pressurised circulating fluidised-bed gasifier (CFBG), cold gas cleaning, and ICE and steam turbine systems, as well as a purely simulation-based analysis approach.
In contrast, this work presents and integrated system model that is directly supported by experimental data (built from, calibrated with or validated against) where the core of the system is a 100 kWth dual concentric bubbling steam gasifier/air combustor, experimentally tested for two years [27]. With regard to the EFG and CFBG commonly used in these systems, as shown in the literature, dual concentric bubbling is more compact and exhibits better thermal transfer. The gasification technology is coupled with in-bed conditioning with olivine [28], a high-temperature ceramic filter candle for particulate removal and a downstream tar reformer reactor for heavy hydrocarbon and methane conversion [29,30,31]. The corresponding model of this so-called advanced gasification subsystem was calibrated to replicate real process behaviour, ensuring reliable mass- and energy-balance predictions across operating conditions. Downstream sorbent reactors for inorganic compounds’ removal [32,33] complement the gas conditioning.
Furthermore, the methanation section is based on a kinetics-driven reactor model developed using the dimensions of an actual reactor and validated with experimental data from the literature, rather than equilibrium assumptions [34]. For the rSOC sections, operating stack electrochemical points and thermal distribution in both electrolysis and fuel cell modes were defined from characteristics of existing commercial stacks and validated electrochemical theory, ensuring that both models reflect attainable performance. Moreover, the respective system architectures are based on real-word physical stack systems [35,36].
This innovative system is analysed through mass and energy balances in order to estimate its overall performance and carry out an optimisation based on heat recovery and thermal integration process, including the identification of heat sources and sinks. The resulting final system performance is compared with that of alternative configurations reported in the literature.
This study provides the basis for future assessments of system reliability, which will require validation over a wider range of feedstocks and extended operating periods, as well as of economic feasibility, which will need to account for biogenic waste availability together with electricity and natural gas costs. In this context, the proposed gasification technology may enable the deployment of integrated fuel and electricity production plants at smaller scales, for instance around 10 MW, corresponding to approximately 2 t/h of lignocellulosic biomass with an average HHV of 18 MJ/kg. This contrasts with the economically assessed 100 MW scale, about 20 t/h for the same feedstock, typical of entrained flow gasification systems. Such systems are poorly suited to biogenic waste streams due to their limited availability; low energy density, which results in higher transportation, storage and handling costs; and feedstock perishability [37].
Furthermore, the use of an rSOC instead of, for example, an SOEC and thus a fuel-production-only operation improves the economic performance of the plant. Although the rSOC entails higher specific capital costs (CapEx) given that the bidirectional architecture is more demanding in terms of materials and thermo-mechanical design, at the system level, the ability to operate year-round (exploiting favourable market conditions) significantly increases annual operating hours and reduces levelised costs of fuel (and electricity when compared to a single-mode SOFC plant). This is even more so when compared to a plant that operates in both fuel production (SOEC) and electricity generation (SOFC) modes. The use of a single reversible device typically reduces overall system investment because it avoids the installation of two separate units and their duplicated balance-of-plant subsystems.

2. Method

2.1. Overall Process Description

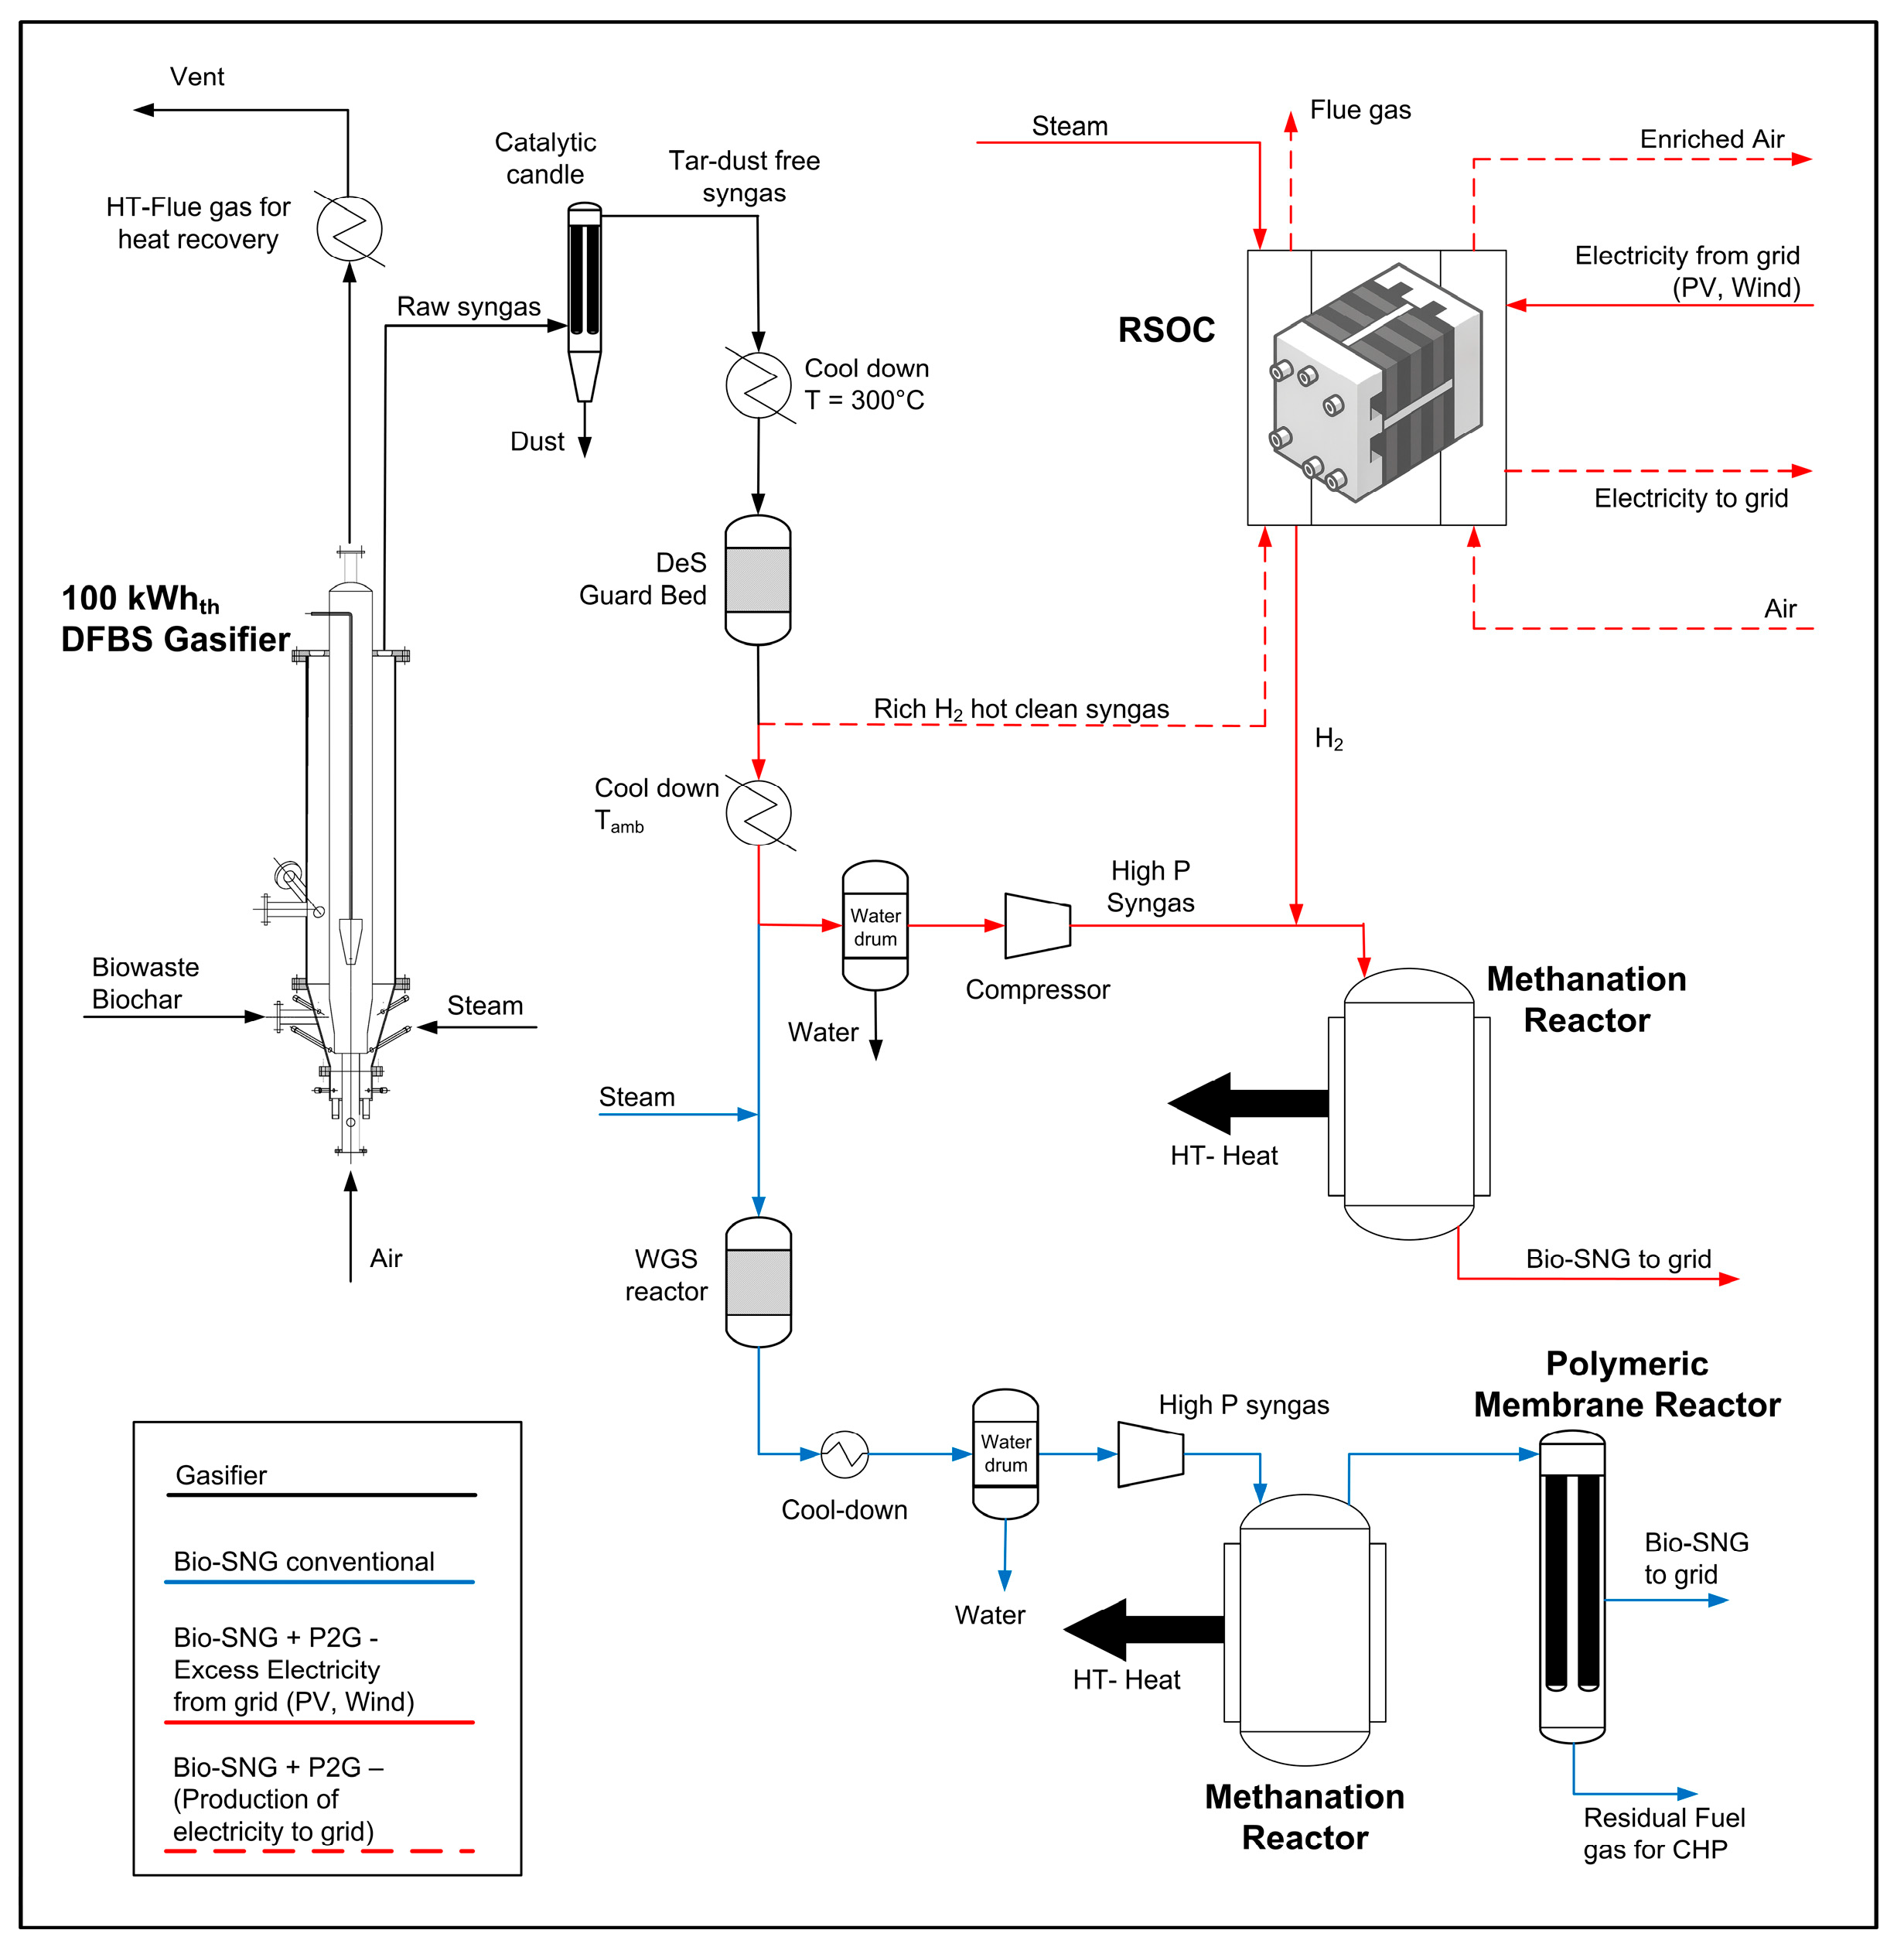
The integrated system (see Figure 1) starts with the production of high-quality hydrogen-rich syngas from various types of biomass, raw or pre-treated, by using a dual-fluidised bed (DFB) gasifier (100 kWth input) integrated with a hot gas conditioning (HGC) system. The HGC system comprises the removal of particulates and tar by means of ceramic filter candles and catalytic reforming sections.
The generated syngas can be used, as a first operating mode of the plant (Line 1, blue stream in Figure 1), for the production of bio-SNG using a conventional methanation system. This system comprises a water–gas shift (WGS) reactor, a methanation section and a membrane gas upgrading system. This operating mode is used when there is partially or totally no demand for electricity by users, to achieve sustainable, low-carbon storage and smart energy use.
As a second operating mode (Line 2, red dotted stream in Figure 1), the syngas can be used for the production of bio-SNG, as in the previous case, but with an enhanced methanation Power-to-Gas (P2G) process concept. This system comprises a subsystem that uses excess renewable energy to produce a H2 flow from steam electrolysis in an rSOC, which is sent to the methanation section mixed with the syngas flow. The hydrogen production rate is adjusted so that when combined with the syngas, the resulting gas mixture achieves a H2/(CO + CO2) molar ratio close to 3.5 in order to obtain a complete conversion of CO and CO2 to bio-SNG. This approach allows efficient methanation without the need for upstream WGS and downstream gas upgrading, simplifying the overall process with respect to the conventional configuration. This second operating mode is proposed to enable weekly to monthly storage of surplus electricity from RES (mainly PV and wind).
Finally, given the possibility of the rSOC to operate reversibly as an SOFC, as a third operating mode (Line 2, red dotted stream), the clean syngas can be directly used to generate stationary energy (electrical and thermal).
The modelling of the integrated plant was carried out in the simulation software Aspen Plus (version 14.0). The model was initially developed by simulating each subsystem individually and subsequently integrating them according to the established operating configurations. For the simulation activities, the MIXCINC stream class was adopted, as the material streams involved in the process include conventional, non-conventional and solid components. The DCOALIGT and HCOALGEN property methods were employed to estimate, respectively, the density and enthalpy of the non-conventional components [38]. For conventional components, the Peng–Robinson equation of state with the Boston–Mathias alpha function (PR-BM) was selected as the global thermodynamic method, enabling the calculation of all relevant thermophysical properties [39].
The biomass feedstock was modelled as a non-conventional component. Hazelnut shells have been selected not only for their availability but also for their favourable properties, namely particle size, low moisture and ash content, which eliminate the need for additional pre-treatments. A biomass flow rate of 20 kg/h was used, corresponding to a thermal input of 100 kWth for the pilot plant. The biomass was characterised using the reference methods ASTM D5373 (to determine the CHN composition), ASTM D4230 (to quantify Cl and S) and ASTM D7582 (for proximate analysis). The fixed carbon (proximate analysis) and oxygen (ultimate analysis) contents were determined by calculating the difference. Likewise, the higher heating value (HHV) was calculated using the Boie correlation [40]. The characteristics of the biomass are shown in Table 1.
Although hazelnut shells can be considered representative of the biogenic waste category [41], feedstock composition is variable, which can significantly affect process performance, particularly in gasification systems and downstream cleaning and upgrading units. Indeed, an increase in moisture content would negatively impact the thermal balance, as part of the energy input would be consumed for water evaporation [42]. In such cases, pre-treatment strategies, such as drying or hydrothermal carbonisation (HTC), could be implemented to mitigate feedstock moisture [43].
Similarly, higher ash content would lead to an increased amount of solid residues entrained in the syngas, requiring appropriate design and scaling of the gas cleaning and filtration systems. In the case of higher concentrations of contaminants such as sulphur and chlorine, a more accurate design of the syngas cleaning section would be necessary to prevent catalyst deactivation in downstream units [44].
Overall, while feedstock variability influences system operation, comparable syngas performance can be achieved through proper design and integration of pre-treatment and gas cleaning/upgrading systems, ensuring process robustness under different feedstock inputs.

2.2. Subsystem Modelling

The subsystems present in the plant concept are (i) the gasification unit coupled with the associated HGC (hereinafter referred to as the “advanced gasification subsystem”), (ii) the Line 1 methanation subsystem, which includes the WGS, methanation and upgrading sections, (iii) the Line 2 methanation system, consisting solely of the methanation section, (iv) the rSOC system operating in SOEC mode and (v) the rSOC system operating in SOFC mode. The models of the advanced gasification subsystem and Line 1 methanation were previously developed and validated by the authors in [34] as part of the study and optimisation of the plant’s operating configuration 1. This paper will only provide a brief overview of these two sections, focusing on the remaining subsystems and configurations.

2.2.1. Advanced Gasification

The advanced gasification subsystem consists of a gasification and a combustion section. Firstly, the biomass is decomposed into its elemental constituents through an RYield block, which converts the non-conventional biomass stream into conventional components according to its ultimate analysis. After this stage, the formation of inorganic compounds is also considered by assuming the stoichiometric conversion of heteroatoms such as Cl and S into their corresponding inorganic species.
Following the decomposition step, a fraction of the residual char is directed to the gasifier, while the remaining portion is sent to the combustor in order to simulate the transfer of unreacted char from the gasification zone to the combustion chamber, thereby contributing to the thermal balance of the system.
The remaining elemental components generated in the decomposition stage are then sent to a stoichiometric reactor, where the formation of tar species is simulated. In this work, tars are grouped into three different compounds, namely benzene, toluene, and naphthalene. After tar formation, the resulting stream is fed into an RGibbs reactor, which simulates the thermodynamic equilibrium of the gasification reactions and leads to the formation of syngas. In this block, both tar compounds and inorganic species are treated as inert components in order to preserve the experimentally observed tar yields and inorganic content. This modelling strategy enables the simulation to reproduce both the syngas composition and the tar quantities measured experimentally and reported in [34]. Finally, the combustion section is simulated by introducing an auxiliary fuel in order to ensure the energy balance of the gasification unit.
Downstream of the gasification reactor, the raw syngas is further processed in the Hot Gas Cleaning (HGC) system, where solid ash is removed and tar compounds are completely reformed. This step is simulated using a second RGibbs reactor, in which the complete conversion of tar species is assumed. This assumption is supported by experimental microreactor tests in the literature performed with a nickel-based catalyst, which demonstrated nearly complete tar conversion [31]. Therefore, the modelling approach adopted here can be considered as a scaled-up representation of the catalytic system, allowing the estimation of the achievable syngas quality under realistic operating conditions. Future work could include kinetic CFD simulations to investigate the internal flow distribution, reaction kinetics, and temperature profiles within the reforming reactor, providing further insight into the kinetic and thermal behaviour of the catalytic bed and supporting the transition from an equilibrium-based representation to a kinetic reactor model.
It should be noted that the adopted modelling approach relies on user-defined constraints to represent the distribution of char, tar, and inorganic species, while the syngas composition is determined through an equilibrium calculation in the RGibbs reactor. Therefore, when different feedstocks are considered, additional experimental data would be required to define the corresponding char, tar, and inorganic fractions. Without such information, the model would still predict a syngas composition close to thermodynamic equilibrium but would not be able to accurately reproduce the distribution of the additional products generated during gasification. However, the downstream catalytic reforming section remains representative, since the assumption of complete tar conversion can also be applied to other syngas compositions.

2.2.2. Line 1 Methanation

The methanation subsystem was modelled to convert syngas into bio-SNG. Initially, a gas cleaning and conditioning section is simulated to remove sulphides and chlorides and to increase the hydrogen content via WGS. Methanation is performed in four inter-cooled adiabatic reactors to maintain the optimal gas inlet temperature (290 °C). The gas then passes through the upgrading section, where it is adiabatically cooled to promote condensation. Finally, carbon dioxide is removed via membrane separation with an efficiency of 95% [45], yielding the final bio-SNG product.

2.2.3. Line 2 Methanation

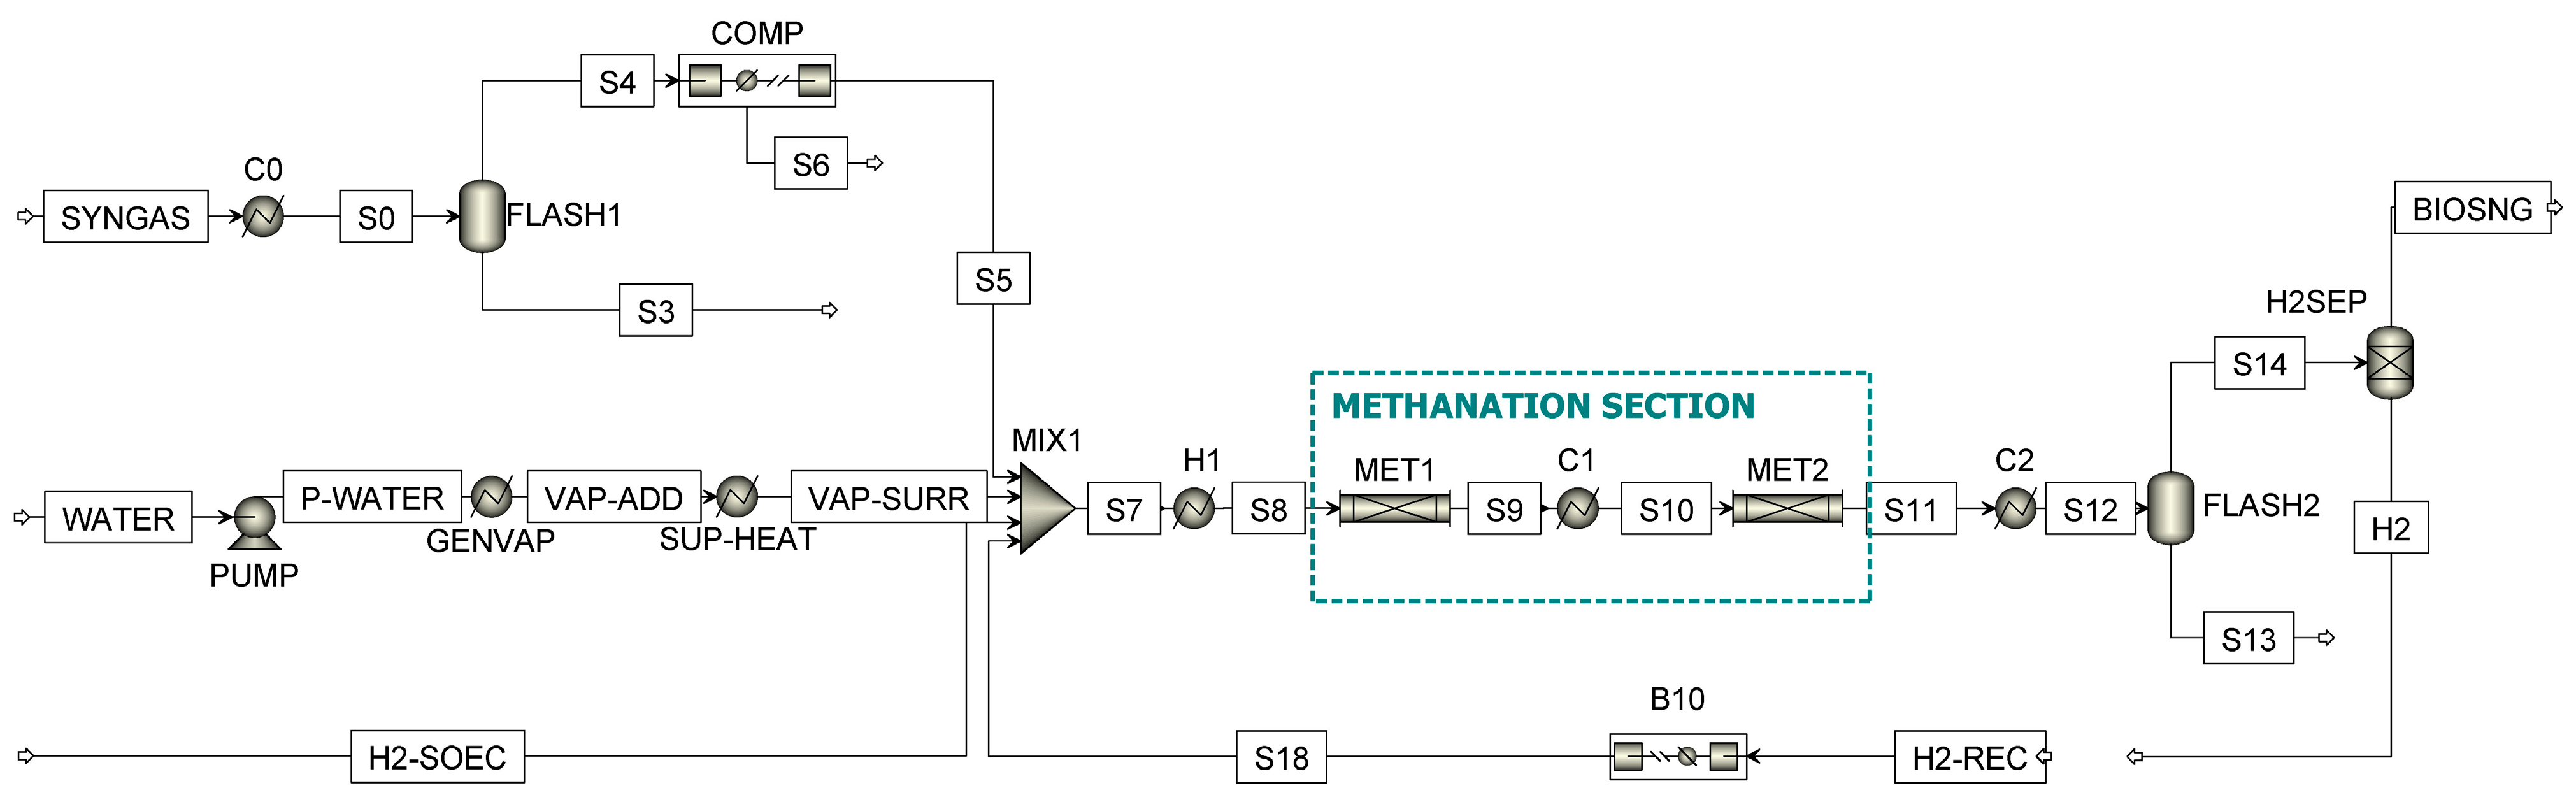
Figure 2 shows the flowsheet of the Line 2 methanation subsystem model.
According to the plant layout (see Figure 1), the methanation system of Line 2 is located downstream of the syngas inorganic contaminants removal section. The syngas is first cooled (C0 block) and dried (FLASH1 block) and subsequently compressed to 10 bar (COMP block), which is the operating pressure of the methanation section. This pressure was selected based on previous analysis, as higher pressure was found to have a negligible effect on the bio-SNG yield or composition [34]. A hydrogen stream at 10 bar and 25 °C from the rSOC system (operating in SOEC mode) is then added to the compressed syngas to achieve a H2/(CO + CO2) molar ratio of 3.5. This value is consistent with the stoichiometry of the methanation reactions, which require molar ratios of 3 and 4 for CO and CO2, respectively.
In addition, a superheated steam stream (10 bar, 400 °C) is introduced into the feed to mitigate the temperature rise in the first methanation reactor, which is limited to 651 °C. The methanation section (framed in turquoise in Figure 2) consists of two inter-cooled adiabatic reactors. A preheater (H1 block) is used to set the inlet temperature of the first reactor to 300 °C, while the second is cooled to 295 °C before entry. The same RPlug reactor model developed for the conventional methanation system (Line 1) in [34] is adopted for this configuration.
To reduce the residual hydrogen content in the bio-SNG without introducing additional methanation stages, a hydrogen separation unit (H2SEP block) is installed downstream of the second methanation reactor. This unit removes 98% of the unreacted H2, which is then recompressed to 10 bar (B10 block) and recycled to the methanation inlet. Before H2 separation, the gas stream is cooled adiabatically to 157 °C (C2 block), below the dew point, and then sent to a flash reactor (FLASH2 block) operating at 40 °C for moisture removal.
The performance of the H2 separation strategy is based on commercially ready membrane separation technology [46], which enables continuous operation of the system.
However, this is merely a theoretical model strategy (i.e., non-implemented) adopted solely to enable a practical direct comparison between conventional and enhanced methanation processes in terms of the minimum number of stages (reactors) required. In industrial methanation, unreacted H2 is not simply discarded; rather, the process is adapted to maximise its utilisation. Therefore, after verifying the suitability of enhanced methanation (in terms of performance), subsequent work will include optimising this process design in the framework of the techno-economic analysis of the overall plant.

2.2.4. rSOC (SOEC Mode)

The rSOC system operating in electrolysis mode was simulated based on a real-word physical stack system [36] and the SOEC stack model of Hauck et al. [47], adapting it to the specific conditions of the current plant.
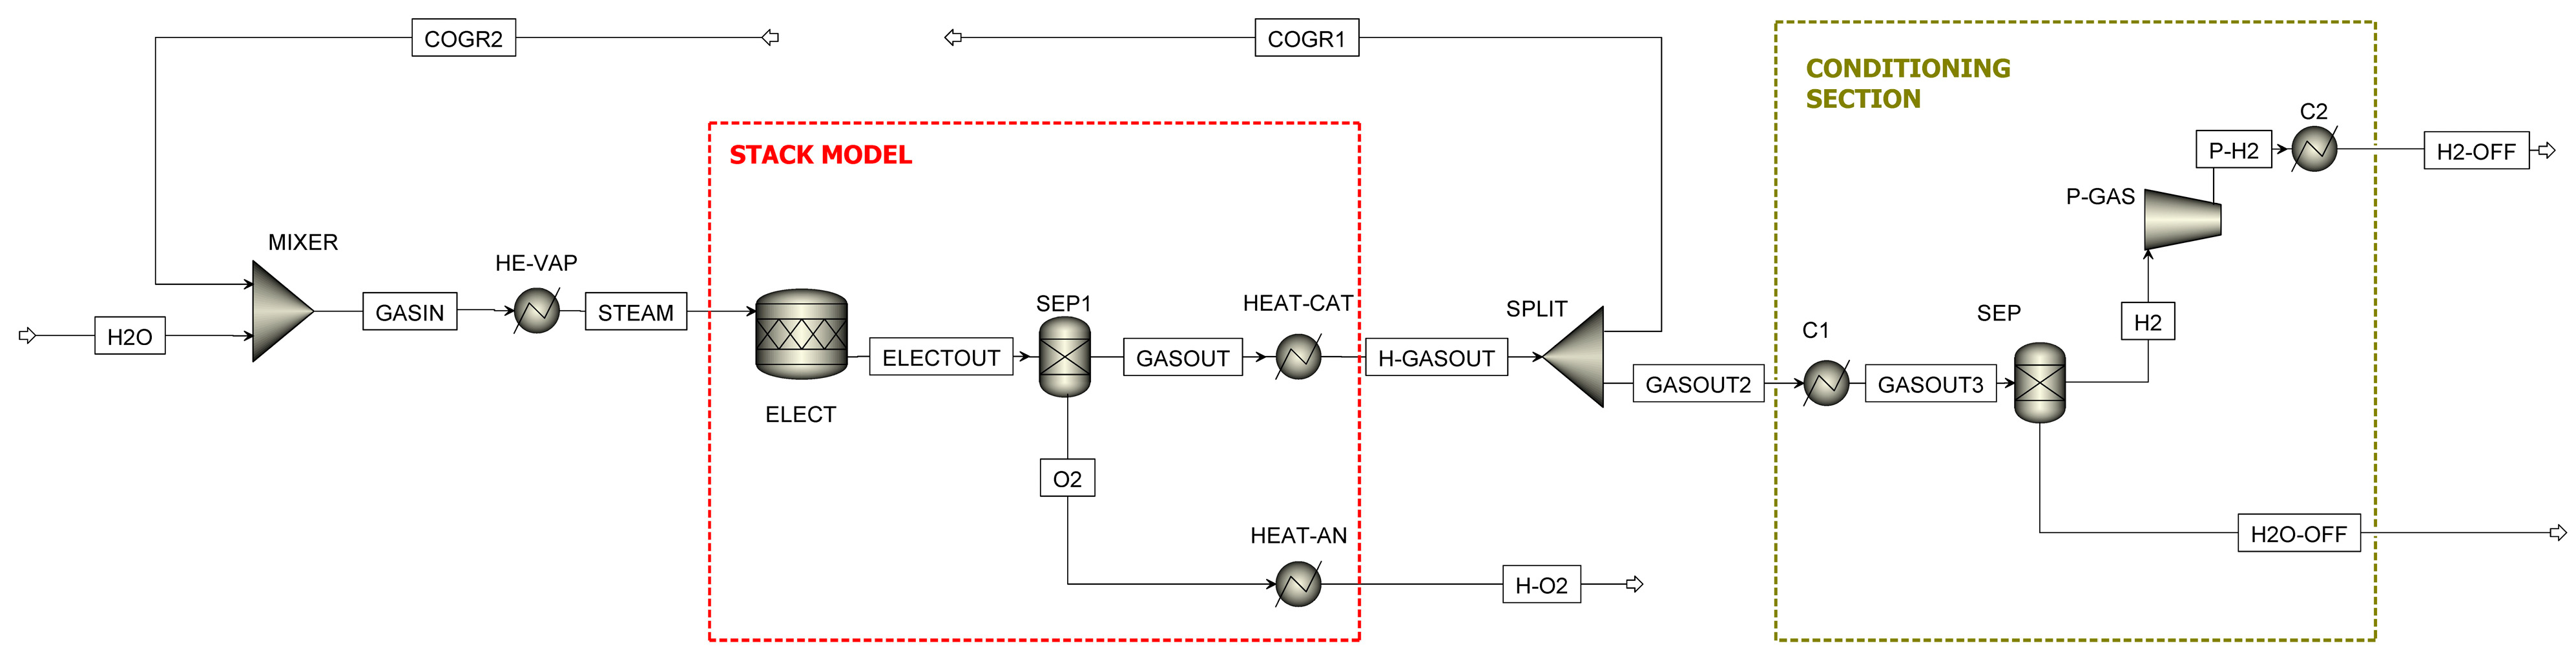
In the current operating framework, only steam electrolysis is carried out rather than co-electrolysis as in the reference model; therefore, neither the reverse water–gas shift reaction nor the internal reforming effect of the resulting product water was taken into account. Furthermore, instead of using heat flows to achieve energy balance throughout the stack, the temperature change in the outlet streams was simulated using heating blocks and calculating the released heat via energy balance. Additionally, partial recirculation of the H2-rich cathode off-gas was added to ensure 10 vol.% H2 at the stack inlet, thereby preventing anode damage and limiting stack degradation [48,49]. A post-conditioning section was also added to deliver the produced hydrogen at the required operating conditions. The resulting process configuration is illustrated in Figure 3.
SOEC technology operates at high temperatures, typically between 600 and 800 °C [50,51]. A temperature of 750 °C has been chosen for this case, which is commonly used for high-efficiency steam electrolysis as it allows for a balance between the stack efficiency (as temperature increases, oxygen ion conductivity increases [50] whilst electrical energy demand decreases [47]) and durability [52] (e.g., degradation less than 0.5%/1000 h in a long-term test lasting over 10,000 h at below 750 °C and 0.5–0.6 A/cm2 [53]) as well as system efficiency (the inlet steam is heated to a lower temperature).
As for the electrochemical operating point, the SOEC is usually operated at a thermoneutral voltage (where the enthalpy of the electrolysis reaction balances the Joule heating) [50], which, at plant level, contributes to achieving high electrolysis efficiency and facilitates the management of stack heat during operation [51]. At 750 °C, the thermoneutral voltage is 1.285 V; therefore, in the model, the SOEC stack (framed in red in Figure 3) operates at 1.3 V, slightly above it. This implies that a fraction of the electrical energy supplied exceeds the amount required for the electrolysis reaction and is therefore released as heat. This heat raises the temperature of the outlet streams above the operating temperature. To account for this effect, dedicated heating blocks (HEAT-AN and HEAT-CAT) were introduced, with their thermal duties calculated using calculator blocks. The electrolysis reaction itself is modelled by the ELECT block, assuming an efficiency of 80% [54].
Regarding the recirculation strategy, a splitter (SPLIT block) is placed downstream of the stack. A fraction of the H2-rich cathode off-gas is mixed with the water feed and subsequently preheated in the HE-VAP block to generate the steam required by the stack. The water feed is set through a Design Spec to achieve the target H2 production. In the conditioning section (framed in green), the remaining fraction of the cathode off-gas is first cooled (C1 block) to allow water condensation and separation (SEP block), then compressed (P-GAS), and finally cooled again (C2) to achieve the desired output conditions of 10 bar and 25 °C.
The thermal balance of the stack is defined as follows. The dissipated heat H d i s s is calculated as the difference between the electrical power supplied to the stack P e l e c t and the power consumed by the electrolysis reaction P r x n (obtained by the ELECT block in the simulation).
H d i s s = P e l e c t P r x n
P e l e c t = 2 · n ˙ H 2 · F c o n s t · V c e l l
where the factor 2 represents the two moles of electrons required for each mole of H2 produced, n ˙ H 2 is the H2 molar flow produced (mol/s), F c o n s t is Faraday’s constant (96.46 s kA/mol) and V c e l l is the cell voltage of the stack (V).
Assuming 20% heat loss, the heat is distributed between cathode and anode streams proportionally to their energy content.
H t r a n s C A T = P e l e c t P r x n · 0.8 · m ˙ · C p · T C A T m ˙ · C p · T C A T + m ˙ · C p · T A N
H t r a n s A N = P e l e c t P r x n · 0.8 · m ˙ · C p · T A N m ˙ · C p · T C A T + m ˙ · C p · T A N
where m ˙ is the mass flow (in kg/h), C p is the heat capacity (kJ/kmol K), and T is the temperature difference. For modelling purposes, a fictitious temperature increase of 100 °C is assumed.

2.2.5. rSOC (SOFC Mode)

The simulation of the rSOC system operating in fuel cell mode was developed based on previous work of part of the authors. This SOFC system was developed within the SO-FREE project [55]. A detailed description of the modelling and experimental validation of the reference system is available in the literature [35], which has been adapted to the current operational framework.
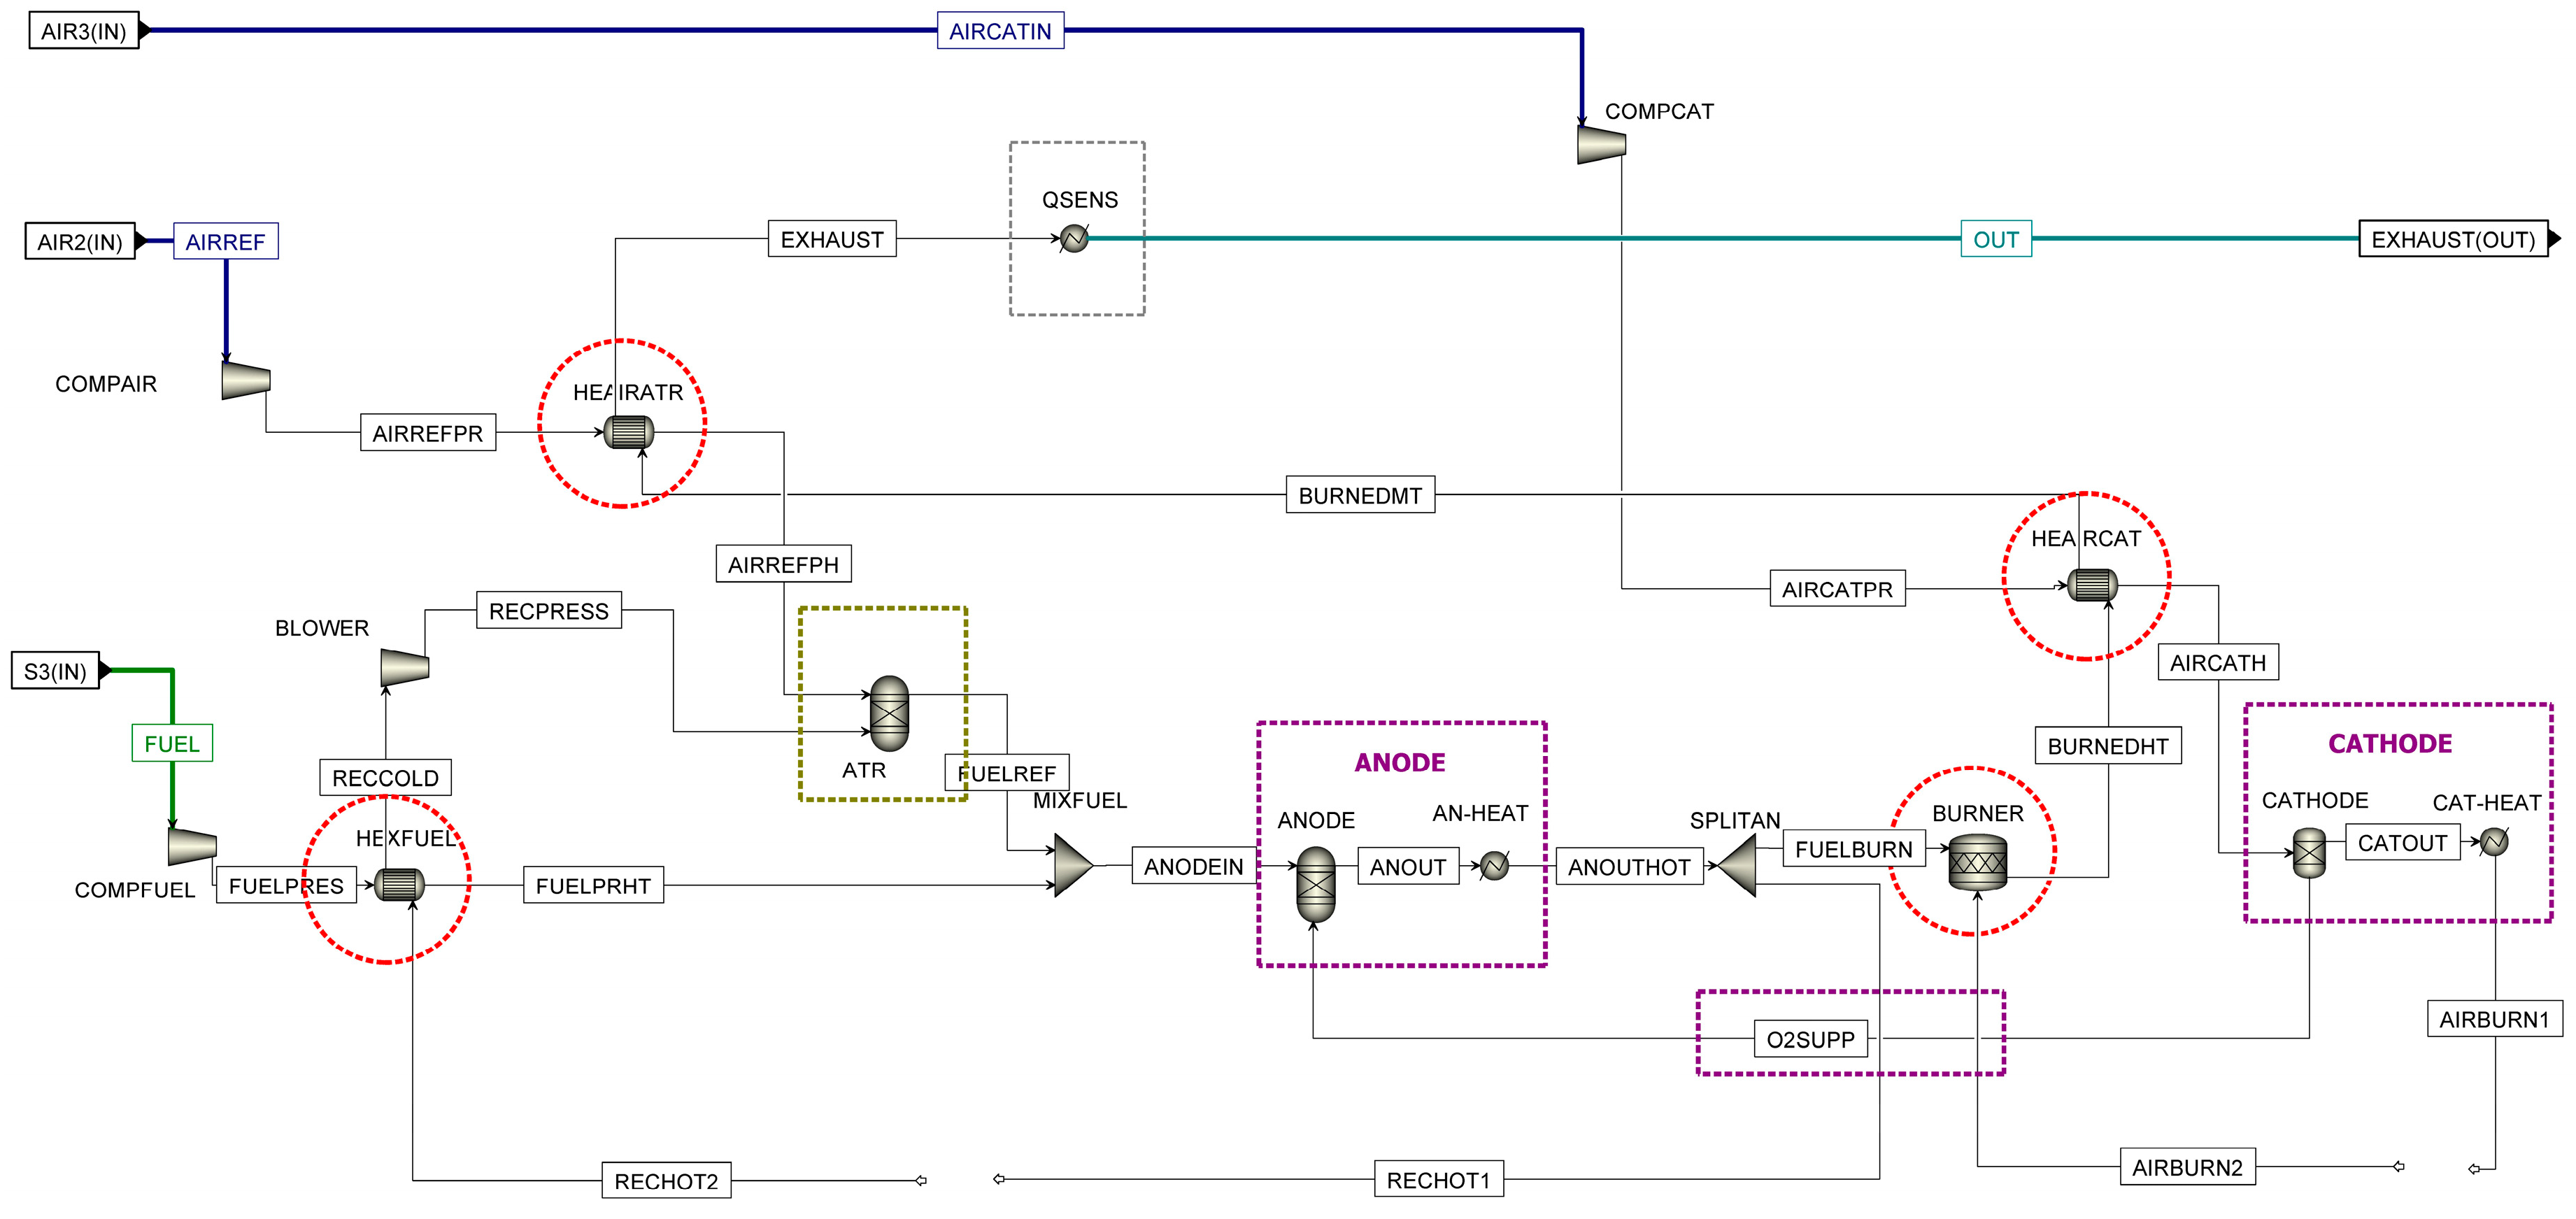
The initial SOFC system architecture was conceived as a flexible platform capable of operating with fuels of varying compositions and with stacks operating at different temperatures, without requiring modifications to the system components. To this end, the design included a recirculation system to regulate the water content at the stack fuel inlet and prevent carbon deposition, as well as a heat recovery system enabling autothermal operation. However, under the current operating conditions, the composition of the inlet fuel gas remains constant, making such a high level of operational flexibility unnecessary. Consequently, a simplified system configuration was developed, both in terms of architecture and control strategy, leading to the flowsheet shown in Figure 4.
Overall, the current SOFC system comprises the stack (framed in purple), the autothermal reformer (framed in gold), the anode off-gas recirculation, and the internal (framed in red) and the external (framed in dark red) heat recovery. There are also three input currents, one for fuel (highlighted in green) and two for air (highlighted in blue), and one exhaust emissions current (highlighted in light blue) released into the atmosphere. The process starts with the supplied fuel being compressed and preheated before being fed to the stack anode, where it is mixed with the outlet stream from the autothermal reformer (ATR). The stack is modelled as a combination of interconnected components, separately representing the anode side, the cathode side, and the transport of oxygen ions through the electrolyte. The heat released by the electrochemical reactions results in an increase in the temperature of the outlet streams.
After the stack, the anode off-gas is split, and a fraction is recirculated to the initial section towards the ATR, preheating the fuel inlet of the system. The ATR in the current model functions only as a burner to ensure that the fuel inlet to the stack is at the required operating temperature. The remaining portion of the anode off-gas is sent to a burner along with all the cathode air so that the remaining fuel present is burned and additional heat is generated. Finally, the exhaust gases are used to heat the air inlet to the stack to operating temperature and preheat the air inlet to the ATR, thus reducing the fraction of fuel burned in it. After heat exchange in the system, the exhaust gases are cooled completely to 25 °C in order to recover the available residual thermal energy.
Regarding the operating conditions, the same operating temperature as in the SOEC case was adopted, consistent with the operation of an rSOC [47,48], where electrolysis and fuel cell mode operate under a unified temperature control to prevent thermal cycling stress/degradation [56]. To define the electrochemical operating point, the characteristics of a commercial IKTS reversible stack module (model 180E) were used as a first approximation. From the respective commissioning test data of the manufacturer’s manual [57], a fuel utilisation U F of 0.75 and a cell voltage V c e l l of 0.83 V were selected, being a conventional midpoint. The stack module operates at this point when fed with a fuel of 40% H2 in N2; therefore, to validly use these data in the model, a Design Spec was established to set a stack fuel inlet with a 40% H2eq content (after the internal reforming effect) by varying the anode off-gas recirculation. In addition, the maximum temperature increase of the stack is 200 °C.
On the other hand, thermal losses equal to 20% of the total thermal energy generated within the stack were assumed, corresponding to the maximum acceptable power losses for this type of system [35]. Furthermore, the SOFC system works slightly above atmospheric pressure with an inlet pressure of 1.7 bar and an outlet pressure of 0.4 bar.
Regarding the modelling approach, it should be noted that although the models of the stack system in both operating modes (electrolysis and fuel cell) have been constructed using real-world performance data of the technology, the stack models lack operational flexibility; that is, they operate at a single predefined electrochemical point as a first approximation. It is therefore necessary to develop a more robust model that incorporates the electrochemical dimension, enabling the stack’s behaviour to be determined autonomously and dynamically based on specific operating conditions and inlet fuel compositions.
In addition, considering that the scope of this work is to study the possible integration scheme of the different technologies involved in the process, the switchable operation of the stack has not been studied. The operation of rSOCs is currently being intensely studied, focusing on identifying and understanding the interactions between the various degradation mechanisms (mechanical and thermal) of both operating modes. A deep understanding of these phenomena is crucial, as degradation represents the primary obstacle to the commercialisation and industrialisation of rSOCs [56].
State-of-the-art research reveals that switchable operation of the stack helps to reverse or mitigate various types of mechanical degradation. For example, it has been demonstrated that reversible cycling can eliminate the formation of nanopores and the separation of YSZ grains at the oxygen electrode/electrolyte interface, damage that typically occurs under continuous and high electrolysis polarisation [58]. Research suggests that asymmetric operation protocols (with a longer duration of the fuel cell mode), such as alternating 5 h in SOFC mode for every 1 h in SOEC mode, are effective in maintaining structural stability and preventing an increase in ohmic resistance. This strategy is optimally suited for integration with intermittent renewable sources as it is better suited to the cyclical source availability [59].
On the other hand, thermal degradation, caused by severe temperature gradients during switching between exothermic (SOFC) and endothermic (SOEC) modes, can be avoided with auxiliary and control systems. Thermal management systems utilising integrated electric heaters and air blowers allow for the control of gradients, preferably keeping them below 10 °C/cm to ensure the mechanical integrity of the stack. In addition, it has been shown that hot standby mode allows for transitions from an idle state to nominal operation in very short transition times, typically between 3 and 10 min, which facilitates electrical grid balancing [36].
In general, the safe operation of a reversible cell relies on its auxiliary and control systems that maintain minimum operating conditions, particularly through the management of gas recirculation to avoid steam condensation and the reduction in current ramp rates during transitions [60]. Therefore, the proposed systems in this work for both fuel cell and electrolysis mode operation, which allow for the control of inlet concentrations and temperature, serve as the basis for a subsequent quasi-dynamic study (through various steady states) to investigate the switchable behaviour of the entire plant.

2.3. Integrated Plant Modelling

After the development of all the subsystem models, the integrated configurations were analysed to assess the overall plant performance. Each configuration was structured into hierarchical blocks representing the respective subsystems.
As shown in Figure 1, the H2-rich clean syngas produced can be used for (i) conventional bio-SNG production through Line 1, (ii) enhanced bio-SNG production through Line 2 using the rSOC in SOEC mode and (iii) heat and power production through the Line 2 system using the rSOC in SOFC mode.

2.3.1. Conventional Bio-SNG Production Process: Gasification + Line 1

In this configuration, reported in [34], biomass is fed into the GASIF hierarchy block, which models the gasification system. Three main outputs were obtained from this system: syngas, flue gas, and ash. The clean H2-rich syngas, along with a dedicated water stream, is sent to the LINE1 hierarchical block, which simulates the conventional methanation system. This system produces bio-SNG, with water and CO2 as by-products.

2.3.2. Enhanced Bio-SNG Production Process: Gasification + Line 2 + SOEC

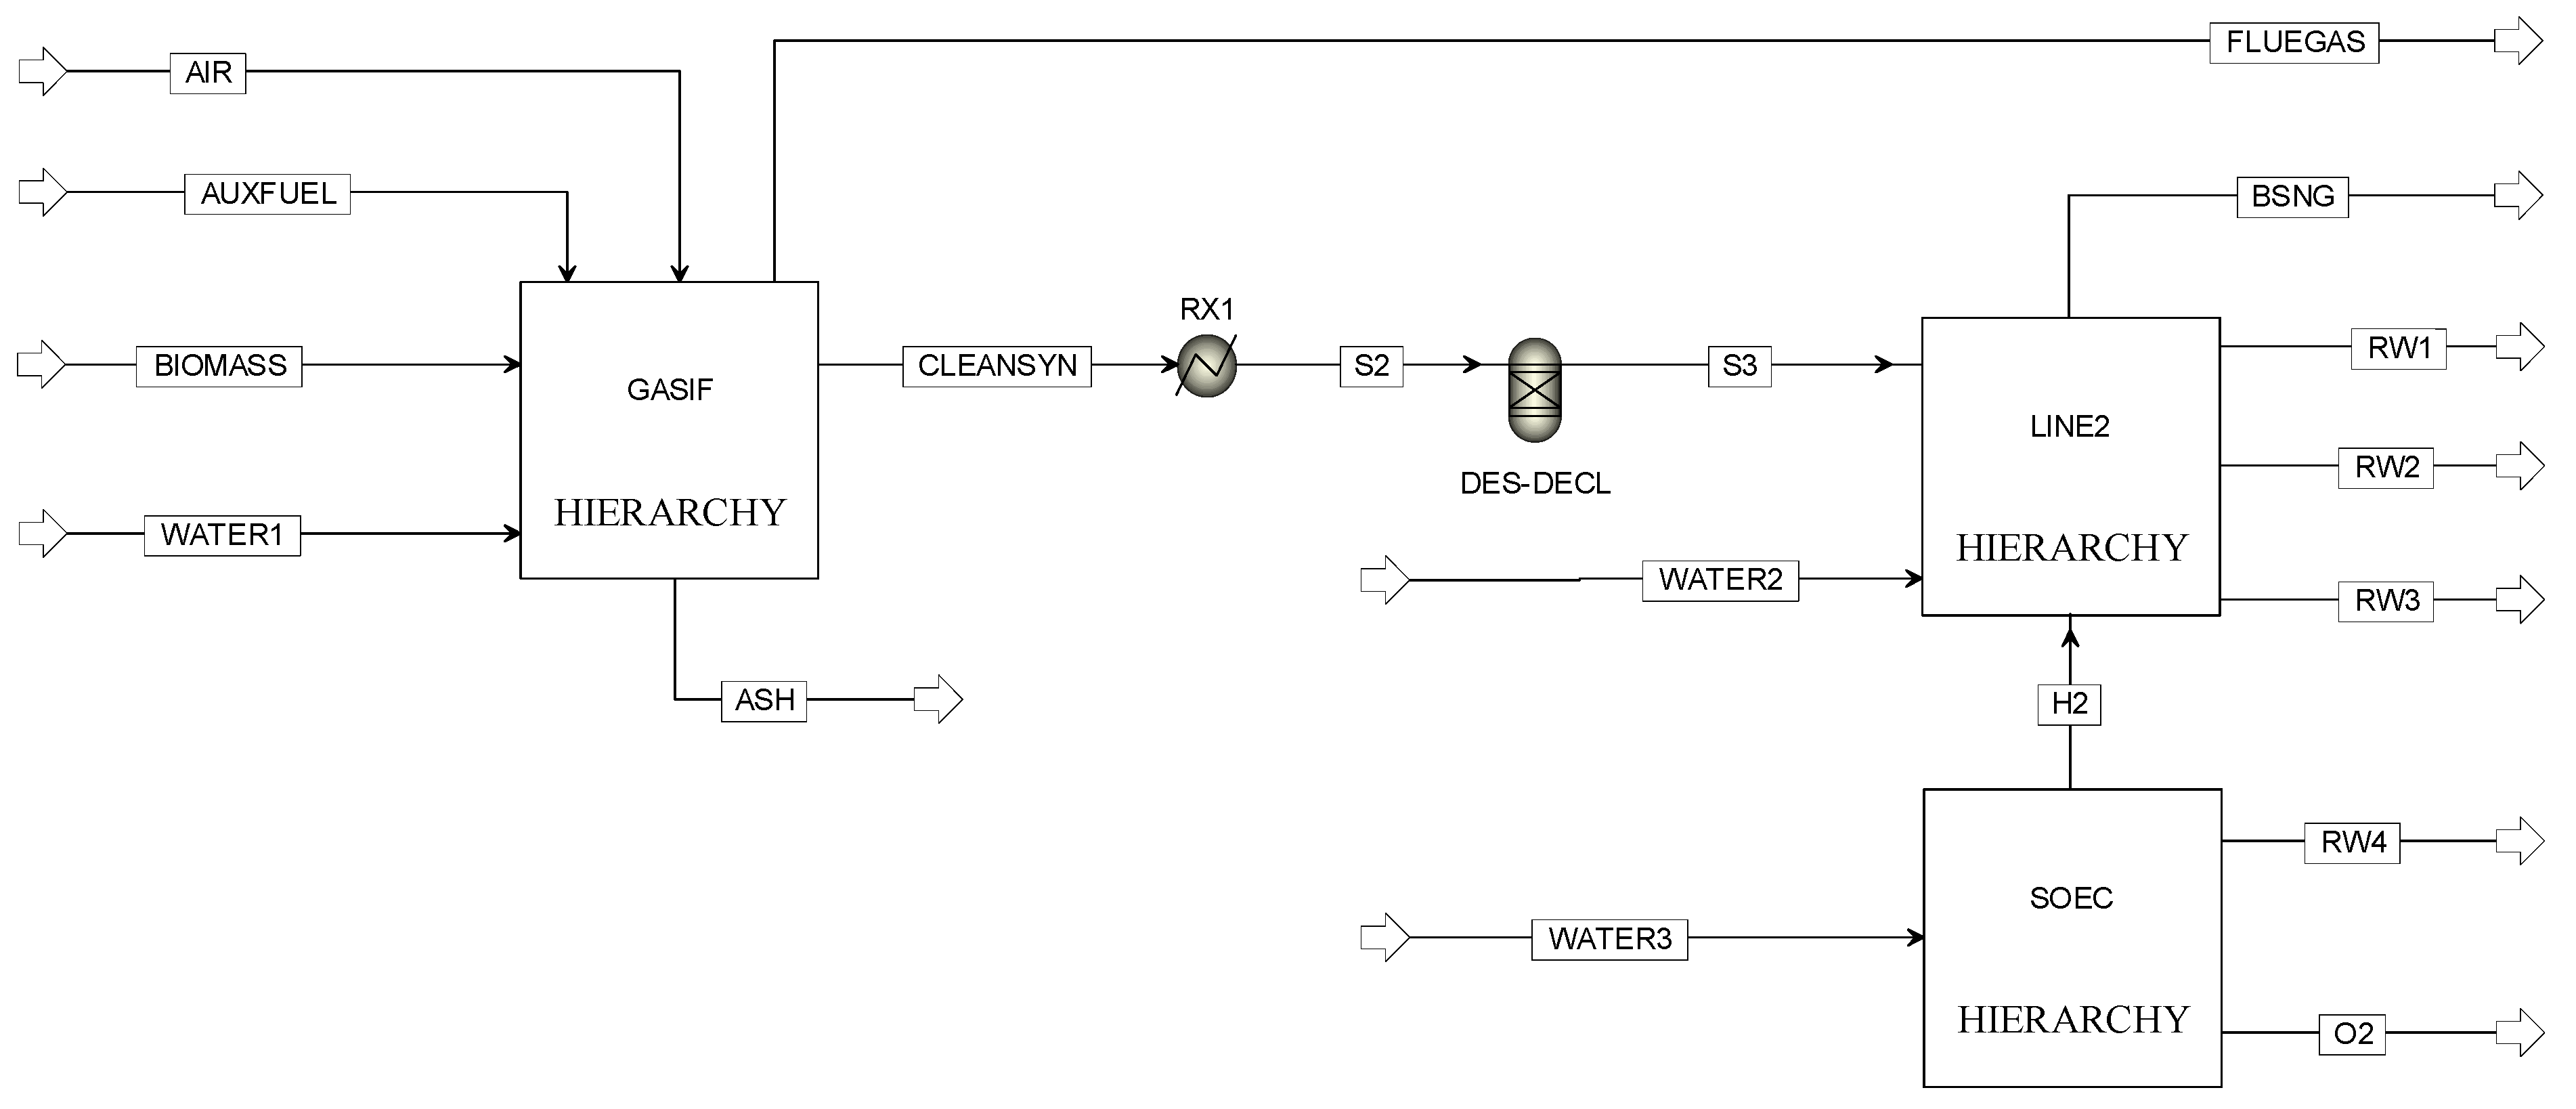
Figure 5 shows the flowsheet of the second configuration of the plant.
In this case, the clean H2-rich syngas from the GASIF block is first cooled to 400 °C through a heater (RX1 block) and then sent to a Gibbs reactor (DES-DECL block), which represents the inorganic compound removal using fixed-bed sorbent reactors. This leads to a syngas stream free of contaminants. In parallel, a water flow enters the SOEC hierarchical block, modelling the rSOC system operating in SOEC mode. In this block, steam electrolysis produces a pure H2 stream, with a Design Spec used to calculate the required water to achieve a final gas mixture (when combined with the clean syngas) with a H2/(CO + CO2) molar ratio of 3.5.
Finally, the resulting gas mixture is sent to the LINE2 hierarchical block, representing the enhanced bio-SNG production system.

2.3.3. Power Production Process: Gasification + SOFC

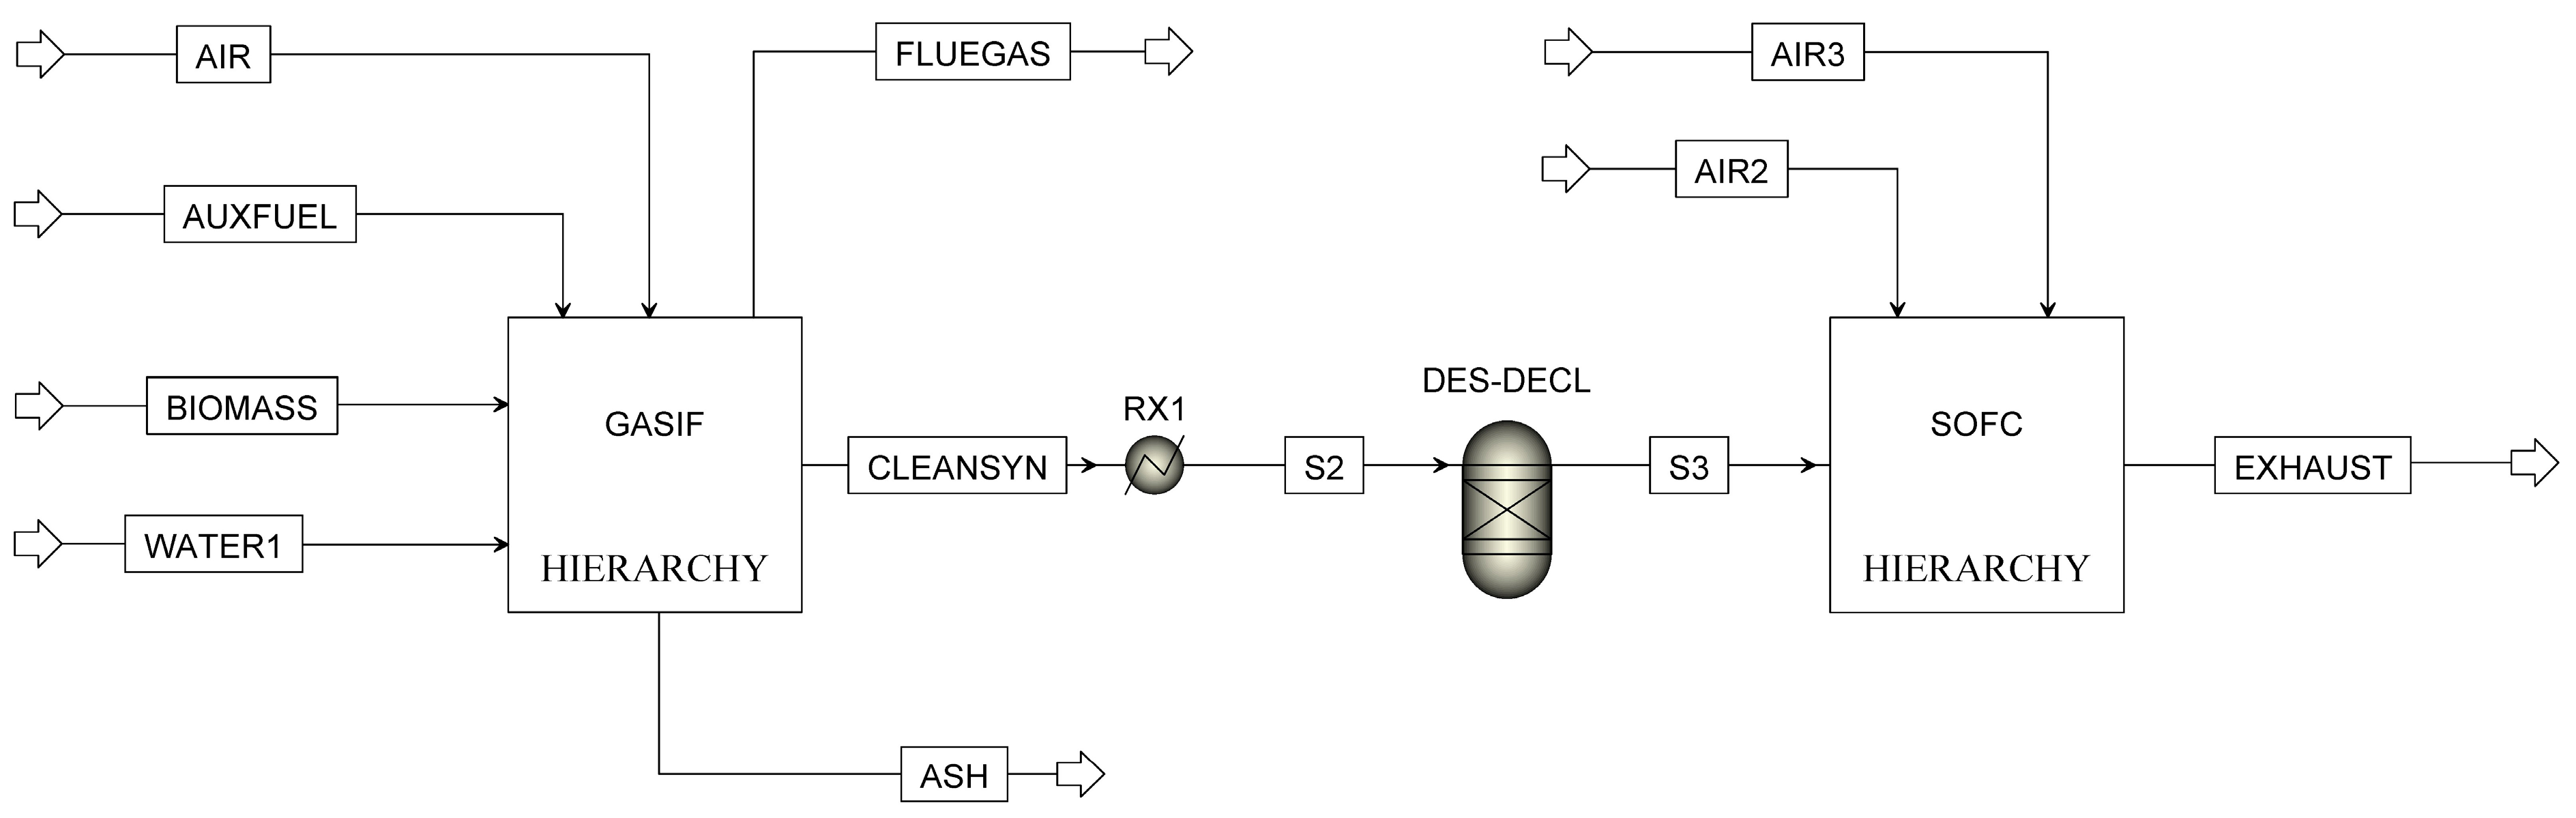
Figure 6 shows the flowsheet of the third operating configuration of the plant.
This configuration follows the same initial steps as operating mode 2 up to the inorganic contaminant removal stage. The clean syngas is then directed to the SOFC hierarchy block, which models the rSOC system operating in fuel cell mode.
The SOFC stack converts the supplied fuel into electricity, while the additional system, including anode flue gas recirculation, autothermal reformer, burner and heat recovery units, uses Design Specs to ensure flexible operation under the specified parameters without requiring external energy input.

2.4. Integrated Plant Optimisation

To ensure overall efficiency, energy balances were performed for each operating mode to identify energy flows within the subsystems, evaluate optimisation opportunities, and enhance the performance of the integrated plant.

2.4.1. Optimisation Approach

The optimisation aimed to maximise heat recovery while ensuring both energy viability and thermal feasibility. Energy viability was evaluated by identifying heat sources and sinks, and by constructing and analysing the thermal composite curves, which enable the simultaneous visualisation of hot streams, cold streams, and the heat transfer potential between them on a single graph. This approach supports effective heat integration across subsystems, while thermal integration was achieved through pinch analysis, aiming to minimise the demand for external utilities.

2.4.2. Energy Performance Assessment

Key performance indicators were calculated for both subsystems and the overall plant: Cold Gas Efficiency ( C G E p r o d u c t   g a s ) and dry gas yield ( Y i e l d p r o d u c t   g a s ) for gasification and methanation, hydrogen production efficiency for the SOEC system, electricity production efficiency for the SOFC system, and overall system efficiency considering heat, electricity and fuel outputs.
The CGE evaluates the conversion efficiency of the feedstock chemical energy to the gaseous fuel:
C G E p r o d u c t   g a s = H H V p r o d u c t   g a s · m ˙ p r o d u c t   g a s H H V f e e d s t o c k · m ˙ f e e d s t o c k + H H V F u e l · m ˙ F u e l
where m ˙ is the mass flow of the product gas or supplied feedstock n , respectively.
The dry gas yield Y i e l d indicates the volumetric production of gas relative to feedstock:
Y i e l d p r o d u c t   g a s = V ˙ p r o d u c t   g a s m ˙ f e e d s t o c k · V ˙ f e e d s t o c k
The hydrogen production efficiency η H 2 of the SOEC is defined as the ratio between the chemical energy of the hydrogen produced and the electrical energy consumed:
η H 2 = L H V H 2 , o u t · m ˙ H 2 , o u t P e l e c t , i n
where L H V H 2 , o u t and m ˙ H 2 , o u t are the lower heating value ( L H V ) and mass flow of the H2 produced.
The electrical efficiency η e l e c t of the SOFC is the ratio between the electrical power and the chemical power of the fuel supplied:
η e l e c t = P e l e c t ,   o u t L H V f u e l , i n · m ˙ f u e l , i n
The electric power output is calculated as:
P e l e c t , o u t = 2 · n ˙ H 2 + n ˙ C O + 4 · n ˙ C H 4 · U F · F c o n s t · V c e l l
where the factor 2 is the number of moles of electrons generated per mole of H2 consumed; n ˙ H 2 , n ˙ C O and n ˙ C H 4 are the molar flows of the H2, CO and CH4 (mol/s); U F is the fuel utilisation factor; F c o n s t is the Faraday constant (96.46 s kA/mol); and V c e l l is the cell voltage of the stack.

3. Results and Discussion

3.1. Optimisation Strategy

3.1.1. Plant Operation in Mode 2

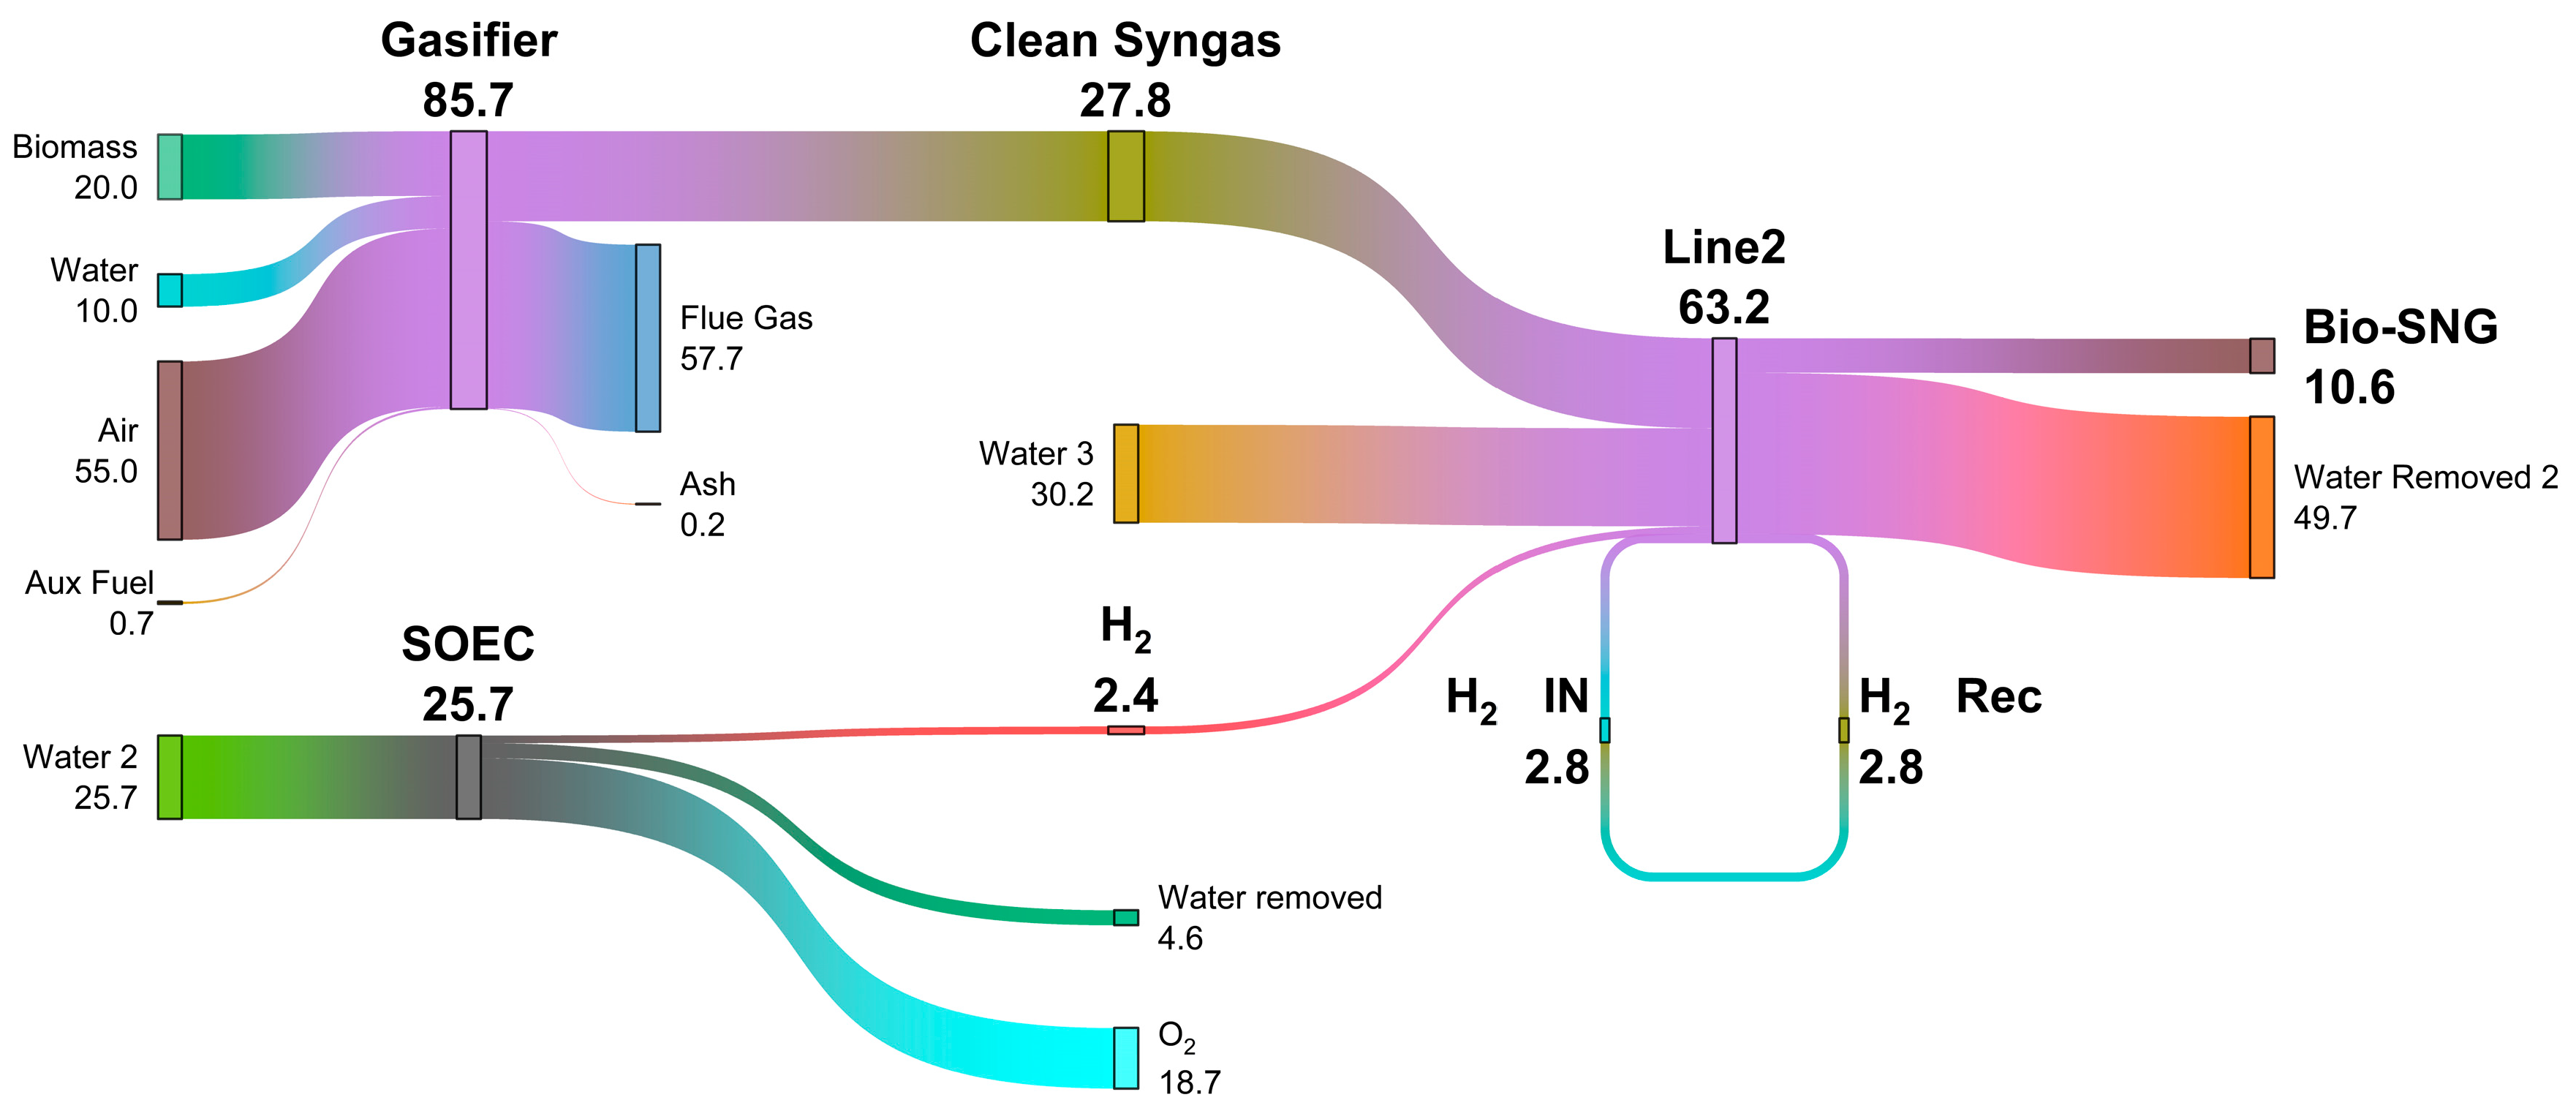
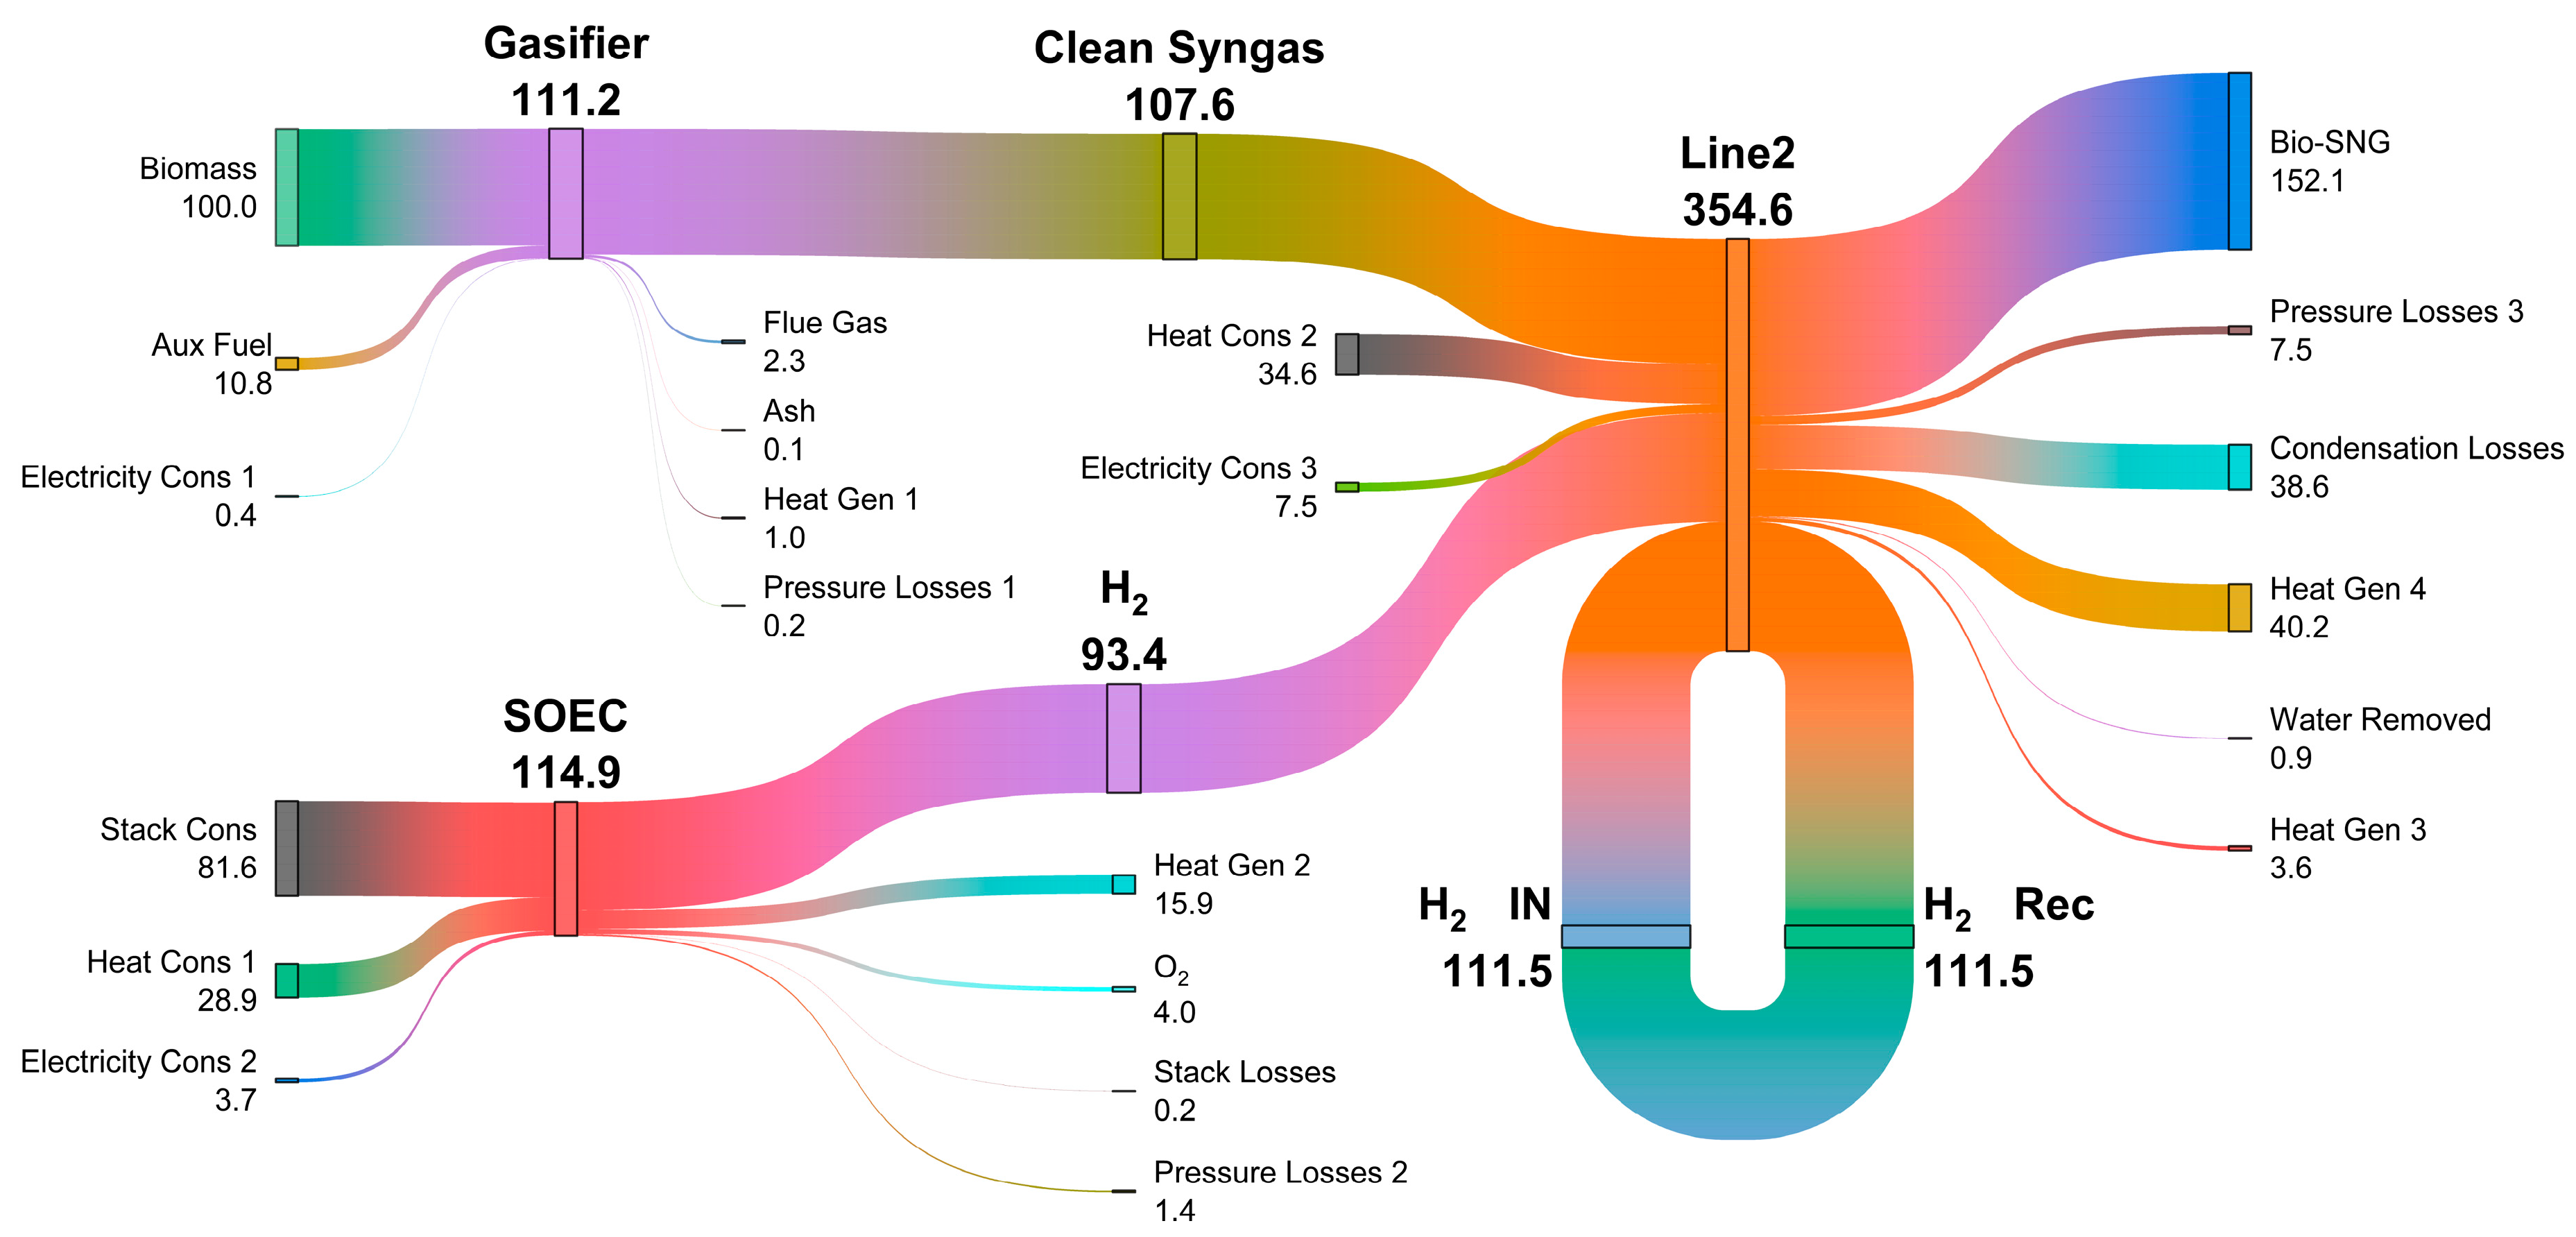
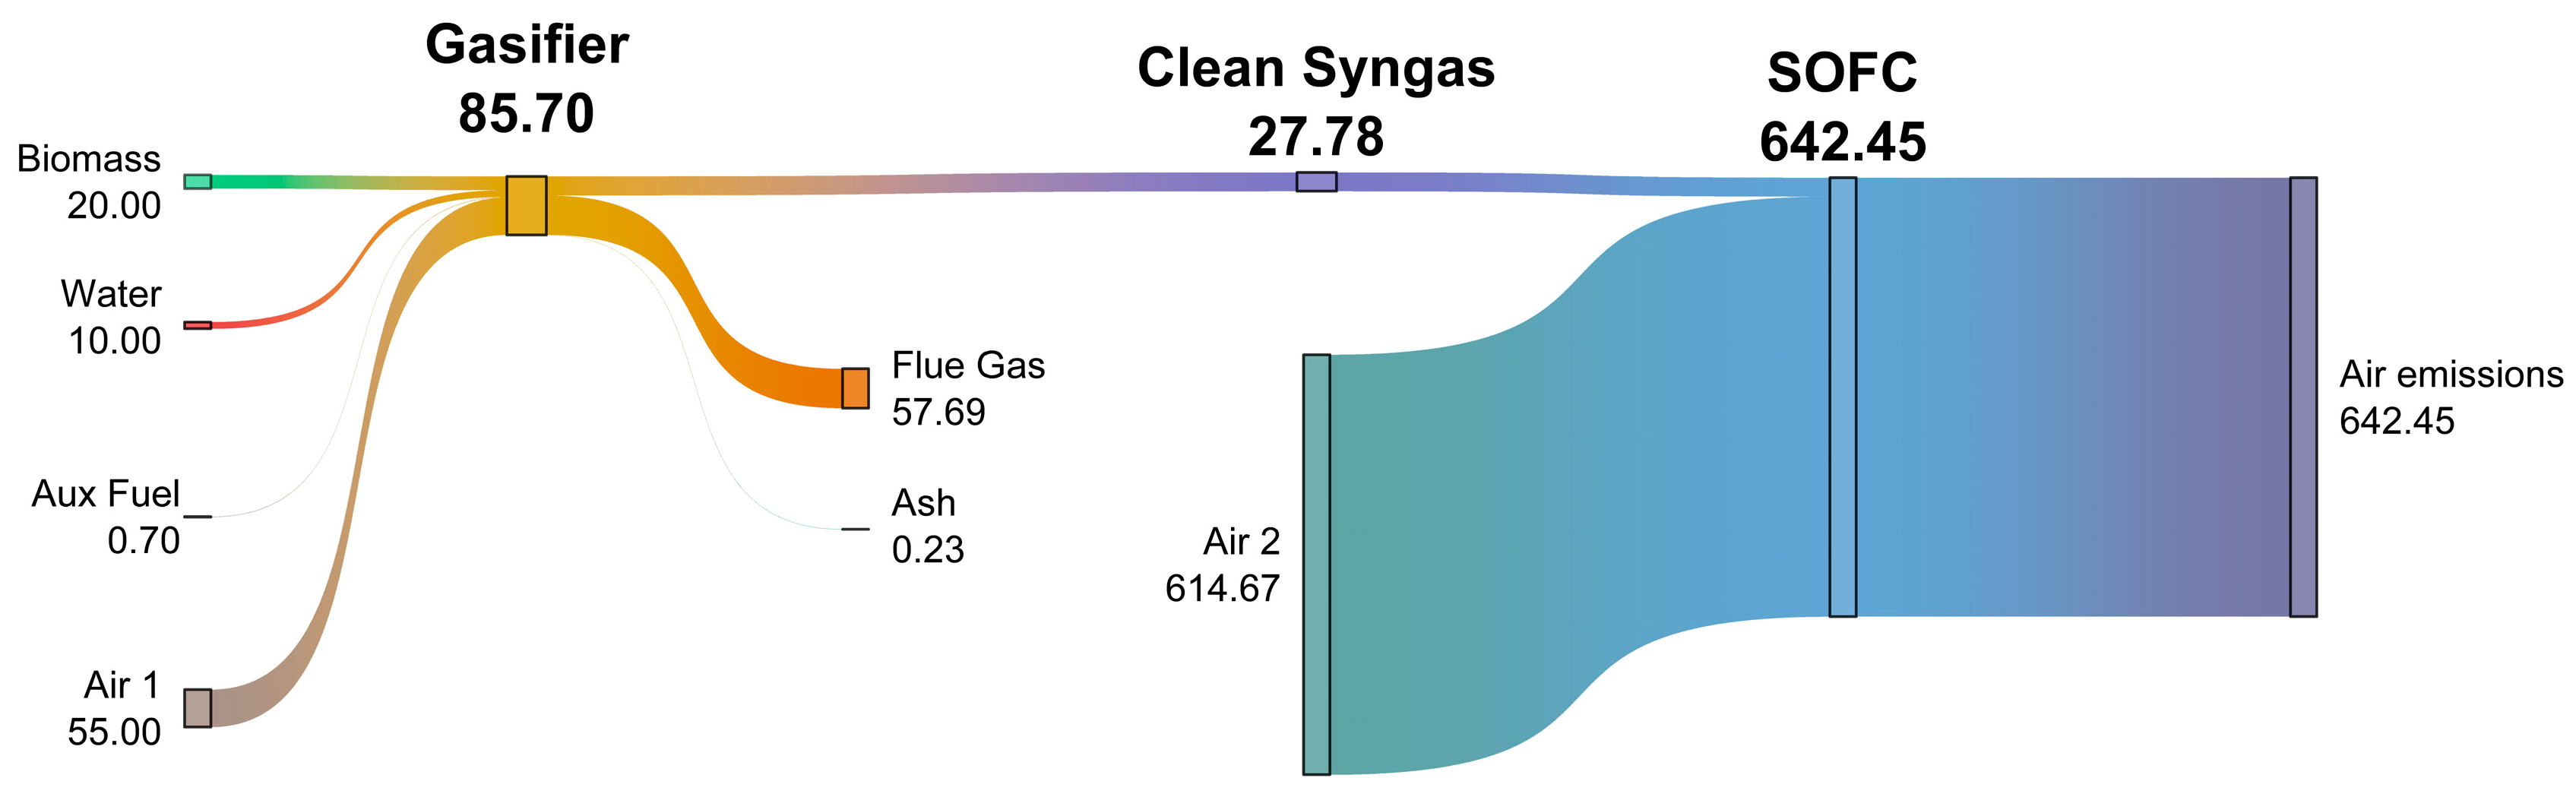
The integrated plant in operating mode 2 was firstly analysed in its unoptimised state through mass- and energy-balance evaluation. Figure 7 and Figure 8 show the corresponding Sankey diagrams.
In this configuration, the process begins with the gasification of biomass, where a mixture of air, process water and a small amount of auxiliary fuel is used to produce a raw syngas. Most of the input energy (approx. 90%) comes from the calorific value of the biomass itself. After the removal of ash and contaminants in the cleaning stage, a clean syngas with a significant proportion of H2 (≈41 vol.%) is obtained.
This clean syngas is then sent to the methanation section, where it is mixed with additional hydrogen from the SOEC. This addition of H2 allows a H/C ratio of 3.5 to be set, raising the hydrogen concentration in the mixture to approximately 73.9 vol.%. At this stage, a large proportion of the chemical energy input—both from the syngas and the electrolytically produced H2—(around 57%) is transferred to the bio-SNG, the final product of the process. Throughout the methanation stages, the water content in the process increases due to the stoichiometry of the hydrogenation reactions (CO/CO2 + H2), where the excess inlet water and inter-cooling strategy allow the heat released to be managed. The excess moisture condenses downstream, creating a stream that serves as a material source. Furthermore, this releases both sensible and latent heat that can also be utilised within the system.
An important aspect revealed by the energy balance is that a significant fraction of the electrolytic H2 does not react and is recirculated to maintain a H2-rich atmosphere (88.6 vol.%, corresponding to a H/C ratio of 5.9), thereby enhancing overall conversion. This reveals that although the SOEC introduces a significant amount of energy (≈26% of the total), only a portion is transferred to the bio-SNG, whilst another portion continuously returns to the system. Harnessing this energy would enable the production of a greater quantity and higher quality of the fuel product.
Finally, the SOEC system requires process heat (around 25% of the total) to maintain its operating temperature, whilst simultaneously generates oxygen and waste steam that can be managed within the system. The stack and compression losses, together with internal heat transfers, are clearly reflected in the energy Sankey diagram, highlighting the importance of the balance between heat generated in methanation and heat consumed by high-temperature electrolysis.
Table 2 shows details of the heat demand and production in each system, as appropriate, including the temperature ranges associated with the heat source or sink. A detailed analysis of the energy demand of the configuration is reported in Figure S1 in the Supplementary Material, providing an overview of the maximum thermal recoverability based on the composite curve analysis.
Line 2 generates 69.79 kWth through cooling, while consuming 34.62 kWth for steam production and inlet gas heating. The SOEC system consumes 28.81 kWth to heat feed water to 750 °C, while producing 12.18 kWth of recoverable heat by cooling the non-recirculated cathode off-gas. Additionally, high-temperature O2 (785 °C) is produced at the SOEC anode and can be utilised for heat recovery. To ensure adequate heat recovery between the systems, the sources’ operating temperature range was considered, while for the heat exchangers, a minimum temperature difference of 10 °C is considered between hot inlet–cold outlet and hot outlet–cold inlet.

3.1.2. Plant Operation in Mode 3

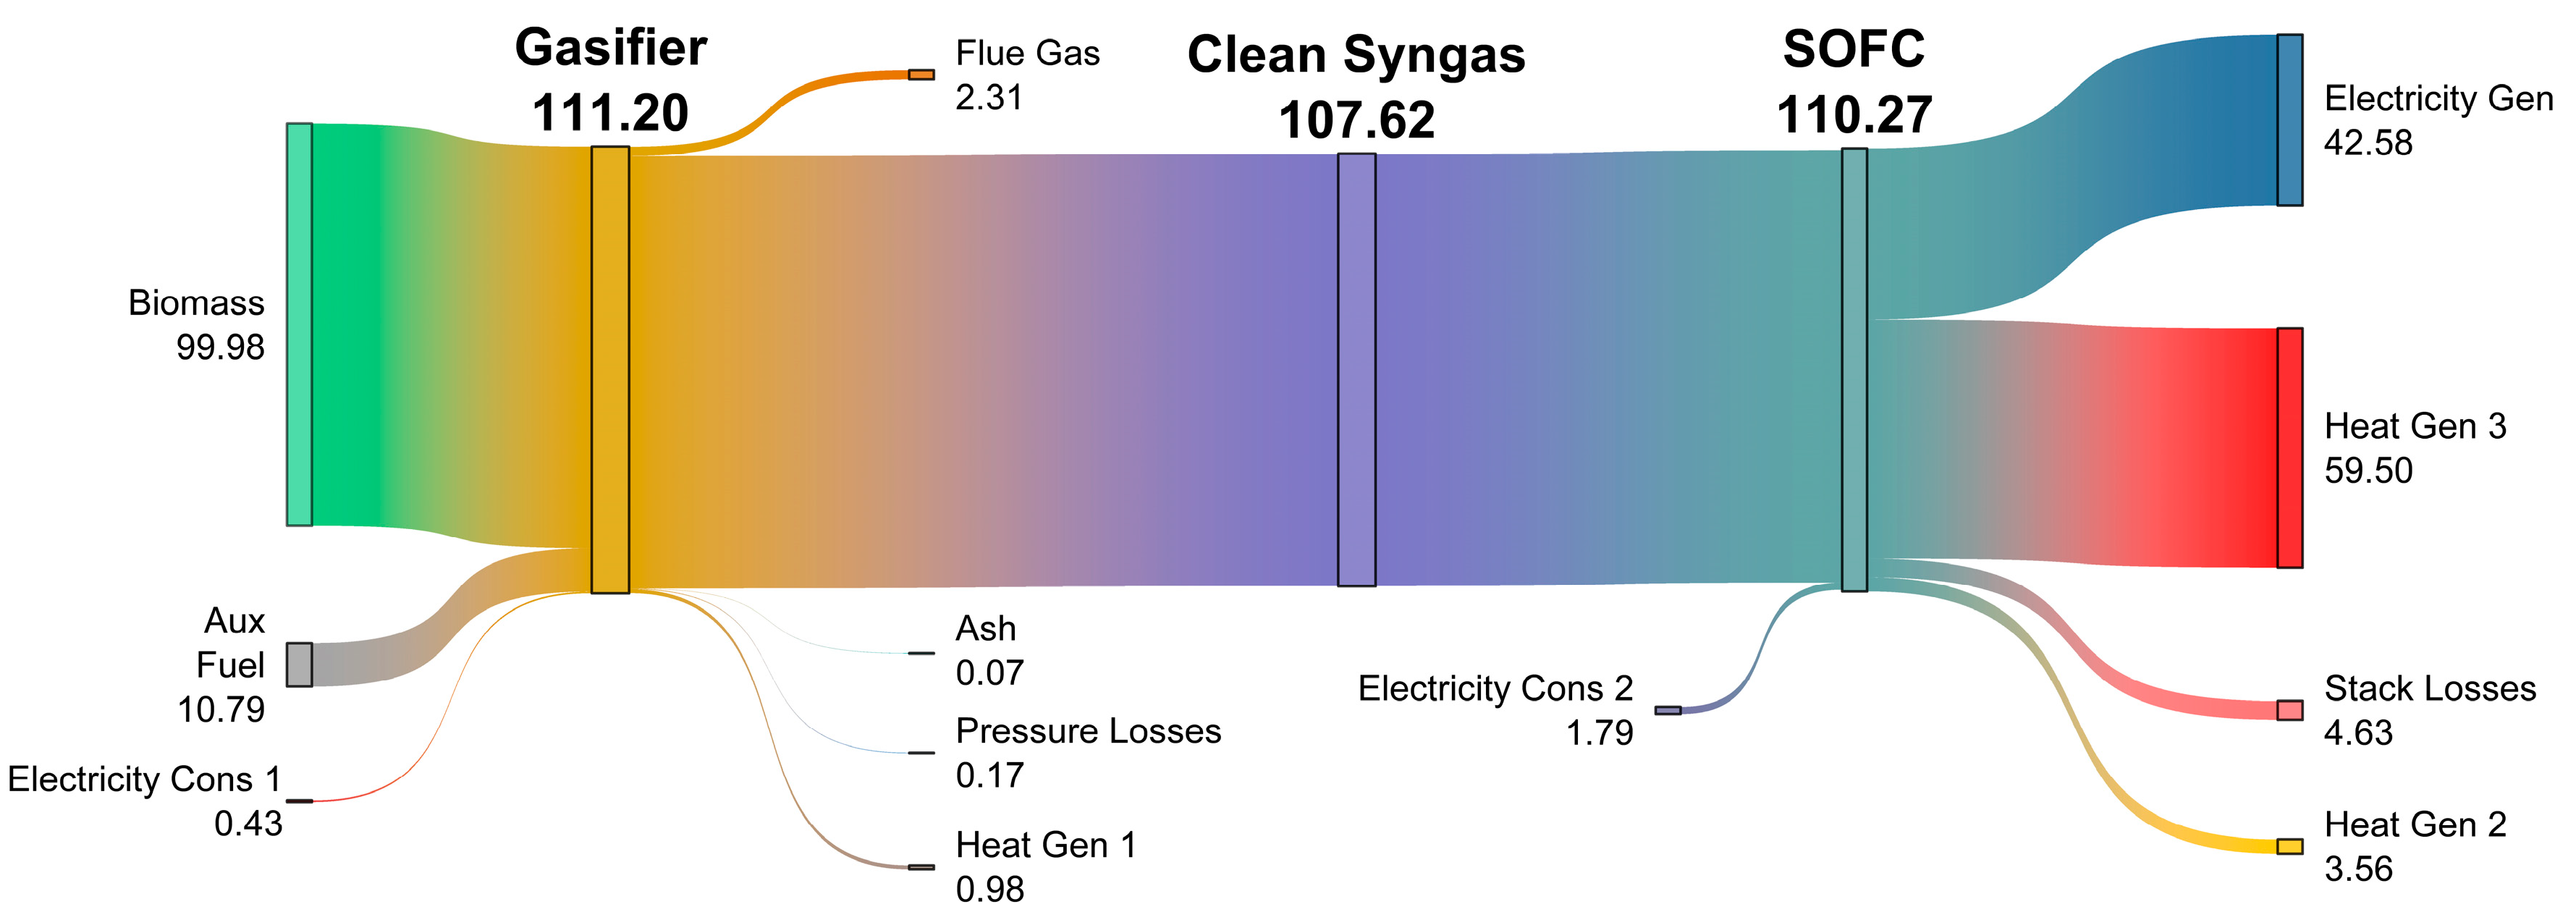
Figure 9 and Figure 10 show the mass- and energy-balance distribution of the integrated plant when the clean syngas in directed to the rSOC operating in SOFC mode.
The advance gasification subsystem (dual concentric gasifier + HGC) behaves identically to operating mode 2, converting biomass (≈100 kWth) and a small auxiliary fuel share (≈10.8 kWth) into clean syngas with 41 vol.% H2.
Inside the SOFC, approximately 30% of the anode off-gas is recirculated to maintain the inlet fuel composition at the required H2,eq ≈ 45.7 mol.%. The stack converts chemical energy into 40.8 kWel net (after deducting the consumption for compression) and releases 59.5 kWth of recoverable thermal energy after the internal heat recovery within the subsystem. Although significant heat is available in the SOFC exhaust, its temperature (≈265 °C) limits the potential for heat recovery.
Table 3 shows the details of the heat sources and sinks of the subsystems, including the associated temperature ranges. Moreover, Figure S2 in the Supplementary material provides an overview of the maximum thermal recoverability of this configuration.
The heat required for producing the steam for the gasification section can be derived from the SOFC exhaust gases; these could provide 59.50 kWth. However, its temperature (265 °C) limits the heat recovery to 7.50 kWth. The remaining 1.88 kWth can be obtained from the clean syngas cooling, raising the steam to 605 °C (HE-STEAM block). Therefore, the sensible heat of the flue gas can be used exclusively to preheat air for the combustor up to 940 °C, eliminating the demand for auxiliary fuel.

3.2. Performance Assessment

3.2.1. Optimization of Plant Operation in Mode 2

The optimisation strategy reconfigured the process flowsheet, maximising heat recovery and eliminating the use of auxiliary fuel.
Key modifications include:
  • Increase in the temperatures of the inlet air flow (at 940 °C) to the combustor and the inlet steam flow (at 746 °C) to the gasifier.
  • Maintain the temperature of the inlet gas mixture to the methanation reactors at 290 °C, the optimum operating value.
  • Consolidation of the water demands using a single pressurised water stream.
  • Integration of high-temperature outlet streams as heat sources.
  • Recover and reuse the wastewater streams of Line 2 to minimise fresh-water input.
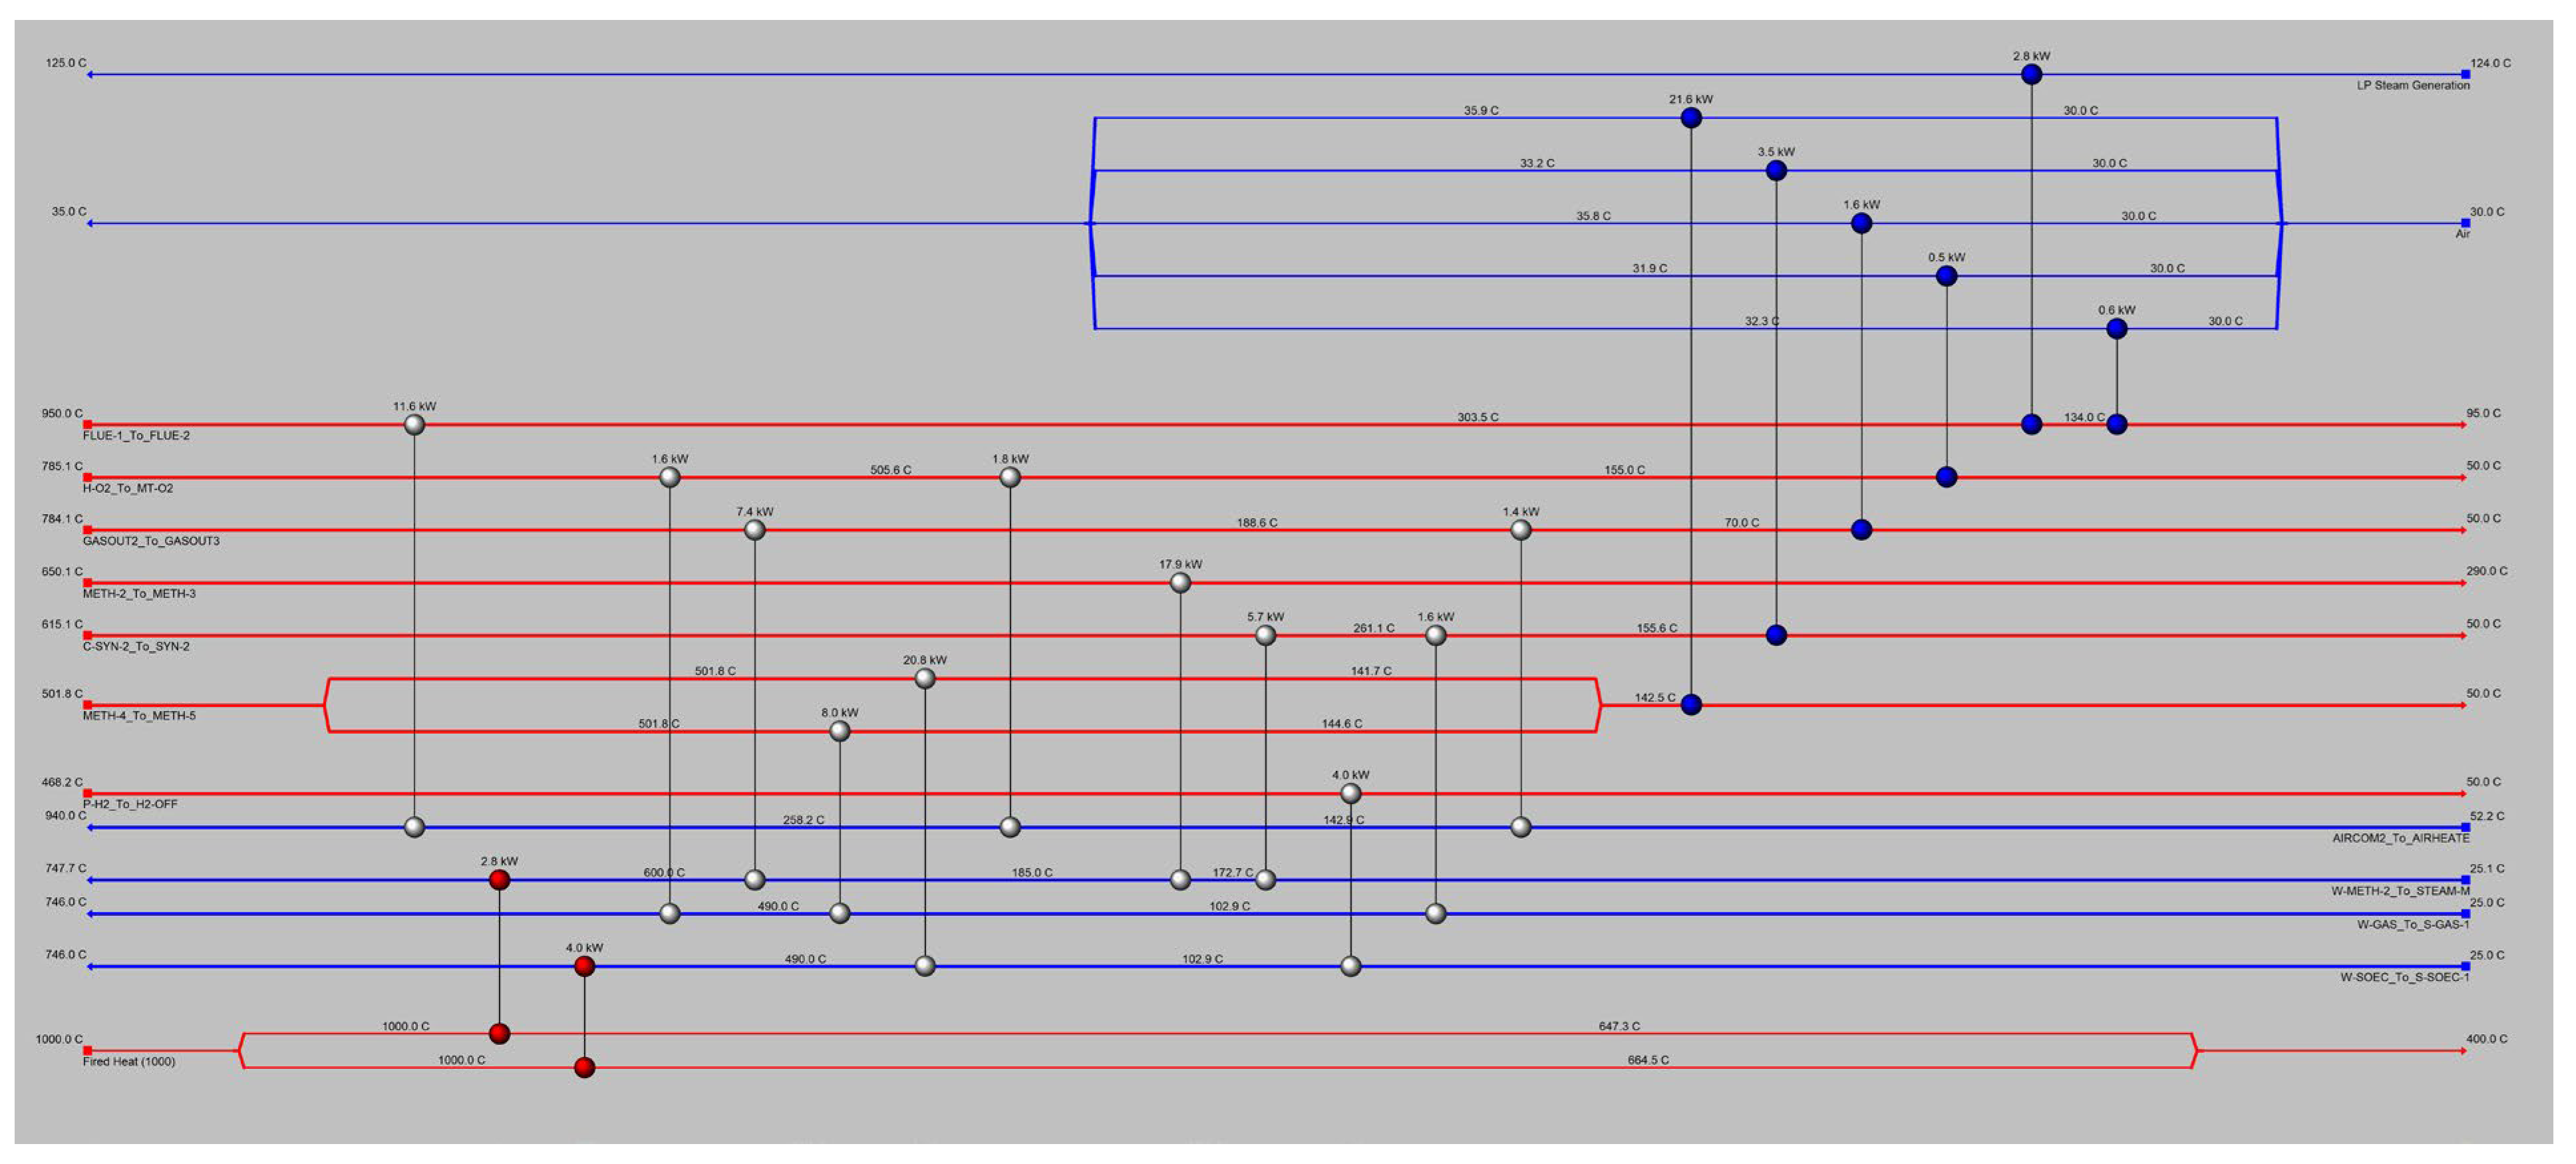
Figure 11 shows the resulting heat exchanger network (HEN), which matches hot and cold streams across subsystems while observing a minimum temperature difference of 10 °C.
The designed HEN was able to supply around 92% of the heating load of the process internally, requiring 6.8 kW of heat utilities (fired heat) at 1000 °C, in addition to 73% of the cooling load, requiring cold utilities and producing 2.8 kW of low-pressure steam at 125 °C and 27.96 kW of air at 35 °C.
The performance comparison of the enhanced bio-SNG production process with respect to the conventional one, and the effect of its subsequent optimisation, are shown in Table 4.
With the initial configuration of the enhanced bio-SNG production process, the plant generates 152.09 kW of bio-SNG from an energy input flow of 267.43 kW (composed of 99.98 kW of biomass, 10.79 kW of auxiliary fuel, 63.47 kW of heat and 93.19 kW of electricity). This process, unlike the conventional one, requires a net heat input related to the SOEC system, which consumes a large amount of thermal energy (28.86 kW), almost twice as much as it generates (15.89 kW). This consumption is related to the steam production at 750 °C. In the case of the Line 1 subsystem (WGS, methanation and upgrading), the heat production (16.68 kW) came from the methanation section due to the exothermic nature of the process, with no thermal demand in the entire system due to the heat recovery strategy already in place.
Despite using the same syngas input as Line 1, the performance of Line 2 was superior, as highlighted by the indicators in Table 4. Overall CGE improved from 71.8% to 74.5%, and CH4 content rose from 84.9% to 93.5% due to the higher H2/(CO + CO2) molar ratio (up to 6.2 at the first methanator vs. 1.5 in Line 1). Starting from the molar ratio of 3.5 between the flows of syngas and the SOEC H2, recirculating the unreacted H2 after the methanation to the feed stream allowed its H2 content to be increased to 6.2. It should be noted that if, instead, a molar ratio of 3.5 is established in the feed stream, a bio-SNG with a methane concentration equal to 73.4% (dry N2-free basis) would be obtained, much lower than in the case of Line 1 (84.9%). Additionally, in Line 1, three of the four reactors operate at the optimum temperature (reaching equilibrium behaviour), while in Line 2, neither of the two reactors does so. All of this demonstrates the fundamental role of the H2/(CO + CO2) molar ratio in achieving complete conversion of gaseous carbon (CO and CO2) into CH4. Excess H2 allows the equilibrium to be shifted and increases the reaction rate, driving it forward, which results in greater conversion efficiency. Despite the points mentioned above, enhanced methanation shows a lower overall fuel production efficiency. This is because, unlike Line 1, the flowsheet of the Line 2 subsystem does not incorporate any heat recovery strategy in the base scenario, meaning that there is no reduction in heat requirement. Furthermore, the heat required in Line 2 is considerably higher, as a greater volume of water needs to be vaporised and brought up to operating temperature. Higher process performance resulting from a higher H/C ratio at the inlet will require more water to stabilise the temperature rise, in addition to greater heat generated (inter-cooling + condensation). An improvement is expected in the respective optimised configuration.
Optimisation further improved overall CGE (to 78.1%) and fuel efficiency (to 75.4%). The performance indicators’ increase is due to the elimination of the auxiliary fuel. On the other hand, the slight decrease in the methane content of bio-SNG, considered negligible, is due to the reduction in the H2/(CO + CO2) molar ratio of the feed stream to the methanation section to 5.9, caused by the decrease in the recirculated H2 flow.
Although this reduction makes it less evident, the optimisation led to a more efficient methanation process, mainly due to the adjustment in the inlet gas temperature of both methanators. This was confirmed by simulating the initial configuration with a fixed H2/(CO + CO2) ratio of 5.9, which resulted in a methane concentration in bio-SNG of 92.6%. Because methanation is exothermic (ΔH° < 0), lowering the temperature shifts the equilibrium toward methane (increasing K), and with excess H2 (changing partial pressures), the equilibrium position moves further toward the product, yielding higher methane.
The SOEC system was unaffected by the optimisation because the system operating conditions (e.g., feed, temperature and pressure) and the stack operating parameters (e.g., voltage and thermal losses) do not vary, keeping the H2 production efficiency constant (96.4%). Therefore, it was not considered in the analysis.
At the plant level, overall fuel production efficiency increased significantly as expected, reaching 75.4%. Heat generation stands at 1.4% when considering only the low-pressure steam produced, which is potentially marketable. If the air produced at 30 °C is included, heat generation rises to 15.3% and total efficiency reaches 90.7%.

3.2.2. Optimization of Plant Operation in Mode 3

Like the previous one, the optimisation of this operating mode focused on complete elimination of auxiliary fuel demand in the combustor by increasing the temperatures of the inlet air flow (at 940 °C) and inlet water flow (at 605 °C) to the combustor/gasifier.
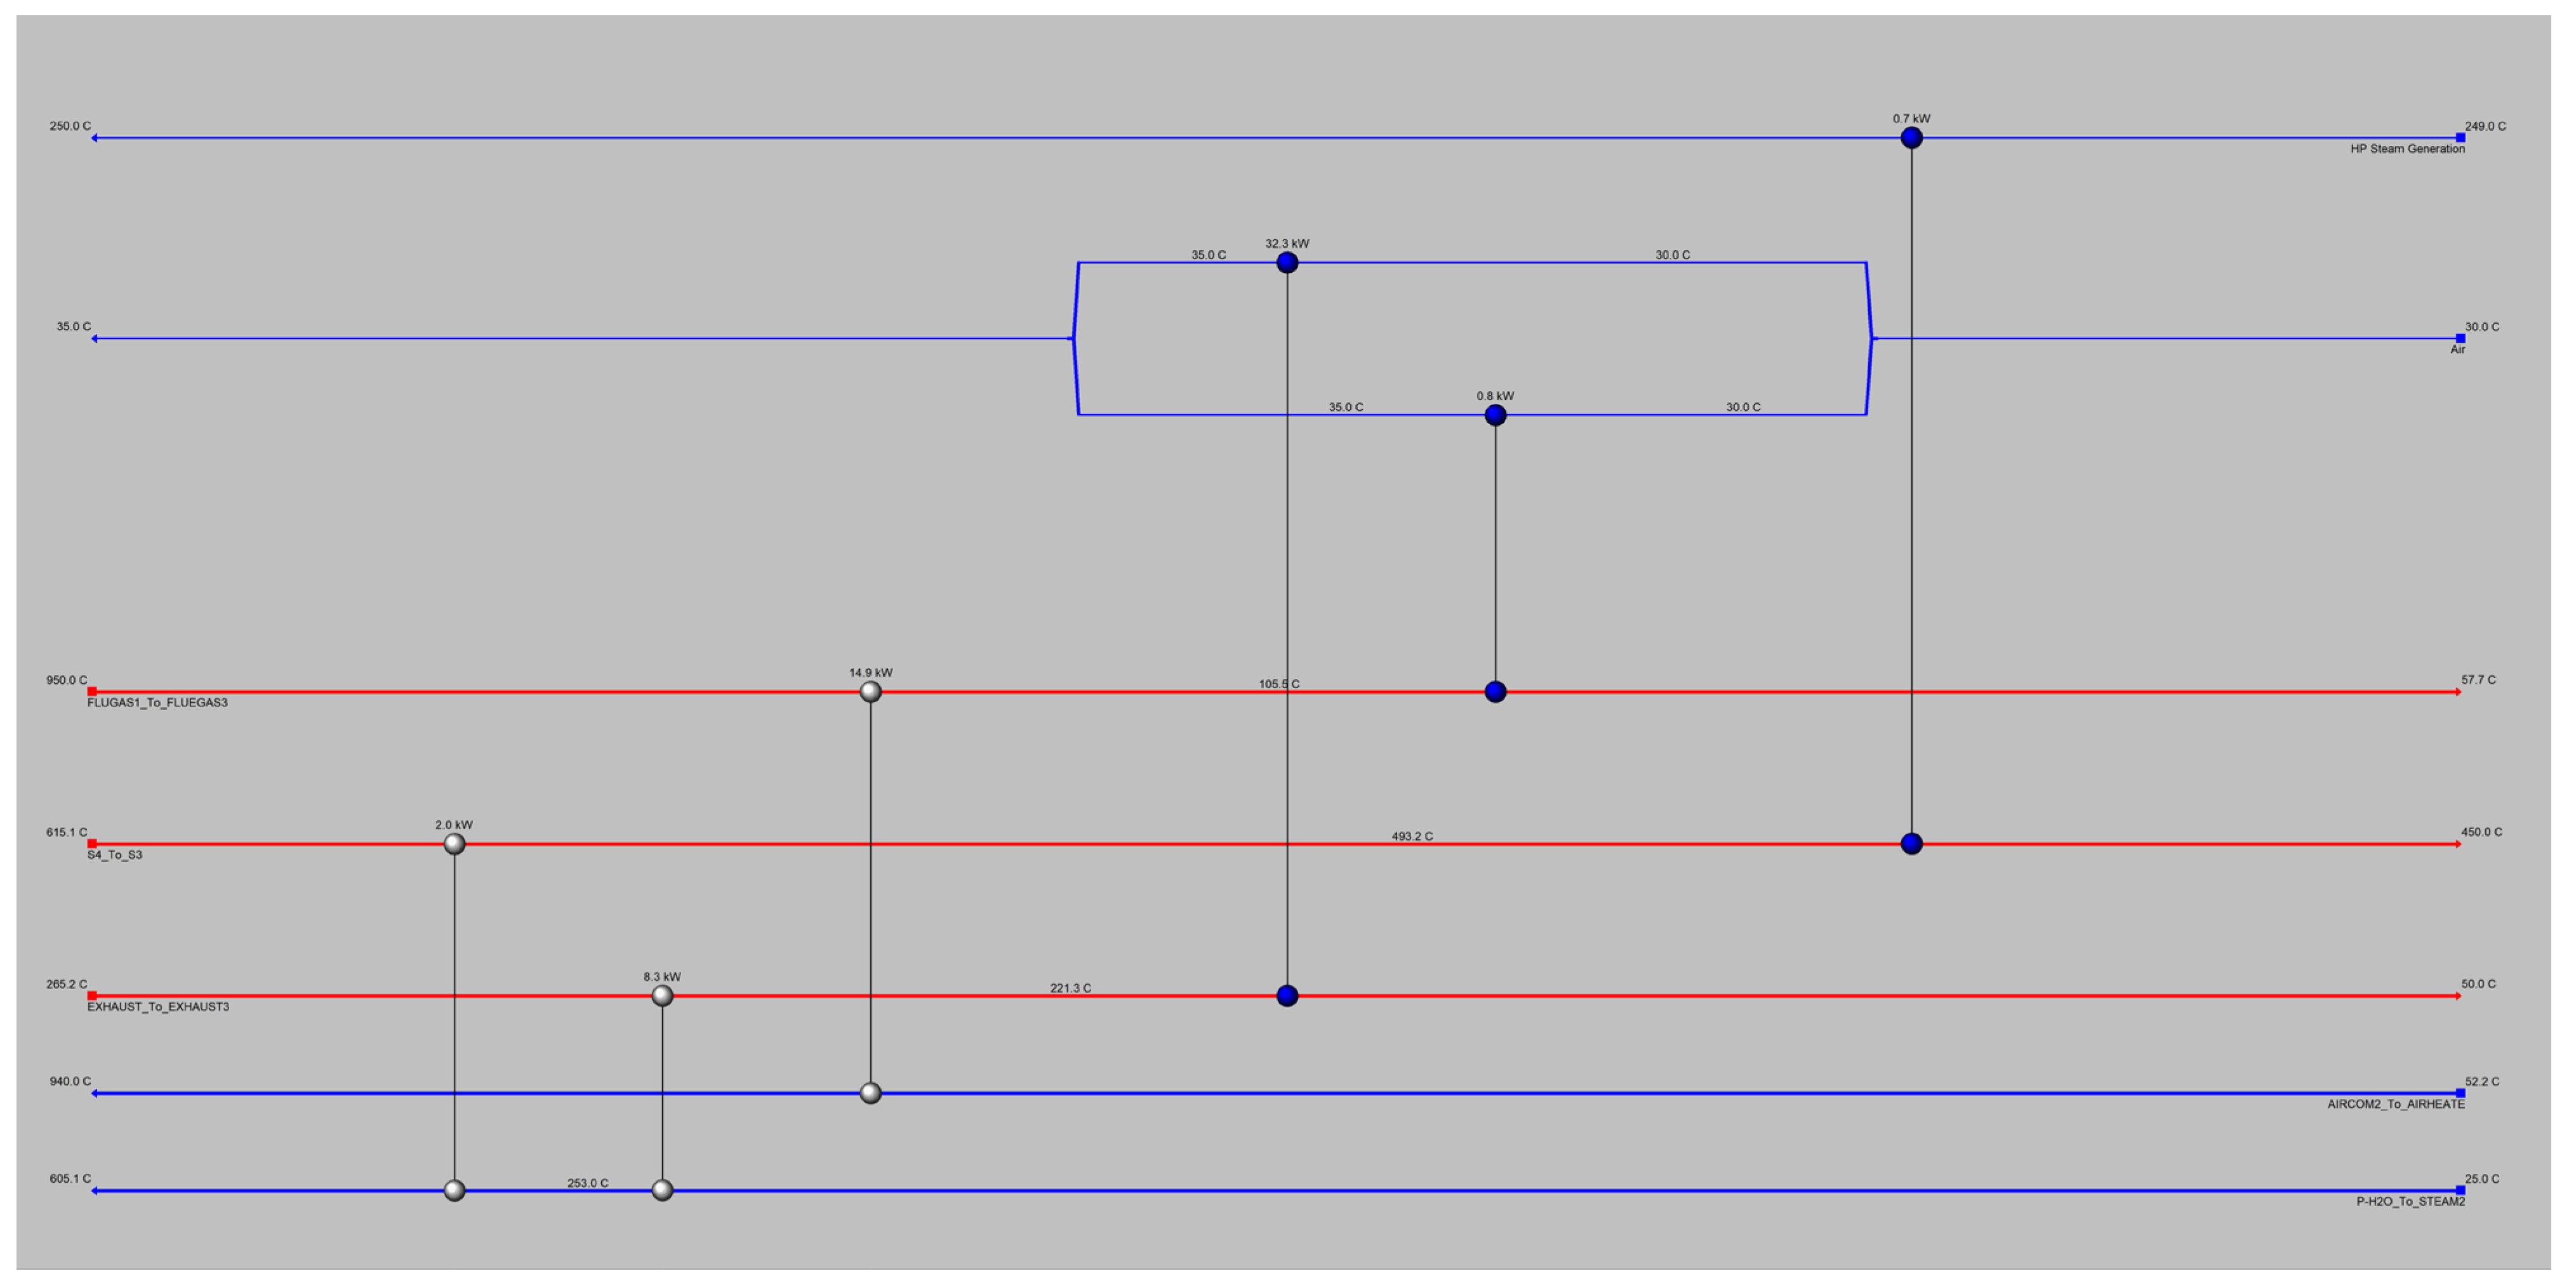
Figure 12 shows the optimised HEN of this configuration.
In the design HEN, the entire heating load of the process is supplied internally. On the other hand, external loads were required for the cooling load, producing 33.07 kW of air at 35 °C and 0.72 kW of high-pressure steam at 250 °C.
The results of optimising this operating mode are summarised in Table 5.
The initial configuration of the power production process using the rSOC operating in SOFC mode allowed the plant to generate 63.06 kWth of heat and 40.37 kWel of net electricity from an energy input stream of 110.77 kW (comprising 99.98 kW of biomass and 10.79 kW of auxiliary fuel). This combined heat and power generation is due to the SOFC system, which, owing to its internal heat recovery within the subsystem, has no thermal energy demand.
The optimisation, as in the previous operating mode, aimed at eliminating the use of auxiliary fuel from the gasification system, resulting in an increase in the CGE (from 85.3 to 94.5%) due to the reduction in the energy inlet, while maintaining the output. The syngas yield does not change, as the auxiliary CH4 was not included in the calculation because it does not affect the syngas by chemically becoming part of it, affecting only the combustor heat. As for the SOFC system, it was not affected by the optimisation, because the input fuel flow (syngas) and the operating parameters (e.g., inlet temperature, cell voltage and utilisation factor) do not vary, keeping the electricity production efficiency constant (51.4%), so it was not considered in the analysis. At plant level, the overall electricity production efficiency increased (from 36.4% to 40.4%), while the heat production efficiency decreased (from 57.8% to 0.7% or 34.6%, depending on which thermal utilities are considered). Consequently, the total efficiency can increase to 75.0%.

3.2.3. Comparison with Alternative Technologies

Table 6 and Table 7 compare the current optimised system with others from the literature. All performance indicators were calculated based on the LHV.
Wang et al. [61] studied a similar system for enhanced bio-SNG production from dry wood waste using a polymeric electrolyser instead of an SOEC and developing an equilibrium-based model. Meanwhile, Ciccone et al. [62] focused solely on the enhanced methanation of low-quality N2-diluted syngas, developing a novel system consisting of an initial recycled reactor together with a series of four inter-cooled reactors with water removal. In addition, kinetics-based reactor models developed from real industrial reactors were used.
At the methanation stage, the competitiveness of the current process compared to the equilibrium process [61], observed in the CGE, C and H2 conversion, and gas yield, is due to the removal and recirculation of unreacted H2. As previously mentioned, recirculation was chosen in order to avoid adding another methanation reactor having reached the target composition (H2 < 4 vol.%) in the bio-SNG product, anticipating a possible positive impact on costs. Analysing only the methanation reactors, on the other hand, a low H2 conversion of 57.8% can be observed. There is therefore much room for improvement, both in terms of the quantity and quality of the bio-SNG product, with the increase in reactors. Additionally, the kinetic model of tubular catalytic reactor used, validated with experimental data in [34], gives the process model an important projection capacity at real plant scale.
In relation to the remaining methanation process [62], a similar performance was obtained with a considerably less complicated system. However, it is important to highlight the notable improvement achieved in overall performance (C conversion and CH4 yield) as a result of removing the water content after the third reactor, shifting the equilibrium towards product formation and reducing the amount of catalyst required. This modification will be evaluated in a future improvement of the current system, considering the risk of an increase in temperature at the reactor outlets, an aspect that is controlled in [62] due to the large amount of N2 (61.5 vol.%db) present in the feed syngas.
At the system level, the use of an SOEC unit instead of a polymeric electrolyser avoids a large electricity consumption (48.1% vs. 73.7% of the total input). However, a small net heat consumption (3.5% of the total input) is required, which could not be matched in the optimisation, given the 750 °C operating condition of the SOEC stack. Due to the high efficiency of the stack and the thermal integration throughout the process, the current system achieves significantly higher fuel production efficiency (70.1% vs. 46.5%). It is possible to assume that, with an increase in methanation stages, the system would increase the heat generated as a by-product, further increasing the overall system efficiency, as well as the overall carbon conversion (76.8%). Along with the energy balance, the material balance was also optimised, considerably reducing the water demand of the system as evidenced by the high overall hydrogen conversion (84.0% vs. 49.3%), assuming possible conditioning of the recovered water streams before reuse.
On the other hand, the presented electricity production system has been compared with those of Bang-Møller [63] and Rokni and Kalina [64]. The former adds a micro-gas turbine (MGT) to the base system layout in a second study case, prioritising the production of electricity over heat, while the latter system layout includes an internal combustion engine (ICE) and an organic Rankine cycle (ORC). The current system achieved greater fuel utilisation (0.86) thanks to the recirculation of the anode off-gas, standing out from the base layout of [63] (gasifier-SOFC) which does not use it (0.80). However, since the current SOFC stack model is limited to one operating point, the presented system is at a disadvantage compared to the improved layout of [63], which adds an MGT (43.1% vs. 50.3%). Therefore, a future model that includes the electrochemical stack part will increase the flexibility of generation, allowing electricity or heat production to be prioritised as required. With regard to the remaining system of [64], there is considerably higher overall fuel utilisation (0.86 vs. 0.76), highlighting the greater efficiency of the technologies present, with a gasifier CGE of 89.8% vs. 71.9% and an SOFC electrical efficiency of 50.6% vs. 36.0%.
As regards the heat produced, the current system mainly generates low-temperature heat; if this is considered unusable, the plant’s production efficiency stands at 0.7%, corresponding to low-pressure steam at 250 °C. However, by varying the operating point of the stack (using an improved flexible model) and the design of the HEN, it is possible to increase the useful heat produced. Furthermore, the systems from the literature used for comparison have not taken the quality of the heat produced into account in their calculations. On this point, when all the heat is considered, the current system achieves the highest efficiency of 80%.
As briefly mentioned in the introduction, the system analysed offers the following advantages:
  • Feedstock Flexibility and Logistical Suitability: Biogenic waste is often characterised by limited local availability of different characteristics, low energy density, and high perishability. Smaller-scale plants that accept feedstock with different characteristics can be located closer to waste generation sites, significantly reducing the transportation, storage, and handling costs that often make conventional 100 MW entrained-flow gasification systems economically unviable.
  • Technological Enabling: Fluidised beds can accept a wider feedstock spectrum than fixed beds and are easily scalable (as rSOC); meanwhile, a dual concentric bubbling steam gasifier/air combustor is more compact and exhibits better thermal transfer compared to traditional circulating bed systems.
  • Grid Balancing: The rSOC allows the plant to switch between producing high-quality bio-SNG (93.3 vol.% methane, dry, N2-free) with high yield (0.69) and efficiency (69.5%) during periods of surplus renewable energy and generating electricity with very high efficiency (45.5%) when grid demand is high. Practical industrial implementation is supported by “hot standby” strategies and thermal management systems (using integrated electric heaters and air blowers) that allow the system to transition between modes in 3 to 10 min. This quick response is essential for participating in modern energy markets and providing grid-regulation services.
  • Reduced CapEx and Increased Utilisation: CapEx is reduced by the use of rSOC because the cost decrease for the elimination of two separate units (an electrolyser and a fuel cell) and duplicated balance-of-plant subsystems is higher than the cost increase for complex requirements for sealing, manifolding, and thermo-mechanical durability, and, with respect to standard processes, the CapEx is reduced for water–gas shift (WGS) reactors and complex gas upgrading elimination, as the added hydrogen from the rSOC optimises the gas mixture directly: annual utilisation increases as the same asset generates revenue in both energy-storage and power-generation regimes, thereby reducing the levelised cost of both fuel and electricity.
  • Market Adaptability: The ability to switch production based on fluctuating market prices for electricity and methane allows operators to maximise profit margins, potentially achieving better competitiveness than conventional single-product plants.
Finally, there still remain some implementation challenges, such as:
Feedstock Variability: Systems with biomass with different characteristics (e.g., more moisture, ash and sulphur and chlorine content) that can affect the thermal balance should be analysed; this may require additional pre-treatment, such as drying or hydrothermal carbonisation, and additional conditioning.
Catalyst, Sorbents and rSOC Degradation: Catalysts, sorbents and rSOC degradation should be verified, especially with high variations in biomass (of different characteristics) and operation mode.
Techno-Economic–Environmental Evaluation: A technical analysis of the scale-up with a lifetime economic analysis and related life cycle assessment should be undertaken.

4. Conclusions

This study investigated the energy performance of a flexible and integrated plant developed within the AIRE project. The system combines steam gasification, hot gas conditioning, methanation and rSOC technologies, aiming to produce either bio-SNG or electricity from biogenic waste, depending on the energy demand. Two operating configurations were analysed: an enhanced bio-SNG production process, which integrates standard bio-SNG production with an rSOC unit working as an SOEC (Line 2-SOEC), and electricity production through the rSOC unit working as an SOFC fed with syngas (Line 2-SOFC). For each configuration, specific optimisation strategies were implemented, focusing on thermal integration and internal heat recovery to minimise external energy inputs, eliminate auxiliary fuel requirements, and improve overall system efficiency.
In the enhanced methanation process (Line 2), higher bio-SNG yield (0.72) and quality (93.5% methane content) was achieved compared to the conventional process (Line 1) developed in a previous work. This finding highlights the key role of the H2/(CO + CO2) molar ratio in enhancing methane yield. The thermal/heat optimisation, which does not affect the SOEC H2 production efficiency of 96.4%, improved overall CGE. Although the electrical energy demand of this optimised configuration was significantly higher than that of its conventional counterpart (4.45 kW vs. 93.28 kW), it was balanced by the improved quantity and quality of the bio-SNG produced, reaching a similar fuel production efficiency (76.2% vs. 75.4%) with low thermal generation. The lower total overall efficiency (81.3% vs. 76.8%) is related to the high energy consumption due to the higher bio-SNG quality (84.5% vs. 93.3%). However, by adjusting the H/C molar ratio, it will be possible to increase the production efficiency while maintaining superior quality.
In the optimised electricity production configuration, the system reached an overall electricity efficiency of 40.4%, maintaining a total efficiency of around 41%. Overall efficiency is limited because around 98% of the heat produced is air at 35 °C, which has not been considered commercially valuable. Considering all the heat produced, the overall efficiency rises to 75.0%. Through the adopted optimisation approach, the sensible heat of exhaust flows was recovered, eliminating the use of auxiliary fuel and raising the CGE of the gasifier to 94.5%.
The results show that the thermal and heat optimisation is fundamental across all analysed configurations, increasing efficiencies and/or fuel quality by 1–9%. By comparing the three optimised configurations, it emerges that Line 1 cannot reach high-quality bio-SNG (less than 85%) but does eliminate net heat production (around 5%), Line 2-SOEC can reach higher fuel quantity (up to 0.72, vs. 0.44) and quality (up to around 93%) with electricity and net heat requirements, and Line 2-SOFC can produce electricity with high efficiency (up to around 40%). Line 1 can be used in applications where there is no electricity need. As Line 2-SOEC/SOFC are different configurations of a plant with the same main components capable of switching flexibly between fuel (with electricity consumption) and power production modes, its responsiveness to energy market conditions or local grid requirements is enhanced. Therefore, the Line 2-rSOC plant, which produces electricity and fuel depending on the market electricity and methane costs, could achieve better economic competitiveness than a Line 1 plant or the same competitiveness at a reduced size.


Supplementary Materials

The following supporting information can be downloaded at: https://www.mdpi.com/article/10.3390/en19081887/s1.

Author Contributions

Conceptualisation, A.D.C. and E.B.; data curation, J.D.P., A.A.P. and A.V.; formal analysis, J.D.P., A.A.P. and A.V.; funding acquisition, A.D.C. and E.B.; investigation, J.D.P., A.A.P. and A.V.; methodology, J.D.P., A.A.P. and A.V.; project administration, A.D.C. and E.B.; resources, A.D.C. and E.B.; software, J.D.P., A.A.P., E.D.B. and A.V.; supervision, A.A.P. and E.B.; validation, J.D.P., A.A.P., E.D.B. and A.V.; visualisation, J.D.P., A.A.P. and A.V.; writing—original draft, J.D.P.; writing—review and editing, J.D.P., A.A.P., E.D.B., A.V., A.D.C. and E.B. All authors have read and agreed to the published version of the manuscript.

Funding

This research was developed within the AIRE (Advanced Integration for Renewable Energies) project, funded by the Italian programme PON R&I 2014–2020, contract ARS01_01245.

Data Availability Statement

Dataset available on request from the authors.

Conflicts of Interest

The authors declare no conflicts of interest.

Abbreviations

AIREAdvance Integration of Renewable Energy
ATRAutothermal reformer
CGECold Gas Efficiency
YieldDry gas yield
DFBDual-fluidised bed
DMEDimethyl ether
FTFischer–Tropsch
HENHeat exchanger network
HHVHigh heating value
HGCHot gas conditioning
ICEInternal combustion engine
LHVLow heating value
MeOHMethanol
MGTMicro-gas turbine
P2GPower-to-Gas
rSOCReversible solid oxide cell
SOFCSolid oxide fuel cell
SOECSolid oxide electrolysis cell
SNGSynthetic natural gas
STSteam turbine
STPStandard conditions of temperature and pressure
WGSWater–gas shift

References

  1. Geisendorf, S.; Pietrulla, F. The Circular Economy and Circular Economic Concepts—A Literature Analysis and Redefinition. Thunderbird Int. Bus. Rev. 2018, 60, 771–782. [Google Scholar] [CrossRef]
  2. Prado-Acebo, I.; Cubero-Cardoso, J.; Lu-Chau, T.A.; Eibes, G. Integral Multi-Valorization of Agro-Industrial Wastes: A Review. Waste Manag. 2024, 183, 42–52. [Google Scholar] [CrossRef]
  3. Chen, D.M.-C.; Bodirsky, B.L.; Krueger, T.; Mishra, A.; Popp, A. The World’s Growing Municipal Solid Waste: Trends and Impacts. Environ. Res. Lett. 2020, 15, 074021. [Google Scholar] [CrossRef]
  4. Vida, V.; Kovács, T.Z.; Nagy, A.S.; Madai, H.; Bittner, B. Food Waste in EU Countries. Appl. Stud. Agribus. Commer. 2023, 16, 11–17. [Google Scholar] [CrossRef] [PubMed]
  5. Kircher, M.; Aranda, E.; Athanasios, P.; Radojcic-Rednovnikov, I.; Romantschuk, M.; Ryberg, M.; Schock, G.; Shilev, S.; Stanescu, M.D.; Stankeviciute, J.; et al. Treatment and Valorization of Bio-Waste in the EU. EFB Bioeconomy J. 2023, 3, 100051. [Google Scholar] [CrossRef]
  6. Cucina, M. Integrating Anaerobic Digestion and Composting to Boost Energy and Material Recovery from Organic Wastes in the Circular Economy Framework in Europe: A Review. Bioresour. Technol. Rep. 2023, 24, 101642. [Google Scholar] [CrossRef]
  7. Rijo, B.; Soares Dias, A.P.; de Jesus, N.; Pereira, M.F. Home Trash Biomass Valorization by Catalytic Pyrolysis. Environments 2023, 10, 186. [Google Scholar] [CrossRef]
  8. Talan, A.; Tiwari, B.; Yadav, B.; Tyagi, R.D.; Wong, J.W.C.; Drogui, P. Food Waste Valorization: Energy Production Using Novel Integrated Systems. Bioresour. Technol. 2021, 322, 124538. [Google Scholar] [CrossRef]
  9. Satari, B.; Khazaei, J.; Kianmehr, M.H. Integrated Hydrothermal Carbonization to Enhance Resource and Energy Recovery from Food Waste. Appl. Food Res. 2025, 5, 100869. [Google Scholar] [CrossRef]
  10. Faaij, A.; van Ree, R.; Waldheim, L.; Olsson, E.; Oudhuis, A.; van Wijk, A.; Daey-Ouwens, C.; Turkenburg, W. Gasification of Biomass Wastes and Residues for Electricity Production. Biomass Bioenergy 1997, 12, 387–407. [Google Scholar] [CrossRef]
  11. DEMİRBAŞ, A. Fuel and Combustion Properties of Bio-Wastes. Energy Sources 2005, 27, 451–462. [Google Scholar] [CrossRef]
  12. Munir, M.T.; Mardon, I.; Al-Zuhair, S.; Shawabkeh, A.; Saqib, N.U. Plasma Gasification of Municipal Solid Waste for Waste-to-Value Processing. Renew. Sustain. Energy Rev. 2019, 116, 109461. [Google Scholar] [CrossRef]
  13. Di Carlo, A.; Savuto, E.; Foscolo, P.U.; Papa, A.A.; Tacconi, A.; Del Zotto, L.; Aydin, B.; Bocci, E. Preliminary Results of Biomass Gasification Obtained at Pilot Scale with an Innovative 100 KWth Dual Bubbling Fluidized Bed Gasifier. Energies 2022, 15, 4369. [Google Scholar] [CrossRef]
  14. Saebea, D.; Ruengrit, P.; Arpornwichanop, A.; Patcharavorachot, Y. Gasification of Plastic Waste for Synthesis Gas Production. Energy Rep. 2020, 6, 202–207. [Google Scholar] [CrossRef]
  15. Parrillo, F.; Ardolino, F.; Boccia, C.; Calì, G.; Marotto, D.; Pettinau, A.; Arena, U. Co-Gasification of Plastics Waste and Biomass in a Pilot Scale Fluidized Bed Reactor. Energy 2023, 273, 127220. [Google Scholar] [CrossRef]
  16. Vitale, A.; Papa, A.A.; Di Carlo, A.; Rapagnà, S. Three-Dimensional Computational Fluid-Dynamic Simulation of Polypropylene Steam Gasification. Int. J. Hydrogen Energy 2024, 95, 1328–1341. [Google Scholar] [CrossRef]
  17. FAO Hazelnut Production. Inventory of Hazelnut Research, Germplasm and References; Ýlhami Köksal, A., Ed.; FAO Regional Office for Europe: Rome, Italy, 2000. [Google Scholar]
  18. Ahmad, A.A.; Zawawi, N.A.; Kasim, F.H.; Inayat, A.; Khasri, A. Assessing the Gasification Performance of Biomass: A Review on Biomass Gasification Process Conditions, Optimization and Economic Evaluation. Renew. Sustain. Energy Rev. 2016, 53, 1333–1347. [Google Scholar] [CrossRef]
  19. Bocci, E.; Di Carlo, A.; McPhail, S.J.; Gallucci, K.; Foscolo, P.U.; Moneti, M.; Villarini, M.; Carlini, M. Biomass to Fuel Cells State of the Art: A Review of the Most Innovative Technology Solutions. Int. J. Hydrogen Energy 2014, 39, 21876–21895. [Google Scholar] [CrossRef]
  20. Marcantonio, V.; Müller, M.; Bocci, E. A Review of Hot Gas Cleaning Techniques for Hydrogen Chloride Removal from Biomass-Derived Syngas. Energies 2021, 14, 6519. [Google Scholar] [CrossRef]
  21. BMWi. BMU Energy Concept for an Environmentally Sound, Reliable and Affordable Energy Supply; BMWi: Berlin, Germany, 2010. [Google Scholar]
  22. Rönsch, S.; Schneider, J.; Matthischke, S.; Schlüter, M.; Götz, M.; Lefebvre, J.; Prabhakaran, P.; Bajohr, S. Review on Methanation—From Fundamentals to Current Projects. Fuel 2016, 166, 276–296. [Google Scholar] [CrossRef]
  23. Erdogan, A.; Dursun, B.; Colpan, C.O.; Ayol, A. A Review on Performance, Economic, and Environmental Analyses of Integrated Solid Oxide Fuel Cell and Biomass Gasification Systems. Energy Sources Part A Recovery Util. Environ. Eff. 2022, 44, 8403–8426. [Google Scholar] [CrossRef]
  24. Wang, L.; Zhang, Y.; Li, C.; Pérez-Fortes, M.; Lin, T.-E.; Maréchal, F.; Van Herle, J.; Yang, Y. Triple-Mode Grid-Balancing Plants via Biomass Gasification and Reversible Solid-Oxide Cell Stack: Concept and Thermodynamic Performance. Appl. Energy 2020, 280, 115987. [Google Scholar] [CrossRef]
  25. Rajaee, F.; Romano, M.C.; Ritvanen, J. Flexible Integrated Gasification Solid Oxide Cell (IGSOC) Plant for Bio-Methanol and Bio-Power Generation. Energy 2025, 337, 138457. [Google Scholar] [CrossRef]
  26. Butera, G.; Højgaard Jensen, S.; Østergaard Gadsbøll, R.; Ahrenfeldt, J.; Røngaard Clausen, L. Flexible Biomass Conversion to Methanol Integrating Solid Oxide Cells and TwoStage Gasifier. Fuel 2020, 271, 117654. [Google Scholar] [CrossRef]
  27. Papa, A.A.; Tacconi, A.; Savuto, E.; Ciro, E.; Hatunoglu, A.; Foscolo, P.U.; Del Zotto, L.; Aydin, B.; Bocci, E.; Di Carlo, A. Performance Evaluation of an Innovative 100 KWth Dual Bubbling Fluidized Bed Gasifier through Two Years of Experimental Tests: Results of the BLAZE Project. Int. J. Hydrogen Energy 2023, 48, 27170–27181. [Google Scholar] [CrossRef]
  28. Rapagnà, S. Steam-Gasification of Biomass in a Fluidised-Bed of Olivine Particles. Biomass Bioenergy 2000, 19, 187–197. [Google Scholar] [CrossRef]
  29. Tacconi, A.; Foscolo, P.U.; Rapagnà, S.; Di Carlo, A.; Papa, A.A. A Pilot-Scale Gasifier Freeboard Equipped with Catalytic Filter Candles for Particulate Abatement and Tar Conversion: 3D-CFD Simulations and Experimental Tests. Processes 2025, 13, 2233. [Google Scholar] [CrossRef]
  30. Nacken, M.; Papa, A.A.; Di Carlo, A. Novel High Performance Catalyst for Complete and Energy Efficient Tar Reforming in Biomass Derived Syngas. Chem. Eng. Trans. 2024, 109, 103–108. [Google Scholar]
  31. Di Carlo, A.; Papa, A.A.; Nacken, M. Comparison of Novel and Commercial Catalysts for the Steam Reforming of Tar Obtained from Biomass Gasification. Chem. Eng. Trans. 2024, 109, 115–120. [Google Scholar]
  32. Hatunoglu, A.; Dell’Era, A.; Del Zotto, L.; Di Carlo, A.; Ciro, E.; Bocci, E. Deactivation Model Study of High Temperature H2S Wet-Desulfurization by Using ZnO. Energies 2021, 14, 8019. [Google Scholar] [CrossRef]
  33. Marcantonio, V.; Bocci, E.; Ouweltjes, J.P.; Del Zotto, L.; Monarca, D. Evaluation of Sorbents for High Temperature Removal of Tars, Hydrogen Sulphide, Hydrogen Chloride and Ammonia from Biomass-Derived Syngas by Using Aspen Plus. Int. J. Hydrogen Energy 2020, 45, 6651–6662. [Google Scholar] [CrossRef]
  34. Di Bisceglie, E.; Papa, A.A.; Vitale, A.; Pasqual Laverdura, U.; Di Carlo, A.; Bocci, E. Optimization of Biomass to Bio-Syntetic Natural Gas Production: Modeling and Assessment of the AIRE Project Plant Concept. Energies 2025, 18, 753. [Google Scholar] [CrossRef]
  35. Bocci, E.; Dell’Era, A.; Tregambe, C.; Tamburrano, G.; Marcantonio, V.; Santoni, F. The Development and Evaluation of a Low-Emission, Fuel-Flexible, Modular, and Interchangeable Solid Oxide Fuel Cell System Architecture for Combined Heat and Power Production: The SO-FREE Project. Energies 2025, 18, 2273. [Google Scholar] [CrossRef]
  36. Kim, J.Y.; Mastropasqua, L.; Saeedmanesh, A.; Brouwer, J. Development of Thermal Control Strategies for Solid Oxide Electrolysis Cell Systems under Dynamic Operating Conditions—Hot-Standby and Cold-Start Scenarios. Energy 2025, 317, 134679. [Google Scholar] [CrossRef]
  37. IEA. Bioenergy Lessons Learned about Thermal Biomass Gasification; IEA: Fahrni, Switzerland, 2019.
  38. Cheng, L.B.; Kim, J.Y.; Ebneyamini, A.; Li, Z.J.; Lim, C.J.; Ellis, N. Thermodynamic Modelling of Hydrogen Production in Sorbent-enhanced Biochar-direct Chemical Looping Process. Can. J. Chem. Eng. 2023, 101, 121–136. [Google Scholar] [CrossRef]
  39. Dimian, A.C.; Bildea, C.S.; Kiss, A.A. Introduction in Process Simulation. In Chemical Engineering Process Simulation, 2nd ed.; Elsevier: Amsterdam, The Netherlands, 2014; pp. 35–71. [Google Scholar]
  40. Boie, W. Fuel Technology Calculations. Energietechnik 1953, 3, 309–316. [Google Scholar]
  41. Solís, A.; Rocha, S.; König, M.; Adam, R.; Garcés, H.O.; Candia, O.; Muñoz, R.; Azócar, L. Preliminary Assessment of Hazelnut Shell Biomass as a Raw Material for Pellet Production. Fuel 2023, 333, 126517. [Google Scholar] [CrossRef]
  42. Meena, M.; Kumar, H.; Chaturvedi, N.D.; Kovalev, A.A.; Bolshev, V.; Kovalev, D.A.; Sarangi, P.K.; Chawade, A.; Rajput, M.S.; Vivekanand, V.; et al. Biomass Gasification and Applied Intelligent Retrieval in Modeling. Energies 2023, 16, 6524. [Google Scholar] [CrossRef]
  43. Hoekman, S.K.; Broch, A.; Robbins, C. Hydrothermal Carbonization (HTC) of Lignocellulosic Biomass. Energy Fuels 2011, 25, 1802–1810. [Google Scholar] [CrossRef]
  44. Rey, J.R.C.; Longo, A.; Rijo, B.; Pedrero, C.M.; Tarelho, L.A.C.; Brito, P.S.D.; Nobre, C. A Review of Cleaning Technologies for Biomass-Derived Syngas. Fuel 2024, 377, 132776. [Google Scholar] [CrossRef]
  45. Lin, H.; He, Z.; Sun, Z.; Vu, J.; Ng, A.; Mohammed, M.; Kniep, J.; Merkel, T.C.; Wu, T.; Lambrecht, R.C. CO2-Selective Membranes for Hydrogen Production and CO2 Capture—Part I: Membrane Development. J. Memb. Sci. 2014, 457, 149–161. [Google Scholar] [CrossRef]
  46. Hydrogen Mem-Tech. Product Applications: Purification. 2024. Available online: https://hydrogen-mem-tech.com/product-info/ (accessed on 1 March 2026).
  47. Hauck, M.; Herrmann, S.; Spliethoff, H. Simulation of a Reversible SOFC with Aspen Plus. Int. J. Hydrogen Energy 2017, 42, 10329–10340. [Google Scholar] [CrossRef]
  48. Giap, V.-T.; Kim, Y.S.; Lee, Y.D.; Ahn, K.Y. Waste Heat Utilization in Reversible Solid Oxide Fuel Cell Systems for Electrical Energy Storage: Fuel Recirculation Design and Feasibility Analysis. J. Energy Storage 2020, 29, 101434. [Google Scholar] [CrossRef]
  49. Schiedeck, M.; Nogueira Nakashima, R.; Frandsen, H.L. Heat Integration and Part-Load Performance of an SOEC-Coupled Haber–Bosch Process. Int. J. Hydrogen Energy 2025, 116, 242–256. [Google Scholar] [CrossRef]
  50. van ‘t Noordende, H.; van Berkel, F.; Stodolny, M. Next Level Solid Oxide Electrolysis. Upscaling Potential and Techno-Economical Evaluation for 3 Industrial Use Cases; Institute for Sustainable Process Technology: Amersfoort, The Netherlands, 2023. [Google Scholar]
  51. Yang, Y.; Tong, X.; Hauch, A.; Sun, X.; Yang, Z.; Peng, S.; Chen, M. Study of Solid Oxide Electrolysis Cells Operated in Potentiostatic Mode: Effect of Operating Temperature on Durability. Chem. Eng. J. 2021, 417, 129260. [Google Scholar] [CrossRef]
  52. Wang, L.; Chen, M.; Küngas, R.; Lin, T.-E.; Diethelm, S.; Maréchal, F.; Van Herle, J. Power-to-Fuels via Solid-Oxide Electrolyzer: Operating Window and Techno-Economics. Renew. Sustain. Energy Rev. 2019, 110, 174–187. [Google Scholar] [CrossRef]
  53. Rinaldi, G.; Diethelm, S.; Oveisi, E.; Burdet, P.; Van Herle, J.; Montinaro, D.; Fu, Q.; Brisse, A. Post-test Analysis on a Solid Oxide Cell Stack Operated for 10,700 Hours in Steam Electrolysis Mode. Fuel Cells 2017, 17, 541–549. [Google Scholar] [CrossRef]
  54. Jolaoso, L.A.; Bello, I.T.; Ojelade, O.A.; Yousuf, A.; Duan, C.; Kazempoor, P. Operational and Scaling-up Barriers of SOEC and Mitigation Strategies to Boost H2 Production- a Comprehensive Review. Int. J. Hydrogen Energy 2023, 48, 33017–33041. [Google Scholar] [CrossRef]
  55. European Commission. Solid Oxide Fuel Cell Combined Heat and Power: Future-Ready Energy; European Commission: Rome, Italy, 2021. [Google Scholar]
  56. Yang, C.; Guo, R.; Jing, X.; Li, P.; Yuan, J.; Wu, Y. Degradation Mechanism and Modeling Study on Reversible Solid Oxide Cell in Dual-Mode—A Review. Int. J. Hydrogen Energy 2022, 47, 37895–37928. [Google Scholar] [CrossRef]
  57. Fraunhofer IKTS. SOFC Stack Development. Available online: https://www.ikts.fraunhofer.de/en/departments/energy_systems/materials_and_components/ceramic_energy_converters/sofc_stack_development.html (accessed on 1 March 2026).
  58. Graves, C.; Ebbesen, S.D.; Jensen, S.H.; Simonsen, S.B.; Mogensen, M.B. Eliminating Degradation in Solid Oxide Electrochemical Cells by Reversible Operation. Nat. Mater. 2015, 14, 239–244. [Google Scholar] [CrossRef] [PubMed]
  59. Baldinelli, A.; Staffolani, A.; Nobili, F.; Barelli, L. Detailed Experimental Analysis of Solid Oxide Cells Degradation Due to Frequent Fuel Cell/Electrolyser Switch. J. Energy Storage 2023, 73, 109117. [Google Scholar] [CrossRef]
  60. Lang, M.; Lee, Y.S.; Lee, I.S.; Szabo, P.; Hong, J.; Cho, J.; Costa, R. Analysis of Electrochemical Degradation Phenomena of SOC Stacks Operated in Reversible SOFC/SOEC Cycling Mode. J. Electrochem. Soc. 2023, 170, 114516. [Google Scholar] [CrossRef]
  61. Wan, H.; Feng, F.; Yan, B.; Liu, J.; Chen, G.; Yao, J. Methanation of Syngas from Biomass Gasification in a Dual Fluidized Bed: An Aspen plus Modeling. Energy Convers. Manag. 2024, 318, 118902. [Google Scholar] [CrossRef]
  62. Ciccone, B.; Murena, F.; Ruoppolo, G.; Urciuolo, M.; Brachi, P. Methanation of Syngas from Biomass Gasification: Small-Scale Plant Design in Aspen Plus. Appl. Therm. Eng. 2024, 246, 122901. [Google Scholar] [CrossRef]
  63. Bang-Møller, C.; Rokni, M. Thermodynamic Performance Study of Biomass Gasification, Solid Oxide Fuel Cell and Micro Gas Turbine Hybrid Systems. Energy Convers. Manag. 2010, 51, 2330–2339. [Google Scholar] [CrossRef]
  64. Kalina, J. Options for Using Solid Oxide Fuel Cell Technology in Complex Integrated Biomass Gasification Cogeneration Plants. Biomass Bioenergy 2019, 122, 400–413. [Google Scholar] [CrossRef]
Figure 1. Flowsheet of the integrated plant.
Energies 19 01887 g001
Figure 2. Flowsheet of the Aspen Plus Line 2 methanation system model.
Energies 19 01887 g002
Figure 3. Flowsheet of the SOEC system model.
Energies 19 01887 g003
Figure 4. Flowsheet of the adapted SOFC system model.
Energies 19 01887 g004
Figure 5. Overall flowsheet of the integrated model of the plant in operating mode 2.
Energies 19 01887 g005
Figure 6. Overall flowsheet of the integrated model of the plant in operating mode 3.
Energies 19 01887 g006
Figure 7. Sankey diagram of the overall mass balance of the plant in operating mode 2.
Energies 19 01887 g007
Figure 8. Sankey diagram of the overall energy balance of the initial configuration of the plant in operating mode 2.
Energies 19 01887 g008
Figure 9. Sankey diagram of the overall mass balance of the plant in operating mode 3.
Energies 19 01887 g009
Figure 10. Sankey diagram of the overall energy balance of the initial configuration of the plant in operating mode 3.
Energies 19 01887 g010
Figure 11. Heat exchanger network for the optimised plant in operating mode 2.
Energies 19 01887 g011
Figure 12. Heat exchanger network for the optimised plant in operating mode 3.
Energies 19 01887 g012
Table 1. Results of the characterisation analysis of the selected biomass.
Proximate Analysis (wt.%db)Ultimate Analysis (wt.%db)
FC23.3C50.96
VM75.5H5.72
Ash1.20N0.42
Moisture content (wt.%)7.9Cl0.02
S0.03
HHV (MJ/kg)19.54O41.65
Table 2. Detail of the production and process heat requirement of the initial configuration of plant operating mode 2.
SystemProcess LineTemperature Range (°C)Heat Duty (kW)
FromTo
GasificationSteam254509.38
Air504506.35
Syngas61550−10.85
Flue gas95095−15.08
Line 2Steam2540027.34
Input methanator1543007.28
Inter-refrigerator654295−18.00
Bio-SNG cooling50740−51.79
SOECSteam6275028.81
Cathode off-gas cooling78725−12.18
H2 cooling41225−3.68
Table 3. Detail of the production and process heat requirement of the initial configuration of plant operating mode 3.
SystemProcess LineTemperature Range (°C)Heat Duty (kW)
FromTo
GasificationSteam254509.38
Air504506.35
Syngas61550−10.85
Flue gas95095−15.08
SOFCExhaust gases26525−59.50
Table 4. Key performance indicators of the enhanced and conventional bio-SNG production process.
IndicatorConventionalEnhanced
InitialOptimised
C G E G a s i f i c a t i o n 85.3%85.3%94.5%
Y i e l d s y n g a s   N m 3 d r y   s y n g a s k g b i o m a s s 1.431.431.43
C H 4 B i o S N G , L n   2   m o l . % d r y N 2 f r e e 84.9%93.5%93.3%
C G E B i o S N G , L n   2 O 71.8%74.5%78.1%
Y i e l d B i o S N G , L n   2 O   N m 3 d r y   B i o S N G k g b i o m a s s 0.410.720.72
η h e a t O 14.4%22.3%1.4% a/15.3% b
η f u e l O 68.8%56.9%75.4%
η t o t a l O 83.2%79.2%76.8% a/90.7% b
a Efficiencies that consider only the low-pressure steam produced at 125 °C. b Efficiencies that also consider the air produced at 35 °C.
Table 5. Key performance indicators of the initial and optimised operation mode 3.
IndicatorInitialOptimised
C G E G a s i f i c a t i o n 85.3%94.5%
Y i e l d s y n g a s   N m 3 d r y   s y n g a s k g b i o m a s s 1.431.43
η h e a t O 56.9%0.7% a/34.6% b
η e l e c t O 36.4%40.4%
η t o t a l O 93.4%41.1% a/75.0% b
a Efficiencies that consider only the low-pressure steam produced at 250 °C. b Efficiencies that also consider the air produced at 35 °C.
Table 6. Comparison of the performance of the current bio-SNG production system with the literature.
IndicatorCurrent System[61][62]
m ˙ b i o m a s s   k g / h 20100-
M o i s t u r e 7.9%5.01%-
L H V b i o m a s s     M J / k g  a18.3018.52-
T e l e c t r o l y s i s   ° C 75080-
P e l e c t r o l y s i s   b a r 120-
η H 2 , e l e c t r o l y s i s 96.4%70.0%-
T M e t h   ° C 290300350
P M e t h   b a r 10305
H 2 C O + C O 2 f e e d   g a s 3.53.33.5
C G E M e t h 83.4%81.7%-
X C M e t h 96.7%98.2%94.4%
X H 2 M e t h 98.6–57.8% b98.9%-
Y i e l d B i o S N G   N m 3 d r y   S N G N m 3 d r y   s y n 0.500.50-
C H 4 B i o S N G   v o l . % d r y ,   N 2 f r e e 93.3%95.4%95.9%
C c o n v O 76.8%89.2%-
H c o n v O 84.0%49.3%-
η h e a t O , L H V 1.4%16.1%-
η f u e l O , L H V 70.1%46.5%-
η t o t a l O , L H V 71.5%62.6%-
a Calculated by L H V = H H V Q × H / 2 × 18 , where Q is 2400 kJ/kg and H is the mass fraction of hydrogen. b Section comprising only the methanation reactors.
Table 7. Comparison of the performance of the current electricity production system with the literature.
IndicatorCurrent System[63][64]
m ˙ b i o m a s s   k g / h 20154.8484.8
M o i s t u r e 7.9%32.2%10.0%
L H V b i o m a s s     M J / k g  a18.3018.2818.49
T S O F C   ° C 750800920
P S O F C   b a r 111
η e l e c t , S O F C 50.6%-36.0%
U F 0.750.850.65
η h e a t O , L H V 0.7% c/36.9% d43.4%/29.4% b38.79%
η e l e c t O , L H V 43.1%36.4%/50.3% b37.22%
U F O 0.860.800.76
η t o t a l O , L H V 43.8% c/80.0% d79.7%76.01%
a Calculated by L H V = H H V Q × H / 2 × 18 , where Q is 2400 kJ/kg and H is the mass fraction of hydrogen. b Gasifier-SOFC-MGT system configuration. c Efficiencies that consider only the low-pressure steam produced at 250 °C. d Efficiencies that also consider the air produced at 35 °C.
Disclaimer/Publisher’s Note: The statements, opinions and data contained in all publications are solely those of the individual author(s) and contributor(s) and not of MDPI and/or the editor(s). MDPI and/or the editor(s) disclaim responsibility for any injury to people or property resulting from any ideas, methods, instructions or products referred to in the content.