Article

Transient Temperature Rise and Grounding Characteristics of Vertical DC Grounding Electrodes Considering Soil Electro-Thermal Coupling


College of Electrical Engineering and New Energy, China Three Gorges University, Yichang 443002, China
*
Author to whom correspondence should be addressed.
Energies 2026, 19(8), 1863; https://doi.org/10.3390/en19081863
Submission received: 12 March 2026 / Revised: 2 April 2026 / Accepted: 7 April 2026 / Published: 10 April 2026
(This article belongs to the Section F: Electrical Engineering)

Abstract

The continuous current dissipation of direct current grounding electrodes generates intense Joule heat, causing severe soil moisture loss and localized thermal runaway. Traditional static models ignore the temperature-dependent nature of soil parameters, leading to dangerous underestimations of actual temperature rises and thermal risks. To address this critical issue, this study establishes a bidirectional dynamic electro-thermal coupled model for a vertical grounding electrode using COMSOL Multiphysics. Comparative analysis demonstrates that the dynamic model accurately reproduces the late-stage accelerated temperature rise observed in experiments, proving its necessity over static methods. Simulations reveal that increased soil resistivity governs heat generation and directly causes a dramatic surge in both grounding resistance and maximum step voltage. In two-layer heterogeneous soils, current is forced into lower-resistivity regions, triggering extreme localized overheating. To mitigate this, expanding the cross-sectional radius of the coke bed effectively suppresses the thermal concentration. These findings provide quantitative evidence and non-uniform design guidelines for the safe operation and thermal protection of grounding electrodes under complex geological conditions.

1. Introduction

High-voltage direct current (HVDC) systems have been widely utilized owing to their significant advantages in long-distance and large-capacity power transmission. Compared to horizontal counterparts, vertical grounding electrodes are more extensively applied due to their smaller footprint and greater flexibility in site selection [1,2]. Under the monopolar ground return operating mode, DC grounding electrodes are subjected to the long-term dissipation of large currents into the surrounding earth [3,4,5,6]. During this process, substantial electrical energy is converted into Joule heat, gradually increasing the temperature of the electrode body and the surrounding soil. This subsequently induces soil moisture loss, triggering non-linear dynamic changes in soil resistivity and thermal parameters [7,8,9]. These variations in physical properties, in turn, affect the electric field distribution and heat generation rate, formulating a complex bidirectional electro-thermal coupling process. If the temperature rise exceeds a certain limit, it can cause localized soil drying, which consequently leads to a sharp increase in grounding resistance and step voltage, severely threatening the safe operation of the system. Therefore, an in-depth investigation into the temperature rise and grounding characteristics of the electrode based on the electro-thermal coupling theory is of significant practical engineering importance.
Extensive explorations have been conducted by scholars domestically and internationally regarding the temperature rise and related electrical characteristics of DC grounding electrodes. Teng et al. [10] analyzed the relationship between structural parameters and the electrical performance of DC deep-well grounding electrodes, providing a fundamental reference for grounding system design under deep geological conditions. Wen et al. [11] deeply investigated the non-linear influence of water-saturated soil resistivity on the temperature rise characteristics of HVDC grounding electrodes and its temperature dependence. Theodosoglou et al. [12] and Nahman et al. [13] utilized the finite element method (FEM) to iteratively predict the electro-thermal coupled heat dissipation and temperature fluctuations of overhead transmission lines and high-voltage underground cables, verifying the reliability of this method in handling non-linear heating problems. Georges and Slaoui [14] preliminarily explored the heat dissipation phenomenon and temperature distribution laws caused by the current dissipation of DC grounding electrodes. In recent years, as the geological conditions faced by DC projects become increasingly complex, the research focus has gradually shifted towards multiphysics coupling and dynamic evolution. For instance, Asensio et al. [15] constructed a one-dimensional transient model focusing on the Joule heating effect within the grounding electrode system under large fault currents, pointing out that the coupled feedback mechanism between temperature and resistivity significantly alters current distribution and temperature gradients. Chen and Li [16], based on COMSOL multiphysics simulation, studied the thermal field and electrochemical corrosion interference laws of DC grounding electrode current dissipation on surrounding complex buried pipeline networks under the monopolar operation mode. Although the thermal behavior of grounding electrodes has been widely explored in previous studies, such research typically focuses on short-duration currents [17,18] or assumes static soil thermal properties [19,20]. In contrast to these earlier works, this paper models the dynamic electro-thermal positive feedback loop induced by long-term, continuous DC injection. Unlike static models, our dynamic approach uncovers a key mechanism: continuous heating causes localized soil moisture to vaporize, leading to an increase in local electrical resistivity that further accelerates localized overheating. Additionally, by comparing our dynamic findings against traditional, unoptimized designs, this study clearly demonstrates how structural optimization—particularly the integration of a coke bed—physically alleviates this severe heat accumulation by buffering the current density.
To address the shortcomings of current research, this paper aims to break through the limitations of traditional static constant-parameter models. Based on the electro-thermal coupling theory, a fully coupled transient electro-thermal model of a vertical DC grounding electrode is constructed using the COMSOL Multiphysics finite element simulation software. The main contributions of this paper encompass two aspects: First, the transient temperature rise laws of the vertical grounding electrode in a uniform soil environment are systematically analyzed to ascertain the influence mechanisms of parameter variations—such as soil resistivity, thermal conductivity, specific heat capacity, and the cross-sectional radius of the coke bed—on the maximum temperature rise, grounding resistance, and maximum step voltage of the electrode. Second, targeting the multi-layer geology common in actual engineering, the squeezing effect of the distribution and stratification position of high- and low-resistivity soil layers on the current dissipation path in two-layer non-uniform soil is deeply analyzed, revealing the resulting step-like local extreme overheating phenomenon and the overall evolution laws of grounding performance.
Through fully coupled dynamic simulation, this study demonstrates that the non-linear variation of soil resistivity is the most critical factor governing system heat generation and the deterioration of grounding characteristics. Furthermore, it reveals the physical mechanism by which a high-resistivity soil layer forces large currents to concentrate and dissipate toward low-resistivity regions under two-layer geological conditions. The conclusions of this research not only improve the existing numerical calculation framework for grounding electrodes and verify the effectiveness of thermal mitigation measures—such as enlarging the coke bed—but also provide a reliable theoretical basis for site surveying, size optimization, and the engineering thermal protection of DC grounding electrodes under complex geological conditions [21,22]. Consequently, this offers vital support for enhancing the operational reliability of modern HVDC transmission systems.

2. Materials and Methods

2.1. Temperature Characteristics of Soil Electro-Thermal Parameters

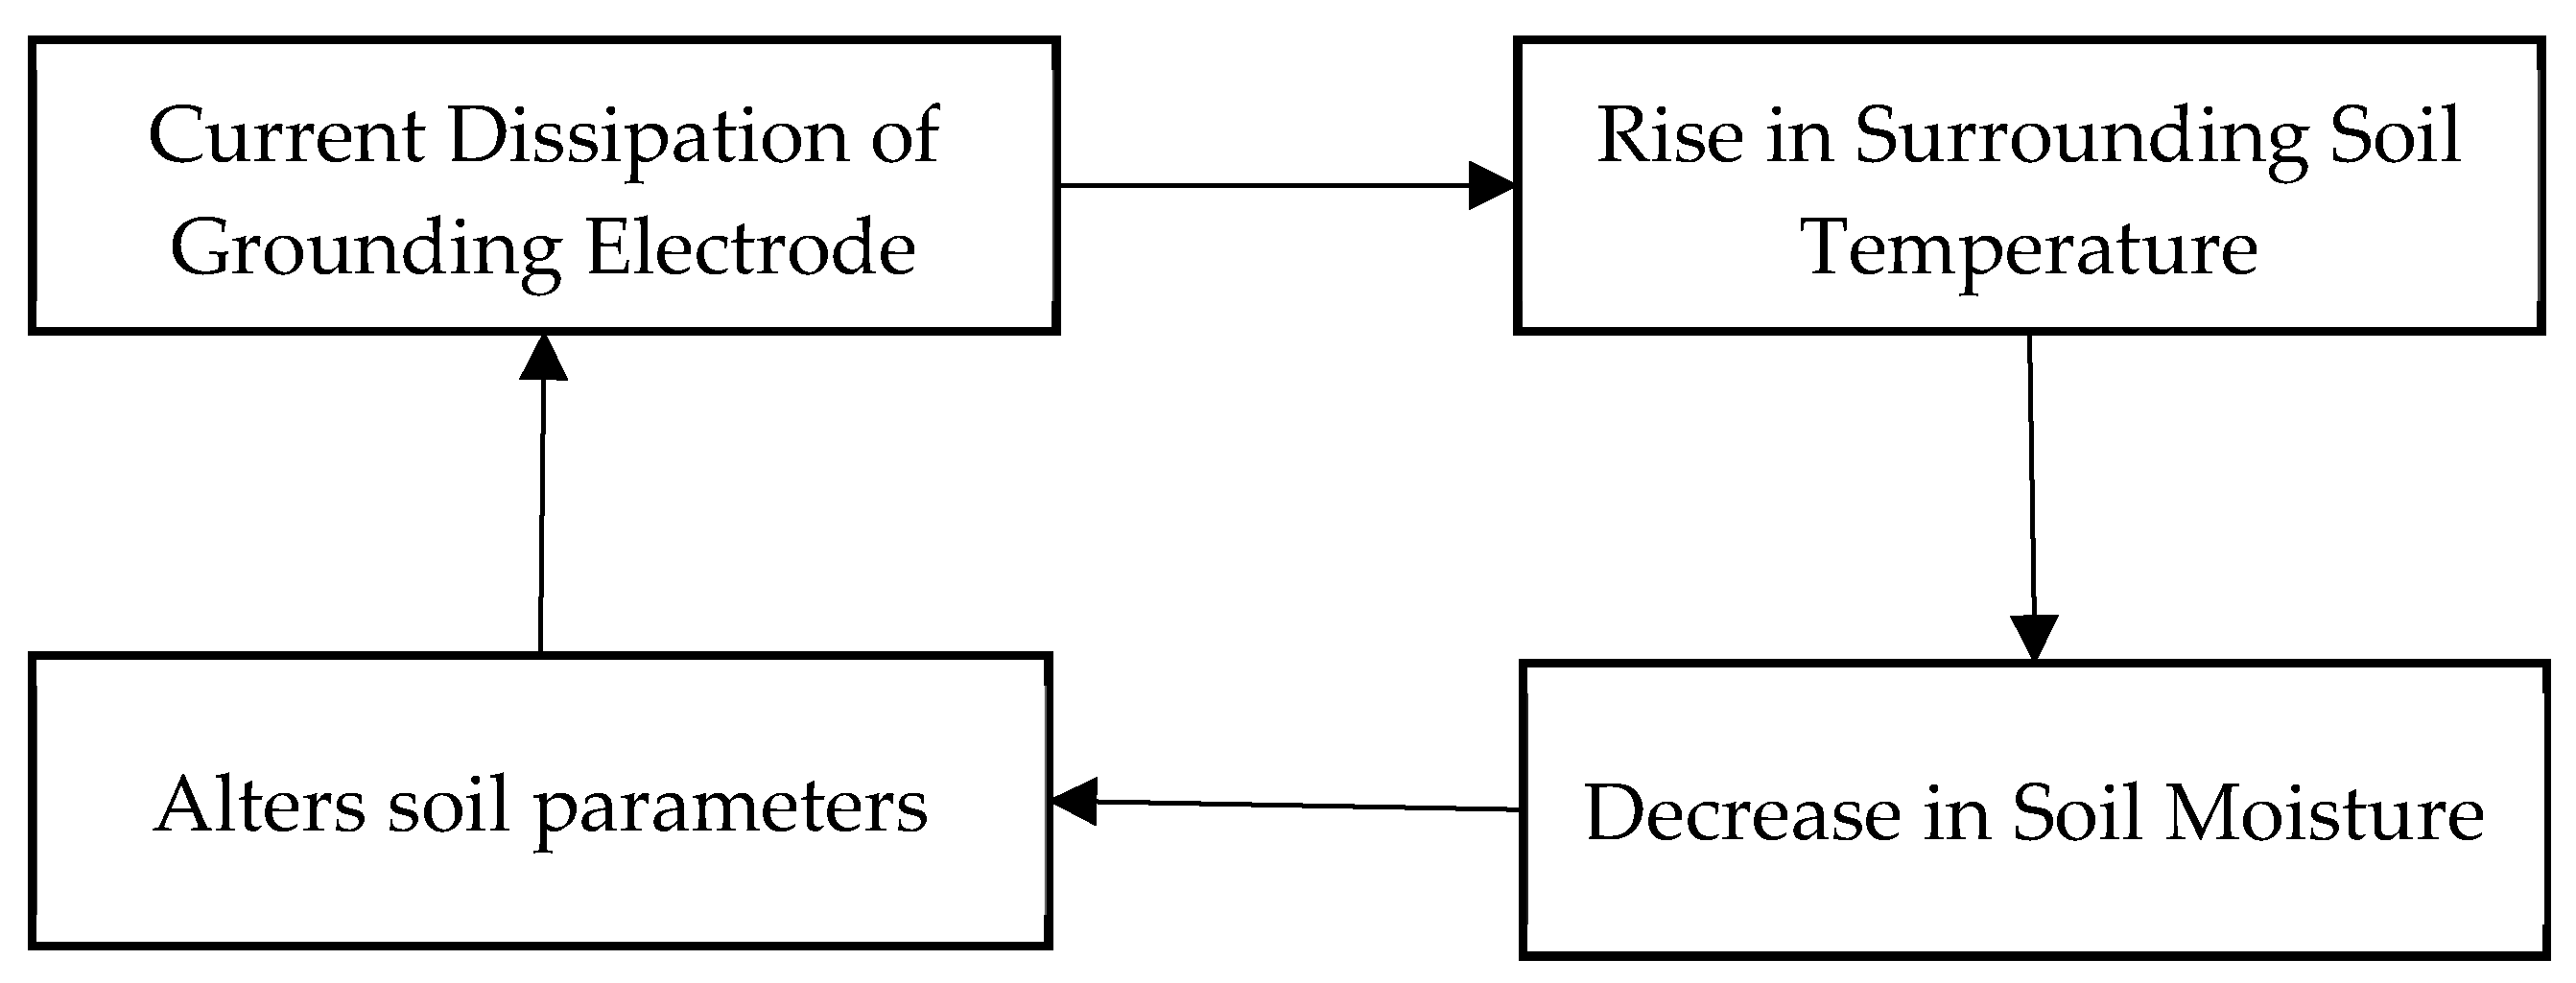
The electrical conductivity of soil is highly dependent on its internal moisture content [23]. The Joule heat generated by the continuous current dissipation of the DC grounding electrode causes a temperature rise and moisture evaporation in the surrounding soil, which subsequently induces non-linear changes in parameters such as soil resistivity. These parameter variations react upon the underground current field, leading to a redistribution of the current dissipation density and the current field. Therefore, the actual temperature rise is a bidirectionally coupled dynamic process characterized by the interaction between the current field and the temperature field. Its physical mechanism is illustrated in Figure 1.

2.2. Electro-Thermal Coupled Finite Element Model of the Vertical DC Grounding Electrode

Constrained by the stationary electric field theory, the Joule heating effect, and the fundamental principles of heat transfer, the temperature rise process of the DC grounding electrode is essentially governed by the mutual coupling interaction between the current field and the temperature field. In this study, the finite element numerical simulation method is employed to independently calculate the current field and the temperature field and, subsequently, couple them.

2.2.1. Current Field Finite Element Model of the Vertical DC Grounding Electrode

The current distribution within the conductor and the soil in the DC grounding electrode system is described by the following fundamental equations of the electromagnetic field:
2 φ x 2 + 2 φ y 2 + 2 φ z 2 = 0 φ | Γ = 0 φ n | Γ s = 0 φ 1 | Γ 12 = φ 2 | Γ 12 γ 1 φ n | Γ 12 = γ 2 φ n | Γ 12
where x , y , and z denote the three directions of the Cartesian coordinate system; φ is the electric potential at an arbitrary point, V; φ 1 and φ 2 are the electric potentials of the conductor and soil media at the interface, respectively, V; γ 1 and γ 2 are the electrical conductivities of the adjacent conductor and soil media, respectively, S/m; Γ represents the boundary at infinity; Γ s represents the ground surface boundary; and Γ 12 is the interface between the conductor and soil media.
The relationship between the electric field intensity E and the electric potential is given by:
E = φ
The relationship between current density J and electric field intensity E is satisfied as follows:
J = γ E
where J is the current density, A/m2; and γ is the electrical conductivity, S/m.

2.2.2. Temperature Field Finite Element Model of the Vertical DC Grounding Electrode

The grounding resistance, composed of the soil resistance surrounding the grounding electrode, converts electrical energy into thermal energy. Consequently, the soil temperature in the vicinity of the grounding electrode increases, and its thermal energy can be expressed as follows:
Q = ρ J 2
where Q is the heat source density, W/m3; and ρ is the soil resistivity, Ω·m. Considering the dynamic process of the full coupling between the electric field and the temperature field, heat conduction should also be a transient process. According to the principles of heat transfer, the transient heat conduction equation for soil is given by:
x k x T x + y k y T y + z k z T z + Q C v T t = 0
where k x , k y , and k z are the thermal conductivities of the soil in the x , y , and z directions, respectively, W/(m·°C). In this study, the soil is assumed to be isotropic; therefore, k x = k y = k z . T is the temperature at each point in the soil, °C; and C v is the volumetric heat capacity of the soil, J/(m3·°C).
To ensure a unique solution for Equation (5), specific boundary and initial conditions must be defined. A portion of the heat generated during the operation of the grounding electrode raises the temperature of the nearby soil, another portion is dissipated through convection between the ground surface and the air, and the remainder is conducted through the soil toward infinity. In practice, the heat is primarily concentrated near the grounding electrode, and the temperature rise in soil far from the electrode is negligible. If the model dimensions are sufficiently large, the model boundaries can be treated as being at infinity, where the temperature rise is zero. Consequently, these boundaries satisfy the Dirichlet boundary condition (the first kind of boundary condition) in heat transfer.
T = T 0
where T 0 is the ambient temperature of the soil at infinity, °C.
Convective heat dissipation occurs between the ground surface and the air; therefore, the soil surface satisfies the third kind of boundary condition (the Robin boundary condition).
k T n = h 0 ( T 0 T )
where k is the thermal conductivity of the soil, W/(m·°C); n represents the respective directions (typically the normal direction); and h 0 is the convective heat transfer coefficient of the ground surface, W/(m2·°C).
To solve the transient temperature field, in addition to satisfying specific boundary conditions, initial conditions must also be defined. To simplify the calculation, the initial temperature at all points is approximately assumed to be 20 °C.

2.2.3. Fully Coupled Electro-Thermal Finite Element Model of the Vertical DC Grounding Electrode

During the operation of a DC grounding electrode, the temperature rise in the soil induces significant variations in its resistivity, thermal conductivity, and specific heat capacity, which, in turn, react upon the current field. To address the limitation that traditional static models with constant parameters fail to capture this dynamic interactive process, this paper establishes a bidirectionally coupled electro-thermal finite element model. By fully accounting for the dynamic temperature-dependent variations of these physical properties, the proposed model achieves an accurate simulation of the temperature rise characteristics of the grounding electrode under actual operating conditions.
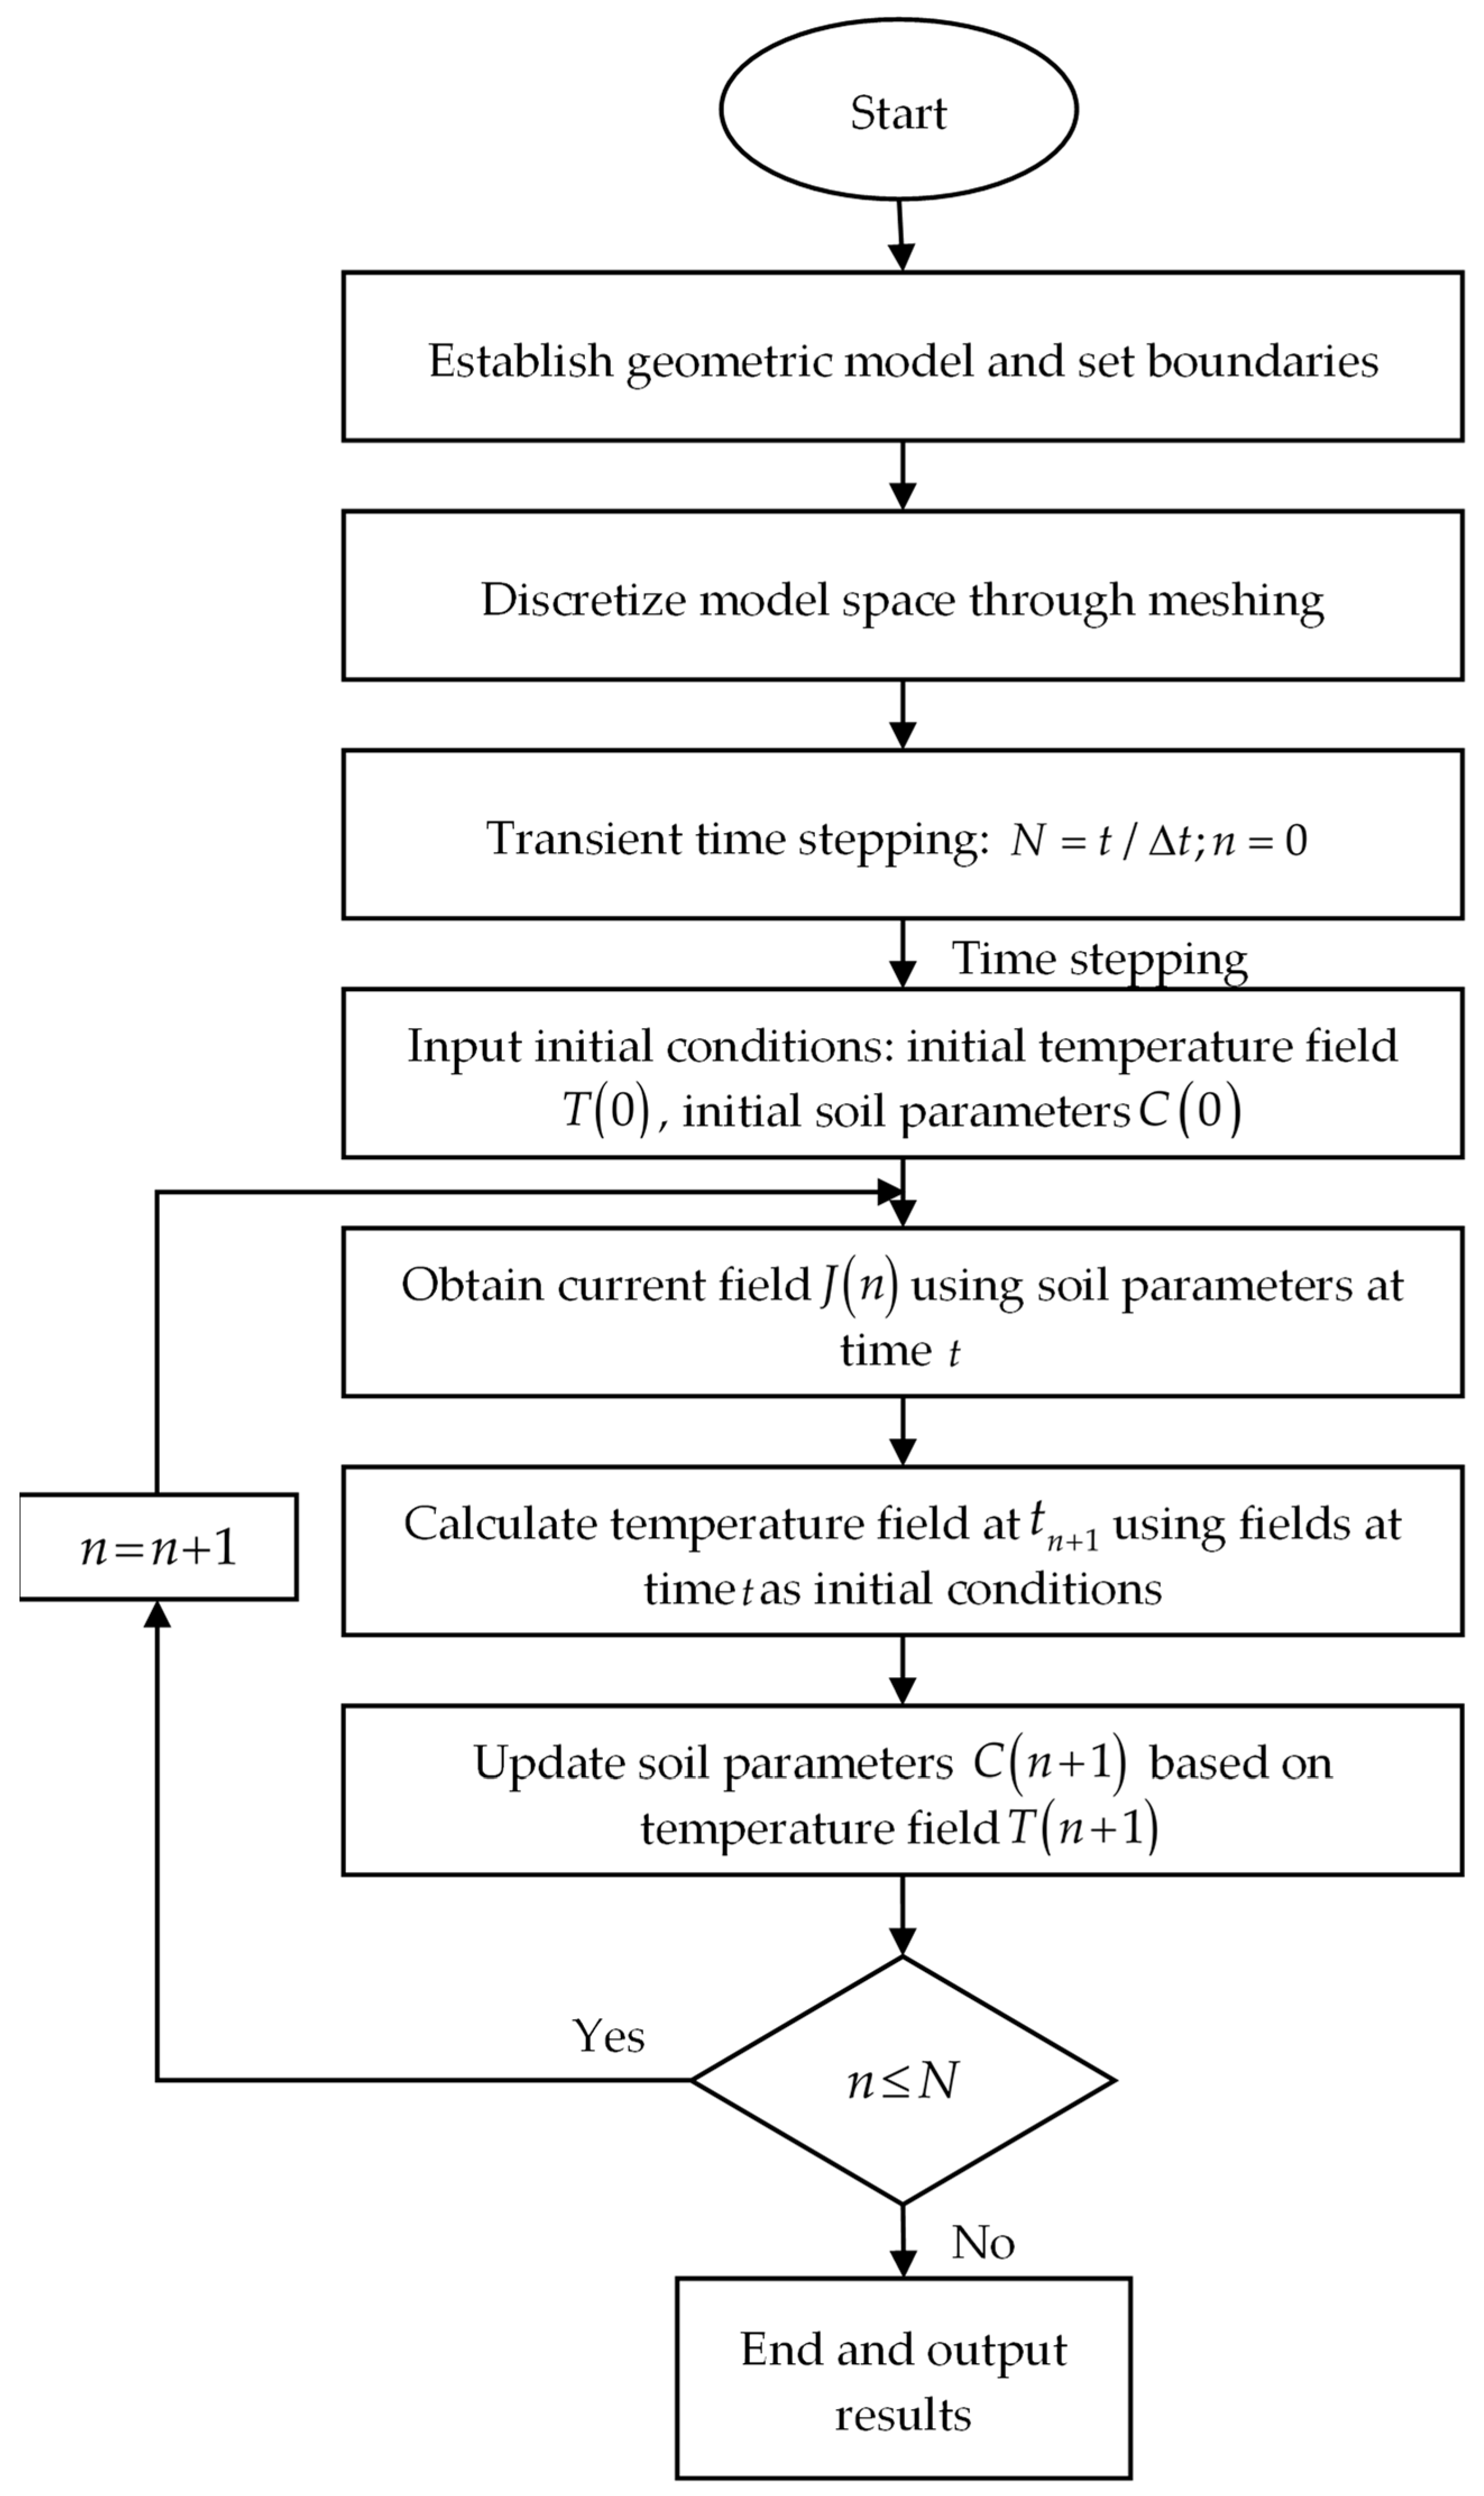
To address the strongly coupled non-linear problem between the current field and the temperature field, since the governing equations contain partial derivative terms with respect to time, the time-stepping method is typically required during finite element solving. This implies that the solution of the temperature field at the next moment is highly dependent on the calculation results of the current field at the previous moment. When constructing the model, the geometric model is first spatially discretized through meshing; subsequently, the time domain of the transient process is processed step-by-step. Let t be the total calculation time, which is divided into n total iteration steps, with a time interval of Δ t . t / Δ t is the total iteration steps N , i.e., n = 0 , 1 , 2 , , N . In the specific iterative solving mechanism, the calculation starting point depends on the initial conditions of the system: the solver first calls the initial temperature field T ( 0 ) and its corresponding initial soil parameters C ( 0 ) (e.g., resistivity) to calculate the current field distribution J ( 0 ) at the beginning of the transient state. Subsequently, the heat generated by this current field is substituted into the heat transfer equation as a heat source to derive and calculate the new temperature field after one Δ t . Considering the electro-thermal non-linear characteristics of the soil, the system updates the soil resistivity parameters at the mesh nodes in real time according to this new temperature and re-solves the current field for the next moment based on the modified physical parameters. The coupling cycle of “electric field heat generation—temperature field update—soil parameter modification—current field recalculation” continuously advances until all iterations are completed and the total number of iteration steps is reached. Ultimately, the variation laws of the current field and temperature field throughout the entire transient process can be comprehensively extracted. The flowchart of the coupling process between the current field and the temperature field is shown in Figure 2.
To ensure numerical stability and accuracy during the highly non-linear electro-thermal coupling process, the fully coupled solver was configured using a damped Newton-Raphson algorithm. The relative tolerance for the convergence criterion was set to 0.001. Under these computational settings, a stable converged solution was typically achieved within three-to-six non-linear iterations per time step, depending on the severity of the localized parameter variations.

2.3. Safety Criteria for DC Step Voltage

In evaluating the operational safety of HVDC vertical grounding electrodes, the surface step voltage is a crucial engineering metric. Unlike short-circuit faults in alternating current systems, which typically last for milliseconds, DC grounding electrodes must conduct current continuously for long periods during the monopolar earth-return operation. Therefore, human safety assessments cannot rely on traditional AC substation standards but must adopt safety thresholds based on continuous steady-state DC injection.
According to the step voltage standard in Ref. [22], the tolerable limit for human exposure to continuous DC current is generally set at 5 mA. Taking into account the human body resistance and the contact resistance between the feet and the ground surface, the empirical formula for calculating the tolerable continuous step voltage threshold E s t e p is defined as:
E s t e p = 5 + 0.03 ρ s
where ρ s represents the resistivity of the surface medium, Ω·m.
This equation demonstrates that the safety limit for step voltage is highly dependent on the conductive properties of the surface material. In the subsequent simulation analysis of this study, the maximum surface step voltage extracted around the electrode will be strictly compared against this theoretical threshold. The designed electrode configuration is considered to meet human safety requirements for long-term operation only if the actual generated maximum step voltage remains below E s t e p .

2.4. Establishment of the Temperature Rise Simulation Model for the Vertical Grounding Electrode

2.4.1. Modeling Workflow

In this study, the COMSOL Multiphysics 6.2 finite element simulation software is employed to establish a fully coupled current and temperature field model of the vertical grounding electrode. The modeling process comprises the following steps:
(1)
Geometry Building
The geometric model of the vertical grounding electrode is constructed directly within the COMSOL software. Alternatively, geometric modeling can be performed using AutoCAD 2023 software and subsequently imported into the simulation environment.
(2)
Parameter Setting
The material properties for the electrode, coke, and soil are defined. Temperature-dependent material properties can be dynamically assigned using predefined functions or mathematical formulas.
(3)
Meshing
The model can be discretized into various element types, such as triangles, tetrahedra, or hexahedra. To save computational time and memory space, a fine mesh is applied to the core research object (the electrode and surrounding area), while a coarse mesh is utilized for less critical regions.
(4)
Numerical Solving and Result Extraction
A transient solver is selected to compute the time-dependent results, accompanied by appropriate time-stepping settings. Upon completion of the calculation, the time-varying temperature curves and corresponding data are obtained and subsequently exported for further analysis.

2.4.2. Establishment of the Simulation Model

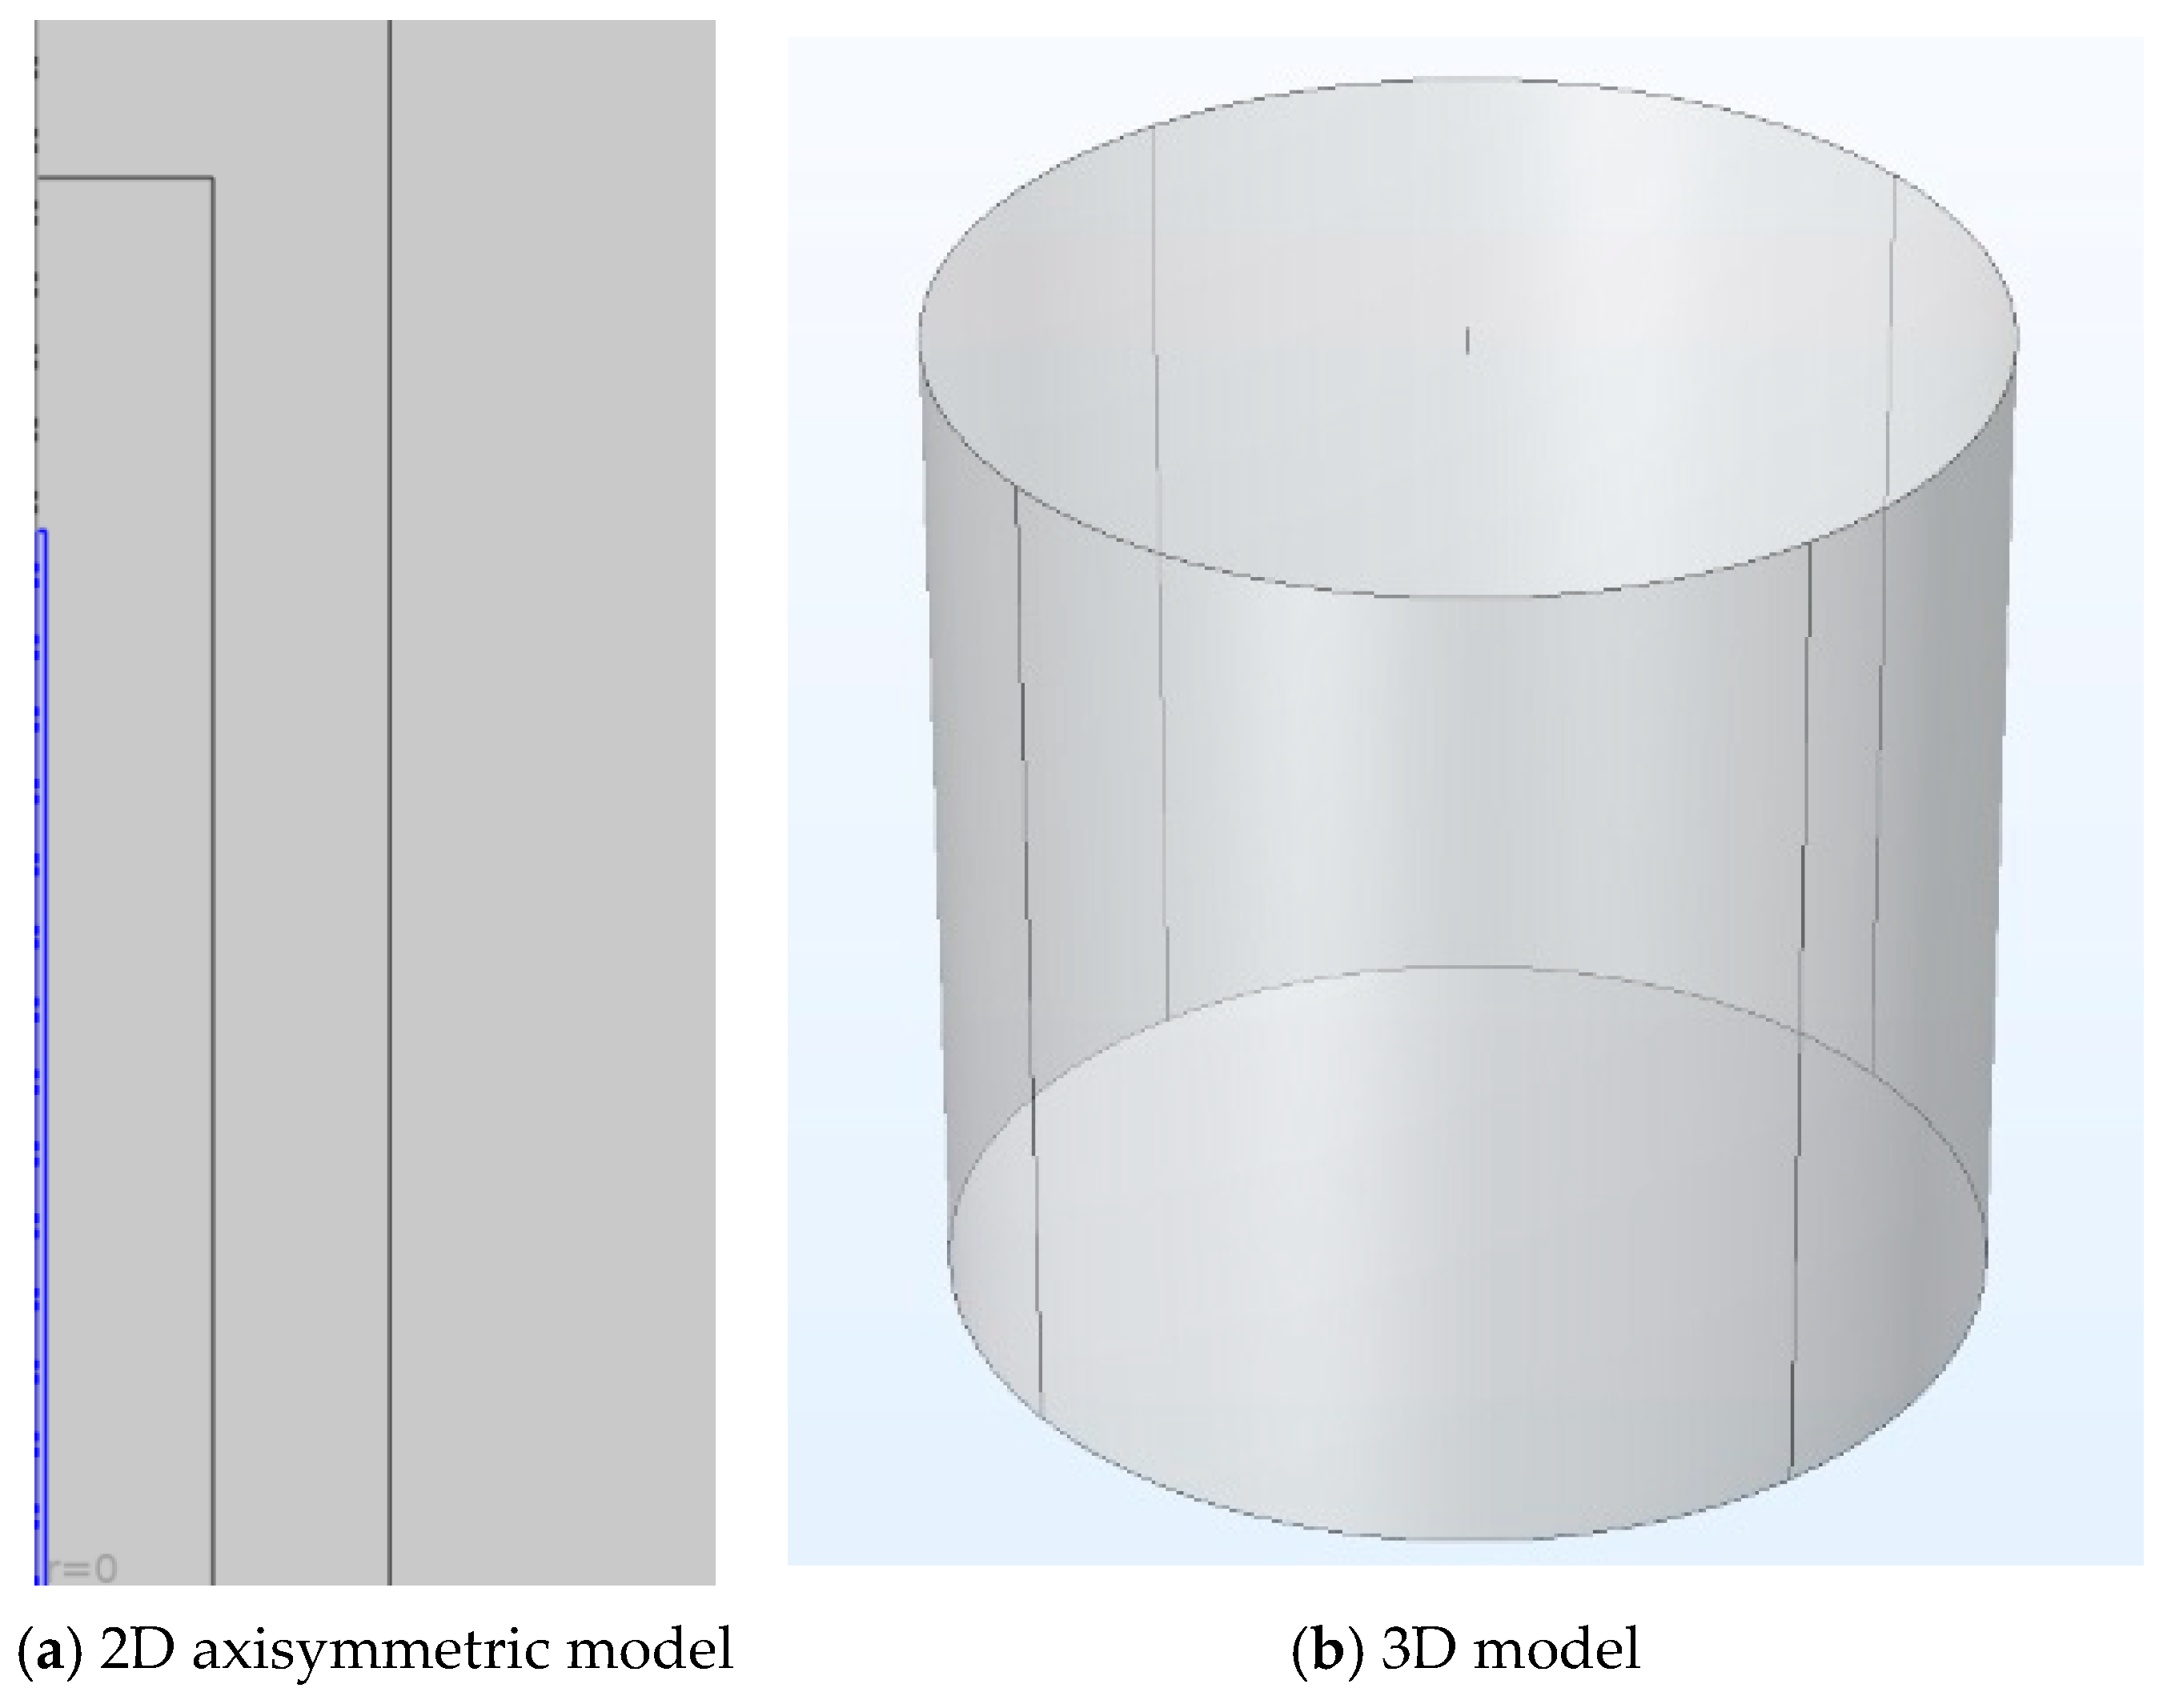
The establishment of the model is illustrated in Figure 3. Assuming the grounding electrode is free from external system interference, the electric potential at infinity is zero. To simplify the model while maintaining computational accuracy, a 2D axisymmetric grounding model is established, as shown in Figure 3a, where the blue section represents the vertical grounding electrode. Revolving this 2D geometry 360° around the r-axis generates the complete 3D grounding electrode model, as depicted in Figure 3b. By employing the truncation method, a sufficiently large truncation boundary is adopted, with the model dimensions set to 5000 m × 5000 m, ensuring that the electric potential and temperature rise at the farthest boundaries are both zero. The horizontally layered soil structures investigated in this study maintain strictly uniform material properties in all radial directions. Therefore, with the vertical grounding electrode acting as the central axis, the spatial current distribution and thermal field maintain perfect rotational symmetry. For these specific horizontally layered scenarios, the 2D axisymmetric geometry is physically exact and introduces no geometric errors regarding azimuthal current dissipation.
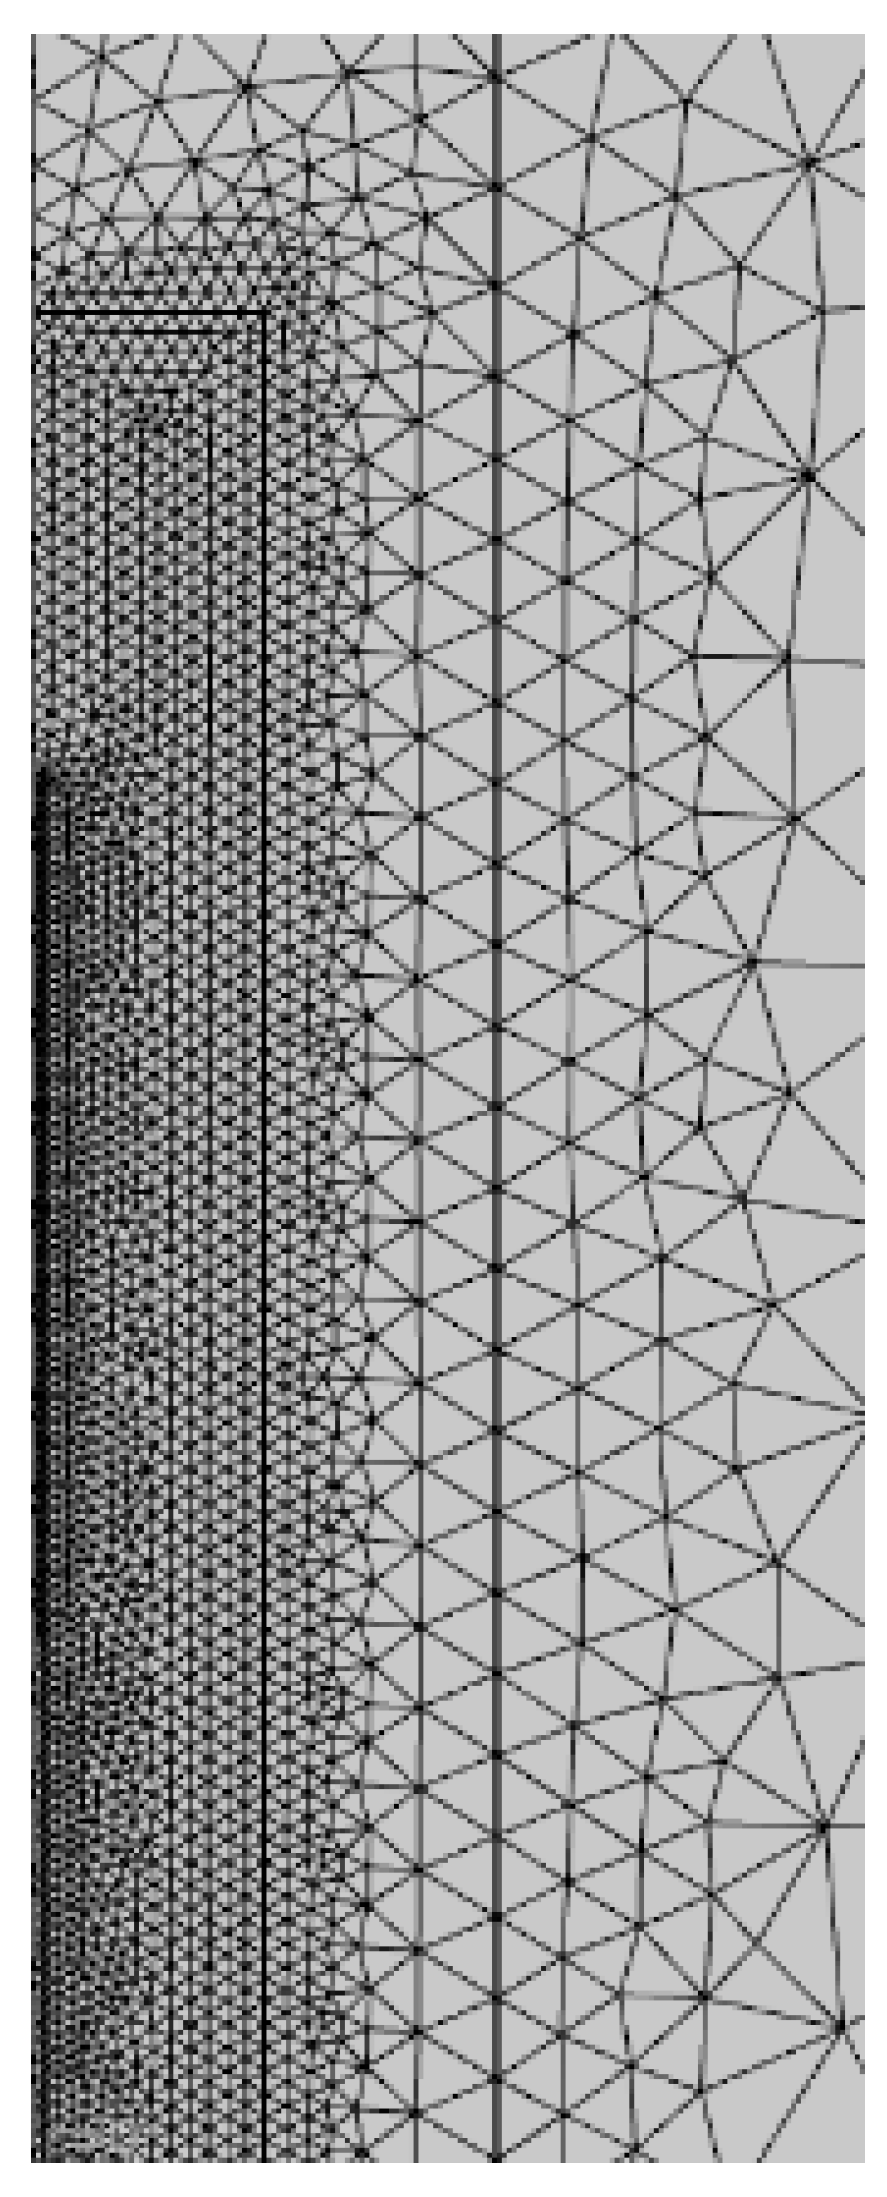
Triangular elements are utilized for the mesh generation. A fine mesh is applied to the electrode and its surrounding coke and soil, while a coarser mesh is implemented for the distant soil regions, as shown in Figure 4. The initial temperature is set to 20 °C, and the convective heat transfer coefficient between the ambient air and the soil surface is specified as 5 W/(m2·°C). Sensitivity analysis of the initial temperature demonstrates that varying the initial temperature within a practical range, such as 10 degrees and 30 degrees, has a negligible impact on the final 180-day temperature rise results, which confirms the robustness of the model.
To systematically analyze the temperature rise of the grounding electrode under various conditions while ensuring its electrical performance requirements are met, low-carbon steel is selected as the electrode material in this study. The electrode has a cross-sectional diameter of 50 mm, a vertical length of 300 m, and a burial depth of 10 m. The exterior of the electrode is surrounded by a cylindrical coke bed with a radius of 0.5 m. The parameters of the various materials used are presented in Table 1, and the expressions for the temperature-dependent soil parameters are detailed in Table 2. The piecewise functions for the temperature-dependent soil electrical resistivity ρ T , thermal conductivity k T , and heat capacity c T used in this model are adopted from established empirical studies [24], but they are limited to a specific soil type. These literature-derived expressions are utilized to accurately reflect the dynamic changes in soil properties during the heating process. It should be specifically noted that the transition threshold of 44 degrees and the exponential coefficients presented in Table 2 are not universal constants applicable to all soil types. These parameters represent a specific macroscopic model widely adopted in previous studies [24]. Physically, this 44-degree threshold represents the critical point where accelerated moisture evaporation begins to dominate. Below this temperature, the moisture content and resistivity remain relatively stable. Above this temperature, rapid moisture loss leads to an exponential increase in macroscopic resistivity.

2.5. Validation of the Temperature Rise Simulation Model for the Vertical Grounding Electrode

To verify the accuracy of the calculation method proposed in this study, vertical grounding electrode models in uniform soil, consistent with those in [20,25], are established. The numerical calculation results of the current field and the temperature field are, respectively, compared with the calculation results from the CDEGS 15.4 grounding numerical analysis software and the actual measured values.

2.5.1. Validation of Electric Field Parameters

The finite element simulation is conducted according to the electrical parameters specified in [25]. Specifically, the electrode diameter is 60 mm, the coke radius is 0.2 m, and the burial depth is 20 m. The grounding resistances are calculated for grounding electrode lengths of 300 m, 400 m, 500 m, 600 m, and 700 m, respectively. The grounding resistances obtained from the finite element numerical calculations are compared with the literature data, as shown in Table 3.
As shown in the table, the calculation results obtained in this study are highly consistent with the CDEGS results reported in [25]. The errors fall within an acceptable range, thereby verifying the accuracy of the proposed calculation model.

2.5.2. Validation of the Temperature Rise Process

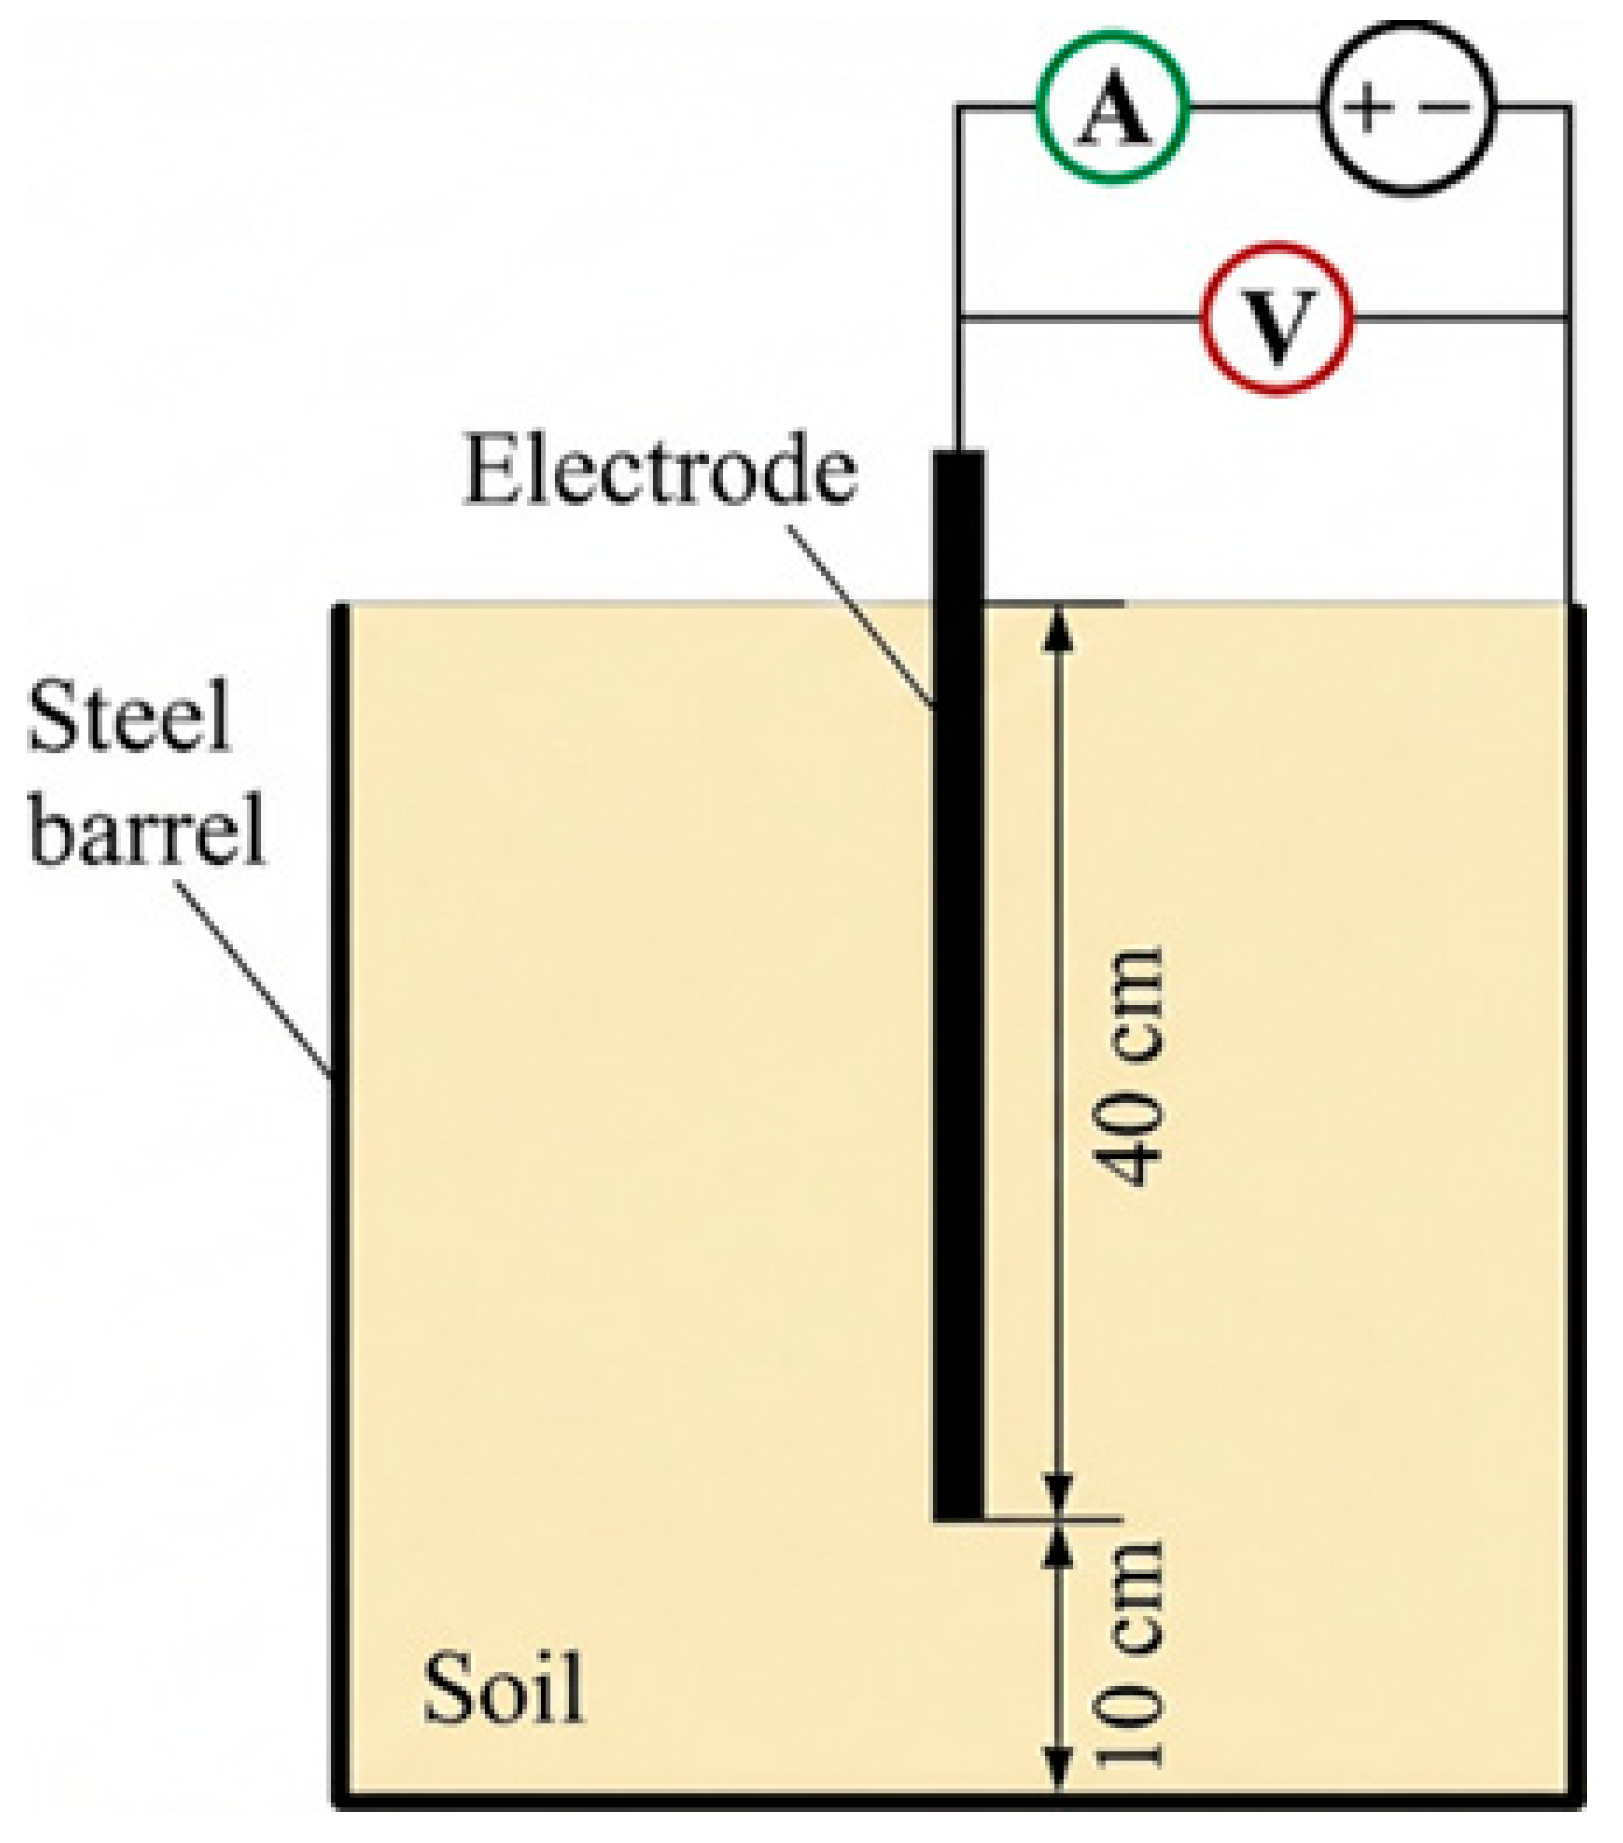
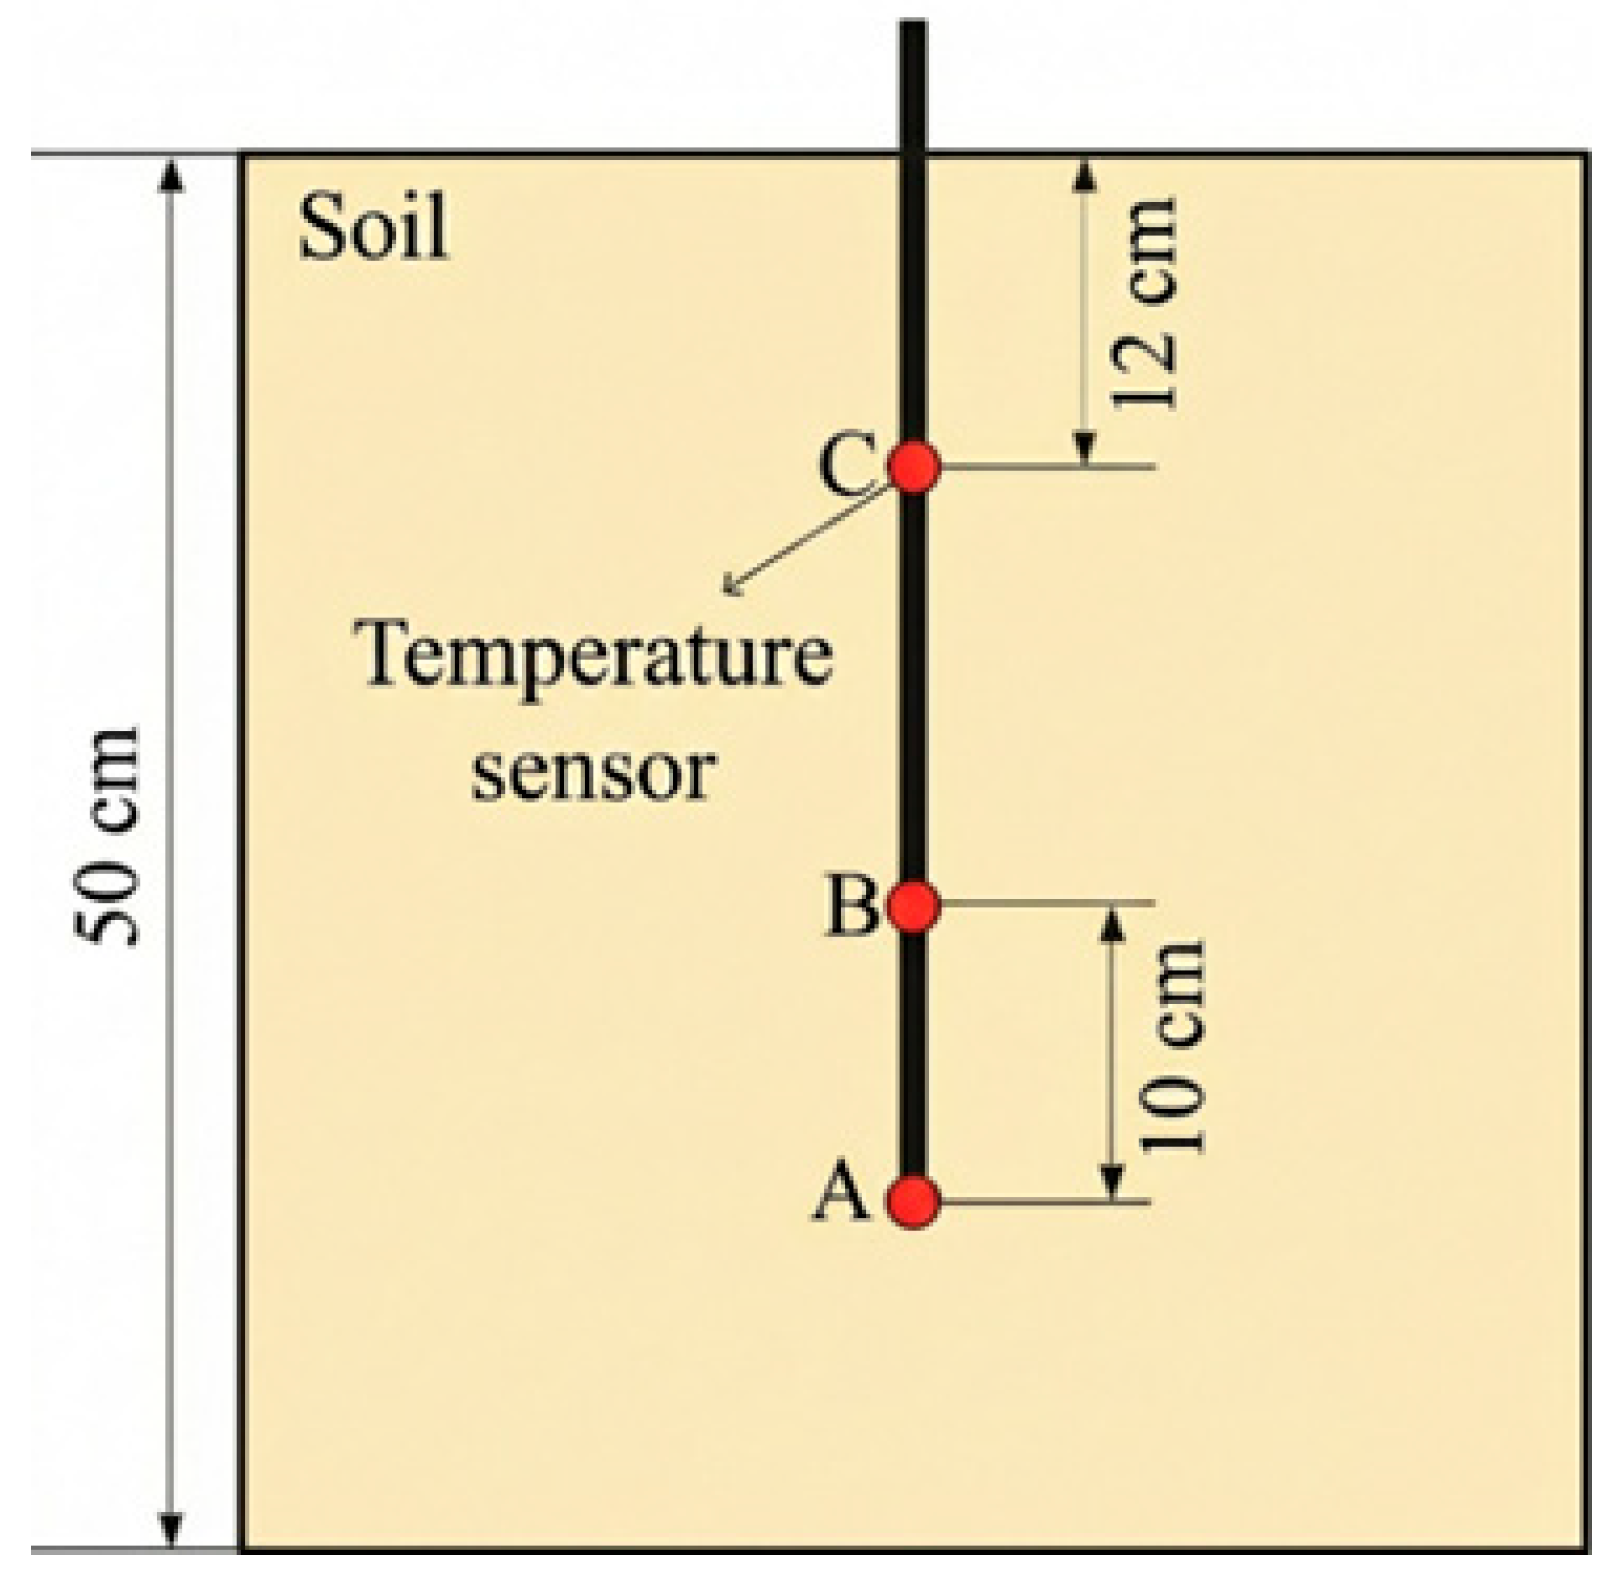
The electro-thermal coupled finite element model established in this study can not only calculate and illustrate the current field distribution of the vertical DC grounding electrode but also intuitively demonstrate the temperature rise of the electrode and the surrounding soil. In this section, the field test data of the temperature rise of a vertical grounding electrode from [20] are utilized for validation. Based on the numerical calculation method proposed herein, a vertical grounding electrode model consistent with that in [20] is established. The schematic diagram of the temperature rise test apparatus is shown in Figure 5, where the buried length of the electrode in the soil is 40 cm. In the literature, three representative observation points are set on the electrode surface, as illustrated in Figure 6. Observation point A is located at the bottom of the electrode, observation point B is at a distance of 10 cm from point A, and observation point C is at a distance of 12 cm from the soil surface.
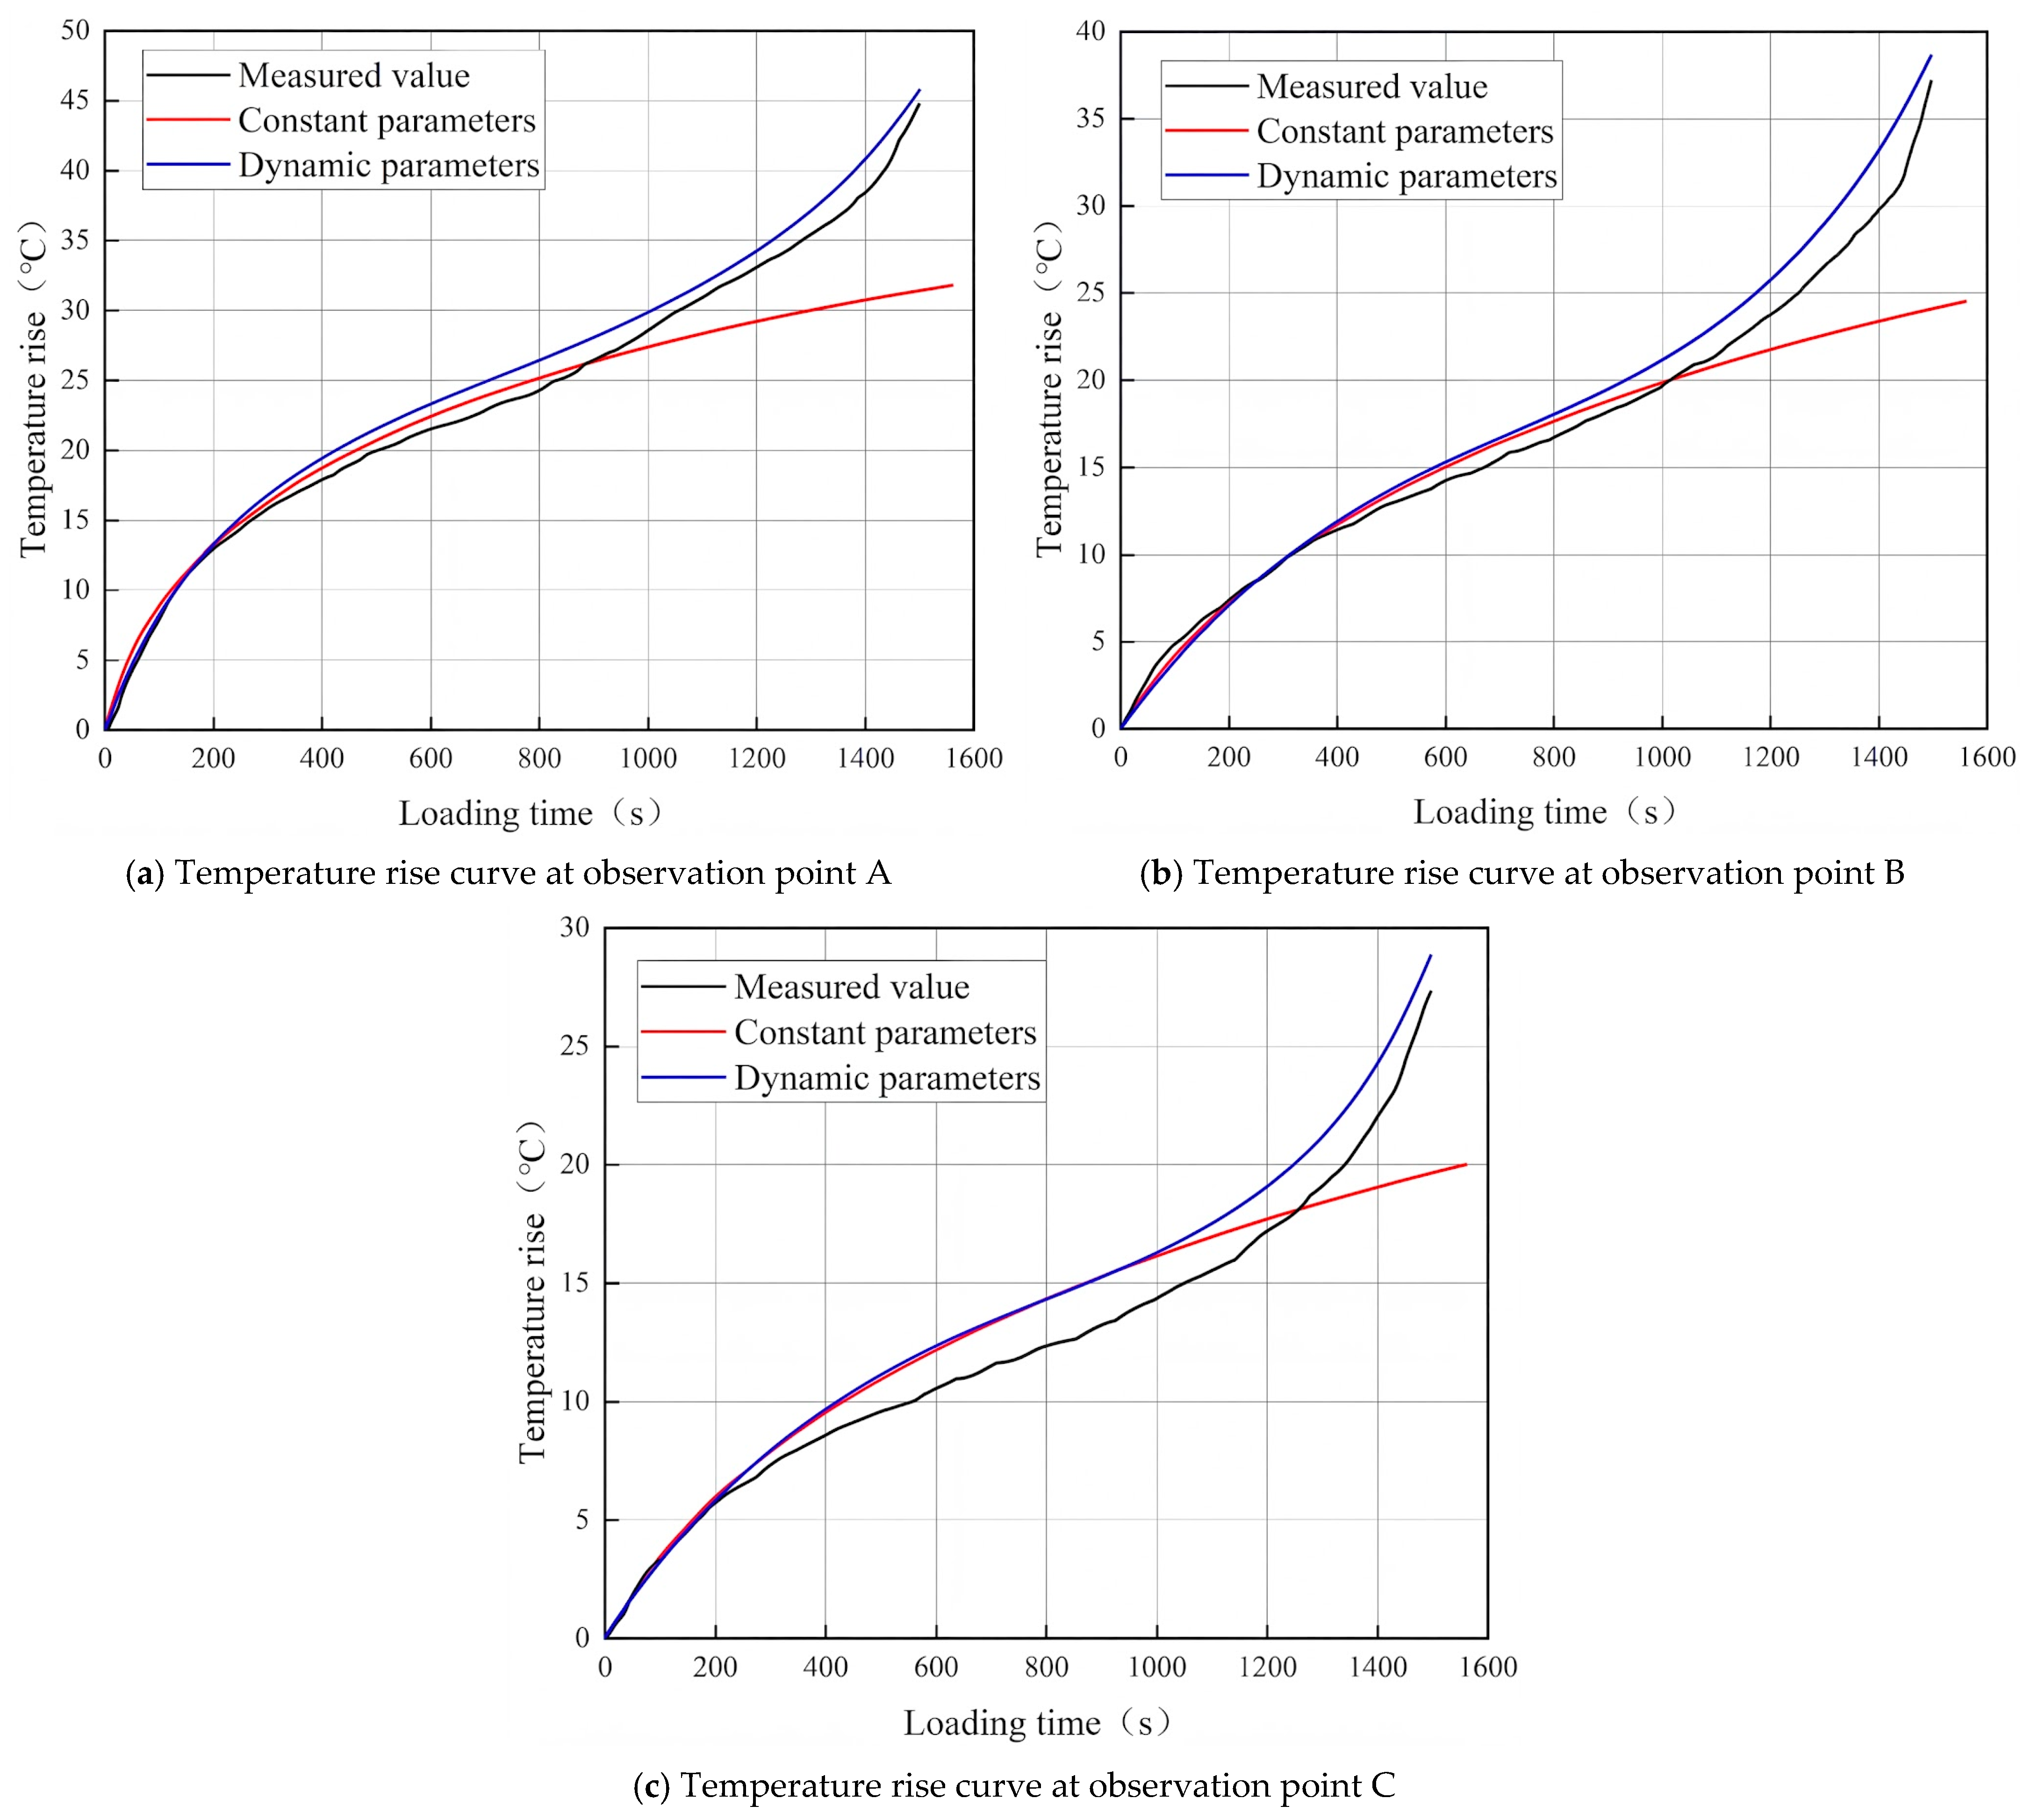
Figure 7 presents the comparison curves of the measured temperature rise, alongside the simulated values using constant and dynamic soil parameters, for measurement points A, B, and C. It can be observed that the temperature rise at point A, located at the bottom extremity of the vertical grounding electrode, is the highest. The temperature rises at points B and C decrease sequentially, indicating a continuous reduction in the temperature rise from the bottom toward the middle of the electrode. During the initial stage of the experiment, the measured values agree well with the simulation results. As the test progresses, the constant-parameter simulation results begin to deviate from both the dynamic-parameter simulation and the experimental measurements. The temperature rise curves of the latter two exhibit a distinct upward acceleration at the tail end. At a current injection time of 1400 s, the temperature differences between the dynamic and constant parameter simulations at measurement points A, B, and C reach 10.2 °C, 8.6 °C, and 5.3 °C. The primary reason for this phenomenon is that the elevated soil temperature causes moisture dissipation, which subsequently increases the soil resistivity and leads to a sharp escalation in temperature. In contrast, the constant-parameter simulation assumes a fixed soil resistivity and ignores its temperature-dependent characteristics, thereby underestimating the actual temperature rise during the later stages of continuous current injection. The simulation incorporating dynamic soil parameters maintains a high degree of consistency with the measured values throughout the entire current injection period, accurately reproducing the accelerated temperature rise characteristic in the later stages. Overall, the good agreement among the temperature rise curves verifies the validity of the numerical calculation method proposed in this paper.
In summary, the analysis of the above results verifies the accuracy of the simulation model and calculation method on the one hand. On the other hand, it also demonstrates that in the actual calculation of the grounding electrode temperature rise, the influence of the temperature-dependent characteristics of soil resistivity must be considered. Although this consideration further increases the computational complexity of the temperature rise for vertical DC grounding electrodes, it yields more accurate results that closely approximate real-world conditions.

3. Results

3.1. Effect of Uniform Soil Properties on the Temperature Rise of the Vertical Grounding Electrode

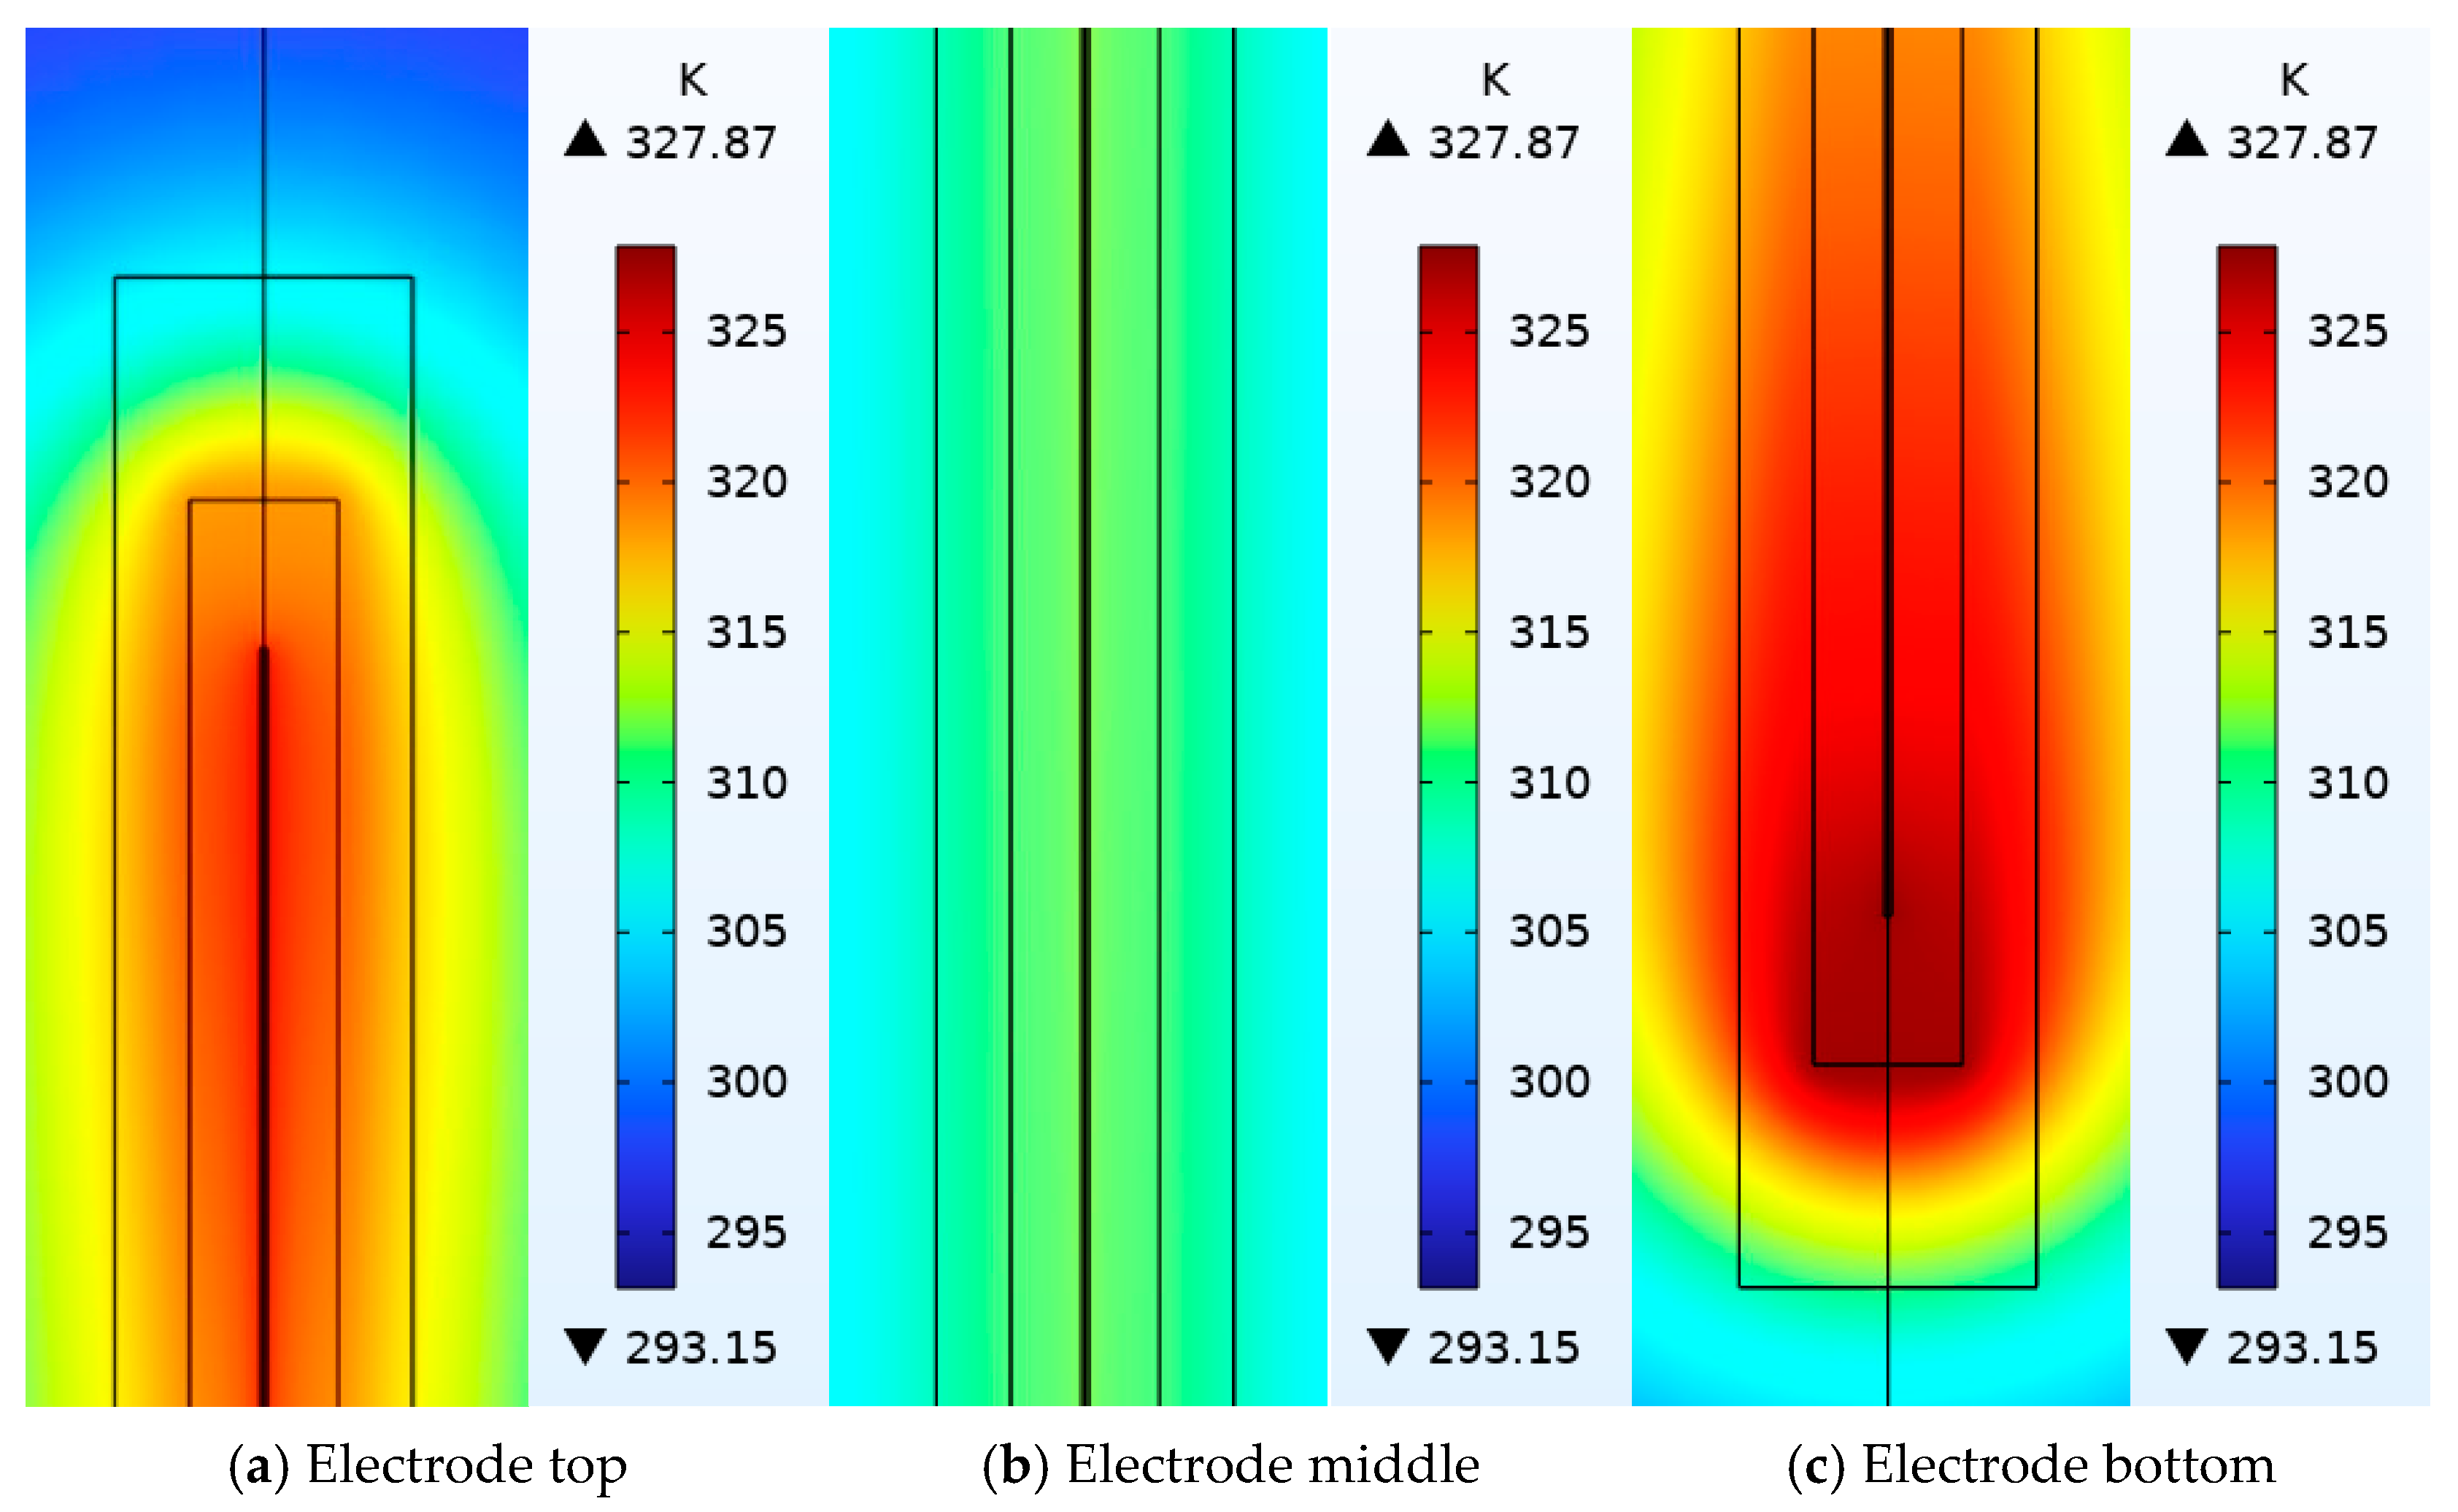
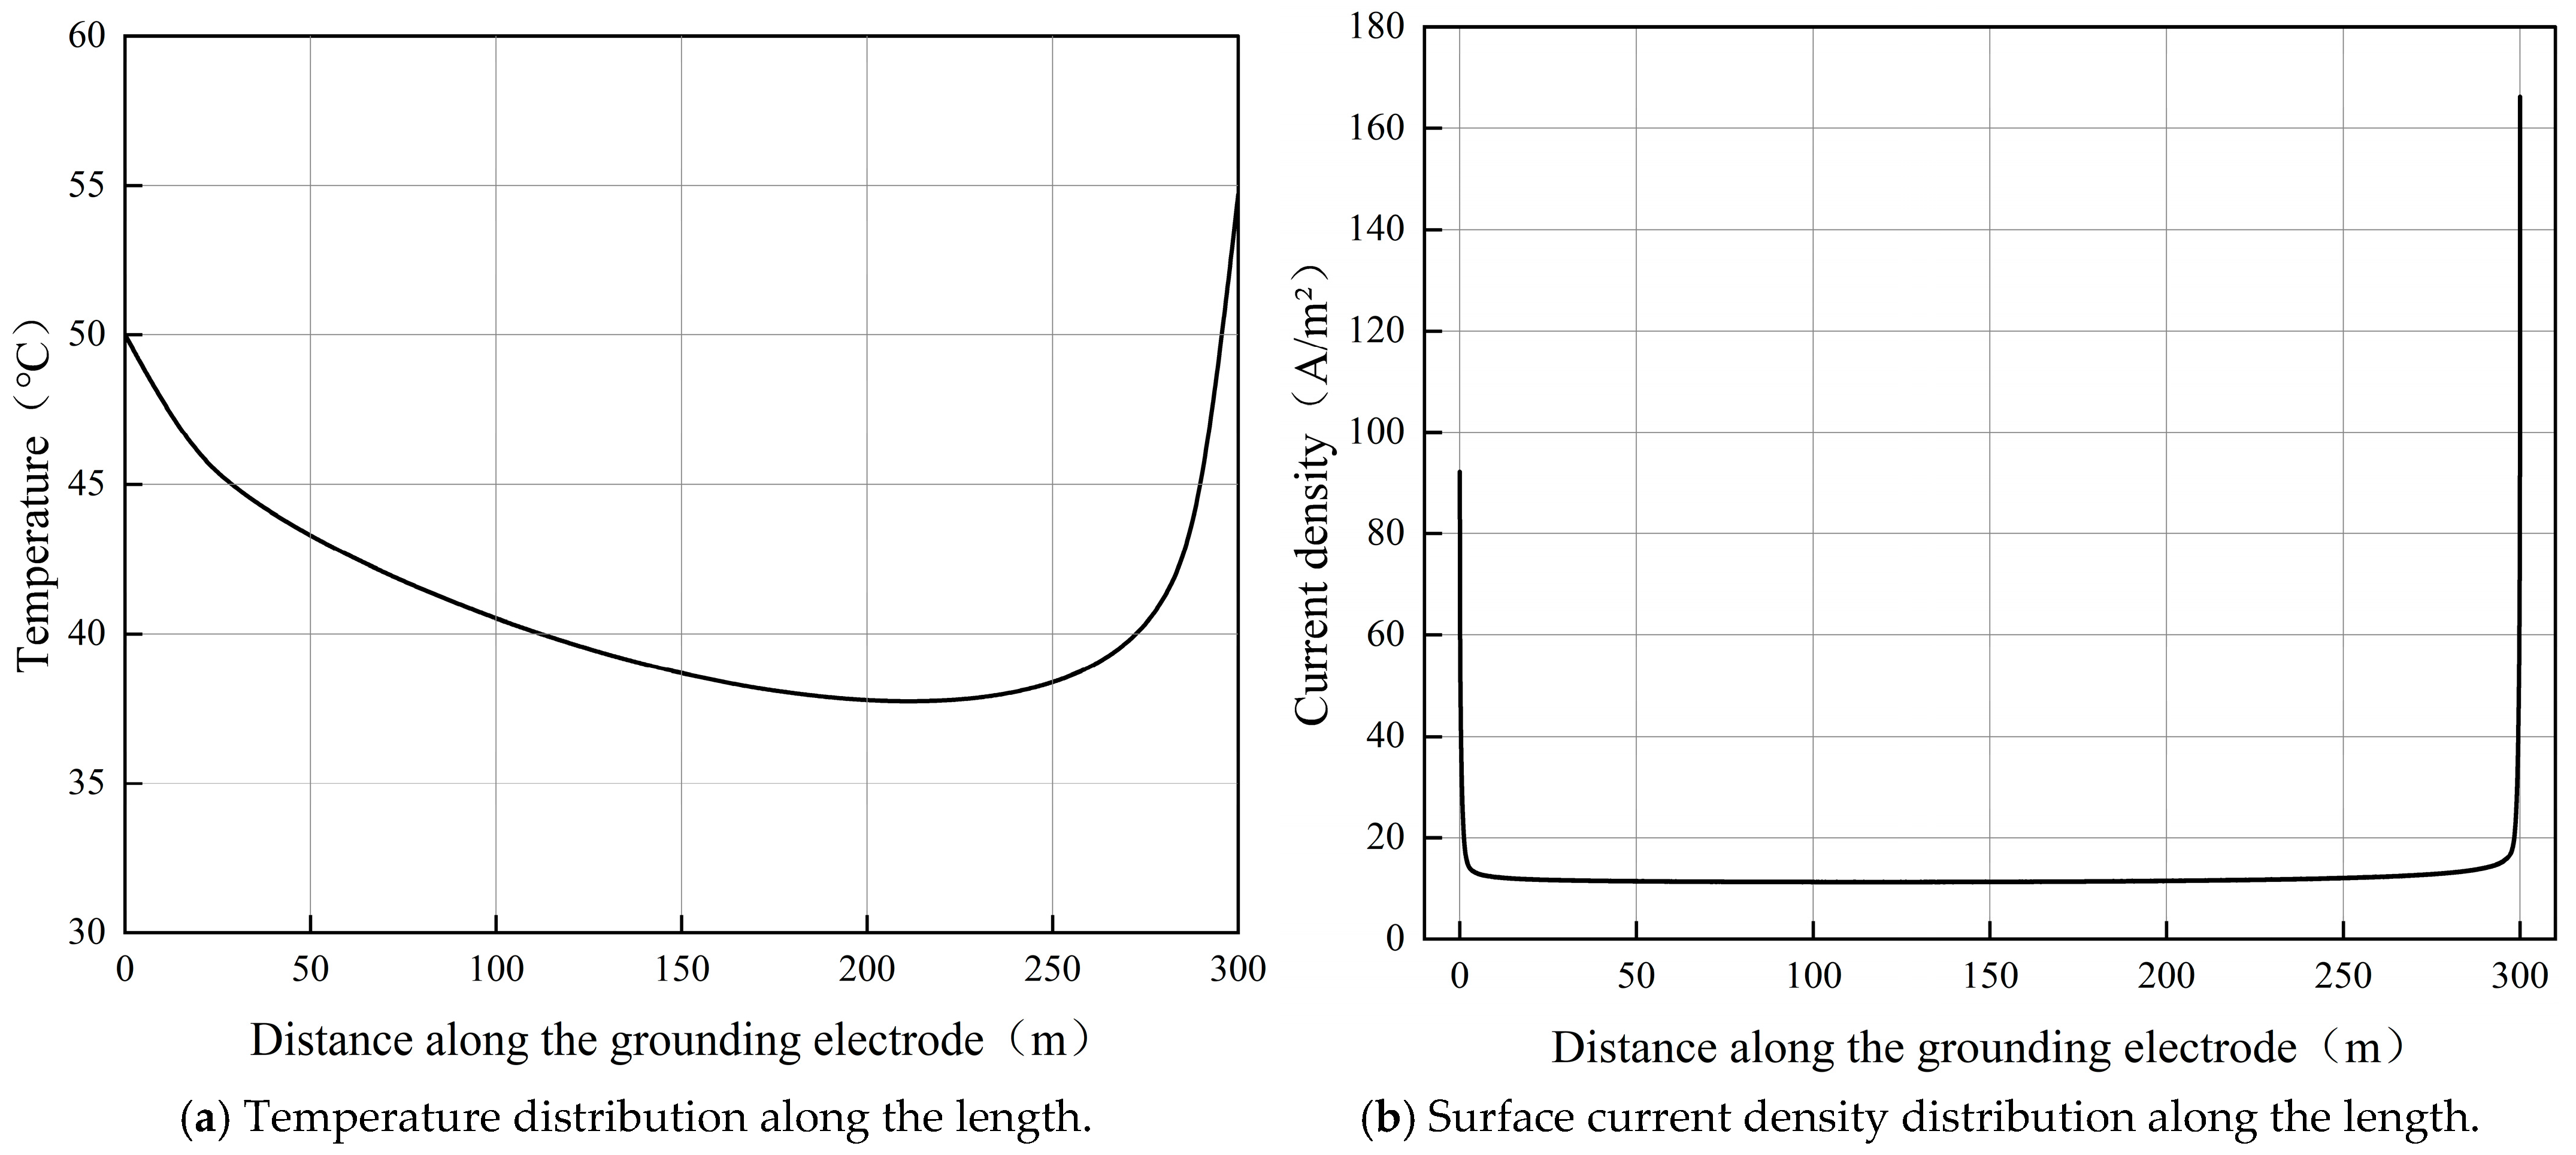
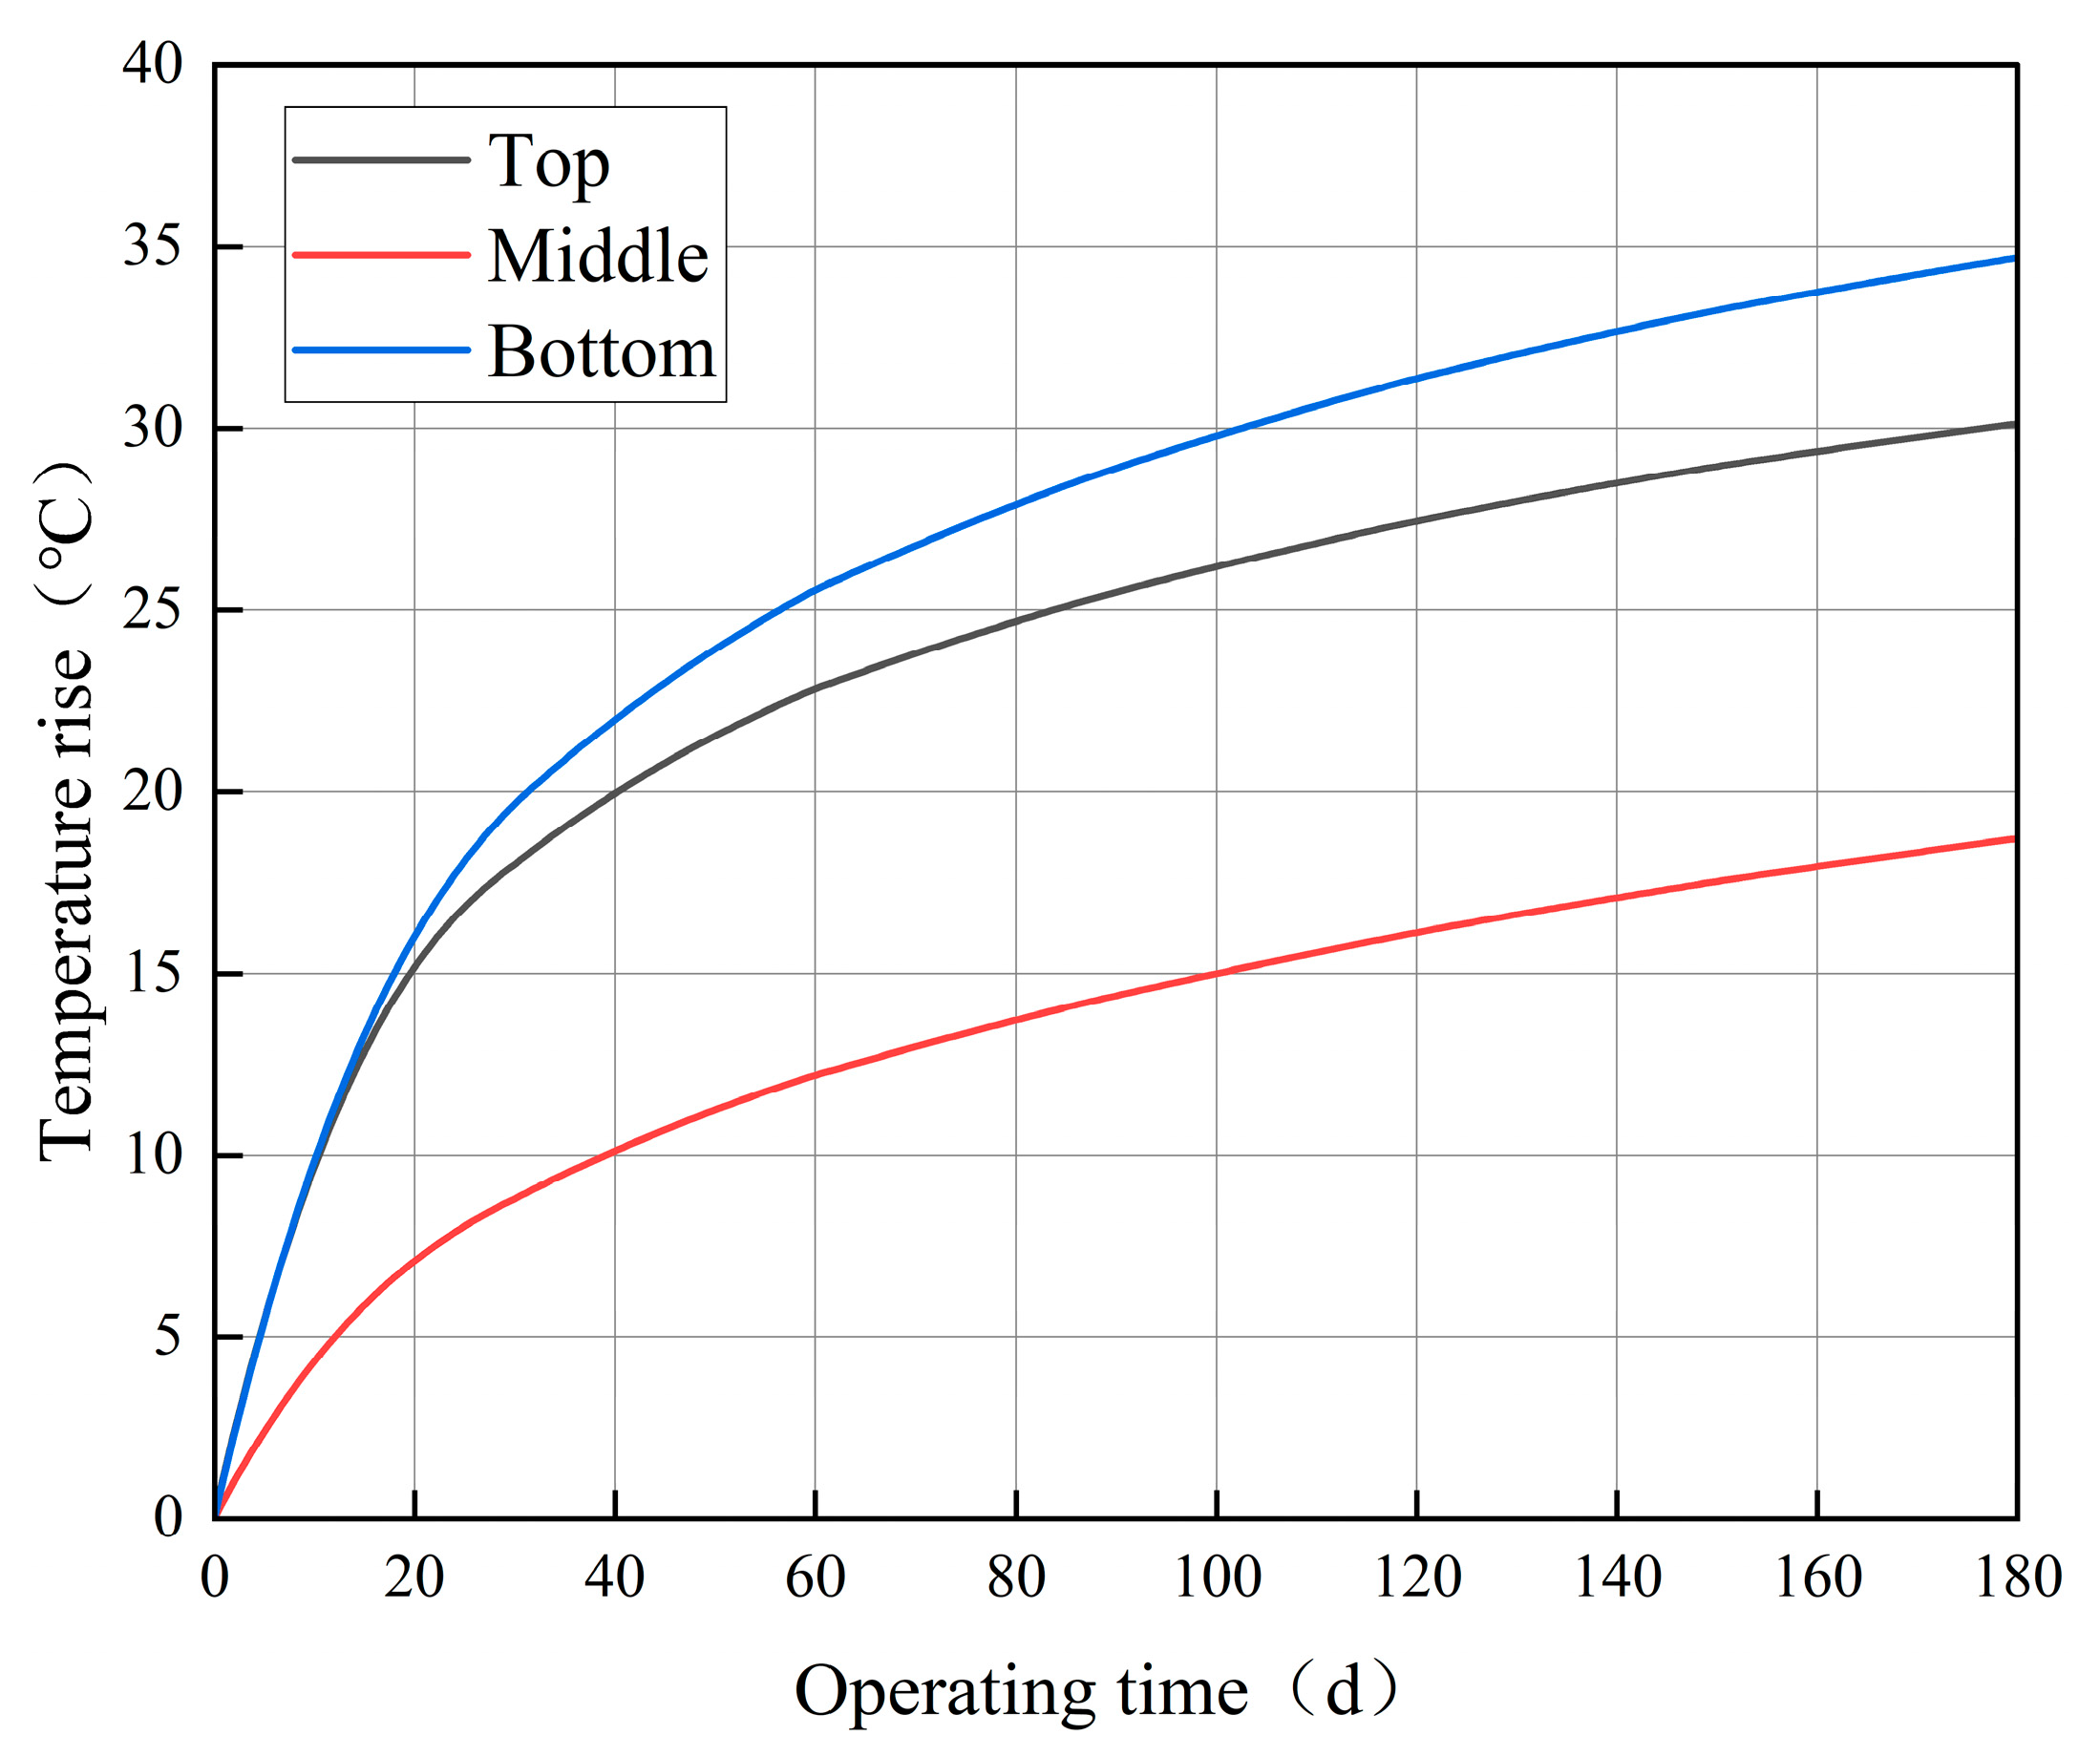
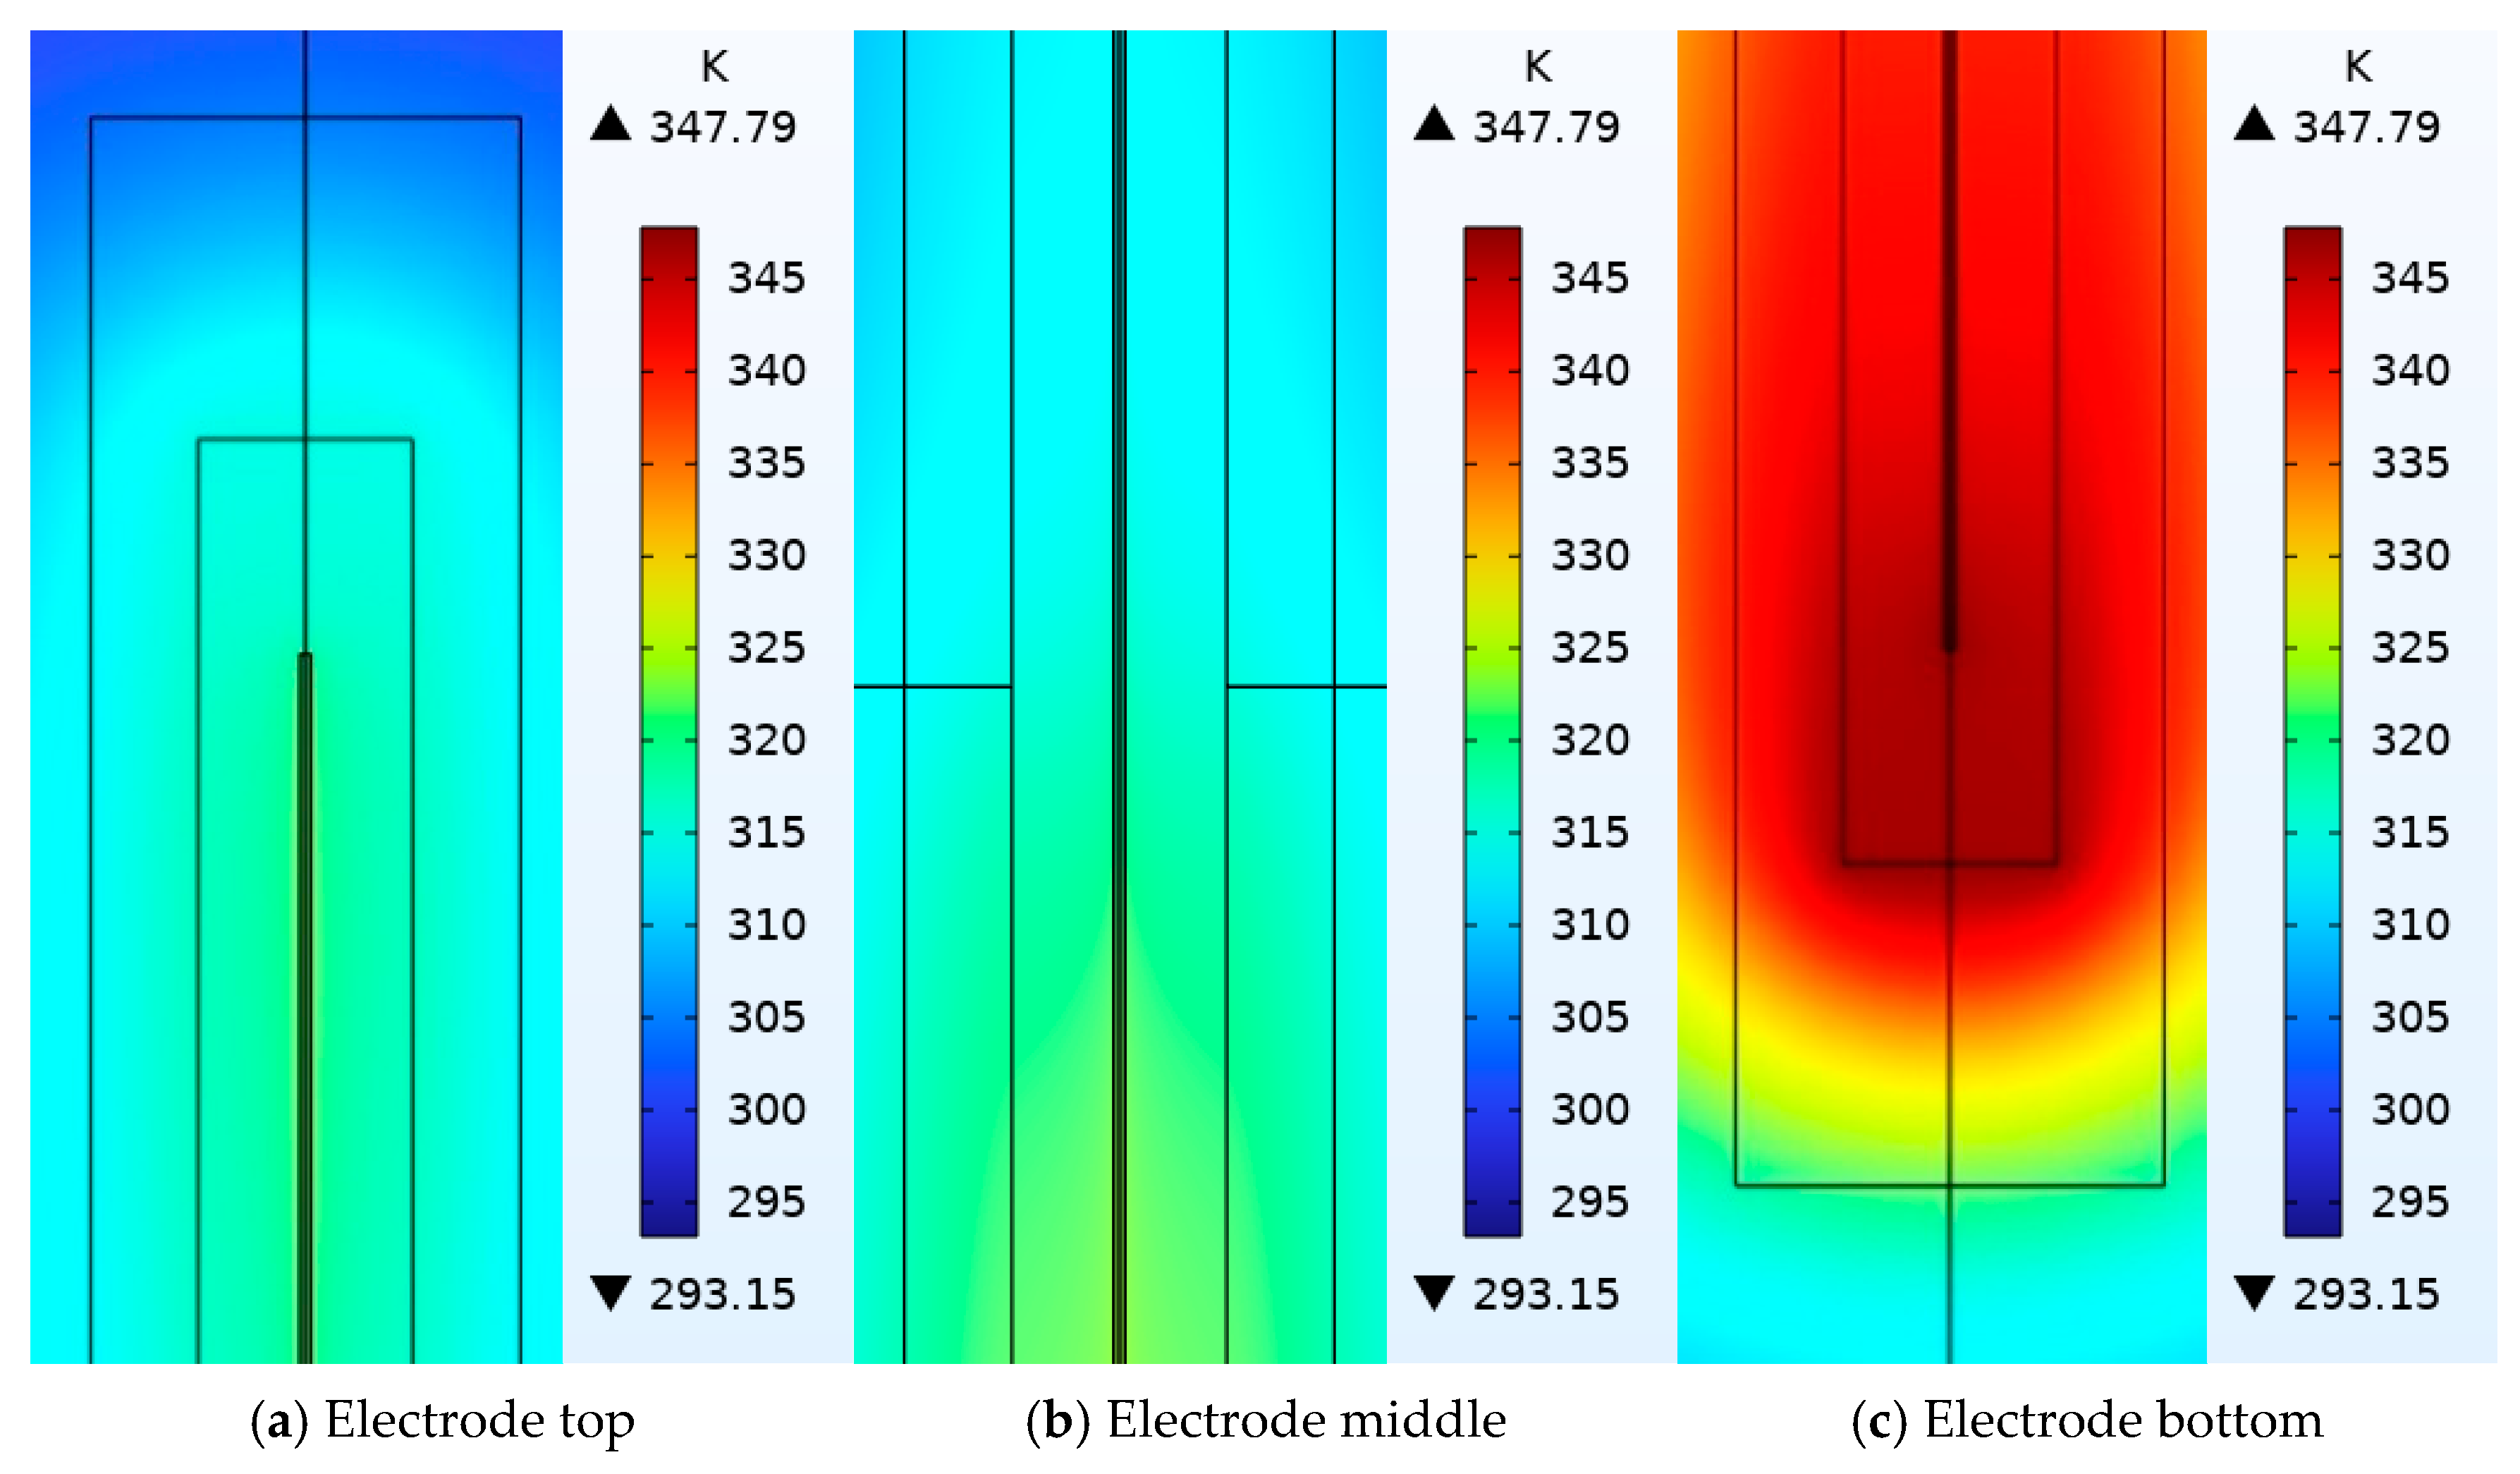
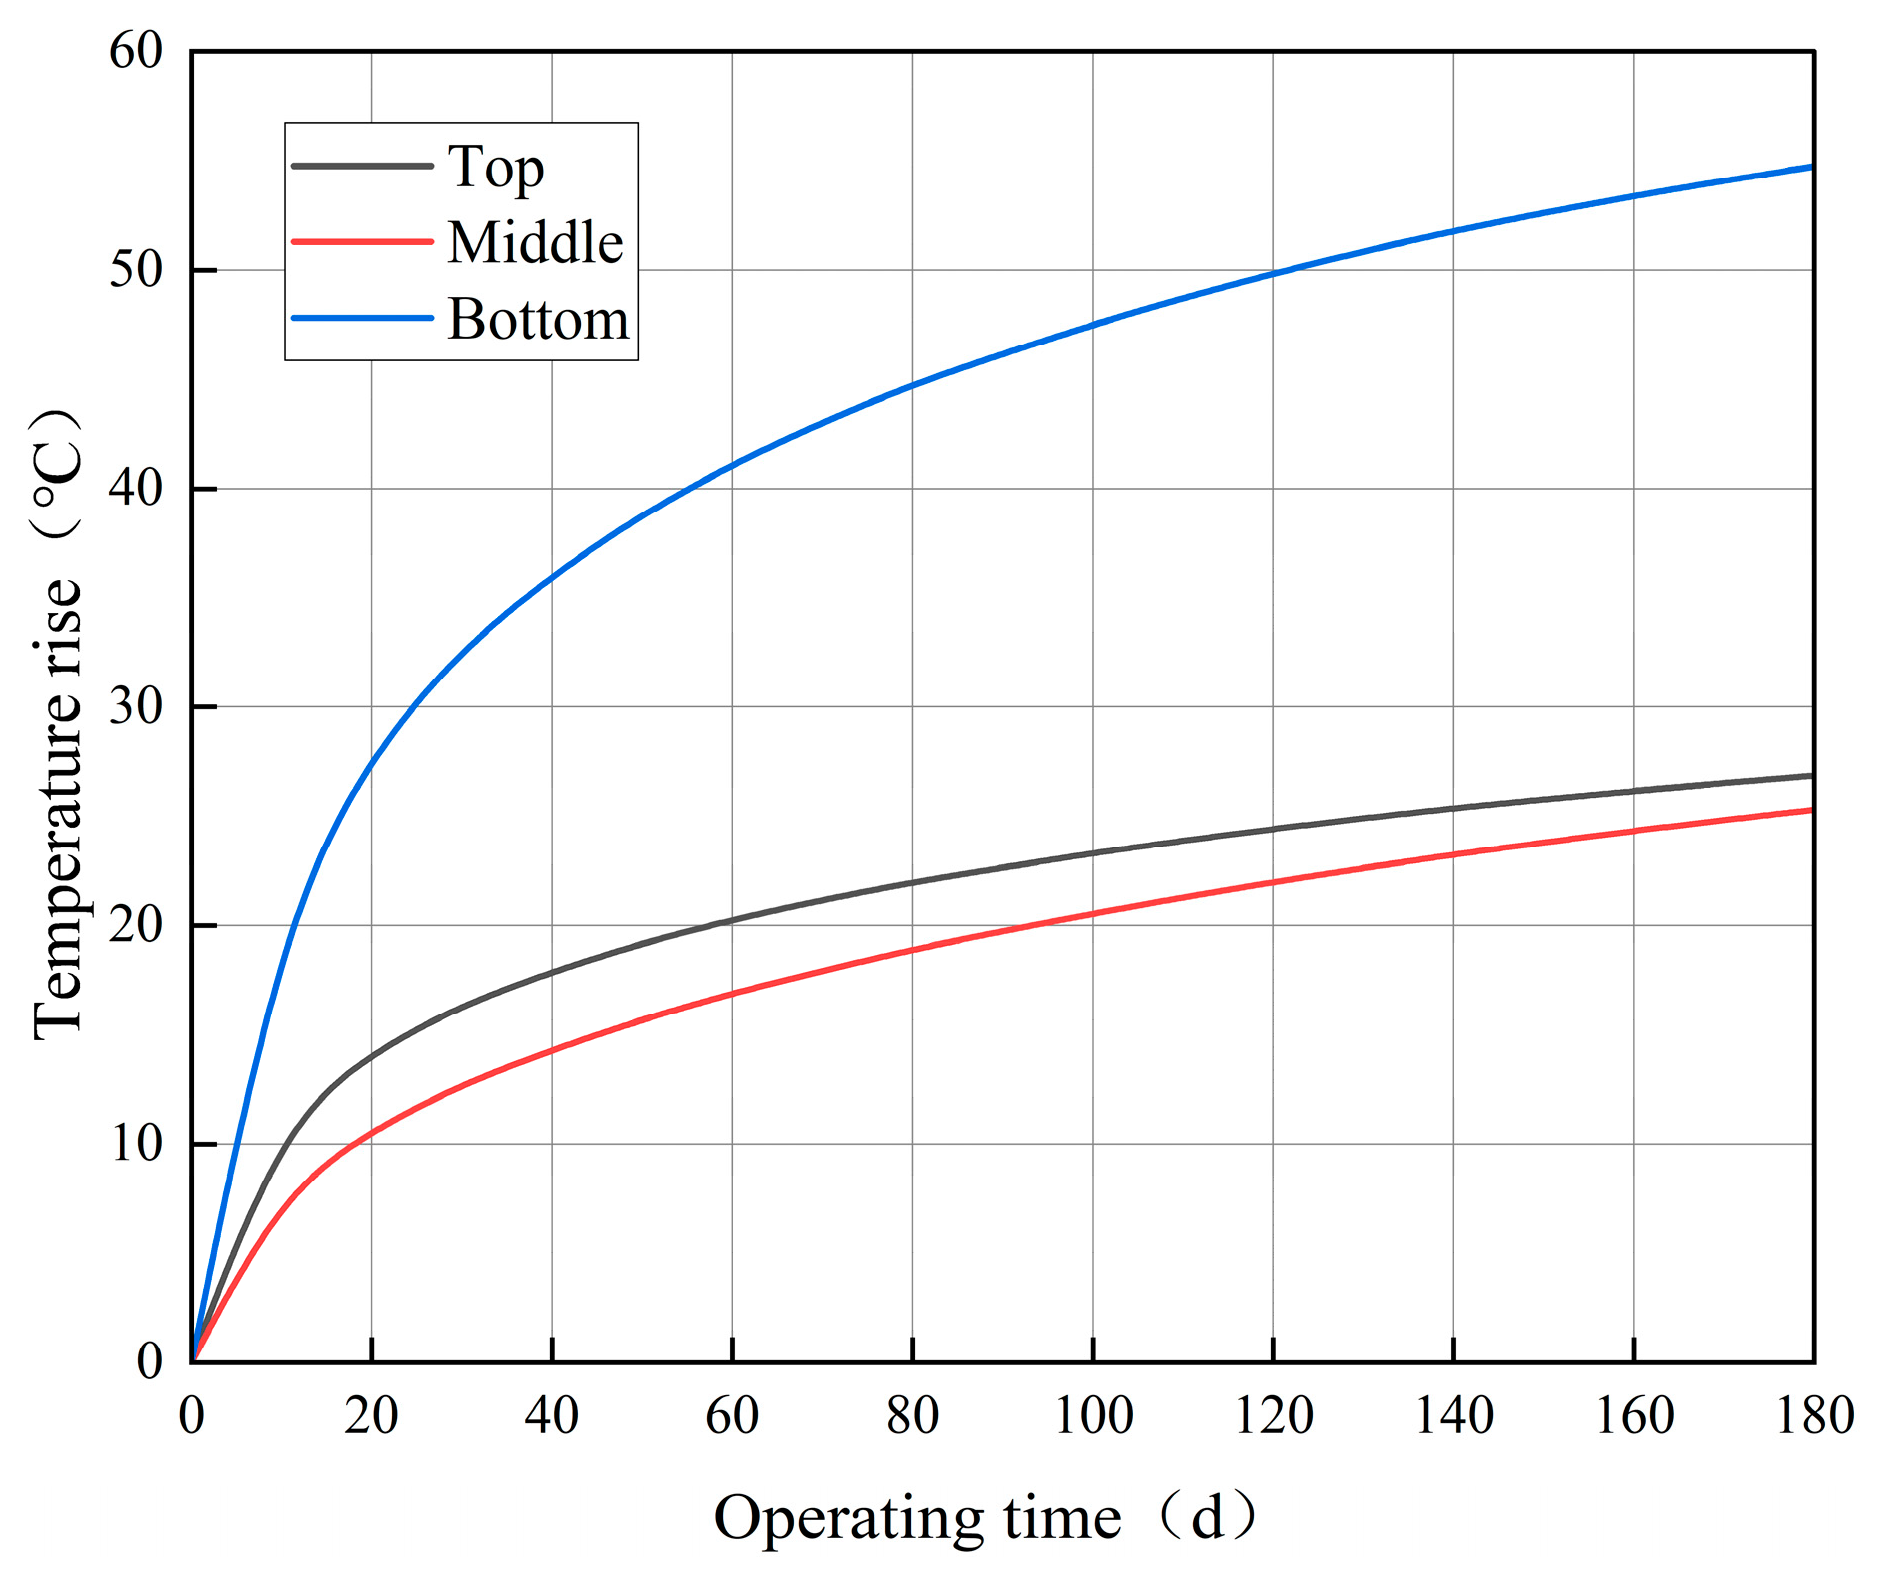
The COMSOL Multiphysics finite element simulation software is utilized to establish a coupled current-thermal model for the vertical DC grounding electrode, aiming to calculate its transient temperature rise under uniform soil conditions. The model parameters are detailed in Table 1 and Table 2. Under the conditions of an injected ground current of 600 A and a maximum operating time of 180 days, the temperature contour map at the ends and the middle of the vertical grounding electrode is presented in Figure 8. The temperature distribution along the length of the grounding electrode is illustrated in Figure 9, and the variation of temperature rise with respect to the operating time is shown in Figure 10.
As observed in Figure 8 and Figure 9, the temperature at the ends of the vertical grounding electrode is significantly higher than that in the middle. Both temperature and current density exhibit a distinct U-shaped distribution along the electrode with similar distribution patterns. This phenomenon is fundamentally driven by a combination of electrical and thermal mechanisms. Electrically, although the highly conductive coke bed buffers the outgoing current density, the steel core and the surrounding coke bed essentially form a combined conductive entity. When current flows into the surrounding high-resistivity soil, the current naturally crowds at the top and bottom tips due to their sharp shapes, resulting in the classic end effect. This extremely non-uniform current dissipation directly determines the local heating rate. Thermally, the extreme temperature peak at the bottom tip is further exacerbated by restricted thermal dissipation. Unlike the upper section, which can transfer heat through the ground surface boundary, the bottom tip is buried deep underground. Heat can only dissipate through pure solid conduction into the surrounding soil, which acts as a poor thermal conductor, creating a localized heat-trapping effect. This combination of concentrated Joule heating and restricted thermal dissipation dictates the severe heat accumulation and extreme temperature rise at the bottom.
As shown in Figure 10, under uniform soil conditions, the transient temperature rise patterns at the ends and the middle of the grounding electrode model are similar. With the increase of operating time, the electrode temperature gradually rises, while the growth rate of the temperature rise gradually decelerates. The temperature increases most rapidly during the initial operating period of 0 to 20 days. According to the expression of soil resistivity varying with temperature in Table 2, a critical transition point exists in the variation process. When the temperature is below this critical point, the soil resistivity remains constant. The maximum temperature rise in the middle section of the electrode does not exceed 25 °C; thus, the soil resistivity in this region remains constant. In contrast, the maximum temperature rise at both ends exceeds 25 °C, meaning the soil resistivity is no longer constant and increases to some extent. However, the temperature rise curve becomes increasingly smooth. This occurs because the soil thermal conductivity and specific heat capacity increase with elevated temperatures, which facilitates heat dissipation and temperature reduction. Therefore, the deceleration in the temperature rise process is primarily dominated by the increases in soil thermal conductivity and specific heat capacity.
This section investigates the effects of soil resistivity, thermal conductivity, and specific heat capacity on the temperature rise of the vertical grounding electrode under uniform soil conditions. The injected current of the grounding electrode is set to 600 A, and the operating duration is 180 days.

3.1.1. Soil Resistivity

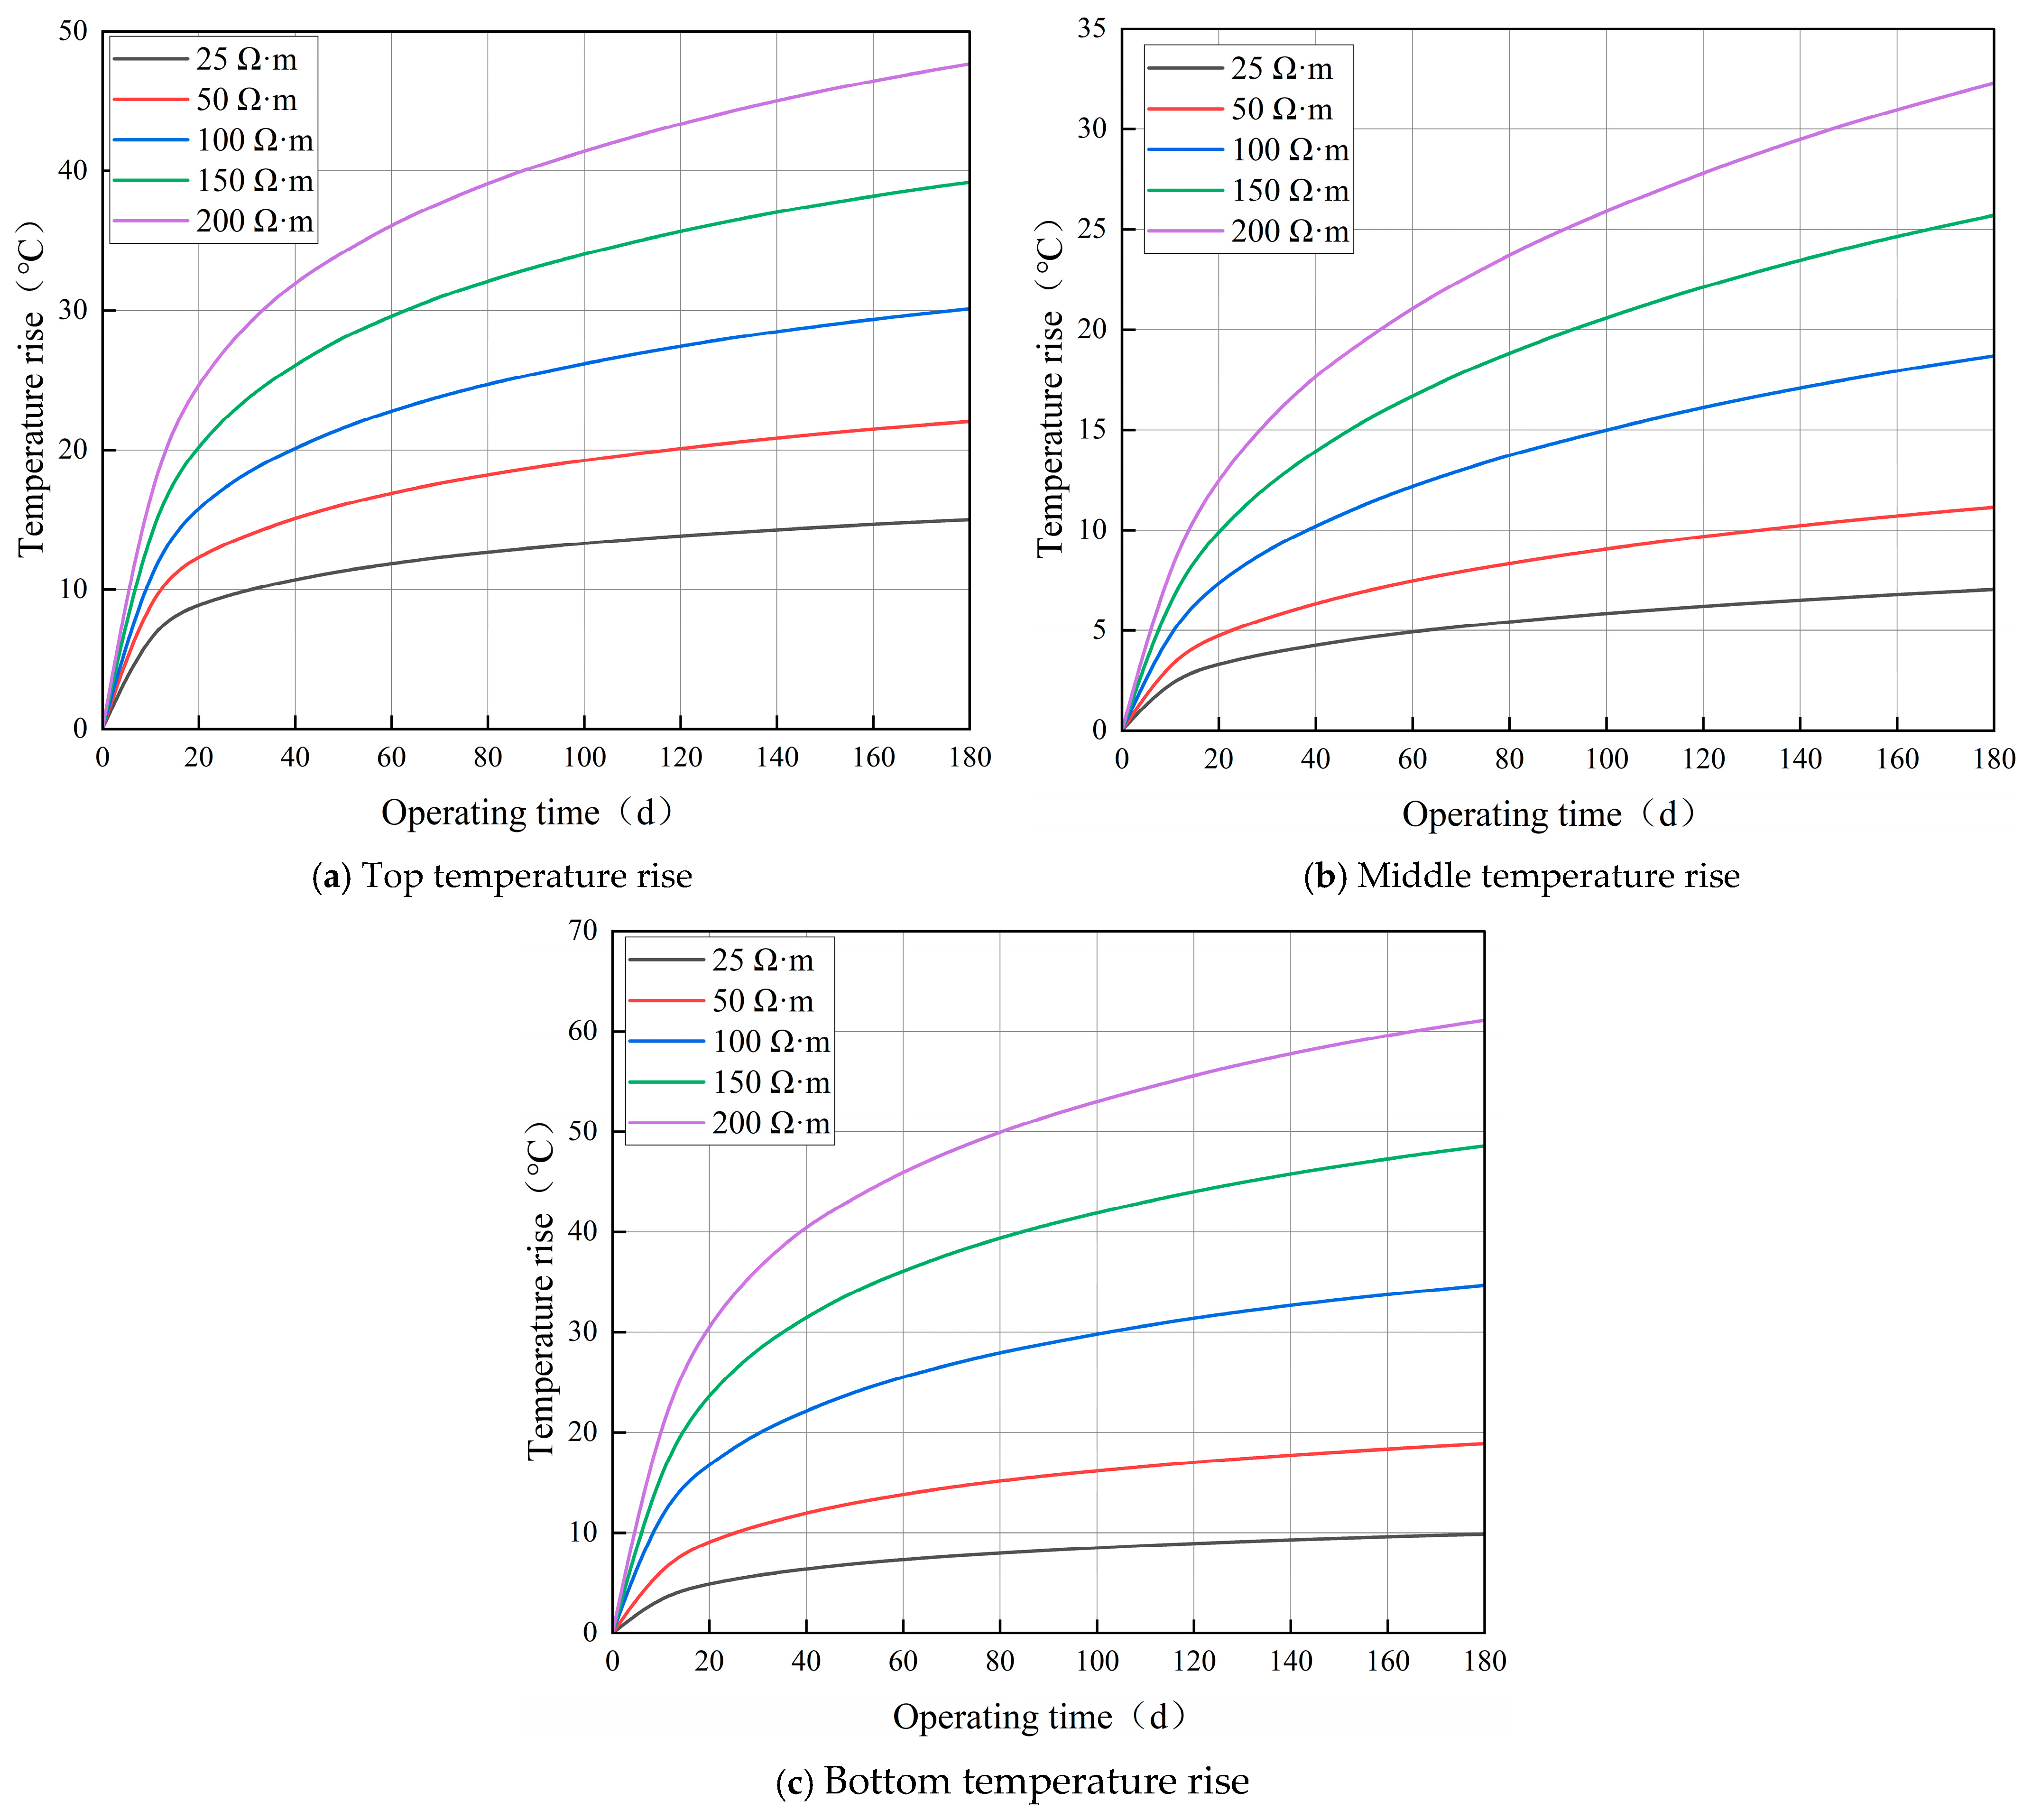
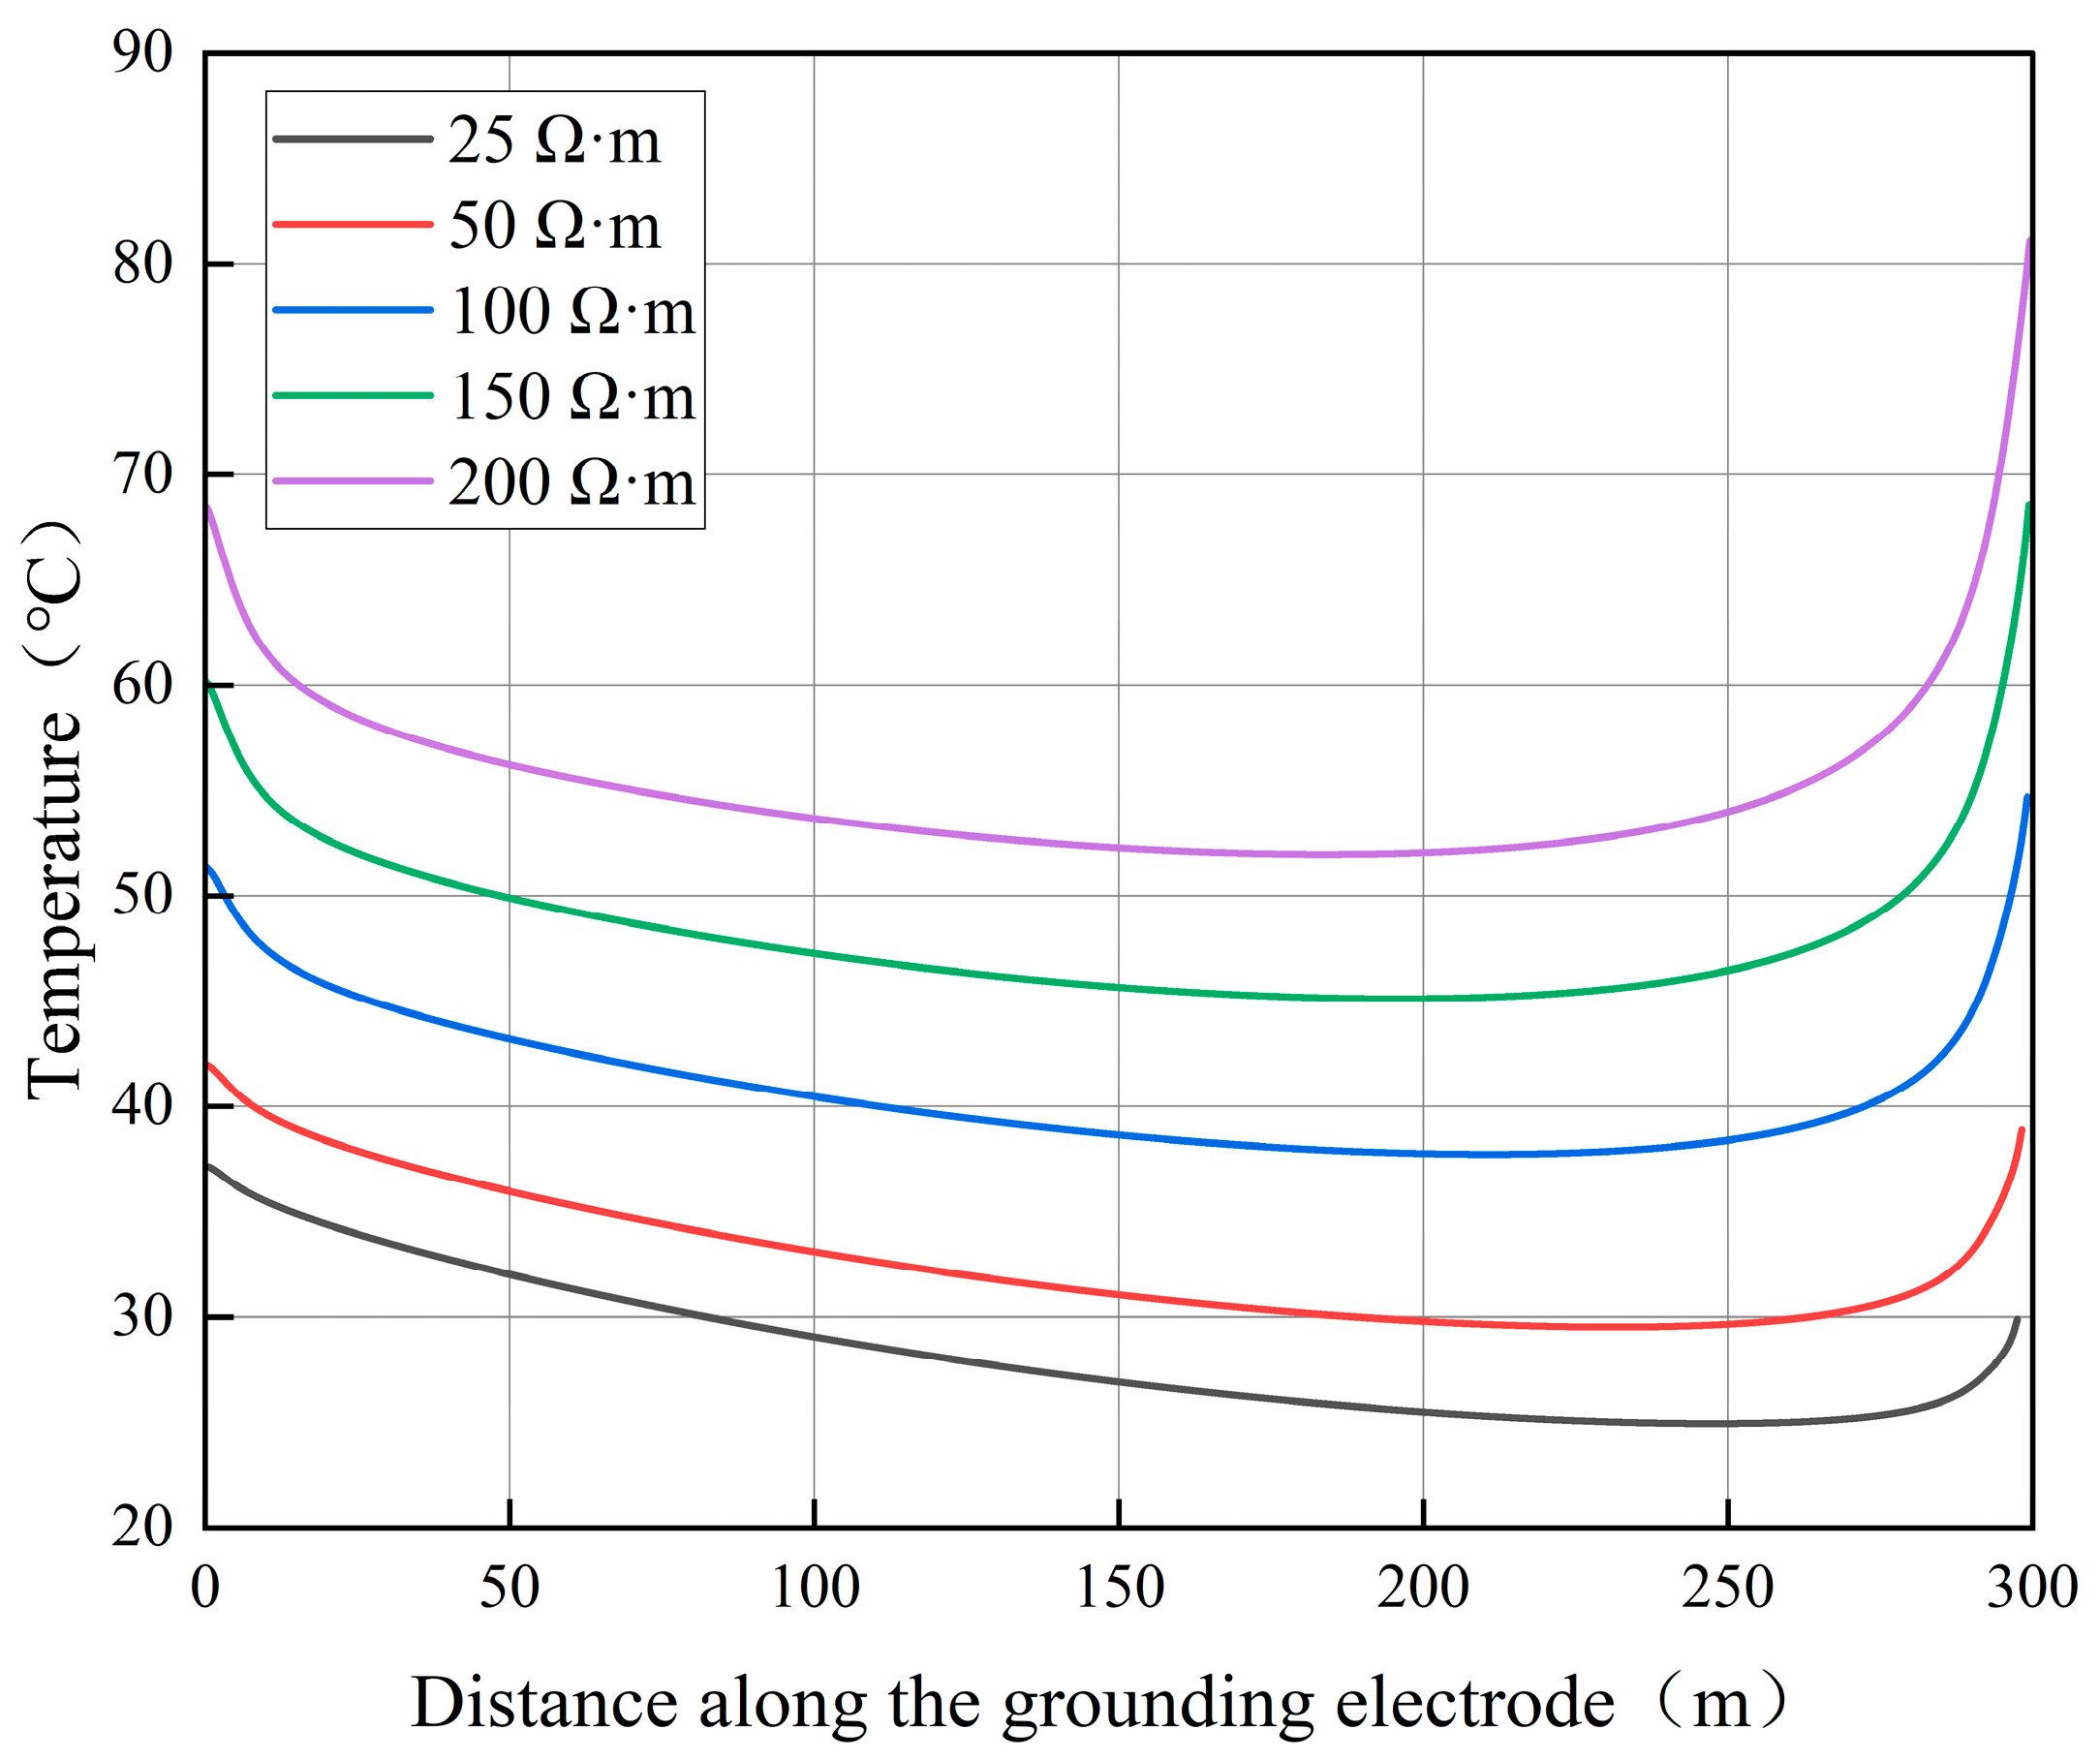
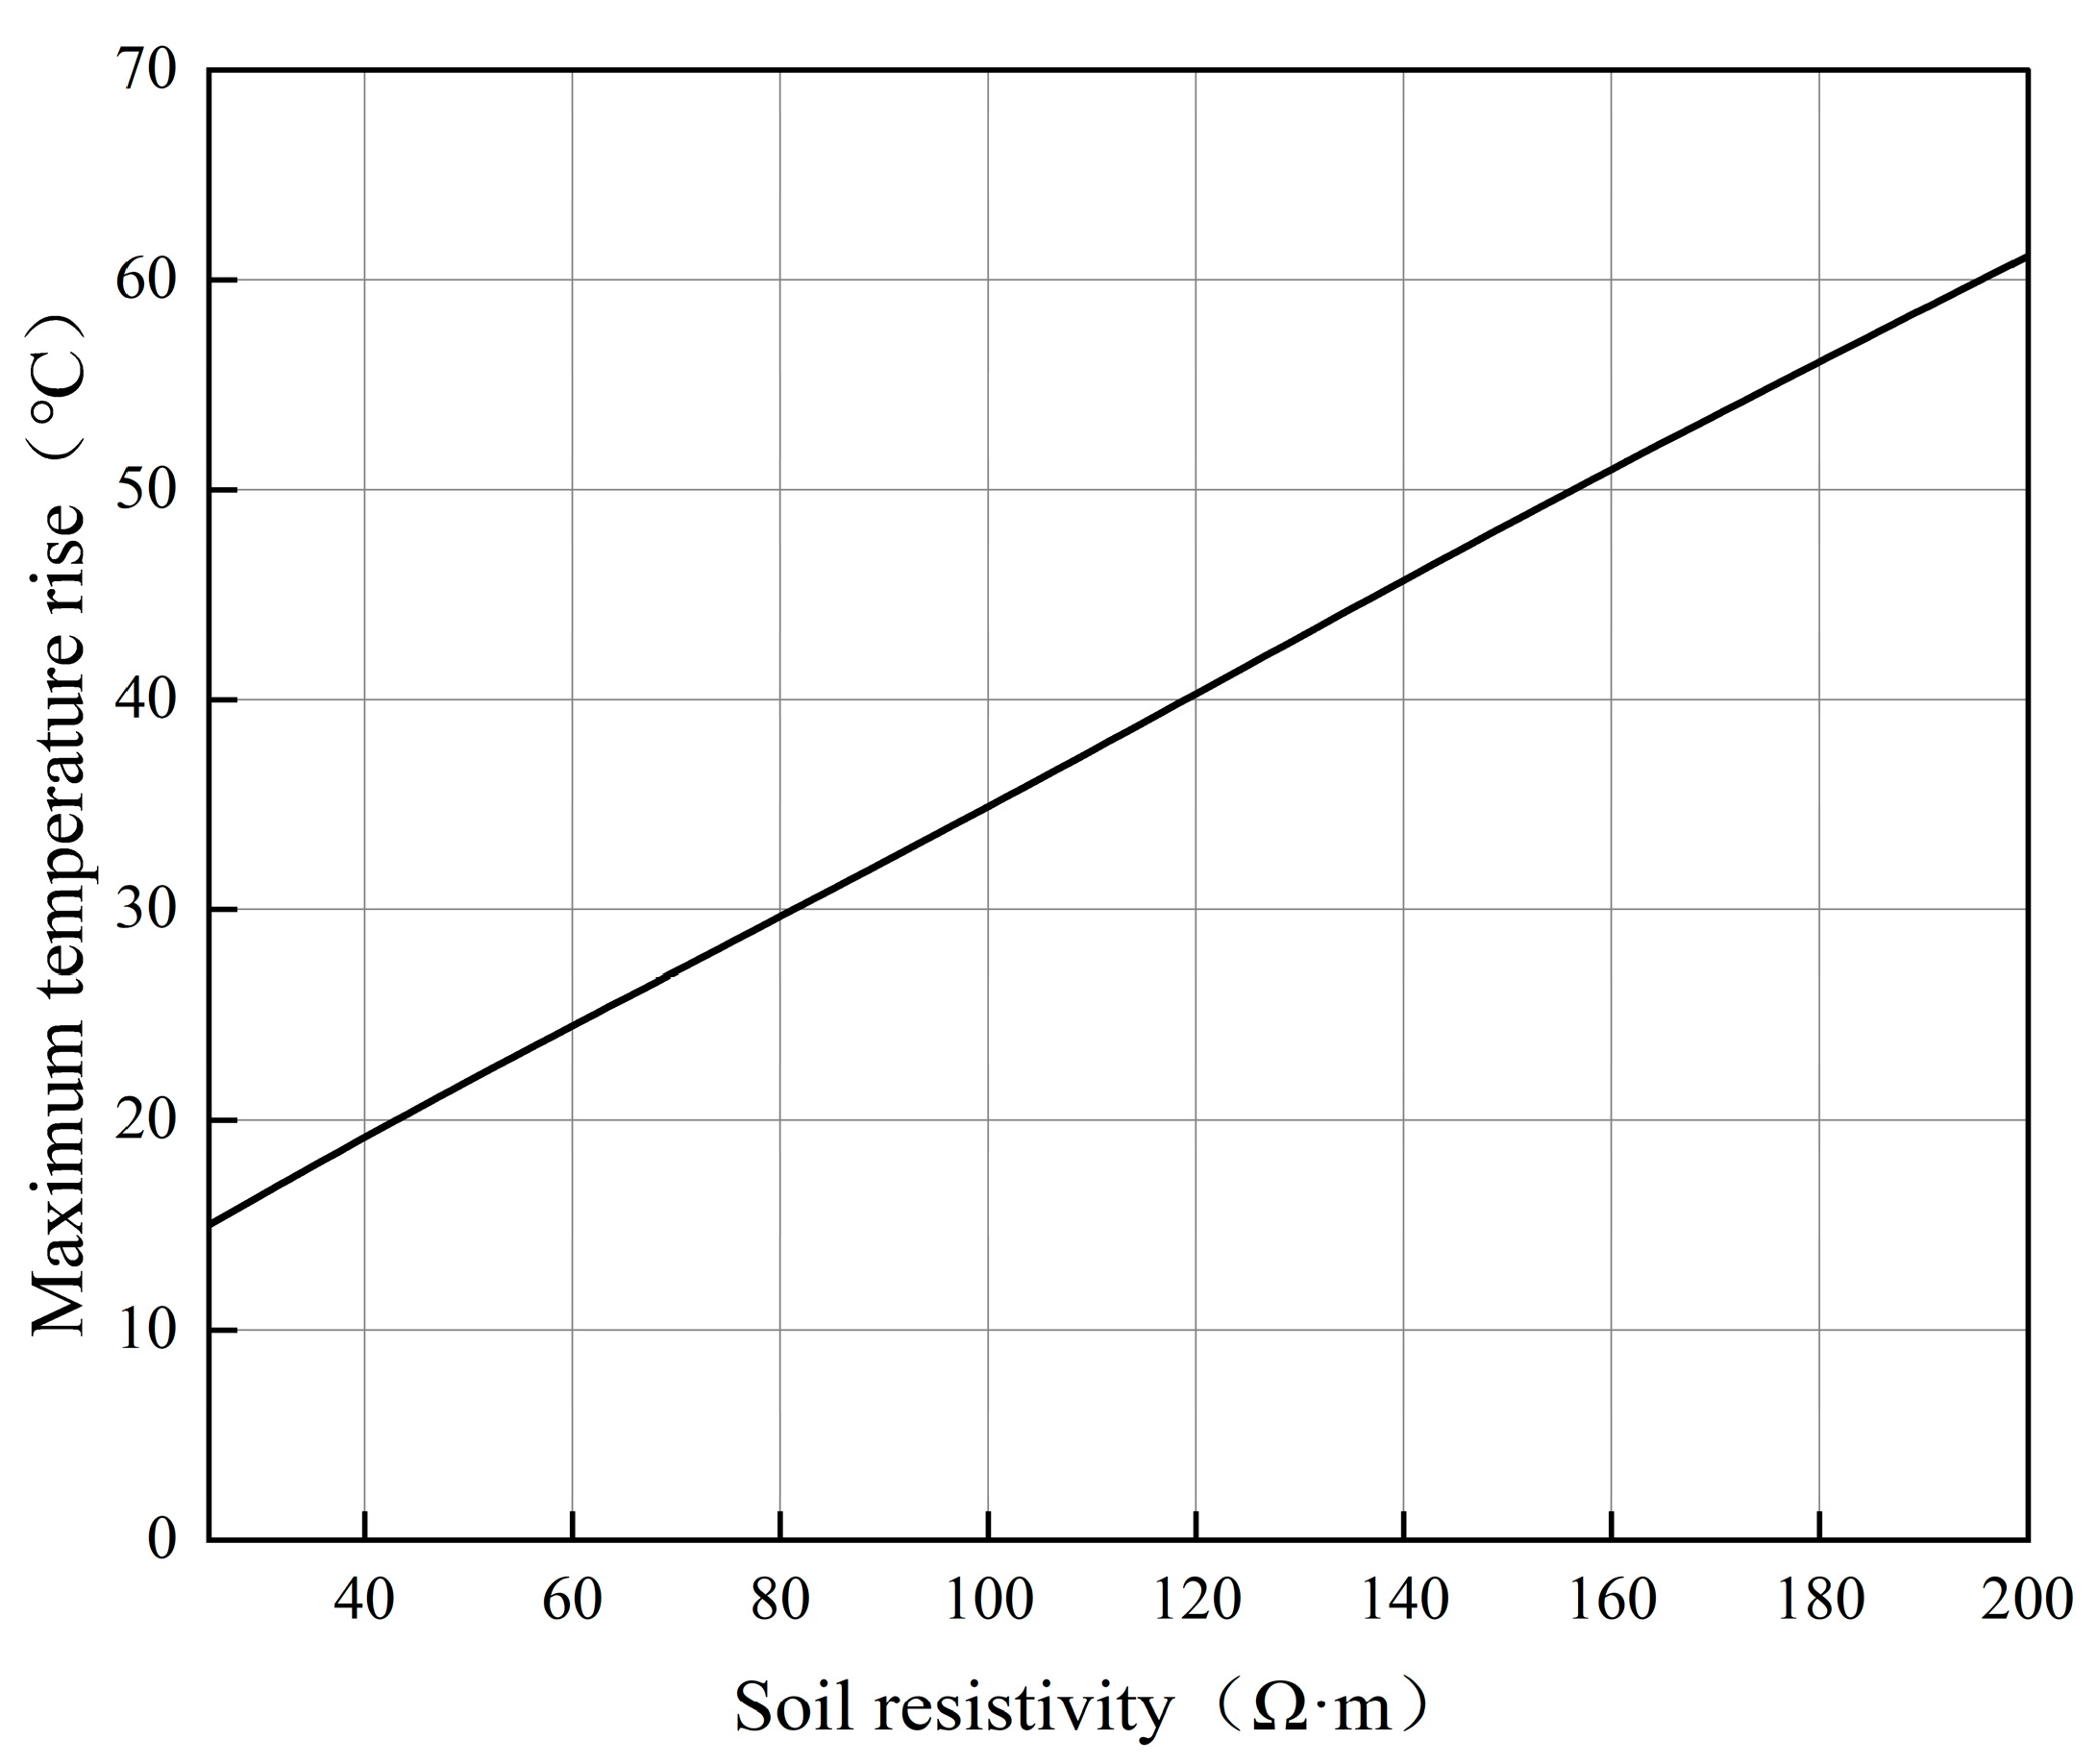
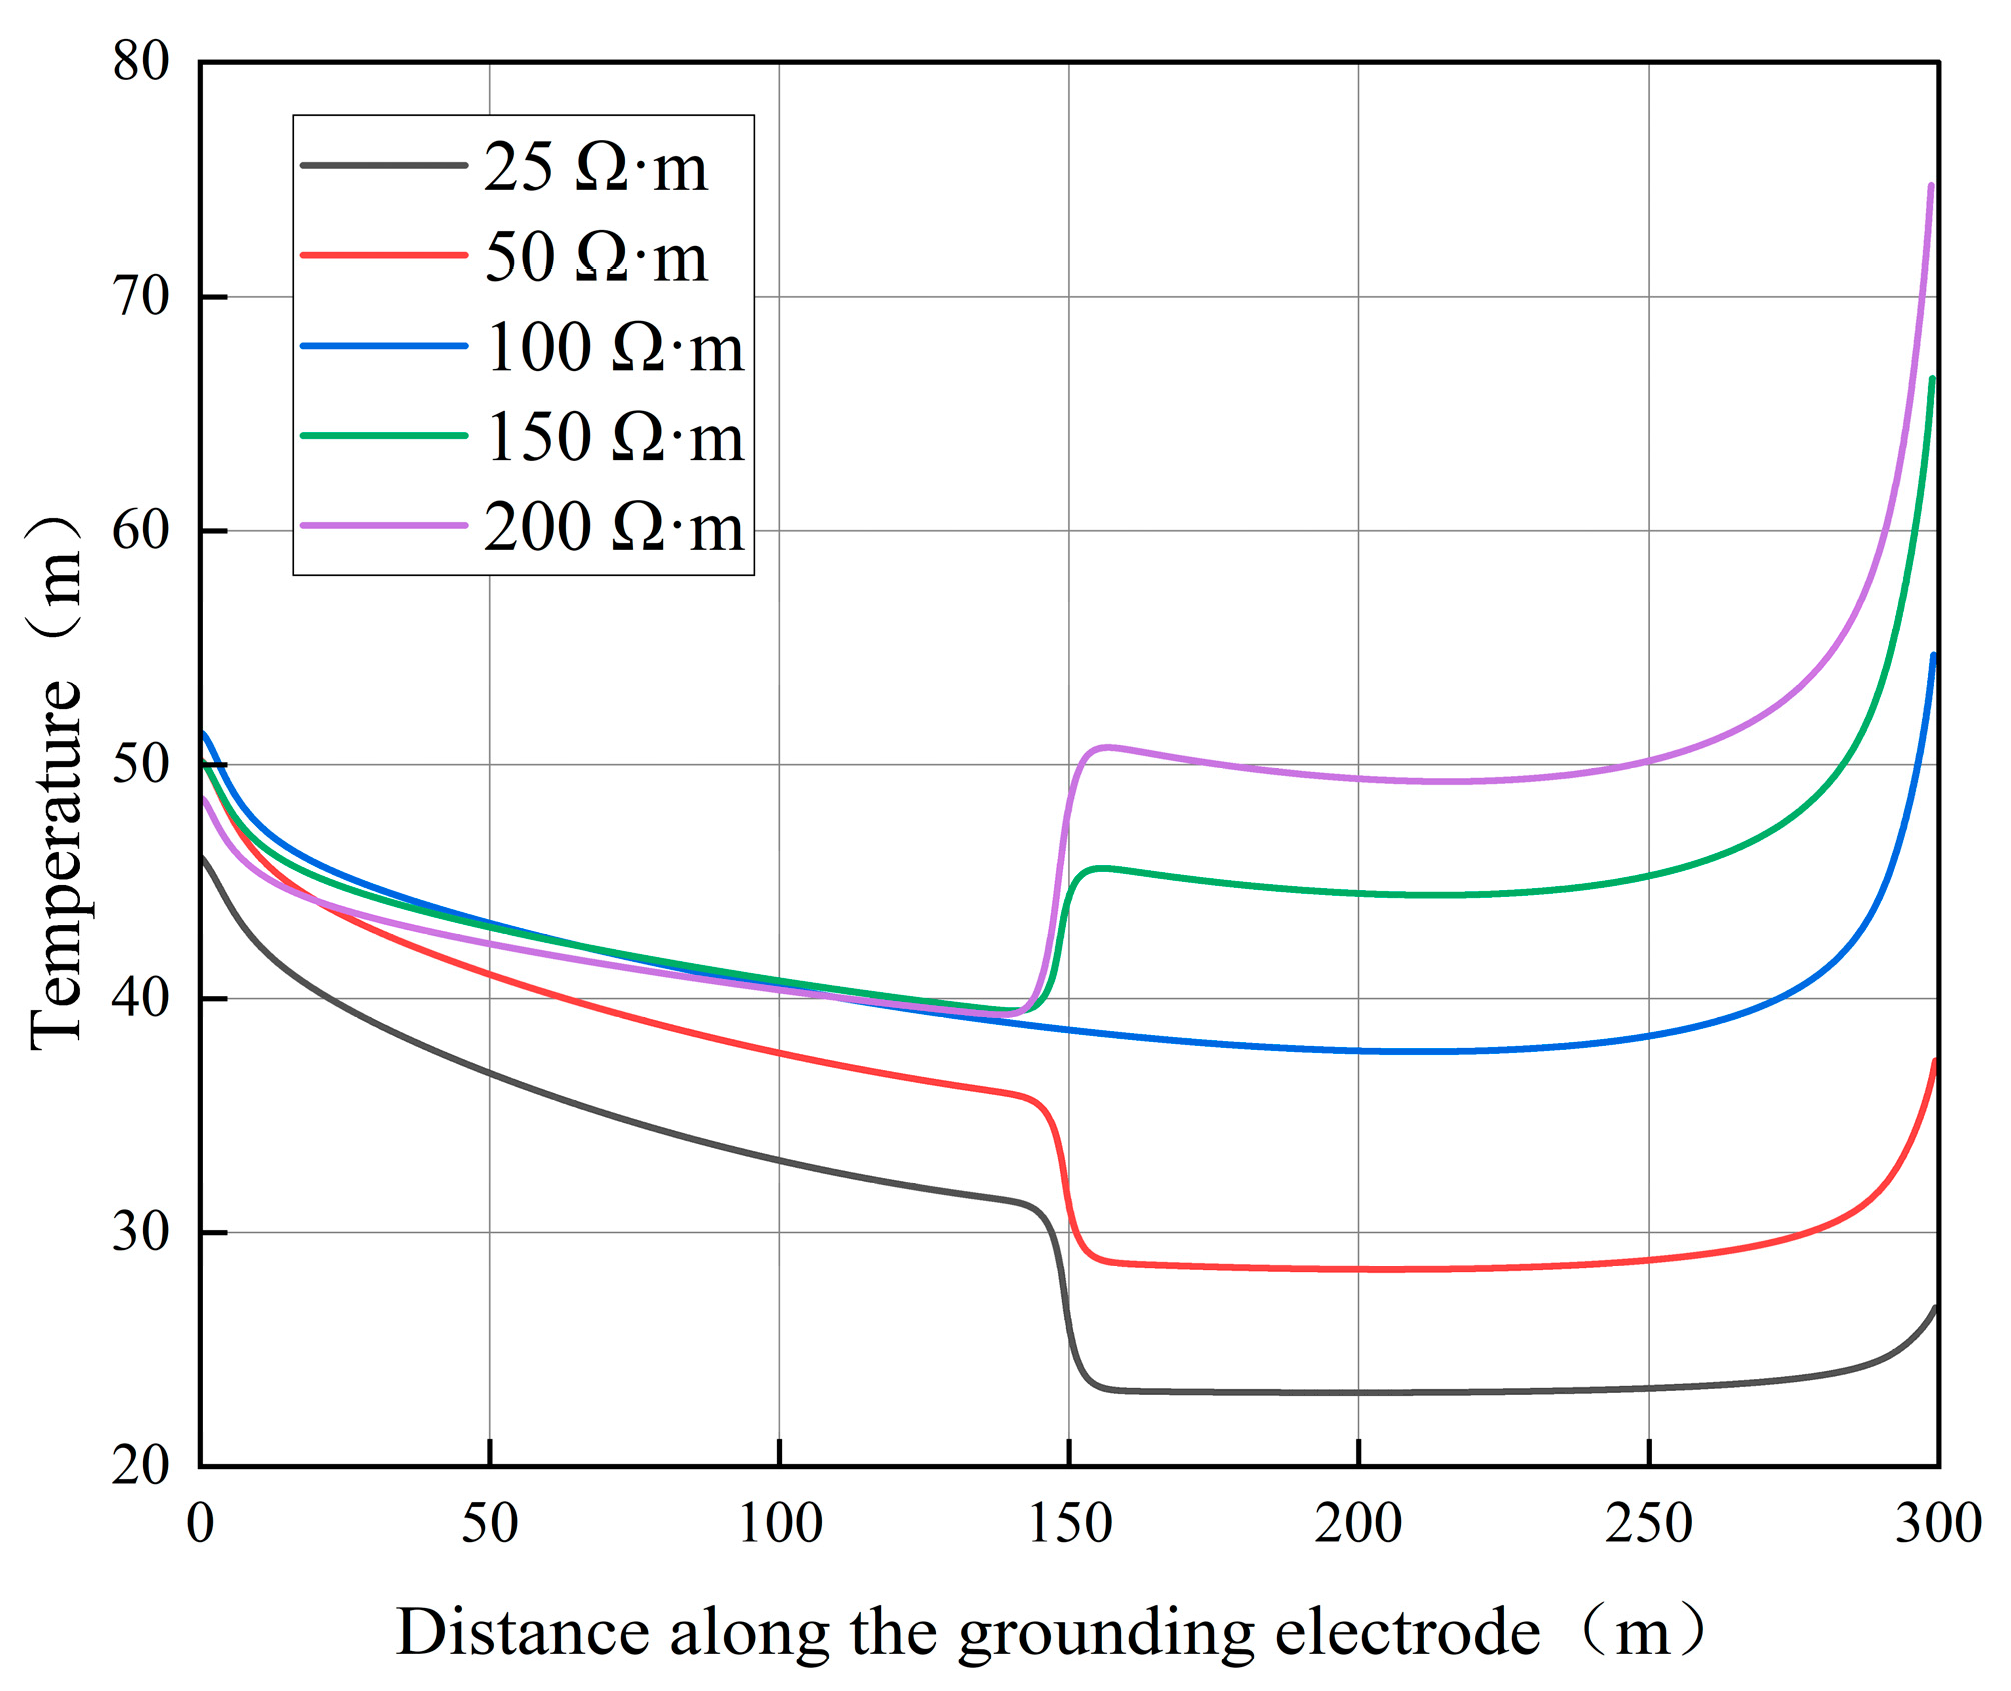
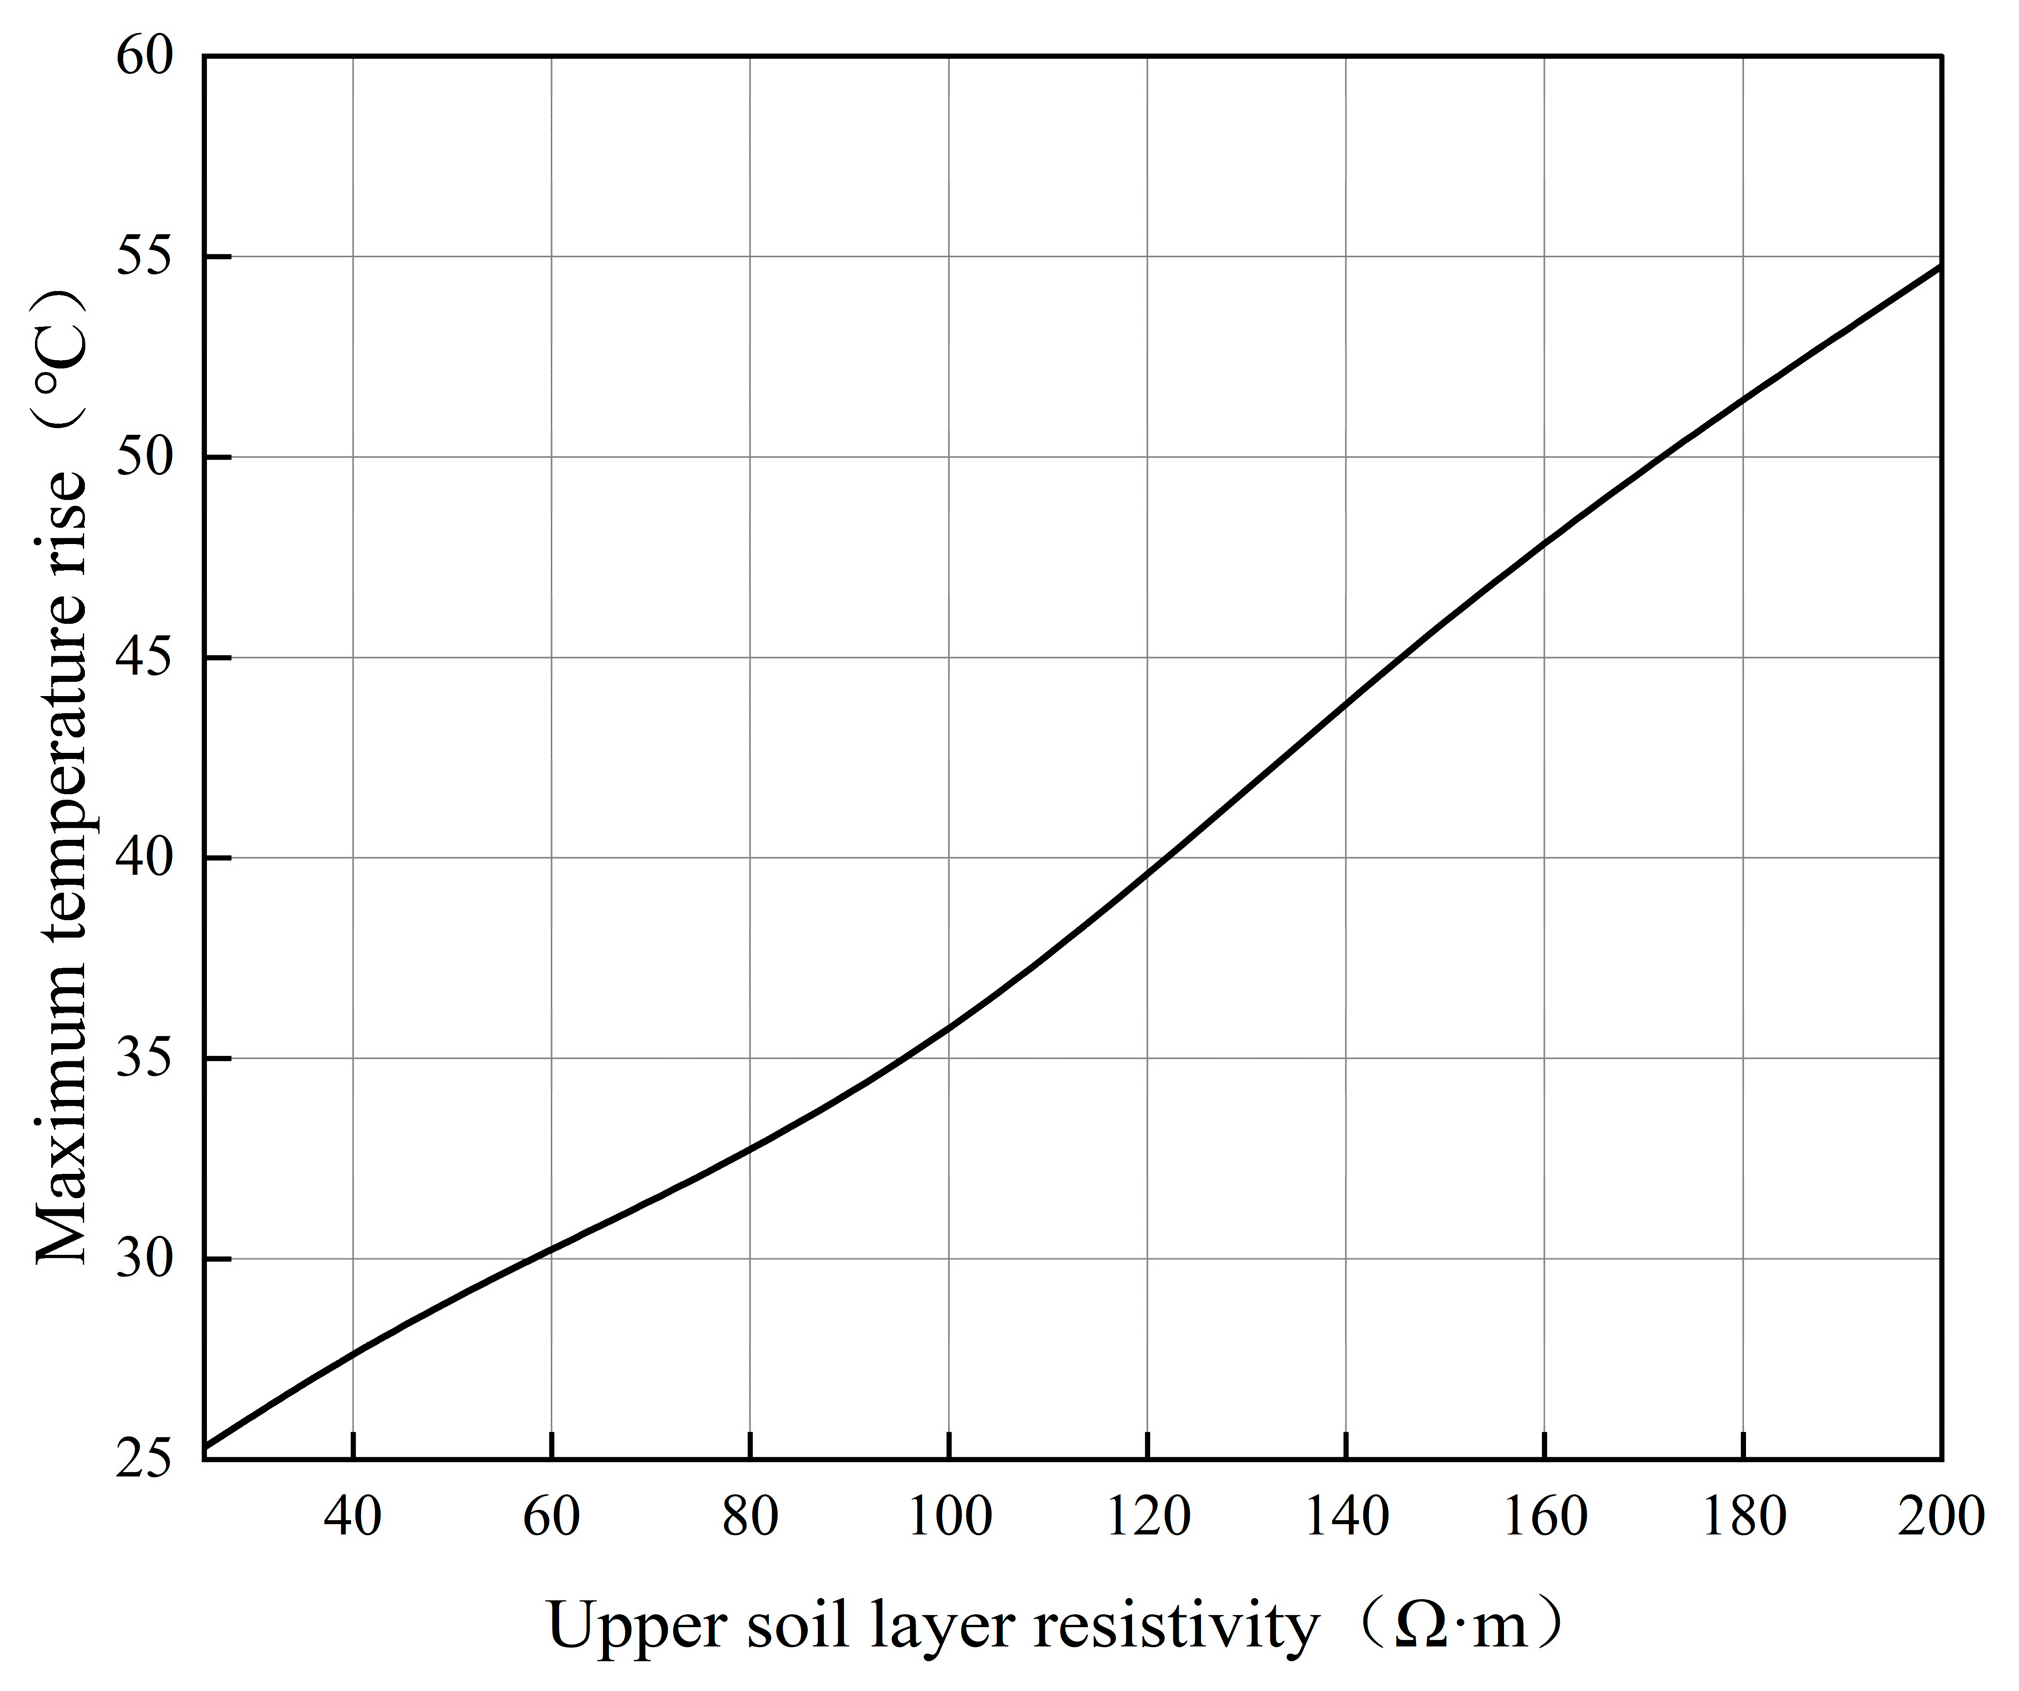
Soil properties vary significantly across different regions; the resistivity of clay in plain wetlands can be below 10 Ω·m, whereas the resistivity in rocky mountainous areas can reach 5000 Ω·m or higher. Therefore, to comprehensively analyze the impact of soil resistivity at the grounding site, it is essential to select appropriate soil resistivity values. With the soil thermal conductivity and specific heat capacity in the model set according to Table 1 and Table 2, the soil resistivity is varied among 25 Ω·m, 50 Ω·m, 100 Ω·m, 150 Ω·m, and 200 Ω·m. The calculated temperature rises at the ends and the middle of the vertical grounding electrode during normal operation are shown in Figure 11. The temperature distribution along the length of the electrode is illustrated in Figure 12. As the soil resistivity gradually increases from 25 Ω·m to 200 Ω·m, the calculated variation of the maximum temperature rise of the grounding electrode during normal operation with respect to soil resistivity is presented in Figure 13.
As observed in Figure 11 and Figure 12, the temperature rise of the vertical grounding electrode exhibits a consistent variation trend. With the increase in soil resistivity, the temperature rise at various parts of the electrode increases, and the temperature distribution along the length of the electrode becomes more uneven, indicating a more severe end effect. When the soil resistivity is 25 Ω·m, the difference between the maximum and minimum temperatures of the grounding electrode is 12.2 °C. However, when the soil resistivity is 200 Ω·m, this temperature difference reaches 29.2 °C, showing an increase of 17 °C between the two scenarios. It can be concluded that an increase in soil resistivity not only further elevates the temperature rise of the grounding electrode but also exacerbates its end effect.
As shown in Figure 13, the maximum temperature rise of the grounding electrode shows a significant positive correlation with soil resistivity, exhibiting an approximately linear relationship with a rapid growth rate. Under the geological condition with a resistivity of 200 Ω·m, the maximum temperature of the vertical grounding electrode surges to 81.12 °C after 180 days, which is 46.11 °C higher than that at a resistivity of 25 Ω·m. When the temperature in the high-resistivity soil exceeds 80 °C, the temperature rise accelerates because the severe loss of moisture turns the surrounding soil into a thermal insulator. Although the specific multiphase behavior near 100 °C is un-modeled, approaching this temperature acts as a critical thermal runaway threshold. In actual engineering practice, reaching this near-boiling regime strongly implies a high-risk state of thermal failure for the grounding electrode.
As shown in Table 4, with the increase in soil resistivity, both the grounding resistance and the maximum step voltage of the grounding electrode increase. This is because higher soil resistivity corresponds to poorer electrical conductivity of the soil medium. When the injected current remains constant, the current experiences drastically increased resistance as it dissipates outward through the poorly conducting soil, which inevitably leads to a higher grounding resistance. Moreover, the electric field intensity in the surrounding soil increases proportionally, resulting in a steeper surface potential distribution. Consequently, the potential difference between two adjacent points near the grounding electrode increases significantly, leading to an elevated maximum step voltage. Furthermore, the calculated maximum step voltages did not exceed the standard permissible threshold, thereby ensuring operational safety. Meanwhile, the average current dissipation density remains unchanged. This is due to the fact that both the dissipation area and the injected current are constant; therefore, the average current dissipation density flowing from the electrode surface inevitably remains constant.

3.1.2. Thermal Conductivity

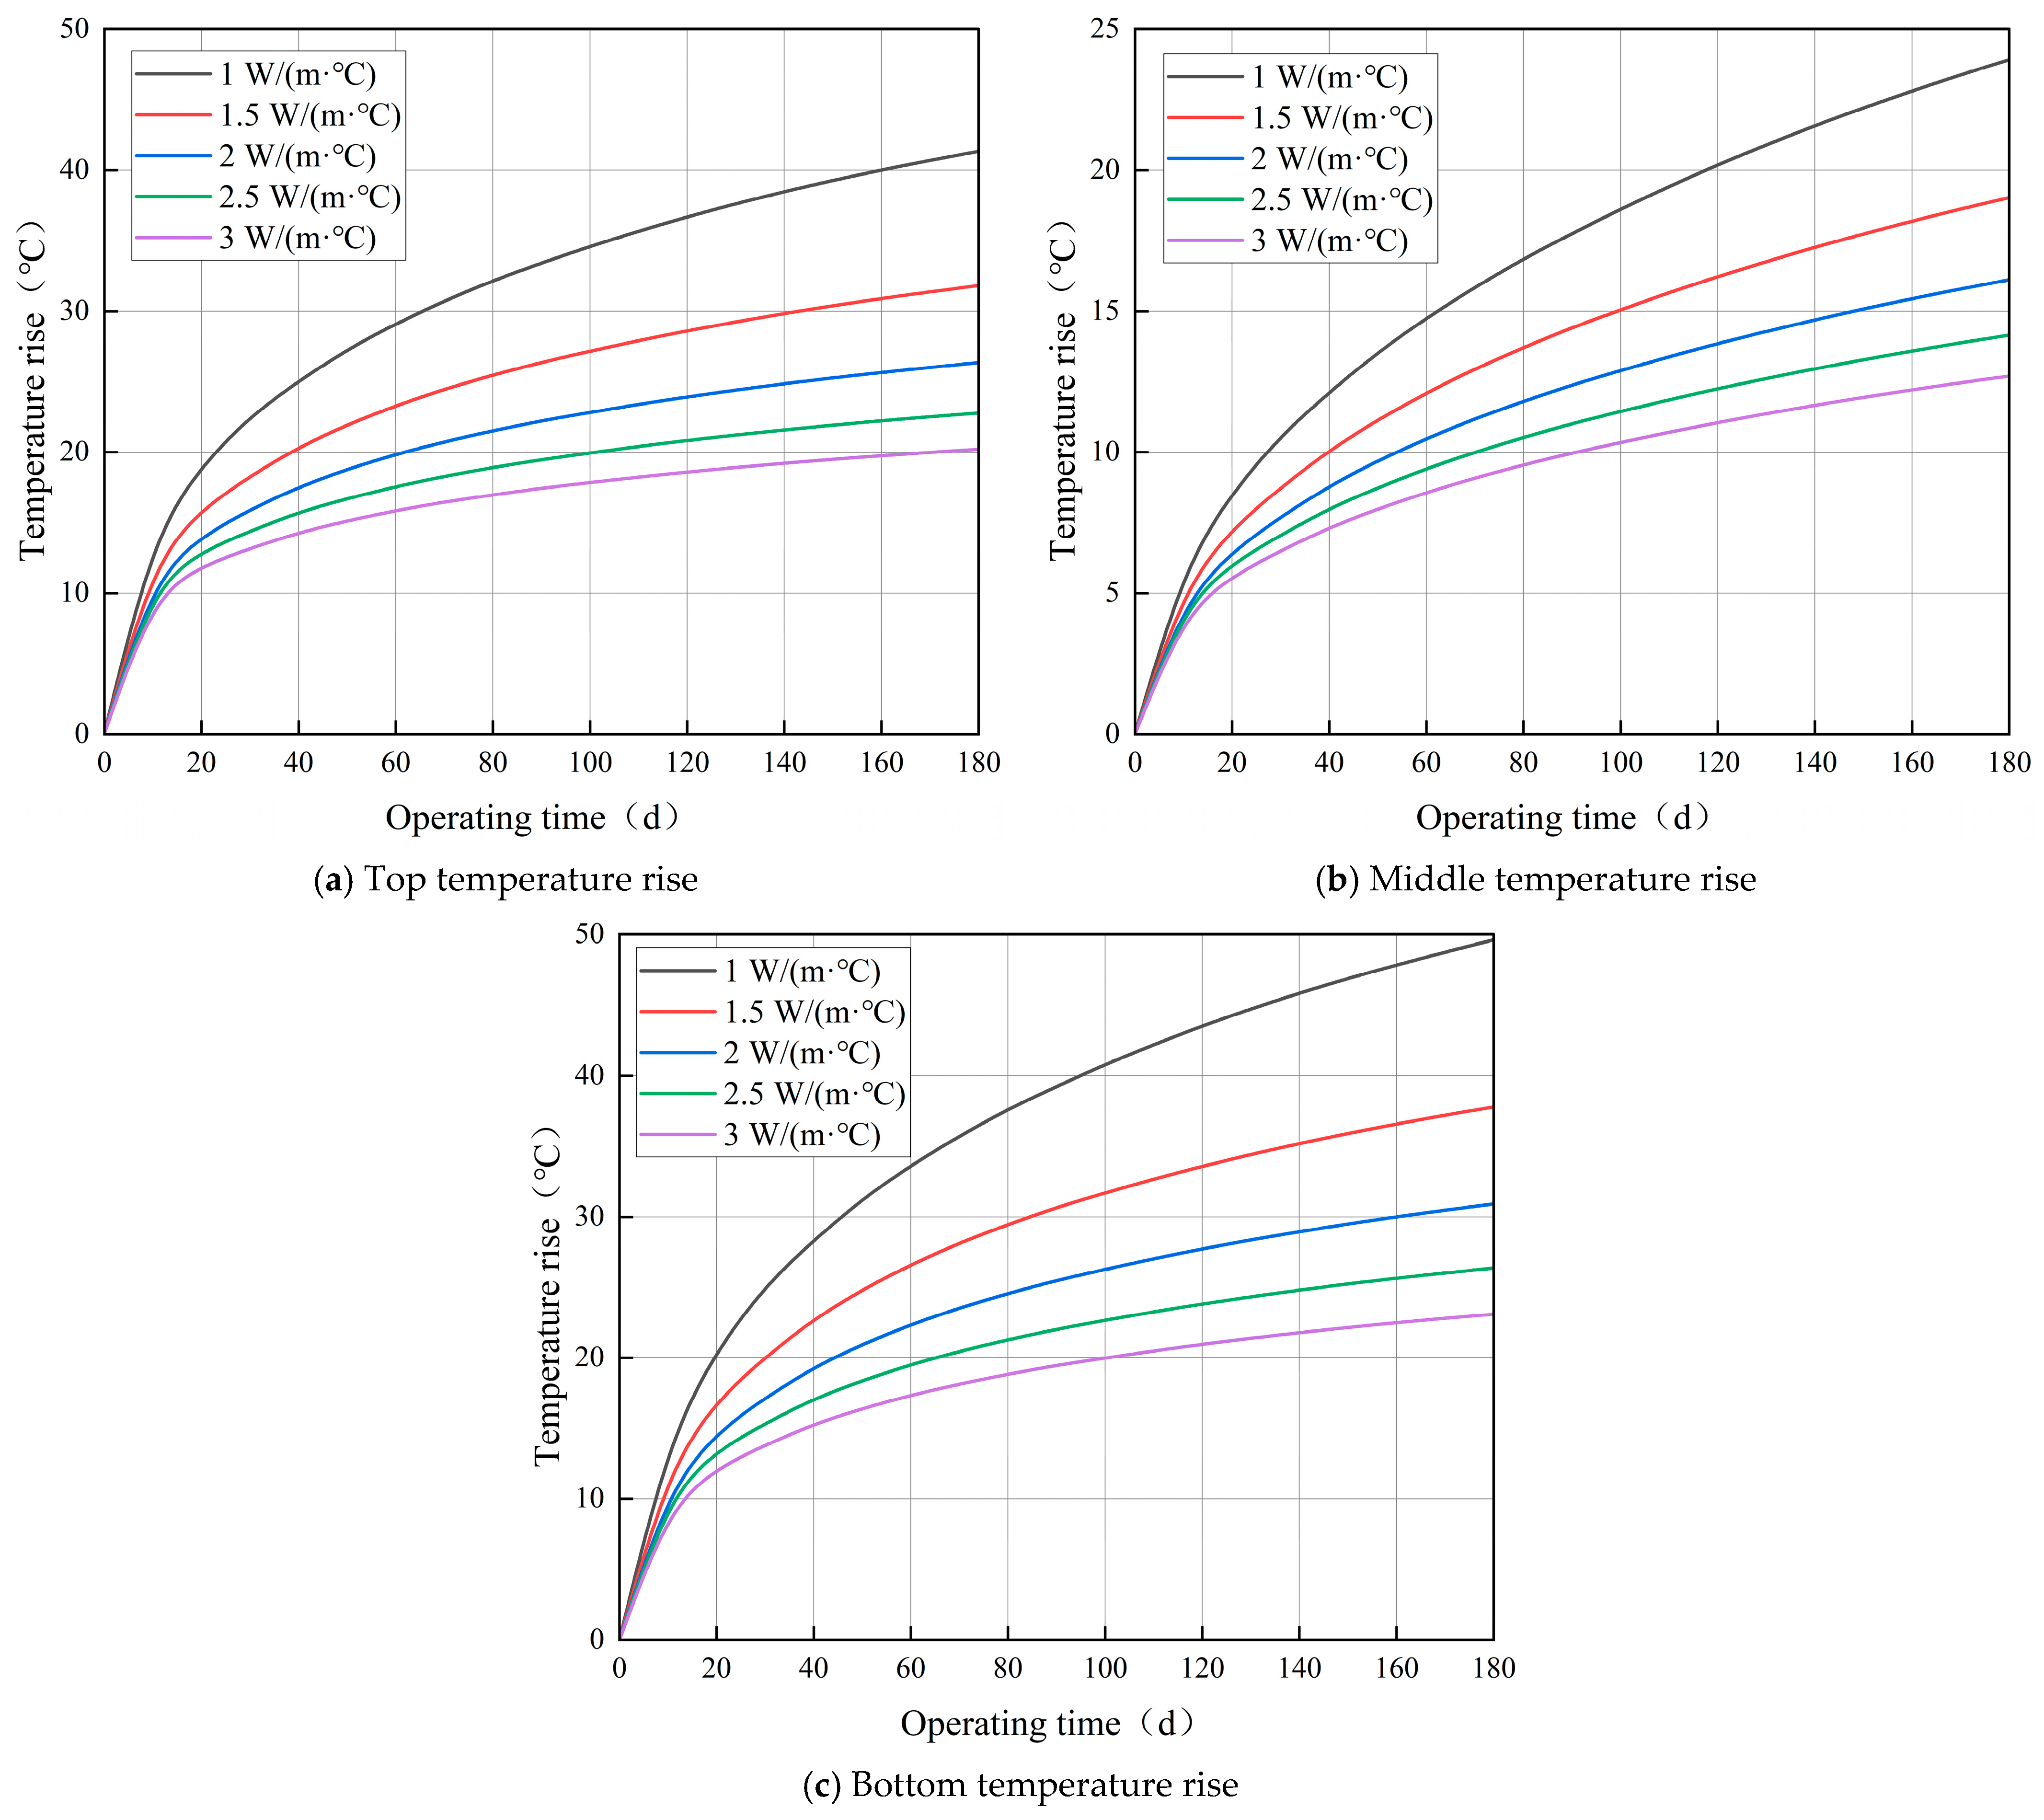
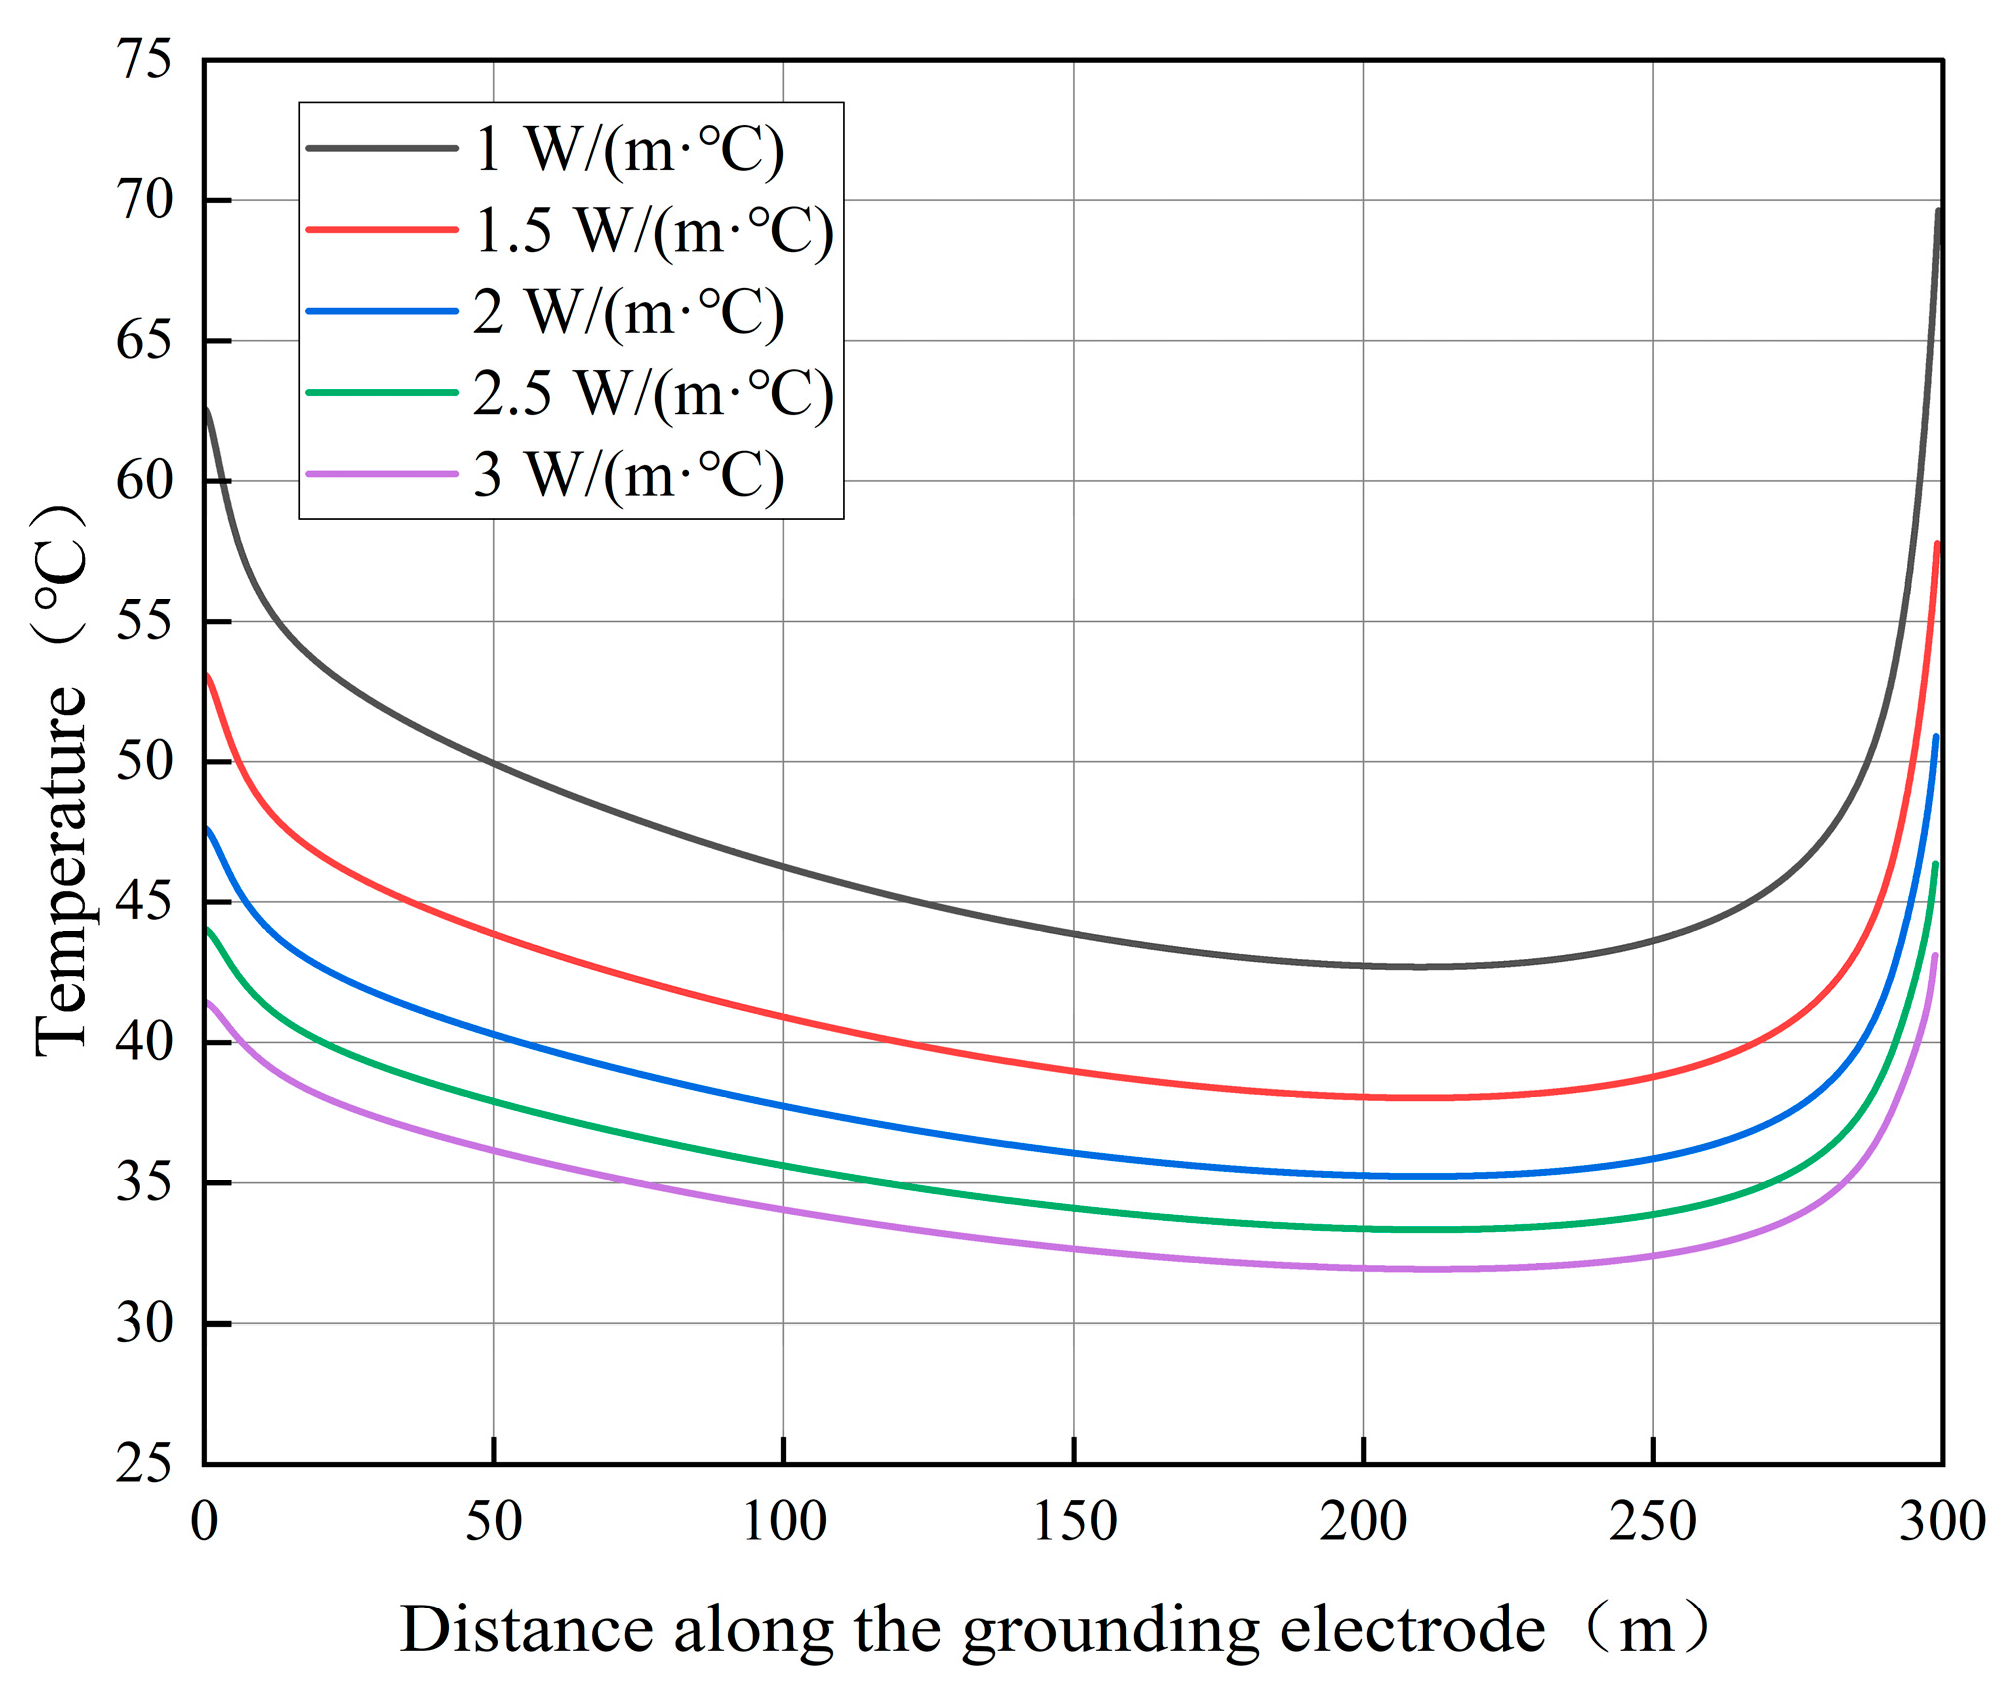
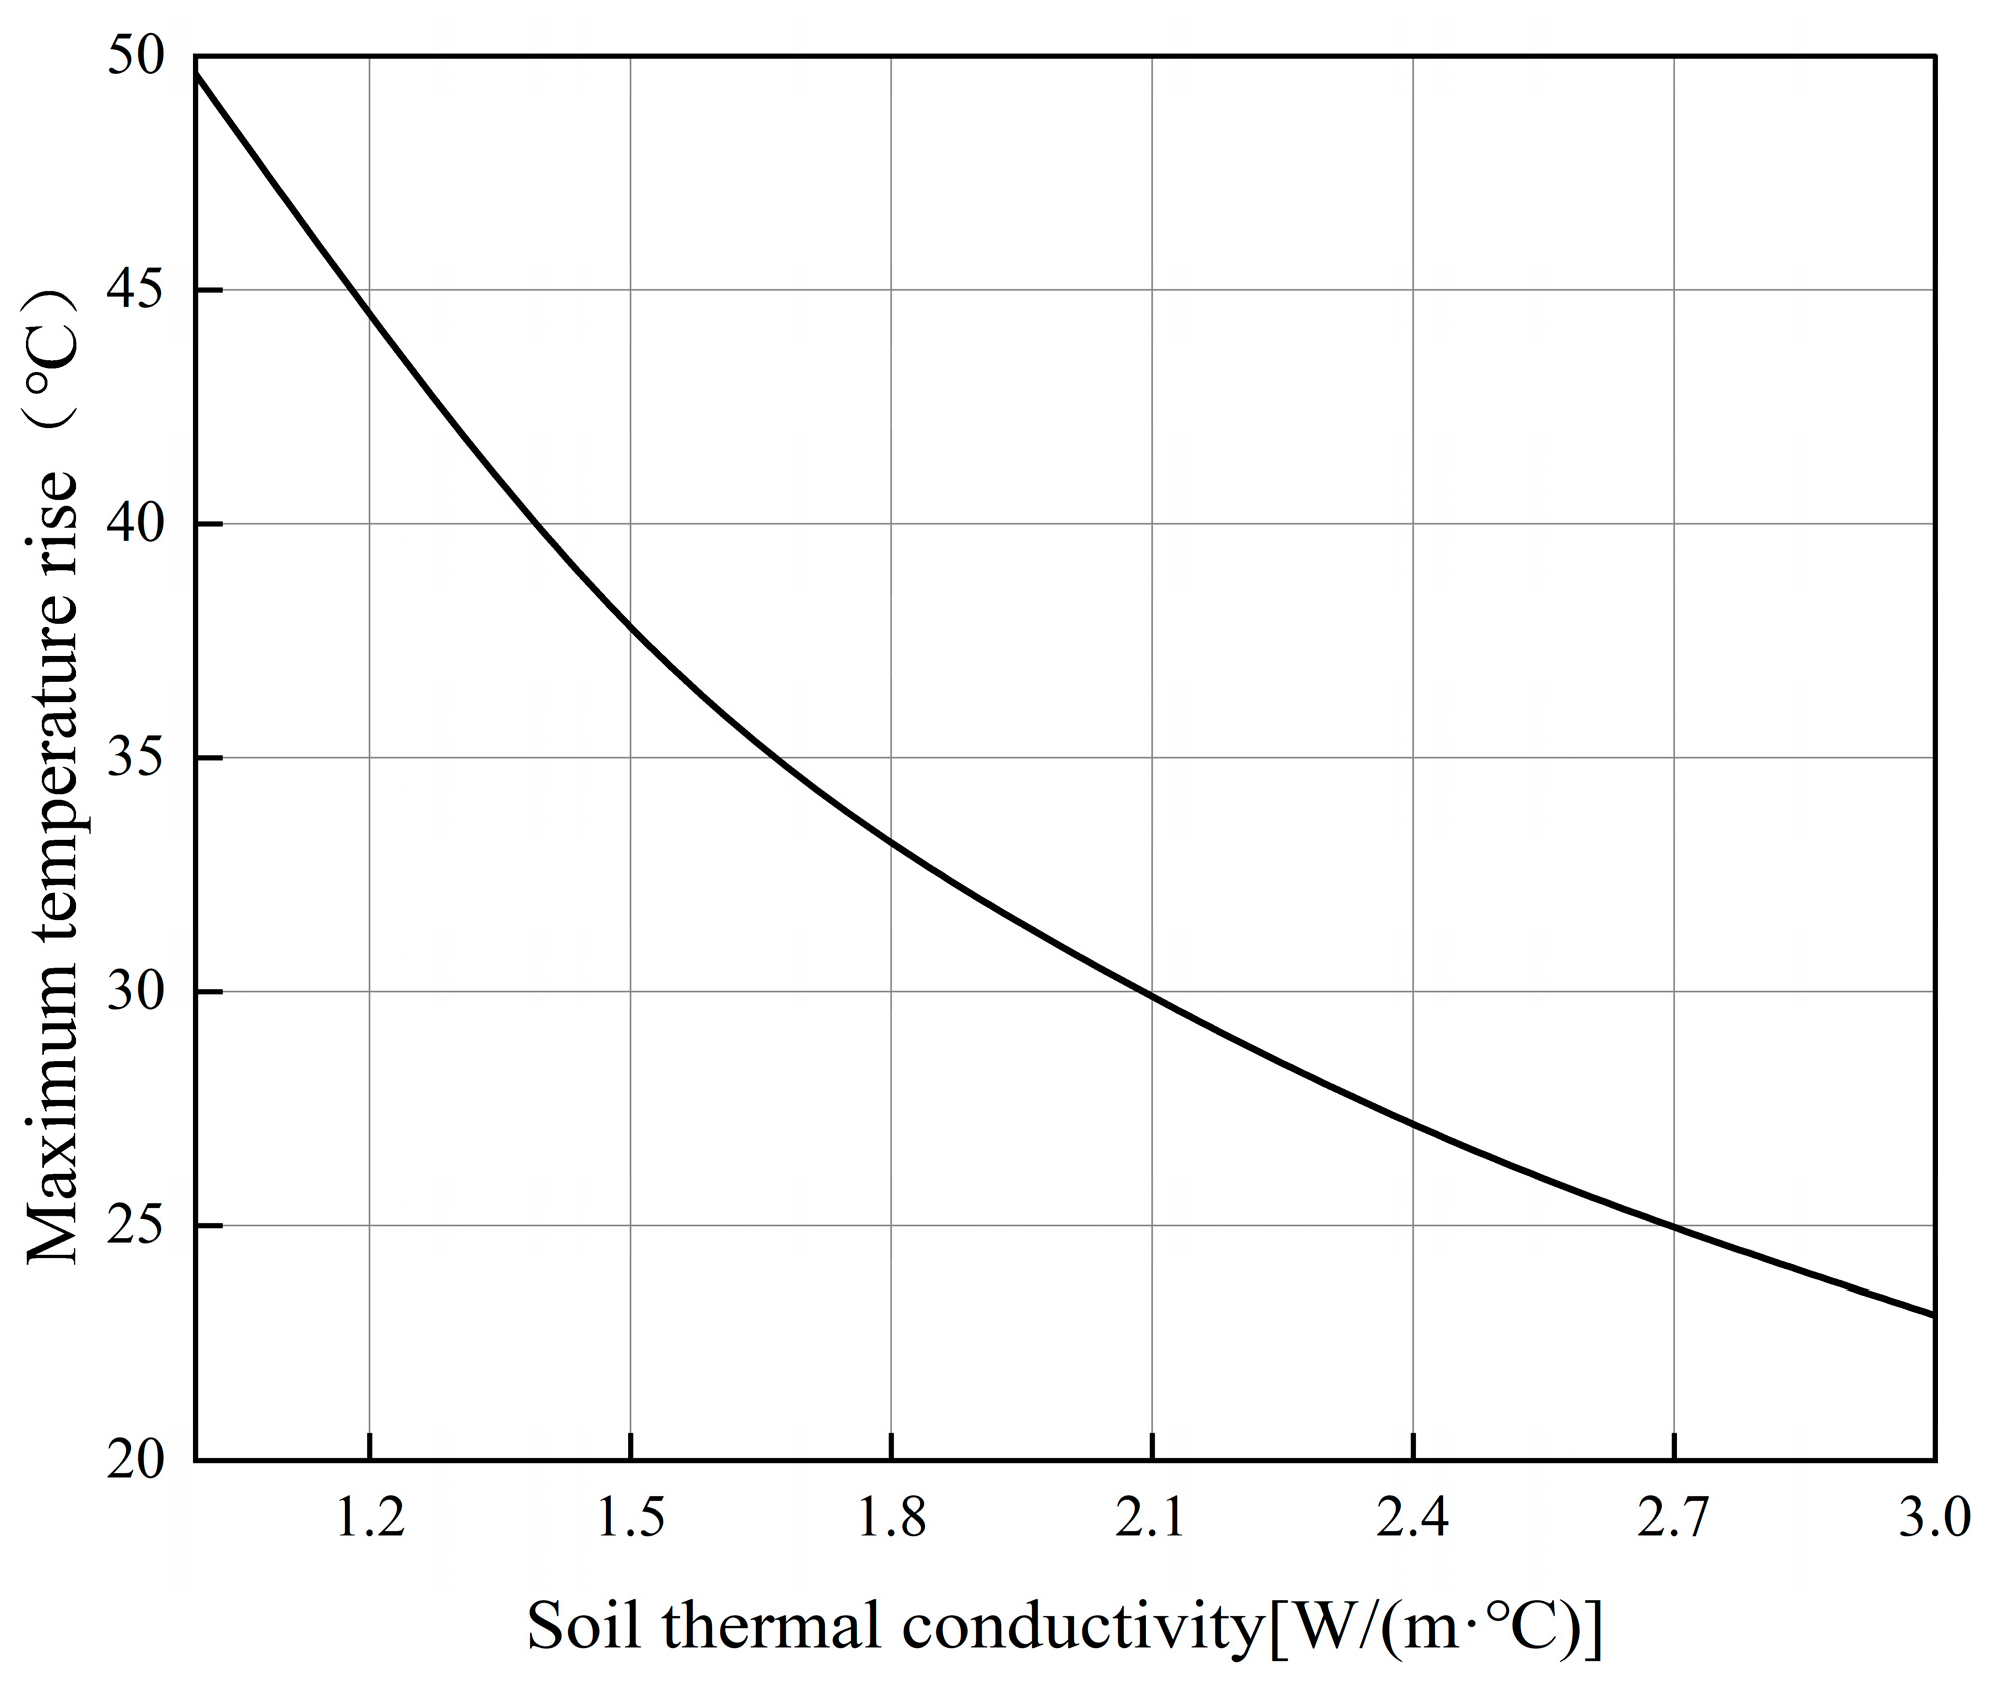
Thermal conductivity determines the capability of Joule heat to conduct and dissipate into the soil surrounding the grounding electrode [26,27]. With the soil resistivity and specific heat capacity set according to Table 1 and Table 2, the soil thermal conductivity is varied among 1 W/(m·°C), 1.5 W/(m·°C), 2 W/(m·°C), 2.5 W/(m·°C), and 3 W/(m·°C). The calculated temperature rises at the ends and the middle of the vertical grounding electrode during normal operation are shown in Figure 14. The temperature distribution along the length of the electrode is illustrated in Figure 15. As the thermal conductivity gradually increases from 1 W/(m·°C) to 3 W/(m·°C), the calculated variation of the maximum temperature rise during normal operation with respect to soil thermal conductivity is presented in Figure 16.
As observed in Figure 14 and Figure 15, with the increase in soil thermal conductivity, the temperature rise at various parts of the vertical grounding electrode decreases, and the temperature distribution along the length of the electrode is significantly improved. The end effect is also mitigated. Specifically, when the thermal conductivity is 1 W/(m·°C), the difference between the maximum and minimum temperatures of the grounding electrode is 26.9 °C; however, when it increases to 3 W/(m·°C), this difference reduces to only 11.1 °C. Notably, as the thermal conductivity continues to increase, the cooling benefit gradually diminishes.
As shown in Figure 16, the maximum temperature rise of the grounding electrode is negatively correlated with the soil thermal conductivity. When the thermal conductivity increases from 1 W/(m·°C) to 3 W/(m·°C), the maximum temperature rise drops by 26.5 °C. Furthermore, higher thermal conductivity enables heat to spread over a wider range, causing the radial temperature gradient to flatten. This implies that superior soil thermal performance can effectively alleviate heat accumulation at the coke-soil interface, preventing rapid soil moisture vaporization caused by local thermal breakdown.
As shown in Table 5, increasing the soil thermal conductivity does not lead to changes in the grounding resistance or the average current dissipation density, while the maximum step voltage exhibits only a marginal variation. This is because, under the conditions of a constant injected current and fixed electrode dimensions, the average current dissipation density inevitably remains constant. Furthermore, although an increase in thermal conductivity reduces the temperature rise of the grounding electrode—subsequently leading to a slight decrease in soil resistivity—this effect is minimal. Consequently, this results in only a slight reduction in the maximum step voltage. Since the impact of these minor fluctuations in soil resistivity on the grounding resistance is even more negligible, the grounding resistance remains virtually unchanged. The calculation results indicate that all maximum step voltages remained strictly below the standard safety threshold.

3.1.3. Specific Heat Capacity

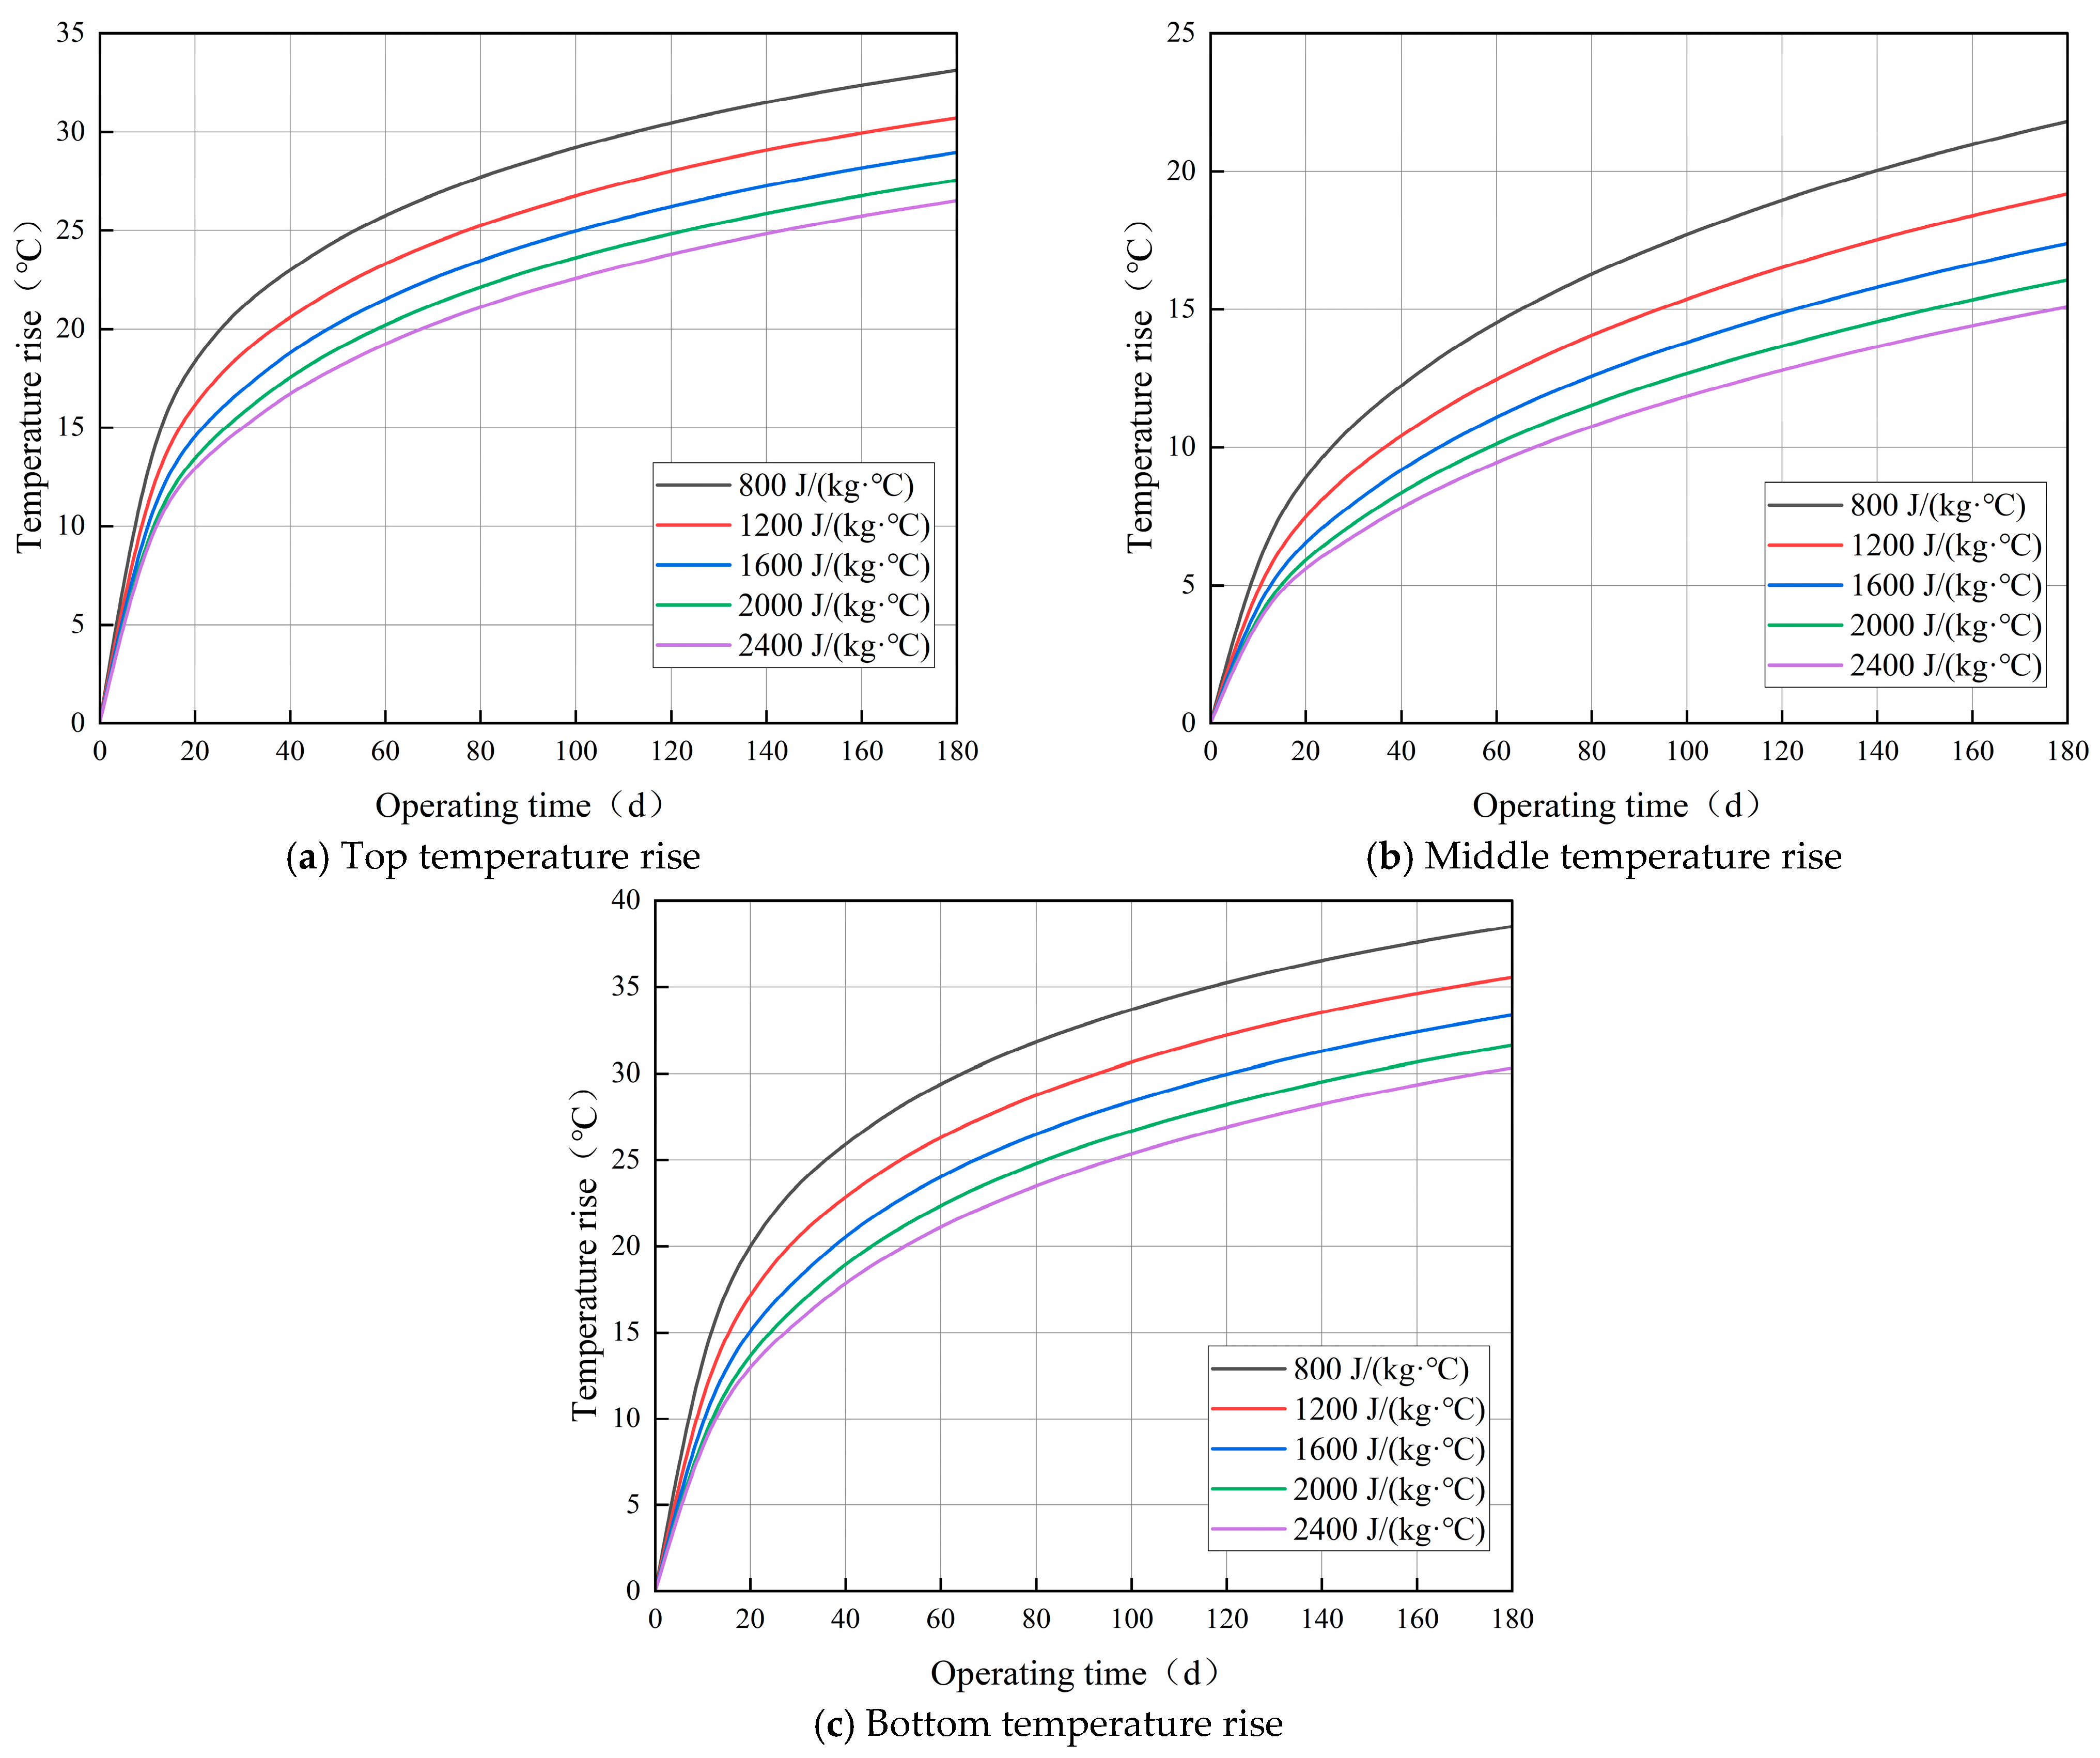
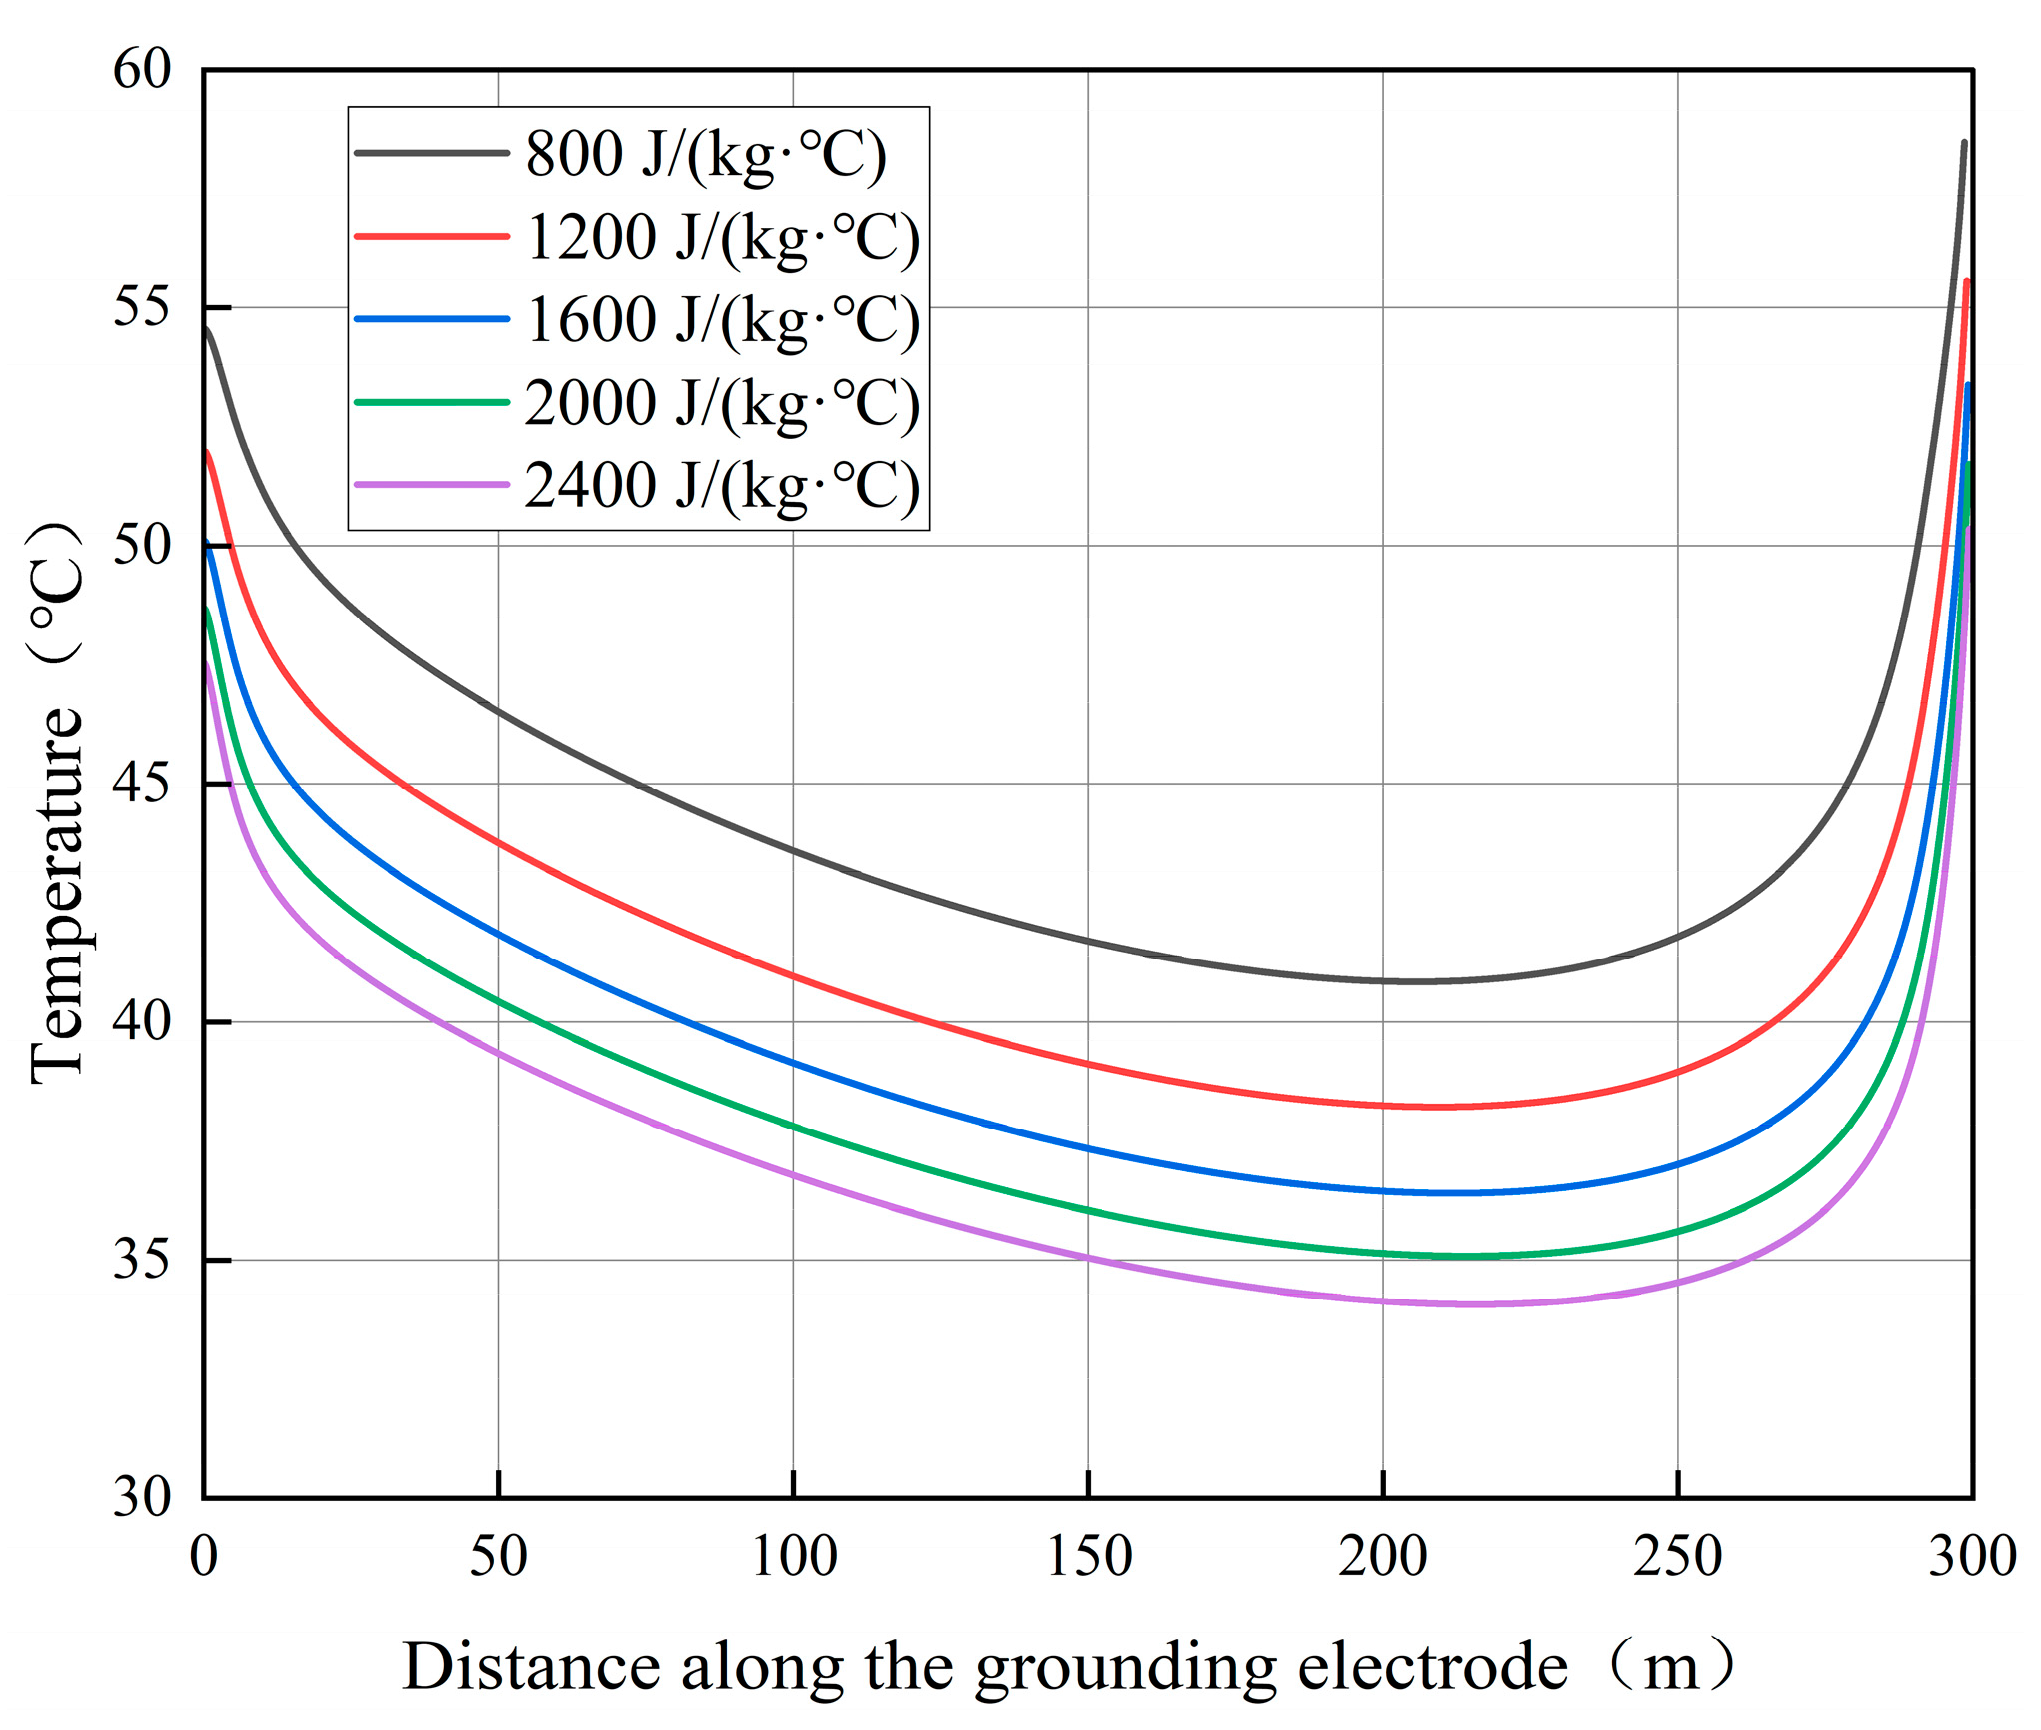
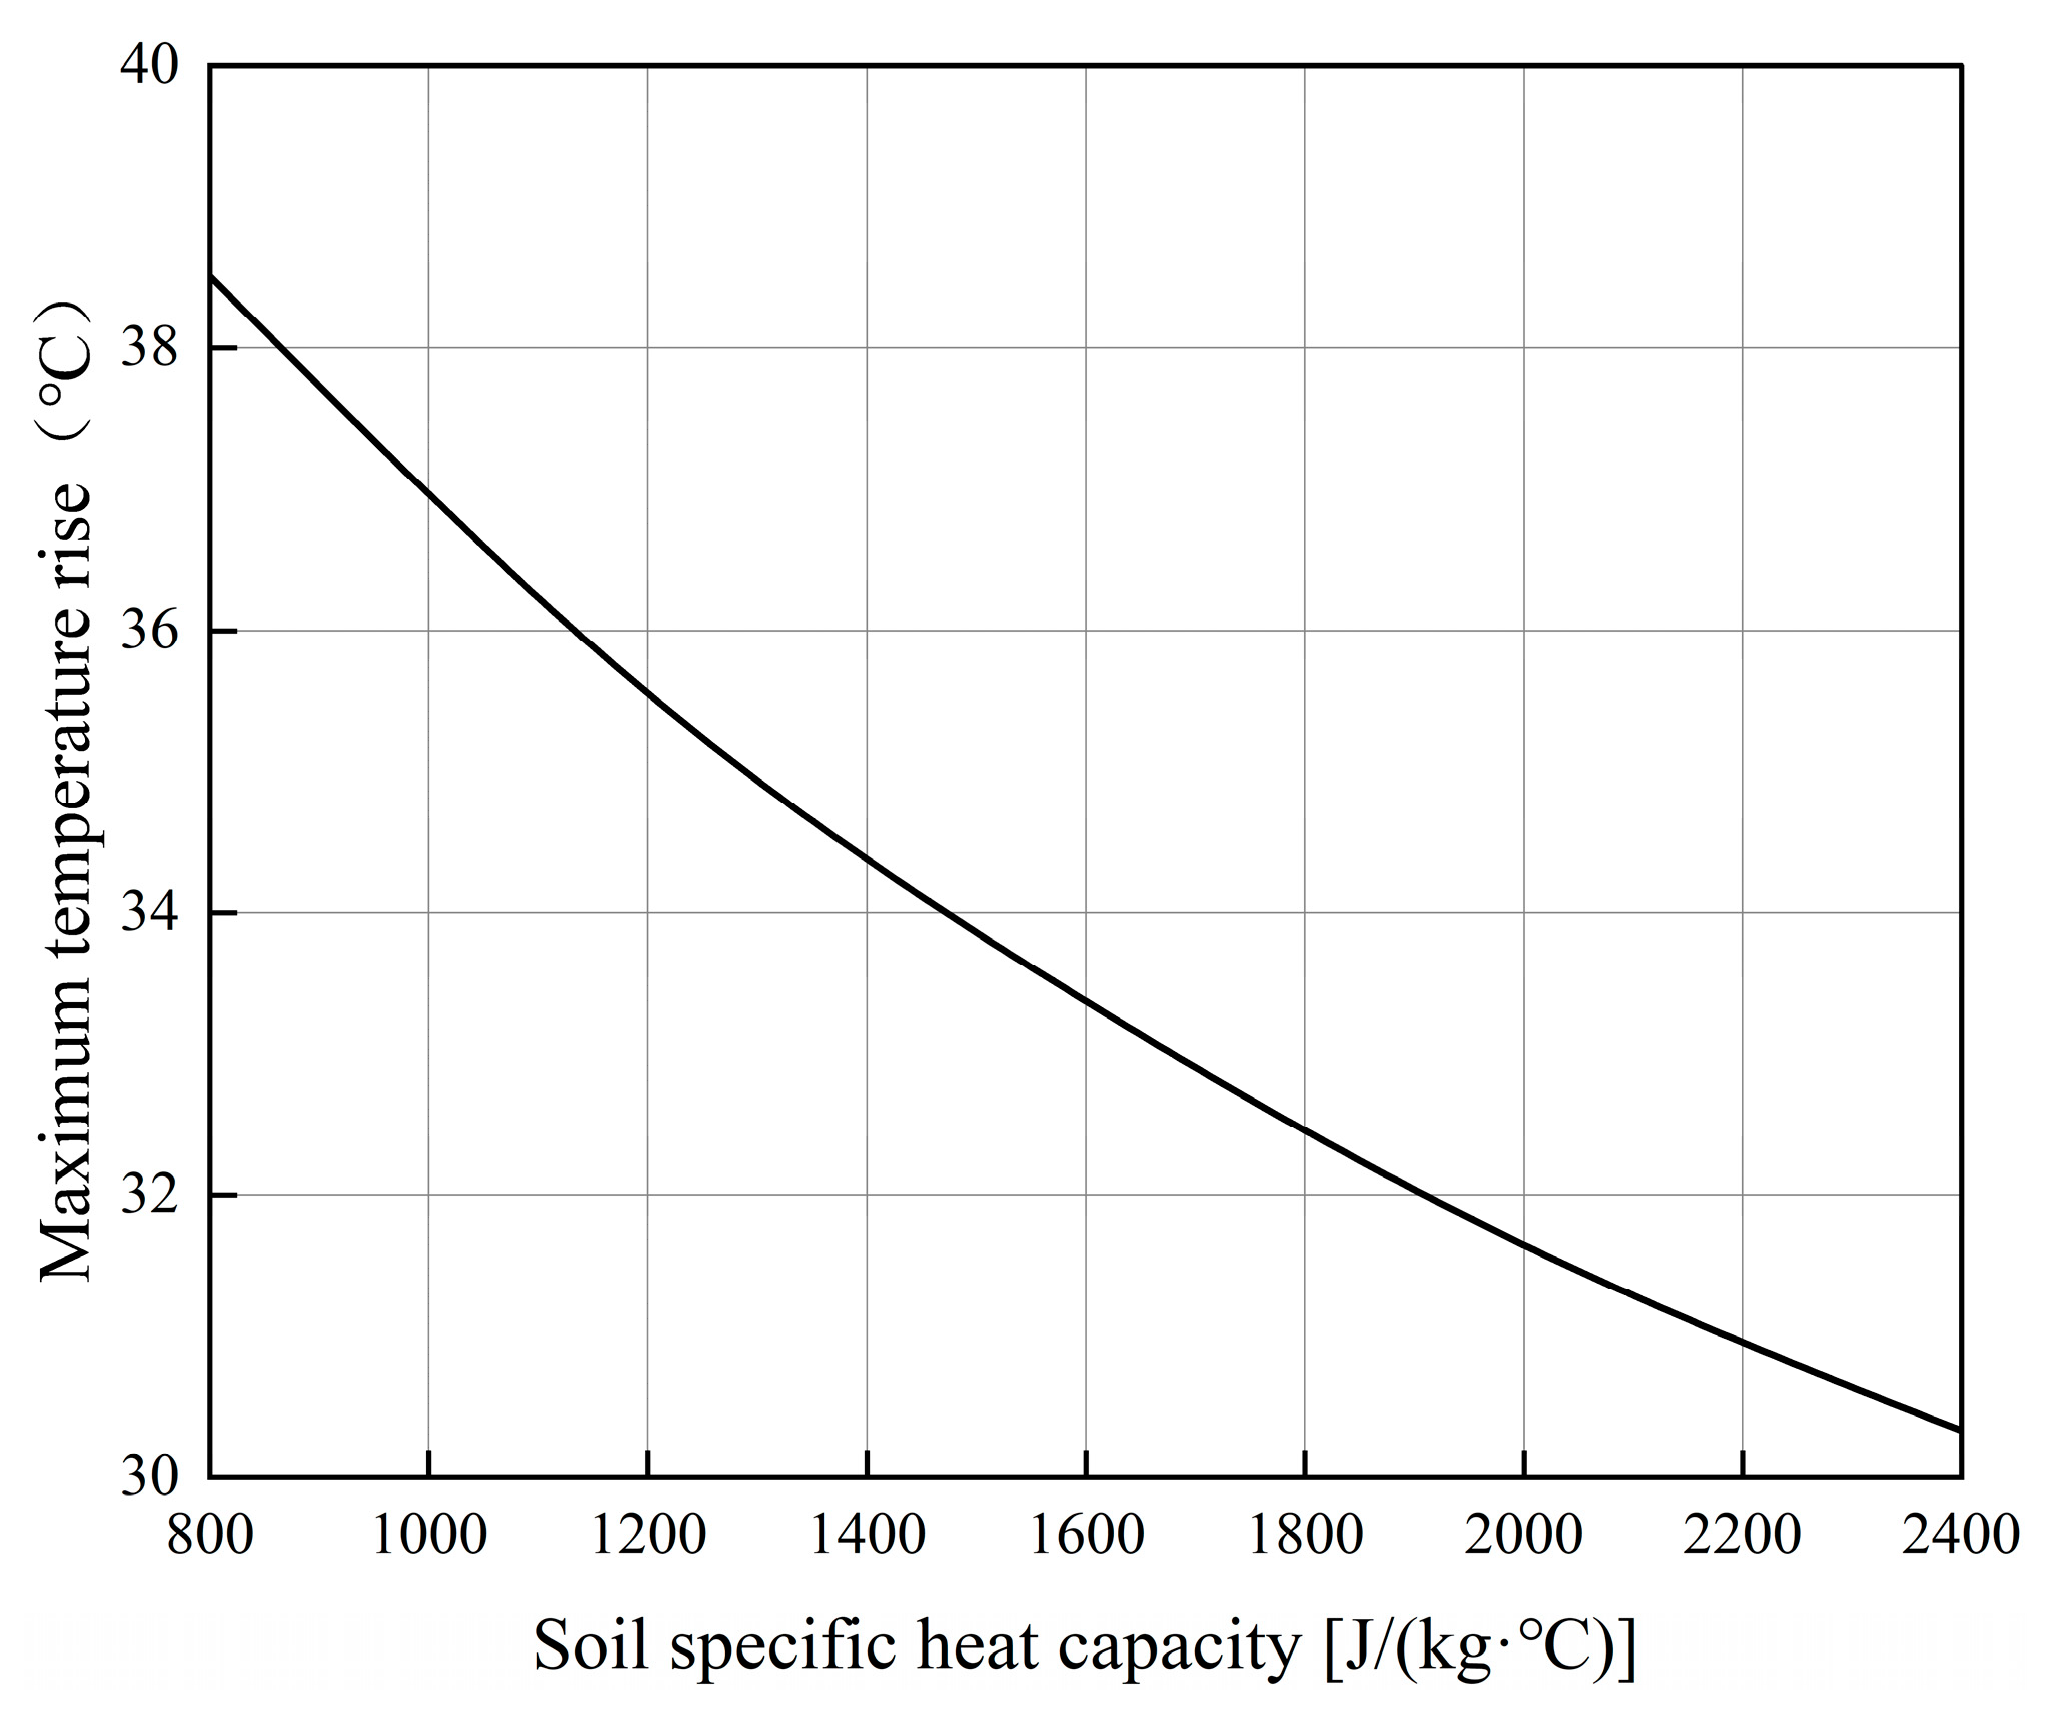
Specific heat capacity is defined as the internal energy absorbed or released by a unit mass of a substance to change its temperature by one unit. With the soil resistivity and thermal conductivity set according to Table 1 and Table 2, the soil specific heat capacity is varied among 800 J/(kg·°C), 1200 J/(kg·°C), 1600 J/(kg·°C), 2000 J/(kg·°C), and 2400 J/(kg·°C). The calculated temperature rises at the ends and the middle of the vertical grounding electrode during normal operation are shown in Figure 17. The temperature distribution along the length of the electrode is illustrated in Figure 18. As the specific heat capacity gradually increases from 800 J/(kg·°C) to 2400 J/(kg·°C), the calculated variation of the maximum temperature rise of the grounding electrode during normal operation with respect to soil specific heat capacity is presented in Figure 19.
As observed in Figure 17 and Figure 18, with the increase in soil specific heat capacity, the temperature rise at various parts of the vertical grounding electrode decreases. However, the temperature distribution along the length of the electrode does not show significant improvement, and the end effect remains severe. When the specific heat capacity is 800 J/(kg·°C), the difference between the maximum and minimum temperatures of the grounding electrode is 17.6 °C. When it increases to 2400 J/(kg·°C), this difference is 16.28 °C, showing a very small change. This indicates that while specific heat capacity can reduce the overall temperature rise, it has limited impact on mitigating the end effect.
As shown in Figure 19, at the final stage when the current flow reaches or approaches a steady state, the differences in the maximum temperature rise of the vertical grounding electrode under various soil specific heat capacities are relatively small. The temperature difference between soil with 800 J/(kg·°C) and 2400 J/(kg·°C) is only 8.18 °C. Compared with the influence of soil thermal conductivity, the effect of soil specific heat capacity is less significant.
As shown in Table 6, increasing the soil-specific heat capacity does not affect the grounding resistance or the average current dissipation density, while the maximum step voltage exhibits only a marginal reduction. As previously mentioned, under the conditions of a constant injected current and fixed electrode dimensions, the average current dissipation density remains constant. Furthermore, while an increase in specific heat capacity lowers the temperature rise of the grounding electrode—thereby slightly reducing the soil resistivity—this impact is minimal. Consequently, it leads to only a slight decrease in the maximum step voltage. Since the effect of these minor fluctuations in soil resistivity on the grounding resistance is even more negligible, the grounding resistance likewise remains virtually unchanged. The calculation results indicate that all maximum step voltages remained strictly below the standard safety threshold.

3.1.4. Coke Cross-Sectional Radius

Grounding electrodes buried in soil for extended periods face severe risks of thermal and electrochemical corrosion. As a widely utilized filler material [28], coke is applied around the grounding electrode to effectively reduce the current dissipation density at the electrode surface through its relatively superior conductivity. This measure not only significantly improves heat dissipation conditions but also provides physical and electrochemical protection, thereby effectively slowing the corrosion rate of the electrode body.
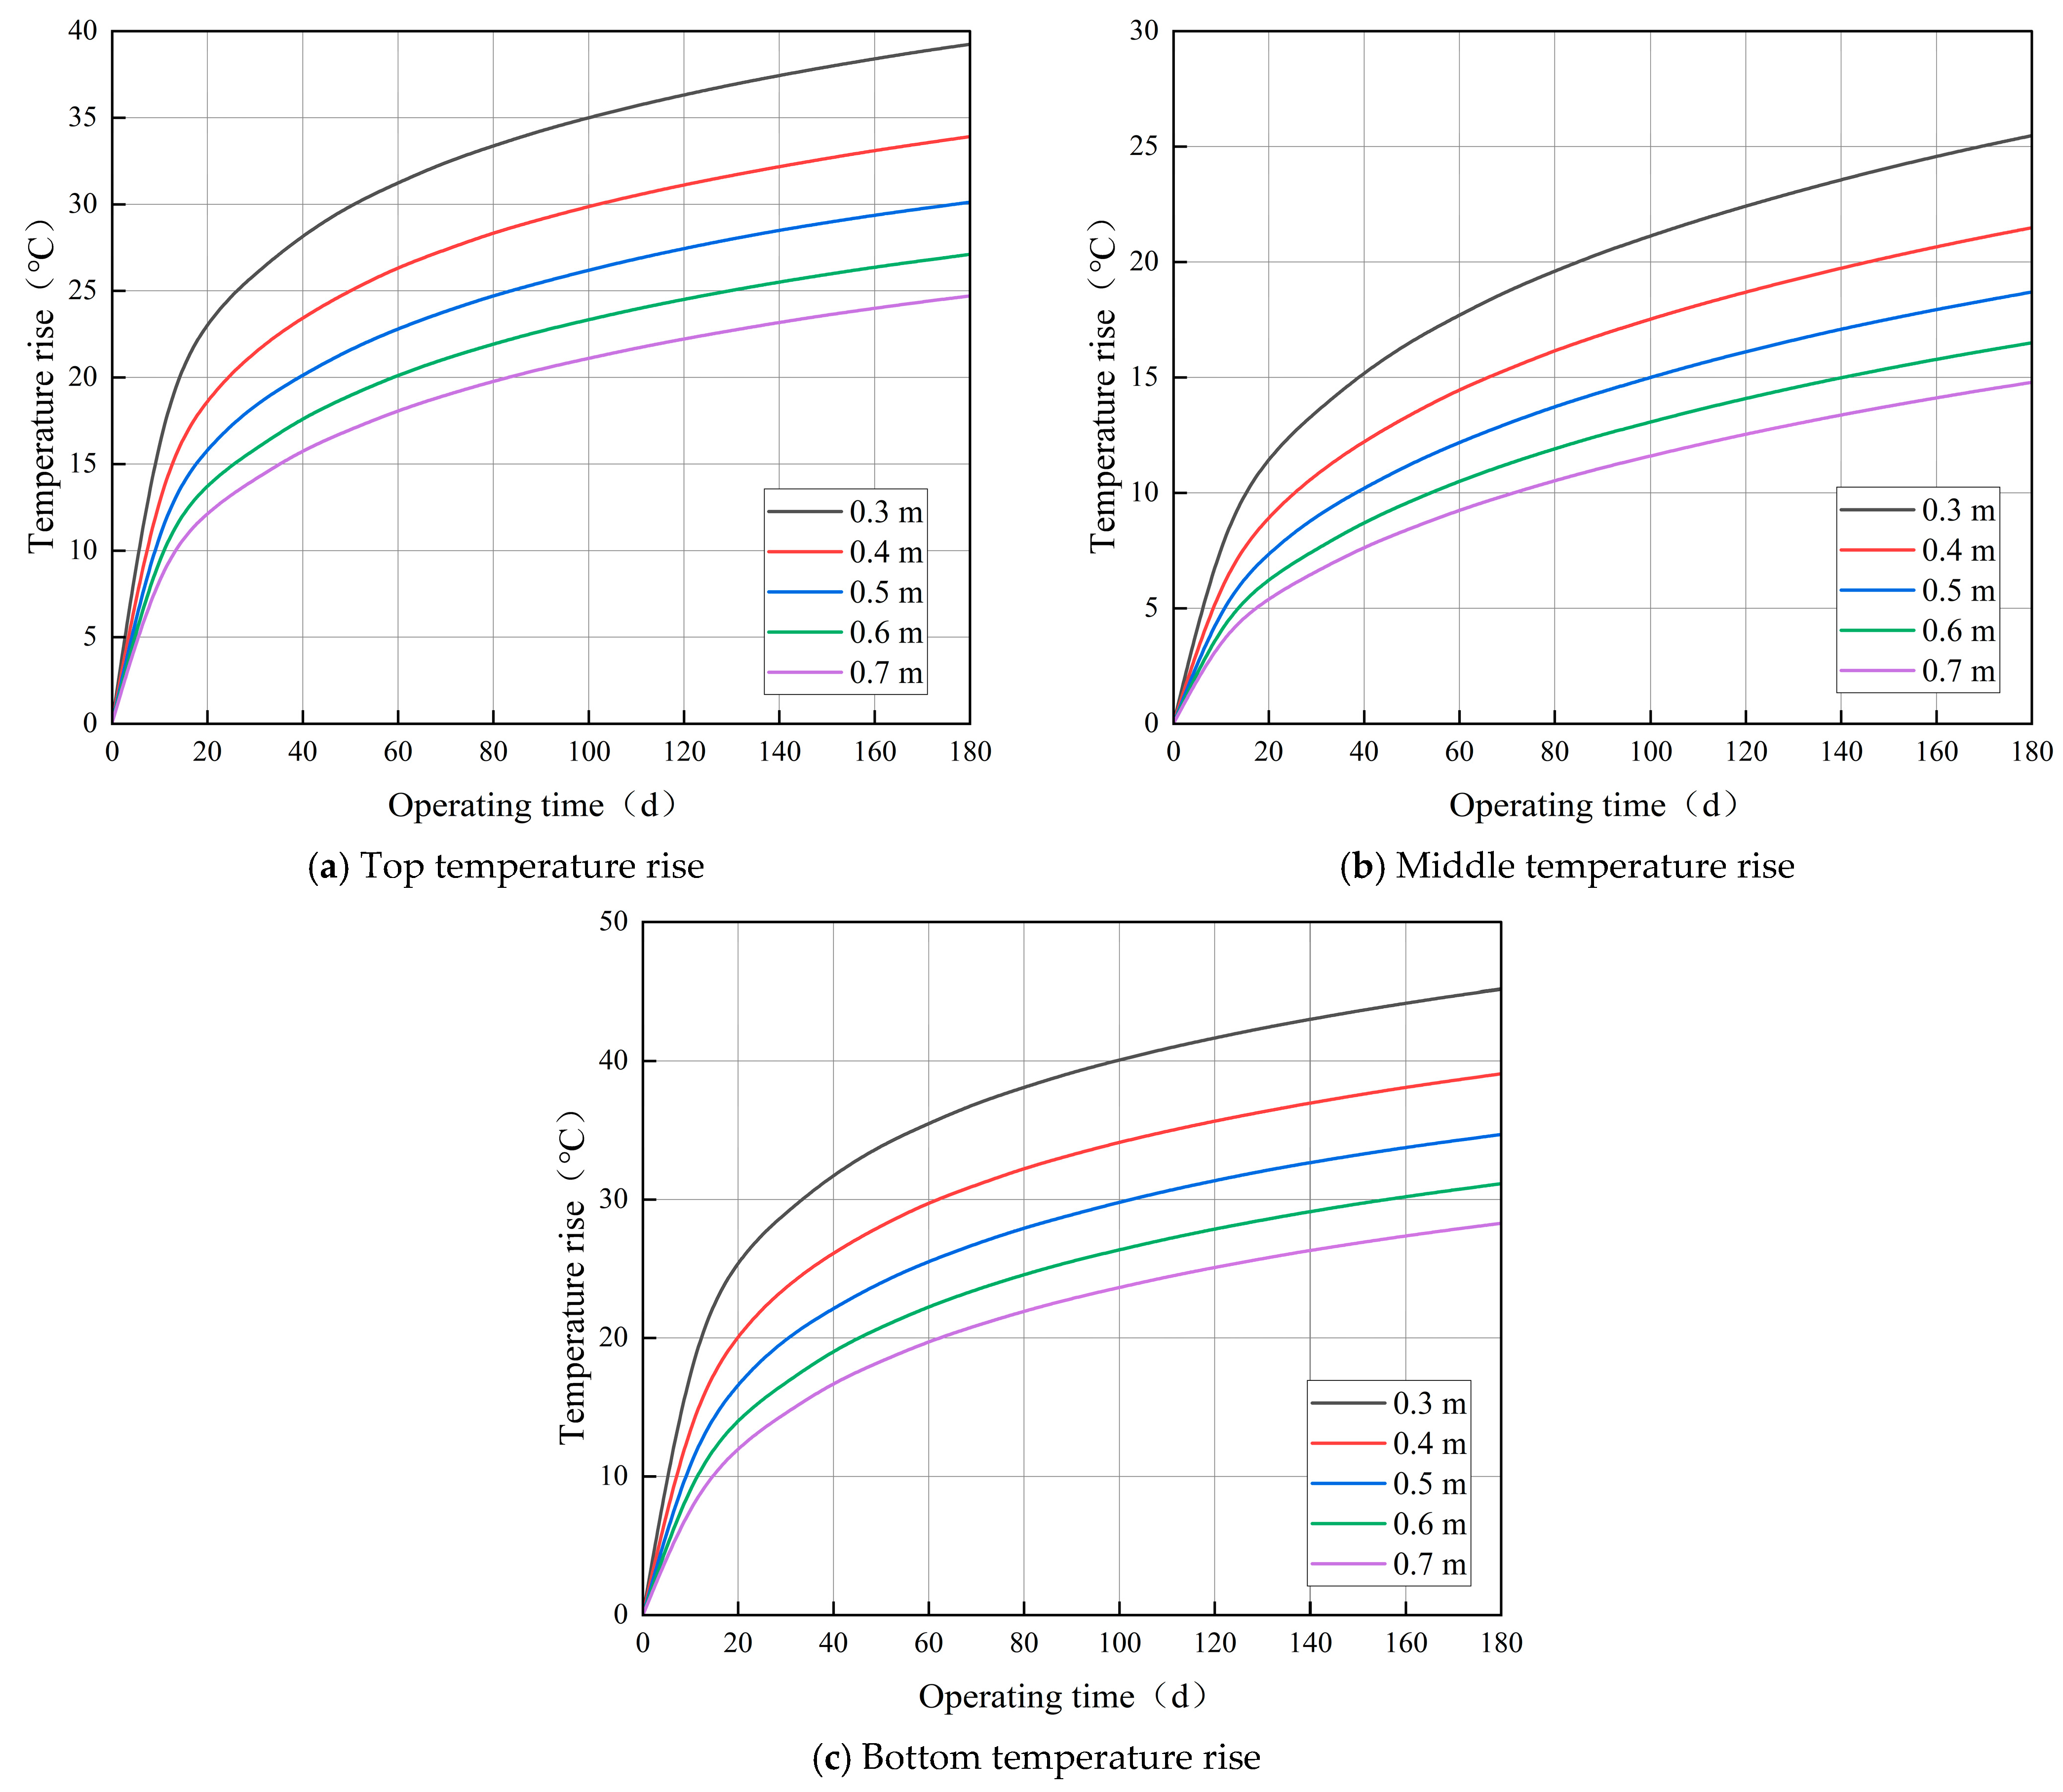
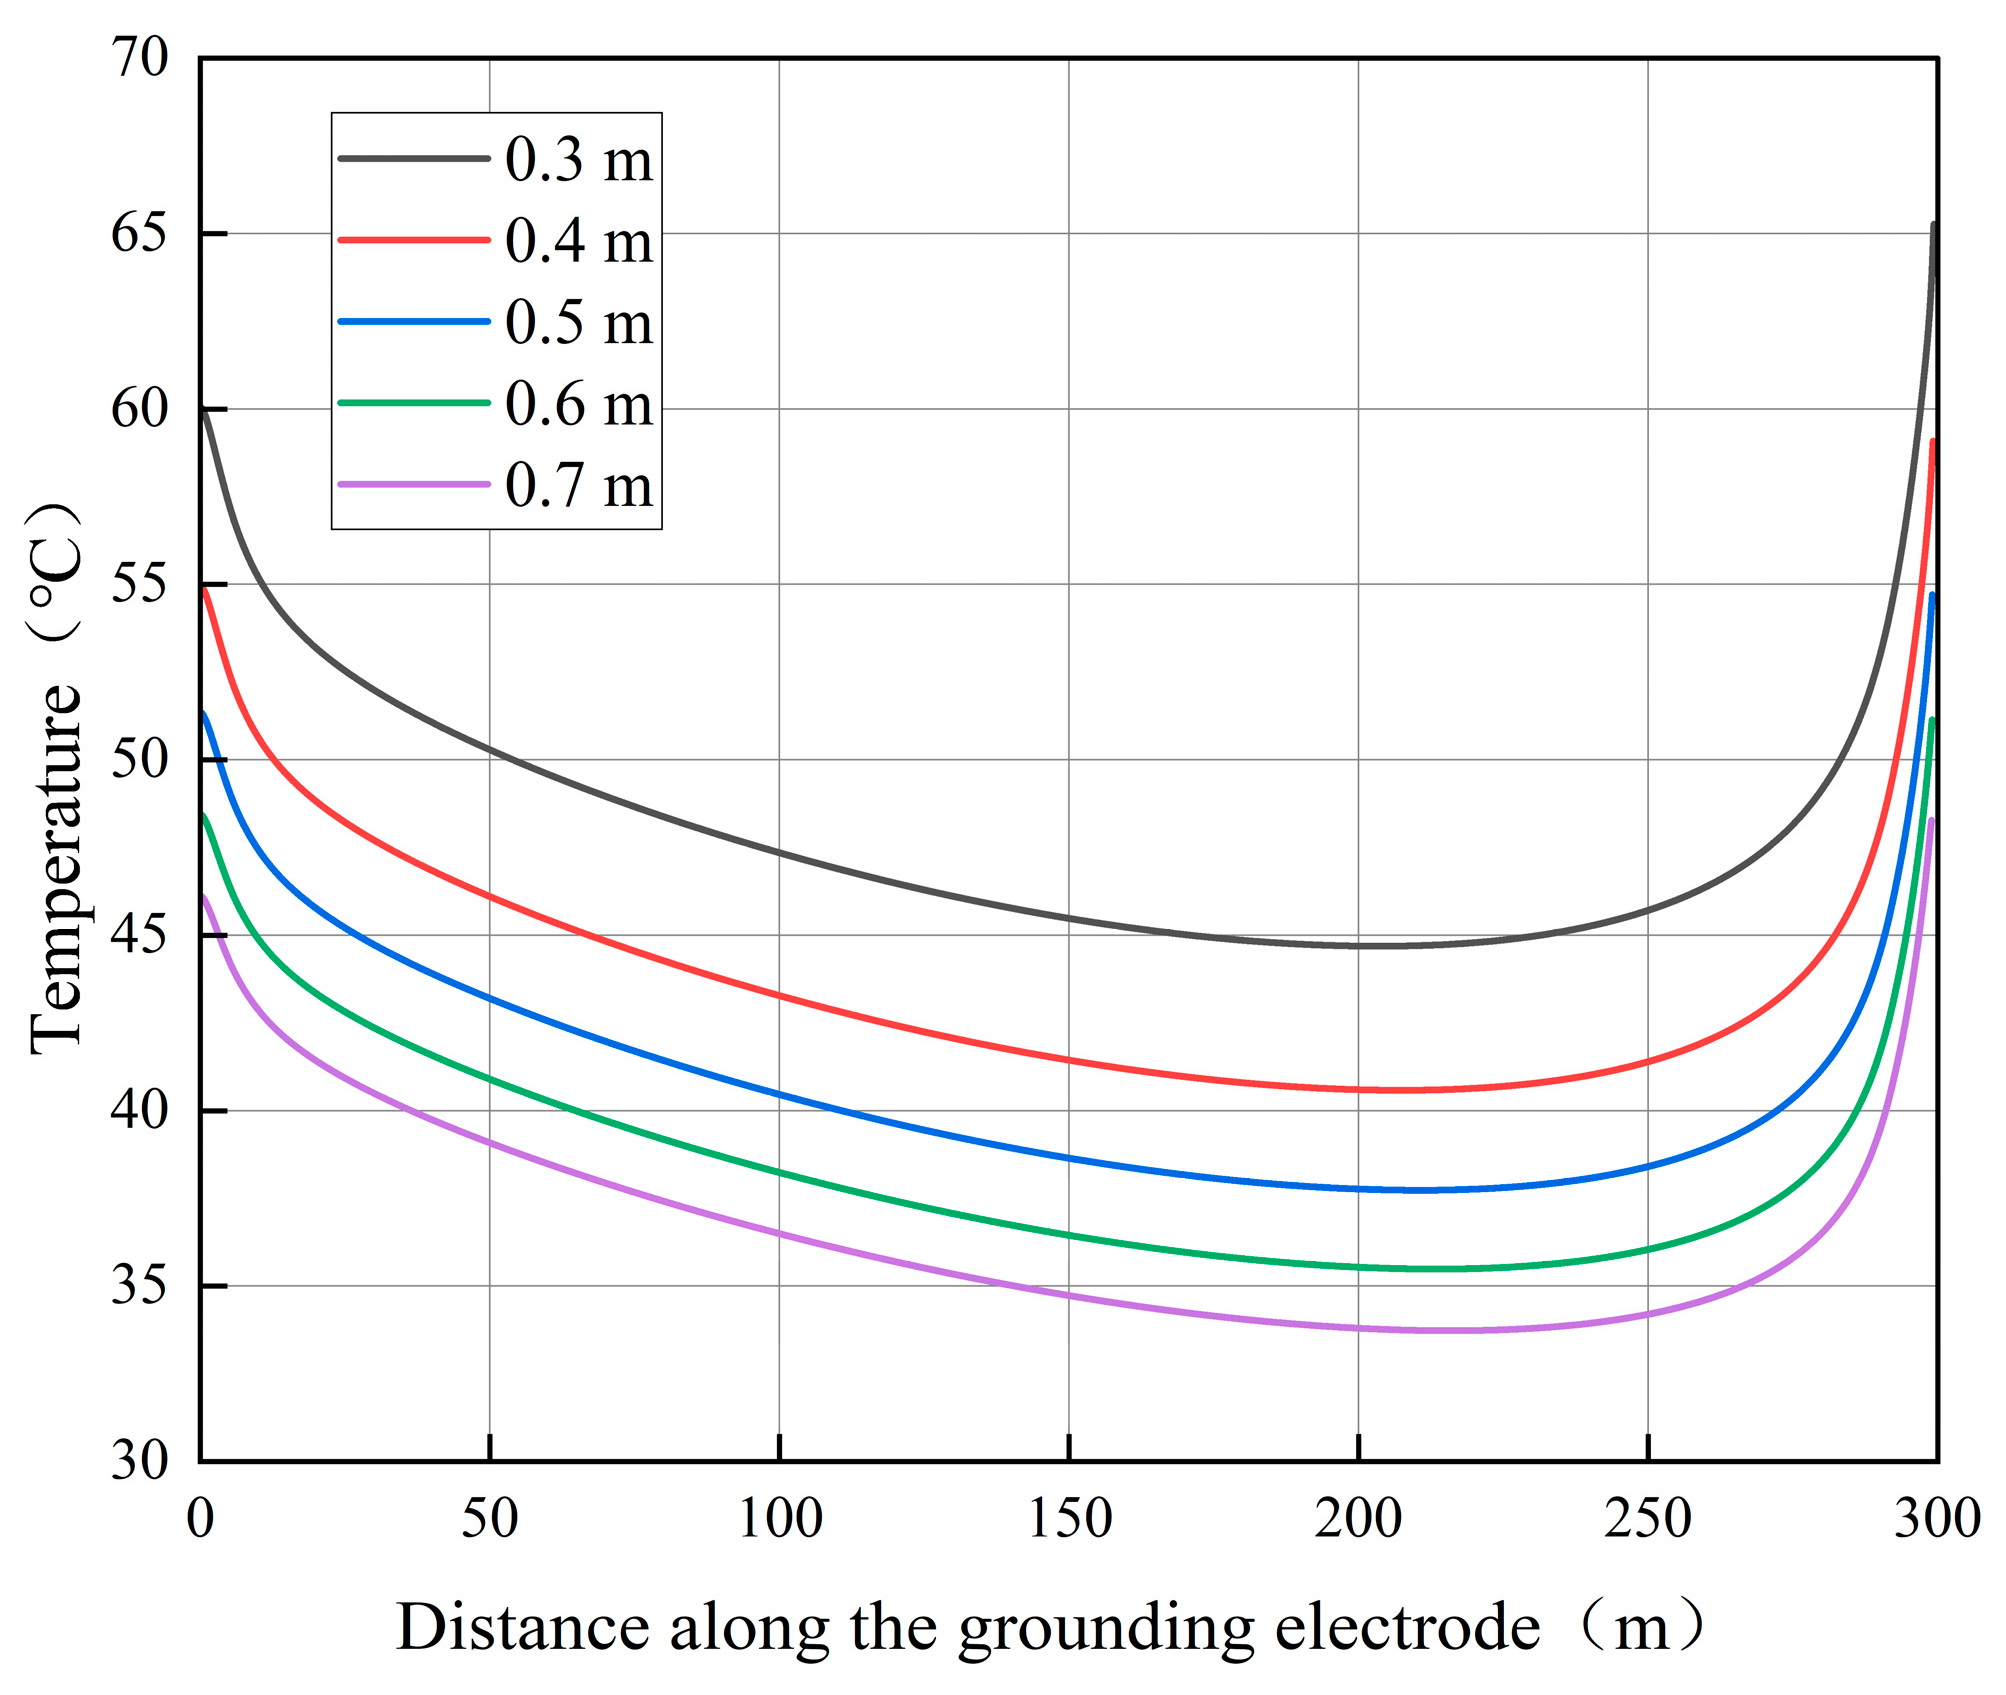
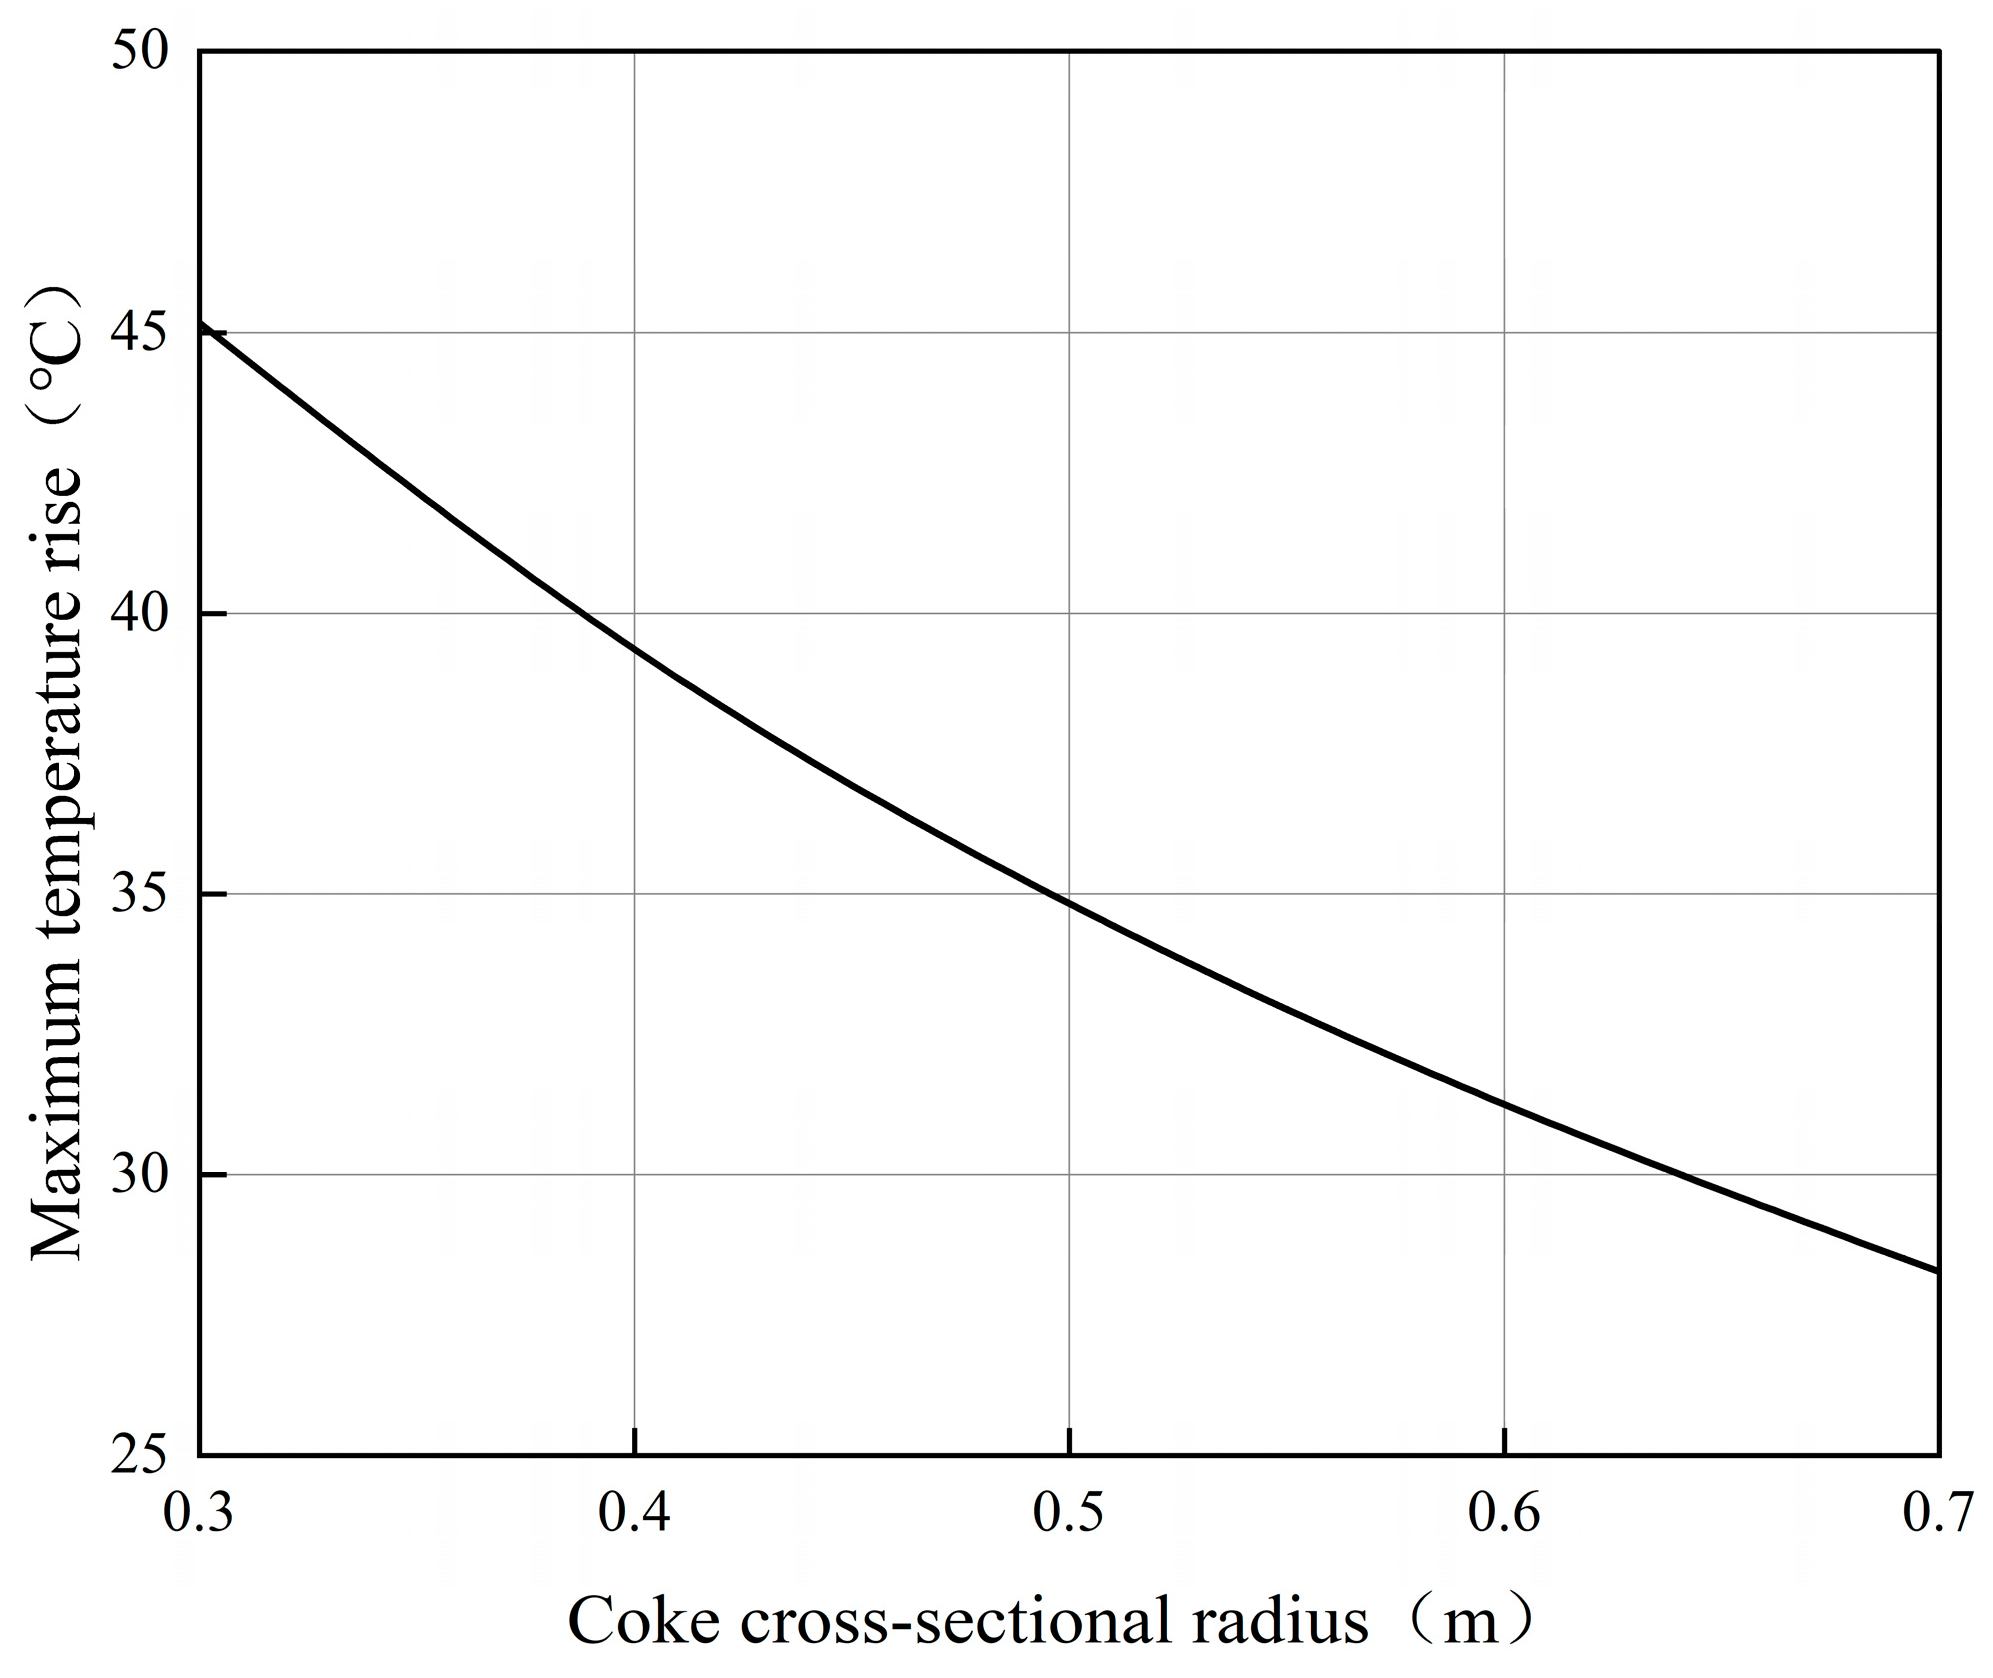
In the simulation, the coke radius is set to 0.3 m, 0.4 m, 0.5 m, 0.6 m, and 0.7 m. Other model parameters are consistent with Table 1 and Table 2. An injected current of 600 A is applied for an operating duration of 180 days to calculate the transient temperature rise. The calculated temperature rises at the ends and the middle of the vertical grounding electrode during normal operation are shown in Figure 20. The temperature distribution along the length of the electrode is illustrated in Figure 21. As the coke cross-sectional radius increases from 0.3 m to 0.7 m, the variation of the maximum temperature rise of the grounding electrode during normal operation with respect to the coke radius is presented in Figure 22.
As observed in Figure 20 and Figure 21, the temperature rise at various parts of the vertical grounding electrode decreases as the coke radius increases. This indicates that increasing the coke cross-sectional radius is one of the most direct and effective means of suppressing temperature rise. The end effect of the grounding electrode is also improved. When the coke radius is 0.3 m, the difference between the maximum and minimum temperatures of the electrode is 20.57 °C; however, when the radius increases to 0.7 m, this difference reduces to 14.54 °C, representing a narrowing of 6.03 °C.
As shown in Figure 22, the maximum temperature rise drop reaches 16.9 °C when the coke bed radius increases from 0.3 m to 0.7 m. This is because increasing the coke bed radius effectively expands the equivalent electrical radius of the grounding electrode, thereby reducing the current dissipation density at the coke–soil interface. Simultaneously, a larger volume of the coke layer provides a more extensive thermal buffer and heat dissipation surface. However, the simulation results indicate that as the cross-sectional radius gradually increases from 0.3 m to 0.7 m, the maximum temperature rise decreases by 6.1 °C, 4.38 °C, 3.55 °C, and 2.86 °C, respectively. This trend clearly reveals the diminishing cooling benefits. Because the required excavation volume and material usage increase quadratically with the radius, the cooling efficiency per unit volume drops significantly. Based on this cost–benefit analysis, a radius of 0.5 m is recommended as the optimal engineering threshold. Up to 0.5 m, the thermal mitigation is highly effective. Any further expansion beyond 0.5 m yields severely diminished thermal benefits that cannot justify the drastically increased construction costs.
As observed in Table 7, with the increase in the coke cross-sectional radius, both the grounding resistance and the maximum step voltage of the grounding electrode decrease. This is attributed to the fact that the conductivity of coke is significantly higher than that of ordinary soil. Encasing the electrode in coke effectively expands its heat dissipation radius and facilitates smoother current dissipation. Consequently, the electric field intensity in the surrounding soil is weakened, and the surface potential distribution becomes smoother, naturally leading to a reduction in both grounding resistance and maximum step voltage. Following the calculations, none of the maximum step voltages exceeded the standard threshold. Furthermore, the increased dissipation radius allows the current to spread more easily, resulting in a decrease in the average current dissipation density. As can be seen here, simply changing the soil parameters cannot alter the average current dissipation density of the grounding electrode. This average density can only be effectively changed by modifying the parameters of the electrode itself. Therefore, increasing the cross-sectional radius of the coke bed is an effective physical approach to reducing this average value.
Simulation results indicate that while the coke bed provides both electrical and thermal benefits, the electrical effect is the dominant factor in suppressing the temperature rise. By expanding the equivalent electrical radius, the coke bed significantly reduces the local current dissipation density. According to Joule’s law ( Q = ρ J 2 ), this reduction lowers the heat generation rate, directly stopping the thermal accumulation at the source. The thermal benefits (such as higher heat conductivity) primarily play a secondary role as a passive thermal buffer, given that heat conduction is a much slower process.

3.2. Impact of Non-Uniform Soil Properties on Temperature Rise

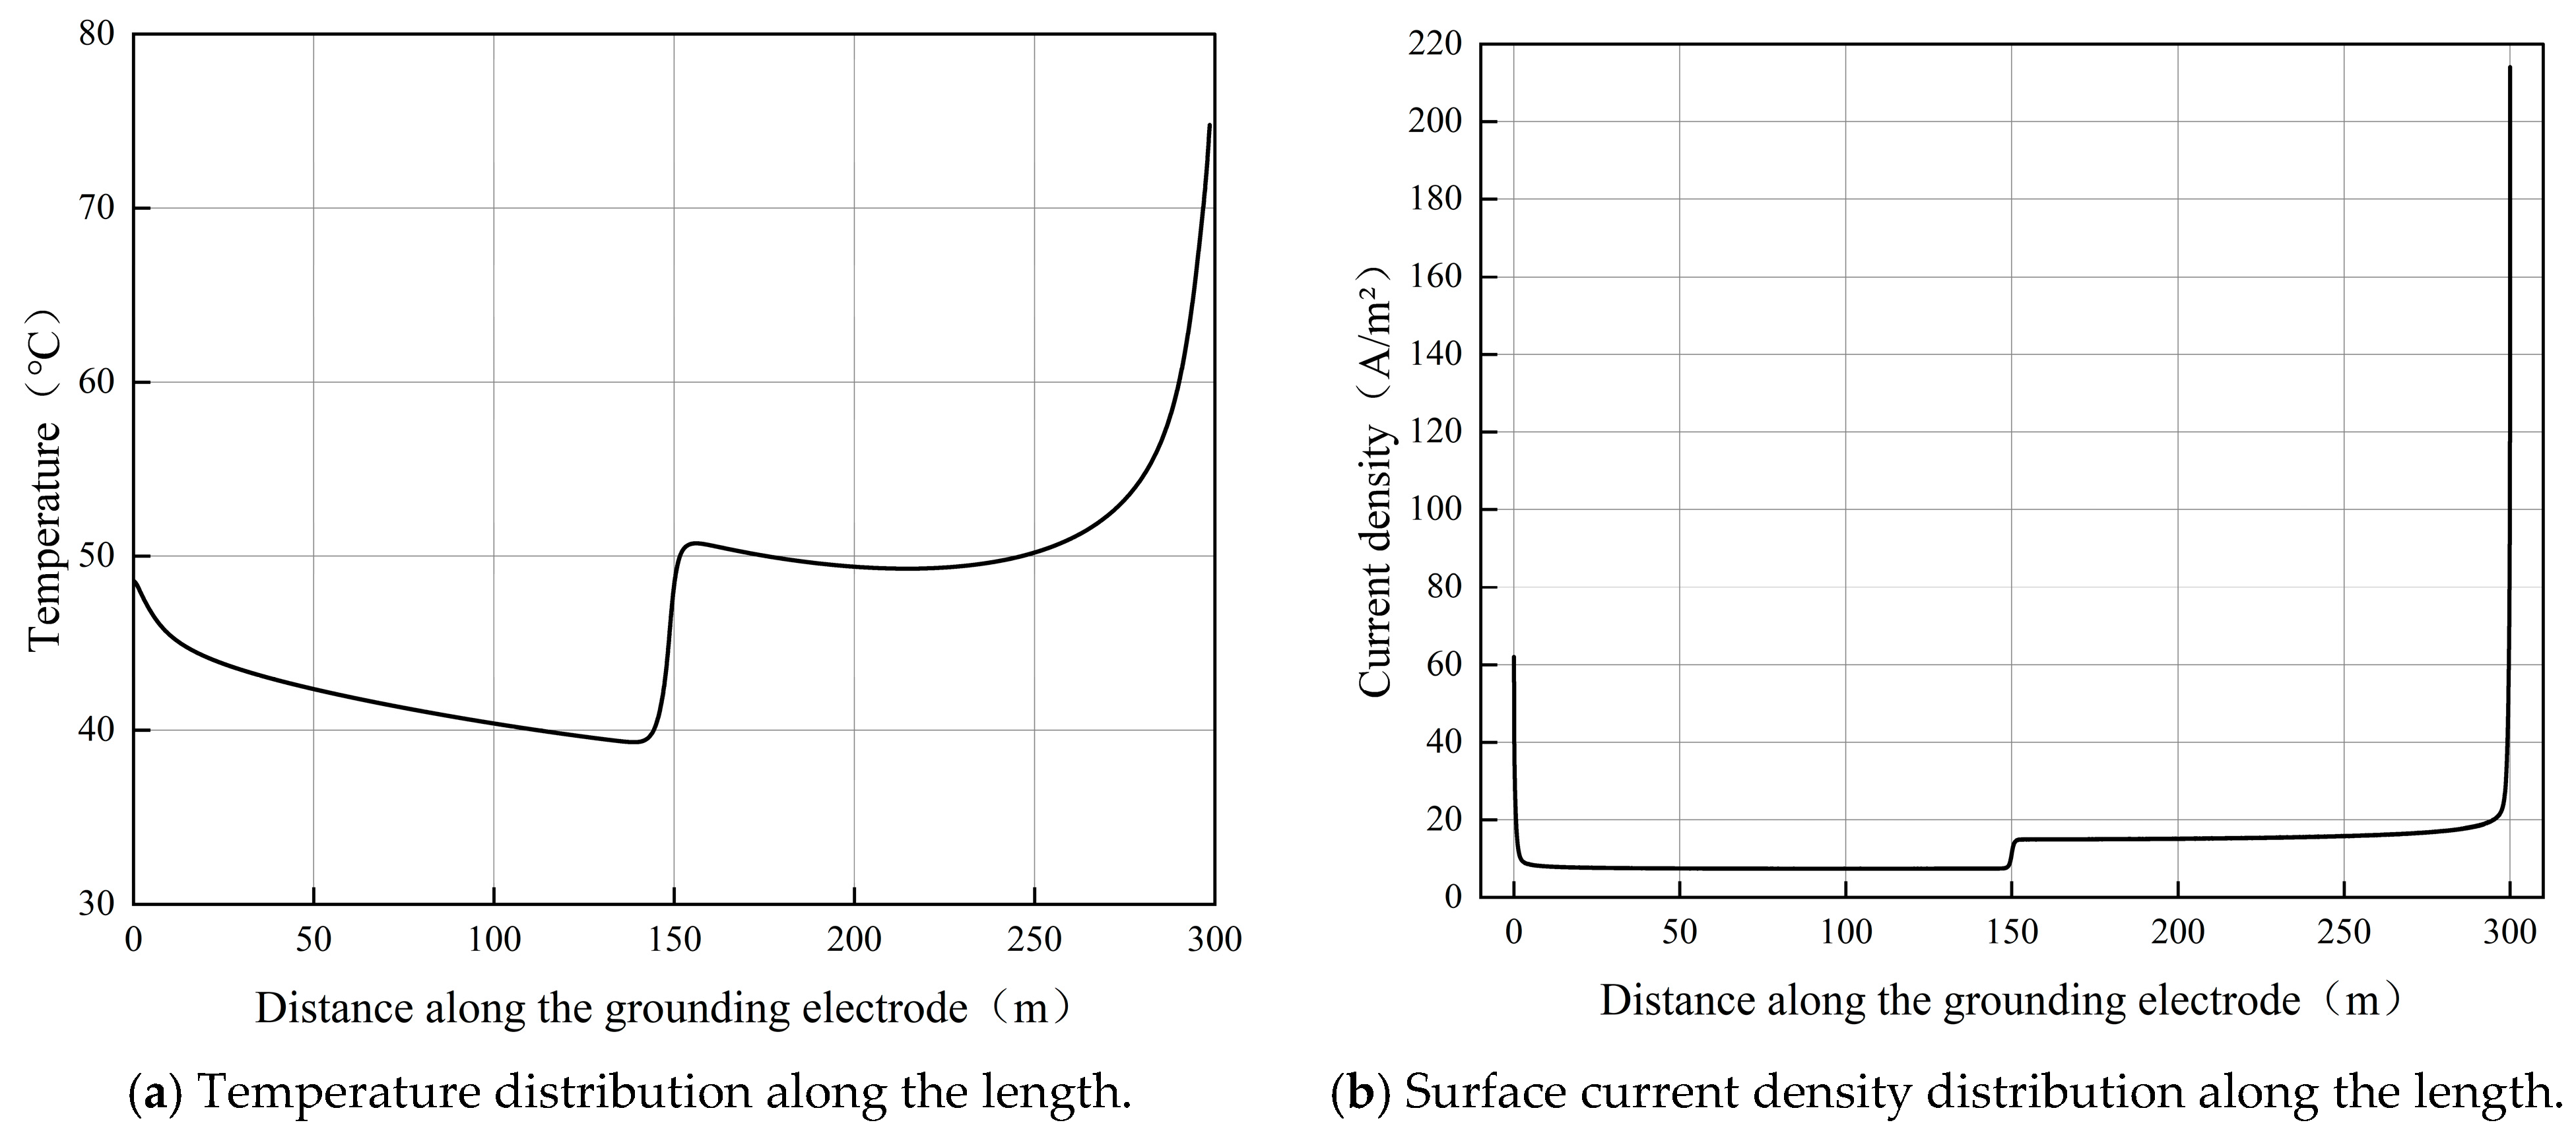
Actual soil is typically non-uniformly distributed and can be modeled using a horizontal layering method. A coupled model of the current and temperature fields for a vertical DC grounding electrode was established using COMSOL Multiphysics finite element simulation software to calculate the transient temperature rise under non-uniform soil conditions. In this model, the initial soil resistivities of the upper and lower layers are set to 200 Ω·m and 100 Ω·m, respectively. The soil interface is located at the midpoint of the electrode, specifically at a burial depth of 160 m. To ensure numerical stability, a highly refined mesh was applied to the soil and boundary layer near the interface between the grounding electrode and the coke bed. Other parameters are set according to Table 1 and Table 2. With an injected current of 600 A and a maximum operating duration of 180 days, the maximum temperature rise distribution at the ends and the middle of the vertical grounding electrode is shown in Figure 23. The temperature distribution along the length of the electrode is illustrated in Figure 24, and the variation of temperature rise with operating time is presented in Figure 25.
As observed in Figure 23 and Figure 24, the temperature distribution of the vertical grounding electrode under non-uniform soil conditions exhibits significant changes compared to that under uniform soil conditions. The distribution presents a step-like pattern, where the electrode temperature is lower in the high-resistivity soil layer and higher in the low-resistivity layer. This phenomenon is caused by the extreme non-uniformity of the current dissipation density; current tends to dissipate through soil layers with lower resistivity, resulting in much higher leakage current in the low-resistivity soil than in the high-resistivity soil. At the locations of soil stratification, the temperature rise of the grounding electrode undergoes an abrupt change, which is caused by the sudden change in material properties. According to Fourier’s law, the temperature field remains strictly continuous. However, the sudden jump in electrical resistivity across the boundary creates a massive step change in the localized Joule heating rate. Because the intense transient Joule heating outpaces the slow thermal diffusion process, this creates an extremely steep cliff like temperature distribution at the interface.
As shown in Figure 25, the transient temperature rise patterns at the ends and the middle of the electrode model under non-uniform soil conditions are similar to those under uniform conditions. With increasing operating time, the temperature gradually rises while the growth rate decelerates. However, the temperature difference between the top and bottom ends is larger than that under uniform conditions, reaching 27.9 °C. This is because the upper part of the electrode (located in high-resistivity soil) carries relatively less current and generates less heat, whereas the bottom part carries more current and generates higher heat. This overheating phenomenon at the bottom is likely to cause rapid local moisture evaporation in the lower soil layer in practical engineering, leading to the deterioration of grounding resistance. The temperature rise at the middle is nearly identical to that at the top. This occurs because although heat is generated on the lower side of the soil interface, it is adjacent to the relatively cooler region above. Heat dissipates toward the low-temperature zone at the top; therefore, the heat accumulation in the middle region is less than that at the bottom where current is most concentrated, making its overall temperature rise closer to that of the top end.
This section investigates the effects of the soil interface position and the resistivity of different soil layers on the temperature rise of the vertical grounding electrode under non-uniform two-layer soil conditions. The injected current is 600 A, and the operating duration is 180 days.

3.2.1. Impact of Soil Interface Position on Temperature Rise

To analyze the impact of the soil interface position on the temperature rise of the grounding electrode, two scenarios are considered: (1) the resistivity of the upper soil layer is higher than that of the lower layer, and (2) the resistivity of the upper soil layer is lower than that of the lower layer. The thickness of the upper-soil layer is varied to shift the soil interface position, with thickness values set at 10 m, 85 m, 160 m, 235 m, and 310 m. Other model parameters are consistent with Table 1 and Table 2.
High-Resistivity Upper Soil Layer
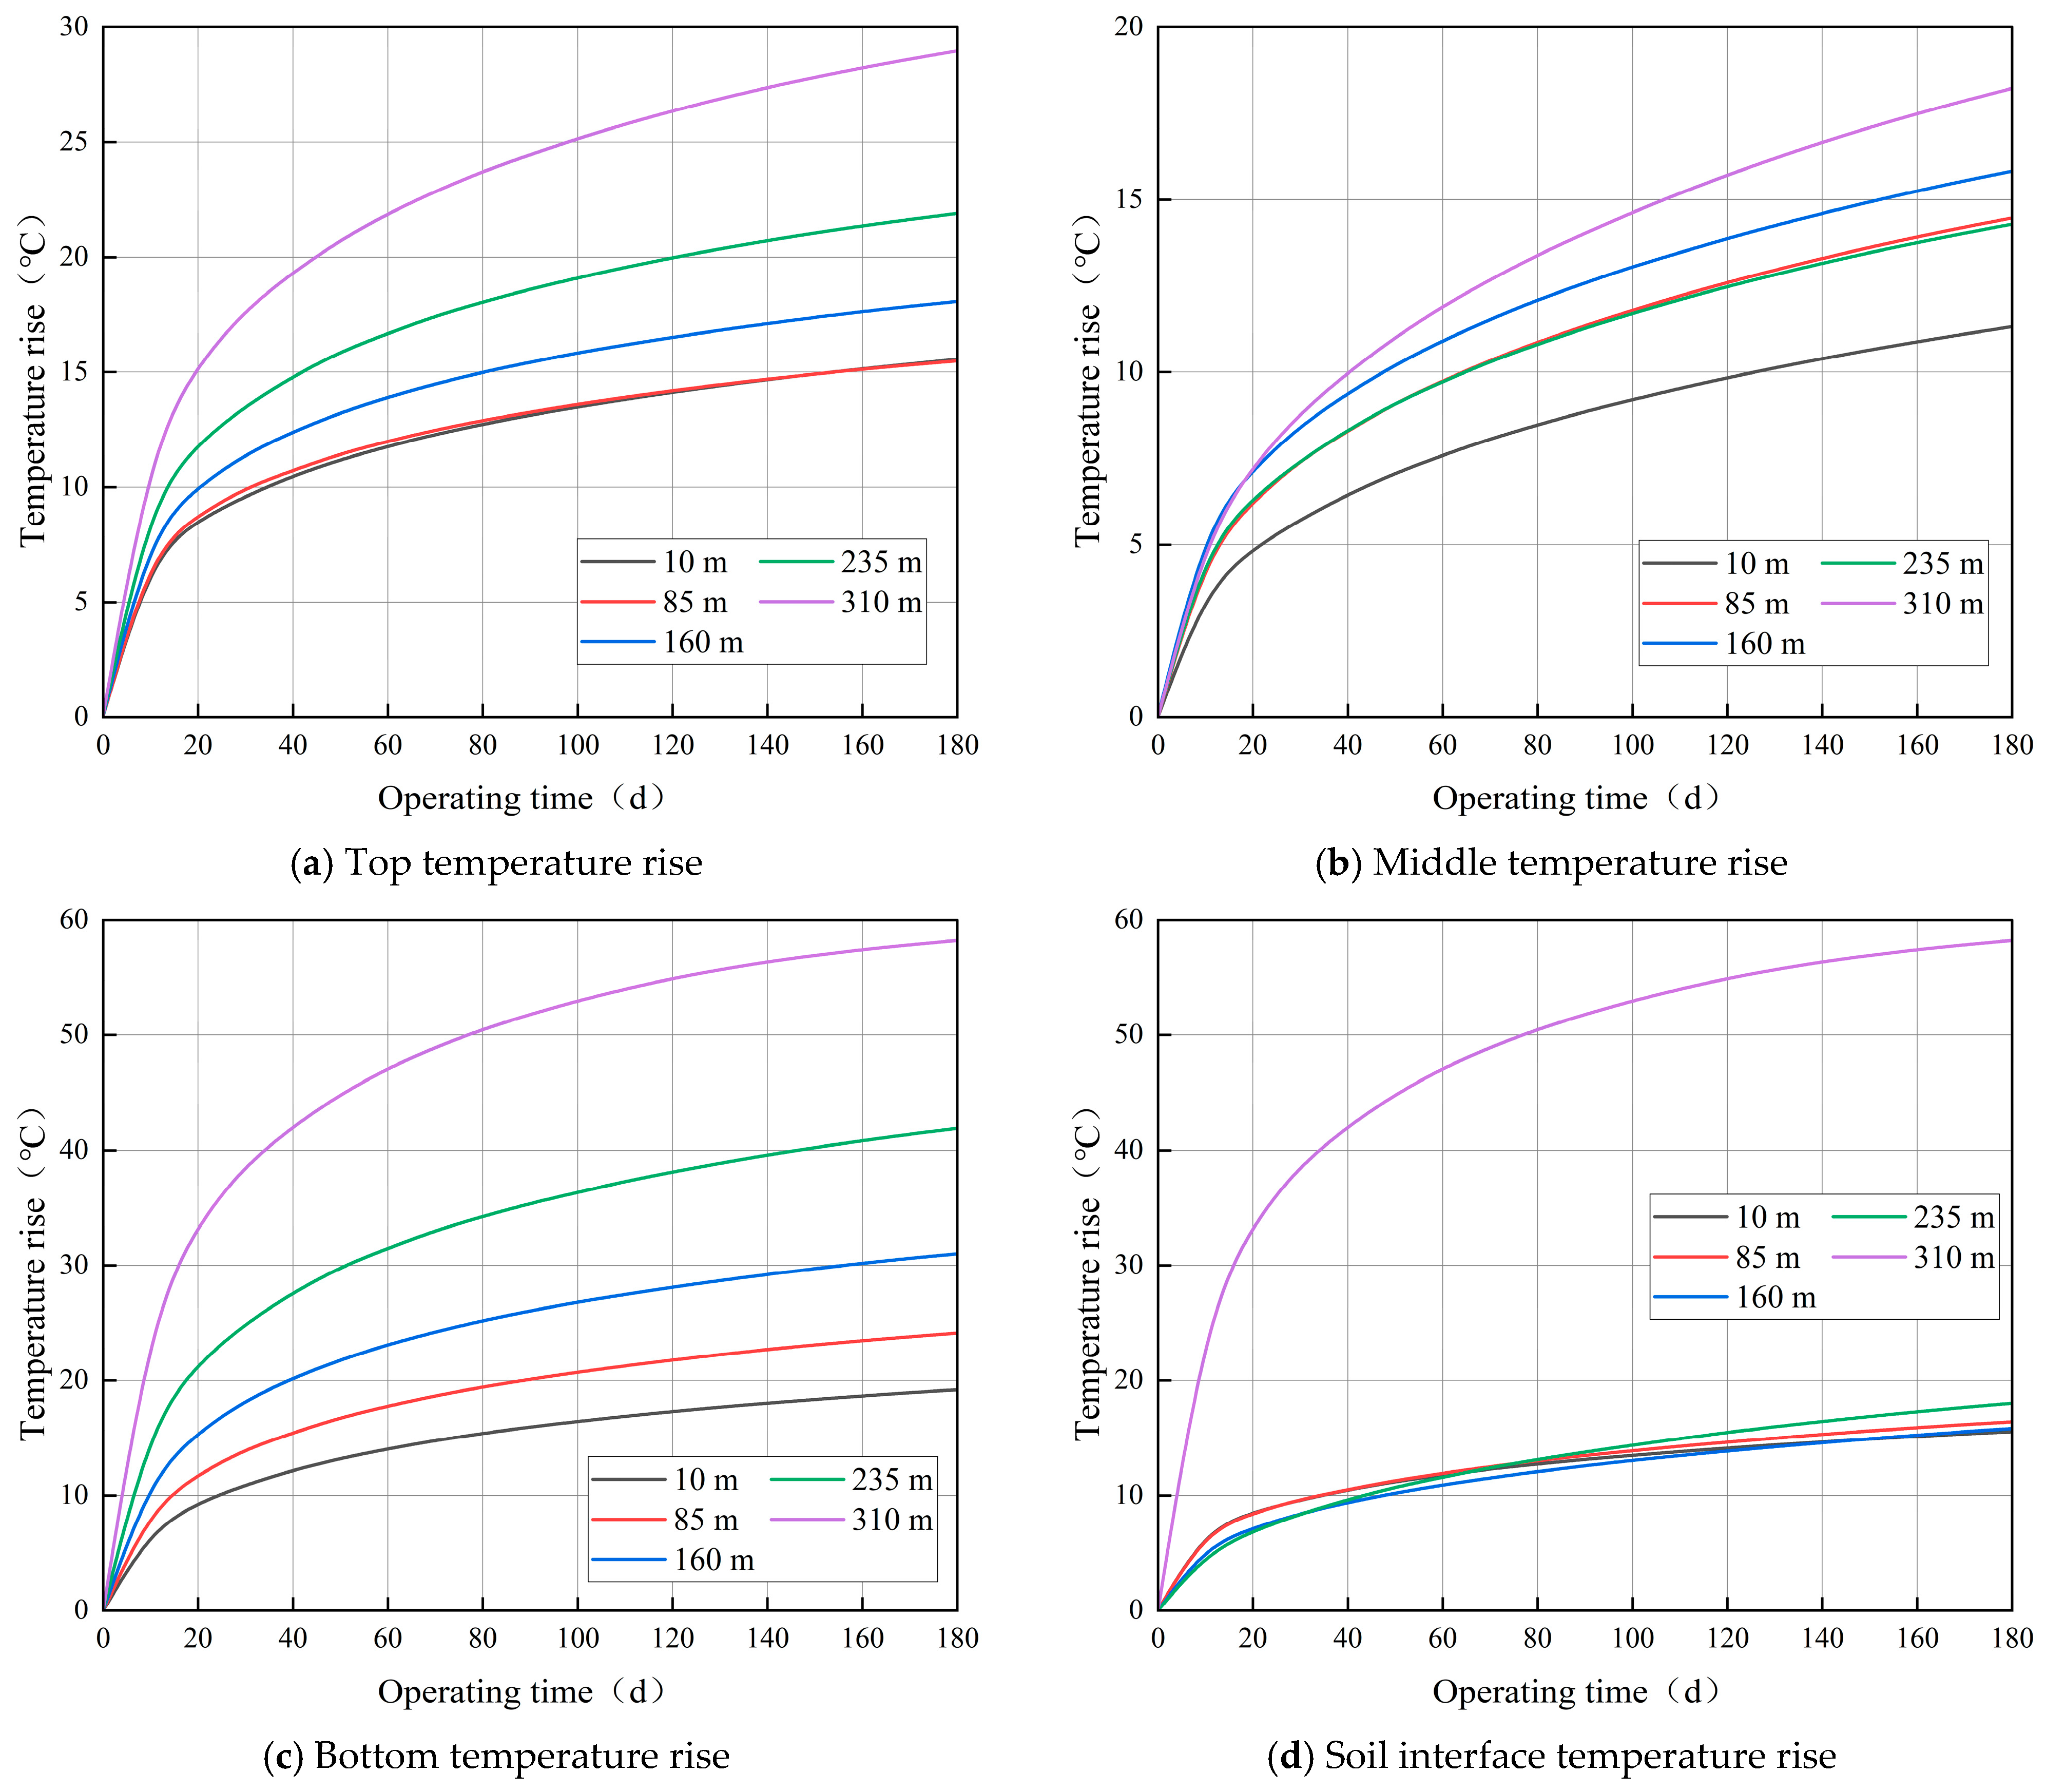
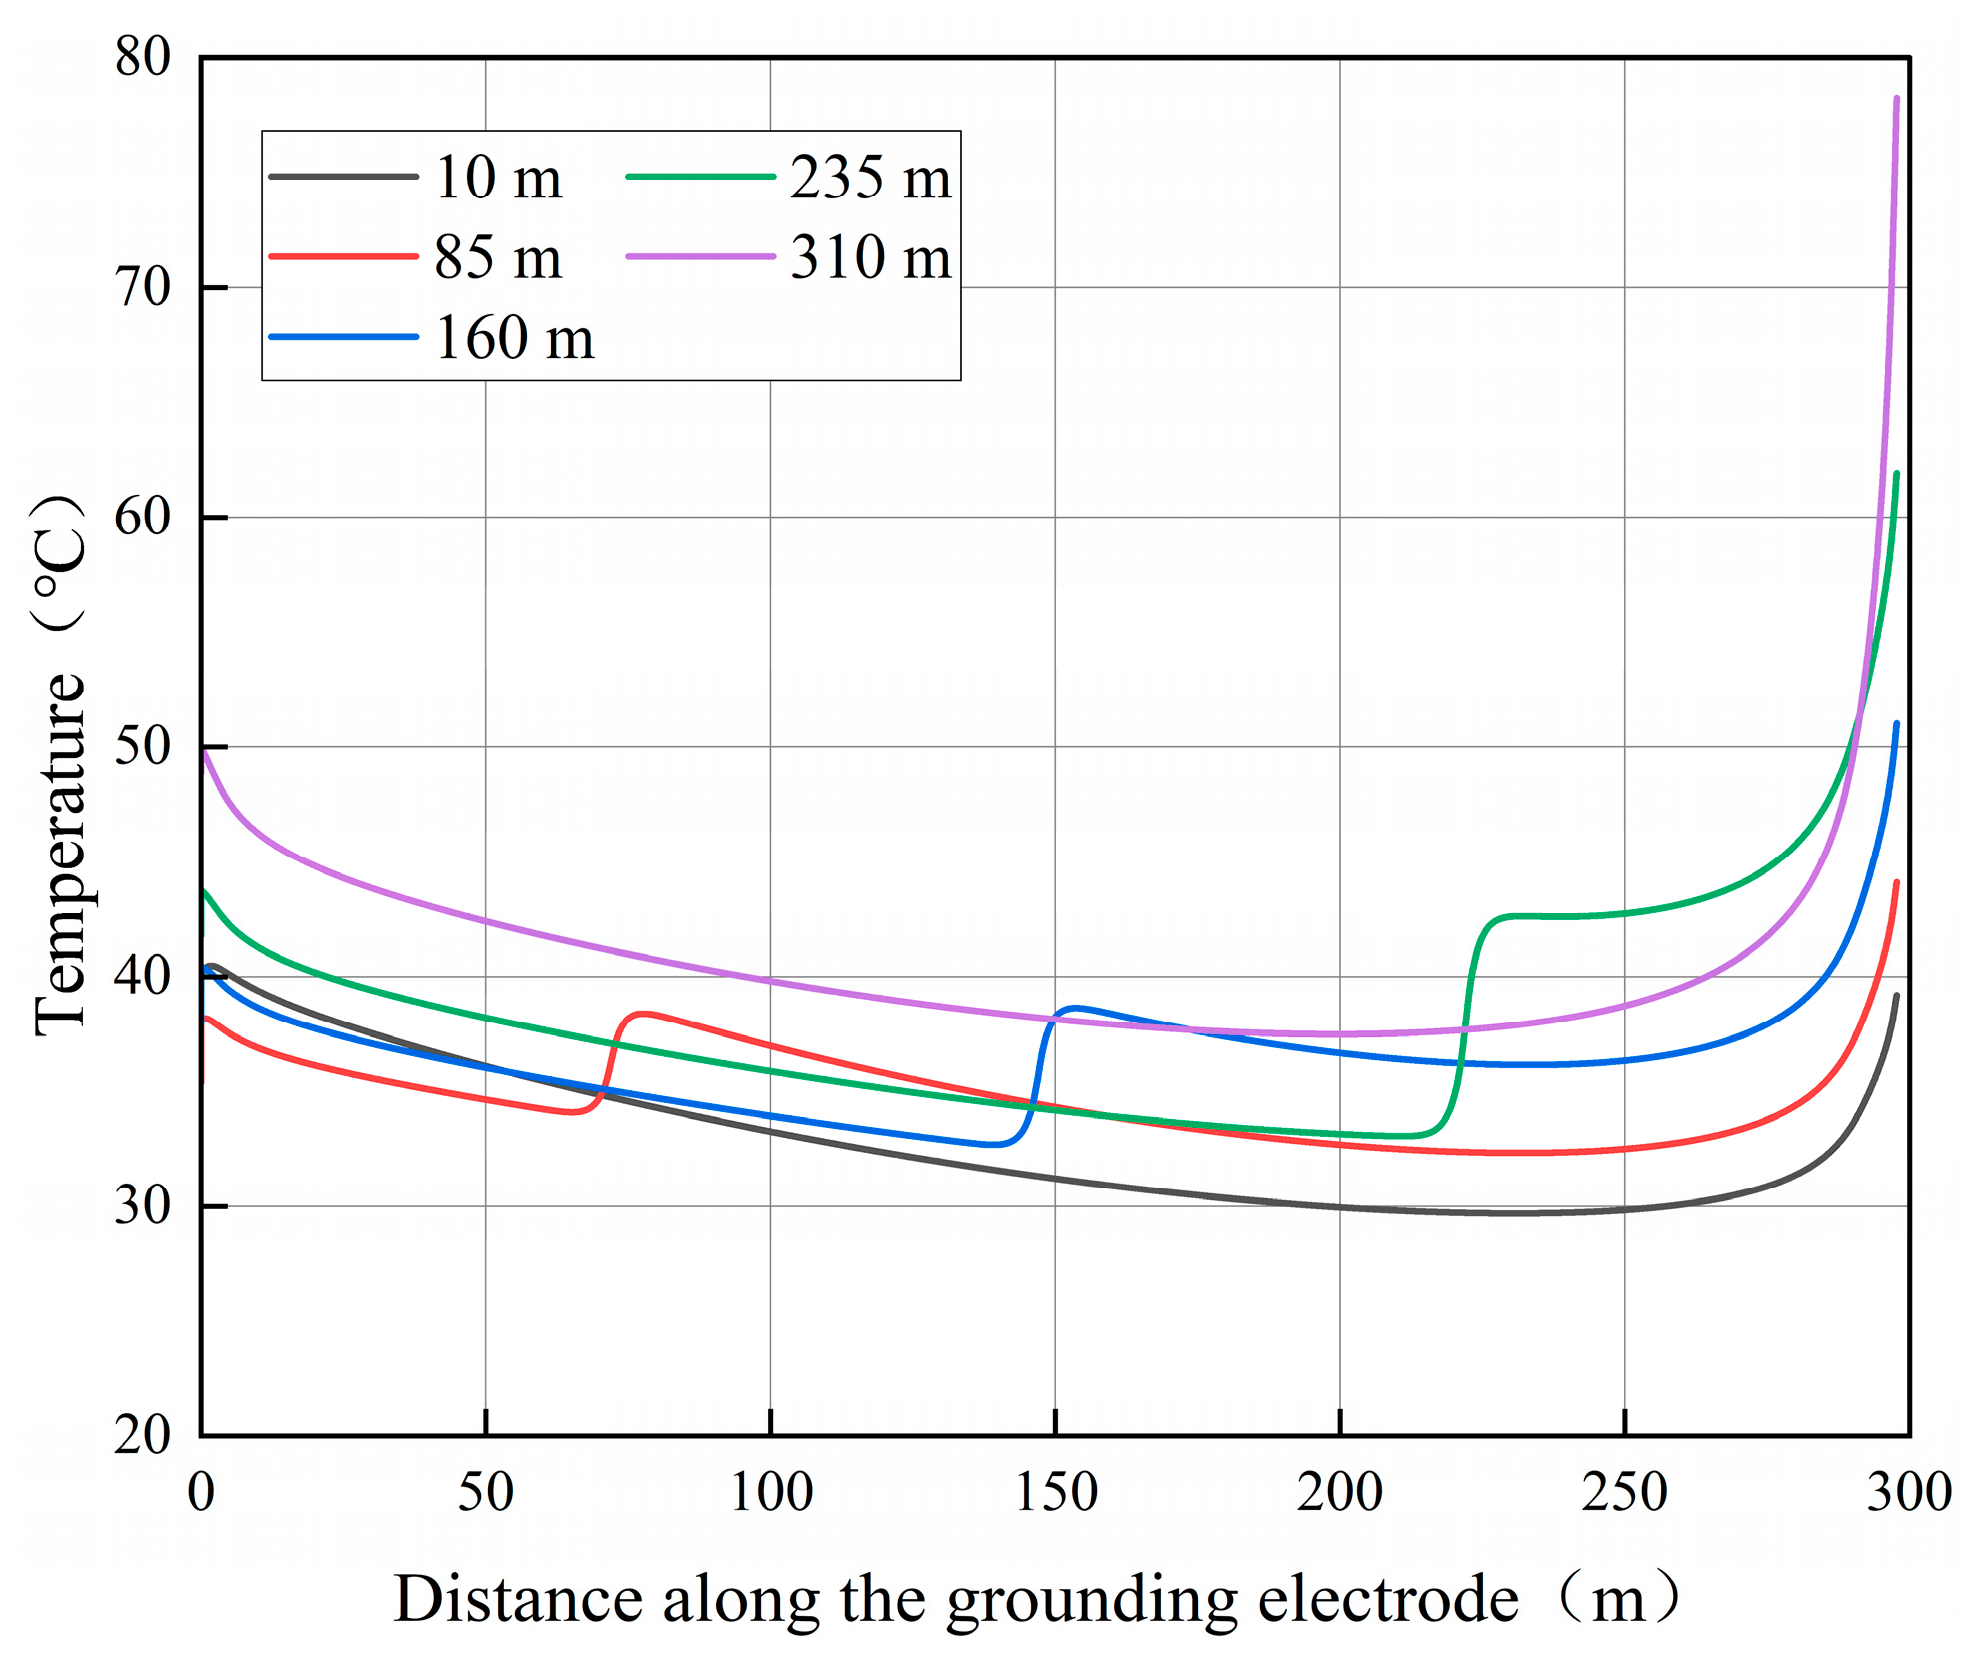
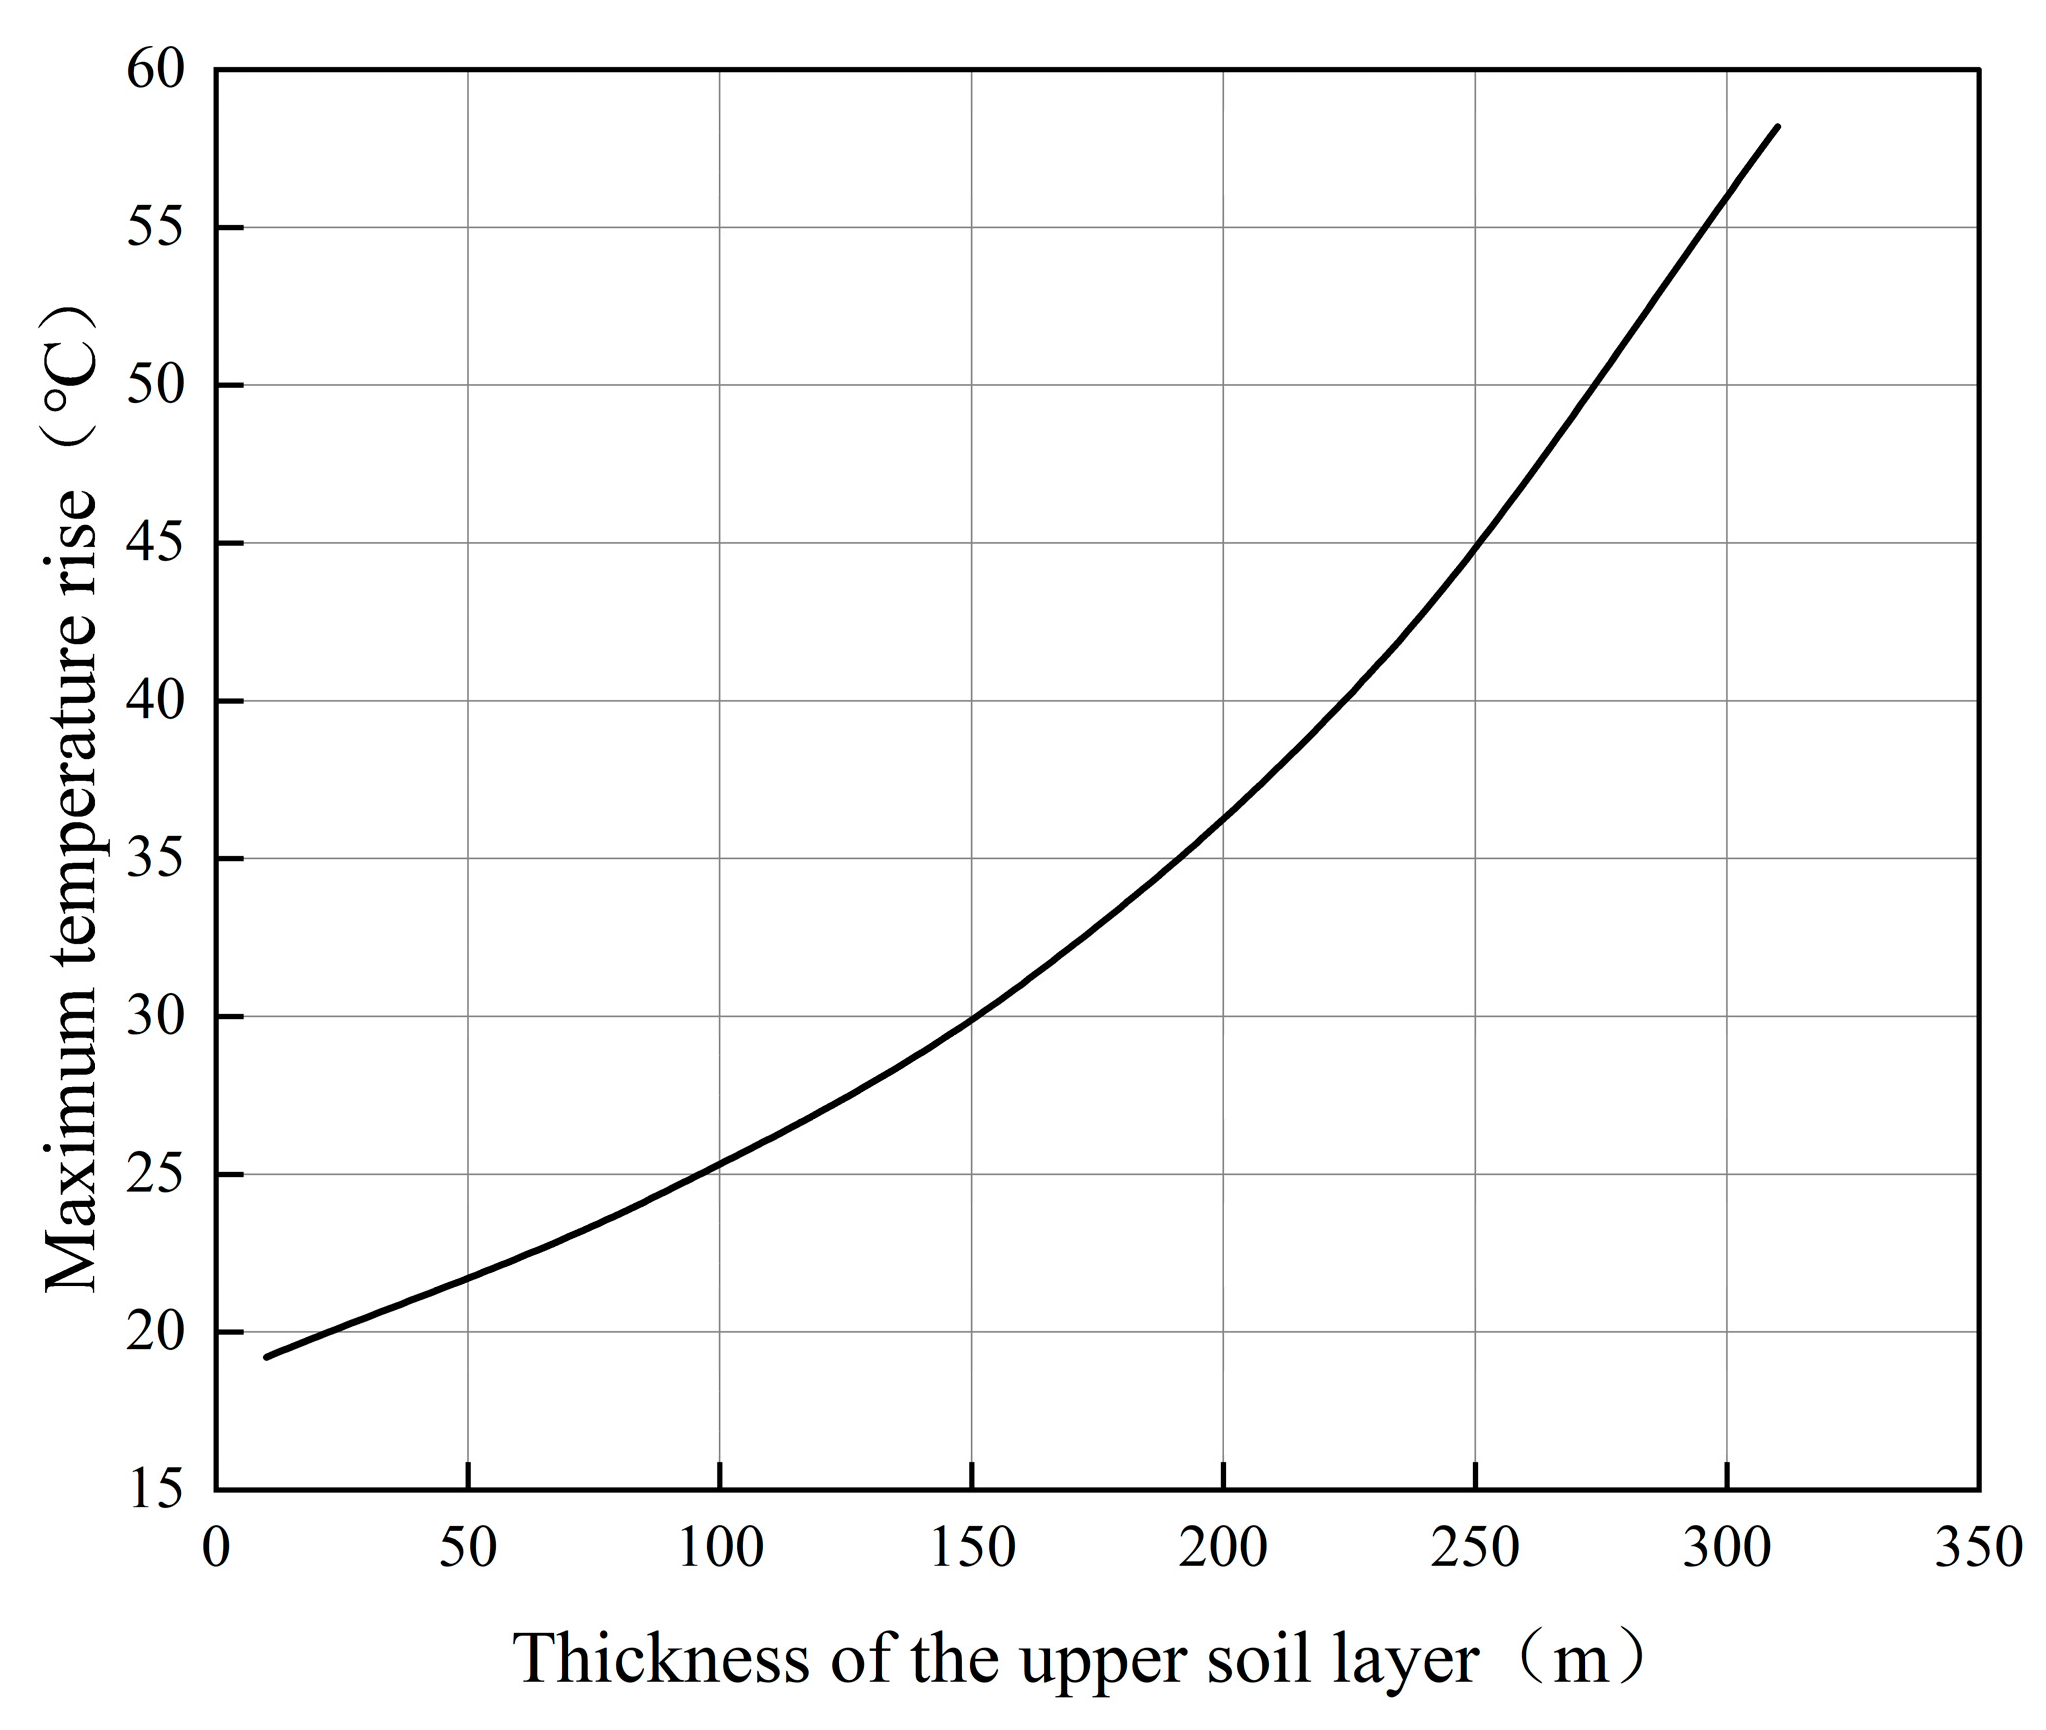
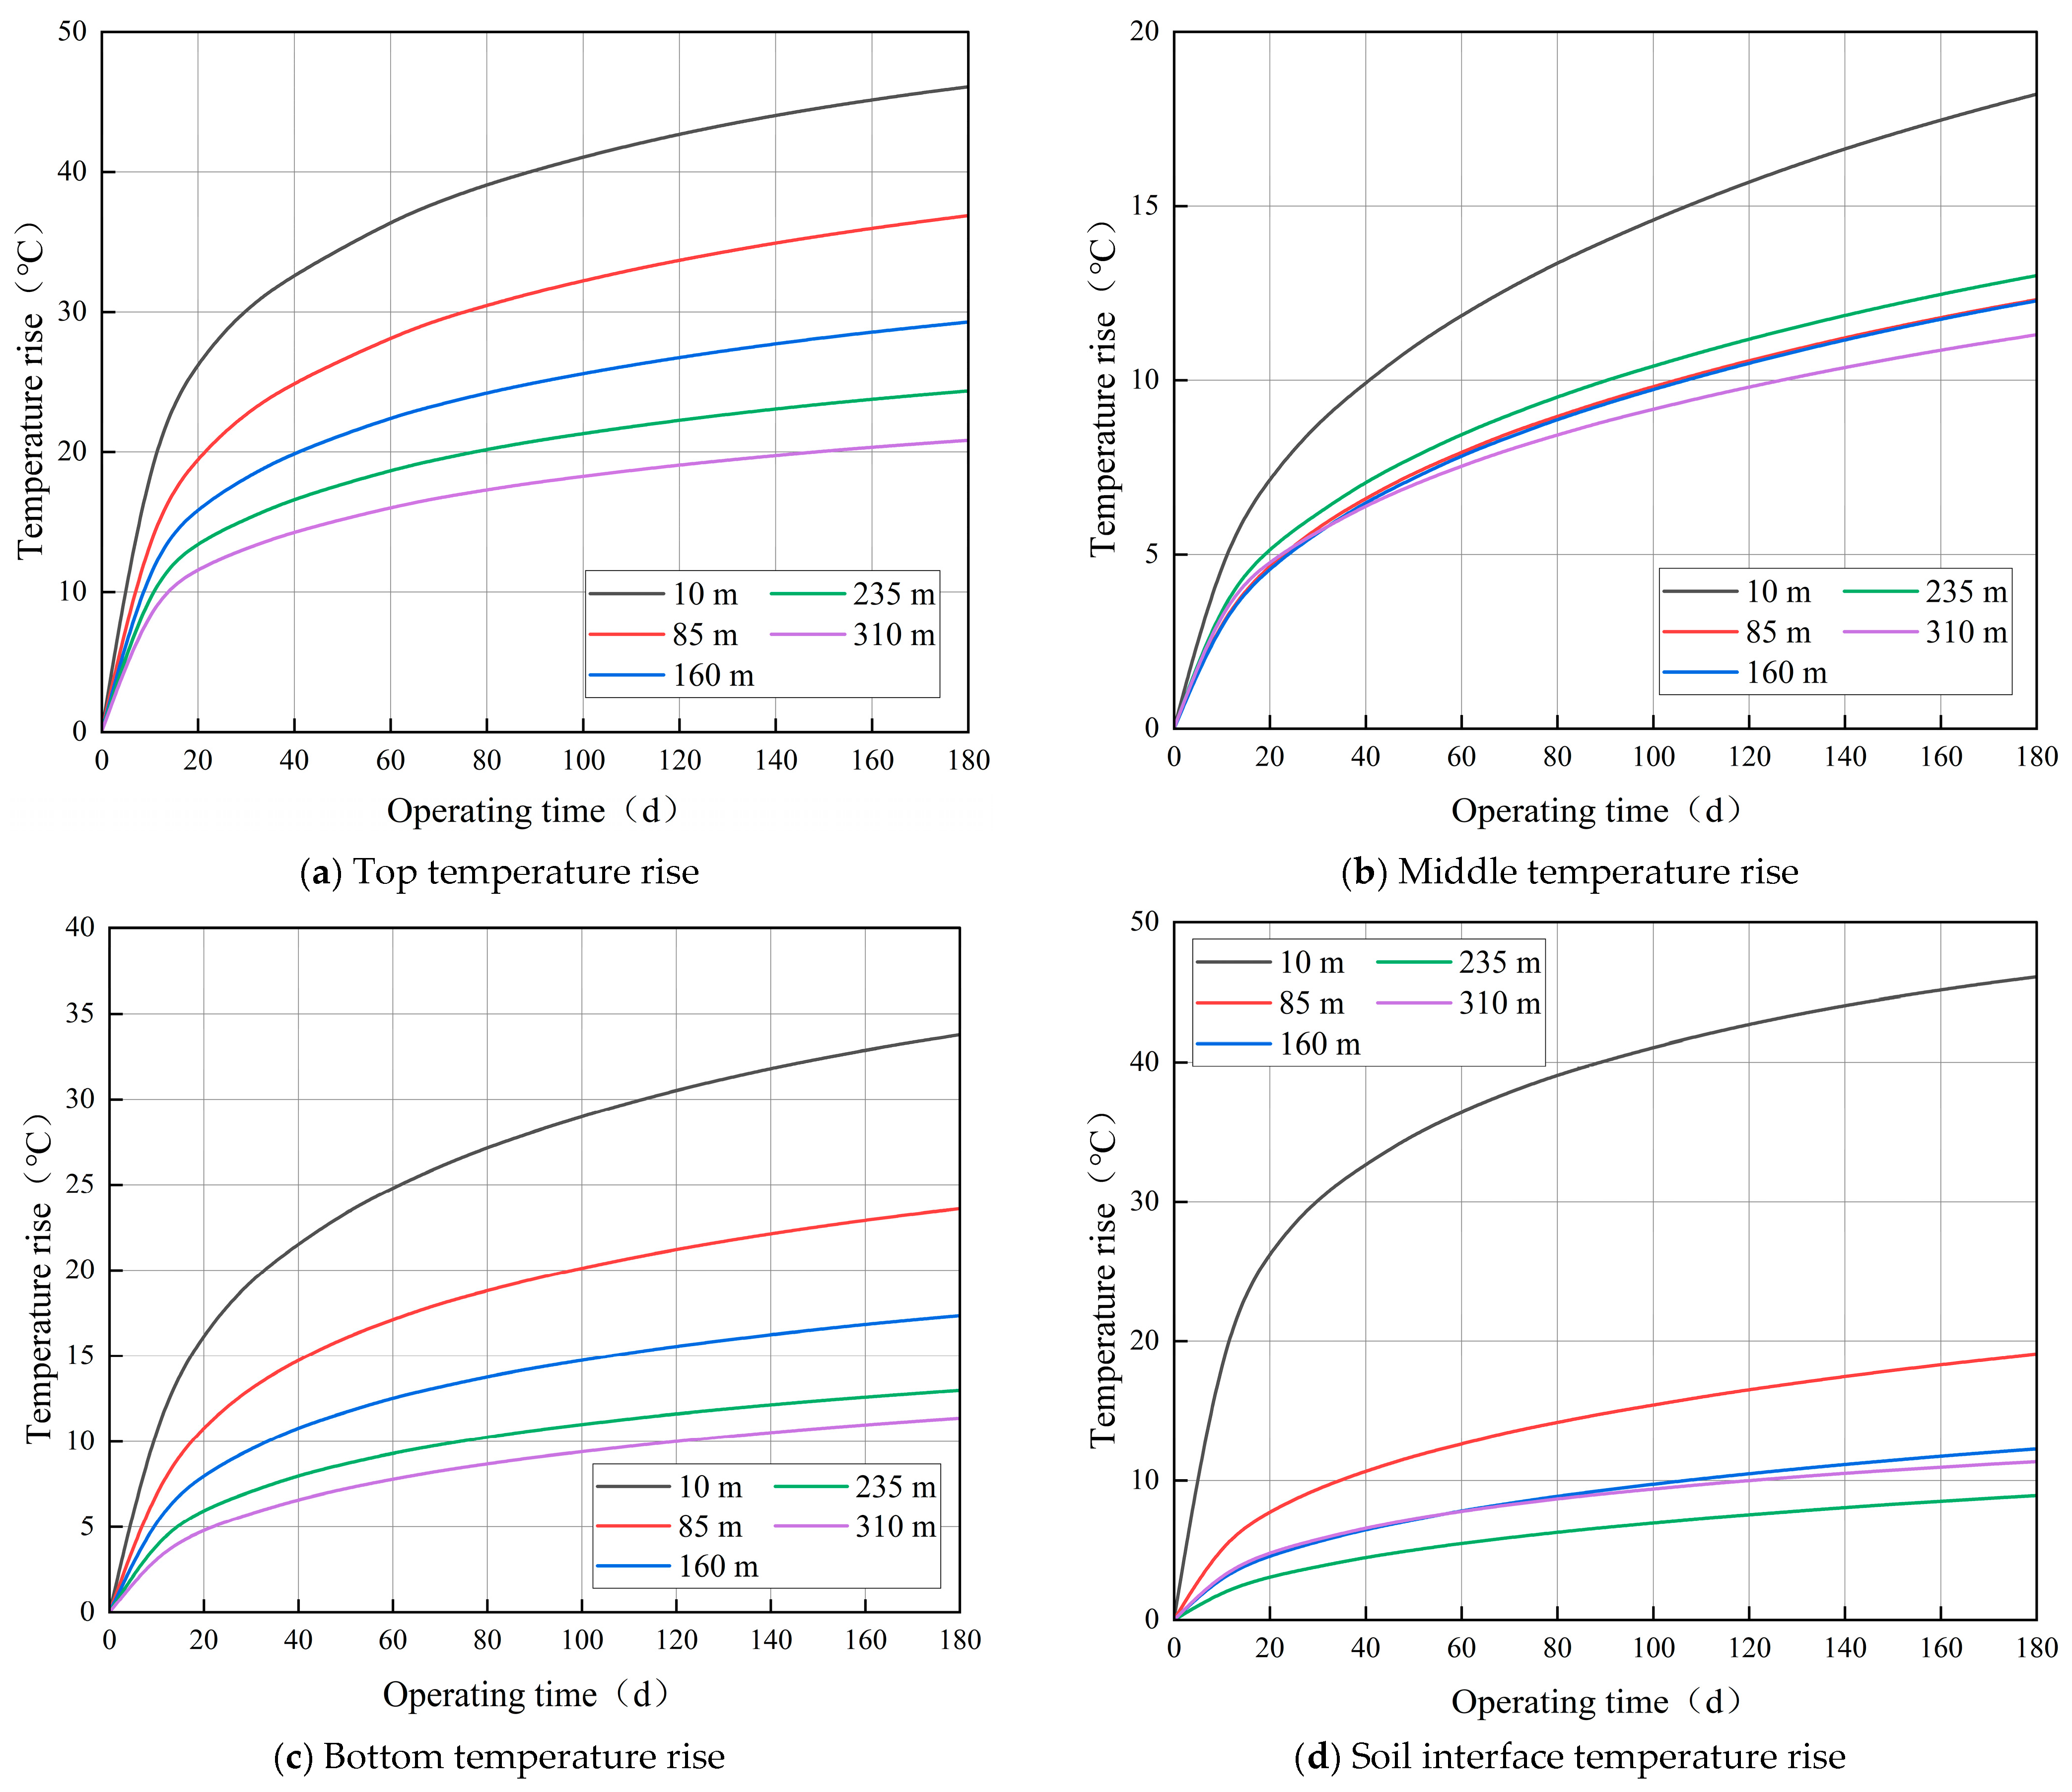
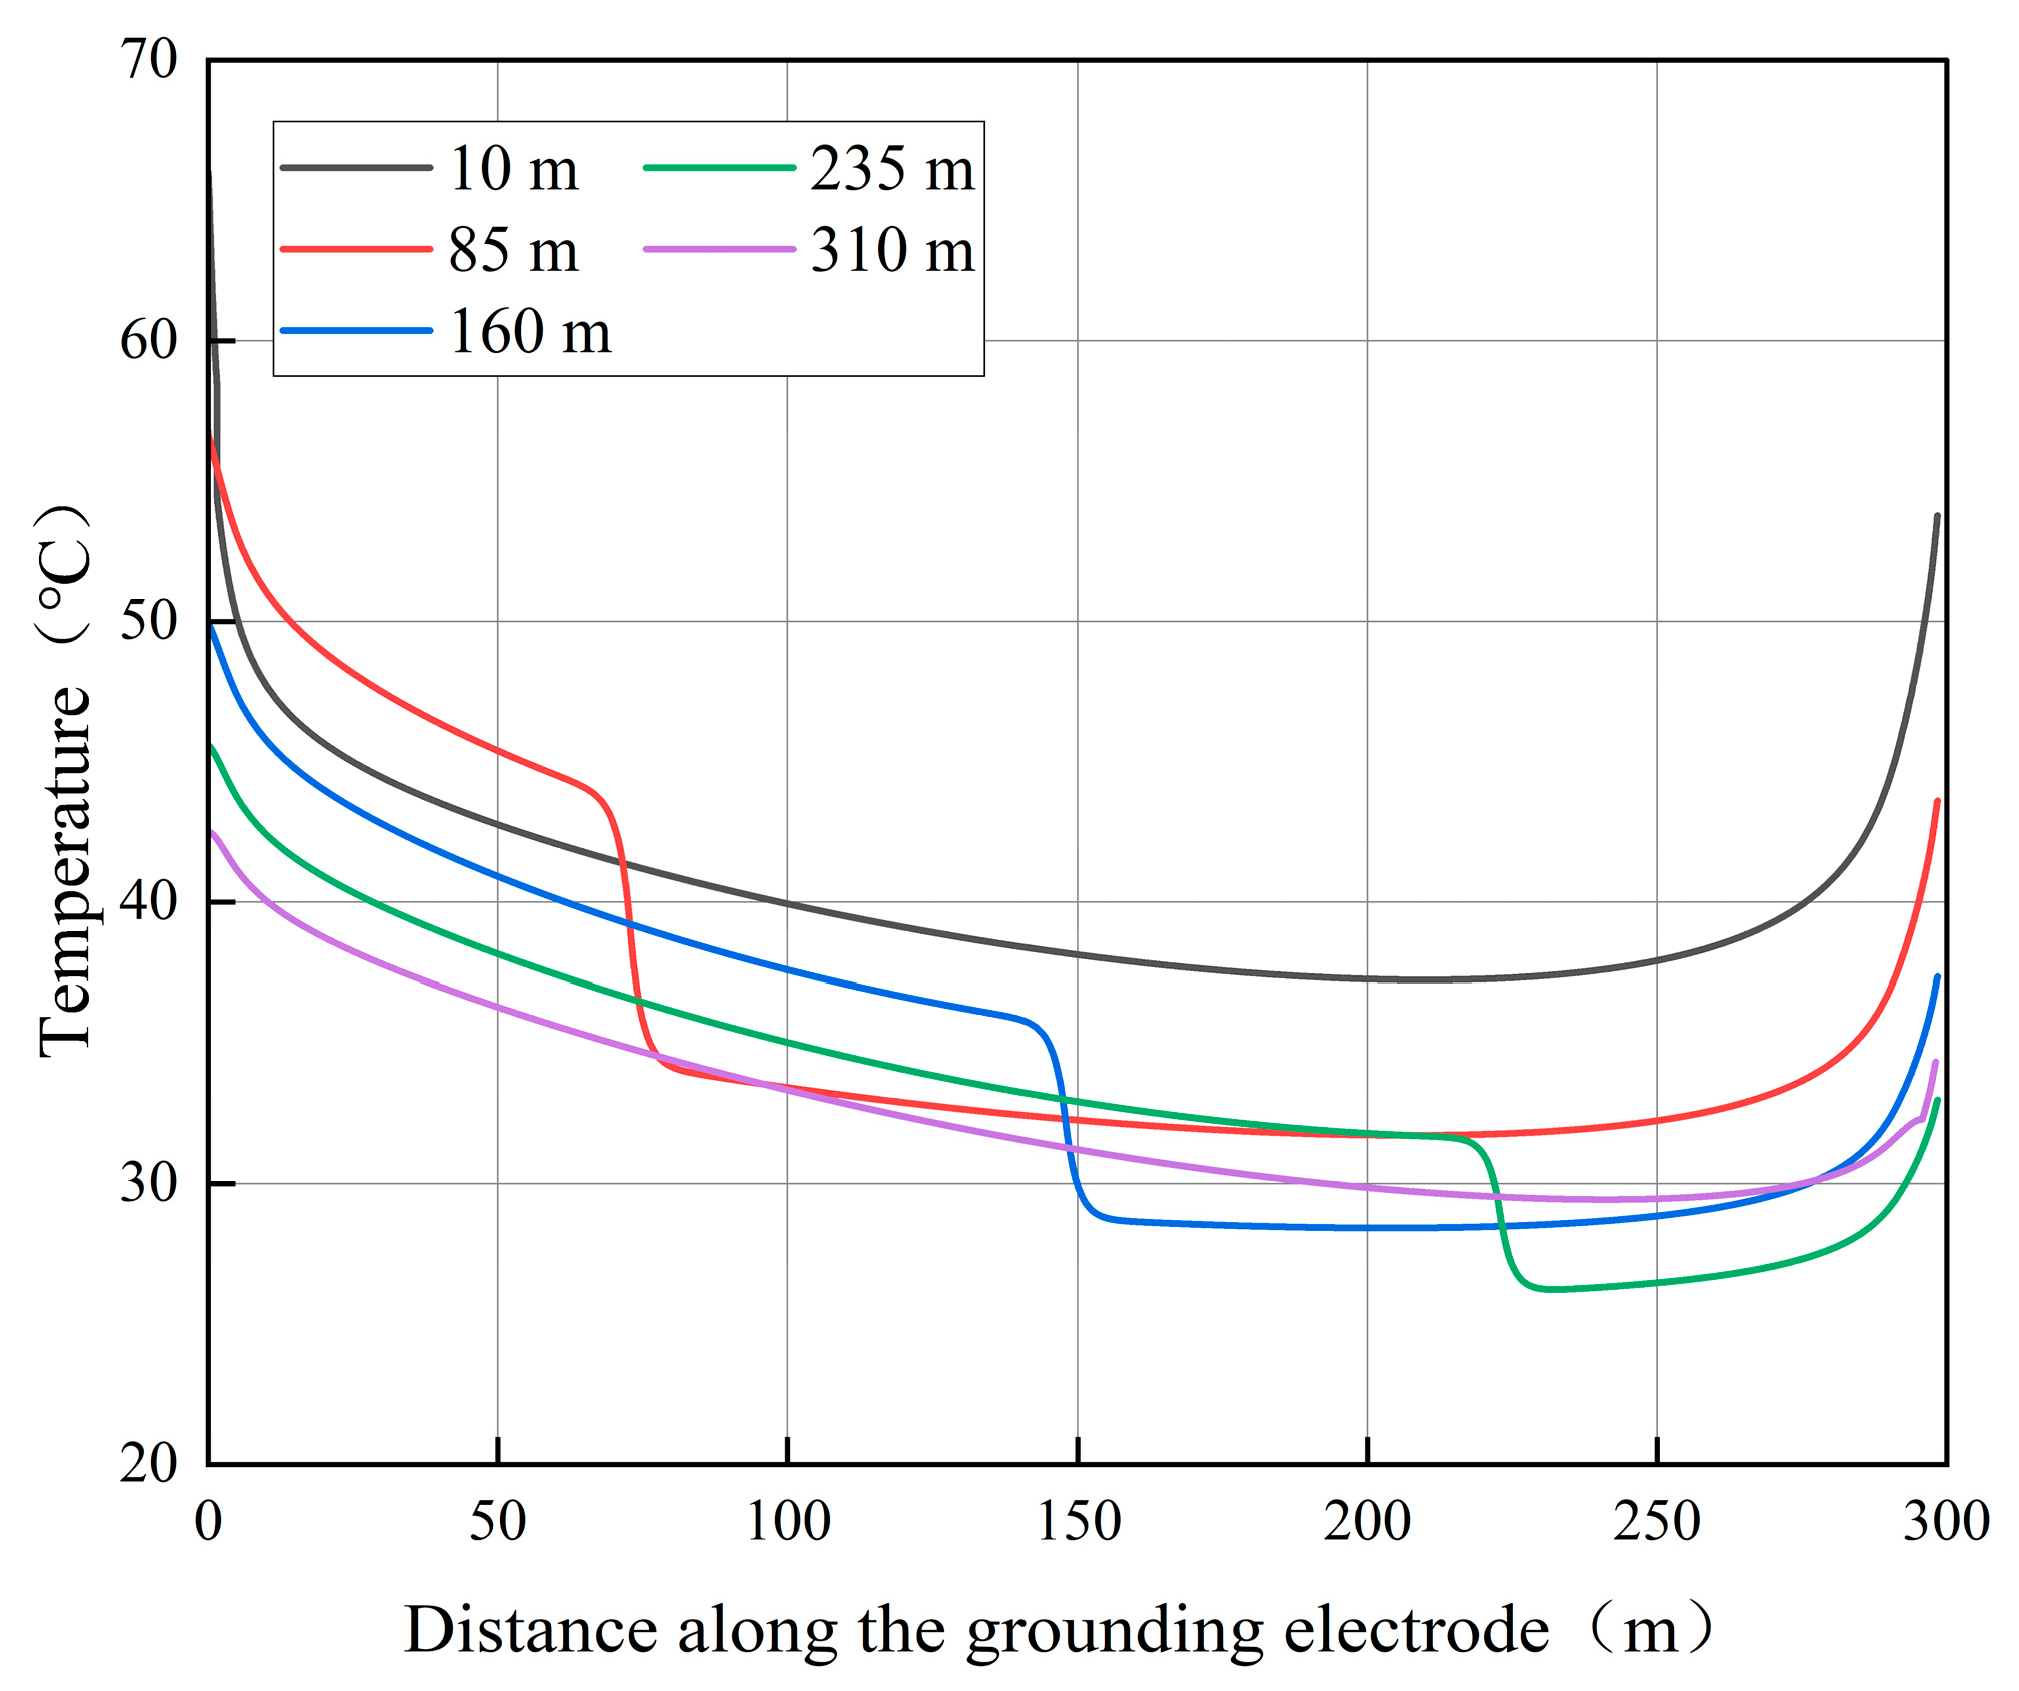
When the initial soil resistivity of the upper layer is 100 Ω·m, and that of the lower layer is 50 Ω·m, the calculated temperature rises at the ends, the middle, and the soil interface position of the vertical grounding electrode during normal operation are shown in Figure 26. The temperature distribution along the length of the electrode is illustrated in Figure 27. As the thickness of the upper soil layer increases from 10 m to 310 m, the variation of the maximum temperature rises during normal operation with respect to the upper soil thickness is presented in Figure 28.
As observed in Figure 26 and Figure 27, under non-uniform soil conditions, when the upper soil thickness is 310 m, the temperature rise at the electrode interface reaches 58.2 °C, which is significantly higher than in other cases where the temperature rises remain nearly consistent. As the thickness of the upper soil layer increases, the temperature rise at the bottom of the electrode grows rapidly, leading to a more uneven temperature distribution along its length and a more severe end effect. The temperature distribution exhibits a step-like pattern, with lower temperatures in the upper soil layer and higher temperatures in the lower soil layer.
As shown in Figure 28, with the increase in upper soil thickness, the maximum temperature rise of the vertical grounding electrode continues to escalate, and the rate of temperature rise also increases. This is because the current tends to dissipate through regions with lower resistivity. As the thickness of the upper soil layer increases, a larger portion of the electrode is surrounded by high-resistivity soil, while the low-resistivity soil available for easy dissipation diminishes. Consequently, a massive amount of current is “squeezed” into the lower section of the electrode, causing a sharp surge in local current density and a rapid increase in temperature at the bottom.
As shown in Table 8, when the resistivity of the upper soil layer is higher than that of the lower layer, both the grounding resistance and the maximum step voltage increase as the upper soil thickness grows. This is because when the high-resistivity soil is only 10 m thick, most of the grounding electrode is located in the low-resistivity region, providing smooth current dissipation paths and resulting in low grounding resistance. However, as the thickness of the high-resistivity layer increases, a larger portion of the electrode is surrounded by high-resistivity soil, obstructing the dissipation paths and causing the grounding resistance to rise continuously. Furthermore, more current is forced to establish electric fields in the shallow high-resistivity region near the surface, making the ground potential distribution more concentrated and steeper, which leads to a continuous increase in the maximum step voltage. Furthermore, the calculated maximum step voltages did not exceed the standard permissible threshold.
High-Resistivity Lower Soil Layer
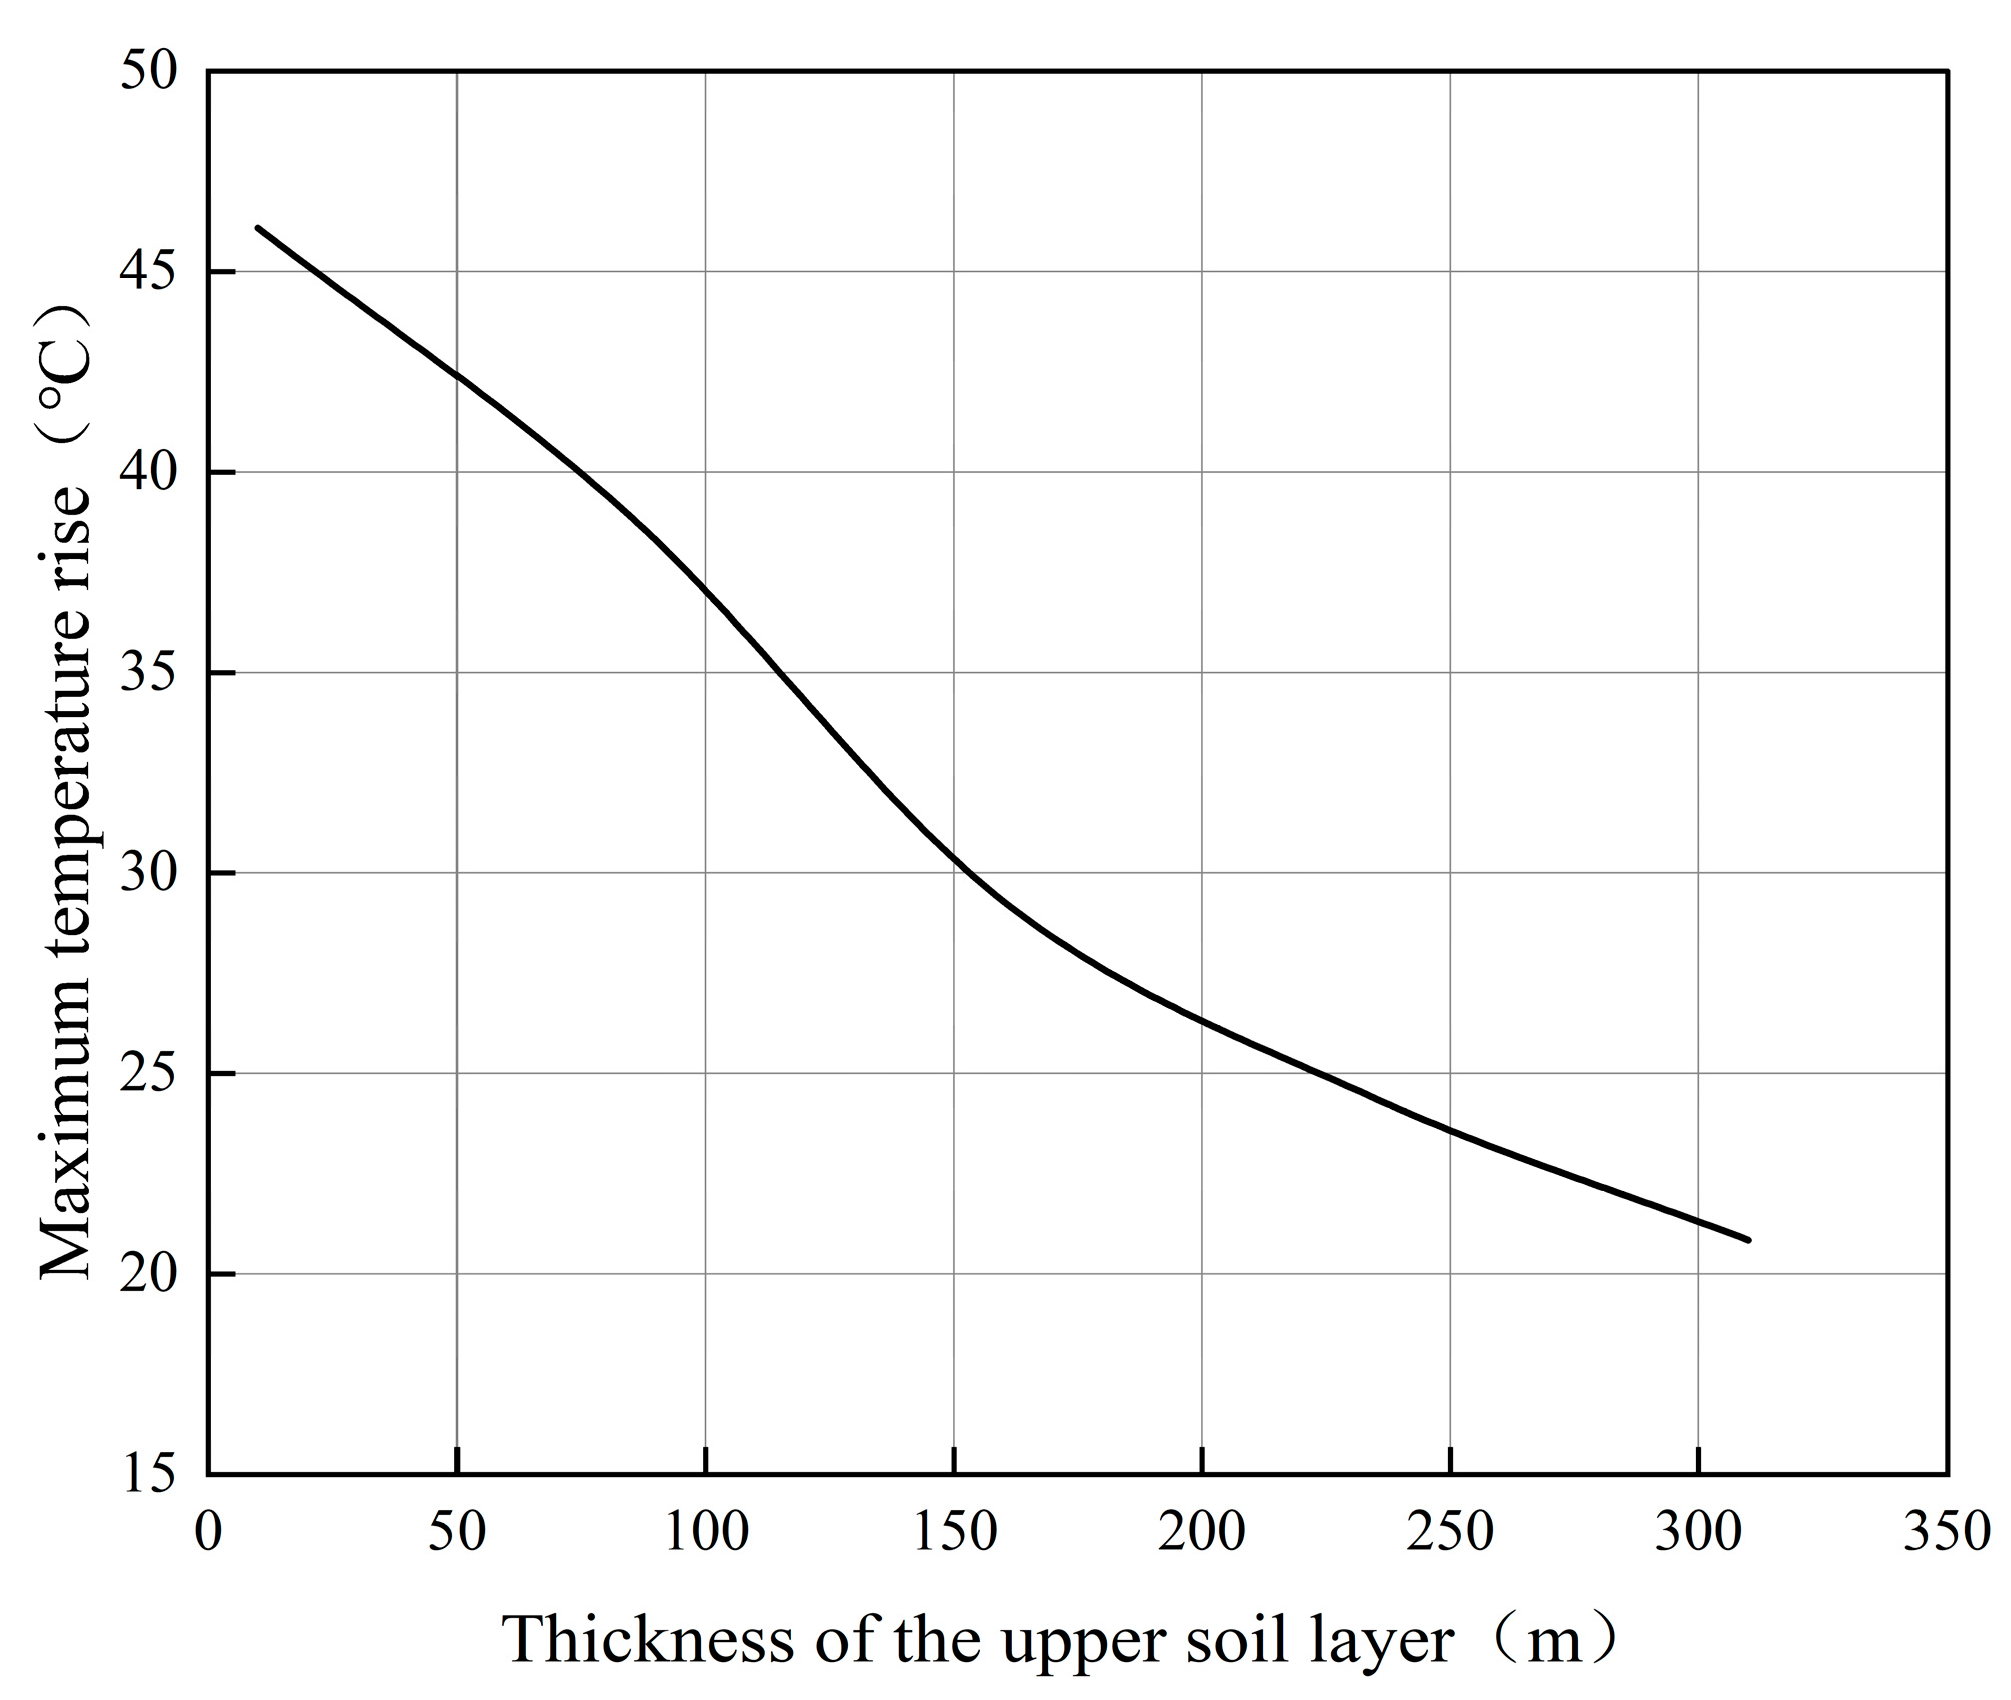
When the initial soil resistivity of the upper layer is 50 Ω·m and that of the lower layer is 100 Ω·m, the calculated temperature rises at the ends, the middle, and the soil interface of the vertical grounding electrode during normal operation are shown in Figure 29. The temperature distribution along the length of the electrode is illustrated in Figure 30. As the thickness of the upper soil layer increases from 10 m to 310 m, the variation of the maximum temperature rises during normal operation with respect to the upper soil thickness is presented in Figure 31.
As observed in Figure 29 and Figure 30, when the upper soil thickness is 10 m, the temperature rise at the electrode interface is 46.1 °C, which is significantly higher than in other cases. As the thickness of the upper soil layer increases, the temperature distribution along the length of the electrode becomes relatively uniform, and the end effect is mitigated. The temperature distribution also exhibits a step-like pattern, with lower temperatures in the lower soil layer and higher temperatures in the upper soil layer.
As shown in Figure 31, with the increase in upper soil thickness, the maximum temperature rise of the vertical grounding electrode continuously decreases, and the rate of temperature rise also decelerates. This is because, as the upper soil thickness grows, a larger portion of the electrode is surrounded by low-resistivity soil. With a greater proportion of the electrode length directly in contact with the low-resistivity soil, the current can easily dissipate outward through the extensive upper region. Consequently, the local current density significantly drops, leading to a substantial reduction in temperature.
As shown in Table 9, when the resistivity of the lower soil layer is higher than that of the upper layer, both the grounding resistance and the maximum step voltage decrease as the upper soil thickness increases. This is because when the low-resistivity soil is only 10 m thick, the grounding electrode is almost entirely situated in the high-resistivity region, where current dissipation is severely obstructed, leading to high grounding resistance. However, as the thickness of the low-resistivity layer grows, a larger portion of the electrode is encased in low-resistivity soil, facilitating easier outward current dissipation and a subsequent reduction in grounding resistance. Furthermore, the superior conductivity of the low-resistivity region causes the surface potential distribution to flatten, thereby reducing the maximum step voltage. Calculated results indicate that all maximum step voltages remain within the permissible limits defined by the standards.

3.2.2. Impact of Different Soil Resistivities on Temperature Rise

To analyze the impact of varying soil resistivities on the temperature rise of the grounding electrode, two scenarios are considered: (1) fixing the resistivity of the lower soil layer while varying the resistivity of the upper layer, and (2) fixing the resistivity of the upper layer while varying the resistivity of the lower layer. The model sets the soil interface at the midpoint of the grounding electrode, corresponding to an upper soil thickness of 160 m. Other model parameters are set according to Table 1 and Table 2.
Fixed Lower Soil Resistivity
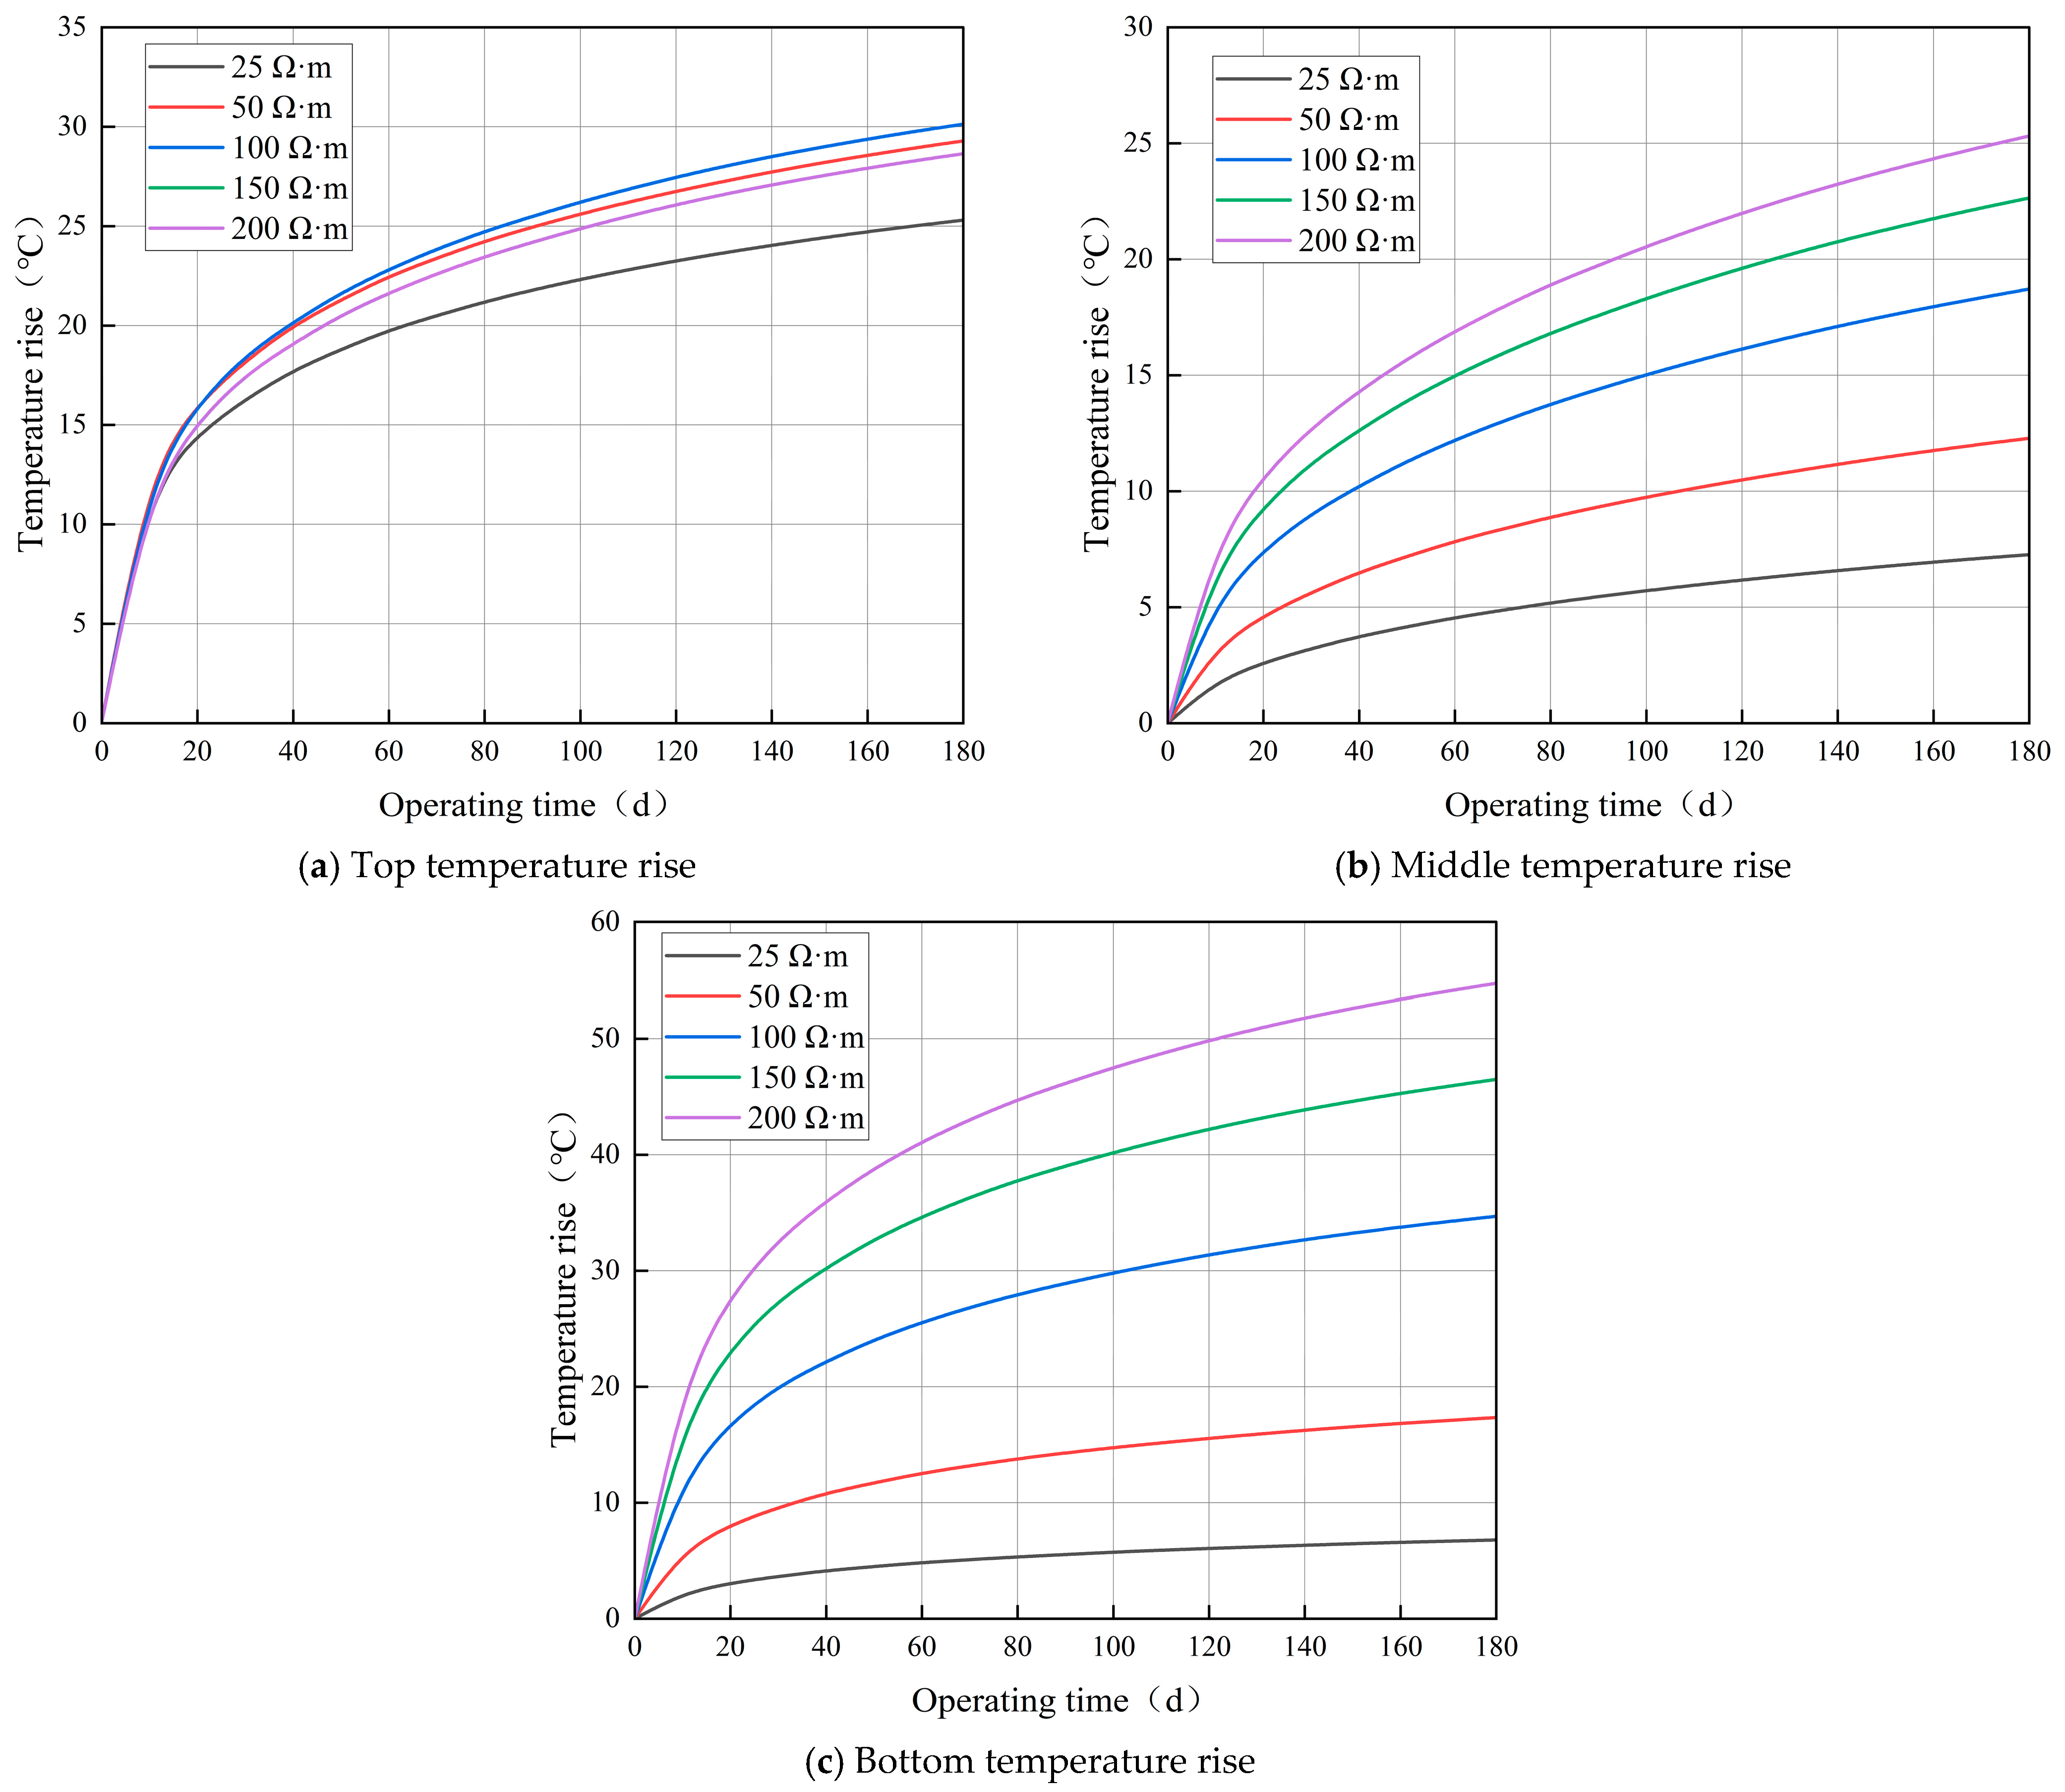
With the lower soil resistivity fixed at 100 Ω·m, the upper soil resistivity is set sequentially to 25 Ω·m, 50 Ω·m, 100 Ω·m, 150 Ω·m, and 200 Ω·m. The calculated temperature rises at the ends and the middle of the vertical grounding electrode during normal operation are shown in Figure 32. The temperature distribution along the length of the electrode is illustrated in Figure 33. As the upper soil resistivity gradually increases from 25 Ω·m to 200 Ω·m, the variation of the maximum temperature rise during normal operation with respect to the upper soil resistivity is presented in Figure 34.
As observed in Figure 32 and Figure 33, as the upper soil resistivity increases, the temperature rise at the top end of the grounding electrode shows marginal difference. The overall temperature distribution of the electrode exhibits a “shovel-shaped” profile, and the location of the maximum temperature rise shifts from the top end to the bottom end. This occurs because when the upper soil resistivity is relatively low, a large amount of current preferentially dissipates through the upper layer, resulting in a high current density in the upper soil. At this stage, the maximum temperature rise point appears at the section of the electrode located in the upper soil layer. Conversely, when the upper soil resistivity is relatively high, the maximum temperature rise point naturally appears at the section of the electrode in the lower soil layer. Overall, the electrode temperature is relatively lower when the upper soil resistivity is less than that of the lower soil, whereas it is higher when the upper soil resistivity exceeds the lower soil resistivity.
As shown in Figure 34, with the increase in upper soil resistivity, the maximum temperature rise of the vertical grounding electrode continuously escalates, and the rate of temperature rise remains largely constant. This is because an increase in upper soil resistivity leads to an increase in the overall equivalent resistivity of the soil. Consequently, the equivalent grounding resistance of the system inevitably increases, which results in a significant surge in the Joule heating power of the grounding electrode, thereby elevating the maximum temperature rise.
As observed in Table 10, when the upper soil resistivity is relatively low, the upper half of the grounding electrode is situated in a highly conductive region, facilitating smooth current dissipation. Additionally, the surface potential gradient in this low-resistivity region remains at a very low level; therefore, the grounding resistance and maximum step voltage are relatively small at this stage. However, as the upper soil resistivity continuously increases, current dissipation from the upper half of the electrode faces increasingly severe obstruction. This causes the current to shift towards the lower half, relatively reducing the effective dissipation area and leading to an increase in grounding resistance. Simultaneously, the potential distribution in the shallow surface layer exhibits a significant attenuation gradient, becoming increasingly steep, which further elevates the maximum step voltage. It is verified that all maximum step voltages are in accordance with the safety limits.
Fixed Upper Soil Resistivity
With the upper soil resistivity fixed at 100 Ω·m, the lower soil resistivity is set sequentially to 25 Ω·m, 50 Ω·m, 100 Ω·m, 150 Ω·m, and 200 Ω·m. The calculated temperature rises at the ends and the middle of the vertical grounding electrode during normal operation are shown in Figure 35. The temperature distribution along the length of the electrode is illustrated in Figure 36. As the lower soil resistivity gradually increases from 25 Ω·m to 200 Ω·m, the calculated variation of the maximum temperature rise during normal operation with respect to the lower soil resistivity is presented in Figure 37.
As observed in Figure 35 and Figure 36, the temperature rise at the bottom end of the grounding electrode shows marginal difference. With the increase in lower soil resistivity, the location of the maximum temperature rise shifts from the bottom end to the top end. The electrode temperature is relatively higher when the lower soil resistivity is less than the upper soil resistivity, whereas it is relatively lower when the lower soil resistivity exceeds the upper soil resistivity.
As shown in Figure 37, as the lower soil resistivity increases, the maximum temperature rise of the vertical grounding electrode continuously escalates, and the rate of temperature rise remains largely constant. This pattern is similar to the scenario where the lower soil resistivity is fixed while the upper soil resistivity is varied.
As shown in Table 11, with the upper soil resistivity fixed, both the grounding resistance and the maximum step voltage exhibit an upward trend as the lower soil resistivity increases. This is consistent with the previously discussed scenario where the lower soil resistivity is fixed. Notably, when the soil resistivity is relatively high, altering the lower soil resistivity has a more pronounced impact on the grounding resistance than altering the upper soil resistivity.
When the lower soil resistivity is relatively low, the lower half of the grounding electrode dominates the current dissipation, preventing massive current accumulation in the upper soil. Consequently, the grounding resistance and maximum step voltage remain relatively small. However, as the lower soil resistivity continuously increases, the lower soil’s obstruction to current flow escalates sharply, leading to a corresponding increase in the grounding resistance. A substantial amount of current is forced to shift from the lower layer to the upper layer, which now possesses a relatively lower resistivity. This shift significantly increases the local current dissipation density in the upper soil, causing the surface potential to rise continuously and become steeper. According to the calculations, the maximum step voltage levels comply with the standard requirements.
In summary, this chapter has detailed the impact of various parameters on grounding electrode performance. A comprehensive summary of the influence of these key parameters and their core physical mechanisms is provided in Appendix A (see Table A1).

4. Discussion

Based on the established bidirectionally coupled electro-thermal finite element model of a vertical DC grounding electrode, this study comparatively analyzes the transient temperature rise and the variation laws of key grounding characteristics under uniform and two-layer non-uniform soil conditions. Under uniform soil conditions, simulation results indicate that soil resistivity is the primary factor determining the temperature rise and grounding characteristics. As soil resistivity increases, the current dissipation resistance of the grounding electrode increases, leading to a significant elevation in both grounding resistance and maximum step voltage. However, although an increase in soil thermal conductivity and specific heat capacity can effectively promote heat diffusion and alleviate heat accumulation at the coke–soil interface, it has essentially no impact on improving the step voltage and grounding resistance. Furthermore, increasing the coke cross-sectional radius is equivalent to expanding the effective heat dissipation and current dissipation areas, which can effectively reduce the temperature rise, grounding resistance, and maximum step voltage. Under two-layer non-uniform soil conditions, due to the extreme non-uniformity of the current dissipation distribution, the temperature distribution along the length of the electrode exhibits a step-like pattern, with current demonstrating a tendency to concentrate in low-resistivity soil. When the high-resistivity soil layer is relatively thick, a massive amount of current is forced to squeeze into the limited area of the low-resistivity region for dissipation. This phenomenon causes a sharp surge in local current density at the bottom, resulting in a rapid temperature increase. Simultaneously, the severe obstruction of the dissipation paths by the high-resistivity soil layer directly leads to a noticeable increase in the overall grounding resistance and maximum step voltage of the system.
In modern high-voltage direct current (HVDC) transmission systems, the grounding electrode is a critical infrastructure component under the monopolar ground return operation mode. The continuous injection of large currents into the ground not only generates a substantial amount of Joule heat but also accelerates the evaporation of soil moisture due to the temperature rise, leading to non-linear changes in parameters such as soil resistivity. The findings of this study offer valuable insights for practical DC grounding electrode engineering. Previous studies have mostly focused on singular electric or temperature field analyses, typically utilizing software such as CDEGS to evaluate the temperature rise and grounding characteristics under constant parameters. Through bidirectionally coupled dynamic simulation, this study supplementarily reveals that the non-linear increase in soil resistivity not only leads to the continuous deterioration of the system’s grounding resistance but also intensifies the surface electric field strength. This makes the surface potential distribution steeper, thereby causing an elevation in the maximum step voltage. Therefore, in the safety margin verification of actual engineering projects, it is imperative to consider the changes in step voltage induced by temperature rise. The application of a coke cross-section can suppress the temperature rise and reduce grounding resistance, providing theoretical support from a thermal dimension for previous engineering designs that relied on grounding enhancement materials. However, to optimize the cost–benefit ratio a coke bed radius of 0.5 m is highly recommended. Expanding beyond this threshold yields severely diminished thermal benefits that cannot justify the drastically increased excavation and material costs. In double-layer or complex geological conditions, the maximum temperature rise point always shifts towards the region with lower soil electrical resistivity. This finding provides critical guidelines for practical engineering. During site surveying, deep soil sounding is recommended to identify precise resistivity contrasts across subterranean layers. If placing the electrode across highly heterogeneous layers is unavoidable, a uniform design should be reconsidered. To prevent rapid local overheating in the low-resistivity layer, a non-uniform design strategy is recommended. The cross-sectional radius of the coke bed should be selectively enlarged or the electrode length extended specifically within this low-resistivity zone to safely dissipate the concentrated current. Furthermore, due to the unavoidable end effect that causes a U-shaped temperature distribution, it is advised to apply enhanced thermal conductive materials or locally increase the diameter, specifically at the top and bottom tips of the electrode to prevent localized thermal runaway.
Despite the valuable findings obtained in this study regarding the electro-thermal coupled temperature rise and grounding characteristics, there are certain limitations due to the computational scale and the complexity of the physical models. First, this paper utilizes a 2D axisymmetric model to approximate the vertical DC grounding electrode. While this approach is accurate for the ideal scenario of a perfectly vertical installation, it fundamentally assumes absolute radial symmetry and uniform horizontal soil stratification. In realistic geological environments, however, conditions such as tilted soil layers or horizontal soil heterogeneity are commonplace. These asymmetric factors can disrupt uniform heat dissipation, potentially leading to localized thermal accumulation that the current 2D axisymmetric model cannot fully capture. Consequently, the temperature rise in practical, heterogeneous scenarios may exhibit localized deviations from the symmetric predictions. Future work will focus on developing a comprehensive 3D soil simulation model that incorporates spatial heterogeneity and tilted stratifications in order to further evaluate the thermal safety of DC grounding electrodes under complex terrain conditions. Second, this study adopts a macroscopic equivalent method that does not explicitly simulate complex micro physical processes such as soil moisture migration vapor diffusion and liquid gas-phase change. Under practical conditions when soil water boils into vapor, it absorbs a large amount of heat, which temporarily prevents the temperature from rising too fast. Furthermore, vapor diffusion carries heat away but also makes the local soil dry faster. In addition, the dried soil draws in fresh liquid water from surrounding wet areas, which helps cool the grounding electrode. Overall, these mechanisms initially act as a cooling system to delay the heating process. However, once the local moisture is completely dried out, the soil resistivity suddenly spikes, leading to rapid thermal runaway. Developing a fully coupled electro thermal hydraulic model to explicitly simulate these precise processes is a critical direction for future research. Furthermore, actual soil stratification at electrode sites often involves multiple layers with inclination angles. It should be noted that this study primarily focuses on horizontal stratification. In practical geological environments with inclined strata, the fundamental physical mechanism of current concentrating in low-resistivity zones remains strictly valid. Therefore, the qualitative conclusions regarding localized thermal runaway and the mitigating mechanism of the coke bed are fully applicable to such complex scenarios. However, inclined strata break the rotational symmetry of the physical field, resulting in an asymmetric temperature distribution around the vertical grounding electrode. To accurately quantify the transient thermal field under these conditions, future work requires upgrading the current 2D axisymmetric finite element model to a full 3D model, incorporating asymmetric spatial boundaries and complex multi-layer intersection geometries.
Looking ahead, it is particularly important to conduct further research in three aspects. First, regarding the irregularity of geological conditions, characteristic tests on more types of soil should be conducted to supplement and modify the fitting curves of soil parameters, thereby further improving the generalizability of the model. The numerical values of temperature are sensitive to the exact shape of the fitting curves. Different soil types will naturally yield different specific maximum temperatures. Nevertheless, our key conclusions, such as the U-shaped temperature distribution, the severe end effect at the electrode tips, and the current squeezing effect remains unaffected. These macroscopic phenomena are primarily determined by the current squeezing effect at the ends of the grounding electrode and the severe heat retention effect after the soil dries out rather than the exact contour of the fitting curves. Additionally, the fundamental driving force of the nonlinear resistivity variation is soil moisture vaporization at high temperatures. Introducing the soil moisture migration mechanism to establish a fully coupled electro thermal hydraulic model, achieving a transition from parameter equivalence to physical mechanisms, and more accurately simulating the moisture variation process around the grounding electrode is a key direction for future research. In the two-layer soil model, it is anticipated that moisture migration will act as a dynamic negative feedback mechanism to diminish the current squeezing effect. Because the initial current naturally squeezes into the low-resistivity layer, this region will experience the most intense Joule heating and the fastest moisture vaporization. The subsequent localized soil drying will cause a sharp increase in the local soil electrical resistivity of this specific layer forcing the current to redistribute toward the adjacent layer. Therefore, during this dynamic drying phase, the extreme localized current concentration in the initially low resistivity region is expected to be significantly alleviated, thereby automatically balancing the current dissipation process. Moreover, investigating the transient temperature rise and the variation laws of grounding characteristics under short-term monopolar ground return operation and step impulse currents will provide a theoretical basis for the safety early-warning of electrode sites. These future studies will not only perfect the existing methodological framework but also propel DC grounding electrode engineering toward a more in-depth direction.

5. Conclusions

Based on the electro-thermal coupling theory, a finite element model of a vertical DC grounding electrode was established using COMSOL Multiphysics simulation software. By considering the dynamic temperature-dependent characteristics of soil resistivity, thermal conductivity, and specific heat capacity, this study thoroughly investigated the temperature rise patterns and grounding characteristics of the electrode under both uniform and non-uniform stratified soil conditions. The main conclusions are as follows:
(1)
Through a comprehensive comparison of the CDEGS software results, field measurements, the constant parameter model, and the dynamic parameter model, the accuracy and superiority of the proposed dynamic electrothermal coupled model are verified. Research indicates that under long-term, high-current operating conditions, the traditional constant parameter model severely underestimates the late-stage temperature rise. Therefore, it is strictly necessary to consider the nonlinear surge in soil resistivity caused by high-temperature moisture dissipation. The proposed dynamic model reflects the actual physical process of thermal runaway much more authentically than the constant parameter model.
(2)
In uniform soil structures, soil resistivity exhibits a significant positive linear correlation with the maximum temperature rise of the grounding electrode, acting as the primary factor influencing heat generation. An increase in soil resistivity obstructs current dissipation, leading to a significant elevation in grounding resistance and maximum step voltage, yet it has no impact on the average current dissipation density. Soil thermal conductivity is negatively correlated with the maximum temperature rise; high thermal conductivity effectively alleviates heat accumulation at the coke–soil interface, preventing local overheating, while its variation has virtually no substantial impact on grounding resistance, maximum step voltage, or average current dissipation density. Soil specific heat capacity is also negatively correlated with the maximum temperature rise, though its impact is relatively minor, and it has no obvious effect on the three grounding characteristics. Increasing the coke cross-sectional radius significantly reduces the current density at the contact surface and provides a larger heat dissipation area. This is an effective means of suppressing temperature rise—despite a diminishing marginal benefit—and it simultaneously reduces grounding resistance and maximum step voltage effectively.
(3)
In two-layer soil structures, the temperature along the length of the grounding electrode exhibits a distinct step-like distribution. Because the current tends to dissipate into low-resistivity soil, the current density within the low-resistivity layer is large, causing severe heat generation, whereas the temperature of the electrode in the high-resistivity soil is relatively lower. At the soil interface, a significant temperature mutation occurs because the rate of heat diffusion is far slower than the rate of electrothermal generation. When the upper soil resistivity is higher than that of the lower layer, an increase in the thickness of the upper high-resistivity layer forces the current to squeeze downward. This causes the current density at the bottom of the electrode to surge, leading to a continuous increase in the maximum temperature rise and an accelerated rate of temperature rise. Conversely, when the upper soil resistivity is lower, an increase in the thickness of the upper low-resistivity layer allows more current to dissipate through the extensive upper region, resulting in a continuous decrease in the maximum temperature rise and a decelerated rate of temperature rise. Altering the resistivity of either layer in a two-layer soil causes the maximum temperature rise point to shift, invariably appearing in the region with relatively lower resistivity: if the upper resistivity is lower, the hot spot is at the upper part of the electrode; if the lower resistivity is lower, the hot spot shifts to the bottom. Regardless of whether the upper or lower soil resistivity is changed, as long as the total equivalent grounding resistance of the system increases, the maximum temperature rise of the electrode exhibits a monotonically increasing trend. Evidently, the obstruction effect of high-resistivity soil layers on current dissipation is highly significant. Whether in the upper or lower layer, an increase in the thickness or the intrinsic value of the high-resistivity soil forces a massive amount of current to establish electric fields in localized areas. This makes the surface potential distribution more concentrated and steeper, which not only aggravates local heat generation and elevates the temperature rise but also drives an upward trend in both grounding resistance and maximum step voltage.

Author Contributions

Conceptualization, C.D.; methodology, Z.F.; software, Z.F.; validation, Z.F. and W.L.; formal analysis, Z.F.; investigation, C.D., Z.F., and W.L.; resources, C.D.; data curation, Z.F.; writing—original draft preparation, Z.F.; writing—review and editing, C.D. and W.L.; visualization, W.L.; supervision, C.D.; project administration, C.D. All authors have read and agreed to the published version of the manuscript.

Funding

This research received no external funding.

Data Availability Statement

The data used in this study are available from the corresponding author upon reasonable request.

Conflicts of Interest

The authors declare no conflicts of interest.

Nomenclature

The following abbreviations are used in this manuscript:
HVDCHigh Voltage Direct Current
φ Electric potential
γ Electrical conductivity
Γ Infinity boundary
Γ s Ground surface boundary
E Electric field intensity
J Current density
Q Heat source density
ρ Soil resistivity
T Temperature
C v Volumetric heat capacity
k Soil thermal conductivity
h 0 Ground surface heat transfer coefficient
E s t e p Step voltage
ρ s Ground surface resistivity
CDEGSCurrent Distribution Electromagnetic Grounding and Soil Structure Analysis

Appendix A

To improve clarity and systematically compare the parametric analysis results, the influences of key parameters on the transient thermal and electrical performances of the grounding electrode are summarized in Table A1.
Table A1. Summary of the influence of key parameters on grounding electrode performance.
Key ParameterVariationImpact on Maximum Temperature RiseImpact on Electrical PerformanceCore Physical Mechanism
Soil ResistivityIncreaseSignificant IncreaseSignificant IncreaseAmplifies local Joule heat generation
Thermal ConductivityIncreaseDecreaseMinor EffectAccelerates spatial heat dissipation
Specific Heat CapacityIncreaseDecreaseMinor EffectEnhances thermal energy absorption capacity
Coke Bed RadiusIncreaseSignificant DecreaseDecreaseBuffers concentrated current density
Layered SoilHigh resistivity adjacent to low resistivityLocal overheating in low resistivity layerOverall performance deteriorationForces current to squeeze into lower resistivity regions

References

  1. Li, Y.; Wang, F.; Teng, Y.; Cai, H.; Hu, S.; Wen, X.; Lan, L.; Liao, D.; Lu, H. Study on threshold value of gas generation current density of DC deep well grounding electrode. CSEE J. Power Energy Syst. 2025, early access. [Google Scholar] [CrossRef]
  2. Lu, H.; Jing, M.; Cai, H.; Hu, S.; Teng, Y.; Chen, J.; Lan, L.; Wen, X. Soil resistivity modeling for temperature rise calculating of HVDC deep-well earth electrode. Int. J. Electr. Power Energy Syst. 2021, 125, 106537. [Google Scholar] [CrossRef] [Scilit]
  3. Marzinotto, M.; Mazzanti, G.; Nervi, M. Ground/sea return with electrode systems for HVDC transmission. Int. J. Electr. Power Energy Syst. 2018, 100, 222–230. [Google Scholar] [CrossRef] [Scilit]
  4. Wang, Y.; Pan, Z.; Zha, Z.; Tan, B.; Wen, X.; Liu, Y.; Zhang, J.; Lan, L. Numerical Simulation and Field Test of the Transient Temperature Rise of HVdc Grounding Electrodes. IEEE Trans. Power Deliv. 2018, 33, 22–31. [Google Scholar] [CrossRef] [Scilit]
  5. Xiong, Q.; Liu, X.; Li, Y.; Xi, L.; Qiu, S. Analysis of the Influence of Complex Terrain around DC Transmission Grounding Electrodes on Step Voltage. Energies 2024, 17, 420. [Google Scholar] [CrossRef] [Scilit]
  6. Rao, H.; Zhang, D.; Zhao, X.; Guo, Q. Practice and analyses of UHVDC power transmission. High Volt. Eng. 2015, 41, 2481–2488. (In Chinese) [Google Scholar]
  7. Li, J.; Li, C.; Zhu, Z.; Liu, L.; Wang, L.; Yuan, H.; Ren, J. Finite element dynamic model of ocean grounding electrode characteristics based on circuit and electric–thermal field coupling. Electr. Eng. 2024, 106, 6533–6546. [Google Scholar] [CrossRef] [Scilit]
  8. Li, J.; Zhang, Z.; Cheng, X.; Li, C.; Wu, G.; Zhang, M.; He, P. Research on the temperature rise characteristics of marine grounding electrodes based on circuit and electro-thermal coupling. Electr. Eng. 2026, 108, 185. [Google Scholar] [CrossRef] [Scilit]
  9. Zhou, M.; Wang, J.; Cai, L.; Fan, Y.; Zheng, Z. Laboratory Investigations on Factors Affecting Soil Electrical Resistivity and the Measurement. IEEE Trans. Ind. Appl. 2015, 51, 5358–5365. [Google Scholar] [CrossRef] [Scilit]
  10. Teng, Y.; Wen, X.; Cai, H.; Jia, L.; Liu, G.; Hu, S.; Lu, H. Analysis on structural parameters and electrical performance of dc deep well grounding electrode. J. Eng. 2019, 2019, 2366–2370. [Google Scholar] [CrossRef] [Scilit]
  11. Wen, X.; Jing, M.; Cai, H.; Zhang, Y.; Hu, S.; Teng, Y.; Liu, G.; Lan, L.; Lu, H. Temperature characteristics and influence of water-saturated soil resistivity on the HVDC grounding electrode temperature rise. Int. J. Electr. Power Energy Syst. 2020, 118, 105720. [Google Scholar] [CrossRef] [Scilit]
  12. Theodosoglou, I.; Chatziathanasiou, V.; Papagiannakis, A.; Więcek, B.; De Mey, G. Electrothermal analysis and temperature fluctuations’ prediction of overhead power lines. Int. J. Electr. Power Energy Syst. 2017, 87, 198–210. [Google Scholar] [CrossRef] [Scilit]
  13. Nahman, J.; Tanaskovic, M. Calculation of the loading capacity of high voltage cables laid in close proximity to heat pipelines using iterative finite-element method. Int. J. Electr. Power Energy Syst. 2018, 103, 310–316. [Google Scholar] [CrossRef] [Scilit]
  14. Georges, S.; Slaoui, F. Modelling and simulation of heat dissipation due to HVDC ground electrodes using the finite element method. In Proceedings of the 2014 IEEE Innovative Smart Grid Technologies-Asia (ISGT ASIA), Kuala Lumpur, Malaysia, 20–23 May 2014; pp. 476–480. [Google Scholar]
  15. Asensio, G.; Faleiro, E.; Moreno, J.; García, D.; Denche, G. Joule Heating in Grounding Electrodes Under Fault Conditions: Effects on System Potentials and Electrode Efficiency. Appl. Sci. 2025, 15, 7504. [Google Scholar] [CrossRef] [Scilit]
  16. Chen, X.; Li, L. Study on the Interference of the HVDC Transmission Grounding Electrode to the Pipeline Cathodic Protection System. ACS Omega 2023, 8, 22088–22098. [Google Scholar] [CrossRef] [Scilit]
  17. Mao, H.; Tian, H.; Hu, Y.; Gao, T.; Chen, Y.; Mu, M. Study on Temperature Rise Characteristics of Tower Grounding Electrode Under Lightning Strike and Power Frequency Short-Circuit Conditions. In Proceedings of the 2023 4th International Symposium on Insulation and Discharge Computation for Power Equipment (IDCOMPU2023), Wuhan, China, 26–28 May 2023; pp. 703–711. [Google Scholar]
  18. Gouda, O.E.; Mohamed, A.Z.E.D.; Al-Harthi, M.M.; Omar, S.Y.; Ghoneim, S.S.M. Performance of Grounding Electrodes Under Lightning Strokes in Uniform and Two-Layer Soils Considering Soil Ionization. IEEE Access 2022, 10, 76855–76869. [Google Scholar] [CrossRef] [Scilit]
  19. Lu, H.; Teng, Y.; Chen, B.; Wen, X.; Cai, H.; Hu, S.; Jia, L.; Liu, G. Analysis and calculation of temperature rise of HVDC deep-well earth electrode. In Proceedings of the 2016 IEEE International Conference on High Voltage Engineering and Application (ICHVE), Chengdu, China, 19–22 September 2016; pp. 1–4. [Google Scholar]
  20. Wang, W.; Lu, H.; Wang, Y.; Dong, X.; Cheng, S.; Sun, Z.; Yao, Q. Research on Temperature Rise Characteristics and Calculation Methods of Vertical DC Grounding Electrodes. Smart Power 2022, 50, 7–12. (In Chinese) [Google Scholar]
  21. Wei, Y.; Li, G.; Liu, C. State Assessment and Maintenance Strategy Optimization for DC Grounding Electrode Systems Based on Multi-Parameter Monitoring and Analysis. In Proceedings of the 2025 2nd International Conference on DC Technologies and Systems (DCTS), Beijing, China, 29–30 November 2025; pp. 122–124. [Google Scholar]
  22. Lu, H.; Chen, J.; Tan, B.; Wang, J.; Chen, W.; Hu, S.; Xie, S.; Cai, H.; Li, W.; Wang, S.; et al. Measurement and Safety Criteria of Step Voltage of High Voltage Direct Current Grounding Electrode. IEEE Trans. Power Deliv. 2022, 37, 423–430. [Google Scholar] [CrossRef] [Scilit]
  23. Datsios, Z.G.; Mikropoulos, P.N.; Karakousis, I. Laboratory characterization and modeling of DC electrical resistivity of sandy soil with variable water resistivity and content. IEEE Trans. Dielectr. Electr. Insul. 2017, 24, 3063–3072. [Google Scholar] [CrossRef] [Scilit]
  24. Yan, Y.; Deng, C.; Xia, P.; Zhang, Y.; Ding, N.; Ma, H. Influence of Soil Characteristics on Transient Temperature Rise of Circular DC Grounding Electrode. J. Electr. Power 2024, 39, 160–167. (In Chinese) [Google Scholar]
  25. Chen, Y. Study on the Influence Factors of Grounding Electrode in Deep Well of Converter Station. Constr. Des. Proj. 2018, 100–101+104. (In Chinese) [Google Scholar] [CrossRef]
  26. Wang, J.; Zhang, X.; Du, L. A laboratory study of the correlation between the thermal conductivity and electrical resistivity of soil. J. Appl. Geophys. 2017, 145, 12–16. [Google Scholar] [CrossRef] [Scilit]
  27. Zhang, Y.; Gao, L.; Jiang, K.; Song, L.; Yuan, T.; Chang, F. Study on a coupled model of soil hydrothermal field considering the heat transfer of grounded conductor in soil freezing process. In Proceedings of the Annual Meeting of CSEE Study Committee of HVDC and Power Electronics (HVDC 2023), Nanjing, China, 22–25 October 2023; pp. 356–360. [Google Scholar]
  28. Zhang, B.; He, J.; Zeng, R.; Wu, J. Effect of coke bed on the electrical performance of HVDC ground electrode. In Proceedings of the 2015 IEEE 15th International Conference on Environment and Electrical Engineering (EEEIC), Rome, Italy, 10–13 June 2015; pp. 889–894. [Google Scholar]
Figure 1. Physical process of electro-thermal interaction.
Energies 19 01863 g001
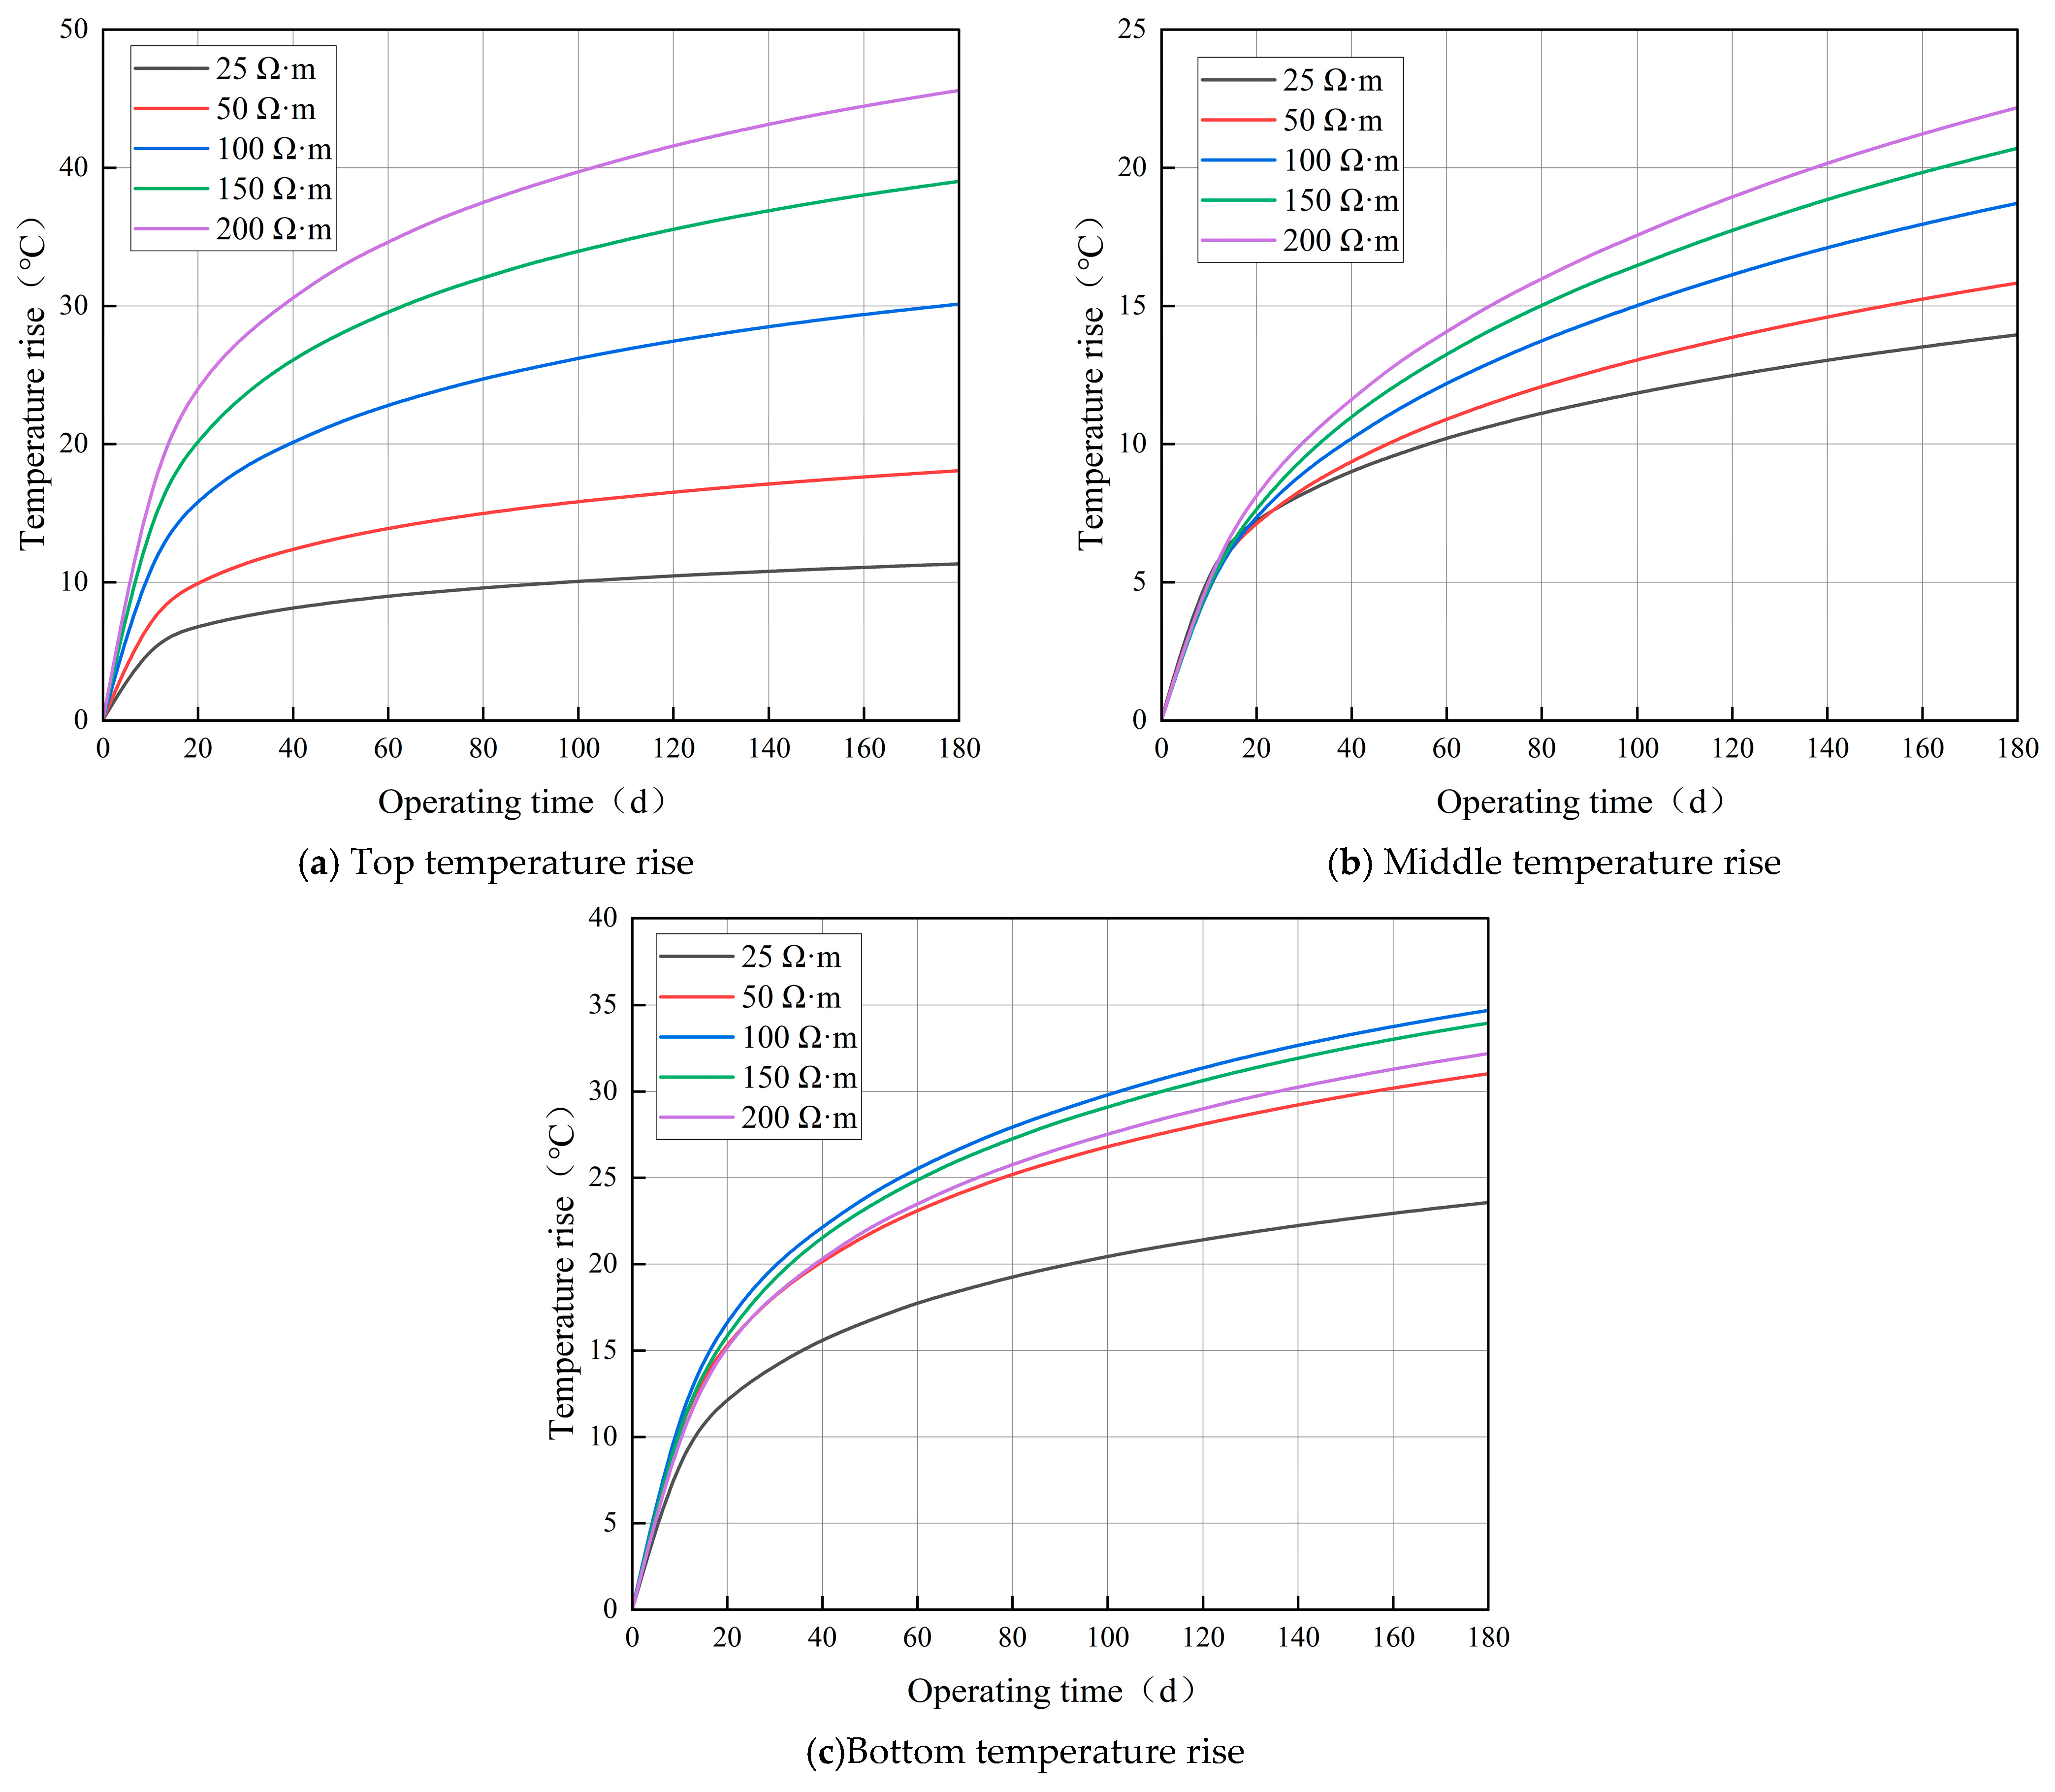
Figure 2. Flowchart of the fully coupled calculation for current and temperature fields.
Energies 19 01863 g002
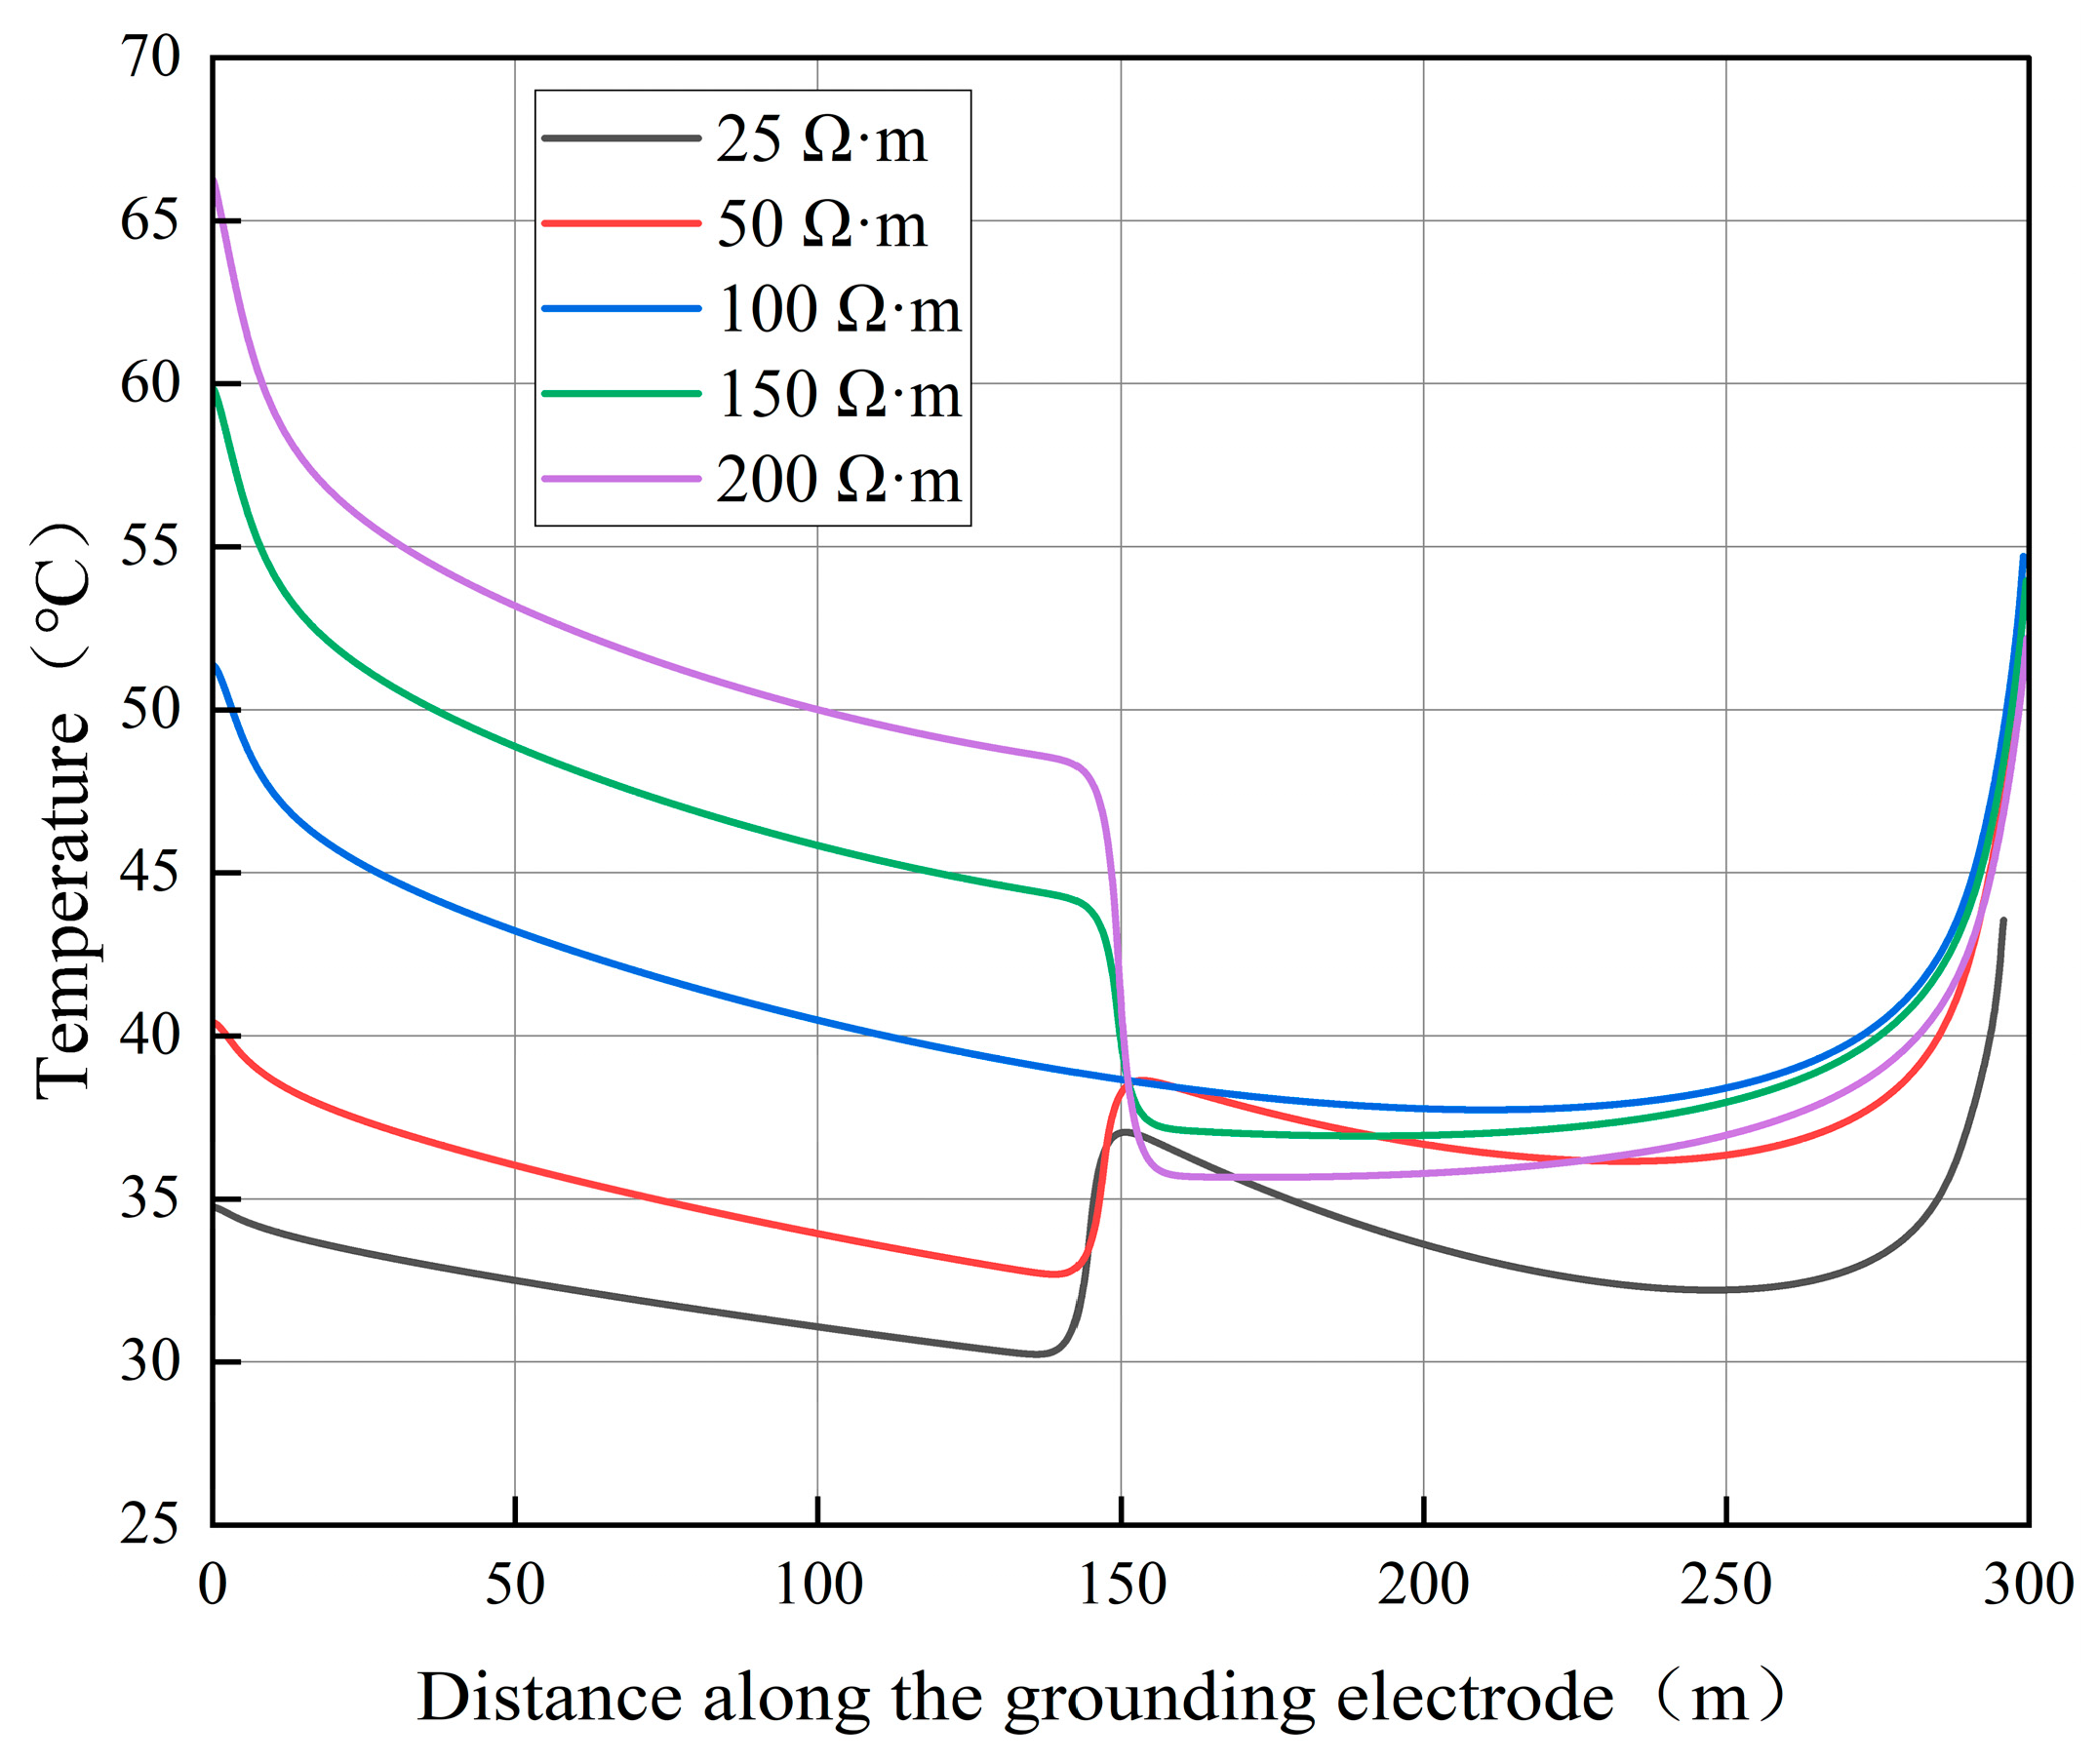
Figure 3. Vertical grounding electrode model.
Energies 19 01863 g003
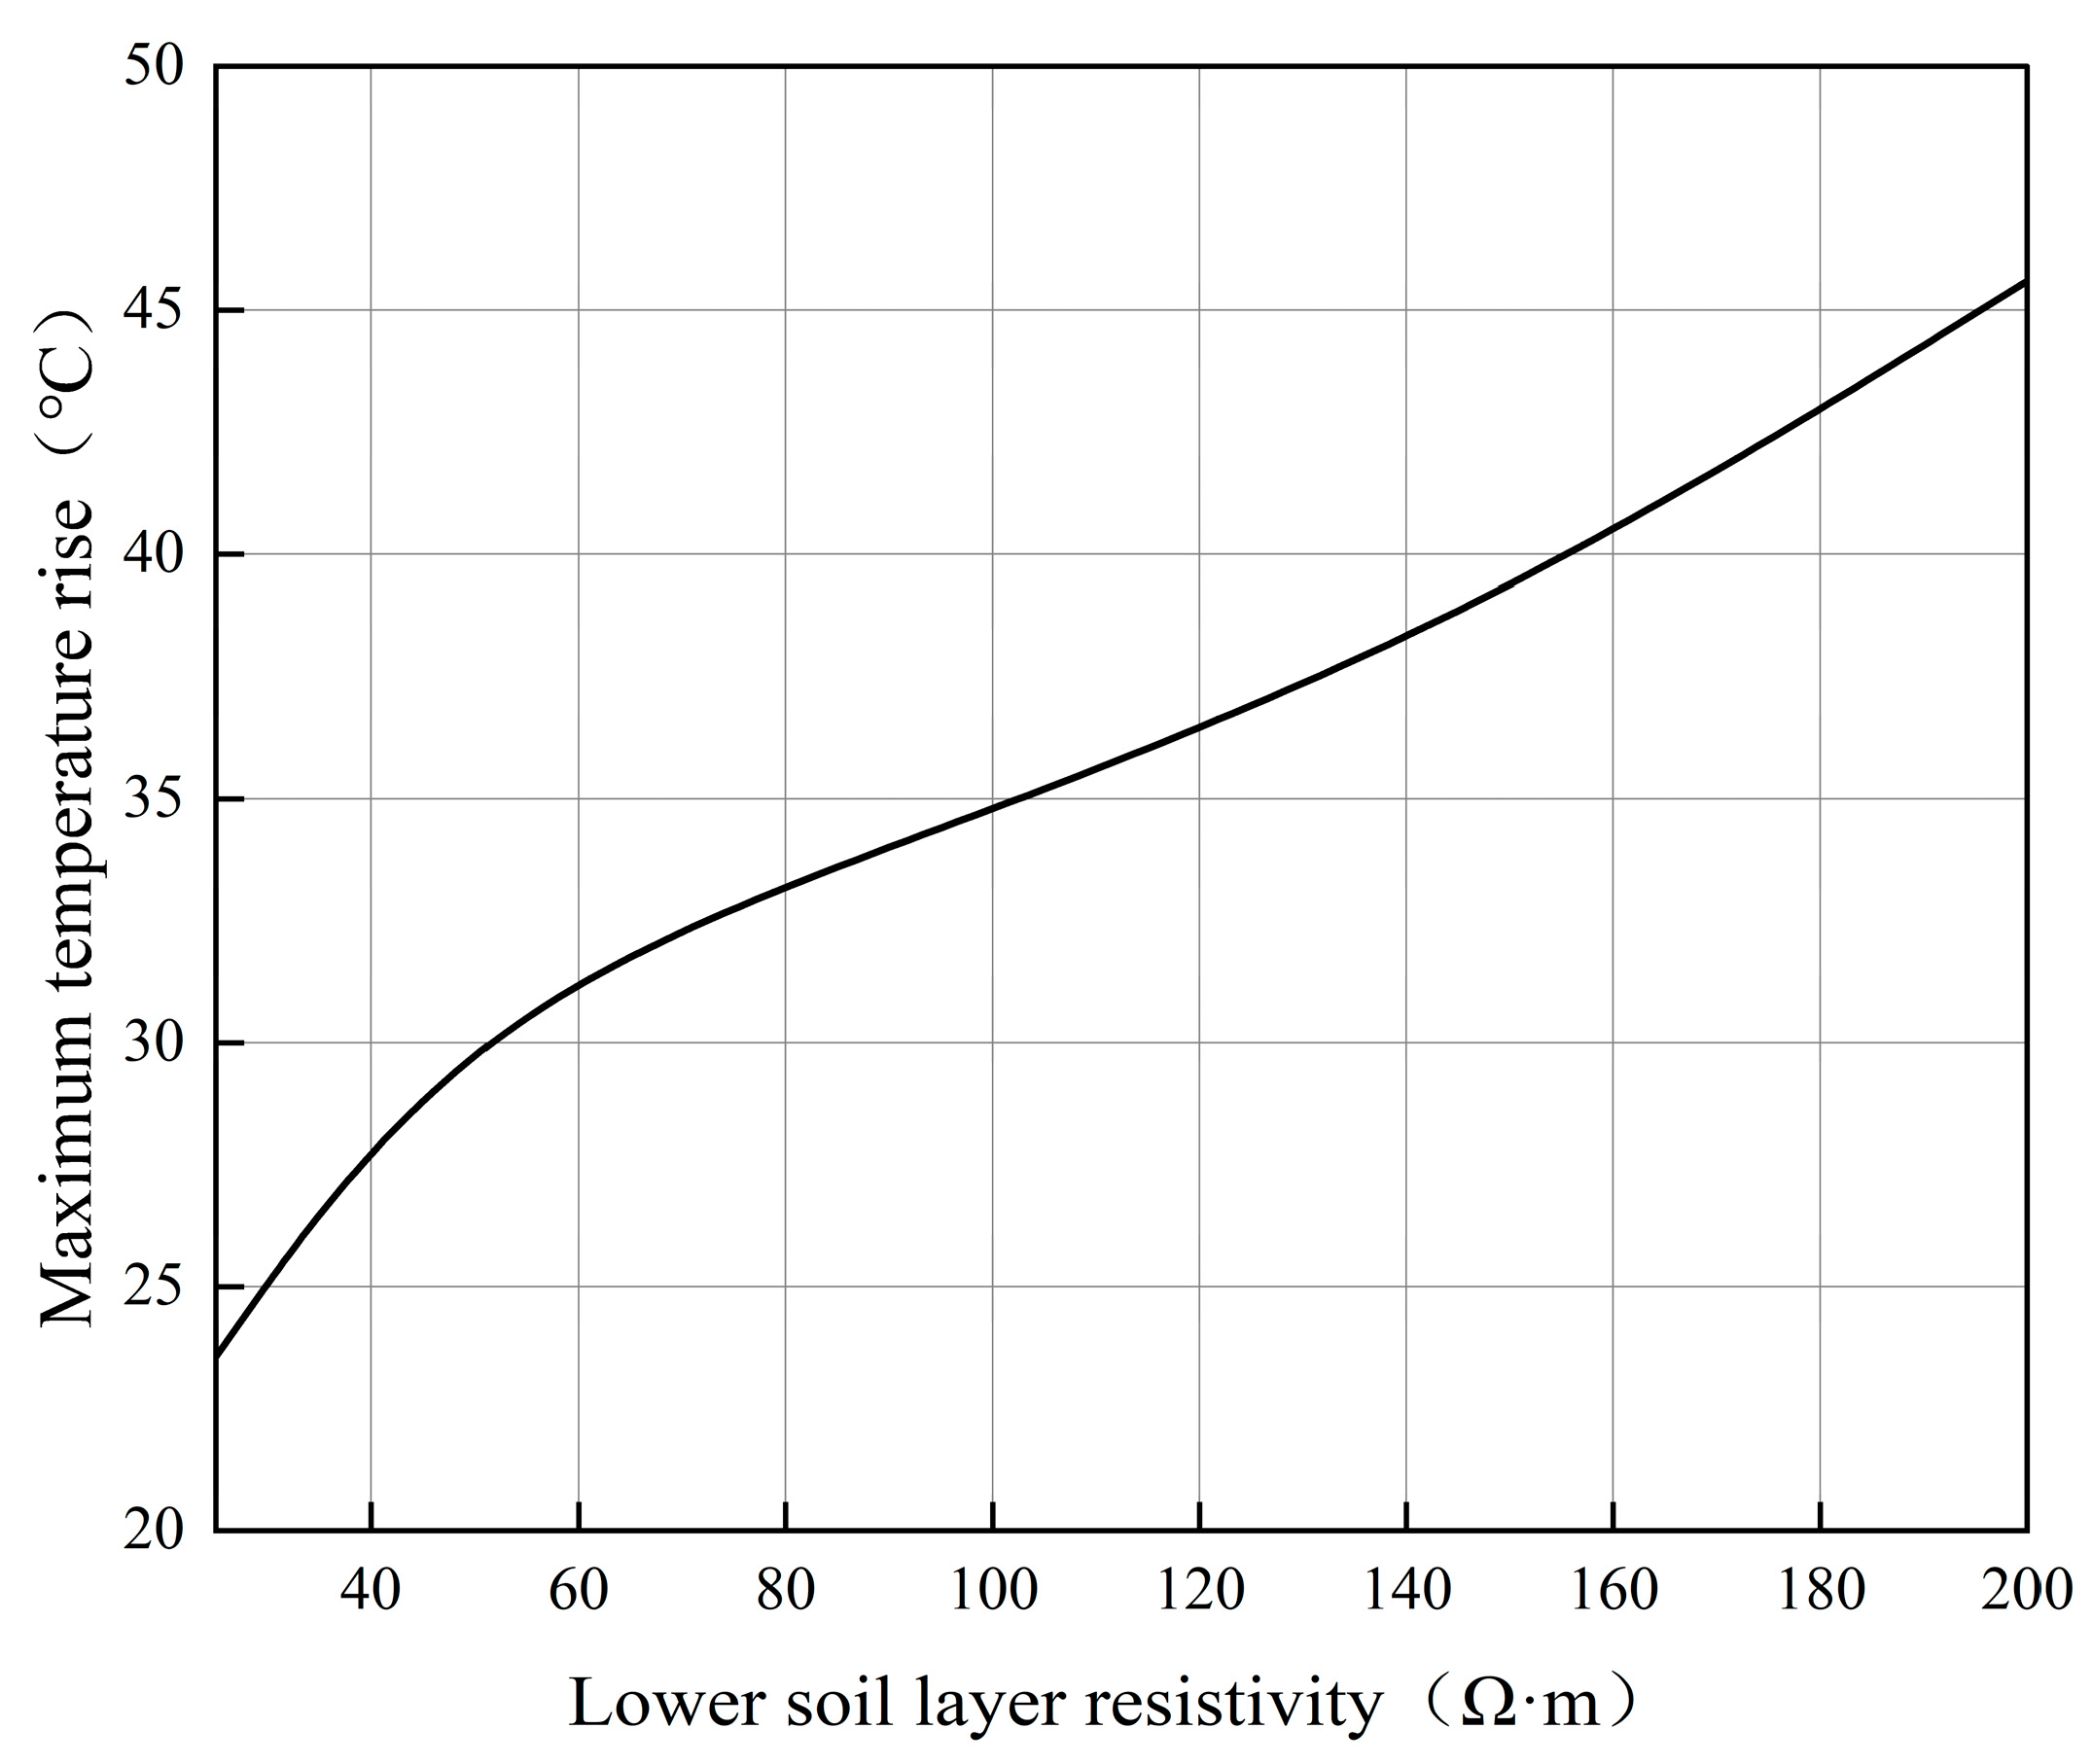
Figure 4. Mesh of the grounding electrode and soil.
Energies 19 01863 g004
Figure 5. Schematic diagram of the temperature rise test apparatus.
Energies 19 01863 g005
Figure 6. Schematic diagram of the layout of temperature rise test points.
Energies 19 01863 g006
Figure 7. Comparison between simulated and measured temperature rise results.
Energies 19 01863 g007
Figure 8. Temperature contour maps at different positions of the vertical grounding electrode.
Energies 19 01863 g008
Figure 9. Temperature and current density distribution along the length of a vertical grounding electrode.
Energies 19 01863 g009
Figure 10. Variation of temperature rise with operating time.
Energies 19 01863 g010
Figure 11. Variation of temperature rise at different positions of the vertical grounding electrode with operating time.
Energies 19 01863 g011
Figure 12. Temperature distribution along the length.
Energies 19 01863 g012
Figure 13. Variation of maximum temperature rise with soil resistivity.
Energies 19 01863 g013
Figure 14. Variation of temperature rise at different positions of the vertical grounding electrode with operating time.
Energies 19 01863 g014
Figure 15. Temperature distribution along the length.
Energies 19 01863 g015
Figure 16. Variation of maximum temperature rise with soil thermal conductivity.
Energies 19 01863 g016
Figure 17. Variation of temperature rise at different positions of the vertical grounding electrode with operating time.
Energies 19 01863 g017
Figure 18. Temperature distribution along the length.
Energies 19 01863 g018
Figure 19. Variation of maximum temperature rise with specific heat capacity.
Energies 19 01863 g019
Figure 20. Variation of temperature rise at different positions of the vertical grounding electrode with operating time.
Energies 19 01863 g020
Figure 21. Temperature distribution along the length.
Energies 19 01863 g021
Figure 22. Variation of maximum temperature rise with coke cross-sectional radius.
Energies 19 01863 g022
Figure 23. Temperature contour maps at different positions of the vertical grounding electrode.
Energies 19 01863 g023
Figure 24. Temperature and current density distribution along the length of a vertical grounding electrode.
Energies 19 01863 g024
Figure 25. Variation of temperature rise with operating time.
Energies 19 01863 g025
Figure 26. Variation of temperature rise at different positions of the vertical grounding electrode with operating time.
Energies 19 01863 g026
Figure 27. Temperature distribution along the length.
Energies 19 01863 g027
Figure 28. Variation of maximum temperature rise with upper soil thickness.
Energies 19 01863 g028
Figure 29. Variation of temperature rise at different positions of the vertical grounding electrode with operating time.
Energies 19 01863 g029
Figure 30. Temperature distribution along the length.
Energies 19 01863 g030
Figure 31. Variation of maximum temperature rise with upper soil thickness.
Energies 19 01863 g031
Figure 32. Variation of temperature rise at different positions of the vertical grounding electrode with operating time.
Energies 19 01863 g032
Figure 33. Temperature distribution along the length.
Energies 19 01863 g033
Figure 34. Variation of maximum temperature rise with upper soil resistivity.
Energies 19 01863 g034
Figure 35. Variation of temperature rise at different positions of the vertical grounding electrode with operating time.
Energies 19 01863 g035
Figure 36. Temperature distribution along the length.
Energies 19 01863 g036
Figure 37. Variation of maximum temperature rise with lower soil resistivity.
Energies 19 01863 g037
Table 1. Parameter values for the grounding electrode simulation model.
ParameterElectrodeCokeSoil
Resistivity/(Ω·m)1.7 × 10−70.3 ρ T
Thermal conductivity/(W·m−1·°C−1)43.24 k T
Relative permittivity1216
Specific heat capacity/(J·kg−1·°C−1)465800 c T
Density/(kg·m−3)787010001900
Table 2. Expressions for temperature-dependent soil parameters.
ParameterTemperature Range T /°CExpression
ρ T /(Ω·m)(20–44] ρ T = 100
(44–100) ρ T = 100 + 120.678 × e 0.0498 × T 160 + 1.96 × e 0.381 × T 70
k T /(W·m−1·°C−1)(9–100) k T = 1.0214 + 0.0174 T
c T /(J·kg−1·°C−1)(9–100) c T = 976.719 + 12.016 T
Table 3. Validation of the finite element model for the vertical grounding electrode.
Grounding Electrode Length/mGrounding Resistance/ΩRelative Error/%
CDEGSCOMSOL
3001.9581.9032.81
4001.5351.4753.91
5001.2711.2065.11
6001.0891.0325.23
7000.9560.8976.16
Table 4. Grounding characteristics of the electrode under different soil resistivities after 180 days of operation.
Soil
Resistivity/(Ω·m)
Grounding
Resistance/Ω
Maximum
Step Voltage/V
Average Current
Dissipation Density/(A·m−2)
250.0910.3612.02
500.1800.6712.02
1000.3471.3112.02
1500.5101.9012.02
2000.6802.5612.02
Table 5. Grounding characteristics of the electrode under different soil thermal conductivities after 180 days of operation.
Thermal
Conductivity/(W·m−1·°C−1)
Grounding
Resistance/Ω
Maximum Step
Voltage/V
Average Current
Dissipation Density/(A·m−2)
10.3471.310712.02
1.50.3471.309312.02
20.3471.308512.02
2.50.3471.307312.02
30.3471.306212.02
Table 6. Grounding characteristics of the electrode under different soil specific heat capacities after 180 days of operation.
Specific Heat
Capacity/(J·kg−1·°C−1)
Grounding
Resistance/Ω
Maximum Step
Voltage/V
Average Current
Dissipation Density/(A·m−2)
8000.3471.309112.02
12000.3471.308512.02
16000.3471.307912.02
20000.3471.307112.02
24000.3471.306312.02
Table 7. Grounding characteristics of the electrode under different coke cross-sectional radius after 180 days of operation.
Coke Cross-Sectional
Radius/m
Grounding
Resistance/Ω
Maximum Step
Voltage/V
Average Current
Dissipation Density/(A·m−2)
0.30.3731.3612.55
0.40.3581.3312.26
0.50.3471.3112.02
0.60.3371.2911.82
0.70.3281.2811.66
Table 8. Grounding characteristics of the electrode under different upper soil thicknesses after 180 days of operation.
Upper Soil Thickness/mGrounding Resistance/ΩMaximum Step Voltage/V
100.1820.737
850.2030.775
1600.2320.885
2350.2681.028
3100.3281.257
Table 9. Grounding characteristics of the electrode under different upper soil thicknesses after 180 days of operation.
Upper Soil Thickness/mGrounding Resistance/ΩMaximum Step Voltage/V
100.3421.172
850.2801.029
1600.2400.877
2350.2170.770
3100.1880.685
Table 10. Grounding characteristics of the electrode under different upper soil resistivities after 180 days of operation.
Upper Soil Resistivity/(Ω·m)Grounding Resistance/ΩMaximum Step Voltage/V
250.1520.538
500.2400.877
1000.3471.310
1500.4081.536
2000.4481.707
Table 11. Grounding characteristics of the electrode under different lower soil resistivities after 180 days of operation.
Lower Soil Resistivity/(Ω·m)Grounding Resistance/ΩMaximum Step Voltage/V
250.1520.538
500.2400.877
1000.3471.310
1500.4081.536
2000.4481.707
Disclaimer/Publisher’s Note: The statements, opinions and data contained in all publications are solely those of the individual author(s) and contributor(s) and not of MDPI and/or the editor(s). MDPI and/or the editor(s) disclaim responsibility for any injury to people or property resulting from any ideas, methods, instructions or products referred to in the content.