Article

Research on Large-Scale Experiments and Optimal Production Allocation in Carbonate Edge–Bottom Water Gas Reservoirs

1
Research Institute of Petroleum Exploration and Development of CNPC, Beijing 100083, China
2
Research Institute of Petroleum Exploration and Development, PetroChina Southwest Oil and Gas Field Company, Chengdu 610051, China
*
Author to whom correspondence should be addressed.
Energies 2026, 19(8), 1841; https://doi.org/10.3390/en19081841
Submission received: 10 March 2026 / Revised: 2 April 2026 / Accepted: 7 April 2026 / Published: 9 April 2026
(This article belongs to the Topic Petroleum and Gas Engineering, 2nd edition)

Abstract

The Dengying Formation gas reservoir in the Penglai gas field, located in the central Sichuan Basin, exhibits substantial resource potential and promising development prospects. This reservoir is characterized by well-developed fractures and dissolution cavities, strong heterogeneity, complex gas–water relationships, and widespread edge–bottom water. During production, edge–bottom water is prone to channeling and intrusion through high-permeability pathways, which severely constrains well productivity and overall gas recovery. To address these challenges, this study takes a fractured-vuggy carbonate edge–bottom water gas reservoir as an example. By integrating large-scale physical simulation with cross-scale numerical simulation, a rational production allocation method suitable for strongly heterogeneous gas reservoirs has been developed. The research results indicate that: (1) Large-scale physical simulation experiments demonstrate that for fractured-vuggy bottom water gas reservoirs, implementing rate reduction and pressure control after water breakthrough can effectively suppress water invasion and coning, extend the stable production period, and increase the recovery factor by approximately 16%; (2) Based on the dynamic characteristics of water invasion, key similarity criteria including the Bond number, capillary number, gravity–viscous force ratio, and geometric–temporal similarity ratio were selected to establish a scientific parameter design method for cross-scale numerical simulation; (3) By considering factors such as reservoir type and aquifer energy, single-well mechanistic models were used to determine appropriate production rates for individual wells, enabling rapid optimization of production allocation plans. This provides crucial guidance for efficient gas well development and surface facility planning.

1. Introduction

For oil and gas exploration in Sichuan Basin, significant breakthroughs have been made in recent years in areas such as deep and ultra-deep marine carbonate rocks, continental tight gas and shale oil formations. These areas have demonstrated enormous resource potential and become important successors for increasing China’s current and future reserves and production capacity [1,2,3]. In the marine carbonate rocks in Sichuan Basin, large-scale porous reservoirs dominated by mound-shoal facies and reef-shoal porous dolomite have developed, where a large number of dissolution fractures and lugs have been formed by dolomitization and dissolution, playing a key role in improving reservoir properties [4]. While these geological conditions greatly enhance the storage capacity of carbonate gas reservoirs, they also pose significant challenges to gas production from such reservoirs. Specifically, edge–bottom water tends to flow predominantly along highly permeable fractured-vuggy units, leading to problems that severely limit the overall degree of recovery from gas reservoirs, such as premature water breakthrough and rapid production declines in gas wells [5,6].
Production optimization is widely regarded as the most direct and effective measure to delay water invasion and improve production performance. However, given the strong heterogeneity of dissolution vugs and fractures in carbonate gas reservoirs, field production optimization is mainly based on empirical methods, and there are still a lack of systematic theoretical research and generalizable decision-making methods for production optimization [7,8]. Most existing studies on production optimization are based on homogeneous or weakly heterogeneous models, making it difficult to effectively depict the complex migration behaviors of gas and water phases in fractured-vuggy systems. For this reason, these studies play a limited role in providing practical guidance [9,10]. Therefore, identifying the dynamic response characteristics of edge–bottom water in fractured-vuggy media and establishing a production optimization method suitable for highly heterogeneous reservoirs are key issues that must be solved to achieve efficient production from such reservoirs.
In this study, a multiscale approach combining large-scale physical simulation and numerical simulation was employed to systematically identify the dynamics of bottom water invasion and the patterns of gas/water distribution in fractured-vuggy structures of carbonate gas reservoirs involving edge–bottom water. Compared with previous studies that mainly relied on homogeneous or weakly heterogeneous models, this work introduces a more representative physical modeling framework that captures the key features of fractured-vuggy systems, thereby enabling a more accurate characterization of gas–water migration behavior. Then, a reliable numerical model for gas reservoirs was built by introducing similarity criteria to establish a physical link between experiments and simulations. This step extends existing numerical simulation efforts by grounding the model in experimentally derived mechanisms, which enhances the credibility and applicability of the simulation results. Subsequently, production schemes for different reservoir types, water energy levels, and degrees of heterogeneity were analyzed and optimized. Finally, a rational production allocation method applicable to highly heterogeneous gas reservoirs with bottom water was developed. By integrating physical and numerical simulations within a unified similarity-based framework, this study complements previous research that focused largely on homogeneous systems and provides a more generalizable decision-making approach for production optimization in highly heterogeneous carbonate gas reservoirs, offering a theoretical reference and practical guidance for their scientific and efficient exploitation.

2. Large-Scale Physical Simulation of Carbonate Gas Reservoirs with Edge–Bottom Water

Based on the actual geological conditions of the Sinian Dengying Formation and the Cambrian Longwangmiao Formation in Sichuan Basin, a large-scale physical simulation model was designed and constructed to simulate the complex pores in these formations. In order to optimize the production rates for carbonate gas reservoirs with edge–bottom water, systematic physical simulation experiments were conducted to investigate the flow behaviors of gas and water phases during reservoir exploitation, reveal the characteristics of gas/water distribution and migration at different production stages, and identify the production patterns of such reservoirs.
To address the common problems such as early water breakthrough and serious water channeling in fractured-vuggy reservoirs, a series of special experiments for production rate optimization were conducted, and the corresponding models were designed and constructed, providing a solid foundation for physical experiments designed for subsequent mechanism research and development strategy optimization.

2.1. Experimental Design

Literature and production data show [11,12] that the degree of recovery from fractured-vuggy gas reservoirs can be improved to some extent by reducing the production rate after water production in gas wells. However, traditional experimental methods often focus on a single production rate, making it impossible to determine the optimal production rate using these methods. Therefore, physical simulation models for different production rates were designed to find the optimal production rate for fractured-vuggy gas reservoirs with bottom water. The experimental scheme designed for this study is detailed below (Table 1).
It should be noted that the large-scale physical simulation model employed in this study, while capable of capturing the principal gas–water flow characteristics of fractured-vuggy reservoirs, inherently involves simplifications relative to actual reservoir conditions. The geometric configuration and core dimensions are designed to represent typical fracture–vug features under controlled laboratory settings, yet they do not fully replicate the complexity of a true three-dimensional fracture–vug network in the subsurface. Consequently, the experimental results are intended to elucidate the general mechanisms governing water invasion and recovery under varying production rates, rather than to serve as direct quantitative predictions for field applications. The optimal production rate identified through this approach should thus be regarded as a reference for further validation via numerical simulations or field-scale tests. These considerations have been incorporated into the interpretation of the experimental findings presented in this study.

2.2. Experimental Method and Procedure

The target gas reservoir has edge and bottom water with a total salinity of 1.2 × 10⁵ mg/L and a CaCl2 water type. In this study, however, tap water was used during core preparation and preliminary tests, as the primary focus was on the physical structure of the artificial cores. The total salinity of the tap water is approximately 300 mg/L, which is significantly lower than that of the actual formation brine. This difference may affect wettability, capillary pressure, and water–rock interactions in subsequent displacement experiments [13,14]. Therefore, to improve the reliability of the simulation, synthetic formation water with the above salinity and ionic composition will be used in future fluid flow experiments. The current study reports the core preparation procedure and provides the baseline salinity information for reference.
① Preparation of salt particles: Press NH4HCO3 powder into a sheet, crush it into particles, sieve the particles, and keep the particles with sizes ranging between 1.70 mm and 4.75 mm (mesh size: about 4–10) for later use. ② Preparation and treatment of cementitious material: Weigh the cementing agent according to the predetermined ratio, mix it evenly, thoroughly mix it with 400-mesh dolomite powder, and sieve the mixture to remove lumps and ensure the uniformity of the mixture. ③ Molding and embedding: Fill the mixture of salt particles and cement into the mold, scrape the mixture to ensure even distribution, and embed soluble salt papers as designed to simulate fractures. ④ Compaction and solidification: Place the mold on a press, slowly increase the pressure to 16 MPa to compact the mixture in the mold, hold the pressure for 0.5 h, release the pressure, and let the mixture-filled mold stand at room temperature for 24 h to allow the mixture to solidify into a core. ⑤ Creation of pores and vugs: Place the solidified core in a thermostat for 48-h heating at 170 °C to fully decompose and volatilize the NH4HCO3 particles, thereby creating a pore-vug system similar to that of a real reservoir. ⑥ Sealing and curing: Carry out anti-seepage treatment of the surface of the core, install a connector, place the core in a mold, pour epoxy resin into the mold, and let the mold stand for 24 h to allow the poured epoxy resin to cure in a sealed environment to obtain the required core.
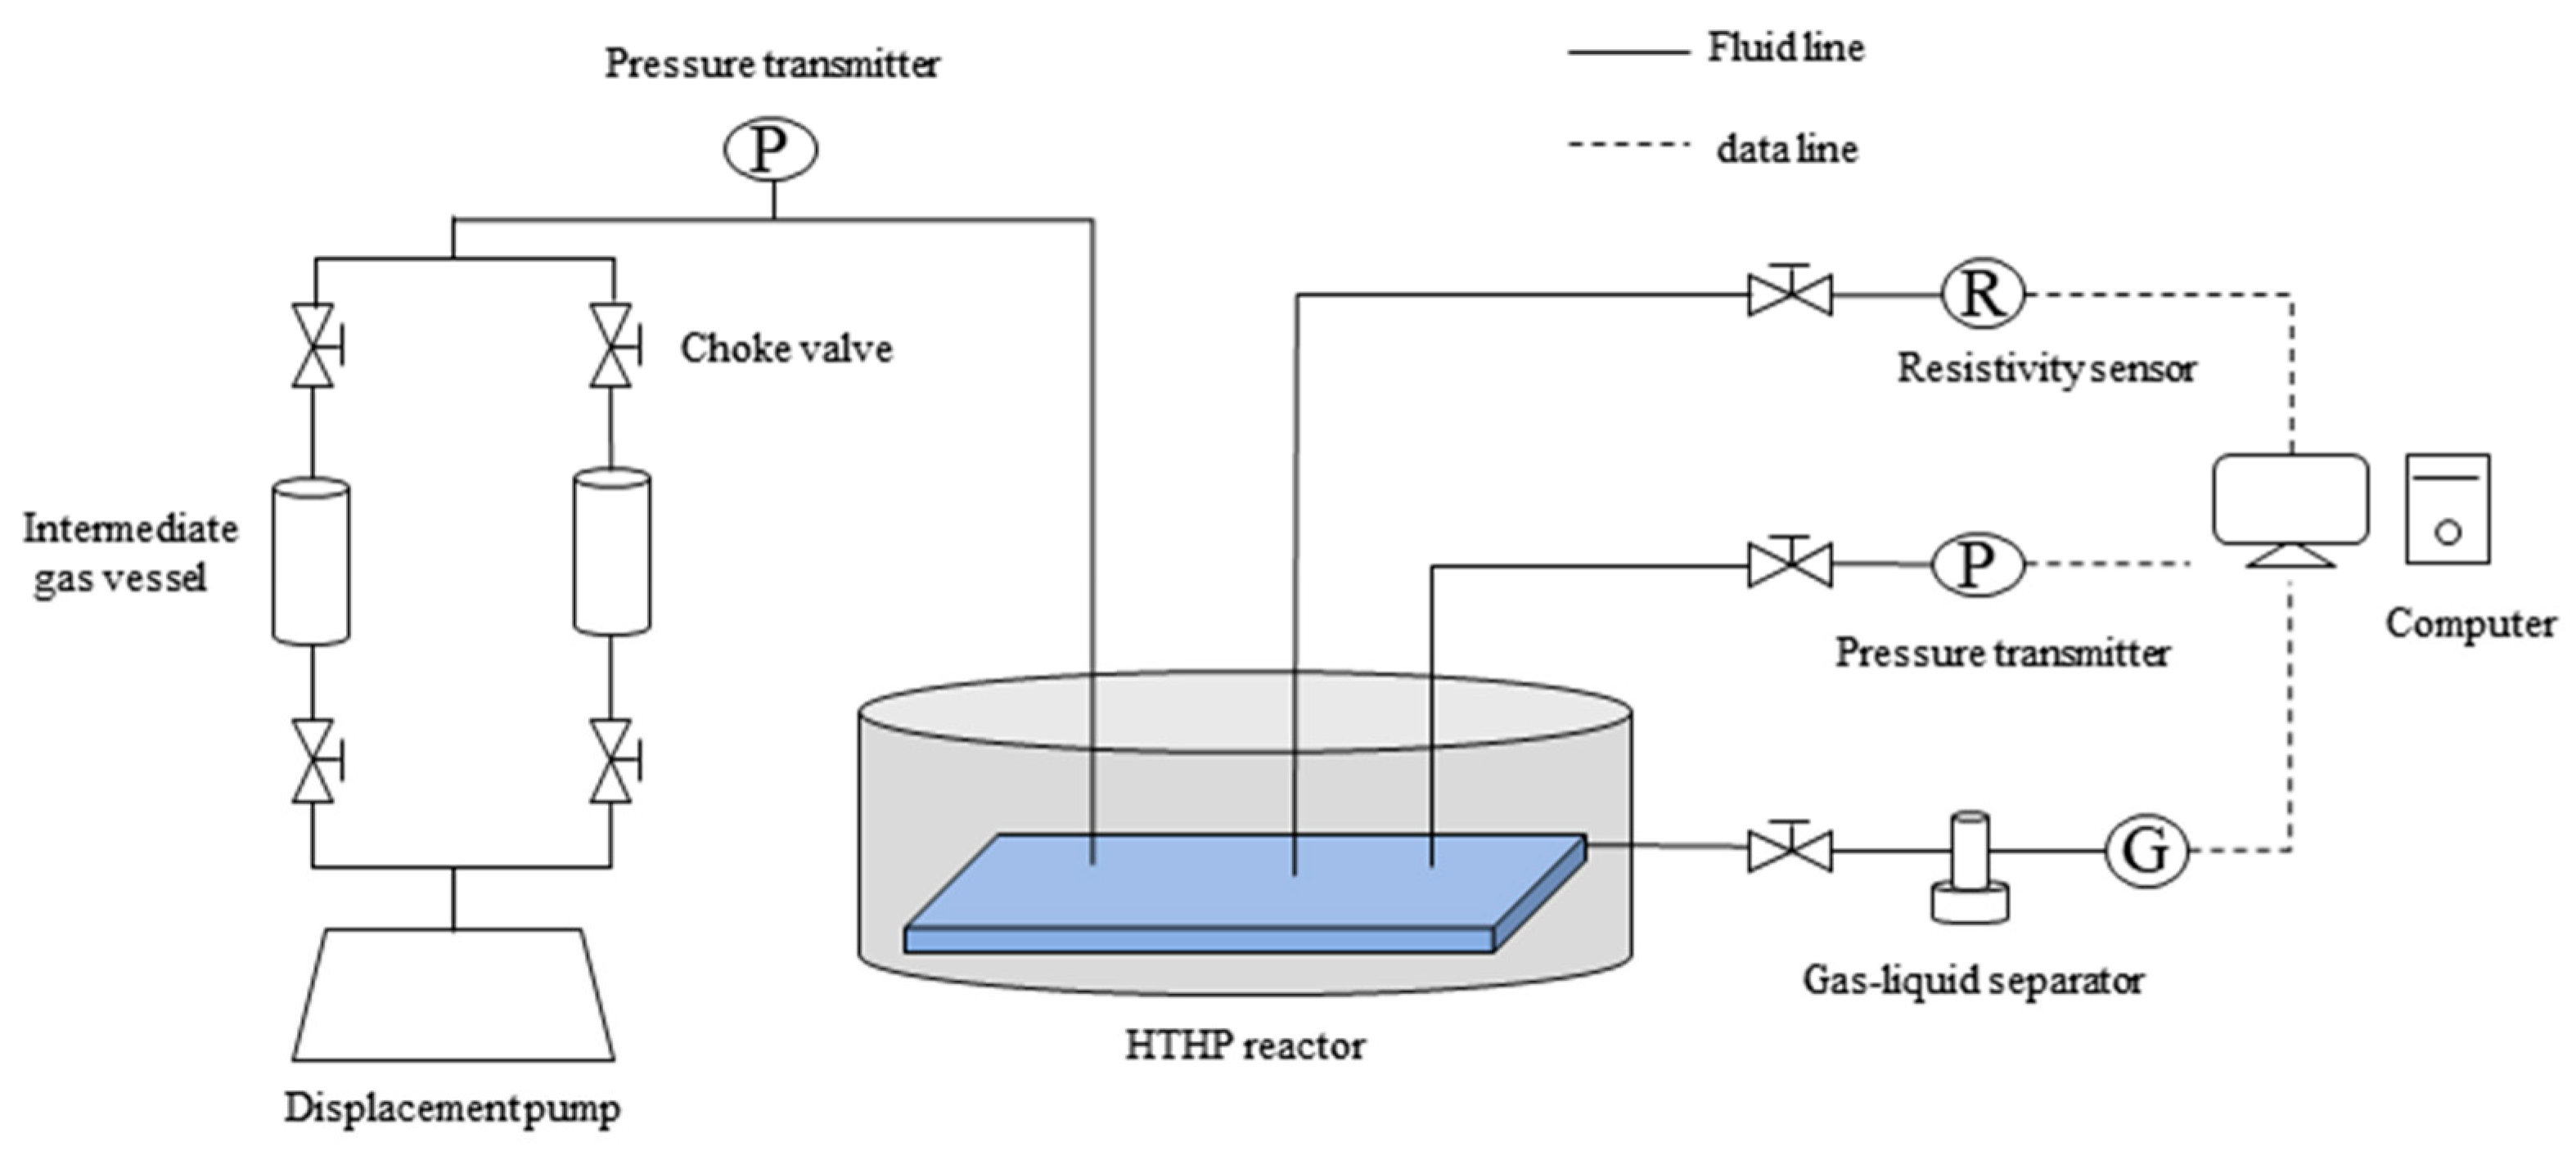
The flowchart of large-scale physical simulation experiments for a carbonate gas reservoir is illustrated in the figure below (Figure 1). ① Place the simulation model into the pressure vessel and connect the pressure and resistivity monitoring systems and water injection and gas production lines. ② Close the cover of the pressure vessel, activate the data acquisition system, and confirm that all data acquisition ports are correctly connected and operate properly. ③ Inject tap water into the pressure vessel, and close the gate valve after the vessel is full. Inject water into the pressure vessel using a hand pump until the water pressure inside the vessel reaches 9.5 MPa, close the hand pump valve, and hold the pressure for 12 h to confirm the airtightness of the pressure vessel system. ④ Inject nitrogen into the simulation model through the externally connected pipeline until the pressure reaches 2.0 MPa, hold the pressure for 0.5 h to confirm the airtightness of the simulation model system, and depressurize the model to atmospheric pressure. ⑤ Connect the model to the gas cylinder and inlet valve, inject gas into the model at a rate of 500 mL/min until the internal pressure of the model reaches 9.0 MPa, and record the cumulative volume of gas injected. ⑥ Connect the gas cylinder with the intermediate vessel filled with water, connect the outlet of the intermediate vessel to the bottom water layer of the simulation model, and adjust the gas cylinder pressure to 9.0 MPa to drive the water into the model. ⑦ Start up the gas production well to extract gas at rates of 100 mL/min, 400 mL/min, and 200 mL/min until depletion, and record the cumulative gas production, water breakthrough time, water production, and cumulative gas production time. ⑧ When the gas production rate drops to 10 mL/min, end the experiment and collate the experimental data.

2.3. Analysis of Experimental Results

2.3.1. Constant-Rate Production

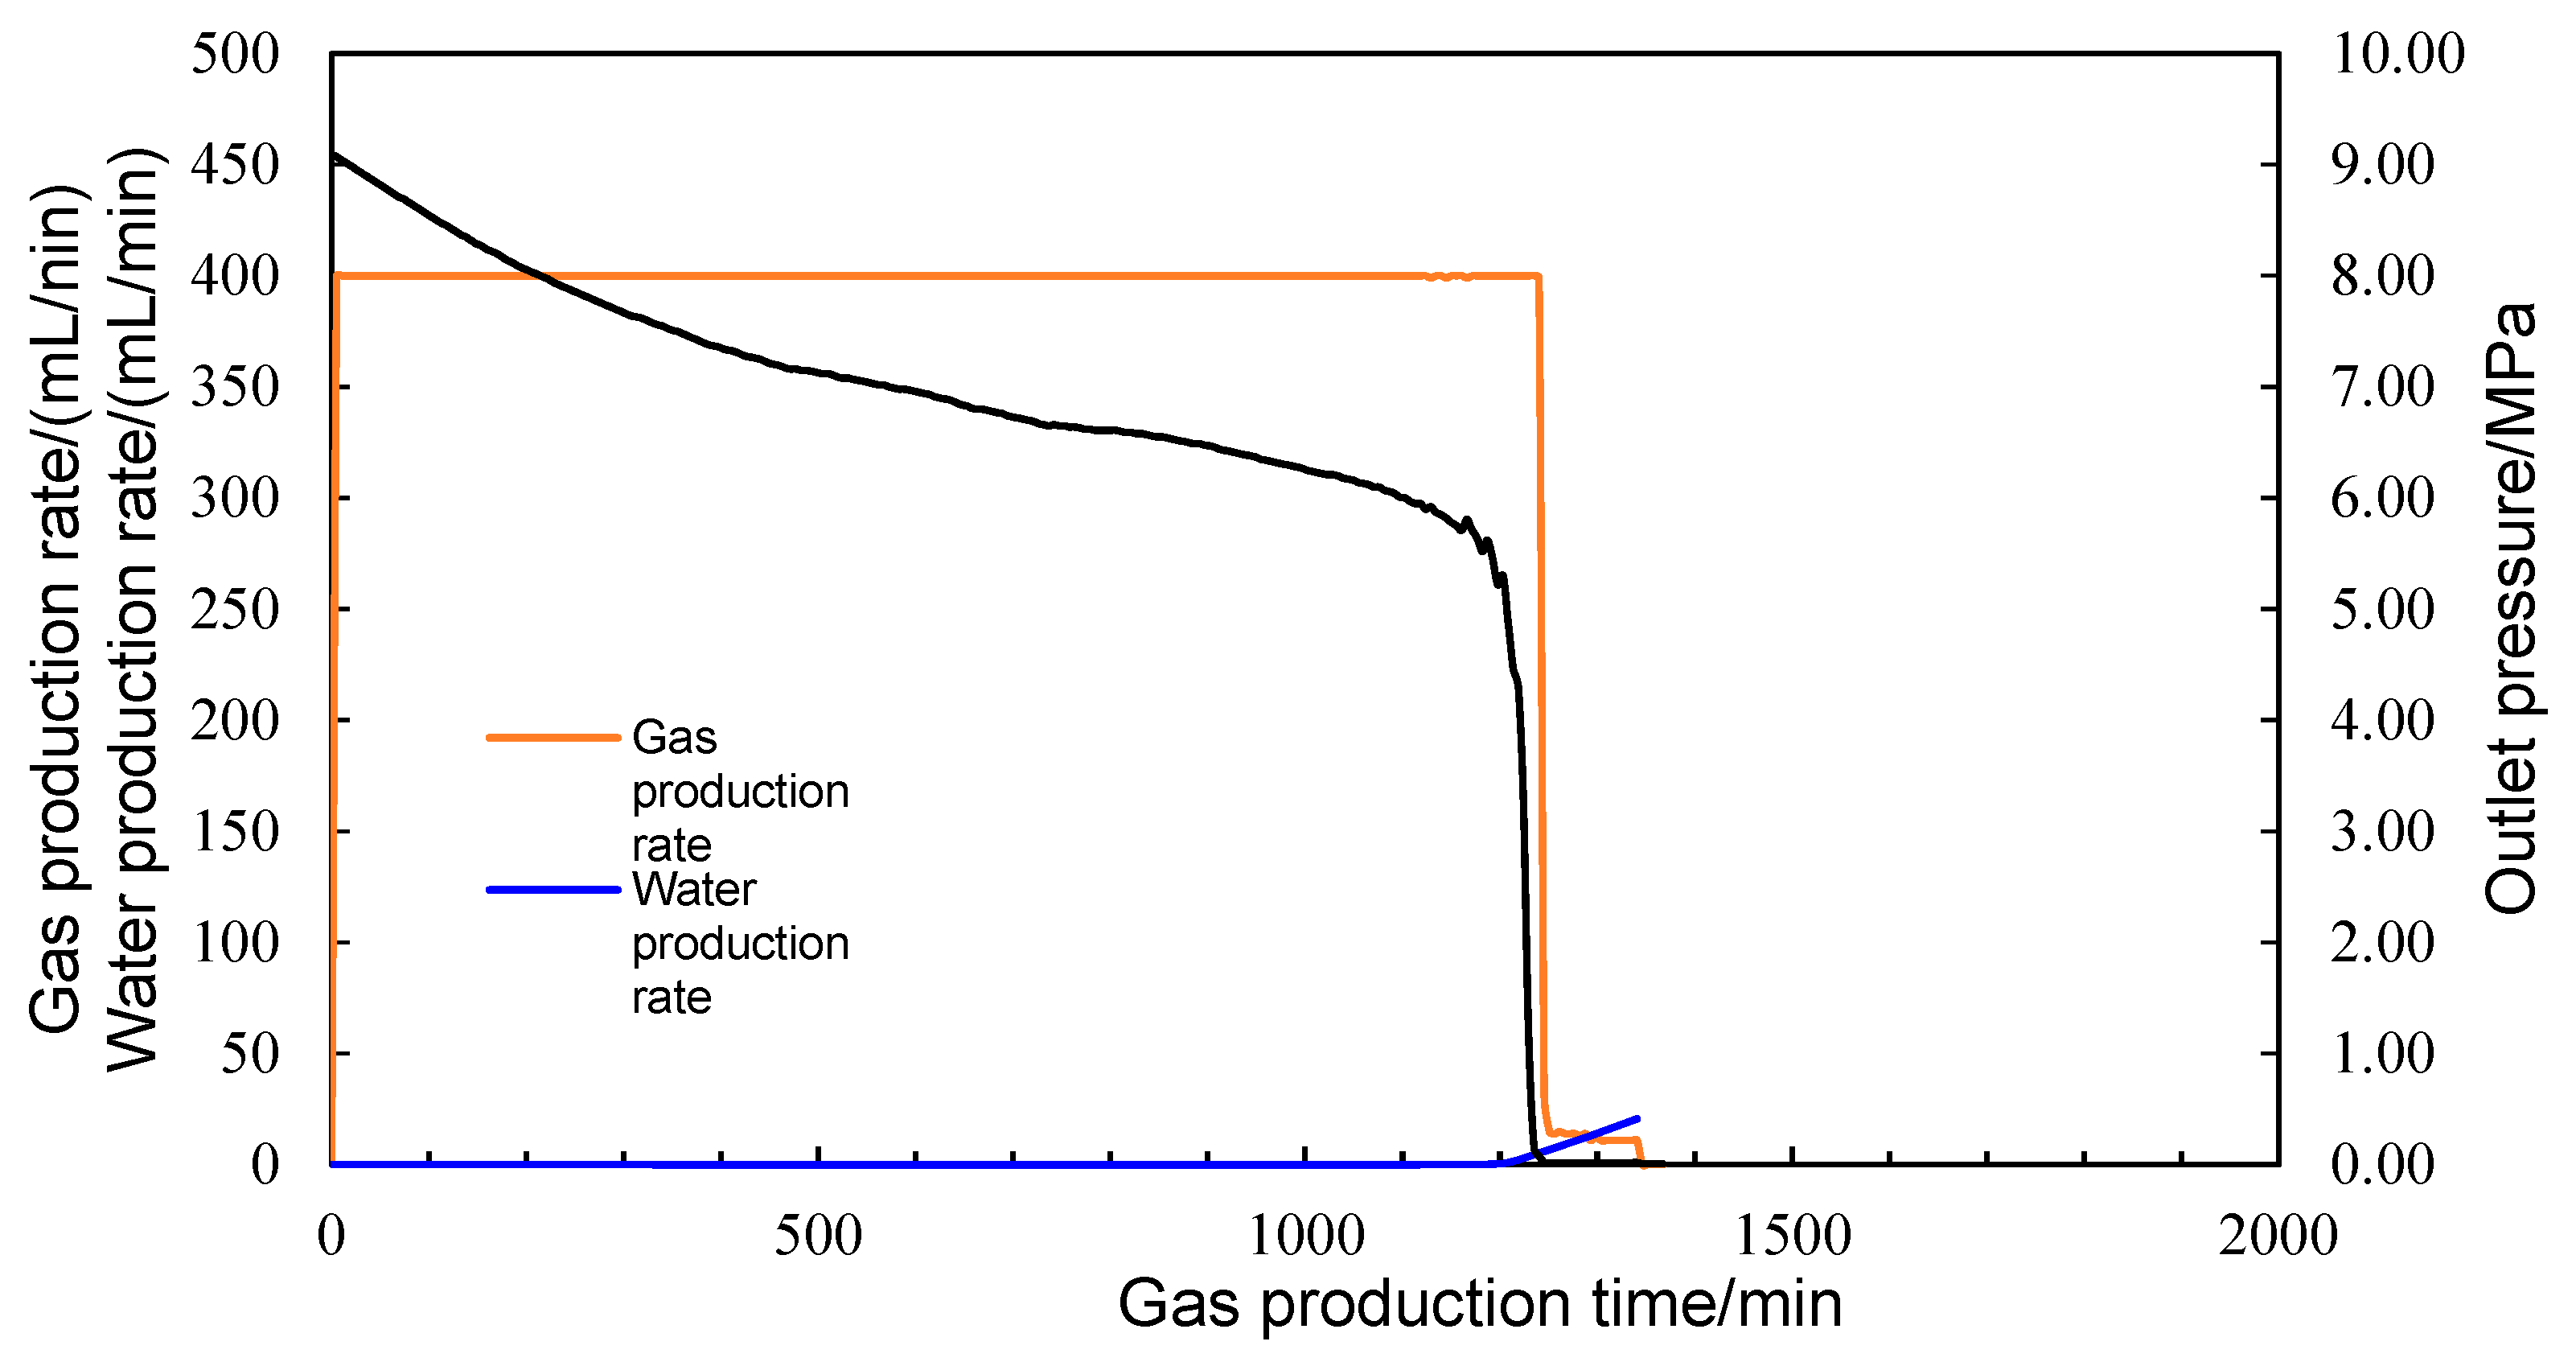
Figure 2 shows the dynamic production curves of the gas reservoir with bottom water in the large-scale physical simulation model, where the water avoidance height and production rate of the gas well are set to 6 cm and 400 mL/min.
As shown in Figure 2, the period of stable production from the fractured-vuggy gas reservoir with bottom water reaches 1240 min; the gas well starts producing water after 1150 min of production, and the gas–water coproduction period is 90 min, during which the gas production rate remains stable at 400 mL/min at the initial stage; when the water production rate exceeds 15 mL/min, the gas production rate and outlet pressure (as the black line) of the gas well decline rapidly, followed by drastic fluctuations; when the water production rate further increases to 20 mL/min, the gas well stops producing gas, the outlet pressure increases slowly, and the gas well experiences complete water invasion, with a recovery degree of only 48.46%.
During the exploitation of fractured-vuggy gas reservoirs with bottom water, gas preferentially flows along fractures, leading to low pore pressures in fractured zones. Water preferentially invades the fractured zones, but the pores and vugs around gas wells form buffer zones, reducing the velocity of water advancing in fractures. However, large-area water invasion can result in a rapid increase in liquid production after water breakthrough in gas wells.
For a heterogeneous fractured-vuggy gas reservoir with bottom water and a unified hydrodynamic system, the planar distribution of fractures and vugs varies greatly, the lateral permeability distribution is non-uniform, and inter-block connection relies primarily on highly permeable zones with well-developed fractures and vugs. After gas production is initiated, natural gas flows preferentially through highly permeable zones with well-developed fractures and vugs, resulting in significant pressure drops in these zones. Under the action of differential pressure, bottom water enters the gas-bearing zone discontinuously and irregularly in a “short-circuit” manner along highly permeable porous channels with low energy. The high-permeability pores and fractures are filled by water. The connectivity of high-permeability zones deteriorates, but it is still sufficient to maintain pressure transmission within the block.

2.3.2. Gas Production at Reduced Rates After Water Breakthrough in Gas Wells

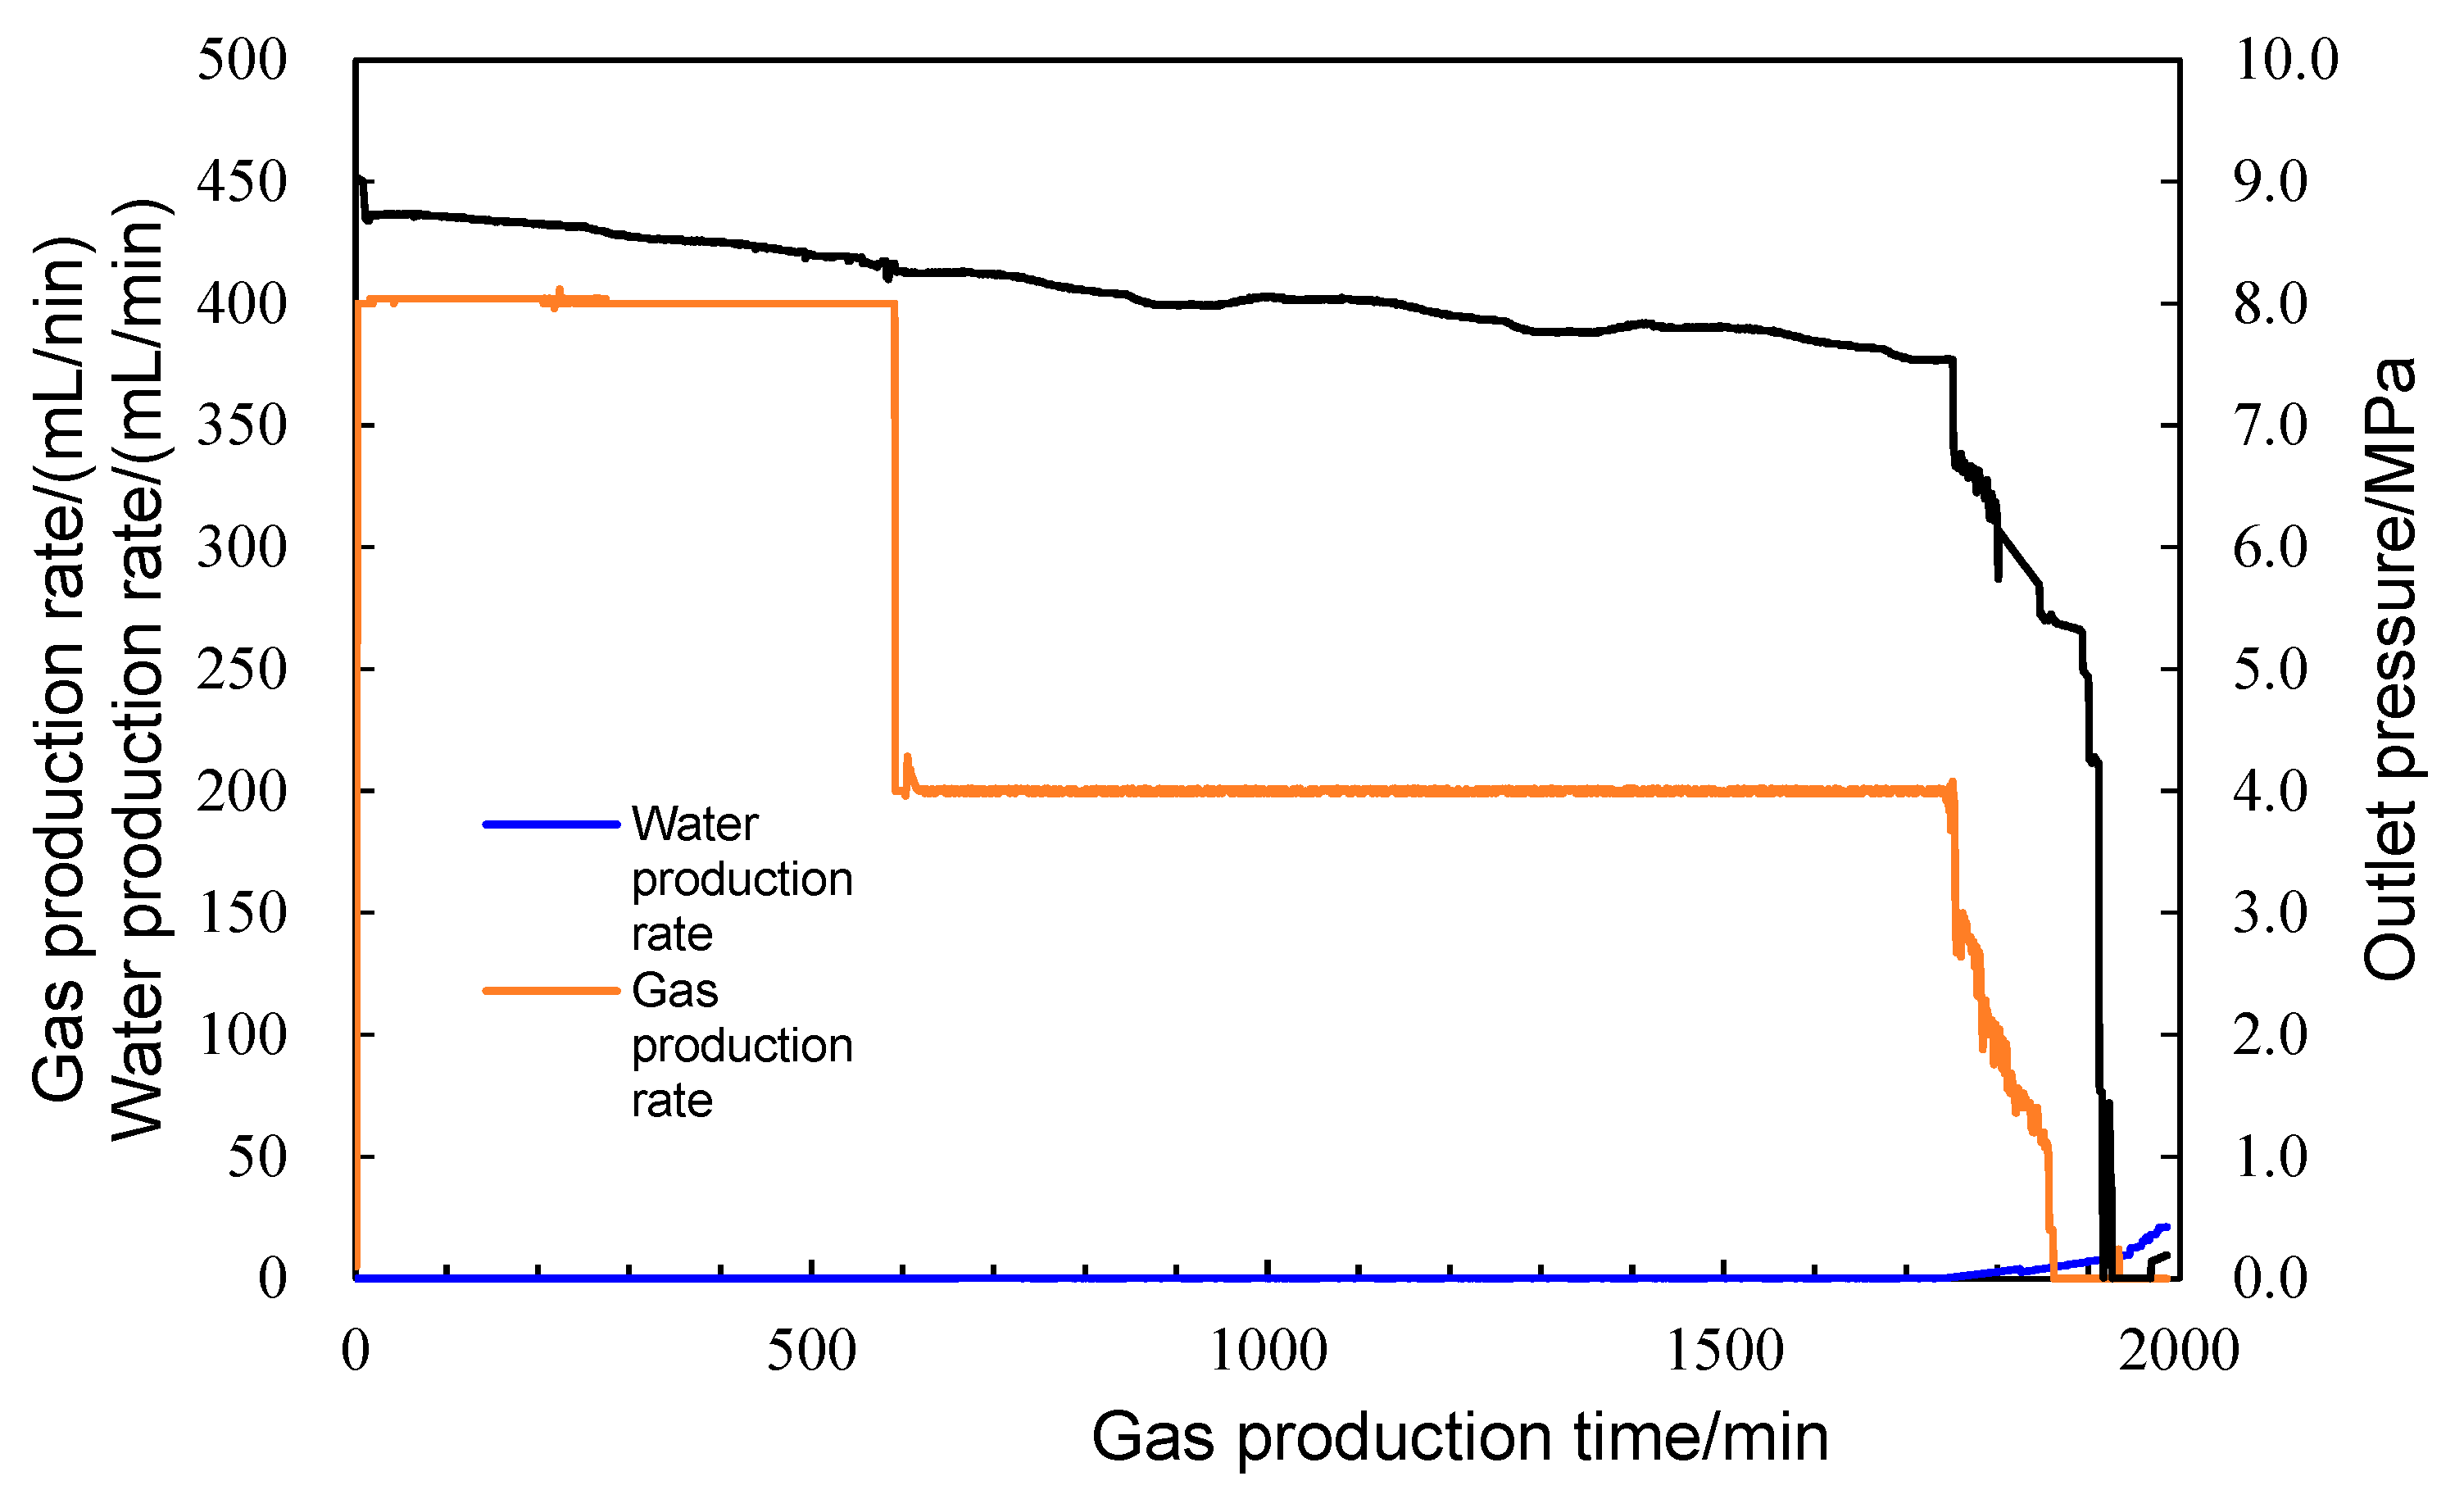
Figure 3 shows the dynamic production curves for pressure-controlled production from the simulated fractured-vuggy gas reservoir with bottom water. The initial rate of gas production from the reservoir model is 400 mL/min, and the gas production rate is reduced to 100 mL/min after water breakthrough in the gas well.
As shown in Figure 3, under the production mode involving bottom water in the fracture-vuggy reservoir model, the gas well starts producing water after 640 min of stable production, with slight fluctuations in outlet pressure. After the gas production rate is reduced, the outlet pressure of the gas well declines slowly, and the well produces gas stably for approximately 2560 min, producing a small amount of liquid. In the later stages of production, the well produces gas and liquid alternately, with the gas production rate decreasing gradually and the water production rate increasing, and the outlet pressure fluctuates significantly. Finally, the gas well experiences complete water invasion, the gas production rate drops to 0, the water production rate increases to 100 mL/min, the outlet pressure is 0.18 MPa, and the recovery degree is 64.78%. These results show that pressure-controlled production can effectively control water invasion in gas reservoirs and increase the recovery degree of gas reservoirs.
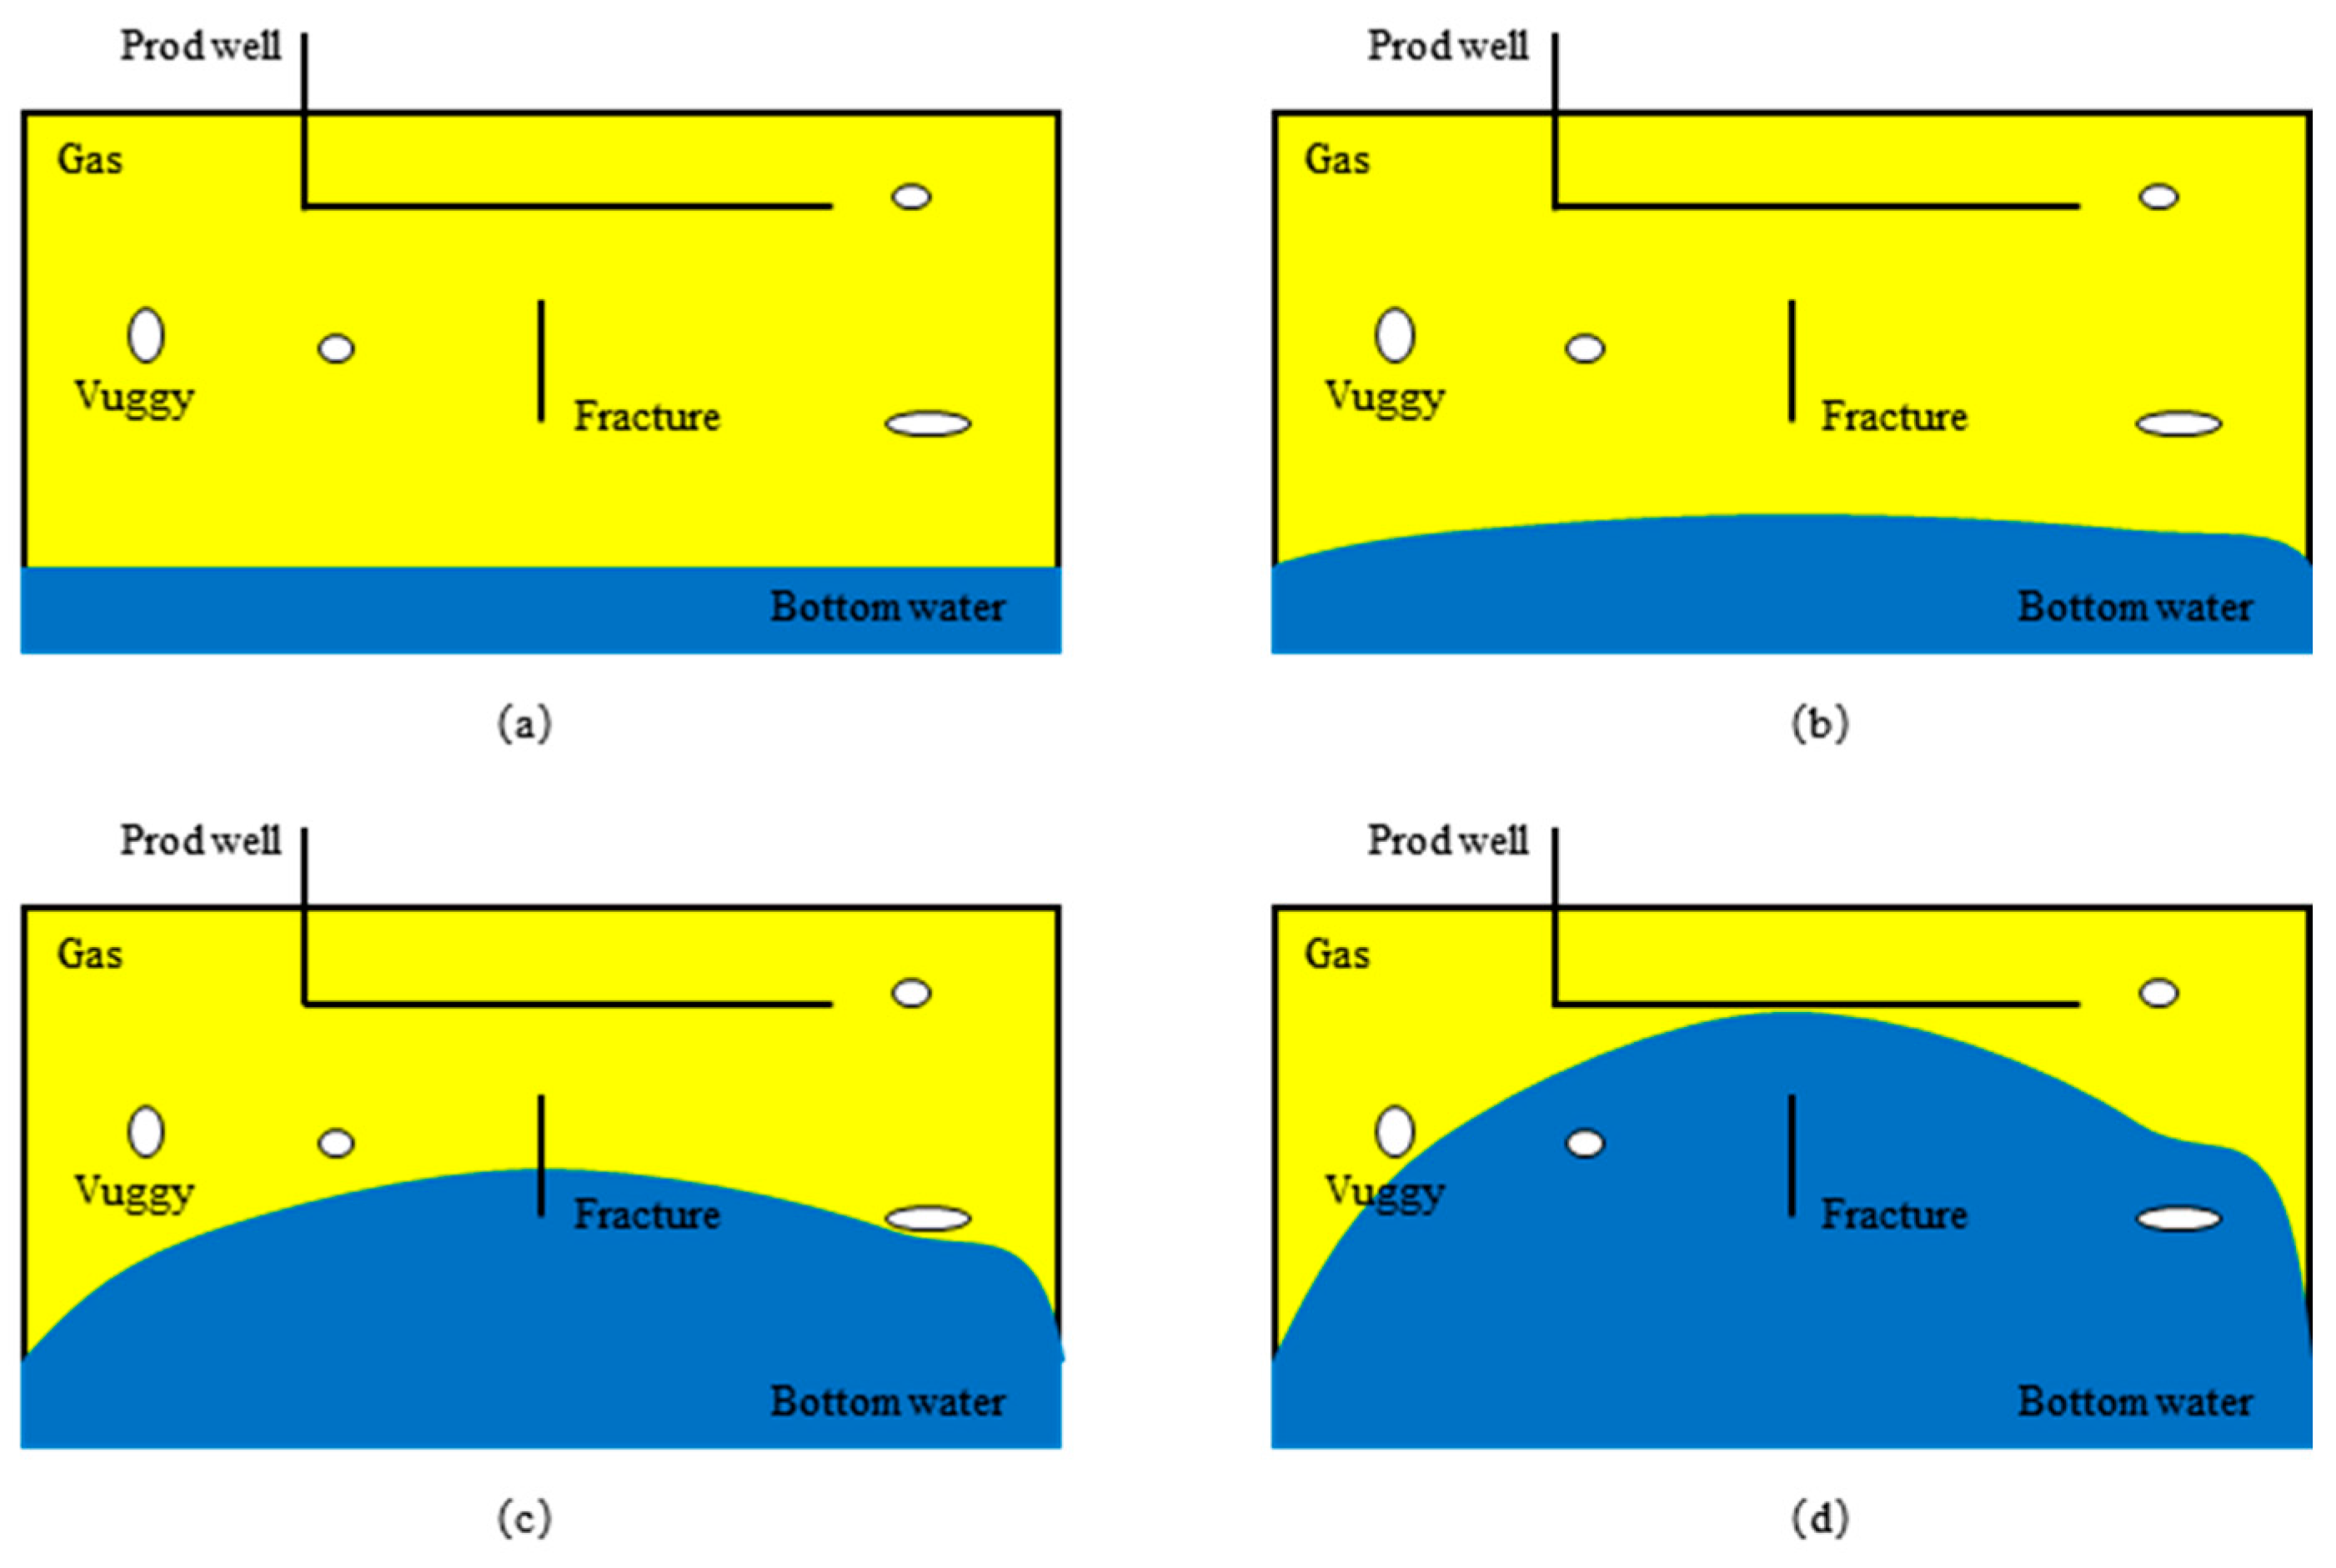
As shown in Figure 4, at the initial stage of water invasion in the fractured-vuggy reservoir model, the gas in pores/vugs is released slowly, the pore pressure changes gradually, and the water front advances slowly. When the pore pressure declines to a certain level, the water phase begins to enter the pores/vugs, gradually filling them and invading the surrounding matrix. As a result, the lateral speed of the water front increases, and the entire water front becomes gentler. The fractures are not directly connected to the wellbore; the water phase starts to invade the surrounding matrix after entering the fractures. After water breakthrough occurs in the gas well, the gas production rate is reduced, and consequently, the gas in the pores on both sides of the water front migrates towards the wellbore, which promptly replenishes the wellbore pressure, suppresses the advancement of the central peak of the water front, and increases the recovery degree.

3. Multi-Scale Gas Reservoir Numerical Simulation Model

The aforementioned large-scale physical simulation of gas reservoirs can effectively reveal the occurrence state of the water phase and the water sealing mechanism during water invasion in gas reservoirs, but it cannot reflect the dynamic changes in water invasion at the single well scale or even at the reservoir scale. As an auxiliary research tool, numerical simulation can compensate for the shortcomings of physical simulation experiments [15,16] based on similarity theory, cross-scale parameter transfer and model correction from physical experiments to numerical models, thereby constructing a numerical model that can accurately simulate the dynamic evolution process of water invasion in gas reservoirs.

3.1. Basis of Similarity Theory

The essence of both physical simulation and numerical simulation lies in the approximate description of real physical systems (prototypes). To establish a comparable quantitative relationship between physical simulation and numerical simulation, similarity theory must be followed to ensure that the identified mechanisms and laws are reliable for extension from the prototype [17,18]. The core of similarity theory consists of three similarity theorems. ① Positive similarity theorem: If two systems (the model and the prototype) are physically similar, all similarity criteria (dimensionless groups) at corresponding positions and times must be equal. ② Inverse similarity theorem: For all similar phenomena, if the singular value conditions (i.e., the geometric parameters, physical parameters, initial conditions, and boundary conditions of the system) are similar and the similarity criteria formed by these conditions are equal, the phenomena must be similar. ③ π theorem (existence and composition of similarity criteria): If the equation describing a physical phenomenon contains n physical quantities, including k fundamental dimensions, the phenomenon can be expressed as a function of (n-k) independent similarity criteria.
For the gas–water two-phase flow process of water invasion in a fractured porous carbonate gas reservoir, the model and the prototype must be geometrically similar, dynamically similar, kinematically similar, and similar in boundary conditions and initial conditions.
To obtain similarity criteria suitable for this study, it is necessary to start from the set of governing equations describing the essence of the aforementioned process. Water invasion in carbonate gas reservoirs with edge–bottom water can be simplified to an isothermal two-phase (gas–water) flow process. Its continuity equation is as follows [19]:
( ϕ ρ α S α ) t + ( ρ α v α ) = 0 ( α = g , w )
where, ϕ is the porosity, ρ α is the density, S α is the saturation, and v α is the Darcy velocity.
Its equation of motion can be expressed as [20]:
v α = K k r α μ α ( P α ρ α g D )
where, K is the absolute permeability, kr is relative permeability, μ is the velocity, P is the pressure, g is the gravitational acceleration, and D is the depth.
Capillary pressure can be expressed by the following equation:
P c ( S w ) = P g P w
Capillary pressure (Pc) is a function of water saturation (Sw) and a key force controlling the distribution of gas and water in micropores.
To make the governing equations dimensionless during the derivation of similarity criteria, a set of characteristic quantities needs to be selected to make all physical quantities dimensionless [21,22]. Based on the characteristics of water invasion problems in carbonate gas reservoirs with edge–bottom water, characteristic length, characteristic pressure, characteristic velocity, and characteristic time are selected as characteristic quantities for this study, which are defined as L c , P c , v c , and t c = L c v c , respectively.
Therefore, the dimensionless equation of motion for the water phase can be expressed as:
v w D = K P c μ w v c L c k r w μ w D ( D P w D ρ w g L c P c D D D )

3.2. Determination of Similarity Criteria

In the investigation of practical problems, it is impossible to satisfy the condition that all criteria are completely equal (completely similar). Therefore, based on the patterns and characteristics of water invasion in carbonate gas reservoirs with edge–bottom water, the Bond number (Nb) [23], capillary number (Nc) [24], gravity number (NGV) [25], and geometric and temporal similarity criteria were selected as key similarity criteria. The Bond number can be expressed as:
N B = ( ρ w ρ g ) g L c 2 σ ϕ / K
where, ρw is the density of the water phase, ρg is the density of the gaseous phase, g is the gravitational acceleration, Lc is the characteristic length (e.g., the height of the gas column), σ is the gas/water interfacial tension, ϕ is the porosity, and K is the permeability.
N C = μ w v c σ
where, μw is the viscosity of the water phase, and vc is the characteristic velocity (e.g., displacement rate).
N G V = Δ ρ g K μ w v c
The geometric and temporal similarity ratios can be expressed as:
α L = L m o d e l L p r o t o t y p e
α t = t m o d e l t p r o t o t y p e
In summary, by adjusting parameter settings including petrophysical properties (μ, σ, and ρ), core size (Lc), injection rate (vc), and pressure (Pc), these similarity criteria of the physical model can be made consistent with those of the real gas reservoir [26,27,28]. For the parameter settings of a numerical model, the values converted from similarity criteria can be used to ensure that the numerical model effectively reflects the physical simulation results and to improve the accuracy and reliability of the model.

4. Rational Production Allocation for Gas Reservoirs with Edge–Bottom Water

In this section, a systematic study is carried out on rational production allocation for carbonate gas reservoirs with edge–bottom water in the Dengying Formation of Sichuan Basin based on a numerical model experimentally calibrated using similarity theory. The study focuses on controlling water invasion, delaying water breakthrough, and maximizing the recovery degree. By designing and simulating multiple sets of different geological parameters and development schemes, the mechanism by which the intensity of production affects the water invasion rate, water breakthrough time, and recovery degree is analyzed in depth. Finally, by systematically correlating key dynamic response indicators with geological-engineering parameters and production allocation systems, a rational production allocation method suitable for scheme optimization and rapid evaluation is established with a view to providing decision-making support for the scientific and efficient exploitation of similar gas reservoirs with edge–bottom water in Sichuan Basin.

4.1. Design of the Model for Rational Production Allocation of Gas Wells

There are three major factors to be considered to achieve rational production allocation for gas wells [29,30]. First, reservoir energy should be utilized as far as reasonably practicable. Second, production allocation should enable gas wells to produce stably for a certain period of time. Third, production allocation should be conducive to improving the ultimate recovery degree. Numerical simulation has significant advantages in production capacity evaluation. It can effectively simulate underground conditions through geological modeling, comprehensively consider the geological characteristics of gas reservoirs and factors such as stress sensitivity and pressure gradient, and achieve rational production optimization based on actual needs during stable production periods.
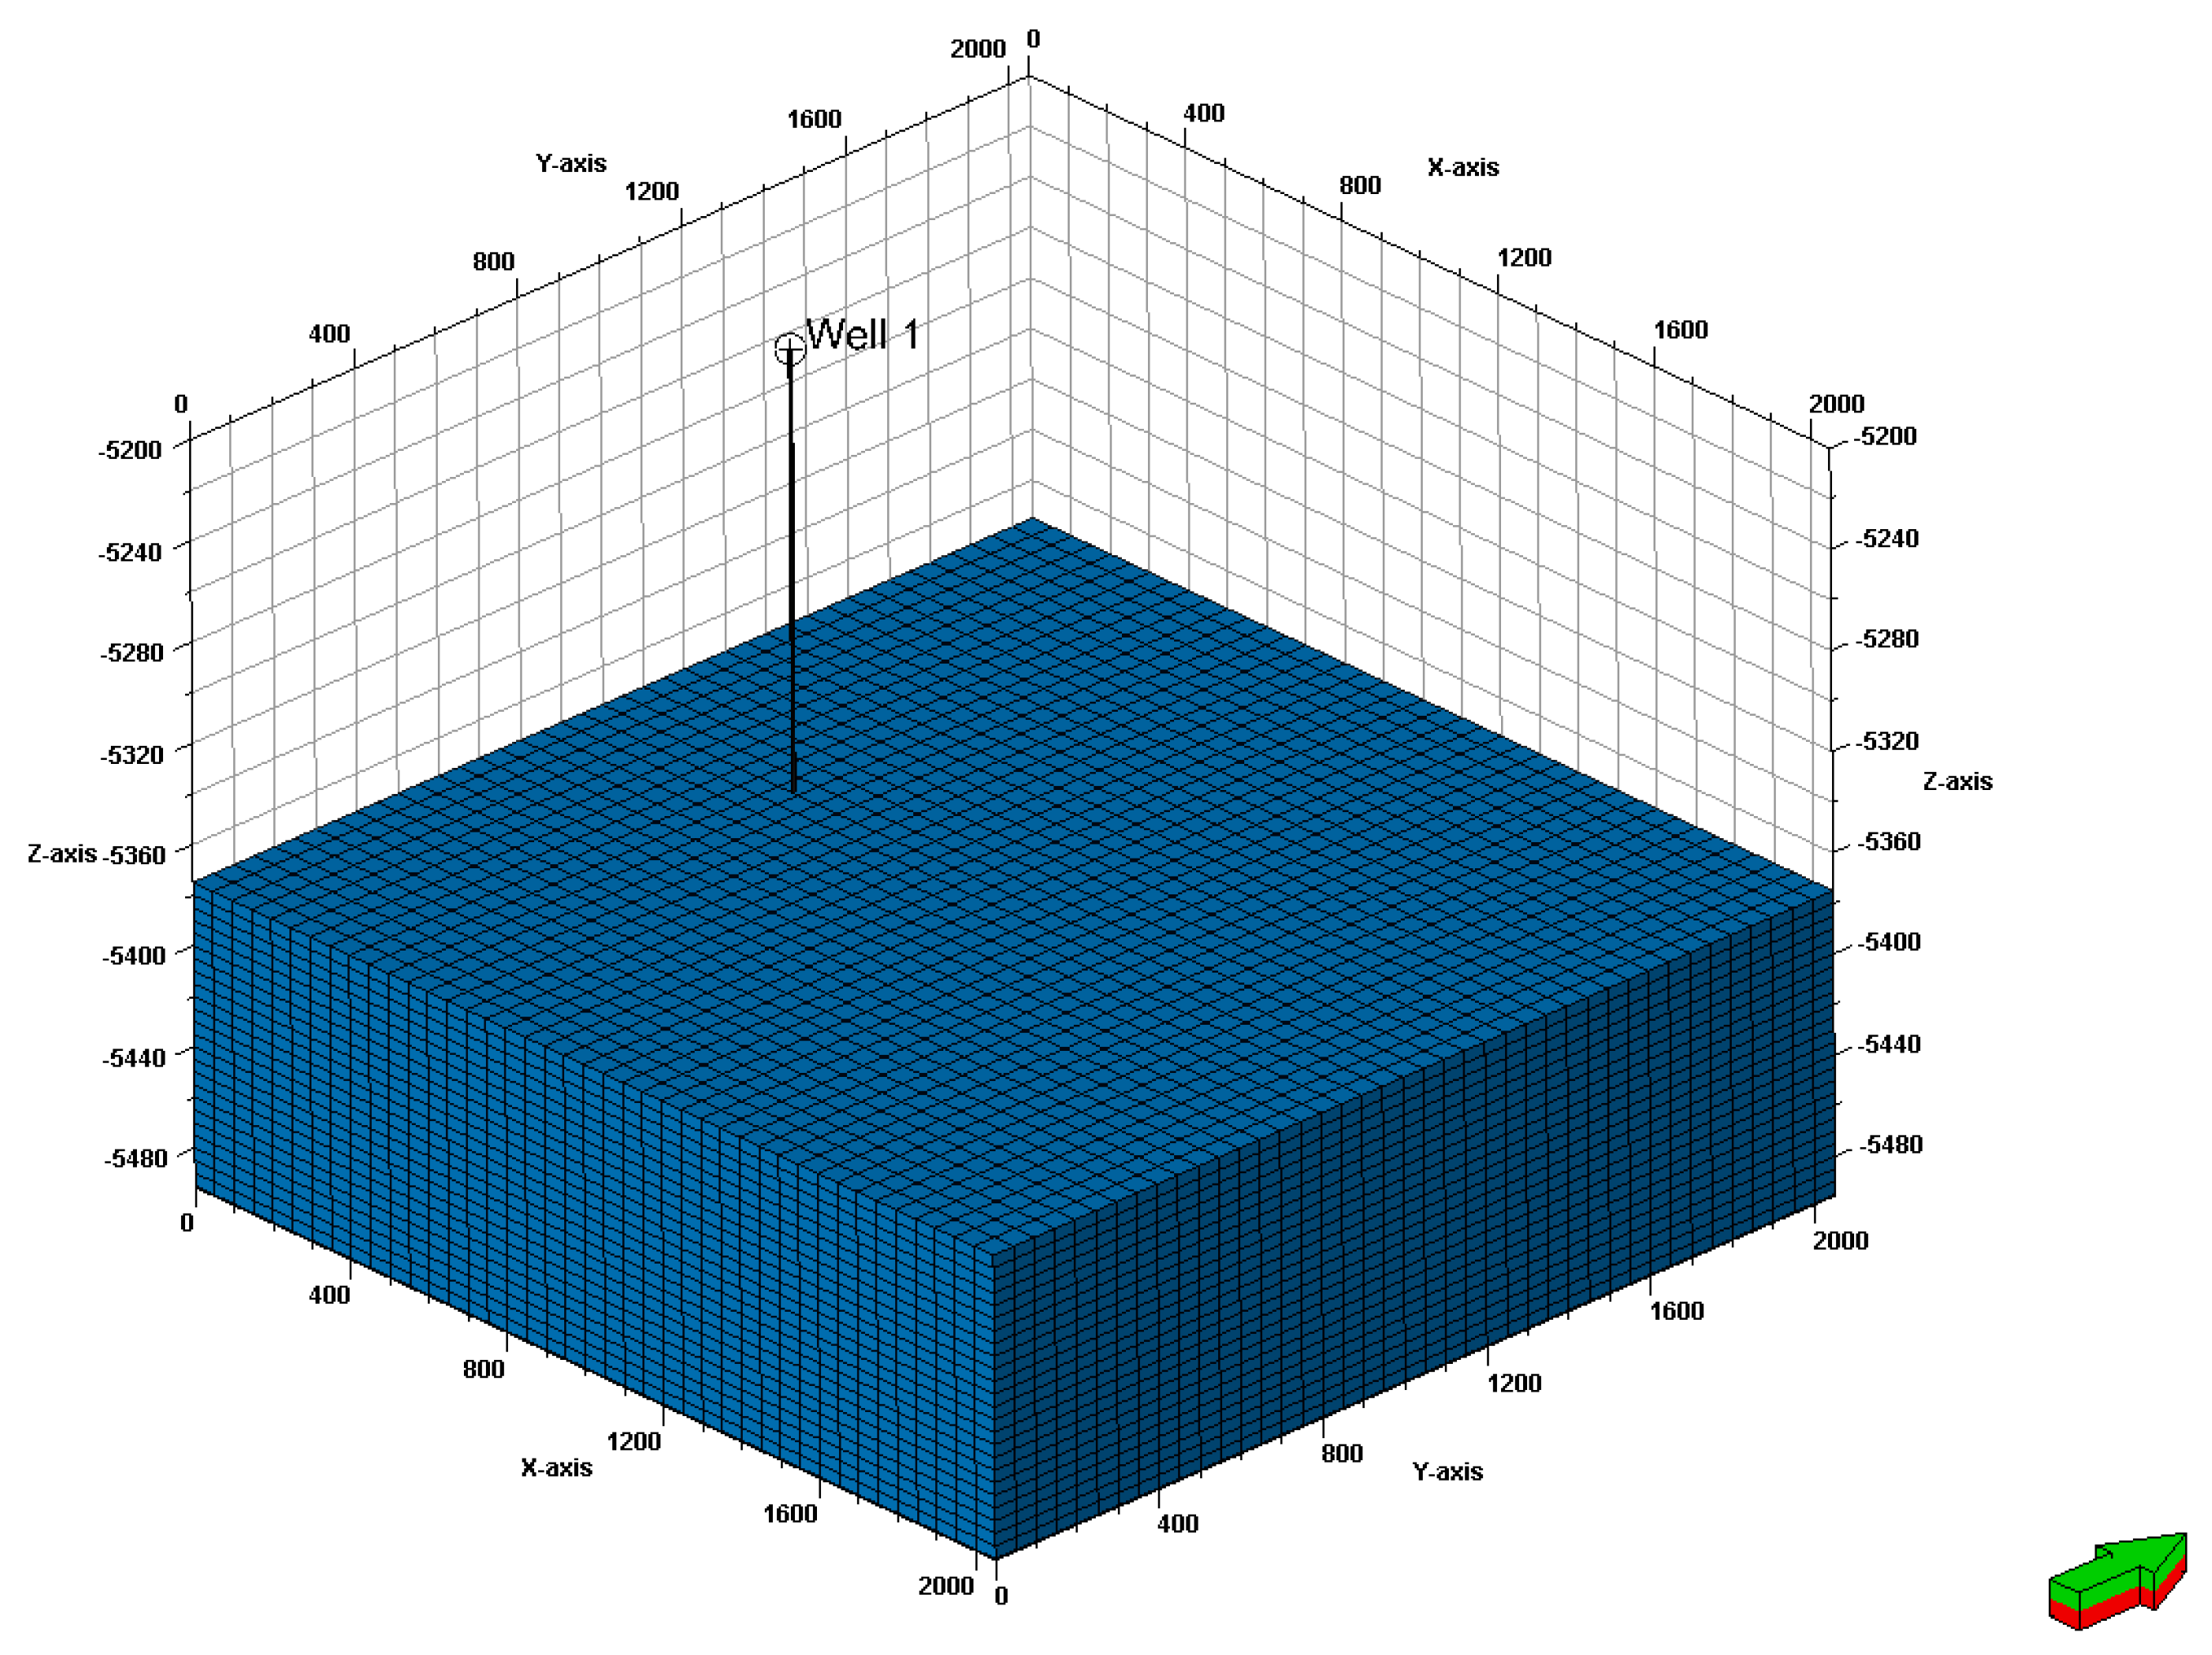
A typical single-well-scale (horizontal well) model for gas reservoir exploitation was established through numerical simulation, as detailed below. A gridded model was created, parameters such as reservoir properties, fluid properties, and well data were input into the model, and model initialization was performed. Reservoir properties include porosity and permeability in the i, j, and k directions. Fluid properties include the volume coefficient, compressibility coefficient, viscosity, and relative permeability curves of the gas and water phases. The model was set with no-flow boundaries in all directions, assuming that the single-well model represents a closed reservoir volume without external fluid influx from adjacent regions. This assumption is consistent with the characteristics of fractured-vuggy gas reservoirs where the well is effectively isolated by low-permeability barriers. Well data include well definition, perforation data, and production data. Model initialization settings include the original formation pressure, reference pressure, and corresponding depth. The single-well-scale numerical model of fractured-vuggy gas reservoirs is shown in Figure 5. The specific model parameters and their values are given in Table 2 and Table 3. The specific parameter values for relative permeability and capillary pressure are listed in Table 4.
The physical experiments described in Section 2 provide the fundamental basis for the numerical simulations, with scale expansion being the core linkage between the two approaches. Key model parameters—including porosity, permeability, relative permeability curves, and capillary pressure functions—were measured or calibrated using the fabricated cores under controlled laboratory conditions and subsequently input into the numerical model to ensure consistency. While physical experiments capture multiphase flow mechanisms at the core scale, numerical simulations enable scale expansion to the single-well scale, allowing for the investigation of reservoir heterogeneity, well configurations, and operational conditions that cannot be feasibly tested experimentally. The consistency between physical and numerical simulation results provides cross-validation that enhances the robustness of the proposed production allocation method. Therefore, based on 3D geological models of gas reservoirs in combination with well drilling/completion data, dynamic monitoring data, and actual production data, rational production rates for gas wells can be determined through numerical simulation at the single well scale.

4.2. Rational Production Allocation

Numerical simulation studies on rational production allocation were conducted based on four types of gas reservoirs in the Penglai Gas Field, namely, porous reservoir, vuggy reservoir, fractured-porous reservoir, and fractured-vuggy reservoir.
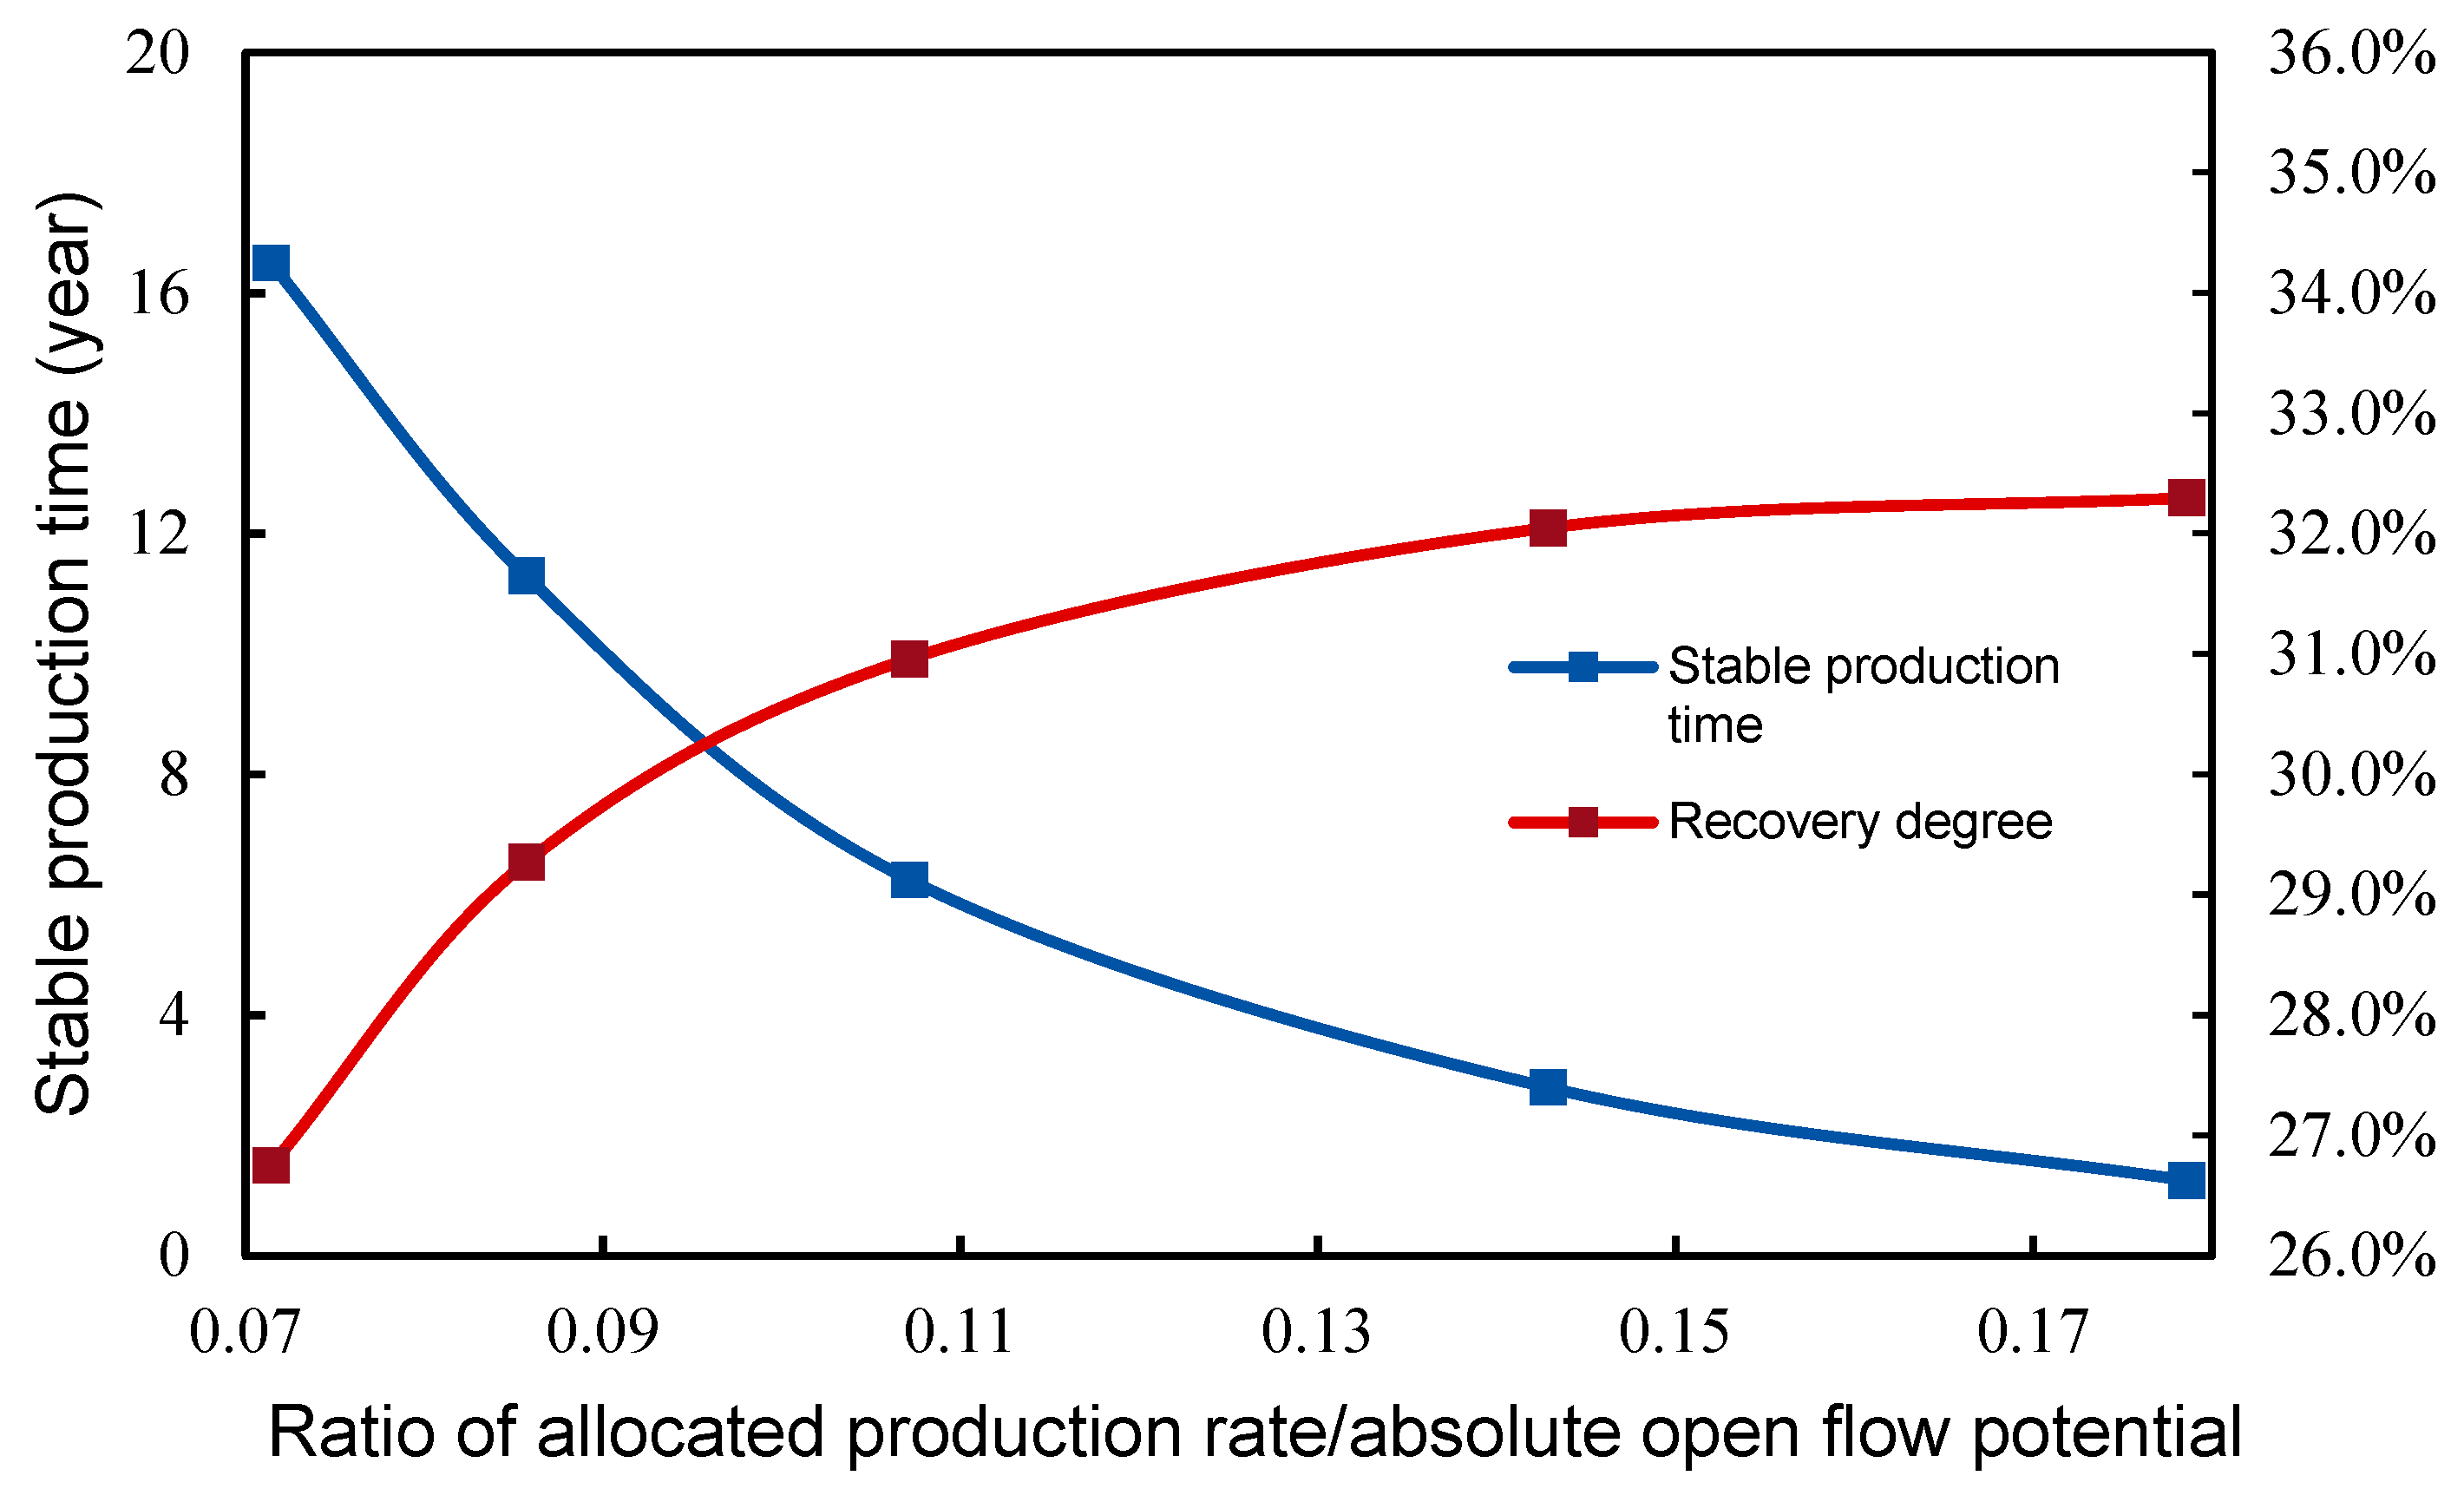
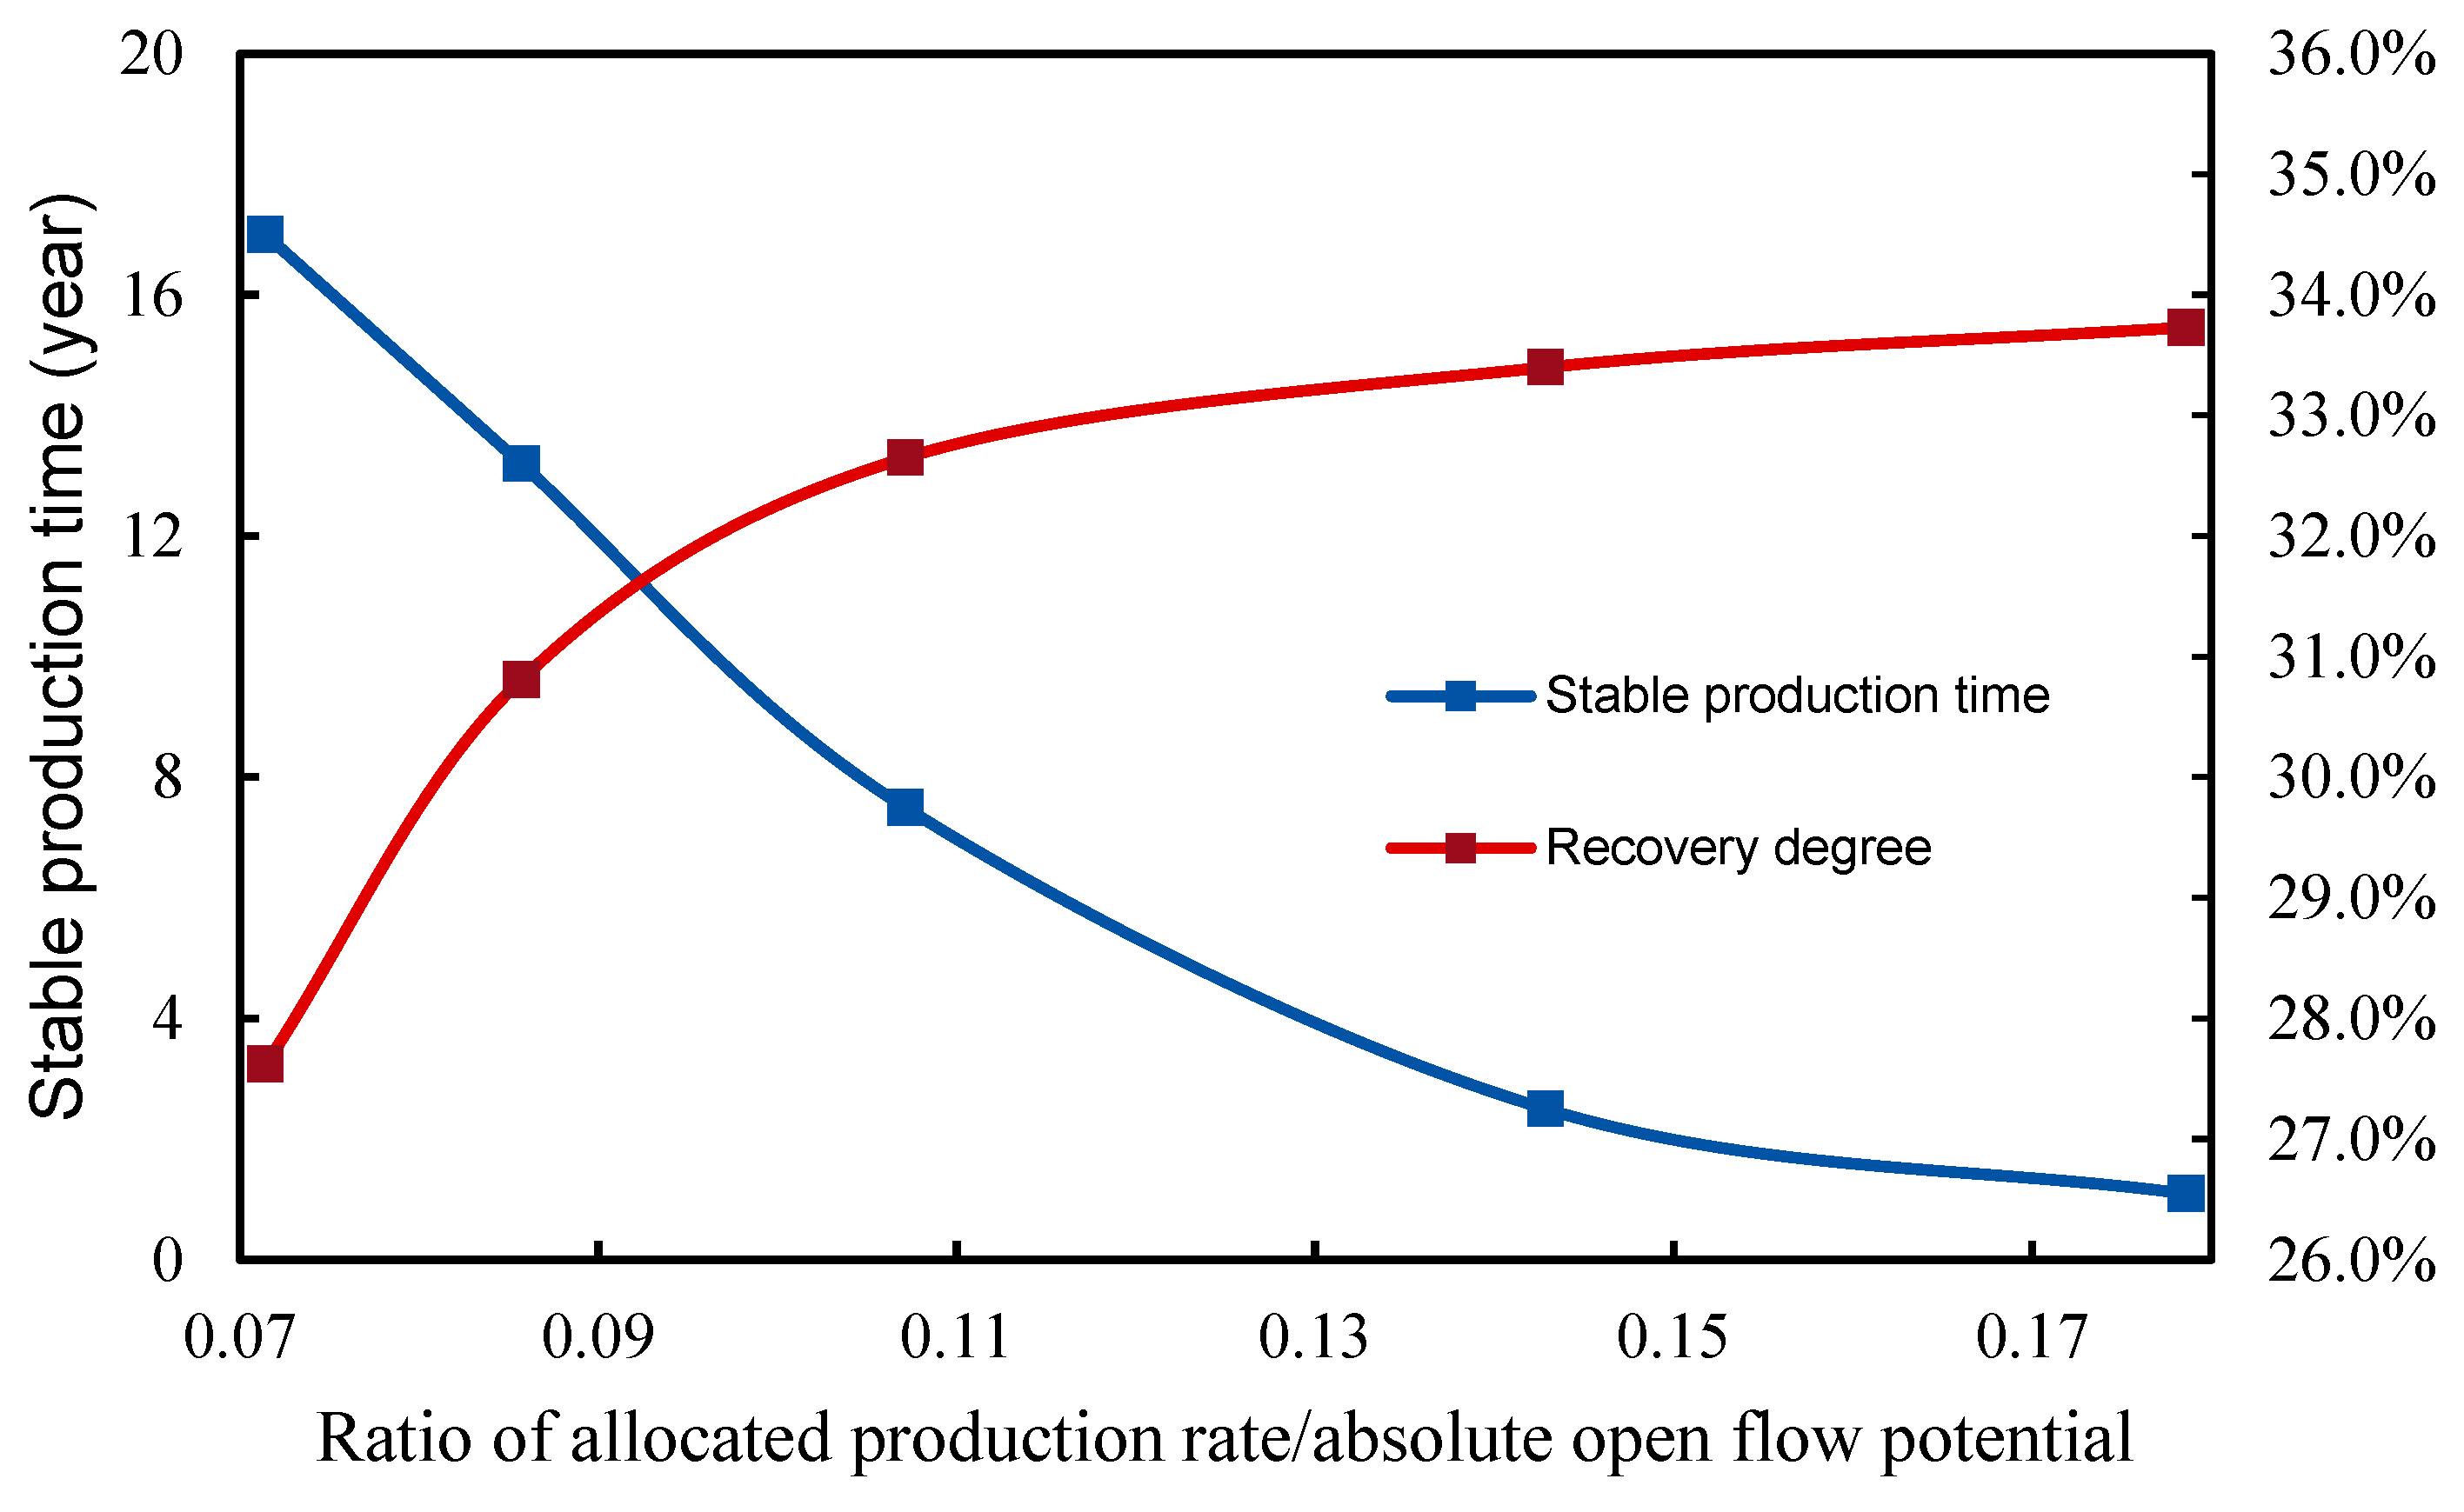
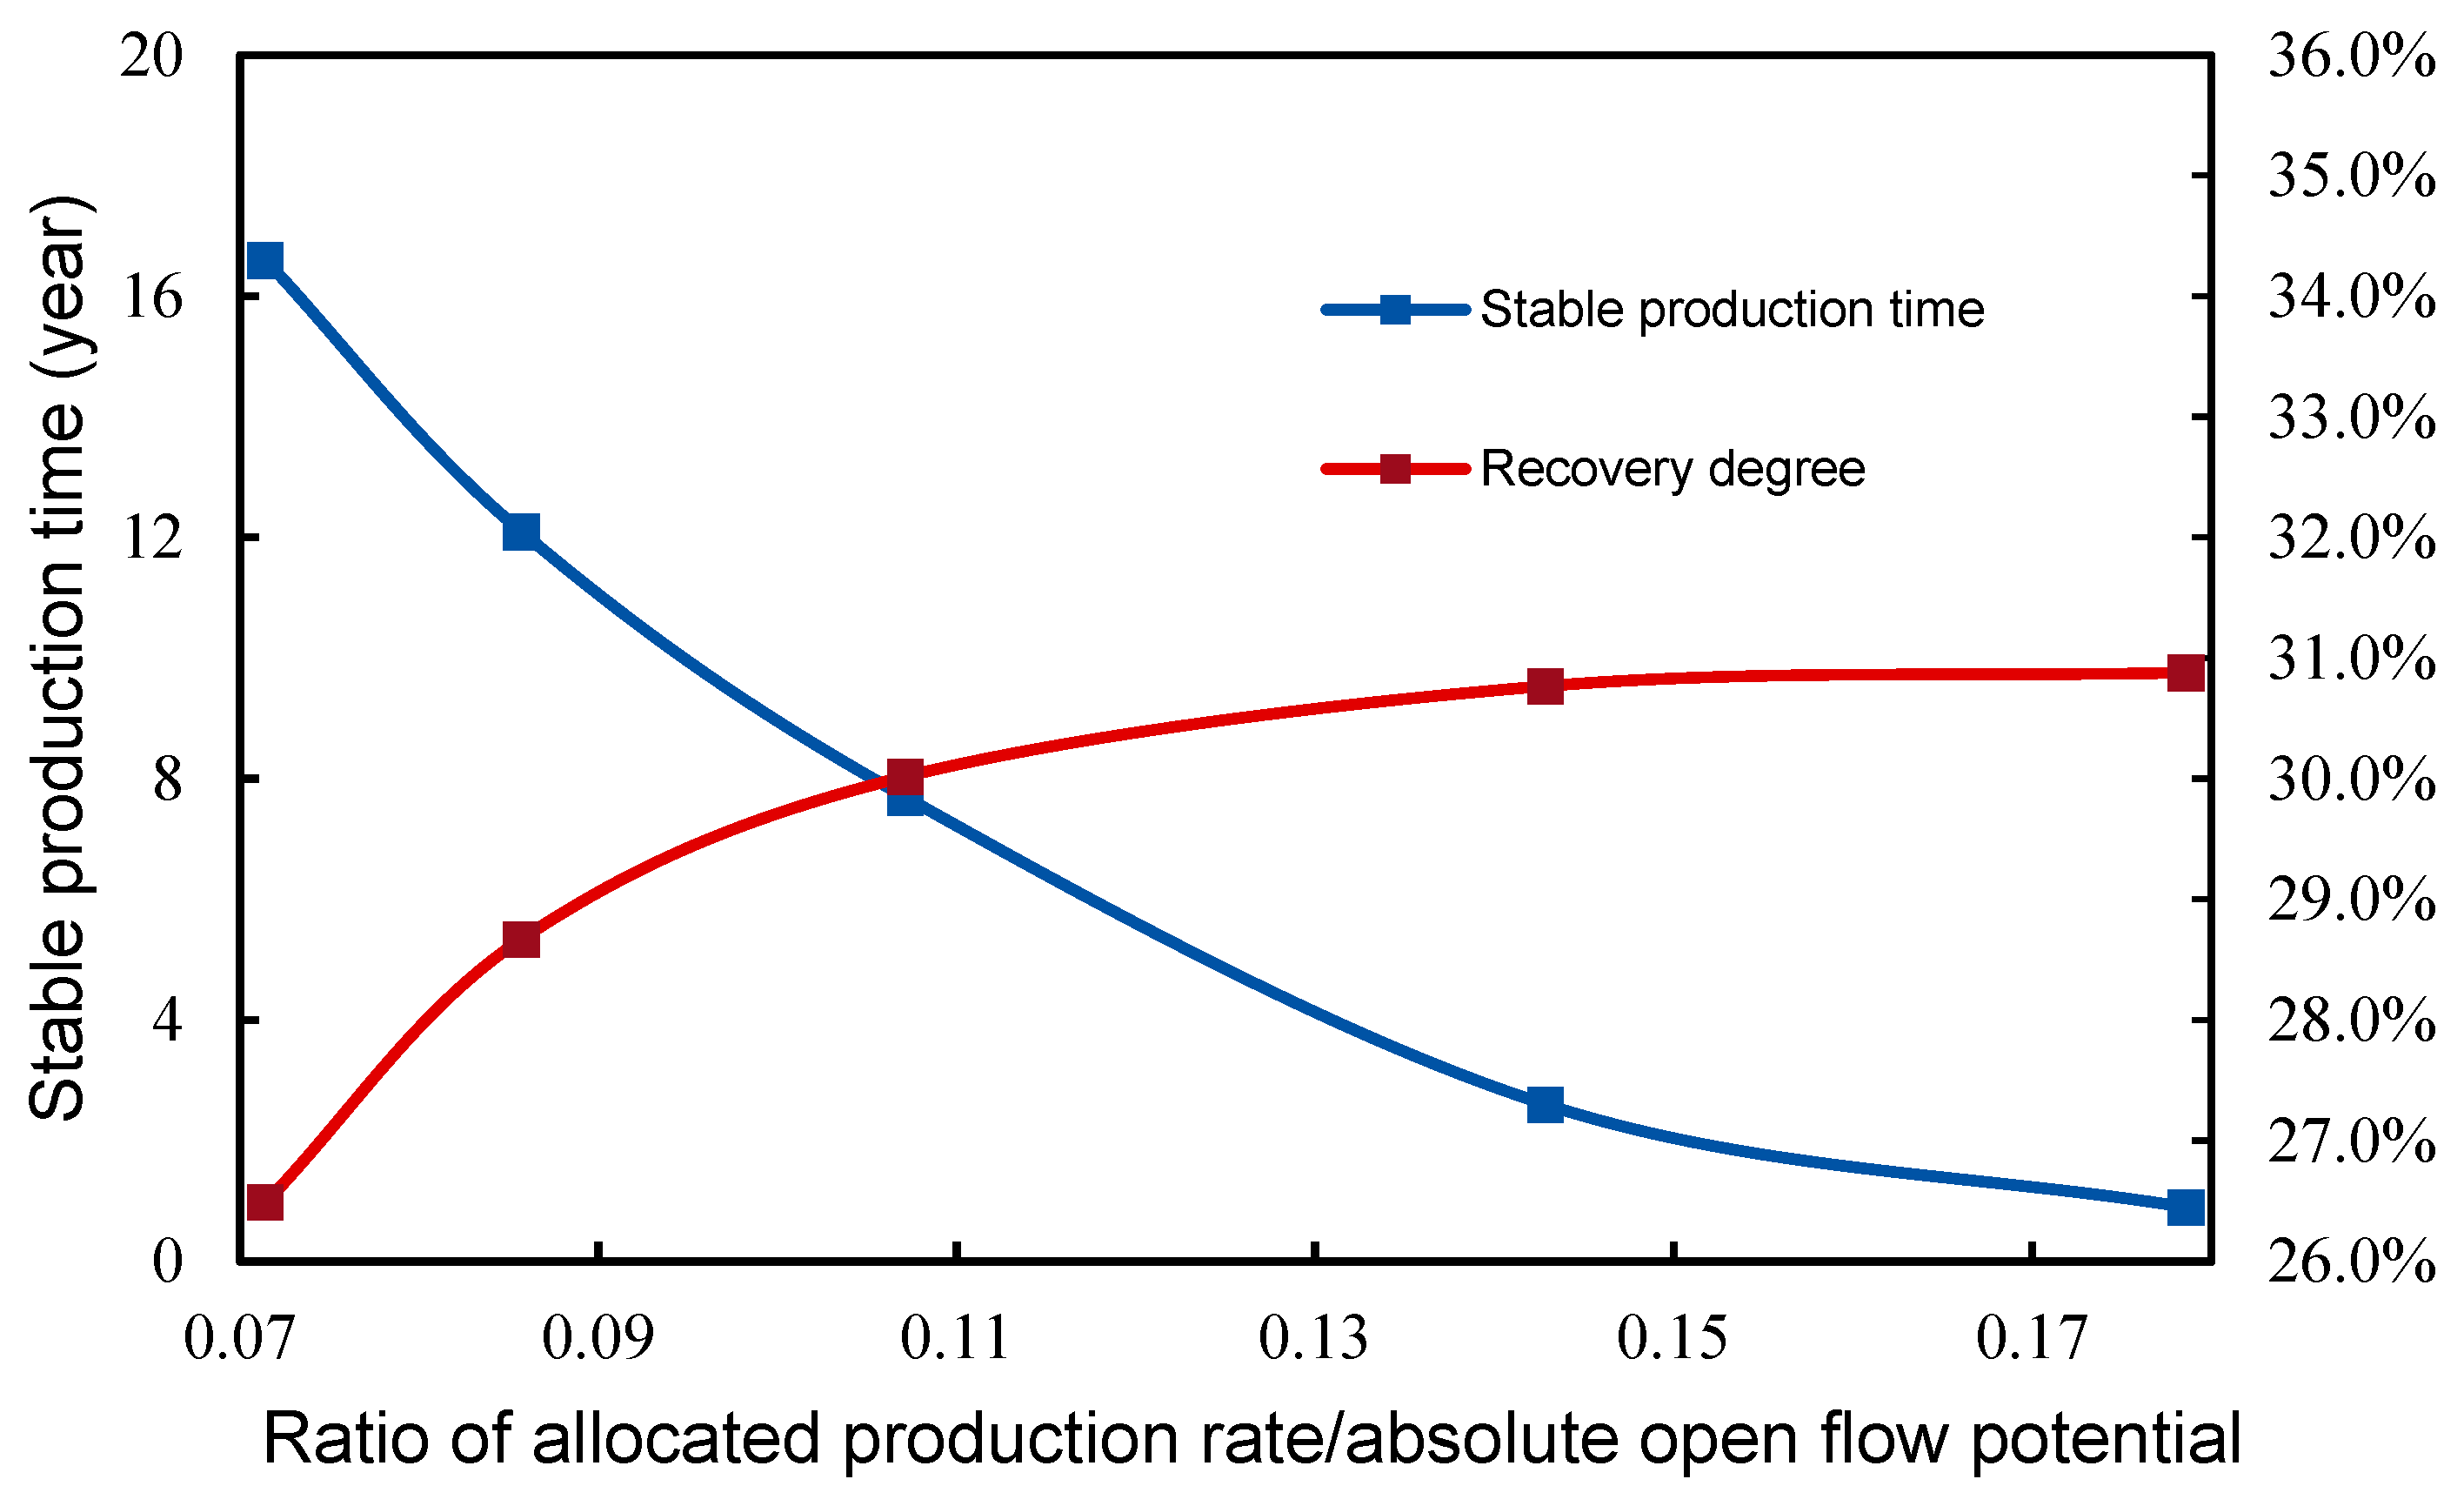
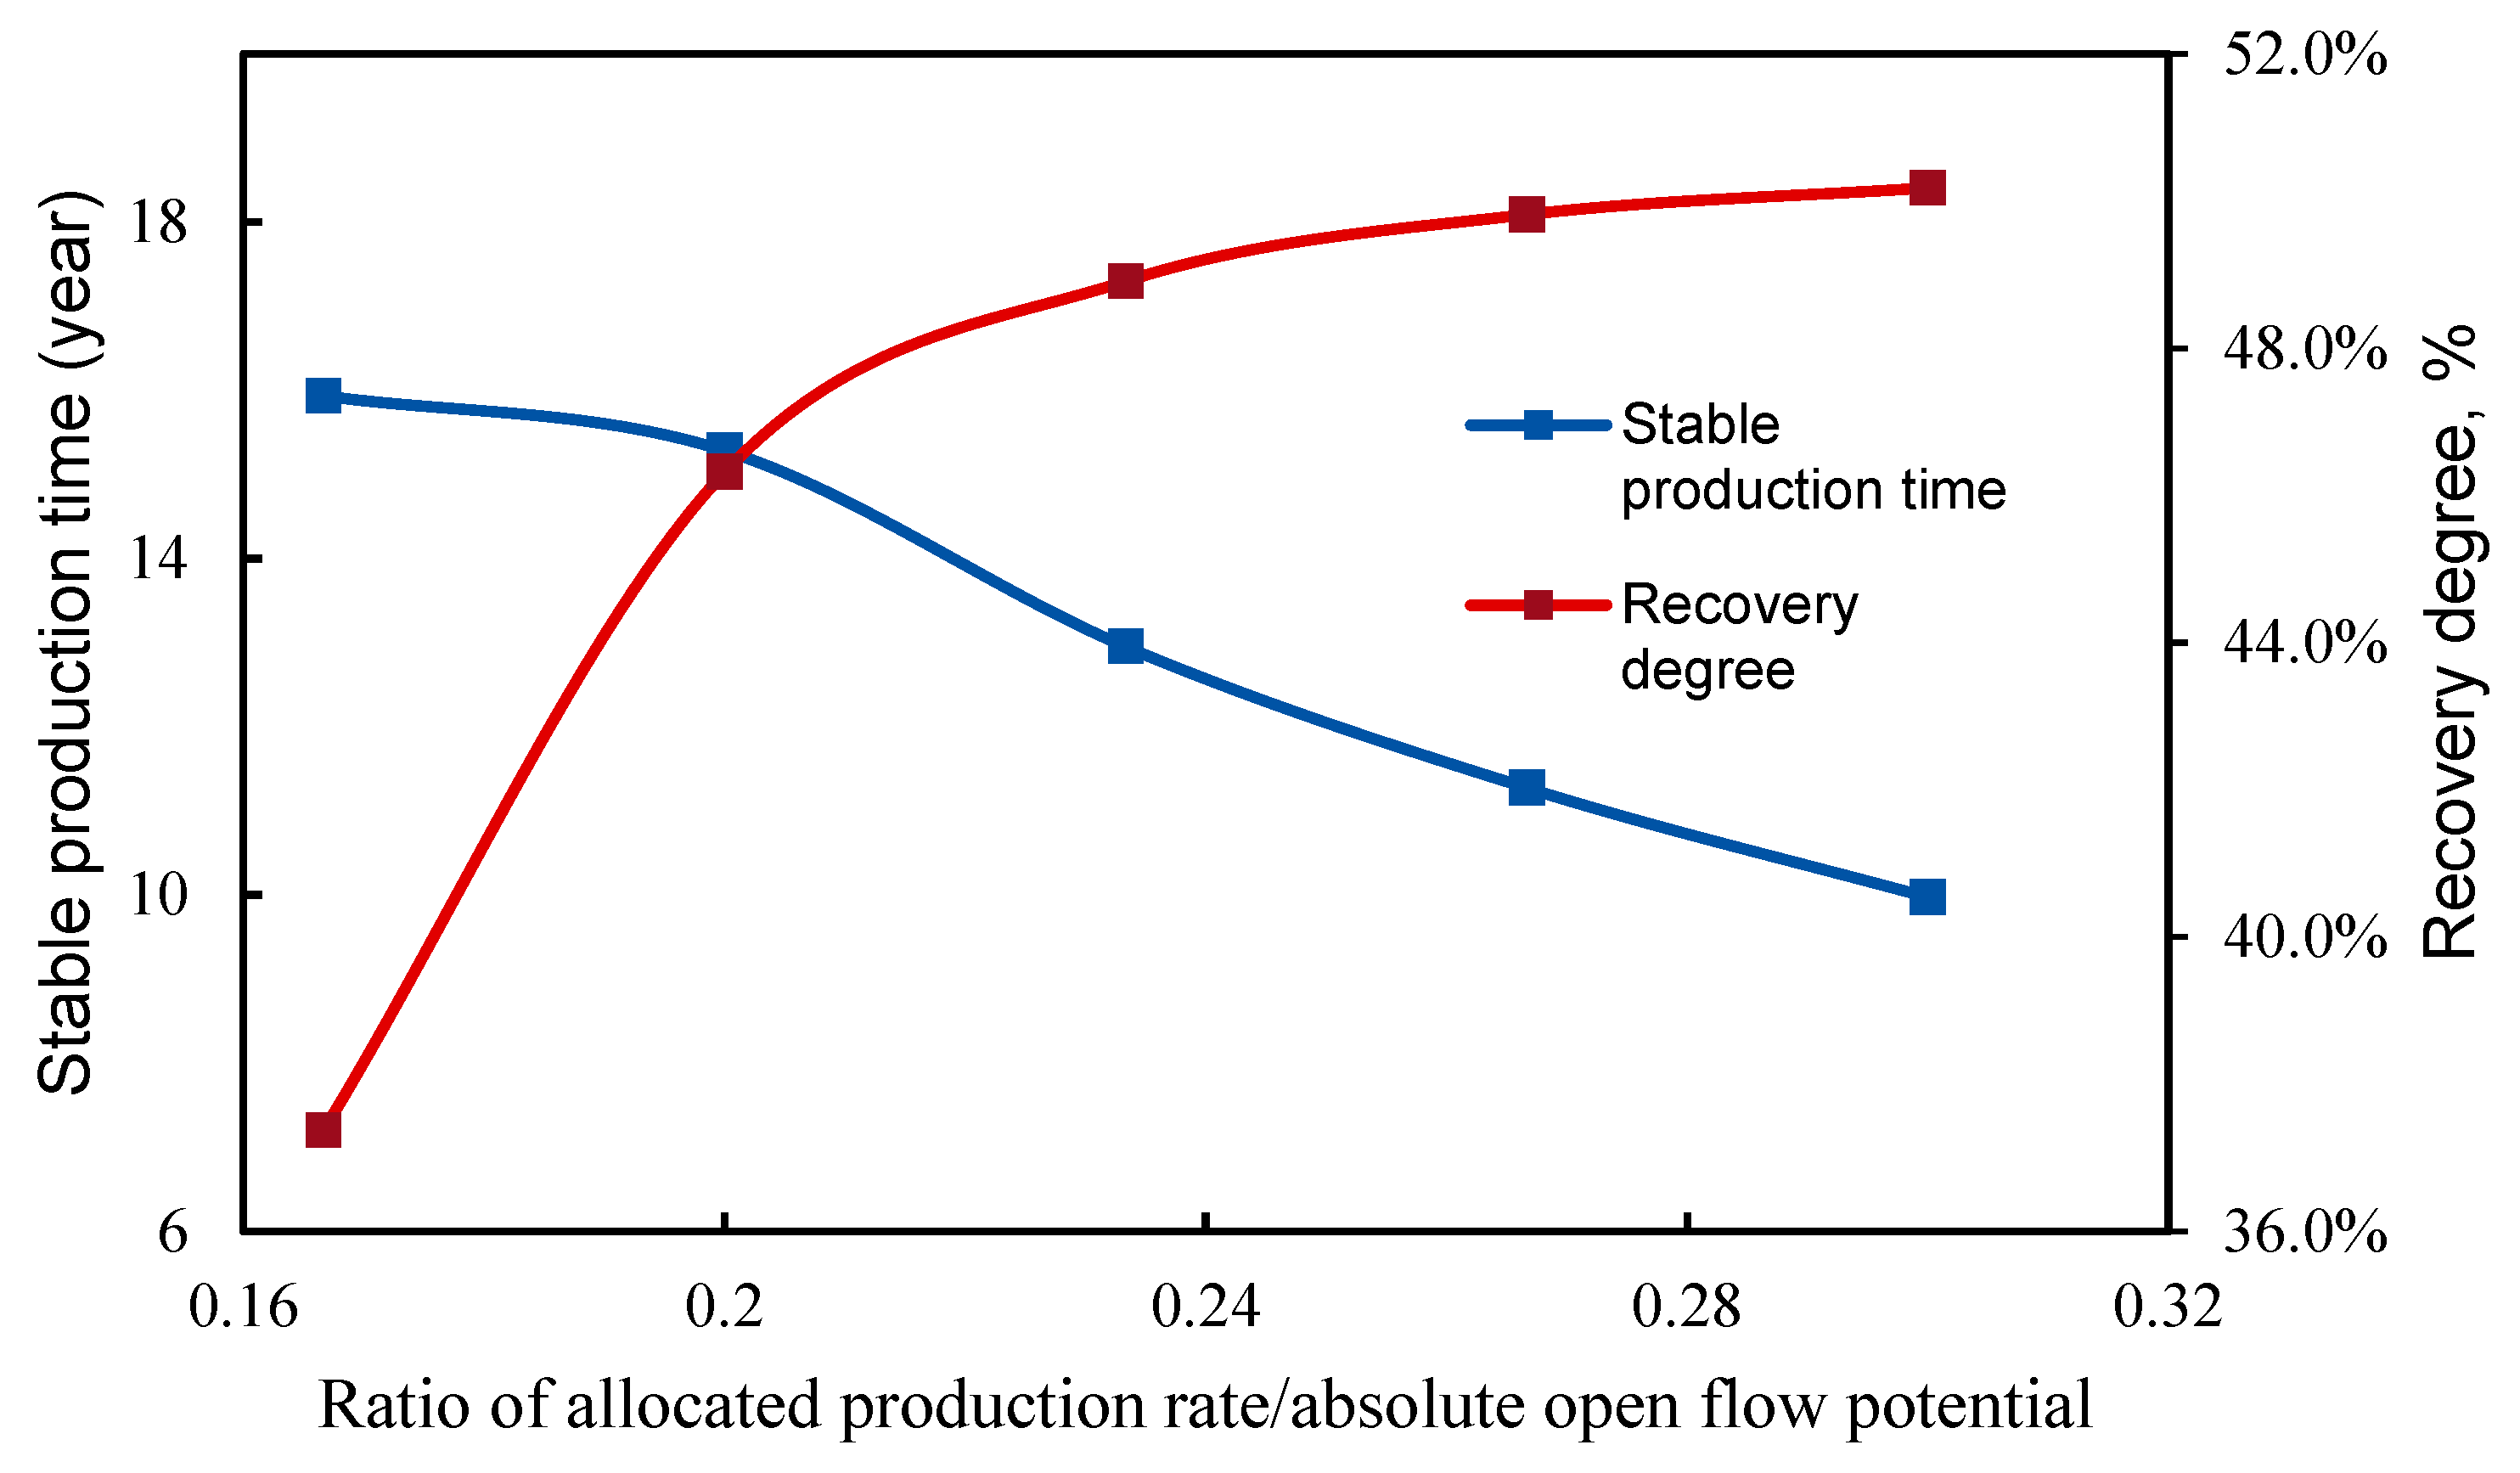
Figure 6, Figure 7 and Figure 8 show the numerical simulation results of production allocation for the porous reservoir model involving different aquifer volume ratio M (M = aquifer volume/gas-in-place pore volume). The porous reservoir model has poor petrophysical properties, for which the aquifer volume and production allocation scheme have significant impacts on the recovery degree. According to the simulation results, the maximum recovery degree is 34% for the model with an aquifer volume ratio M = 2, and the maximum recovery degree under the single-well production mode is 32% with an aquifer volume ratio M = 5, indicating that the increase in aquifer volume has a significant inhibitory effect on gas well productivity.
As the aquifer volume increases, the recovery degree gradually decreases, while the single-well stable production time remains relatively unchanged. This indicates that the increase in aquifer volume mainly affects the ultimate recovery degree and has limited impact on stable production time. The stable production time of a gas well is mainly controlled by its allocated production rate. When the ratio of production rate to absolute open flow potential is maintained at around 0.09, the single-well stable production time can reach 12–15 years; when this ratio increases to around 0.18, the stable production time is generally 4–5 years. Therefore, reasonably controlling this ratio is key to achieving a balance between the recovery degree and stable production time for porous gas reservoirs.
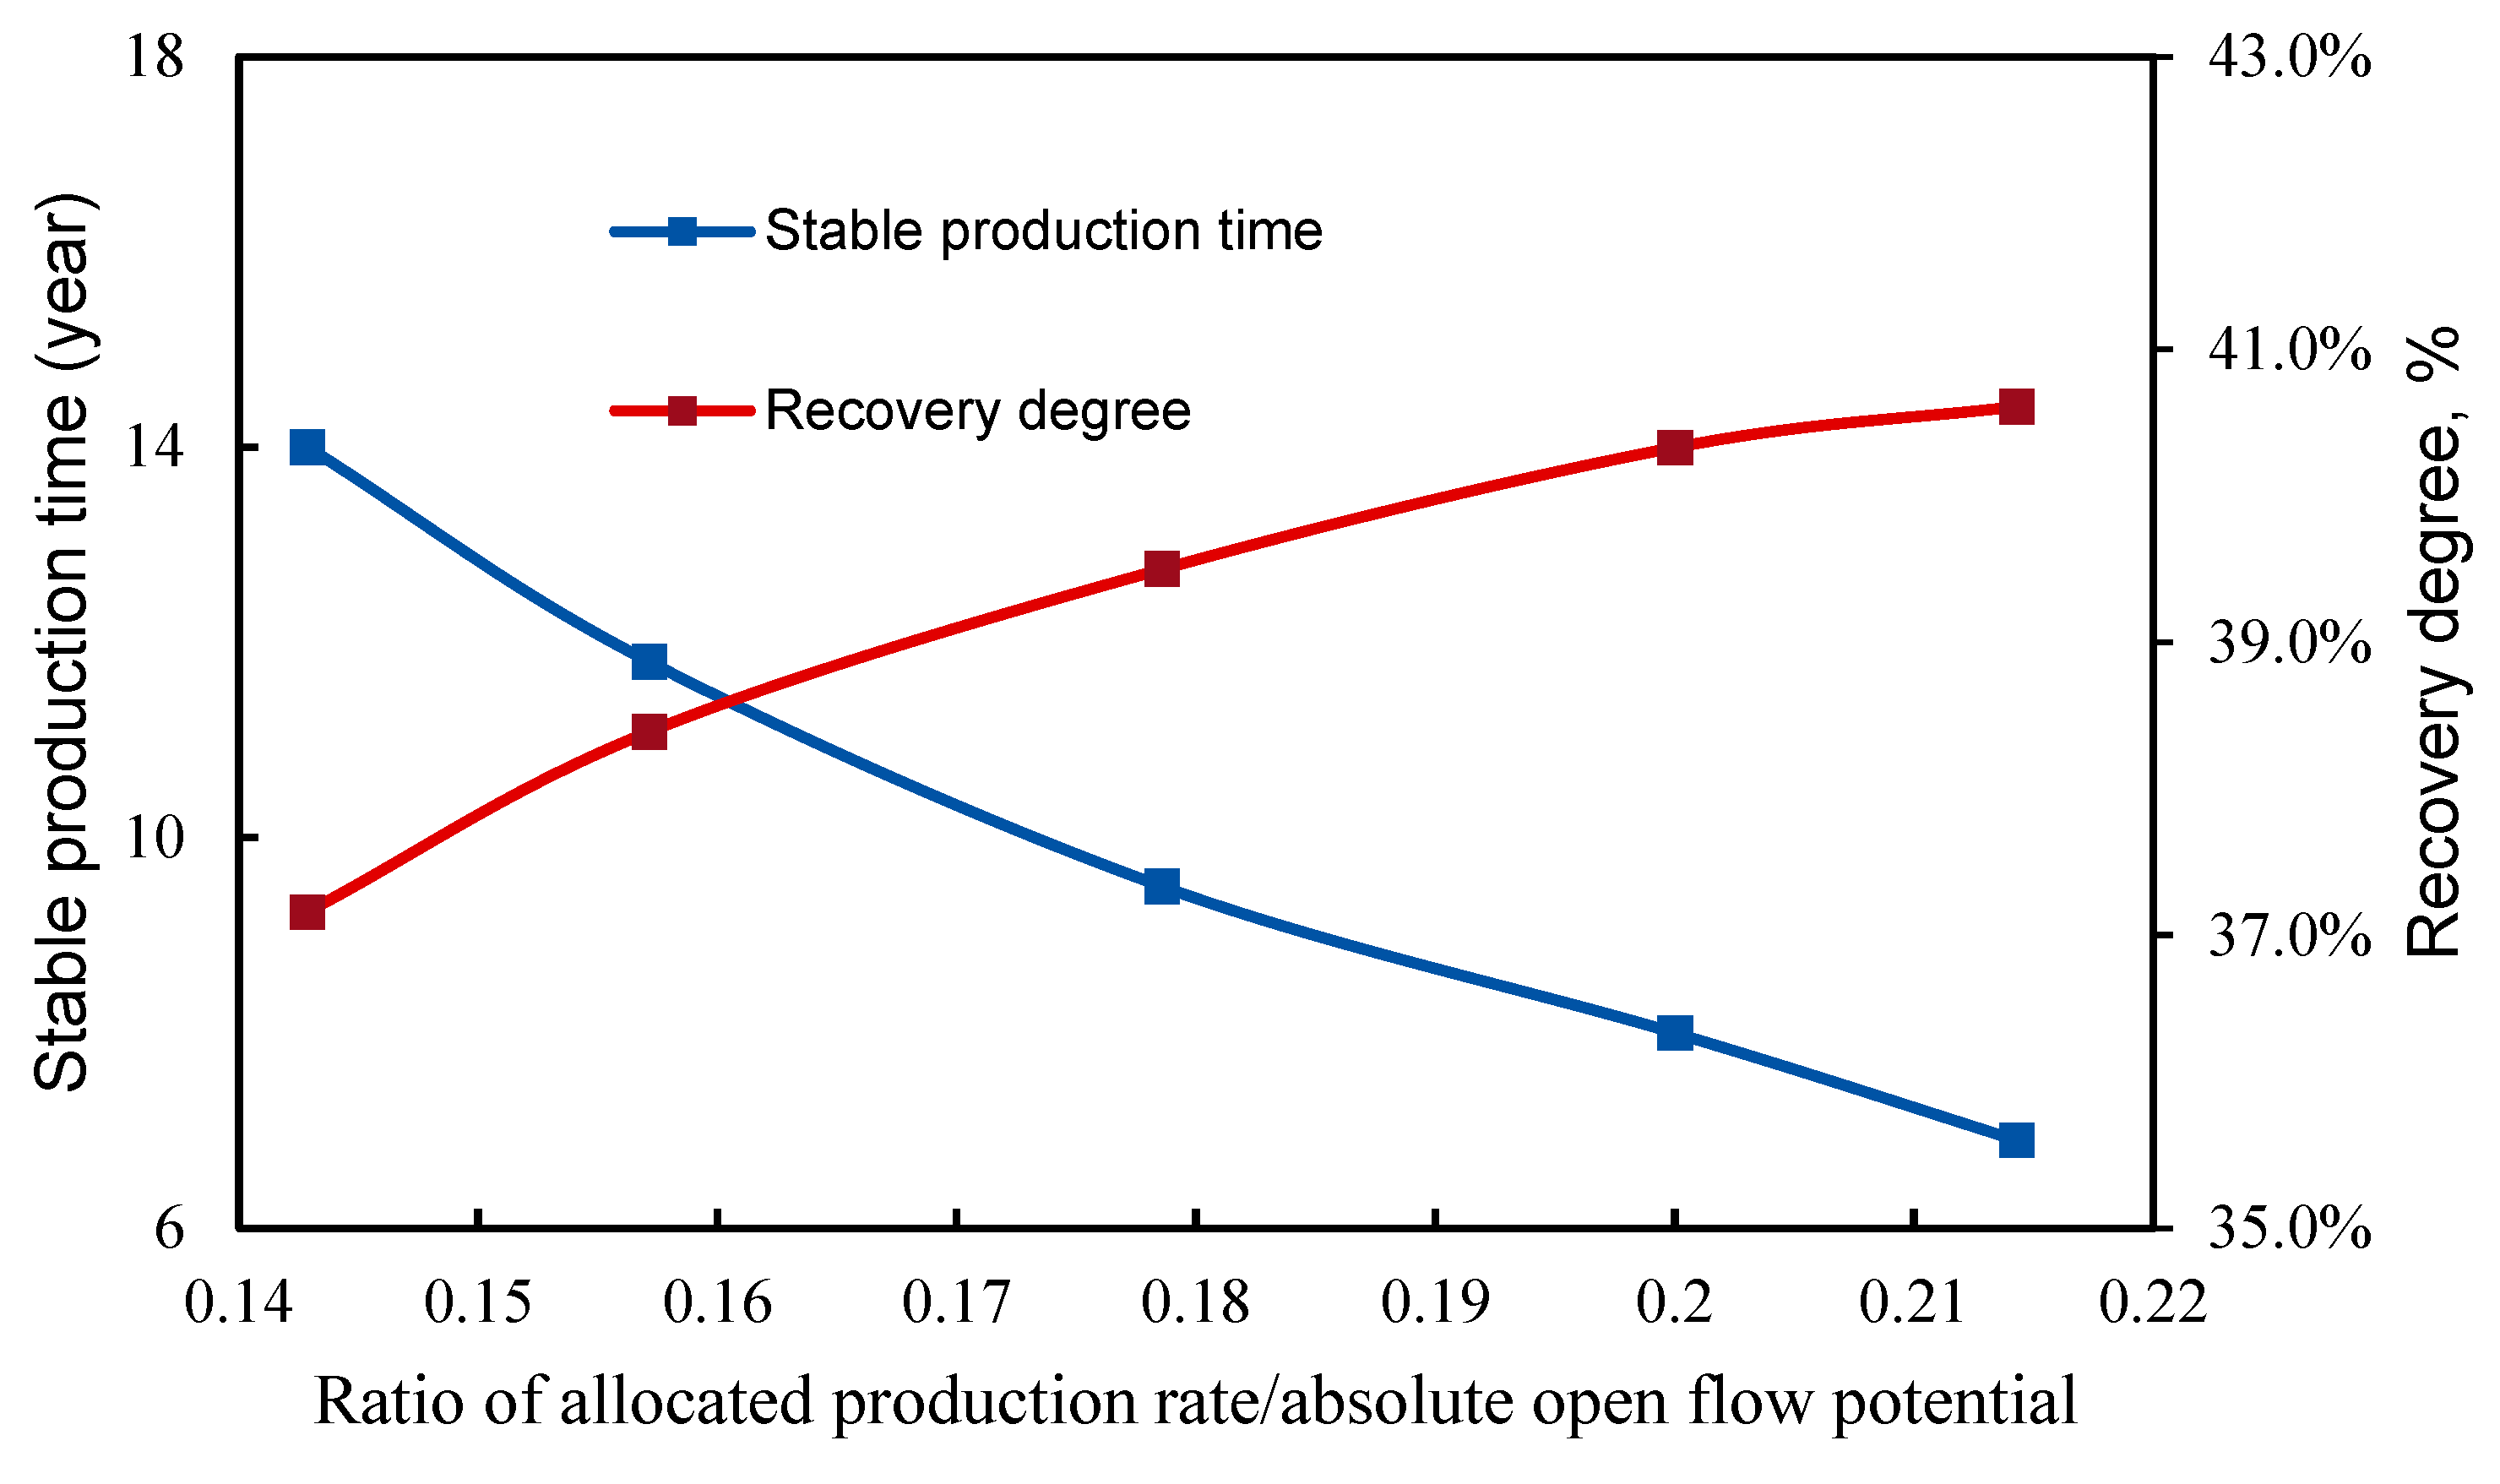
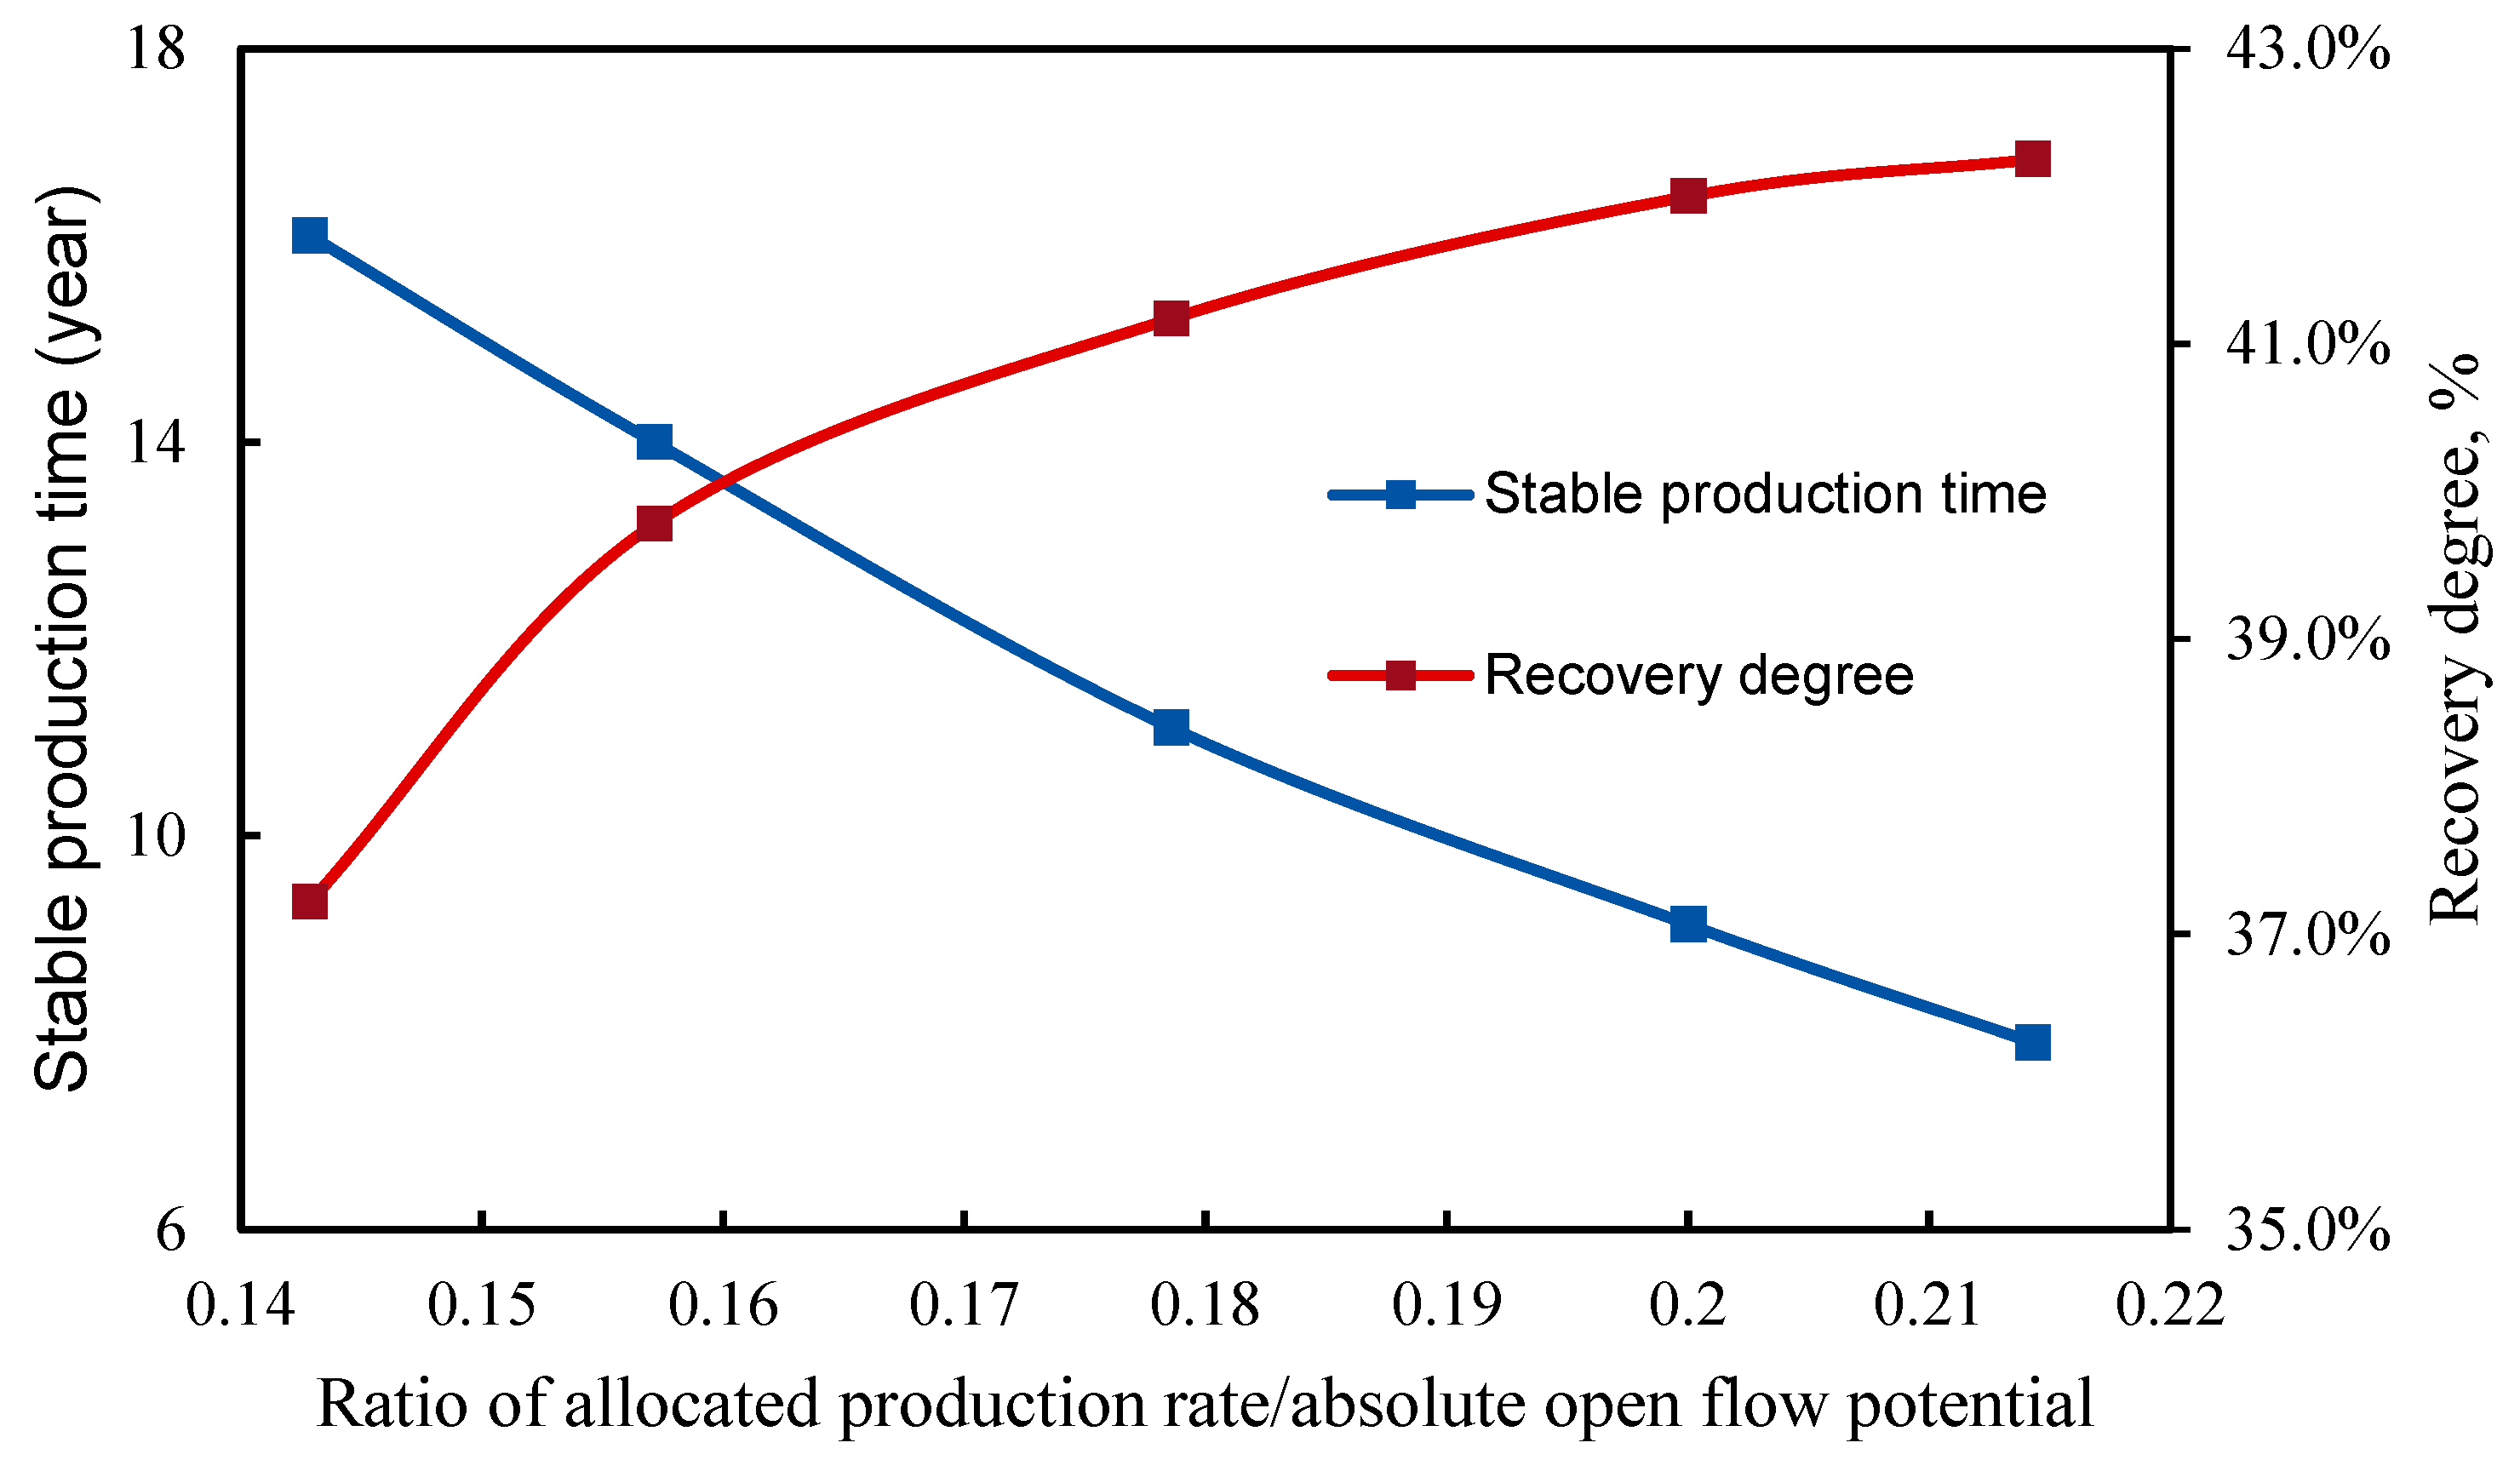
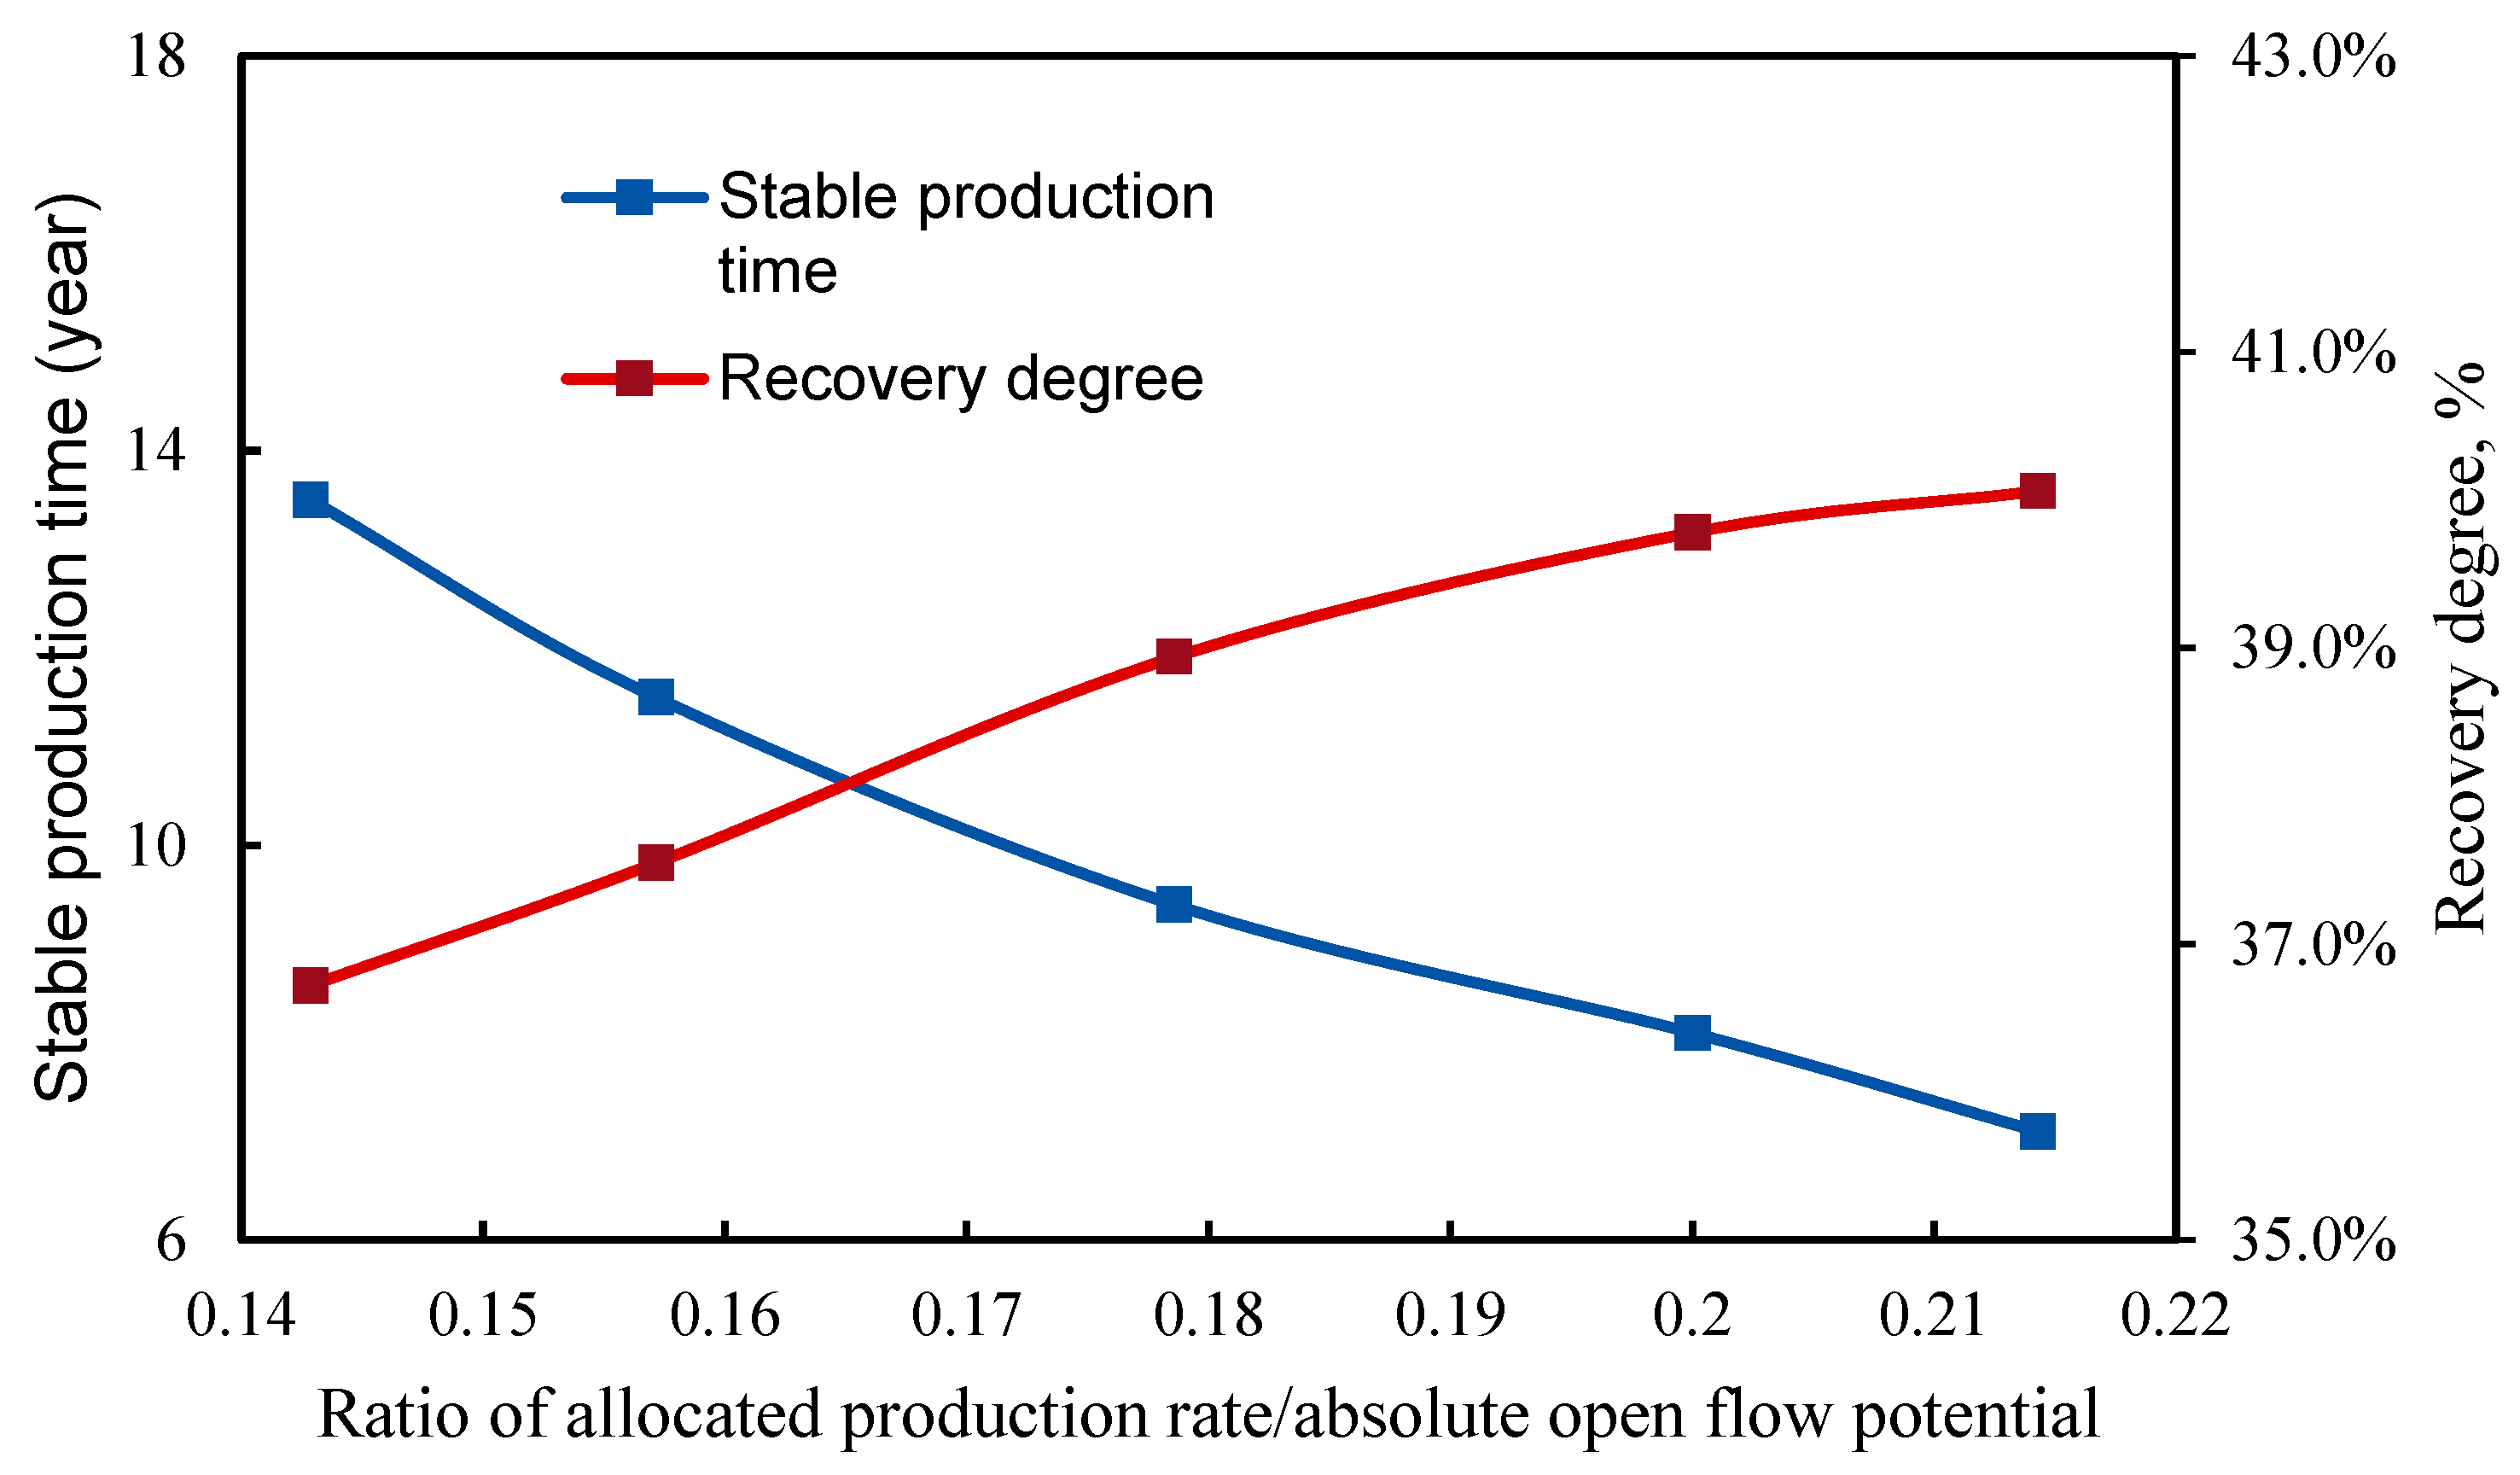
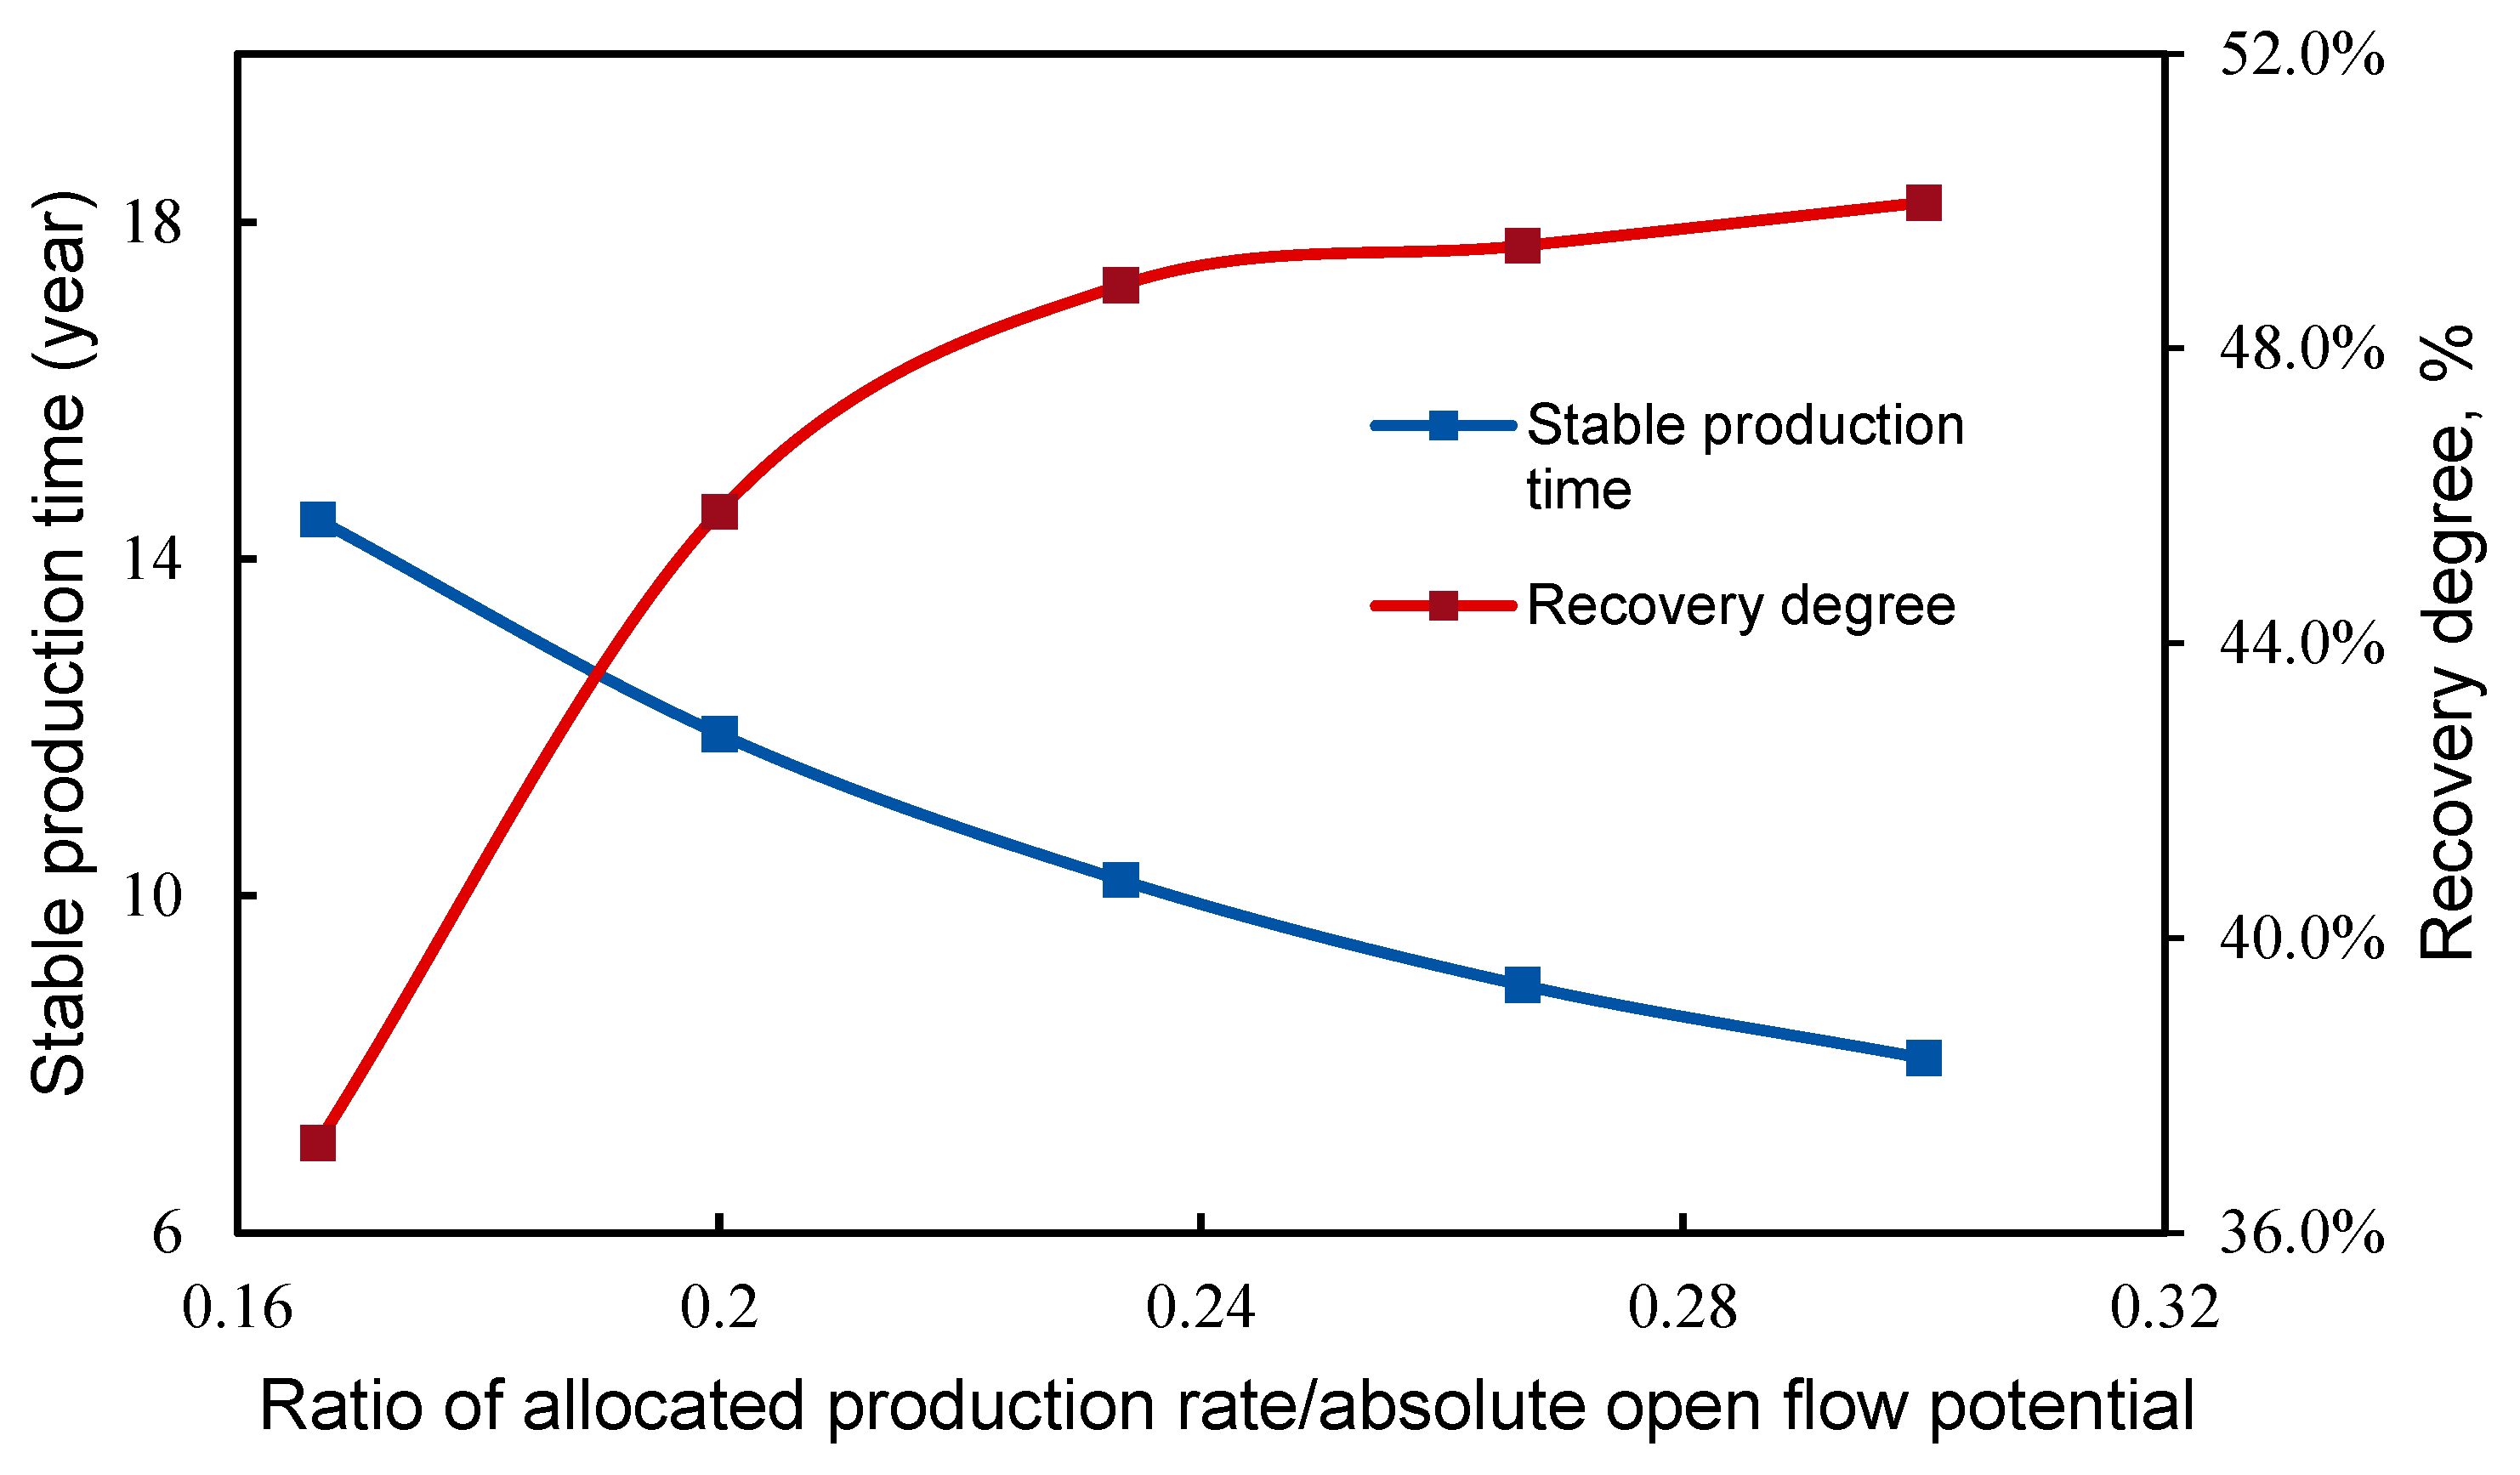
Figure 9, Figure 10 and Figure 11 show the numerical simulation results of production allocation for the vuggy reservoir model involving different aquifer volume ratio. These results indicate that the aquifer volume has a significant impact on the stable production time and recovery degree of gas wells. When the aquifer volume is small, the stable production time is relatively short, and the recovery degree is relatively low; the longest stable production time is approximately 14 years, and the recovery degree is approximately 41%. As the aquifer volume increases to an appropriate level, the stable production time and recovery degree both increase, indicating that reasonably increasing the aquifer volume is favorable for increasing reservoir energy and can improve production performance to some extent.
However, as the aquifer volume ratio exceeds the appropriate level, the stable production time and recovery degree of gas wells decrease due to water channeling and water sealing. In general, reasonable production rate adjustments for vuggy gas reservoirs involving different aquifer volume ratio have significant impacts on the stable production time and recovery degree of gas wells. The highest recovery degree in numerical simulation is 42%, indicating that production rate optimization can effectively mitigate the adverse impacts of large aquifer volume.
Figure 12, Figure 13 and Figure 14 show the numerical simulation results of production allocation for the fractured-porous reservoir model involving different volumes of water. The fractured-porous reservoir model has demonstrated relatively consistent production characteristics. The simulation results show that, as the aquifer volume increases, the stable production time and recovery degree of gas wells do not fluctuate significantly. This suggests that, for fractured-porous reservoirs, the magnitude of water energy and production rate adjustments have limited impacts on the stable production time and ultimate recovery degree, and such reservoirs are relatively stable in withstanding water disturbance.
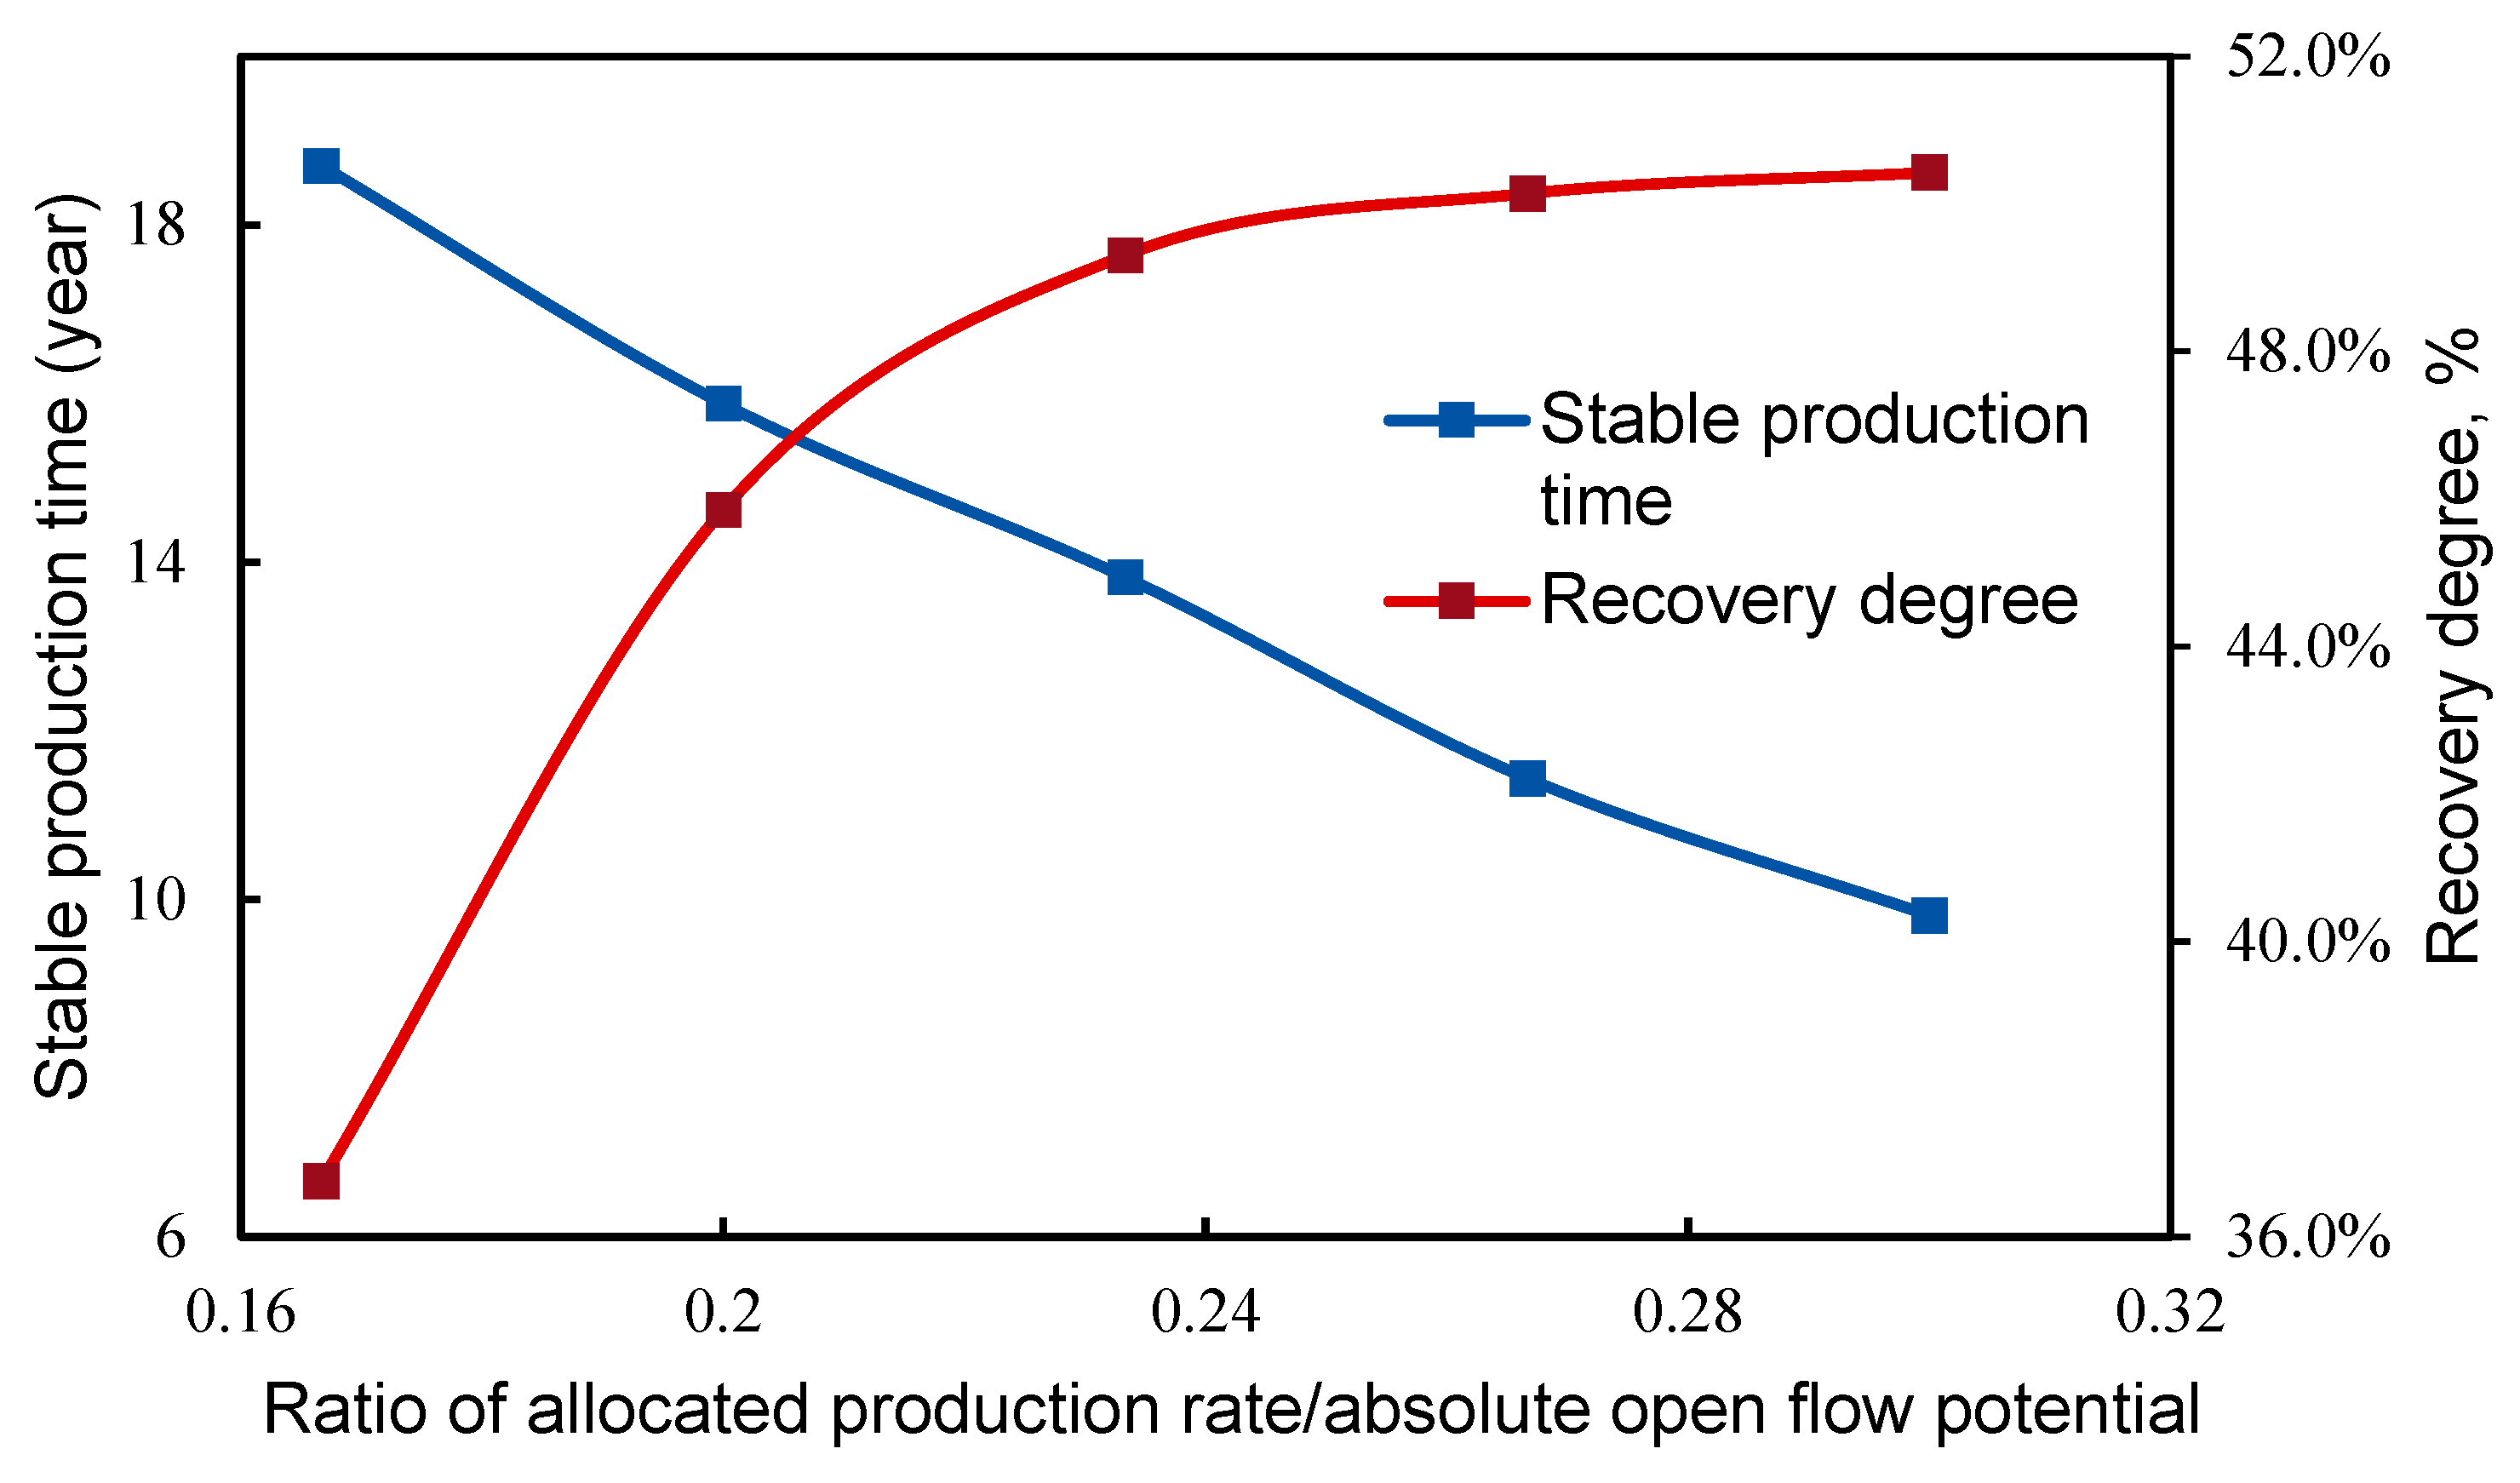
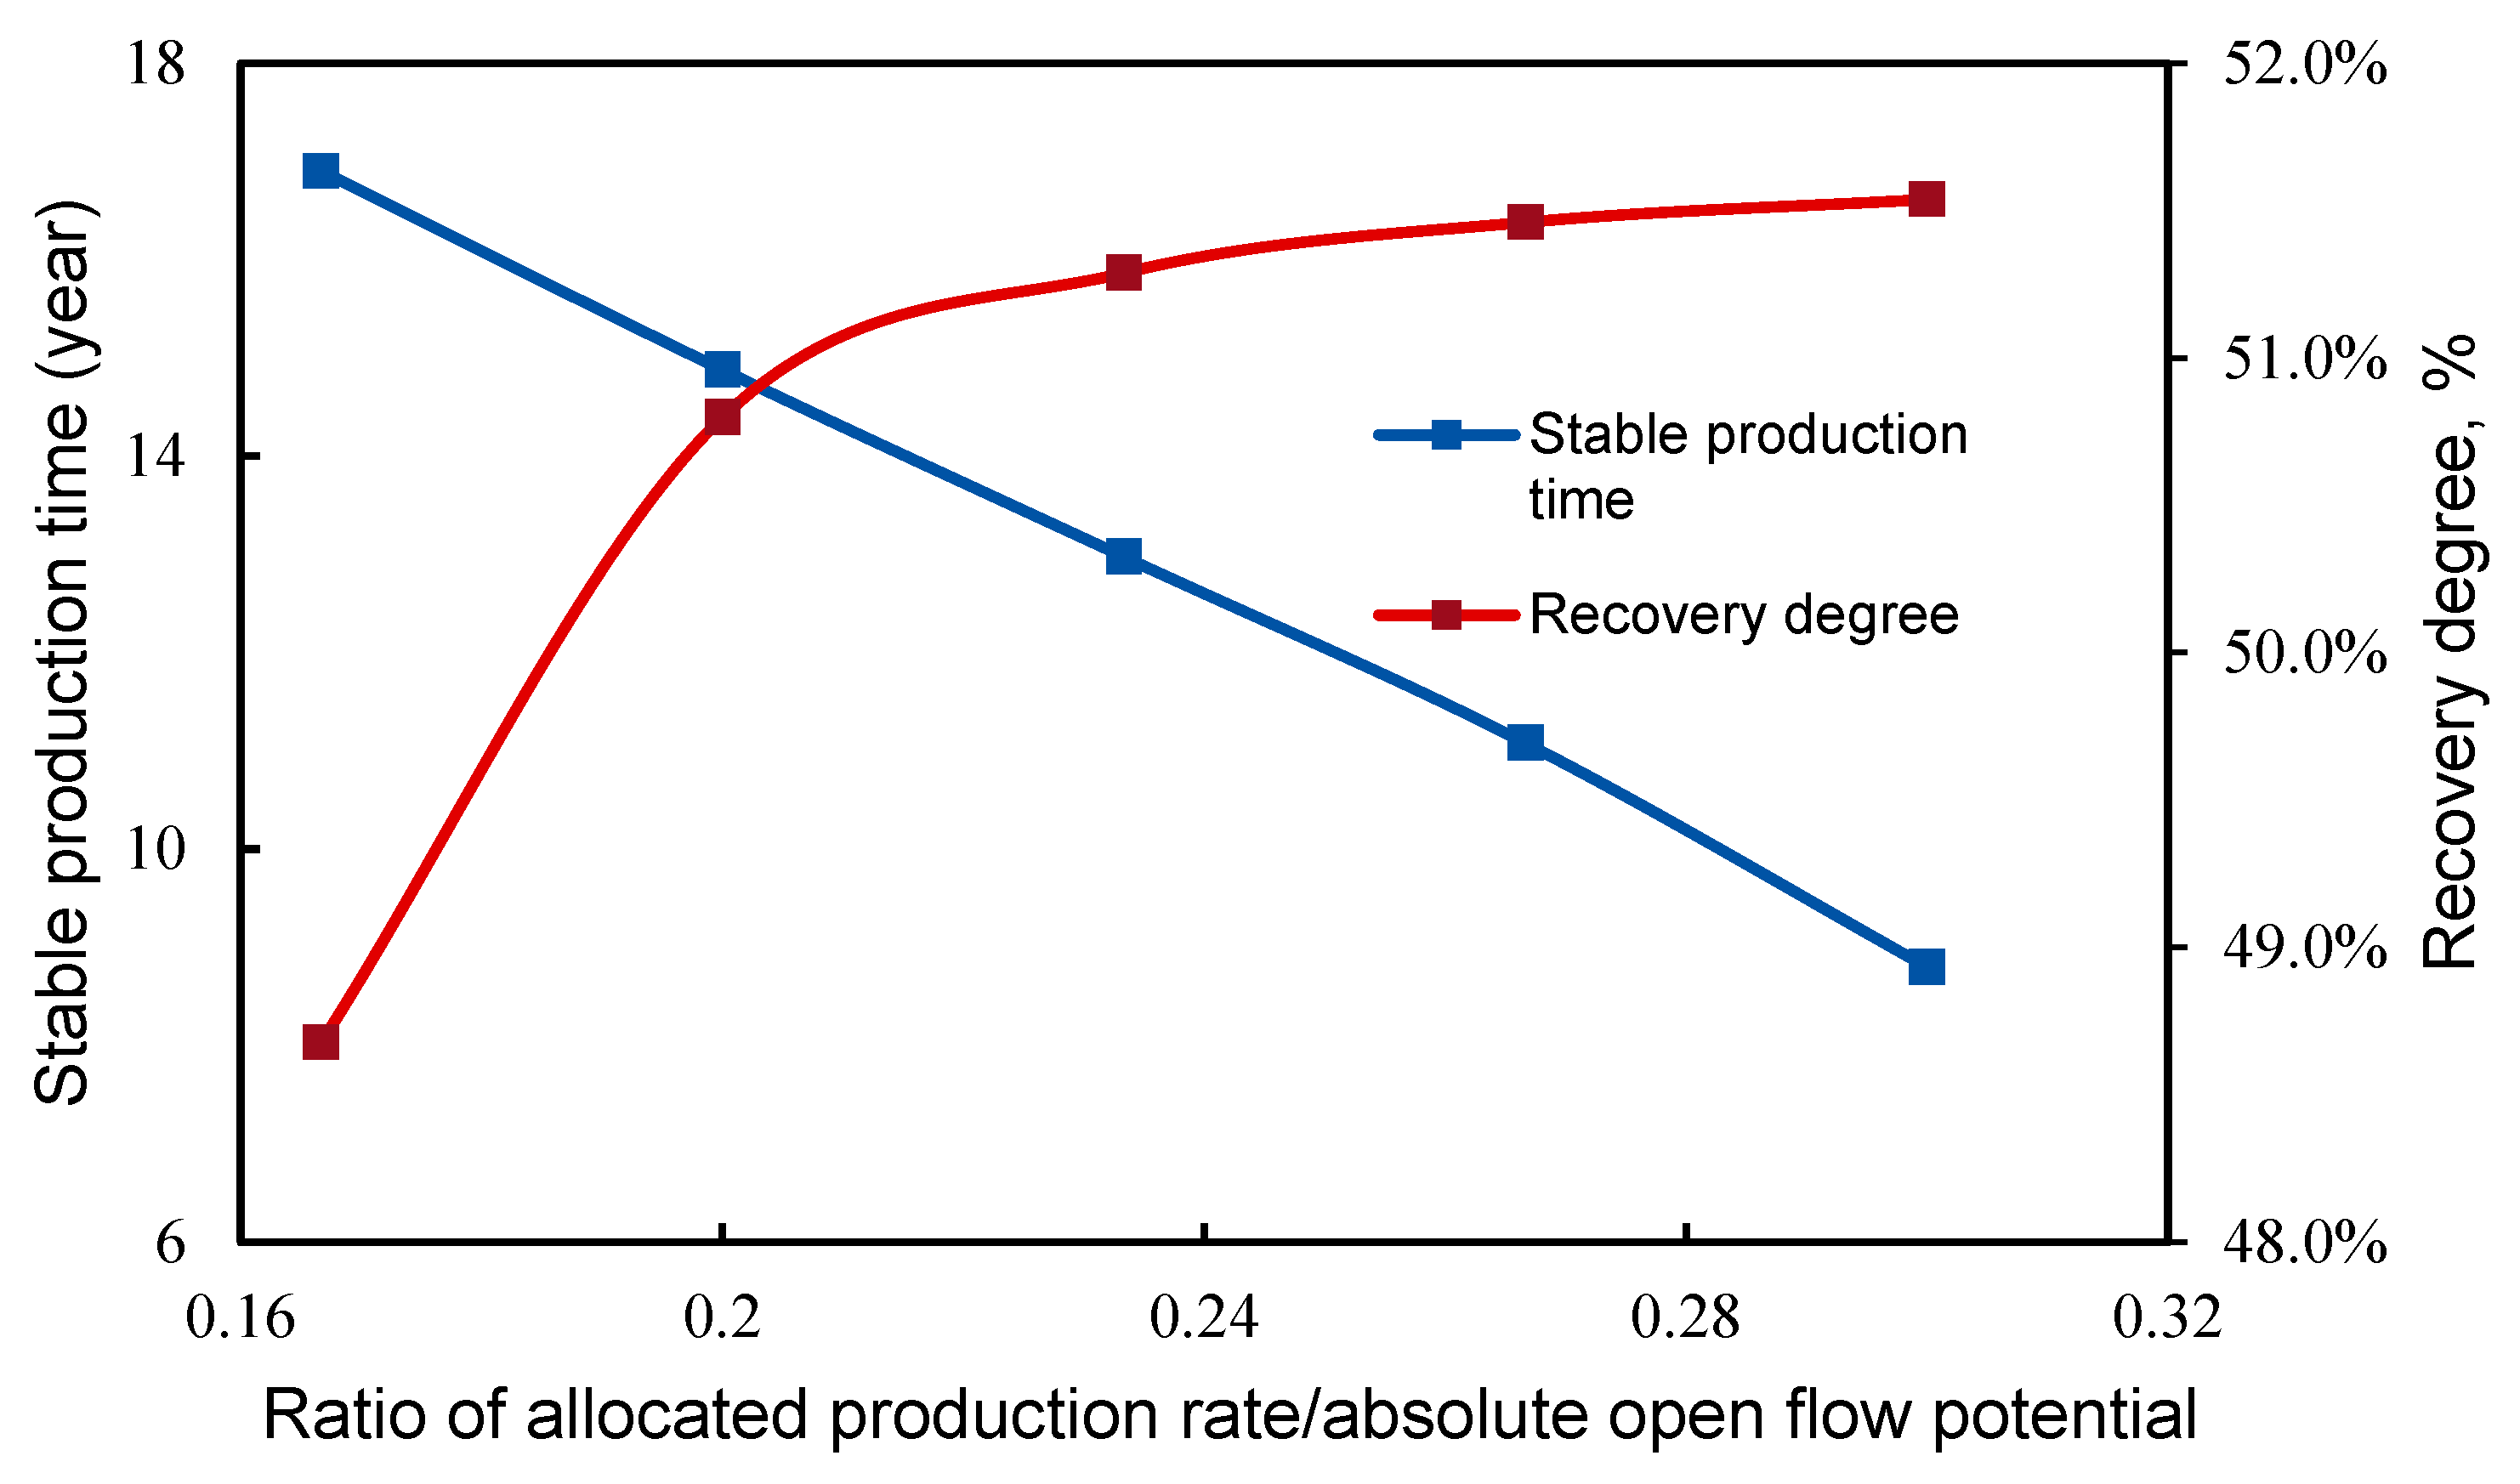
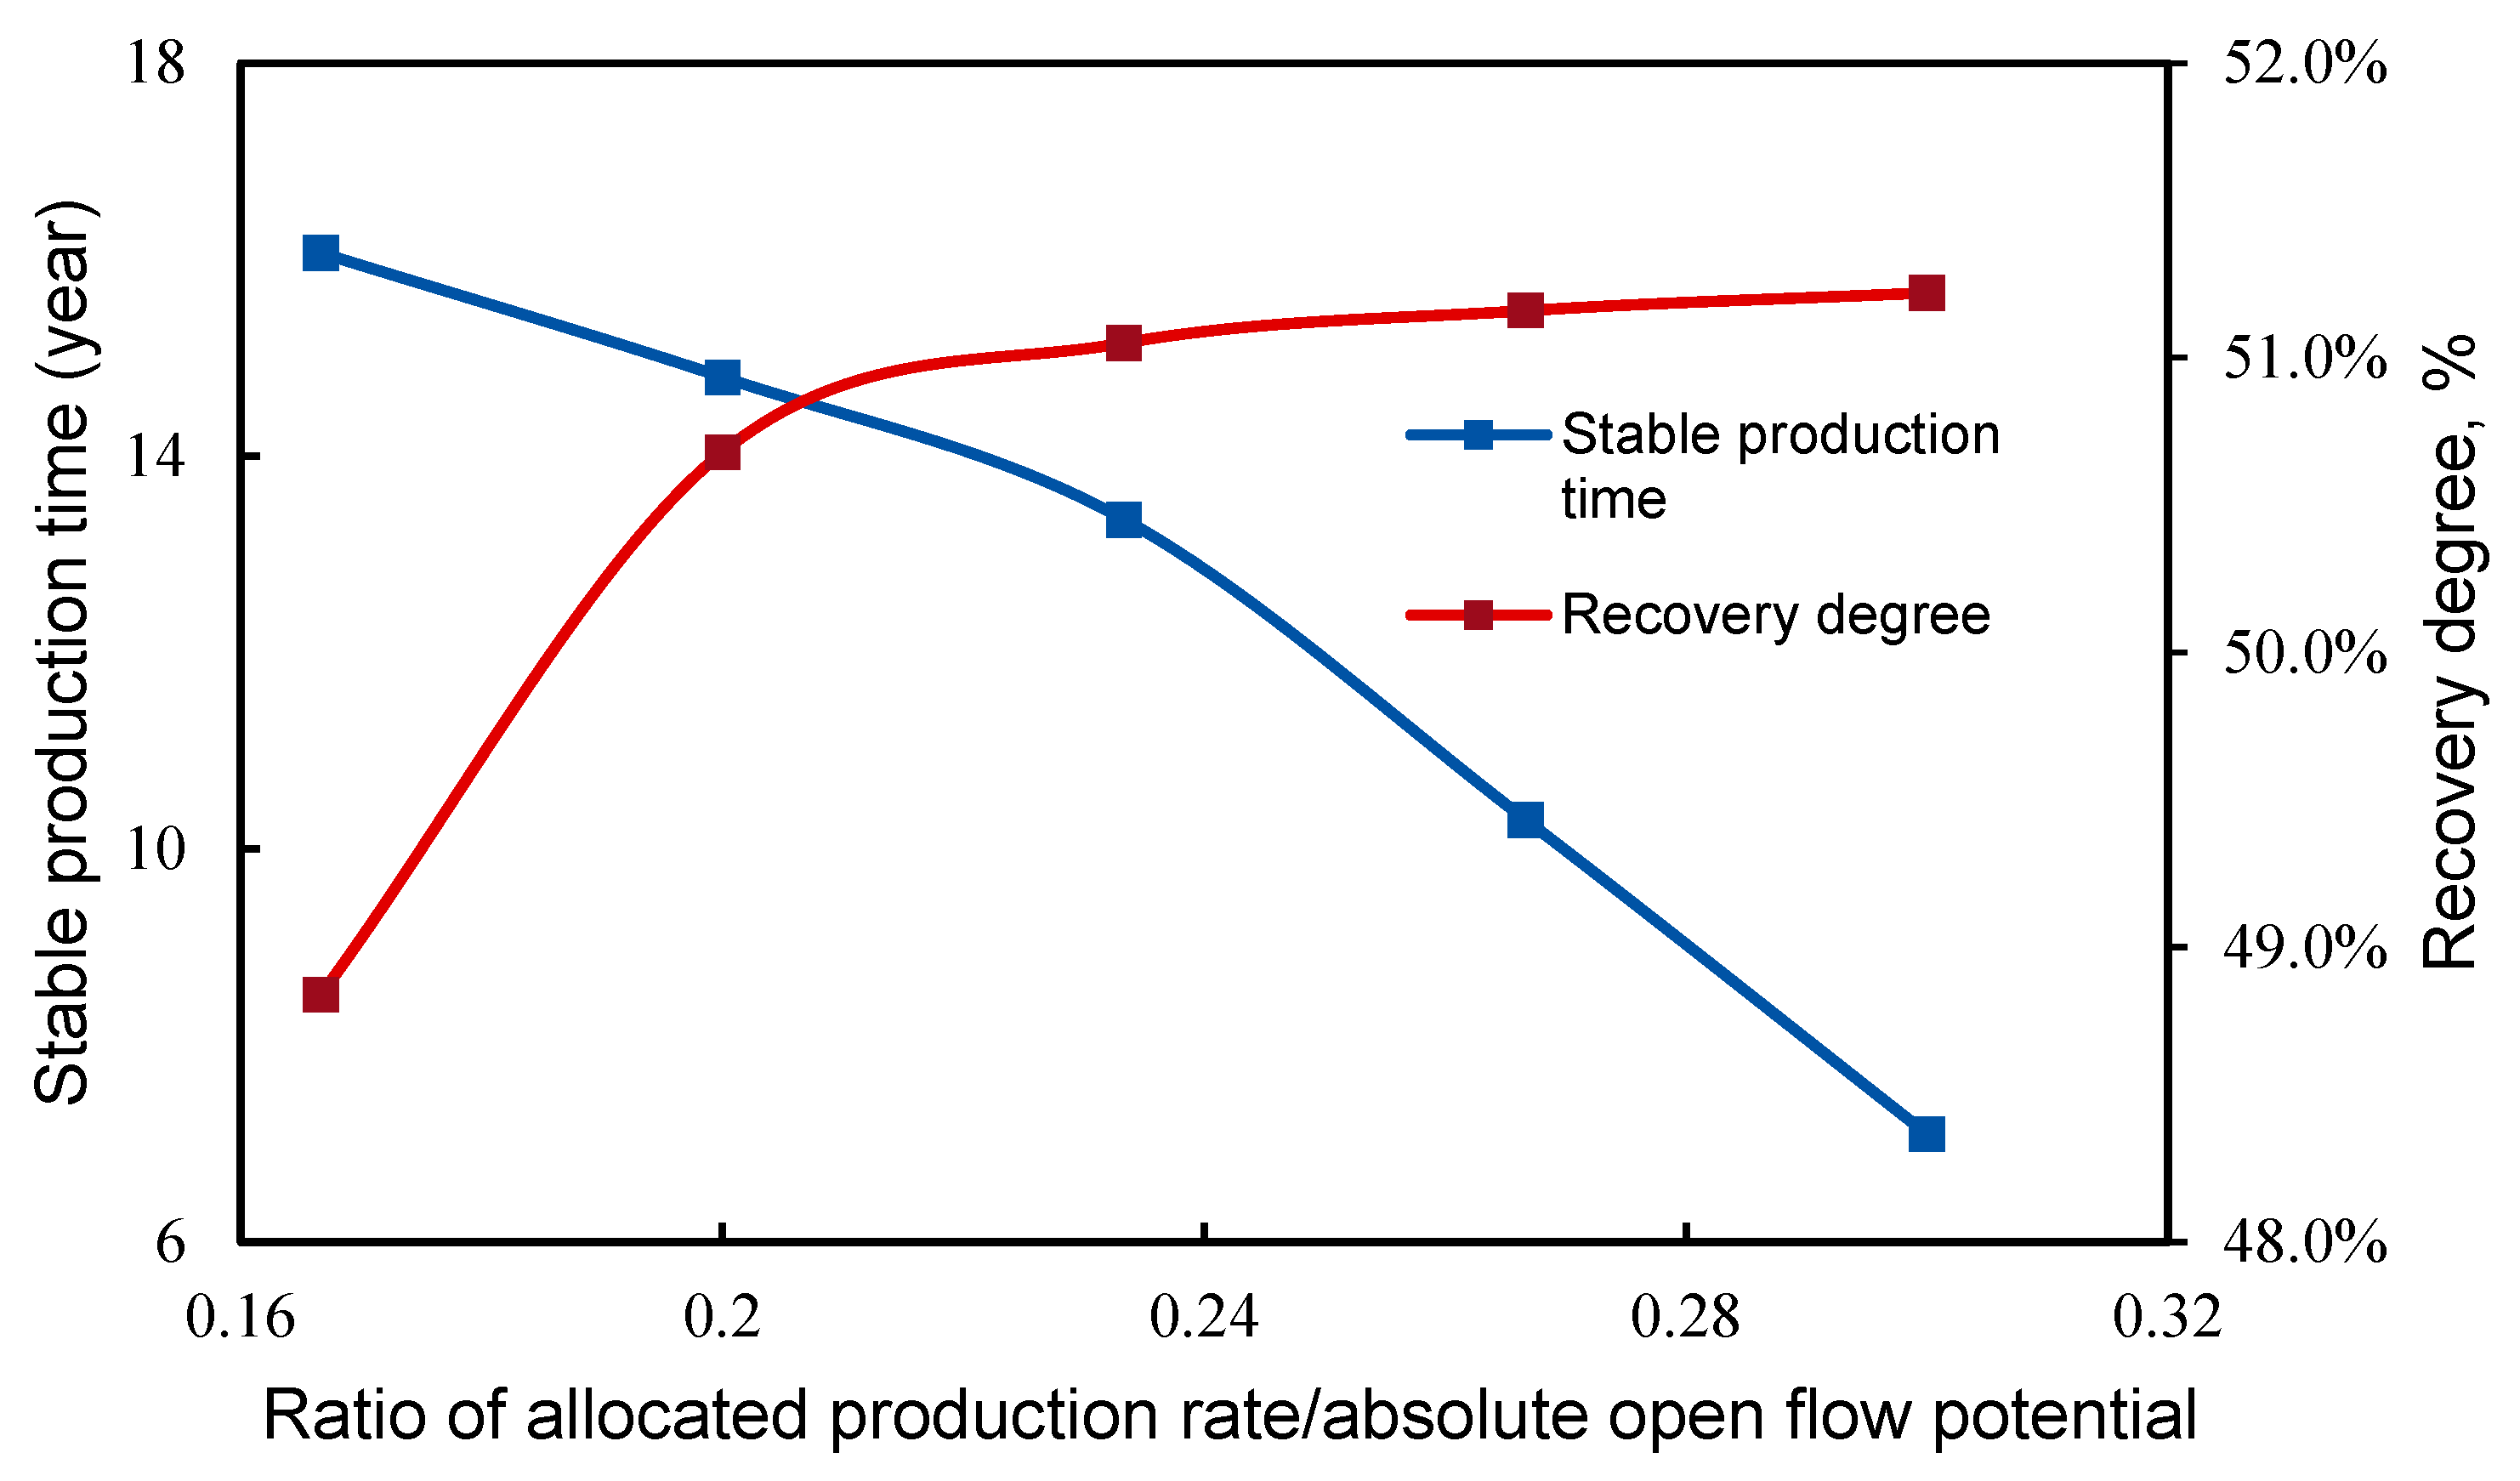
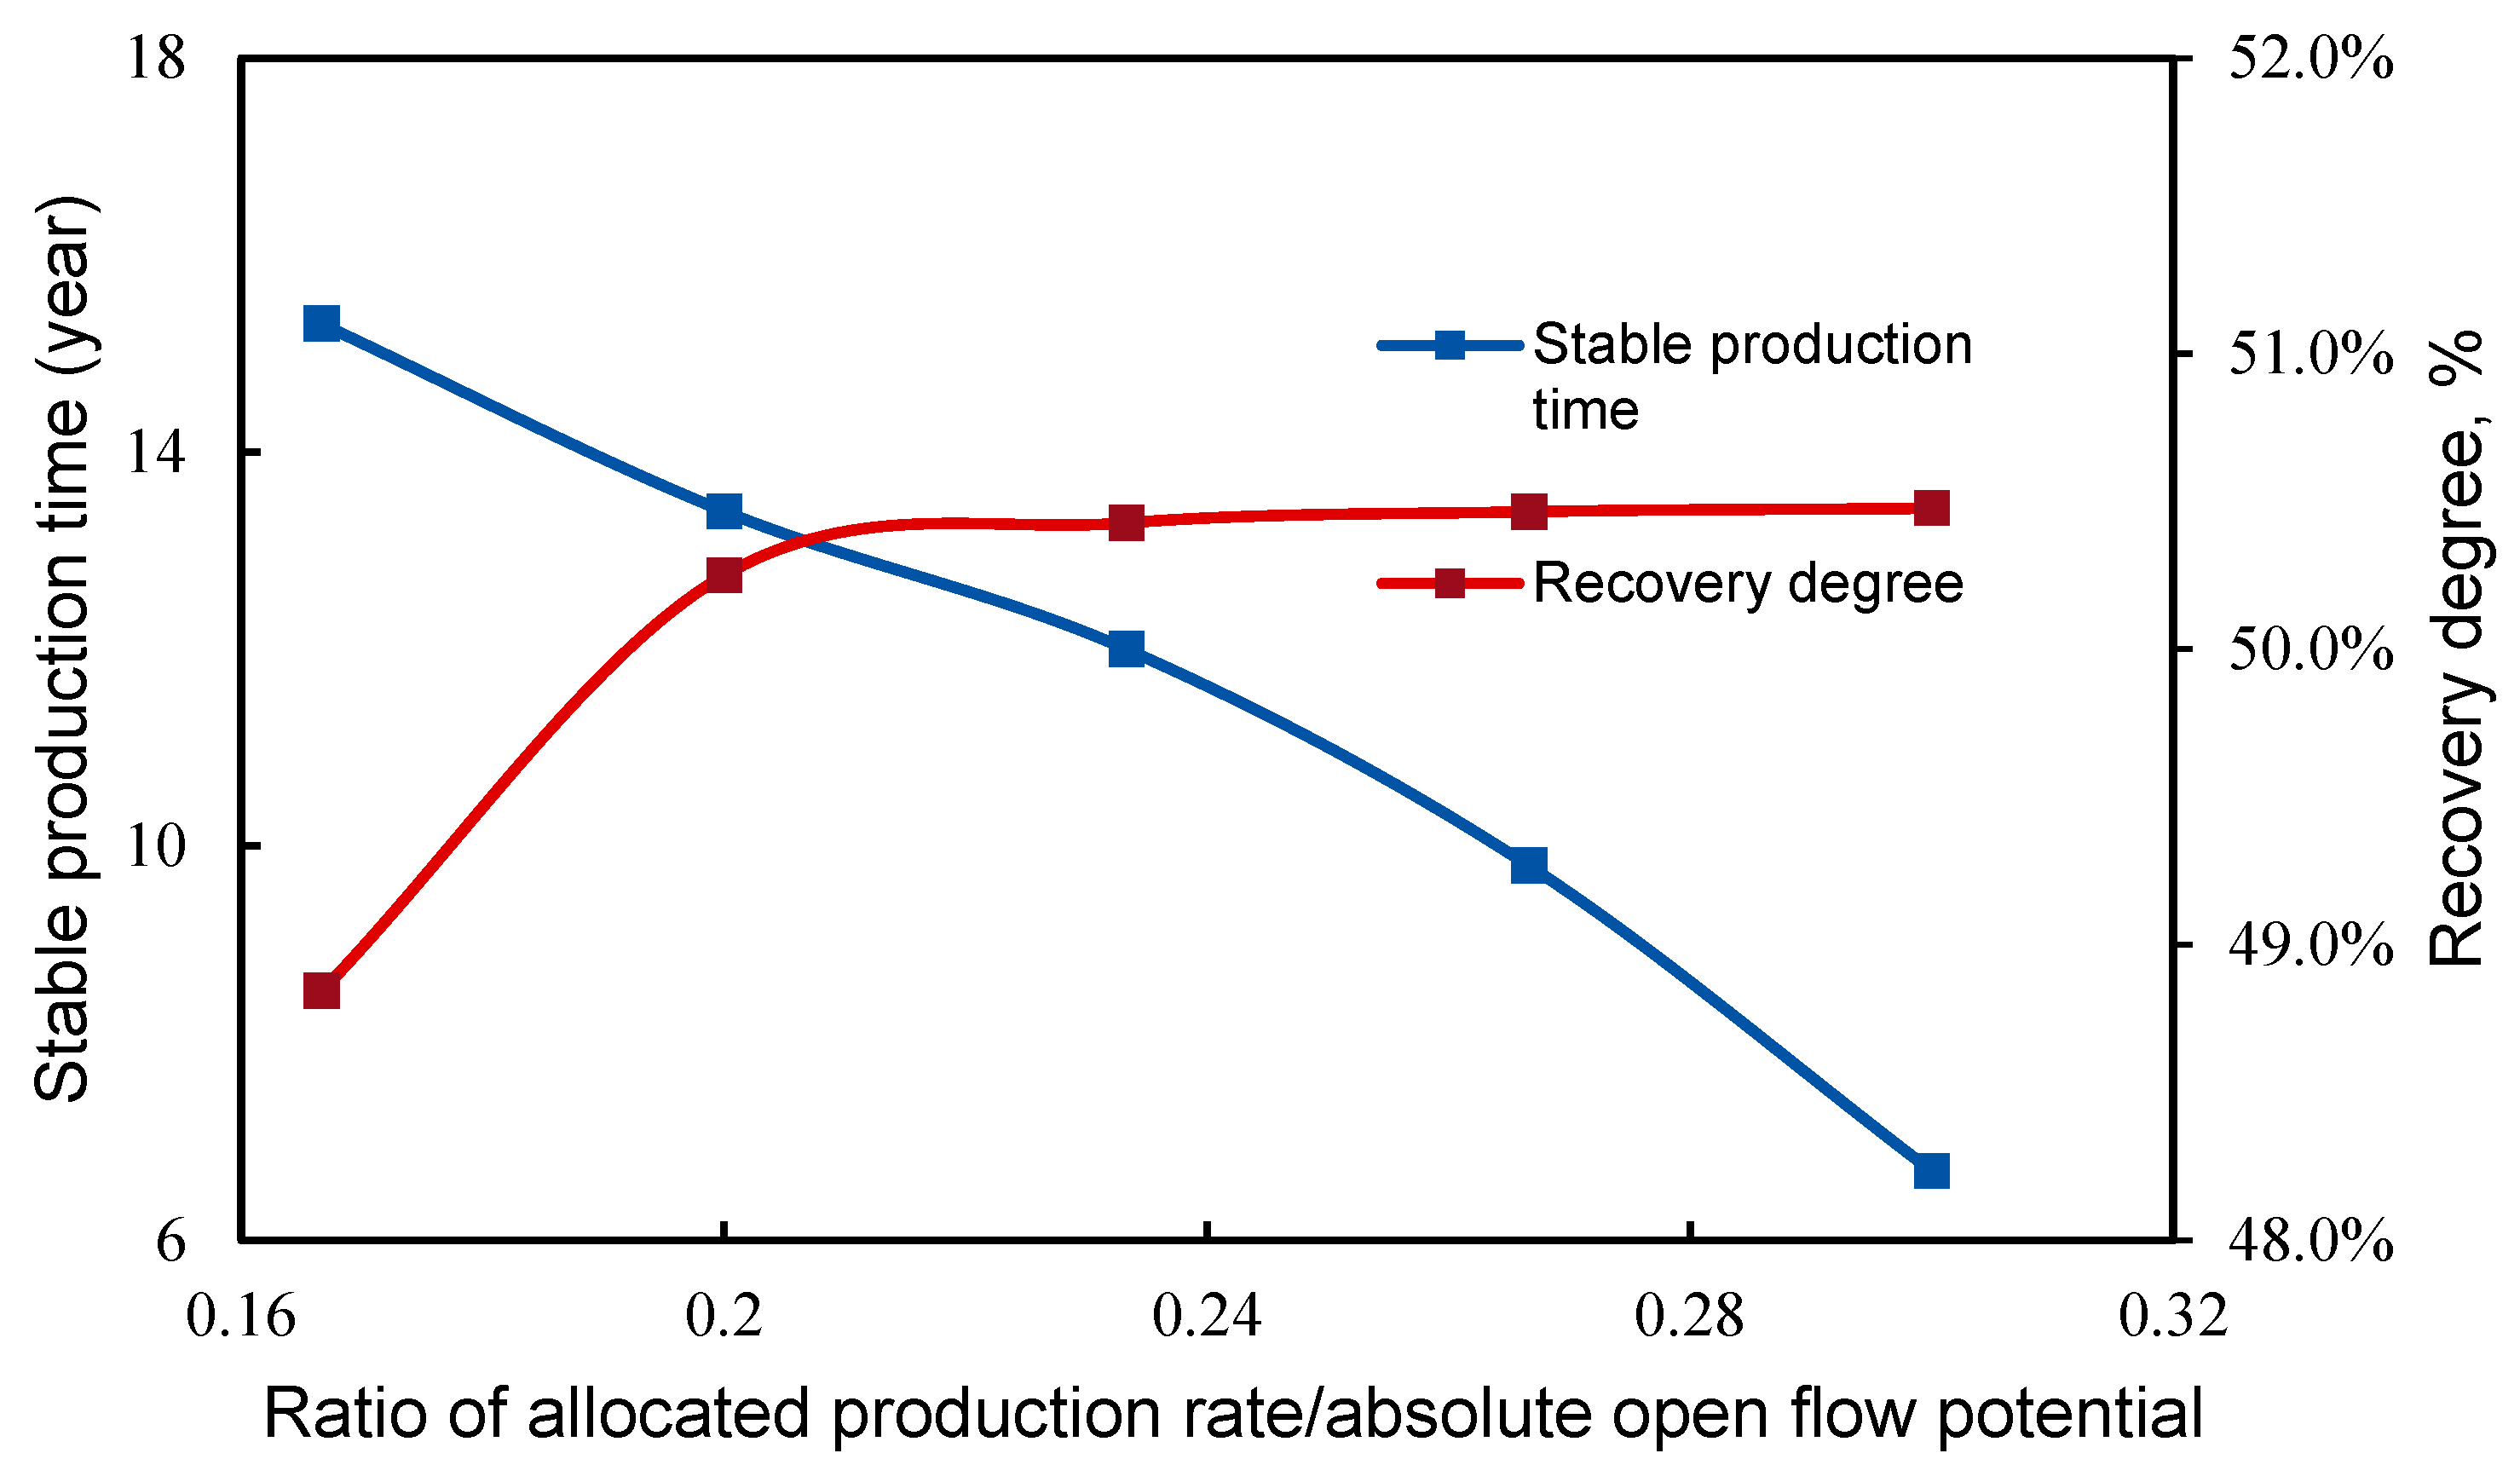
Fractured-vuggy gas reservoirs were numerically simulated using a dual-medium model, and the reasonable range of production rate for such reservoirs was determined by statistically analyzing the relevant production indices involving different aquifer volumes under varying production conditions. The simulation results in Figure 15, Figure 16 and Figure 17 show that the aquifer volume and production rate have significant impacts on the stable production time and recovery degree of fractured-vuggy gas reservoirs.
Given that fractured-vuggy gas reservoirs generally have good petrophysical properties, their recovery degree is relatively high and can reach up to 51%. However, as the aquifer volume increases, the recovery degree shows a significant downward trend, decreasing by approximately 1–2% when the aquifer volume increases to five times its initial level, and the stable production time gradually shortens from 10–17 years to 7–15 years. This indicates that, for fractured-vuggy gas reservoirs, the increase in water energy simultaneously restricts both recovery efficiency and stable production capacity. Therefore, it is necessary to comprehensively optimize the production allocation strategy during the exploitation of such reservoirs.

5. Conclusions

(1)
Based on experimental results from the 32 × 32 × 15 cm large-scale physical model and considering the similarity criteria for microscopic and macroscopic gas–water flow behaviors, the patterns of water invasion in various types of gas reservoirs with bottom water (heterogeneous porous, vuggy, and fractured-porous/vuggy reservoirs) were studied through numerical simulation at multiple scales, and reasonable single-well production allocation schemes and water invasion patterns for fractured-vuggy reservoirs were analyzed, thereby providing the basis for water control in gas reservoirs with bottom water.
(2)
Based on similarity theory, a multiscale analysis method spanning from large-scale physical simulation of gas reservoirs involving water invasion to single-well (small-scale) numerical simulation was established. The physical experimental parameters and numerical model parameters were calculated based on the principles of similarity criteria matching. The key numerical model parameters were corrected using large-scale physical simulation data, significantly improving the reliability of numerical models in describing water sealing mechanisms and water invasion dynamics.
(3)
Results from the simulation study of carbonate gas reservoirs with edge–bottom water show that the response of water energy to the allocated production rate varies significantly in different types of gas reservoirs. Porous reservoirs have poor petrophysical properties, and their recovery degree (≤34%) and stable production time are highly sensitive to the aquifer volume and production rate. Production allocation is the key factor controlling the stable production time. There is an optimal aquifer volume for porous reservoirs. Appropriate volumes of water are conducive to improving the recovery degree (up to 42%) and extending the stable production time, but excessive volumes of water can cause water channeling, resulting in poor production performance. The production indices of fractured-porous reservoirs are least affected by aquifer volume and production rate, and their stable production time and recovery degree are relatively stable. Among the various types of gas reservoirs studied in this paper, fractured-vuggy reservoirs have the best petrophysical properties and the highest recovery degree (51%), but they are most sensitive to water invasion. For such reservoirs, as the aquifer volume increases, the stable production time shortens significantly from 10–17 years to 7–15 years, and the recovery degree also declines. Therefore, the production allocation strategy must be tailored to the specific type of reservoir considered. For porous reservoirs, low production rates should be implemented to ensure stable production. For vuggy reservoirs, the production rate needs to be finely controlled, and water control measures should be optimized to properly utilize water energy while suppressing water channeling. For fractured-porous reservoirs, the production allocation scheme can be more flexible. For high-yield fractured-vuggy reservoirs, a rigid water control scheme must be developed and implemented, and the production rate must be carefully optimized to suppress water invasion.

Author Contributions

Conceptualization, L.C.; Methodology, L.C., H.S. and Y.L.; Investigation, L.Z., P.C., H.S. and Q.G.; Resources, Y.X., Z.W. and Q.G.; Data curation, P.C., S.W., Y.L., Y.X. and Z.W.; Writing—original draft, L.C.; Writing—review & editing, L.C.; Visualization, L.Z. and Q.G.; Project administration, L.C. and S.W. All authors have read and agreed to the published version of the manuscript.

Funding

This research was funded by the National Major Project of China under the 15th Five-Year Plan for National Economic and Social Development (Project Name: Efficient Development Technology for Fractured Porous Carbonate Gas Reservoirs).

Data Availability Statement

The original contributions presented in this study are included in the article. Further inquiries can be directed to the corresponding author.

Conflicts of Interest

Authors Luming Cha, Lin Zhang, Pengyu Chen, Haidong Shi, Siqi Wang, Yi Luo, Yuzhong Xing and Zijie Wang were employed by the Research Institute of Petroleum Exploration and Development of CNPC. Author Qimin Guo was employed by the Research Institute of Petroleum Exploration and Development, PetroChina Southwest Oil and Gas Field Company. The authors declare that the research was conducted in the absence of any commercial or financial relationships that could be construed as a potential conflict of interest.

References

  1. Ma, X. Natural gas and energy revolution: A case study of Sichuan-Chongqing gas province. Nat. Gas Ind. 2017, 37, 91–99. [Google Scholar] [CrossRef] [Scilit]
  2. Hu, Y.; Peng, X.; Li, Q.; Li, L.; Hu, D. Progress and development direction of technologies for deep marine carbonate gas reservoirs in the Sichuan Basin. Nat. Gas Ind. 2019, 39, 48–57. [Google Scholar] [CrossRef] [Scilit]
  3. Ma, Y.; Cai, X.; Li, M.; Li, H.; Zhu, D.; Qiu, N.; Pang, X.; Zeng, D.; Kang, Z.; Ma, A.; et al. Research advances on the mechanisms of reservoir formation and hydrocarbon accumulation and the oil and gas development methods of deep and ultra-deep marine carbonates. Pet. Explor. Dev. 2024, 51, 692–707. [Google Scholar] [CrossRef] [Scilit]
  4. Ma, X.; Yang, Y.; Wen, L.; Luo, B. Distribution and exploration direction of medium- and large-sized marine carbonate gas fields in Sichuan Basin, SW China. Pet. Explor. Dev. 2019, 46, 1–15. [Google Scholar] [CrossRef] [Scilit]
  5. Sun, Z. Production characteristics and the optimization of development schemes of fractured gas reservoir with edge or bottom water. Pet. Explor. Dev. 2002, 29, 69–71. [Google Scholar]
  6. Yony, R.; Zhang, L.; Li, T.; Peng, X.; Zhang, C.; Yang, Y. Key technologies for efficient water management in the middle and late development stages of the Cambrian Longwangmiao Formation gas reservoir in the Anyue Gas Field of the Sichuan Basin. Nat. Gas Ind. 2025, 45, 1–11. [Google Scholar]
  7. Dranchuk, P.; Purvis, R.; Robinson, D. Computer calculation of natural gas compressibility factors using the Standing and Katz correlation. In Proceedings of the Annual Technical Meeting, Edmonton, AB, Canada, 7–11 May 1973. [Google Scholar]
  8. Li, X.; Guo, Z.; Wan, Y.; Liu, X.; Zhang, M.; Xie, W.; Su, Y.; Hu, Y.; Feng, J.; Yang, B.; et al. Geological characteristics and development strategies for Cambrian Longwangmiao Formation gas reservoir in Anyue gas field, Sichuan Basin, SW China. Pet. Explor. Dev. 2017, 44, 398–406. [Google Scholar] [CrossRef] [Scilit]
  9. Yang, Y.B.; Xiao, W.L.; Zheng, L.L.; Lei, Q.H.; Qin, C.Z.; He, Y.A.; Liu, S.S.; Li, M.; Li, Y.M.; Zhao, J.Z.; et al. Pore throat structure heterogeneity and its effect on gas-phase seepage capacity in tight sandstone reservoirs: A case study from the Triassic Yanchang Formation, Ordos Basin. Pet. Sci. 2023, 20, 2892–2907. [Google Scholar] [CrossRef] [Scilit]
  10. Cheng, J.; Zhang, S.; Wang, L.; Chen, G. Numerical Simulation of Gas Production and Geomechanical Response of Heterogeneous Gas Hydrate Reservoirs. Nat. Resour. Res. 2026, 35, 459–476. [Google Scholar] [CrossRef] [Scilit]
  11. Wang, W.; Li, Y.; Chen, Z. Post-fracturing numerical simulation of shale gas reservoir based on complex flow mechanisms. Reserv. Eval. Dev. 2020, 10, 22–29. [Google Scholar]
  12. Winders, T.M.; Neville, B.W.; Swanson, K.C. Effects of hempseed cake on ruminal fermentation parameters, nutrient digestibility, nutrient flow, and nitrogen balance in finishing steers. J. Anim. Sci. 2023, 101, skac291. [Google Scholar] [CrossRef] [Scilit]
  13. Wang, N.; Liu, Y.; Cha, L.; Balhoff, M.T.; Prodanovic, M. Experimental investigation of trapped oil mobilization with ferrofluid. SPE J. 2022, 27, 753–770. [Google Scholar] [CrossRef] [Scilit]
  14. Liu, Z.; Song, X.; Fu, X.; Luo, X.; Wang, H. Energy Production Potential of Ultra-Deep Reservoirs in Keshen Gas Field, Tarim Basin: From the Perspective of Prediction of Effective Reservoir Rocks. Energies 2025, 18, 2913. [Google Scholar] [CrossRef] [Scilit]
  15. Perepelkin, A.; Sharifov, A.; Titov, D.; Shandrygolov, Z.; Derkach, D.; Islamov, S. Approaches to Proxy Modeling of Gas Reservoirs. Energies 2025, 18, 3881. [Google Scholar] [CrossRef] [Scilit]
  16. Xin, C.; Zhou, W.; Du, Y.; Zhang, L.; Wang, K.; Bai, H.; Huang, X. Physical simulation on multi-layer commingled production in Yan’an Gas Field, Ordos Basin. Sci. Technol. Eng. 2026, 26, 2370–2377. [Google Scholar]
  17. Ding, Z.; Jiao, S.; Li, N.; Zhang, X.; Wang, L. Study on similarity theory of developing fractured heavy oil reservoirs in buried hill by injecting hot water. Spec. Oil Gas Reserv. 2017, 24, 140–144. [Google Scholar]
  18. Cha, L.; Xie, C.; Feng, Q.; Balhoff, M. Geometric criteria for the snap-off of a non-wetting droplet in pore-throat channels with rectangular cross-sections. Water Resour. Res. 2021, 57, e2020WR029476. [Google Scholar] [CrossRef] [Scilit]
  19. Cha, L.; Feng, Q.; Wang, S.; Xu, S.; Liu, G.; Huang, W. Numerical Simulation of Fracture-flooding with Virtual Element Method in a Continuous Damage Model. Chin. J. Comput. Phys. 2023, 40, 81–90. [Google Scholar]
  20. Zhao, Z.; Zhou, Y.; Ma, X. Study on the similarity of the non-tectonic cracks in mud-shale to underwater shrinkage cracks in present muddy sediments. J. Xian Shiyou Univ. 2008, 23, 6–11. [Google Scholar]
  21. Mi, G.; Li, P.; He, L. Structure and property of metal melt I:The number of residual bonds after solid-liquid phase changes. Sci. China 2010, 53, 1571–1577. [Google Scholar]
  22. Wang, H.; Zhao, W.; Xia, X.; He, W.; Pang, A. Lattice Boltzmann study on oil-water flow in shale heterogeneous porous media. Pet. Sci. Bull. 2025, 10, 736–746. [Google Scholar]
  23. Zhan, S.; Su, Y.; Jin, Z.; Zhang, M.; Wang, W.; Hao, Y.; Li, L. Study of liquid–liquid two-phase flow in hydrophilic nanochannels by molecular simulations and theoretical modeling. Chem. Eng. J. 2020, 395, 125053. [Google Scholar] [CrossRef] [Scilit]
  24. Yuan, L.; Zhang, T.; Lv, X.; Zhang, C.; Wang, Y.; Wang, X.; Huang, X.; Wang, Y. Establishment and analysis of thermo-hydro-mechanical coupling similarity criteria for compressed air energy storage process in abandoned coal mines. J. China Univ. Min. Technol. 2025, 54, 743–753. [Google Scholar]
  25. Hu, Y.; Zhao, Y.; Yang, D. Simulation theory & method of 3D solid-liquid coupling. J. Liaoning Tech. Univ. 2007, 26, 204–206. [Google Scholar]
  26. Geertsma, J.; Core, G.A.; Schwarz, N. Theory of dimensionally scaled model of petroleum reservoir. Trans. AIME 1956, 207, 118–127. [Google Scholar] [CrossRef] [Scilit]
  27. Ge, F.; Zhang, B.; Sang, Y.; Xiao, Y.; Li, M.; Cao, T.; Fang, H.; Tang, S.; Zhu, D.; Su, Q. Key exploration technologies and efficient practice for continental tight channel sandstone gas reservoirs in the Sichuan Basin. Nat. Gas Ind. 2025, 45, 139–149. [Google Scholar]
  28. Yang, H.; Zhang, L.; Liu, X.; Liu, Y.; Wu, J.; Yang, J.; Wen, M.; Dai, Z.; Li, F.; Yang, S.; et al. New development model and key technological innovation for large-scale and cost-effective development of natural gas in the Sichuan Basin. Nat. Gas Ind. 2025, 45, 150–166. [Google Scholar]
  29. Tan, X.; Han, X.; Ren, L. A new numerical simulation model of water invasion unit in complex gas reservoirs based on intelligent optimization algorithm. Nat. Gas Ind. 2023, 43, 127–136. [Google Scholar]
  30. Xia, Y.; Deng, Y.; Wei, S.; Jin, Y. Numerical simulation of multi-scale coupled flow in after-fracturing shale gas reservoirs. Chin. J. Theor. Appl. Mech. 2023, 55, 616–629. [Google Scholar]
Figure 1. Large-scale physical simulation experiment flowchart.
Energies 19 01841 g001
Figure 2. Dynamic production curves of the simulated fractured-vuggy gas reservoir without bottom water (recovery degree = 48.46%).
Energies 19 01841 g002
Figure 3. Dynamic production curves for gas production at controlled pressures from the simulated fractured-vuggy gas reservoir without bottom water (recovery degree = 64.78%).
Energies 19 01841 g003
Figure 4. Water front advancement process in the fractured-vuggy reservoir model, they should be listed as: (a) Water invasion into pores; (b) Water invasion into the matrix; (c) Water invasion into fractures; (d) Gas well water invasion.
Energies 19 01841 g004
Figure 5. Single-well-scale numerical model.
Energies 19 01841 g005
Figure 6. Rational production allocation for the porous reservoir model (M = 1).
Energies 19 01841 g006
Figure 7. Rational production allocation for the porous reservoir model (M = 3).
Energies 19 01841 g007
Figure 8. Rational production allocation for the porous reservoir model (M = 5).
Energies 19 01841 g008
Figure 9. Rational production allocation for the vuggy reservoir model (M = 1).
Energies 19 01841 g009
Figure 10. Rational production allocation for the vuggy reservoir model (M = 3).
Energies 19 01841 g010
Figure 11. Rational production allocation for the vuggy reservoir model (M = 5).
Energies 19 01841 g011
Figure 12. Rational production allocation for the fractured-porous reservoir model (M = 1).
Energies 19 01841 g012
Figure 13. Rational production allocation for the fractured-porous reservoir model (M = 3).
Energies 19 01841 g013
Figure 14. Rational production allocation for the fractured-porous reservoir model (M = 5).
Energies 19 01841 g014
Figure 15. Rational production allocation for the fractured-porous reservoir model (M = 1).
Energies 19 01841 g015
Figure 16. Rational production allocation for the fractured-porous reservoir model (M = 3).
Energies 19 01841 g016
Figure 17. Rational production allocation for the fractured-porous reservoir model (M = 5).
Energies 19 01841 g017
Table 1. Fracture-pore model parameters.
TypeStructural DiagramTechnical Parameters
Fracture-pore typeEnergies 19 01841 i001Gas-bearing layer thickness: 13 cm; horizontal well length: 11 cm; water avoidance height: 6 cm, 4 cm; gas-bearing layer permeability: 0.1 mD; pore size: 2–5 mm; plane porosity: 5%; fracture size: 7 cm × 3 cm × 0.1 cm; number of fractures: 3 × 3; bottom water layer thickness: 2 cm; permeability: 1000 mD.
Table 2. Basic model parameters.
ParameterValueUnit
Grid number42 × 42 × 5/
Grid size50 × 50 × 4m
Top depth5400m
Porosity2.5–3.5%
Permeability0.02–0.1mD
Table 3. Gas phase PVT data.
Pressure (MPa)Volume CoefficientViscosity (cp)
22.30.00910.0181
27.40.00740.0198
32.50.00630.0218
37.60.00540.0238
41.60.00490.0256
49.80.00410.0295
54.80.00370.0321
58.90.00350.0343
62.90.00320.0366
670.0030.039
680.0030.0396
71.10.00290.0415
74.10.00280.0434
78.10.00270.0441
Table 4. Gas–Water Relative Permeability and Capillary Pressure Data.
Water Saturation SwGas Relative Permeability krgWater Relative Permeability krwCapillary Pressure Pc
0.2 0.8 0 5
0.25 0.7 0.01 3.2
0.3 0.6 0.02 2
0.35 0.5 0.03 1.2
0.4 0.41 0.05 0.7
0.45 0.32 0.08 0.4
0.5 0.24 0.12 0.2
0.55 0.17 0.18 0.1
0.6 0.11 0.26 0.05
0.65 0.06 0.36 0.02
0.7 0.03 0.48 0.01
0.75 0 0.62 0
Disclaimer/Publisher’s Note: The statements, opinions and data contained in all publications are solely those of the individual author(s) and contributor(s) and not of MDPI and/or the editor(s). MDPI and/or the editor(s) disclaim responsibility for any injury to people or property resulting from any ideas, methods, instructions or products referred to in the content.