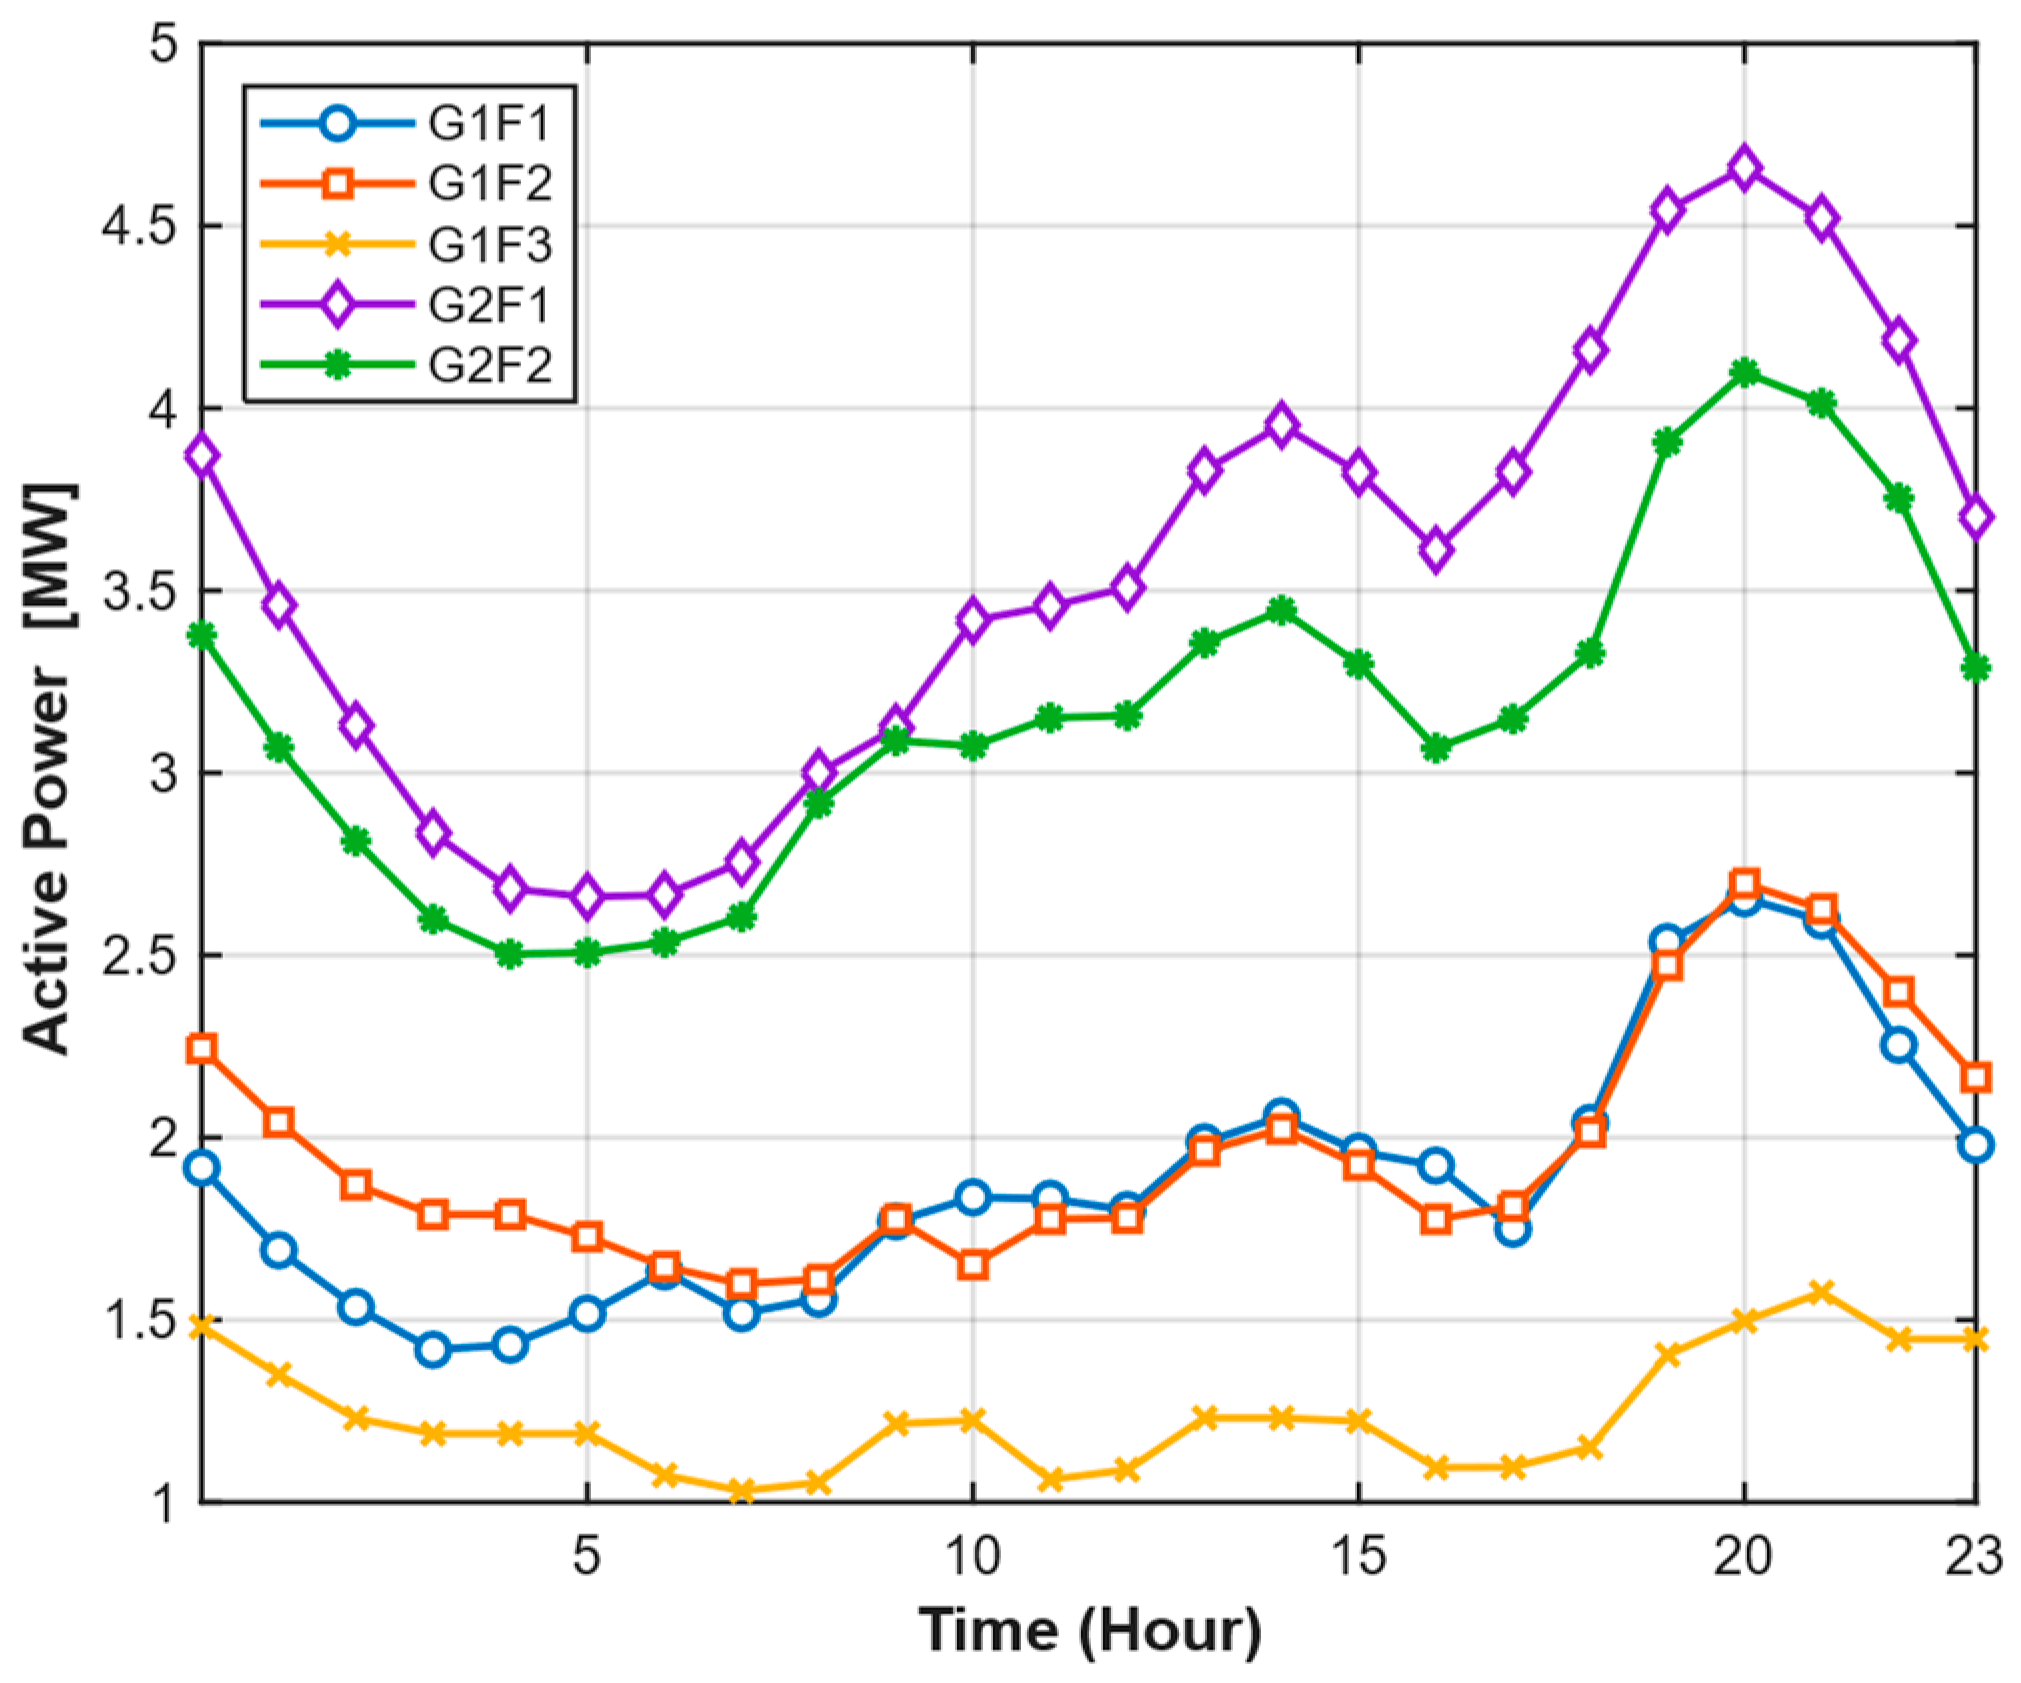
1. Introduction
Distribution networks are changing rapidly as more loads and distributed energy resources (DERs), which are highly dynamic, are integrated into the system. This dynamic nature of these loads and generation makes it difficult for distribution system operators (DSOs) to maintain network security while keeping operational costs down. Fast charging stations for electric vehicles (EVs) are a major load that operates for a relatively short time and can significantly adversely affect the distribution system. It typically increases power demand during evening hours, when many EVs are charged [
1]. Solar PV systems stress the distribution network by injecting power into it when the sun shines, with a peak around midday [
2,
3]. There is, therefore, a significant mismatch between the energy demanded by the loads and what is produced. Both generation and load are dynamic in nature (turn on and off throughout the day at different times), and both can cause issues: “congestion issues” such as voltage violations, reverse power flow, or thermal overload, which can occur during any time period [
4,
5].
Traditionally, long-term mitigation strategies for congestion rely on network reinforcement: constructing new feeders, upgrading conductors, and upgrading transformers. Although technically effective, these methods require higher capital investment, longer construction time, and land use approvals [
6]. Short-term congestion management measures have several significant drawbacks, including demand-side management and generation curtailment. These measures impose economic penalties that also limit the use of DERs and reduce the investor’s return. Frequent curtailment conflicts with decarbonization objectives. Demand response programs are inconvenient for customers. These programs also require complex coordination among stakeholders.
Over the past decade, distribution utilities have deployed remote-controlled load-break switches and SCADA-based automation to accelerate fault isolation and service restoration. Historically, radial operations have been preferred because they simplify protection coordination under unidirectional power flows. However, the radial constraint limits the available line capacity utilization and reduces the distribution network flexibility, whereas meshed configurations can provide this flexibility. With the advent of adaptive protection relays supporting real-time communication and multiple setting groups, along with bidirectional fault-detection functions embedded in load-break switches, DSOs can now operate temporary meshed configurations without compromising the protection coordination or system reliability. These technologies enable reconfiguration between radial and mesh topologies, supporting flexible congestion management and enhancing DER hosting capacity without compromising the security and reliability of the network.
Most distribution networks use a radial topology with sectionalizing load-break switches supplemented by strategically placed tie connections (normally open load-break switches) that enable interconnections between feeder sections. This infrastructure provides significant operational flexibility and the capability to dynamically reconfigure the network topology to optimally match varying load and generation patterns throughout the day. This approach, called distribution network reconfiguration (DNR), leverages existing load-break switch investments and supply-side infrastructure. This method enhances the system efficiency and does not require additional hardware deployment [
7]. DNR maximizes distribution network utilization and can decrease both load and generation curtailment. It also represents a cost-effective alternative to traditional congestion management strategies [
8].
DNR involves altering the topological structure of distribution feeders by changing the open/closed status of remotely controlled sectionalizing and tie load break switches to achieve multiple objectives, including minimizing power losses, improving voltage profiles, balancing feeder loads, and alleviating congestion [
9]. However, the DNR problem is inherently a large-scale, nonlinear, nondifferentiable, and combinatorial optimization challenge, in which finding optimal configurations across exponentially large search spaces poses a significant computational burden. Load and generation patterns are time-varying, necessitating frequent network reconfiguration. Consequently, there is a critical need for computationally efficient optimization algorithms capable of determining near-optimal switching schedules within a practical timeframe while maintaining solution quality and operational feasibility.
1.1. Literature Review
Distribution network reconfiguration (DNR) has been widely investigated as an effective operational strategy for improving distribution system efficiency, reducing power losses, and enhancing voltage profiles. By changing the open or closed status of sectionalizing and tie switches, DNR modifies the network topology to adapt to changing load patterns and distributed generation while maintaining radial operating constraints. However, due to the nonlinear power flow equations and the combinatorial nature of switching states, DNR is recognized as a large-scale optimization problem that requires efficient computational methods.
A wide range of optimization techniques have been proposed to address the DNR problem. Particle Swarm Optimization (PSO) has been one of the most widely adopted methods due to its simplicity and strong global search capability. The improved Binary PSO algorithm proposed in [
10] demonstrated effective performance in handling discrete switching states while preserving radial network topology constraints. To enhance convergence performance, hybrid optimization strategies have also been explored. For example, a PSO–Tabu hybrid algorithm was introduced in [
11], where Tabu Search improves local exploration while PSO maintains global search capability. Multi-objective optimization formulations have also been investigated. In [
12], a multi-objective PSO framework was developed to simultaneously minimize network losses and generation costs in medium-voltage distribution systems. Furthermore, wavelet-oriented evolutionary algorithms have been applied to solve multi-objective optimal power flow problems incorporating flexible AC transmission systems [
13].
Genetic Algorithm (GA)-based optimization methods have also been widely applied to the DNR problem. A hybrid GA framework combined with machine learning techniques was proposed in [
14] to improve convergence performance while optimizing power losses, load balancing, and switching costs. In addition to classical evolutionary algorithms, several nature-inspired optimization methods have been introduced. The chaos-disturbed beetle antennae search algorithm proposed in [
15] demonstrated improved performance in minimizing power losses and voltage deviations. This concept was further extended by social beetle swarm optimization in [
16], which improved load balancing and voltage profile performance in distribution networks. Later studies incorporated Lévy flight-based search mechanisms to enhance exploration capability in networks with distributed energy resources and electric vehicle integration [
17].
Other swarm-based optimization techniques have also been investigated. The Wild Mice Colony algorithm introduced in [
18] focuses on improving reliability metrics such as energy-not-supplied indices. Harris Hawks Optimization was applied in [
19] to enhance sustainable network reconfiguration performance, while the Marine Predators Algorithm proposed in [
20] improved voltage stability and loss reduction in distribution systems. Similarly, Gray Wolf Optimization has been used to reduce peak demand through coordinated battery energy storage system allocation in distribution networks [
21]. Additional heuristic approaches include Tabu Search-based reconfiguration methods [
22], frog-migrating algorithms [
23], and firefly optimization techniques [
24]. To further reduce computational complexity in large-scale networks, search-space reduction techniques were introduced in [
25], while geometric mean optimization approaches were proposed to improve convergence stability and solution robustness [
26].
More recently, hybrid metaheuristic algorithms have been proposed to combine complementary optimization mechanisms. A hybrid PSO–Simulated Annealing algorithm was proposed to improve global search capability and avoid premature convergence in DNR problems [
27].
With the increasing penetration of renewable energy sources and load variability, modern distribution networks require more advanced operational strategies that explicitly consider uncertainty. A stochastic multi-timescale distribution network reconfiguration framework was proposed to coordinate network topology decisions with distributed generators, energy storage systems, and controllable loads under renewable uncertainty conditions [
28]. Another research direction focuses on integrating reactive power compensation with network topology optimization. A three-stage optimization framework was proposed to jointly optimize tie-line reconfiguration and capacitor placement in order to reduce network losses and improve voltage stability [
29].
Data-driven approaches and advanced market mechanisms have also recently been explored for adaptive network operation. Deep reinforcement learning (DRL) has been applied to coordinate distribution network reconfiguration with Volt–VAR control in real-time environments [
30]. Multi-agent DRL frameworks have enabled decentralized control in large-scale systems [
31], while sequential DRL methods have shown promising performance [
32]. To further enhance flexible operation, recent advancements have introduced dynamic market models, such as Distribution Locational Marginal Pricing (DLMP), which effectively manage network congestion and losses under the severe uncertainties of electric vehicle (EV) charging demands [
33]. Similarly, to address complex market pricing and adaptive energy management, hierarchical reinforcement learning algorithms have been proposed to optimize regional energy flexibility [
34]. In addition, emerging hybrid quantum–classical techniques, such as QAOA-based frameworks, have been explored to solve the DNR problem while maintaining electrical feasibility [
35]. While these cutting-edge AI and market-based approaches offer robust, near-instantaneous responses to load uncertainties, they often require complex market deregulation and massive offline training datasets, and, critically, neural networks struggle to strictly enforce hard topological constraints. Therefore, physical network reconfiguration via remotely controlled switches remains a highly practical and direct corrective measure for DSOs, provided that the transition process itself is mathematically guaranteed to be safe.
In addition to algorithmic advancements, recent studies have begun to explore specific operational requirements for real-world DNR. For instance, to ensure safe and efficient topological transitions, switching-sequence optimization has been proposed to minimize intermediate power losses and avoid constraint violations during the actual switching operations [
36,
37]. Additionally, recognizing the capacity limits of purely radial networks, closed-loop and meshed reconfiguration strategies have been actively developed to significantly enhance the hosting capacity of distributed energy resources [
38]. Furthermore, to align with practical day-ahead operational planning, hourly dynamic reconfiguration models that explicitly incorporate 24 h time-series variations and daily commutation constraints have been investigated [
39]. However, while these advanced operational features—safe switching sequences, meshed operation, and hourly operational constraints—have been successfully studied as separate domains, their simultaneous integration into a single operational framework remains largely unaddressed.
To ensure a transparent and reproducible comparison, a structured literature screening was conducted focusing on recent distribution network reconfiguration (DNR) studies employing metaheuristic, heuristic, and data-driven approaches. The inclusion criteria required that selected studies explicitly define their objective functions, clearly specify operational topological constraints (e.g., radial or meshed configurations), and describe their methodologies for validating switching sequences. Based on these criteria, a set of representative studies was identified and is systematically summarized in
Table 1.
1.2. Contributions
Despite extensive research on distribution network reconfiguration, several critical gaps persist that limit its practical deployment in real-world distribution system operator (DSO) environments.
First, although multi-objective optimization formulations have advanced significantly, comprehensive operational cost modeling remains insufficiently addressed. Only a limited number of studies [
14,
23] explicitly incorporate switching costs, while key economic factors such as time-of-use (TOU) energy pricing and on-load tap changer (OLTC) operational costs are often neglected. This limitation is non-trivial, as practical DSO decision making requires full economic visibility across all operational cost components to ensure cost-effective, justifiable actions.
Second, existing approaches typically address different operational stages in isolation rather than within an integrated framework. Based on the systematically screened literature summarized in
Table 1, three key observations can be made: (1) the majority of metaheuristic-based studies [
10,
11,
12,
13,
14,
15,
16,
17,
18,
19,
20] focus exclusively on radial network optimization, neglecting mesh topologies as a viable congestion mitigation strategy; and (2) only a limited number of studies [
21,
38] consider meshed configurations, yet lack a structured coordination mechanism between radial and mesh operation.
Third, although safe switching sequence, meshed network operation, and cost-aware reconfiguration have each been extensively studied as independent research domains, their integration into a unified operational pipeline remains limited. In practice, DSOs require comprehensive decision-support tools that span the full operational workflow—from economic optimization to severe congestion mitigation and, ultimately, secure implementation. The fragmented nature of existing solutions makes their sequential application within real control room environments both complex and operationally challenging.
To address these gaps, this paper proposes a unified and practically oriented operational framework rather than a standalone optimization algorithm. Consequently, the core novelty of this paper lies explicitly in the hierarchical integration of these operational stages and in its comprehensive validation on a real distribution feeder, rather than in the invention of isolated optimization ingredients. The main contributions of this work are summarized as follows:
A comprehensive cost modeling approach is developed, incorporating time-of-use (TOU) energy pricing, switching operation costs, and OLTC degradation, thereby enabling a more realistic and economically grounded representation of day-ahead DSO operations.
An integrated hierarchical framework is proposed through a three-stage operational strategy that sequentially combines radial network optimization, temporary mesh reinforcement for severe congestion mitigation, and explicit validation of safe switching sequences. This ensures that all generated network configurations are not only optimal but also operationally feasible and safely executable.
The proposed framework is validated on a real 22 kV distribution network, demonstrating its effectiveness and practical applicability as an end-to-end congestion management solution for medium-voltage systems.
The remainder of this paper is organized as follows.
Section 2 presents the mathematical formulation of the problem.
Section 3 describes the proposed operational framework.
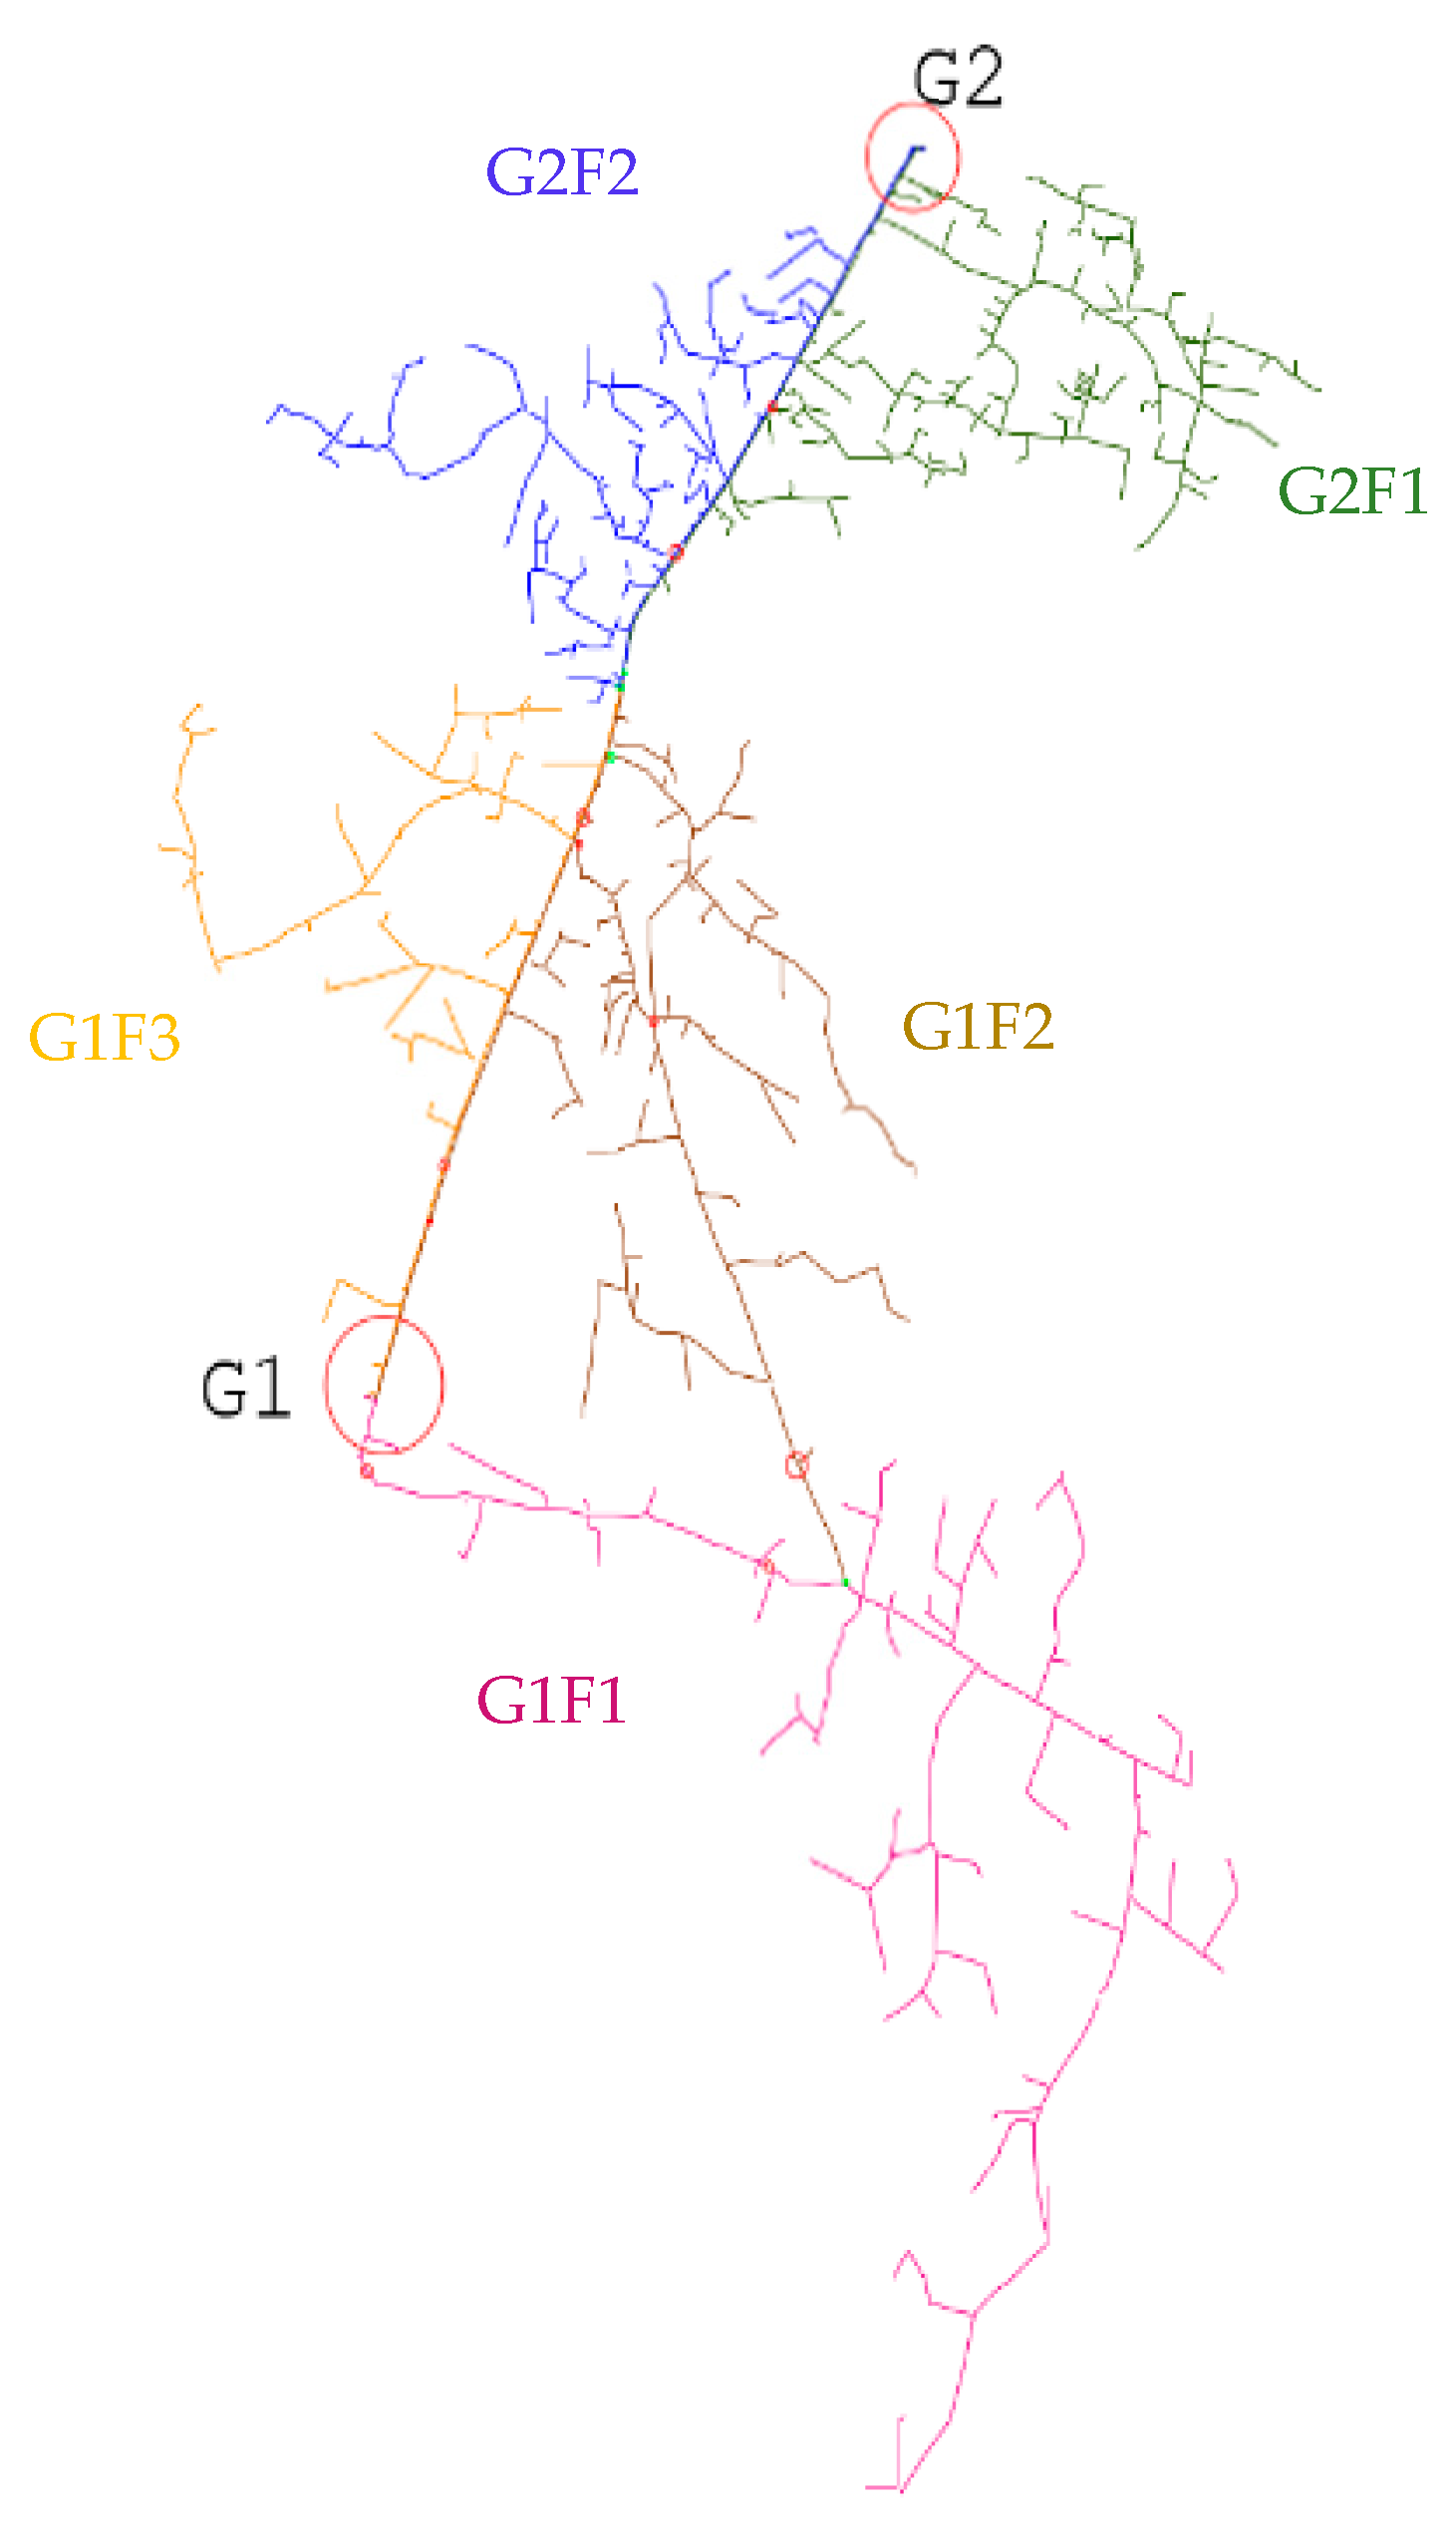
Section 4 details the simulation implementation and describes the actual distribution network used in the study.
Section 5 presents the simulation results, and
Section 6 provides a discussion. Finally,
Section 7 concludes the study.
3. Proposed Operational Framework
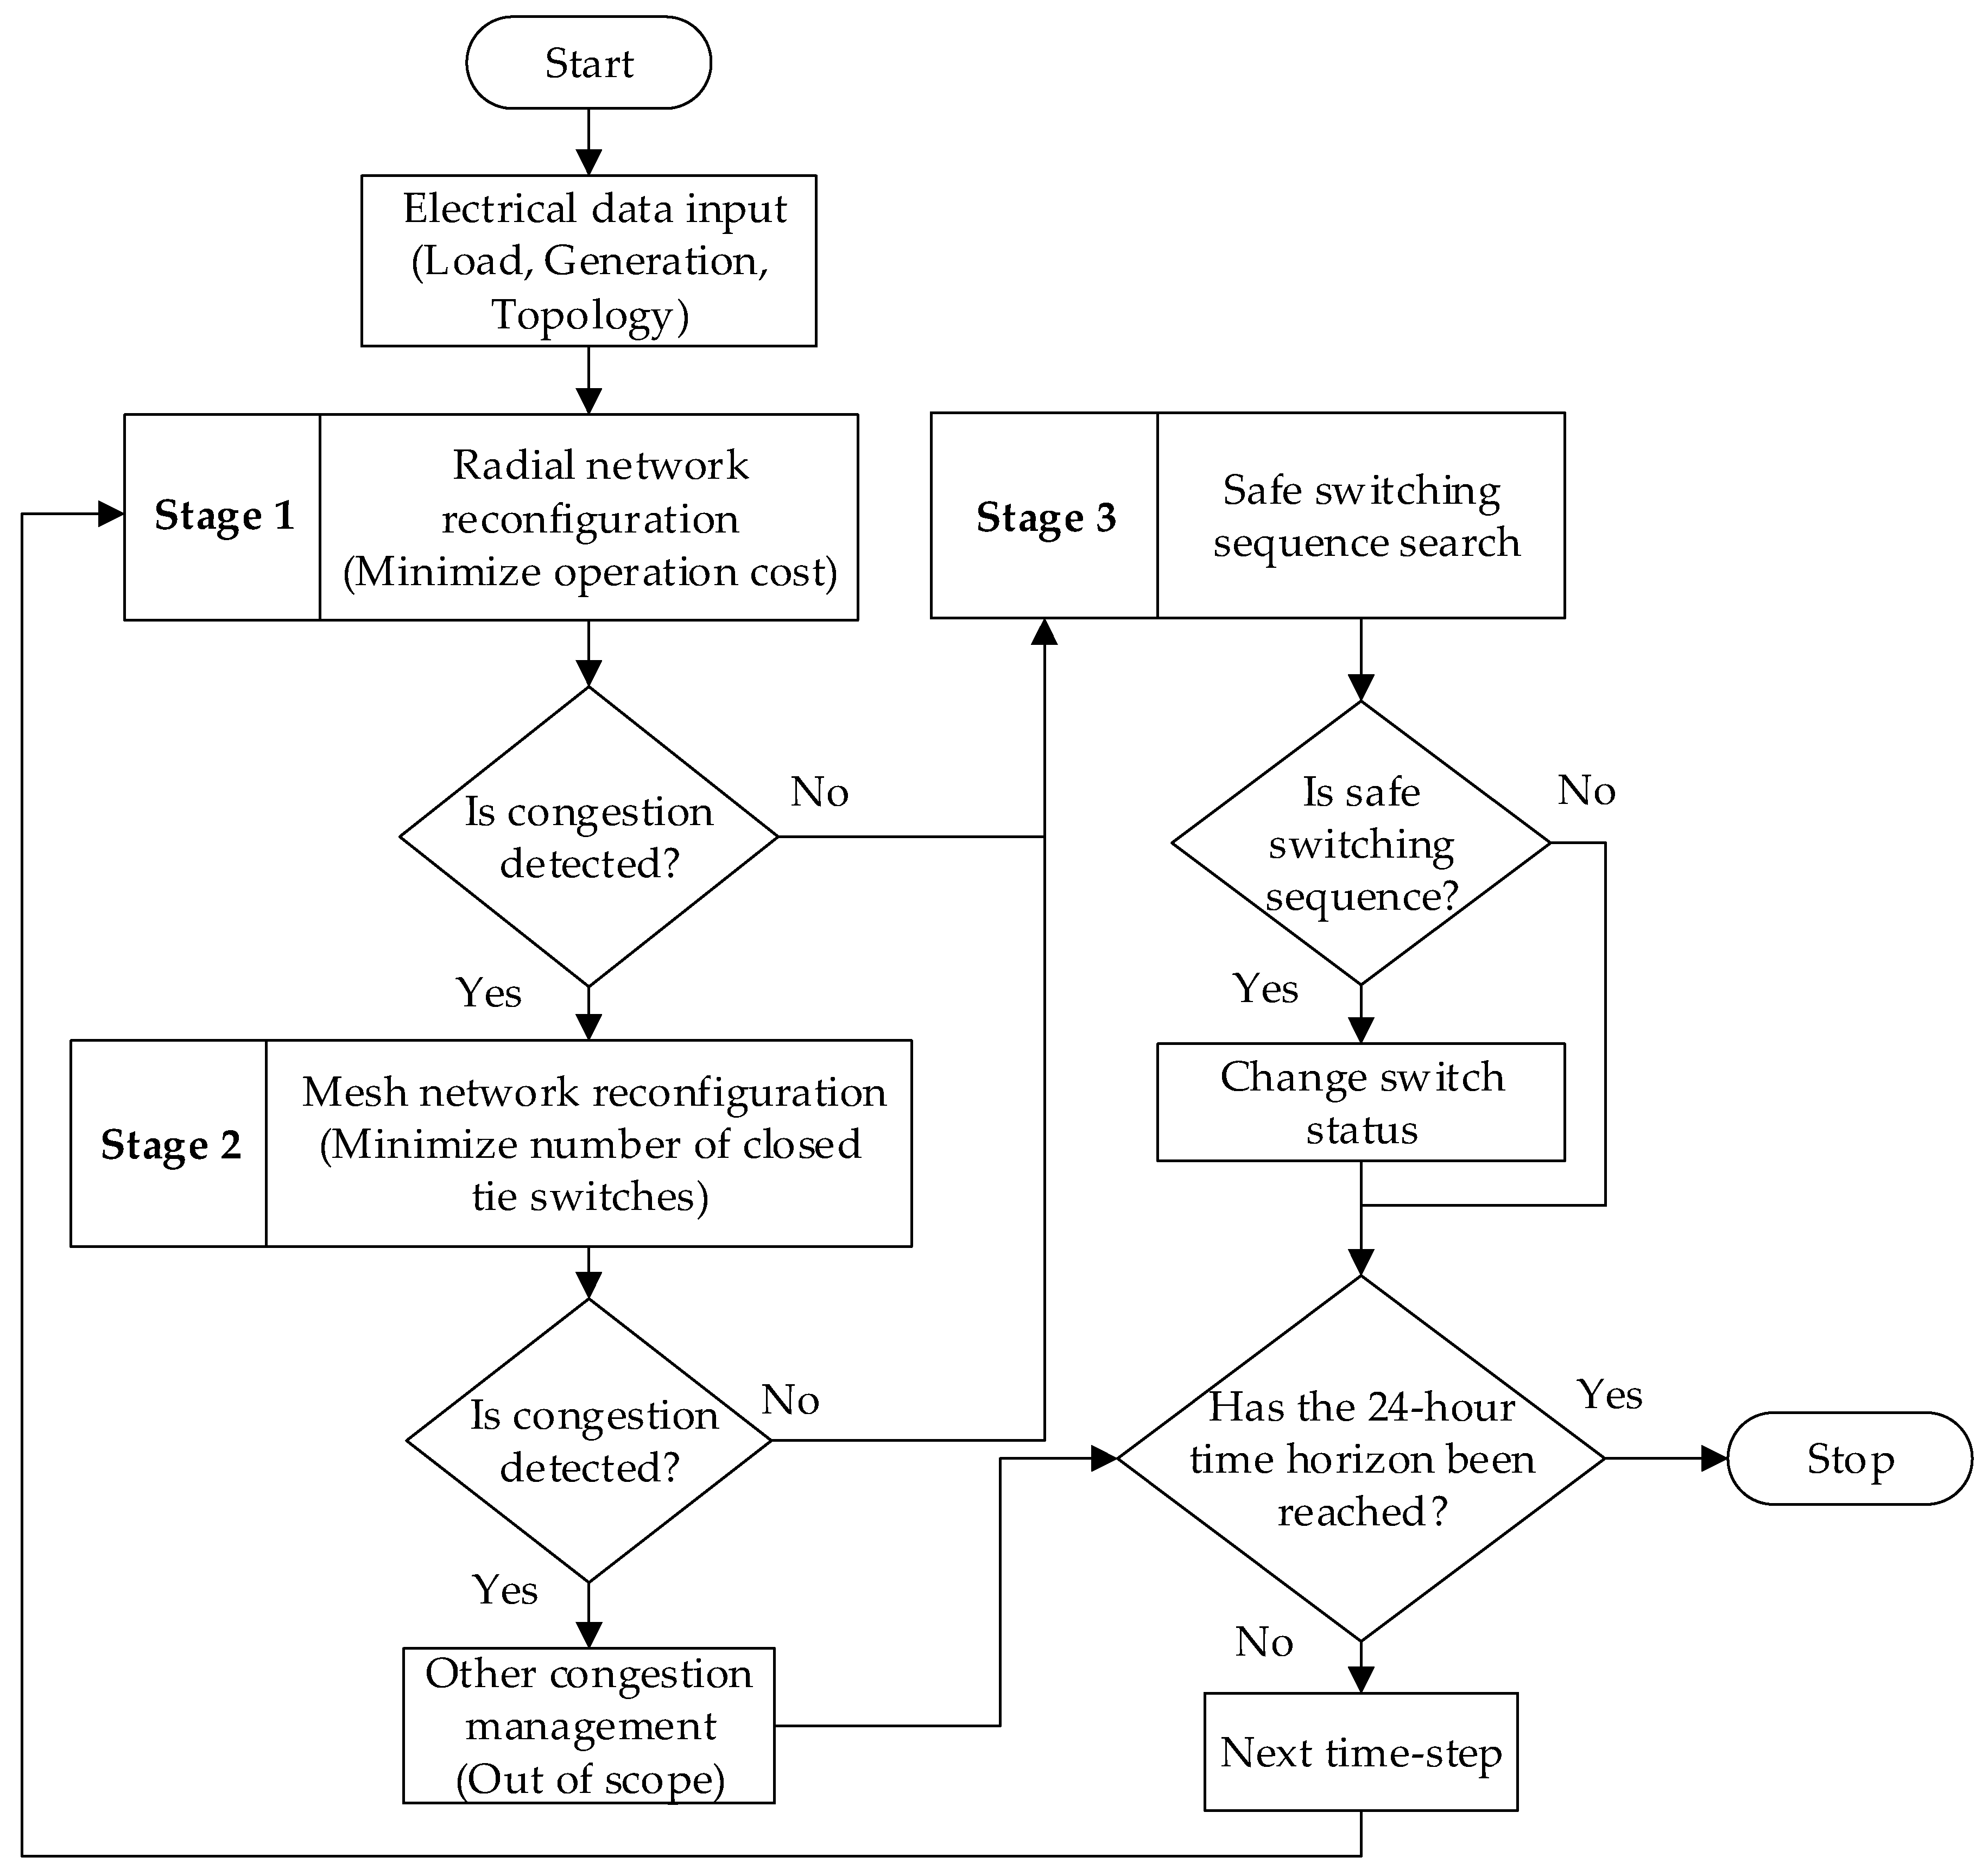
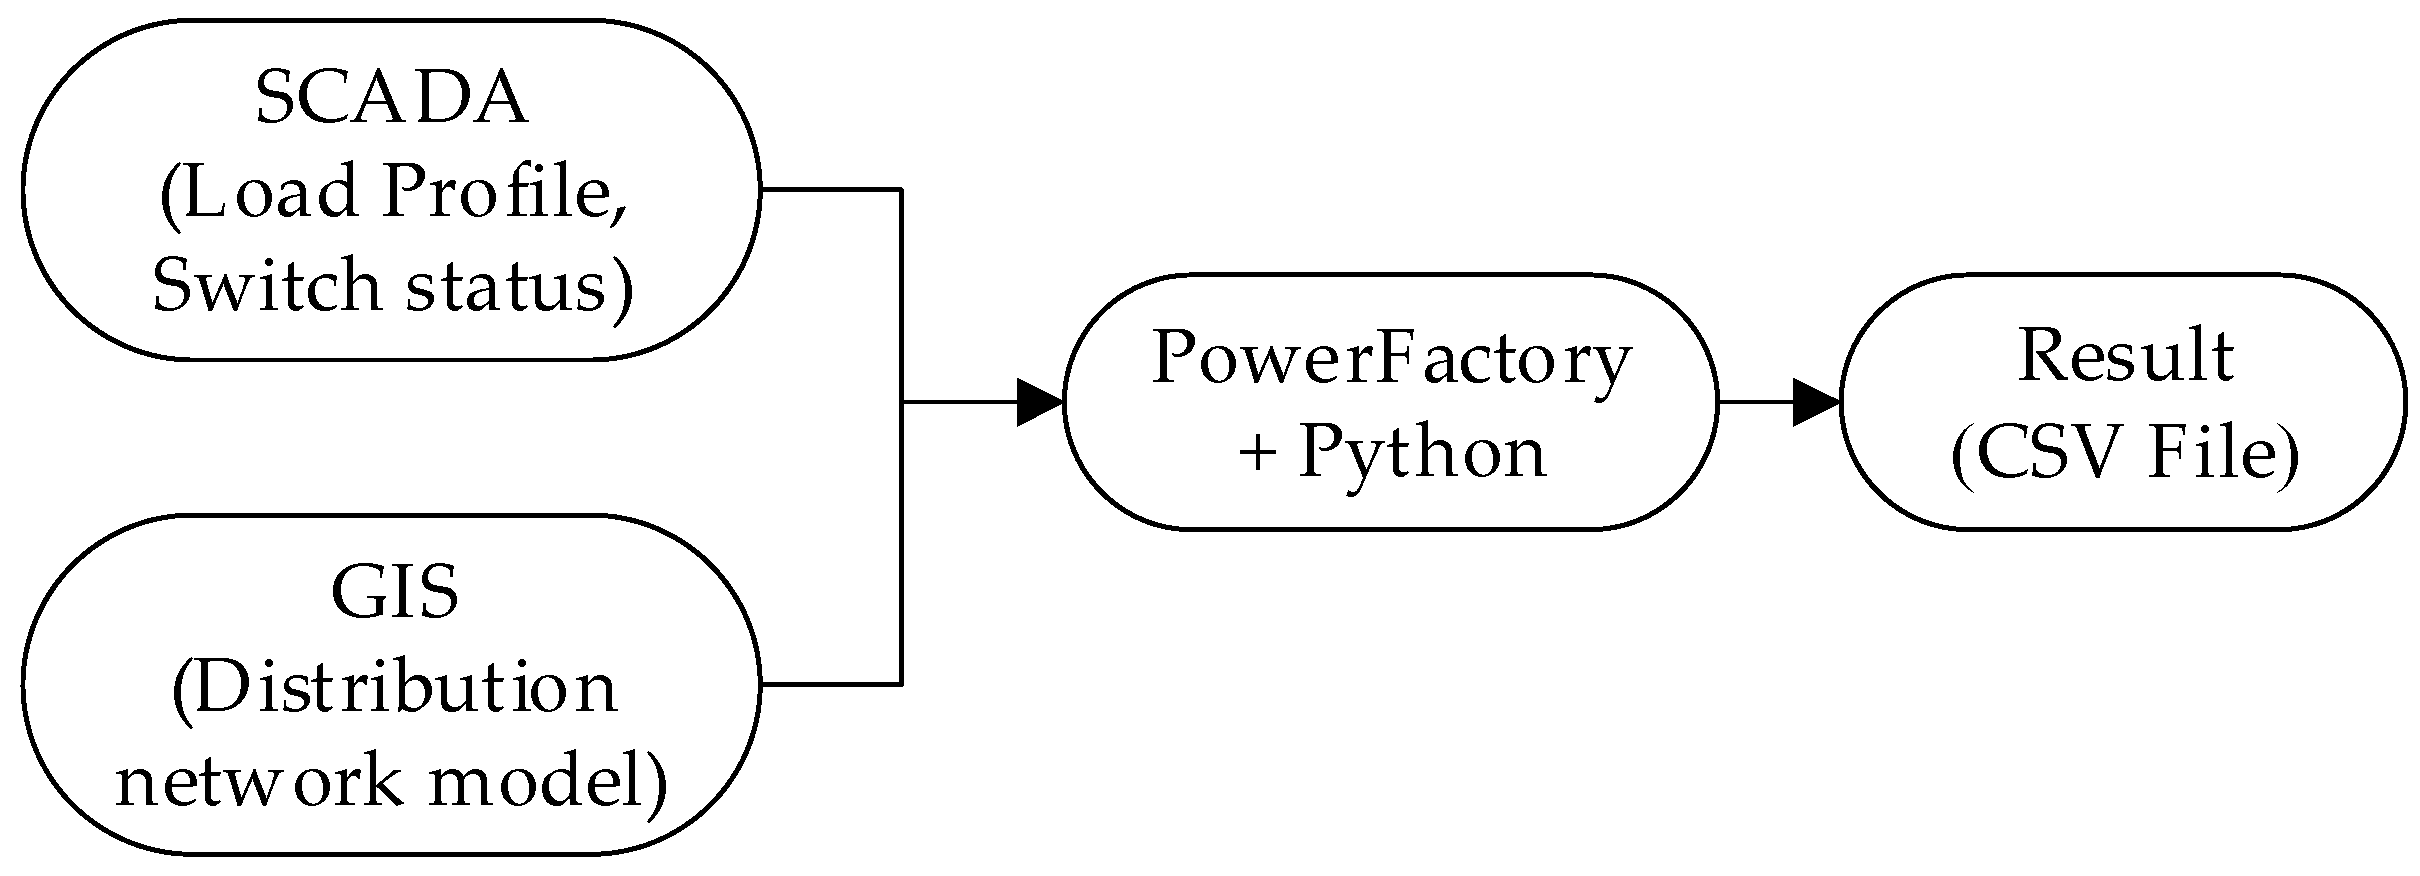
The proposed framework operates as an integrated three-stage approach to address both normal operating conditions and congestion scenarios, including voltage violations, overloads, and reverse power flow, as shown in
Figure 1.
The framework begins by importing electrical data, including time-varying load and generation profiles and network topology. From
Figure 1, the first stage optimizes the radial network configuration. If congestion occurs in the distribution network, the algorithm transitions to the second stage, that is, the mesh network reconfiguration stage. The final stage performs a safe-switching-sequence search. The proposed framework follows a hierarchical operational structure rather than a single unified optimization problem. Radial network operation is treated as the default and economically preferred mode, while temporary meshed operation is considered only as a corrective action under congestion conditions.
3.1. Stage 1: Radial Network Reconfiguration
In the radial network optimization stage, the optimization algorithm searches for the optimal radial network topology that minimizes the objective cost function in (1) under strict radiality constraints. The population is initialized using the distribution network topology from the previous hour, thereby promoting temporal continuity, reducing unnecessary switching operations, and lowering operational costs.
Prior to fitness evaluation, each candidate configuration is validated to ensure full network connectivity without any outage buses and to confirm a radial structure. Configurations that violate these conditions are excluded from evaluation, thereby reducing computational burden and focusing the optimization on feasible radial solutions, as illustrated in Algorithm 1.
| Algorithm 1. Radial Network Optimization |
| | Input:
: Previous hour switch configuration.
: Current hour. |
| | Output:
: Set of optimal switch status.
: Minimum operation cost. |
1
2
3
4
5
6
7
8
9
10
11
12
13
14
15
16 | Begin:
Initialize a population of candidate solutions
S_seed ← if IsRadial() else
For to do
For each candidate () in population do
If IsRadialAndEnergized() is false then
Else
Apply to network
RunLoadFlow()
End If
End For
UpdateOptimizer()
End For
Return
End |
Algorithm 1 performs radial network optimization to minimize hourly operational costs while satisfying radiality constraints on the distribution network. The algorithm starts with optimization initialization (lines 1–2). Candidate solutions are generated that represent valid radial topologies. The seeding strategy adapts based on the previous hour’s configuration: was radial; it serves as the primary seed to maintain temporal continuity and reduce switching frequency.
However, when the previous configuration was meshed (after congestion management), the algorithm used a base radial pattern () to ensure a feasible starting point.
From Algorithm 1, the main optimization loop (lines 3–14) evaluates each candidate configuration. Line 5–6 enforces hard constraints by assigning an infinite cost to topologies that violate radiality or result in de-energized buses, effectively excluding infeasible solutions. For valid configurations, the algorithm performs a power-flow analysis (line 9) to compute the steady-state operating conditions for the load and generation profiles at hour t. The cost function (line 10) aggregates the costs of multiple objectives. The optimizer state update (line 13) follows the BPSO procedure, where each particle learns from its own best-found switch configuration and the best configuration discovered by the entire swarm, then probabilistically updates its switch states to search for lower-cost topologies. Finally, the algorithm returns the optimal reconfiguration with the minimum operating cost.
3.2. Stage 2: Mesh Network Reconfiguration
When radial reconfiguration fails to find a feasible radial topology with no congestion (Voltage Violation, Overload, Reverse power flow), Stage 2 is entered. In this stage, the framework bypasses the radial optimization process and applies a deterministic mesh reinforcement procedure, enabling temporary mesh operation by closing normally open tie switches. The mesh reconfiguration operates iteratively, beginning with the optimal radial configuration from Stage 1. The framework evaluates closing each available tie switch individually, selecting the switch whose closure most effectively reduces congestion or violation severity while moving toward constraint satisfaction.
This process continues, adding one mesh connection per iteration, until either (1) all congestion and reverse power are satisfied (successful congestion relief) or (2) all available tie switches have been exhausted (partial relief).
Algorithm 2 implements an adaptive mesh reconfiguration strategy that is activated when radial operation cannot resolve network congestion or violations. The algorithm initializes with the best radial configuration from Algorithm 1 (line 1) and identifies all currently open tie switches as candidates for mesh formation (line 2). Tie switches are inter-feeder connections that, when closed, create alternative power flow paths and loops in the network.
The iterative mesh exploration (lines 3–16) employs a greedy level-by-level strategy to minimize the number of closed tie switches while resolving violations. At each level, the algorithm tests whether closing one additional tie switch results in a closed tie (lines 5–13). Each evaluation uses power-flow analysis with mesh topology permissions (line 7) as the system transitions from radial to meshed operation. The cost evaluation in this stage focuses on reducing penalty costs associated with congestion or violations, rather than operational costs such as power losses, switching operations, or OLTC actions. The lowest cost at each level is selected (lines 9–11). This determines the feasible configuration.
The shift in the objective function from economic optimization (Stage 1) to penalty and topology minimization (Stage 2) is a deliberate design choice reflecting practical DSO priorities during severe network stress. When Stage 2 is activated, it indicates that the network is operating under extreme conditions in which no feasible radial configuration exists. In such critical states, operational security strictly supersedes economic optimality. Therefore, the primary objective is to rapidly restore network feasibility by eliminating voltage and thermal violations. Attempting to optimize marginal economic costs (e.g., power losses) during an unresolved emergency would be practically inappropriate. Furthermore, the iterative greedy strategy—which intrinsically seeks the minimum number of closed tie switches—is fundamentally tied to protection coordination. Meshed distribution networks complicate fault detection, often requiring complex directional relaying. By seeking a ‘minimally meshed’ topology (closing only the absolute minimum number of tie switches required to relieve congestion), the framework effectively minimizes disruptions to standard adaptive protection schemes, thereby balancing necessary capacity reinforcement with protection simplicity and operational safety.
| Algorithm 2. Mesh Network Optimization |
| | Input:
: Best radial configuration from Stage 1.
: Previous hour switch configuration.
: Current hour. |
| | Output:
: Optimal mesh configuration.
: Minimum cost with mesh topology. |
1
2
3
4
5
6
7
8
9
10
11
12
13
14
15
16
17
18 | Begin:
← Evaluate(, mesh)
TieSwitches ← {i | [i] = 0 and i ∈ TieIndices}
For level = 1 to |TieSwitches| do
← null, ← ∞
For each sw ∈ TieSwitches do
← [sw] ← 1
RunLoadFlow()
← Evaluate(, mesh)
If < then
← ←
End If
End For
If ≥ then Break // No improvement
← ←
If Penalty() = 0 then Break // Feasible found
End For
Return
End |
Two termination criteria govern the search process. First, the algorithm stops when closing additional tie switches no longer reduces cost (line 13), indicating diminishing returns from further meshing. Second, it terminates upon finding a violation-free solution (line 15), meaning the primary goal of resolving congestion has been achieved. This adaptive approach balances operational constraint satisfaction with network complexity. If no feasible mesh configuration is found after all possibilities are exhausted, the algorithm returns the “least infeasible” solution, flagging the need for operator intervention or alternative congestion-management strategies.
3.3. Stage 3: Safe Switching Sequence Search
This stage constitutes a critical practical consideration often neglected in the DNR literature. Regardless of whether the final configuration is radial or mesh, the framework must verify that a safe, step-by-step switching sequence exists to transition from the previous hour’s configuration to the current optimal configuration. This validation ensures that no intermediate switching state causes customer outages, voltage violations, or temporary overloads.
To strictly guarantee operational safety, the validation process imposes specific constraints at every intermediate switching step. Specifically, the algorithm verifies that (1) all nodal voltages () remain within the permissible safety limits (); (2) no branch loading exceeds the emergency thermal limit (), which is set at 90% of the rated capacity during transitions; and (3) there is reverse power flow to the upstream substation. This ensures that transient states do not trigger protection relay tripping due to undervoltage, thermal overload, or unintended reverse power flow. This safe sequence is essential for DSO in practical network reconfiguration.
Algorithm 3 generates safe switching sequences to transition between network configurations without causing temporary service interruptions or constraint violations during reconfiguration. This critical validation step ensures that the optimization results can be practically implemented; even optimal steady-state configurations may be unreachable through safe switching operations. The algorithm identifies required closing and opening operations by comparing start and target configurations (lines 2–3) and then orchestrates them in a carefully designed two-phase sequence.
| Algorithm 3. Safe Switching Sequence Search |
| | Input:
: Starting switch configuration.
: Target switch configuration. |
| | Output:
: Safe switching operation sequence.
: Boolean indicating sequence safety. |
1
2
3
4
5
6
7
8
9
10
11
12
13
14
15
16
17
18
19
20
21
22
23
24
25 | Begin:
If = then Return “No Change”, True
ToClose ←
ToOpen ←
Sequence ← []
// Phase 1: Close switches with loop management
While ToClose ≠ do
← {} subject to:
and and
If = null then Return “UNSAFE_CLOSE”, False
← 1, Append “CLOSE ” to Sequence
If LoopDetected() then
← FindLoopBreakSwitch(ToOpen)
If ≠ null then
[] ← 0, Append “OPEN ”
End If
End If
End While
// Phase 2: Open remaining switches
For each ∈ ToOpen do
← 0
If Connectivity() = Fail or Constraints() = Fail then
Return “UNSAFE_OPEN”, False
← Append “OPEN ”
End For
Return Join(Sequence, “; ”), True
End |
Phase 1 (lines 6–16) prioritizes closing operations using a “make-before-break” philosophy, temporarily creating alternative power paths before removing the existing ones. At each step, the algorithm evaluates all remaining switches to close and selects the one minimizing system loading while maintaining safety constraints (line 7). This greedy selection balances progress toward the target configuration with operational limits. The critical challenge in this phase is managing temporary loops formed when closing tie switches. When a loop topology is detected (line 10) the loop-breaking mechanism searches for an appropriate switch to open. It examines switches planned for opening in the target configuration (line 11), preferring operations that serve dual purposes. This adaptive strategy accommodates situations where the optimal sequence requires temporary deviations from the direct path to the target configuration. In rare cases where no loop-breaking switch maintains safety, the algorithm accepts the meshed state temporarily and continues the sequence.
Phase 2 (lines 19–24) executes the remaining opening operations with rigorous safety validation. Each opening is tested for potential customer outages (island formation) and new constraint violations (line 20) before execution.
This defensive checking is essential because opening switches can shift power flows, potentially overloading other lines or causing voltage drops in areas with weak supply. Any detected unsafe condition immediately terminates sequence generation with a failure status (line 21), preventing the execution of partially complete or potentially dangerous sequences.
Explicit failure reporting enables the optimization framework to reject target configurations with unsafe transition paths, even if those configurations are operationally optimal. The integration of operational feasibility with transition feasibility distinguishes practical network reconfiguration from purely theoretical optimization.
Computational Complexity: Unlike Stage 1, Algorithm 3 employs a deterministic greedy heuristic with linear complexity , where is the number of switching operations in the sequence and is the number of available tie switches. Validation with the 22 kV network confirms execution times of 1–5 s, demonstrating the algorithm’s high computational efficiency and its ability to rapidly determine safe topology transitions without introducing significant computational delays.
5. Results
To validate the performance and robustness of the proposed framework for congestion management and operation cost minimization, four case studies were designed to represent different operational scenarios that reflect challenges commonly encountered within the distribution network.
Case 1 (Normal Condition): This case operates without any congestion or violations in the test network.
Case 2 (Overvoltage): Simulates an overvoltage scenario intentionally caused by modeling high photovoltaic (PV) penetration on feeder G1F2. This is to assess the framework’s voltage regulation capability.
Case 3 (Undervoltage): Introduces an undervoltage problem caused by high power demand from a large-scale electric vehicle (EV) charging station connected to the network.
Case 4 (Overload and Reverse Power Flow): Examines a thermal overload condition resulting from concentrated PV generation that causes reverse power flow.
These case studies are formulated to evaluate the framework’s effectiveness in detecting and mitigating various types of network congestion and violations, including overvoltage, undervoltage, overload, and reverse power flow, and to compare the optimized performance with the non-reconfiguration in the base case.
5.1. Case 1: Normal Operation
This case evaluates the performance of the proposed operational framework under normal operating conditions, with a typical 24 h load profile that does not initially cause congestion or violations. The primary objective is to minimize the total operational cost. All parameters must be maintained within permissible limits. The optimization process identified one beneficial reconfiguration event, as summarized in
Table 8.
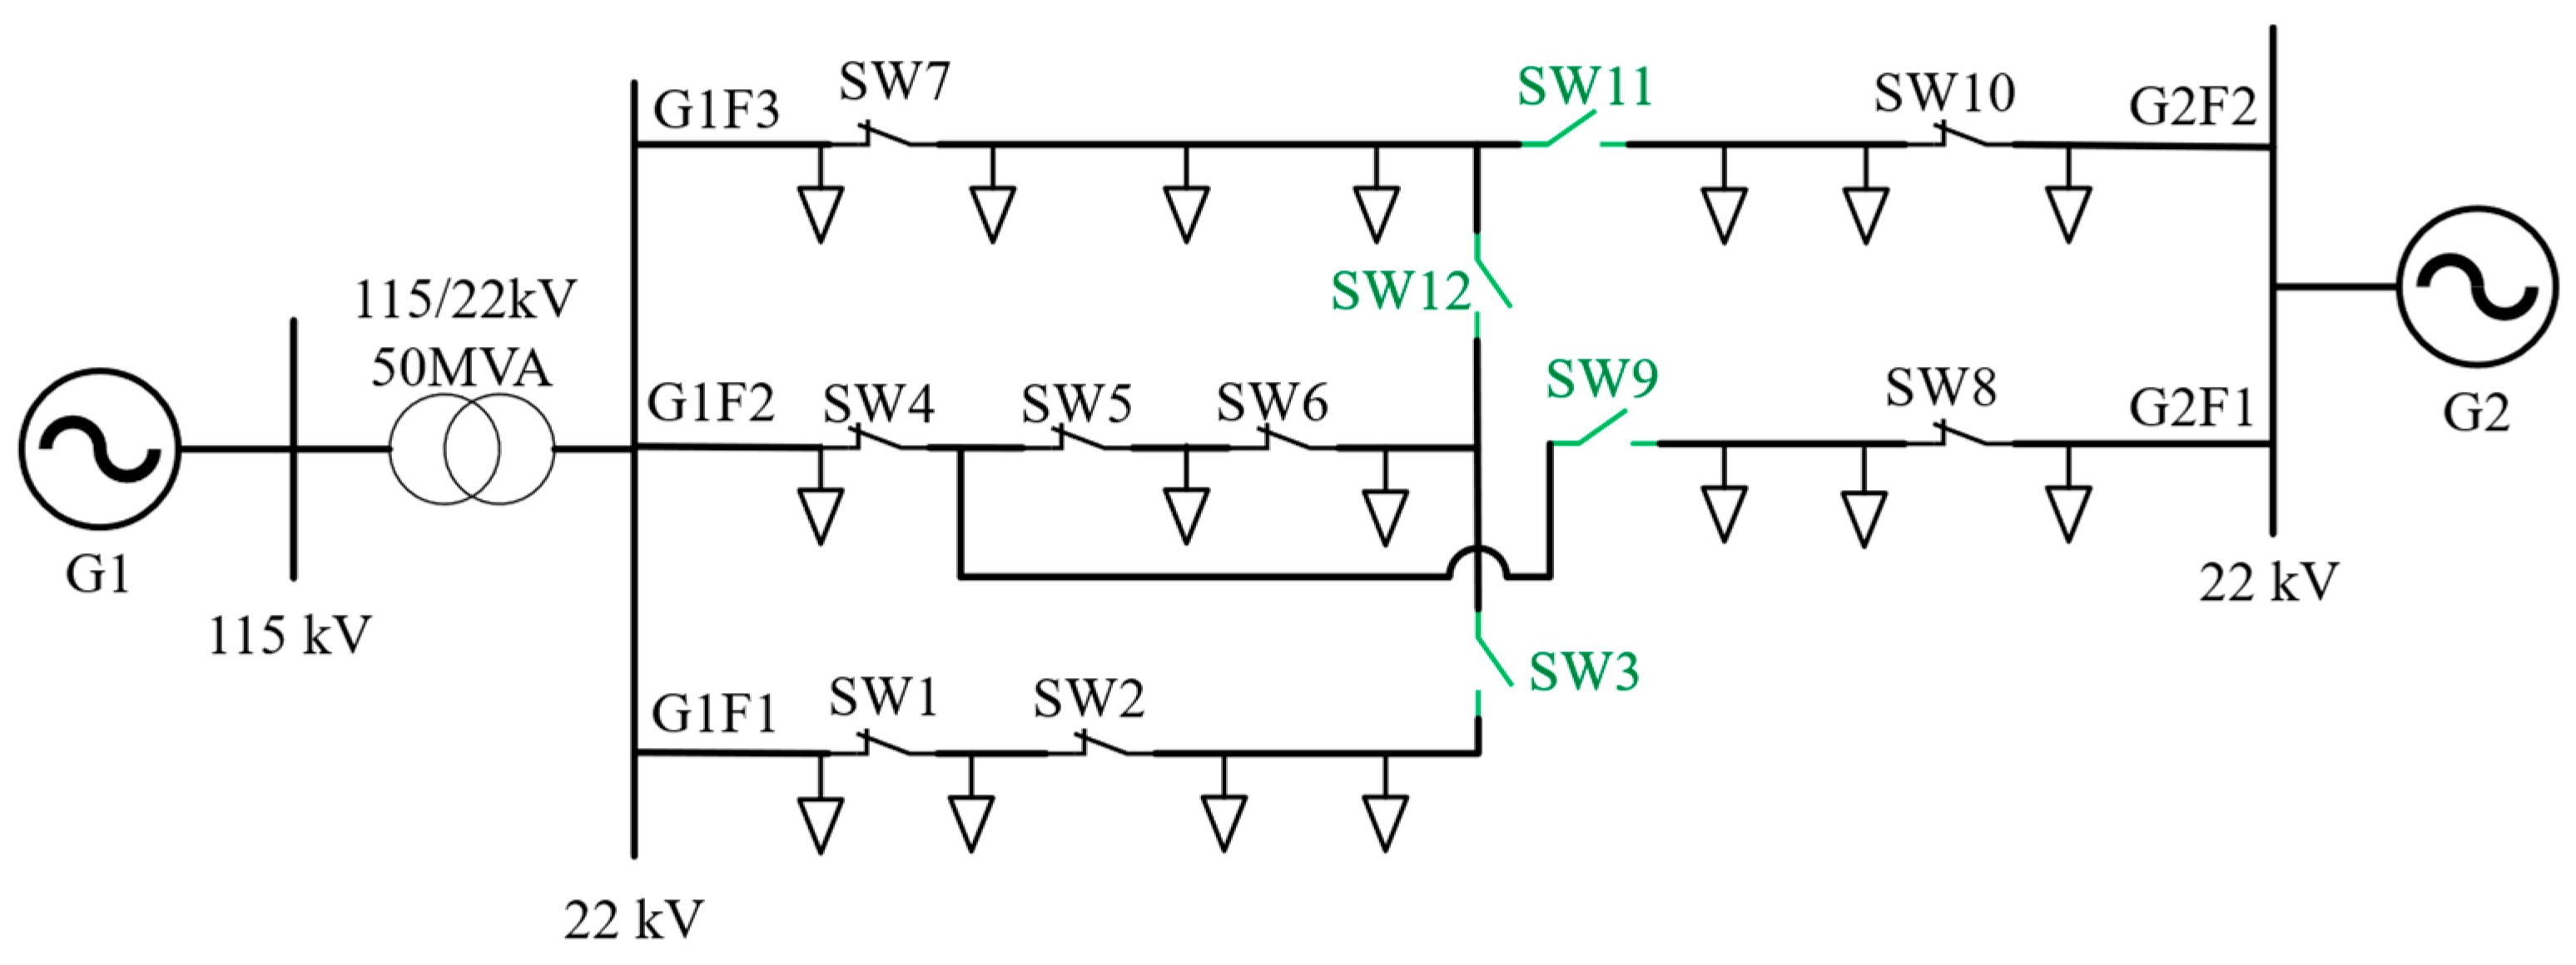
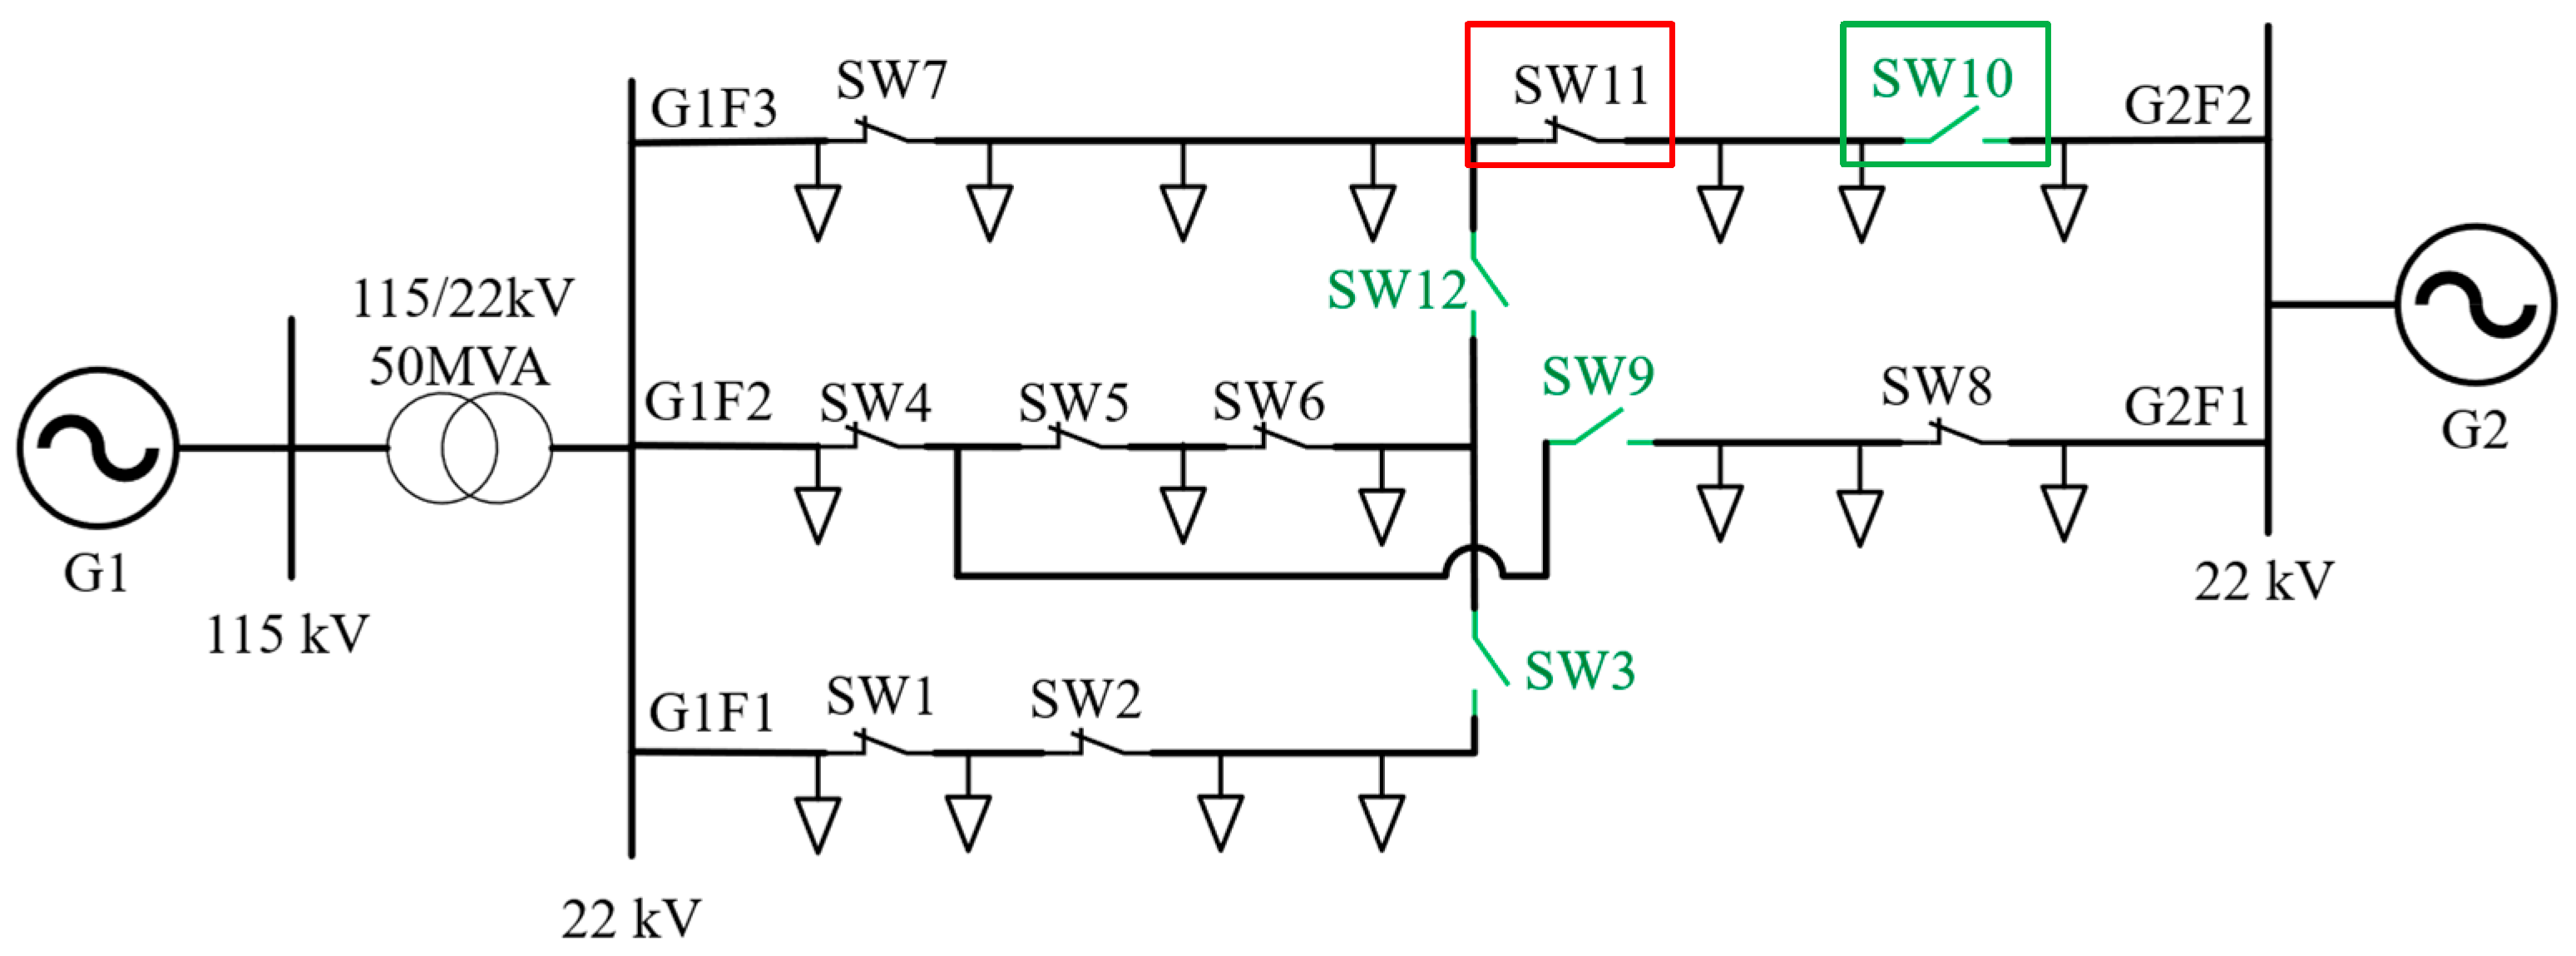
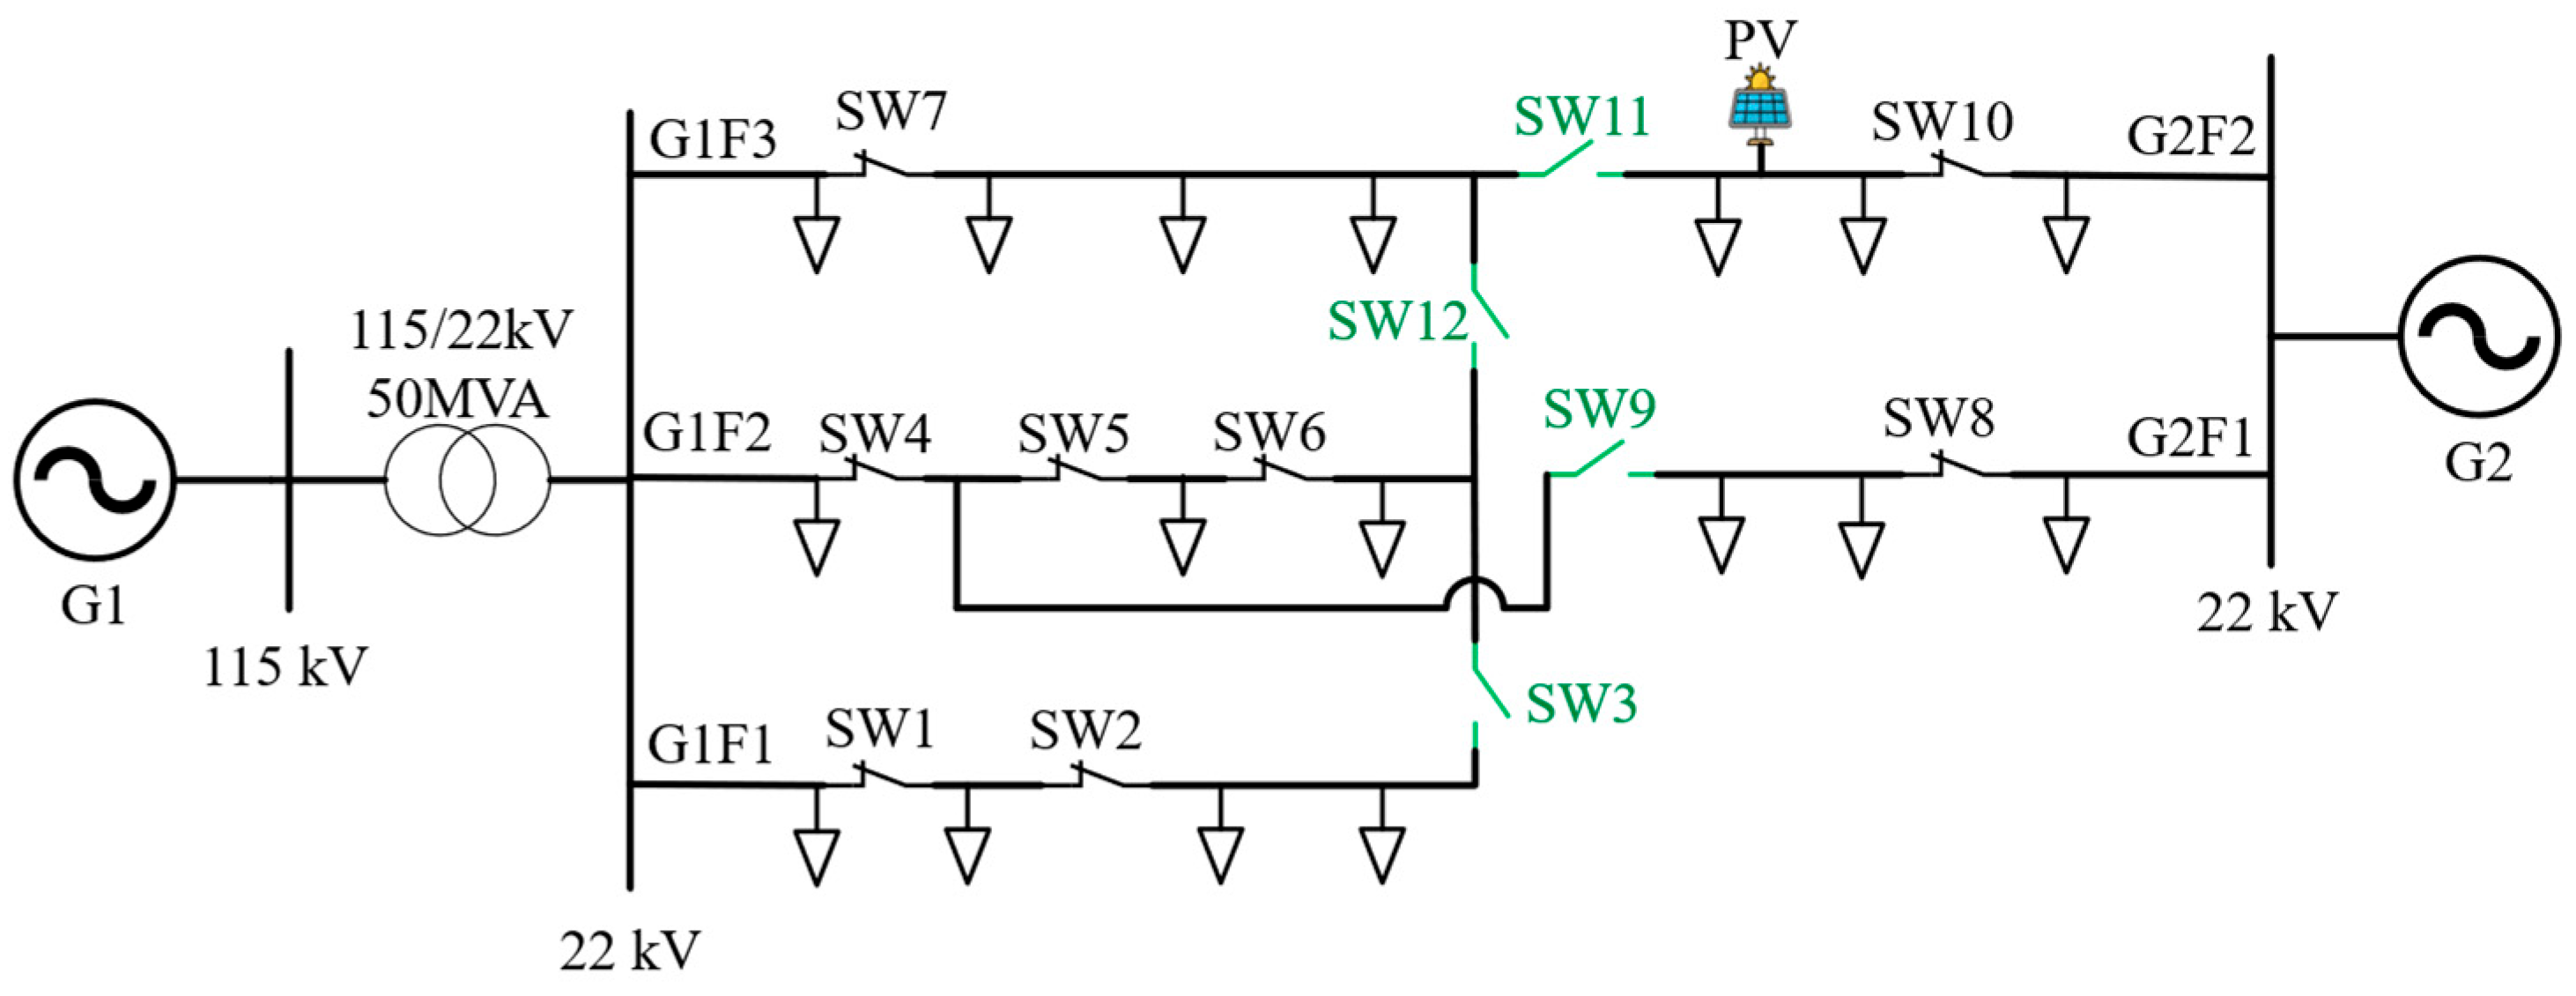
At 09:00 a.m., the algorithm recommended closing SW11 and opening SW10, transferring the load from substation G2 to G1. The corresponding topology change is illustrated in
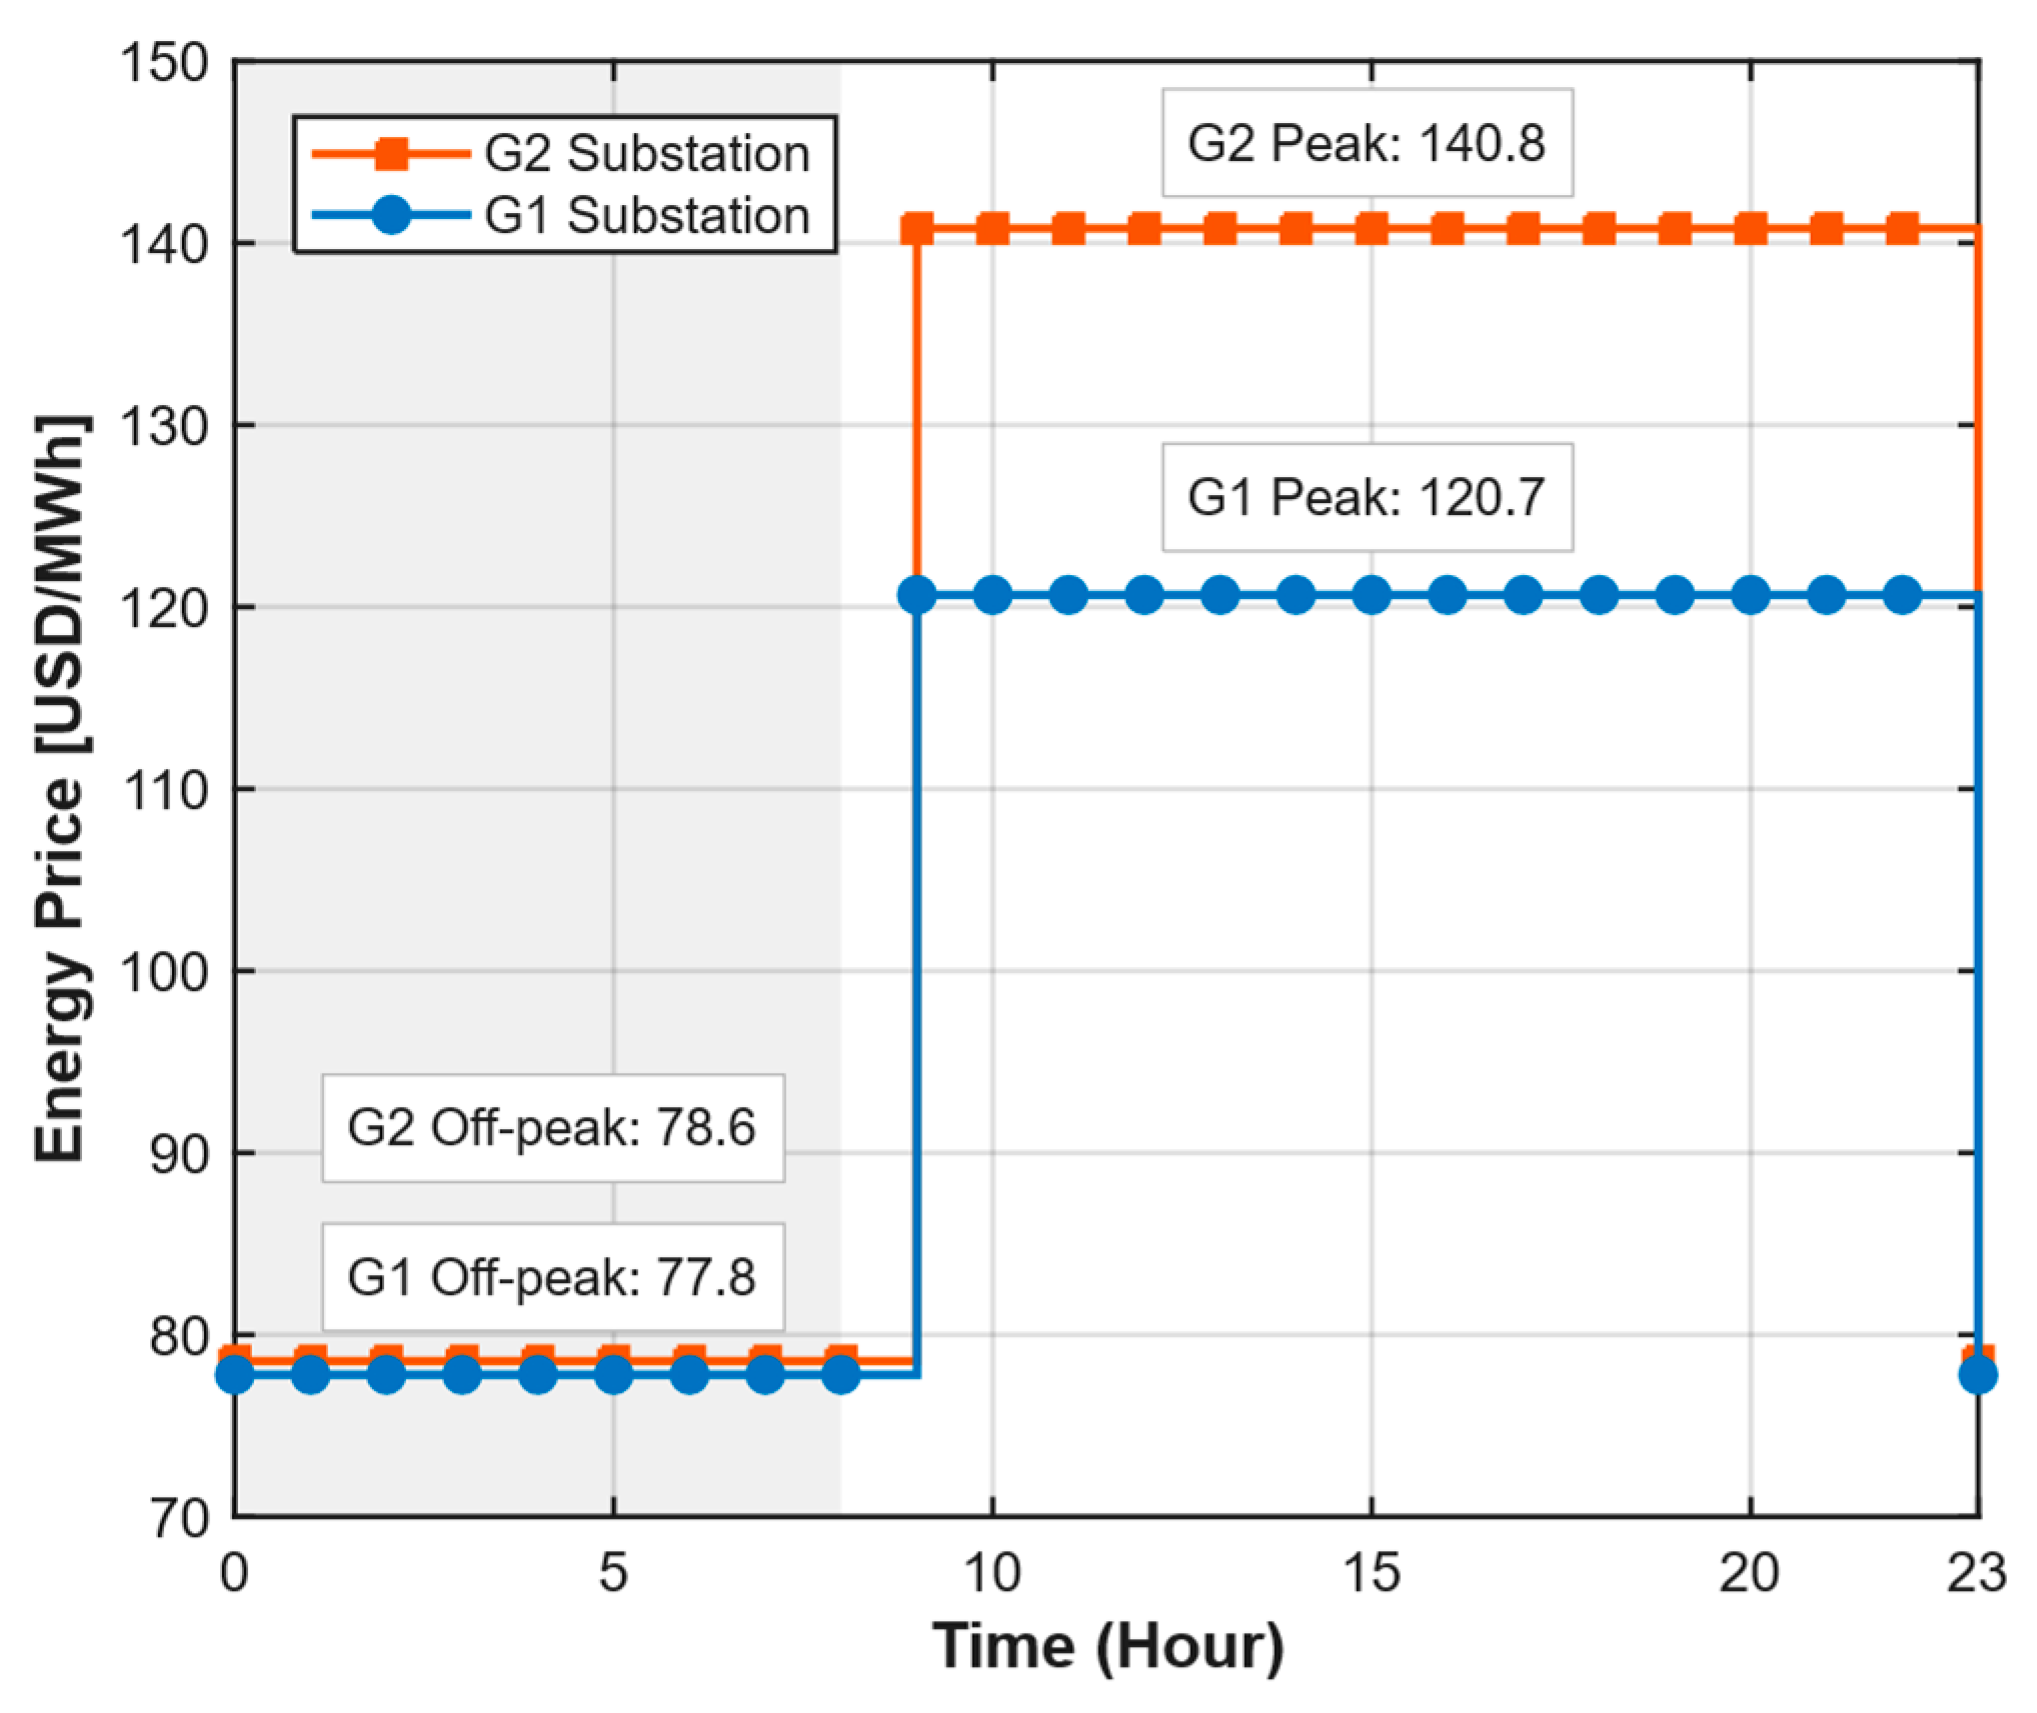
Figure 7. This switching action leverages the lower import energy costs from Substation G1 compared to Substation G2 during peak-time-of-use (TOU) tariff periods, thereby reducing the overall operating cost of the distribution network. The BPSO successfully found a solution for all 24-hourly optimization periods. Simulation results are presented in
Table 9. Compared with the base case, the BPSO-optimized configuration achieved a 1.81% reduction in total operating cost from USD 32,265.40 to USD 31,680.94 while maintaining all constraints.
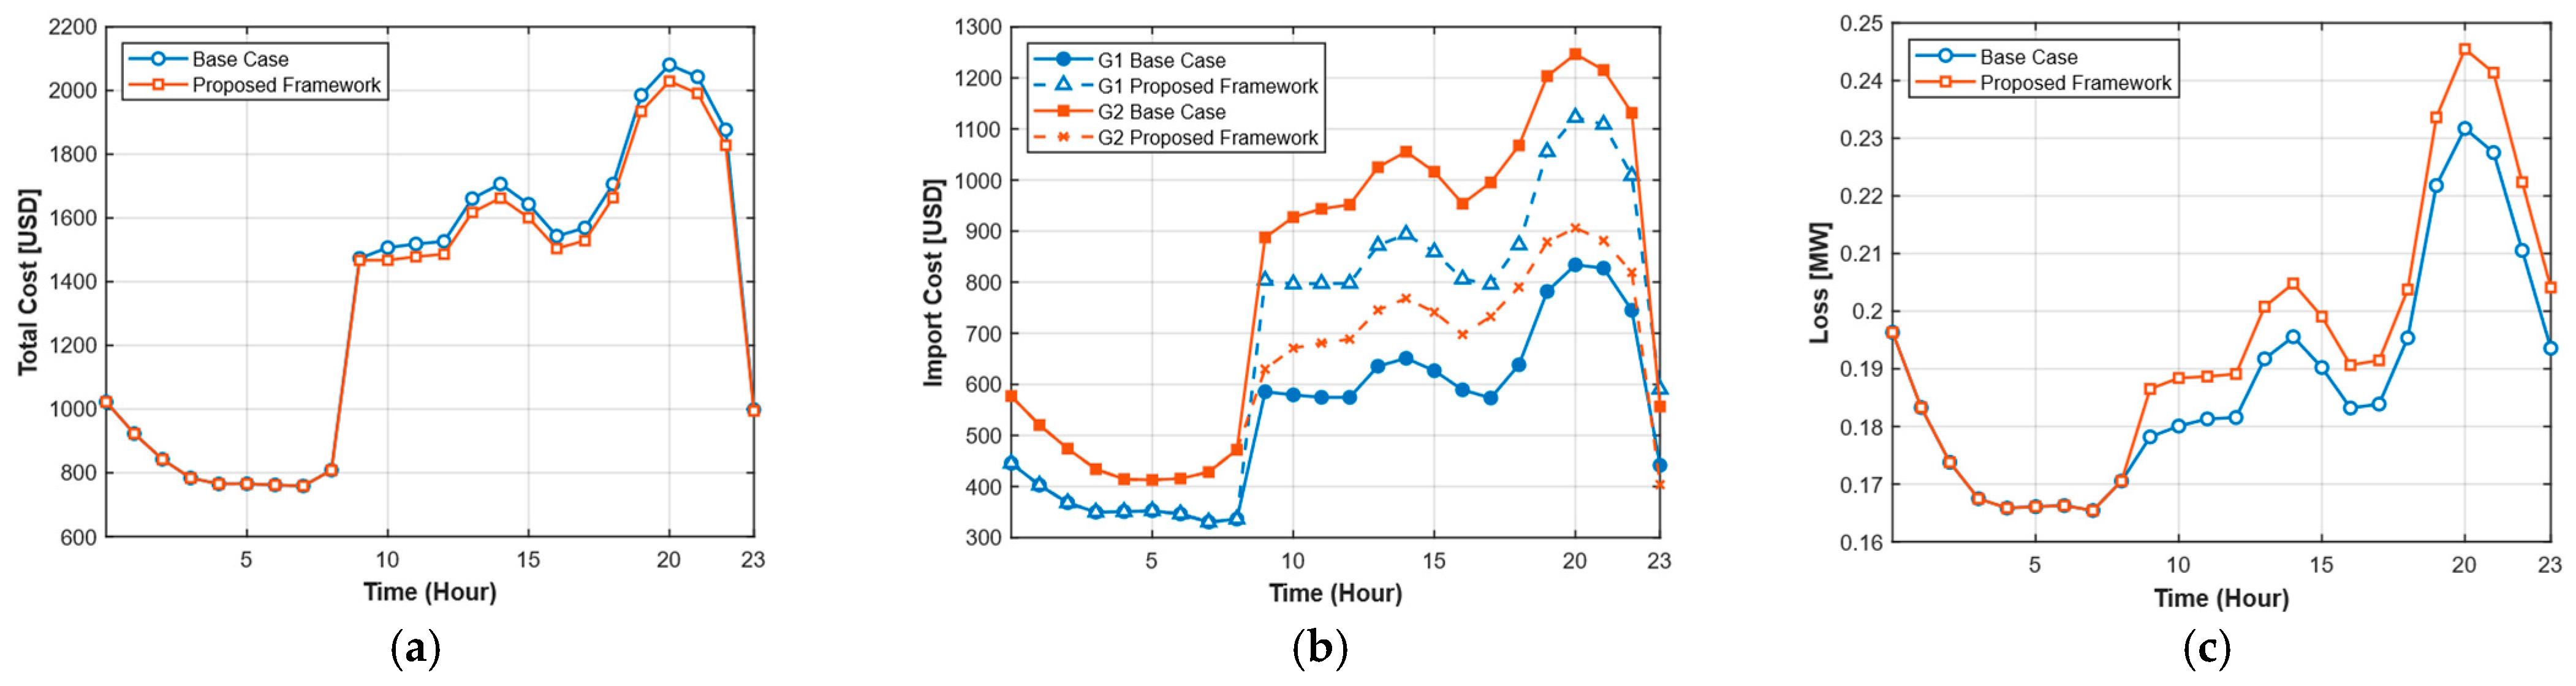
As shown in
Figure 8a, after this reconfiguration event, the hourly operational cost in the optimized case was always lower than that in the base case.
Figure 8b further explains the economic rationale: the framework strategically shifted power import by increasing purchases from the lower-cost G1 substation while decreasing purchases from the higher-cost G2 substation. This dynamic import-cost adjustment is the main driver of overall cost savings.
A small trade-off was seen in terms of increased network losses, which increased by 0.1439 MWh (3.20%), as depicted in
Figure 8c. However, the total operational cost savings from reduced imports were much greater than the marginal increase in network losses. Throughout the 24 h period, the optimized configuration remained compliant with all operational constraints. The maximum voltage was sustained at 1.04 p.u., while the minimum voltage stayed above the 0.95 p.u. limit. Moreover, the proposed framework achieved a 9.7% reduction in maximum loading (from 57.21% to 47.42%) while requiring only two switching operations in total, demonstrating the framework’s effectiveness and practicality for network operation.
In this normal operating condition, the proposed framework operated primarily in Stage 1 (Radial Network Reconfiguration), successfully identifying cost-optimal switching actions while maintaining radial topology throughout the 24 h period. Stage 2 (Mesh Network Reconfiguration) was not activated, as no congestion was detected. All switching operations passed Stage 3 (Safe Switching Sequence Search) validation, confirming that the topology transitions could be executed without transient violations. This case demonstrates the framework’s ability to optimize operational costs under normal conditions using only radial reconfiguration, which represents the typical operational mode preferred by DSO.
5.2. Case 2: Overvoltage
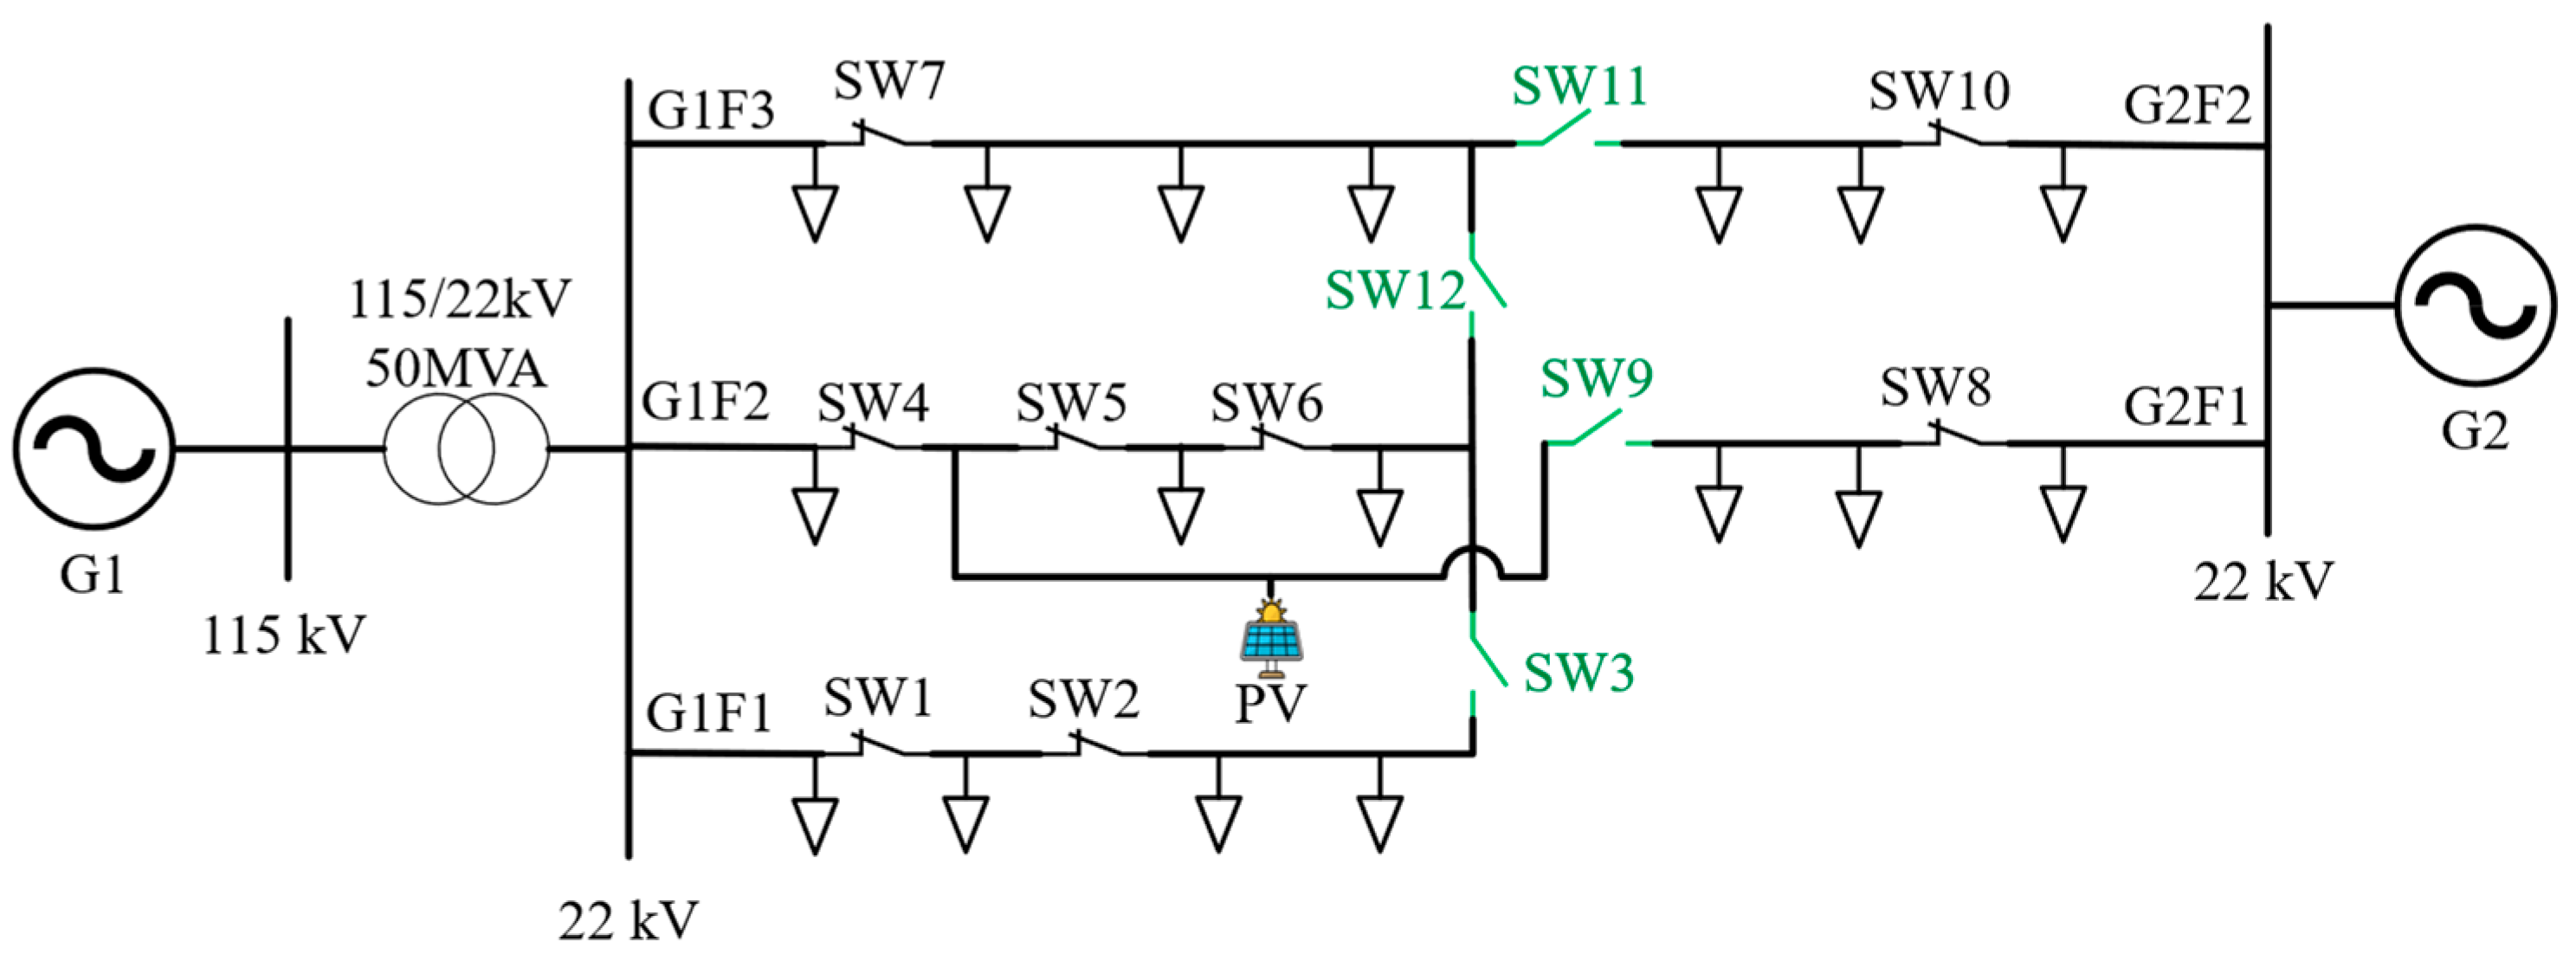
This case considers the performance of the proposed operational framework under overvoltage conditions in the distribution network. A 10 MW photovoltaic (PV) system was integrated into feeder G1F2, in the SW4–SW9 section, as illustrated in
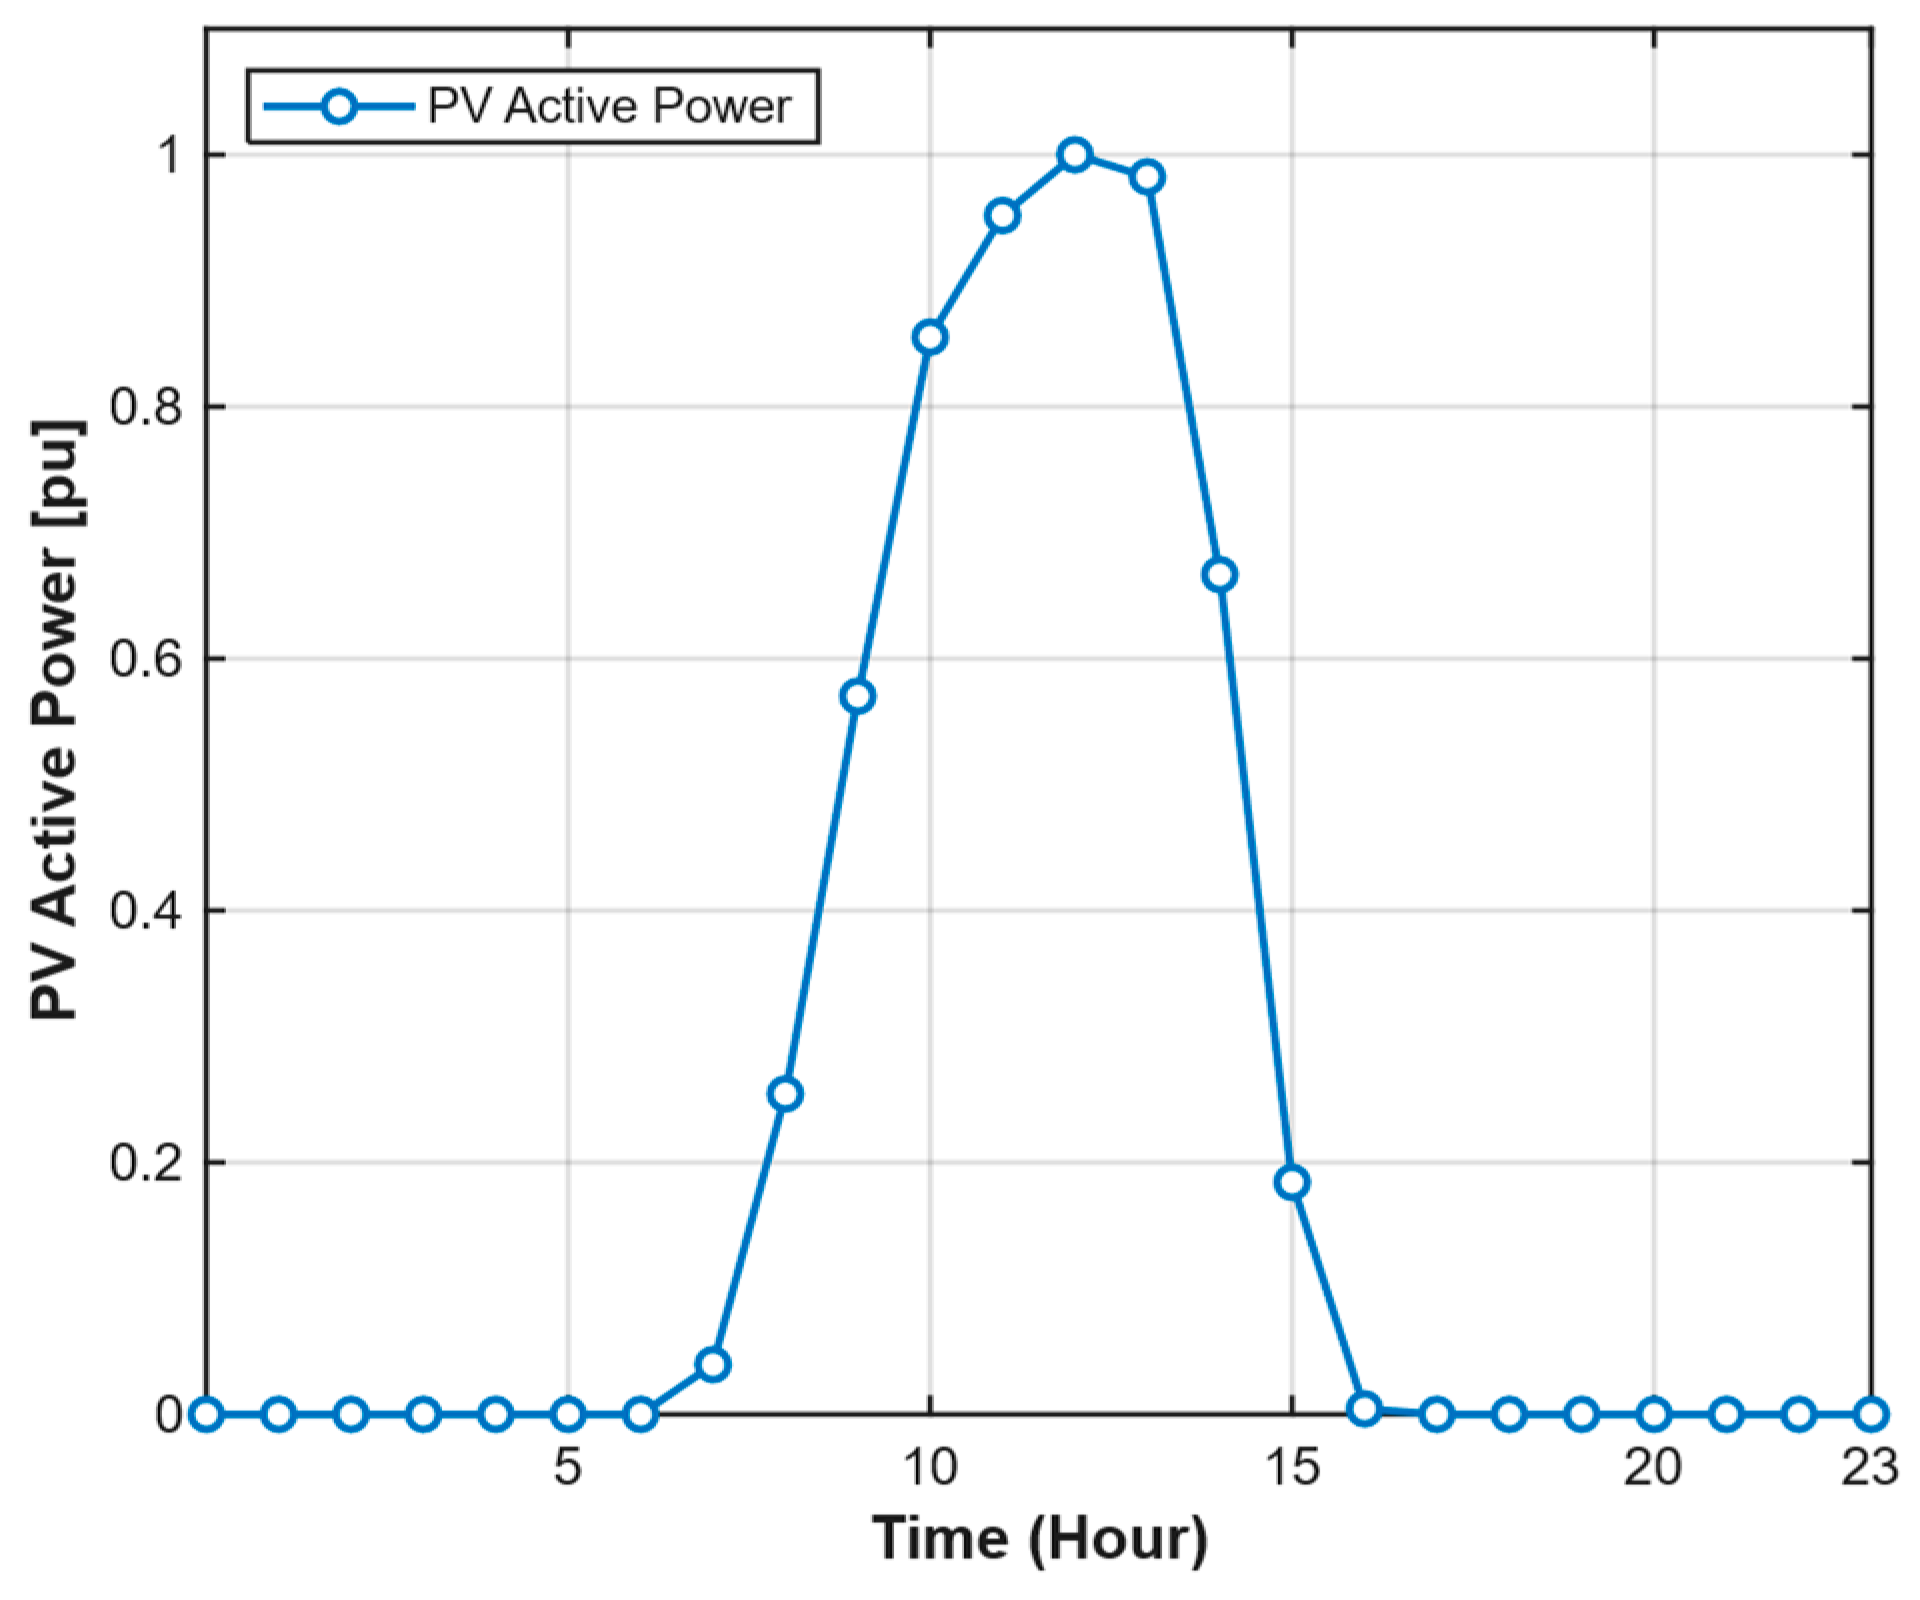
Figure 9. The PV generation profile shown in
Figure 10 reaches its maximum output at midday, corresponding to the typical high-solar-irradiation period.
The optimization switching results, shown in
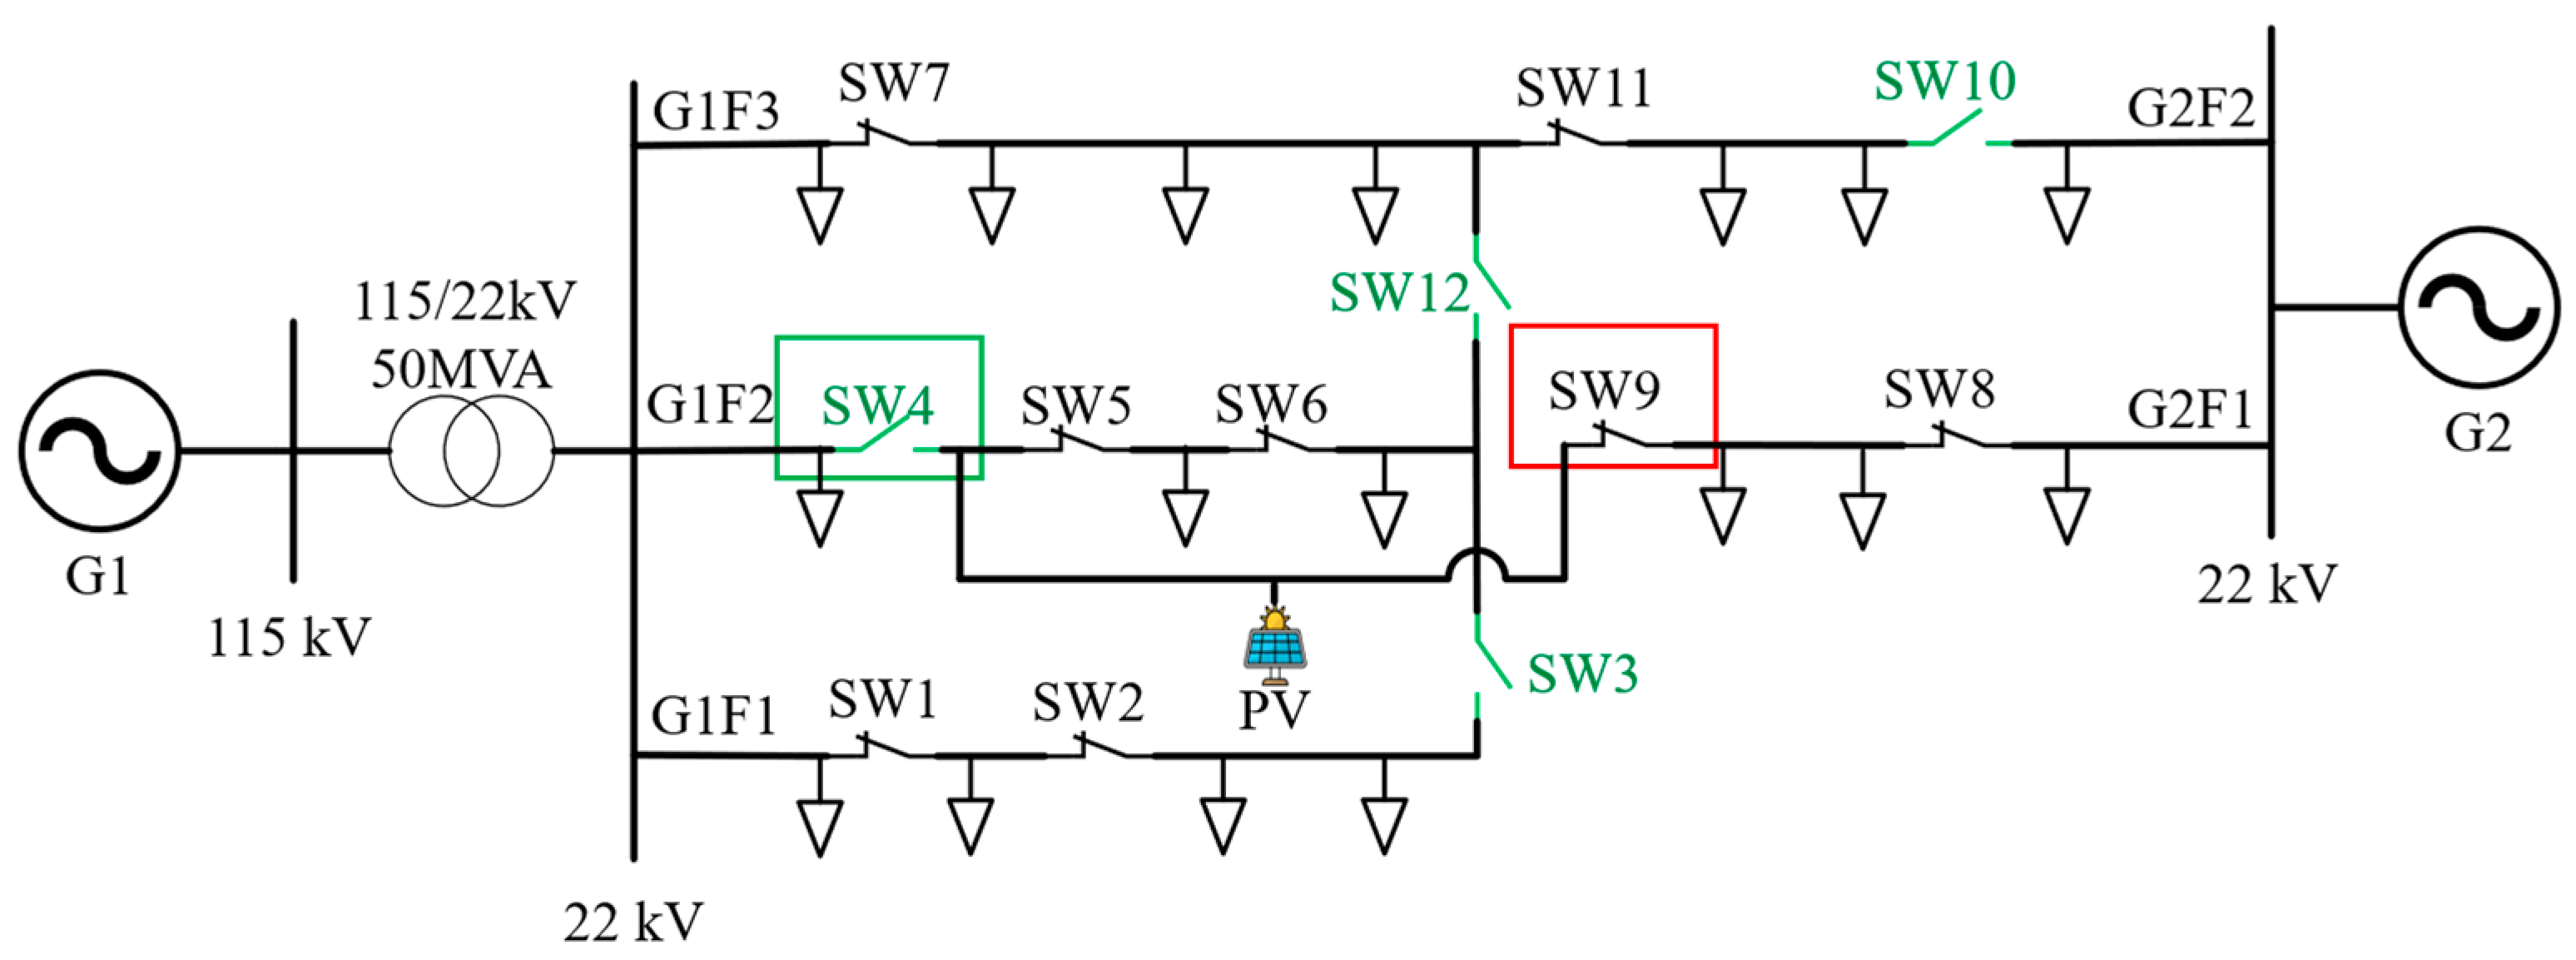
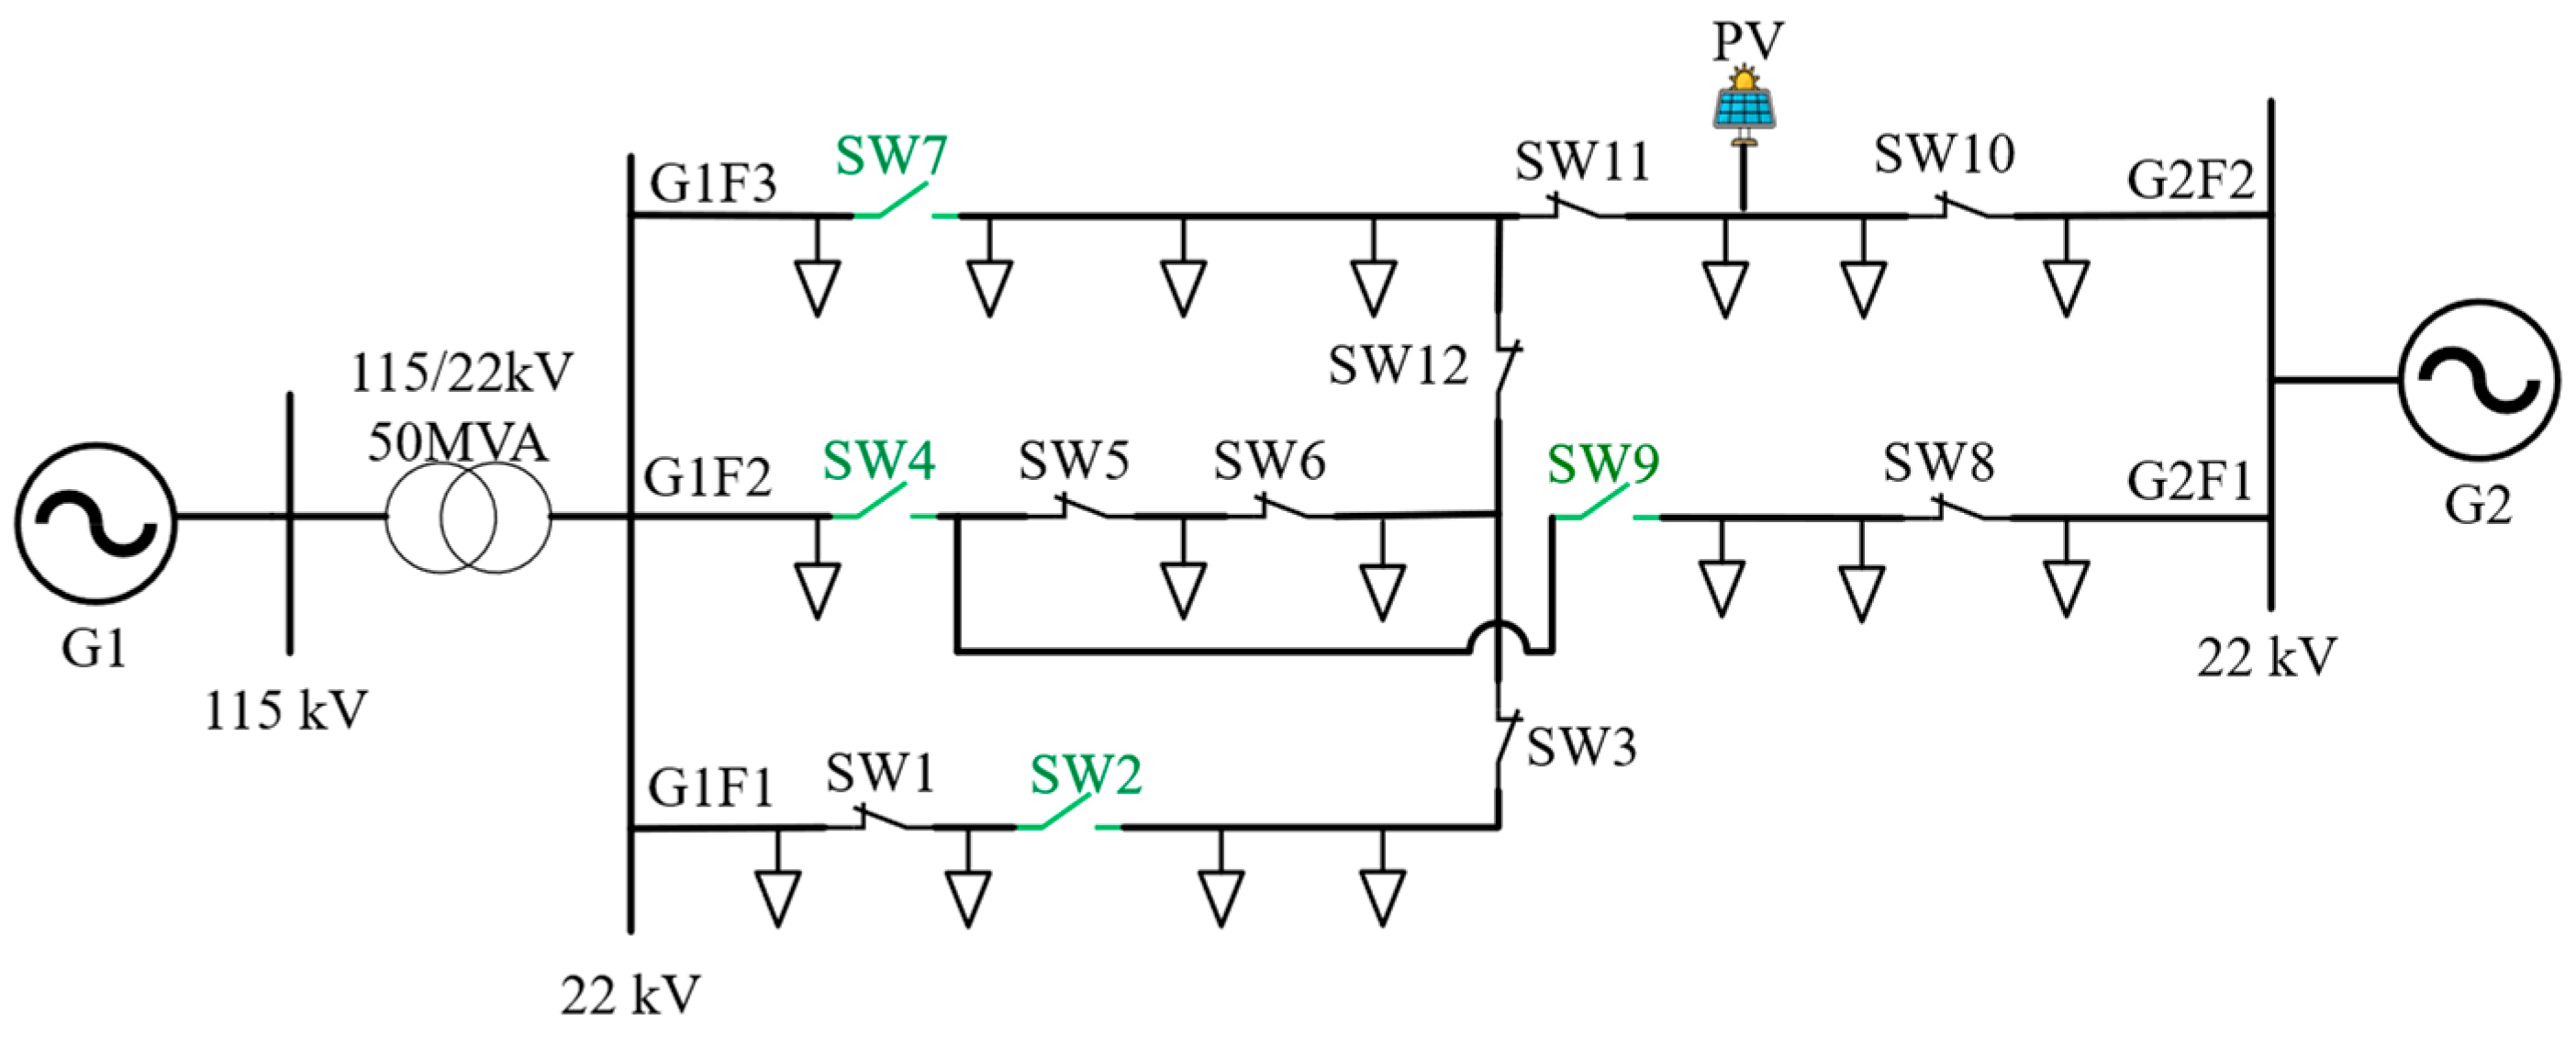
Table 10, reveal three reconfiguration events during the day. The first event occurred at 09:00 a.m., when SW11 was closed, and SW10 was opened. This switching action effectively reduced imported energy costs by shifting the energy source from substation G2 to G1, leveraging the difference in time-of-use (TOU) electricity pricing between the substations, while maintaining voltages and loadings within acceptable limits. At 10:00 a.m., the second reconfiguration involved closing SW9 and opening SW4, as illustrated in
Figure 11. In this operation, the PV generation was transferred from feeder G1F2 to G2F1, improving power balance since G2F1 had a higher load demand. The topology change was effectively used to prevent local overvoltage during peak PV output periods.
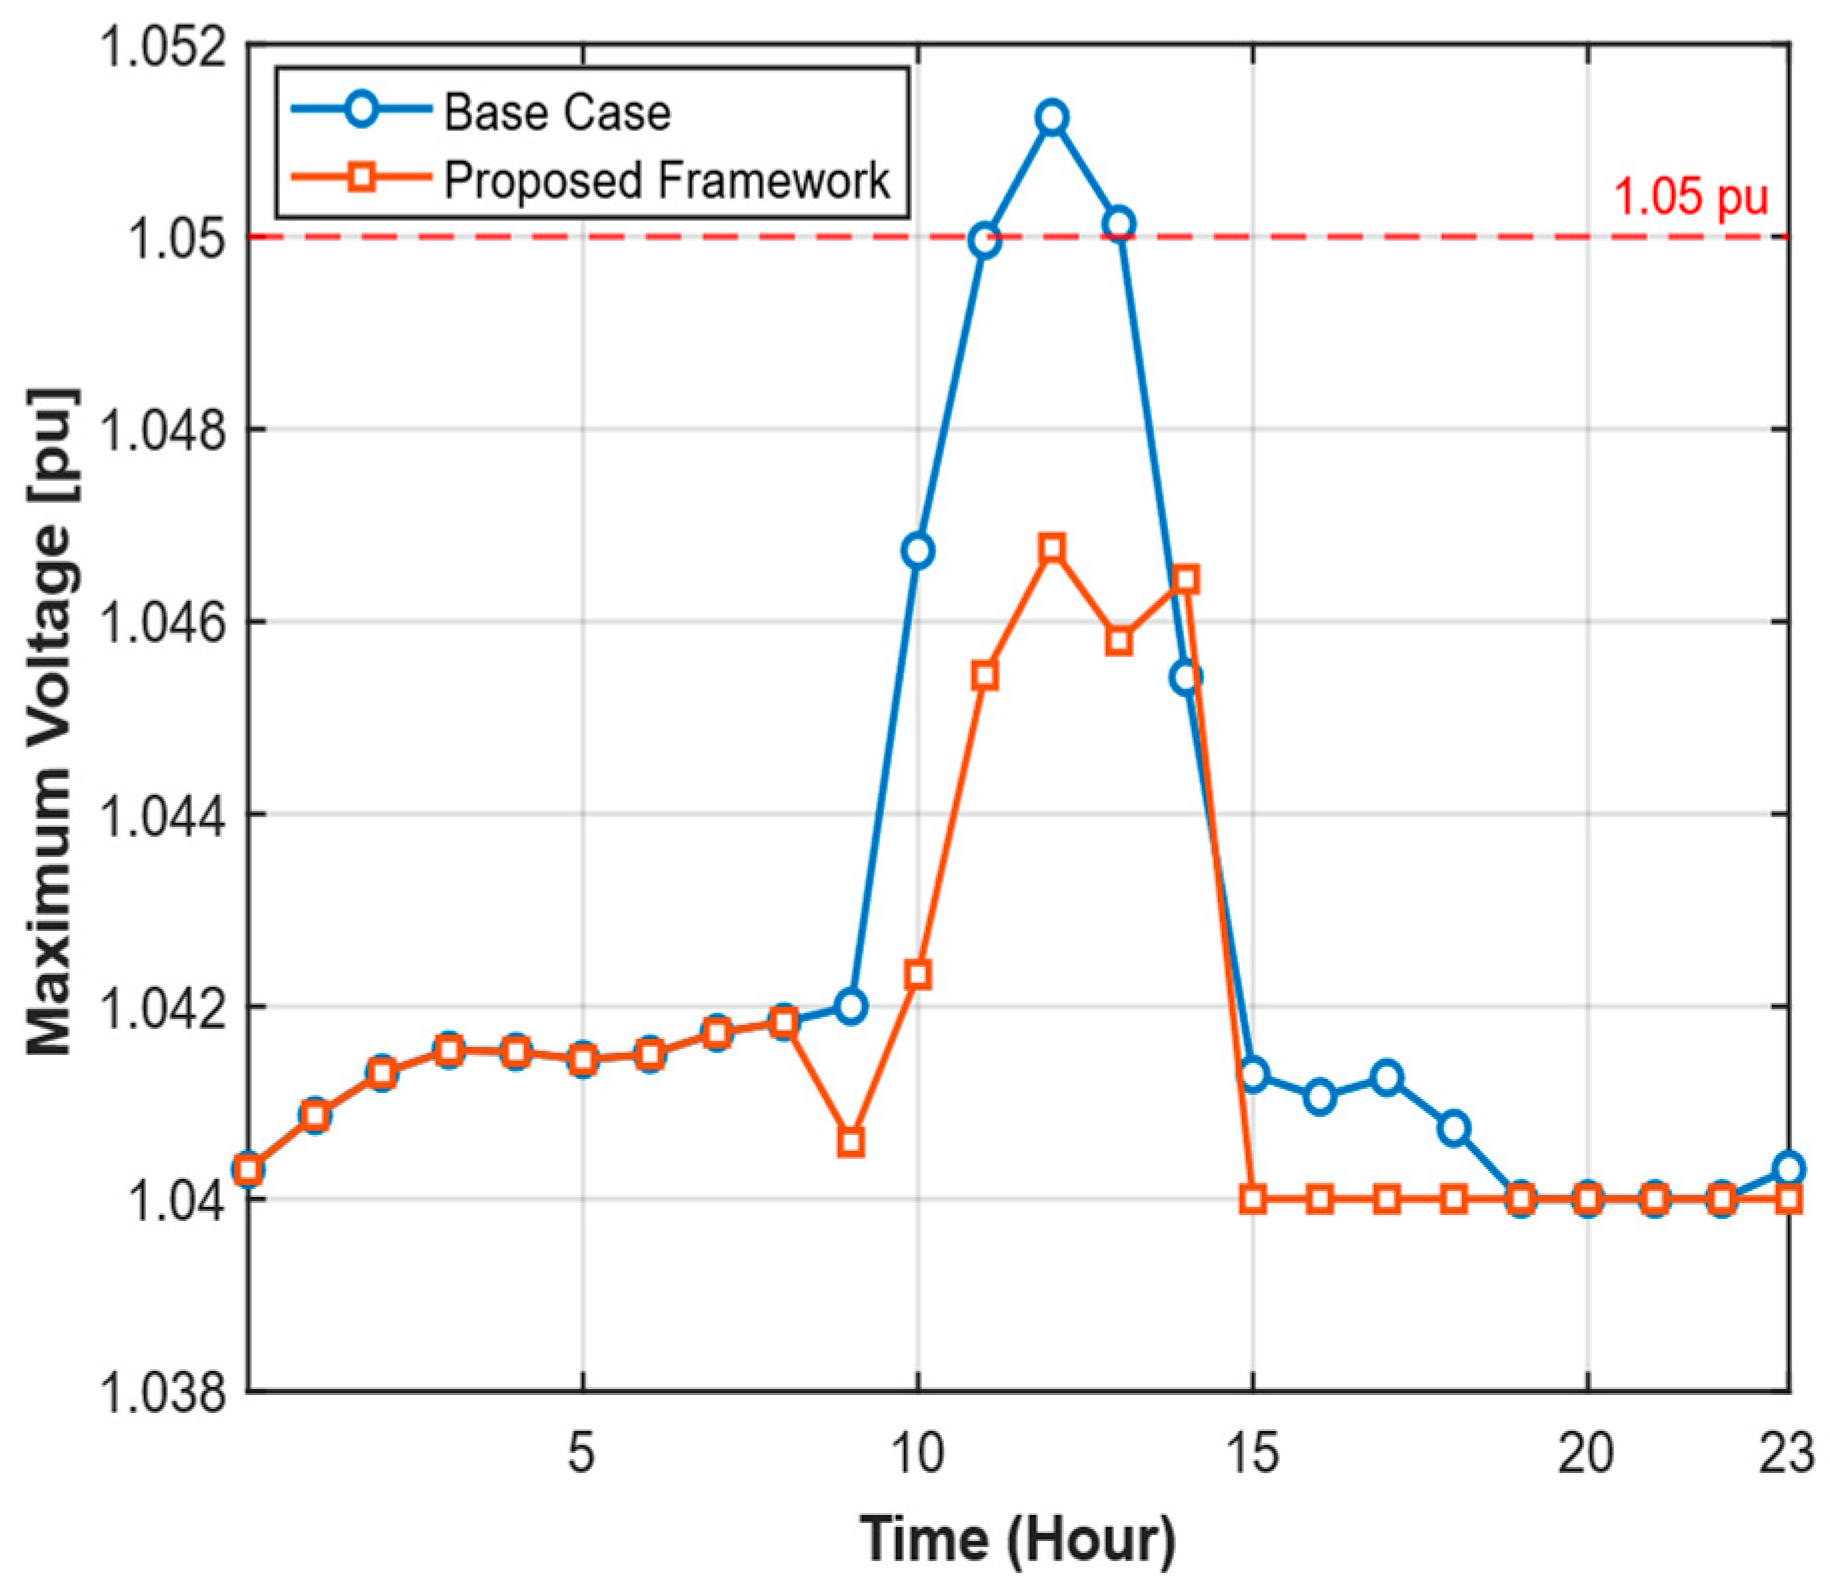
Figure 12 compares the maximum voltage profiles of the base and optimized configurations. In the base case, the maximum bus voltage rose to 1.051 p.u. around noon due to high PV generation, exceeding the 1.05 p.u. upper voltage limit. After the proposed BPSO-based reconfiguration, the voltage peak was reduced to 1.046 p.u., restoring compliance with operational limits and maintaining voltage stability across the network. This demonstrates the framework’s ability to dynamically adjust feeder connections to prevent overvoltage while preserving radial topology. The final reconfiguration occurred at 2:00 p.m., when SW12 was closed, and SW5 was opened. This switching sequence further optimized the operational cost while maintaining secure operating conditions. All switching operations were verified to preserve radiality and ensure safe operational transitions within the network. The optimized configuration achieved a cost reduction of USD 701.26 (2.37%), lowering total operating cost to USD 28,779.17. This economic gain resulted primarily from import reallocation, where energy was drawn preferentially from the lower-priced substation G1 during peak TOU periods.
Although the total energy losses increased slightly from 4.51 MWh to 5.01 MWh (+11.08%) due to extended power transfer paths, the clear economic benefit thereby obtained far outweighed this minor drawback. Additionally, maximum feeder loading decreased from 57.21% to 47.42% (−9.79%), thereby reducing thermal stress and enhancing network reliability. The minimum voltage remained within limits at 0.973 p.u., ensuring overall system stability.
The results in
Table 11 confirm that the proposed framework effectively mitigates overvoltage caused by high PV penetration while minimizing operating costs and preserving the distribution network’s radial topology. Overall, the proposed approach enhances both the technical robustness and economic efficiency of the network.
This overvoltage case utilized Stage 1 (Radial Network Reconfiguration) to address voltage violations caused by high PV penetration. The BPSO algorithm successfully identified three reconfiguration events that maintained radial topology while transferring PV generation to feeders with higher load demand, thereby preventing local overvoltage conditions. The framework did not require activation of Stage 2 (Mesh Network Reconfiguration), demonstrating that radial reconfiguration alone was sufficient to mitigate overvoltage congestion when appropriate load transfer paths were available. All switching sequences were validated through Stage 3 (Safe Switching Sequence Search), ensuring no transient overvoltage occurred during topology transitions.
5.3. Case 3: Undervoltage
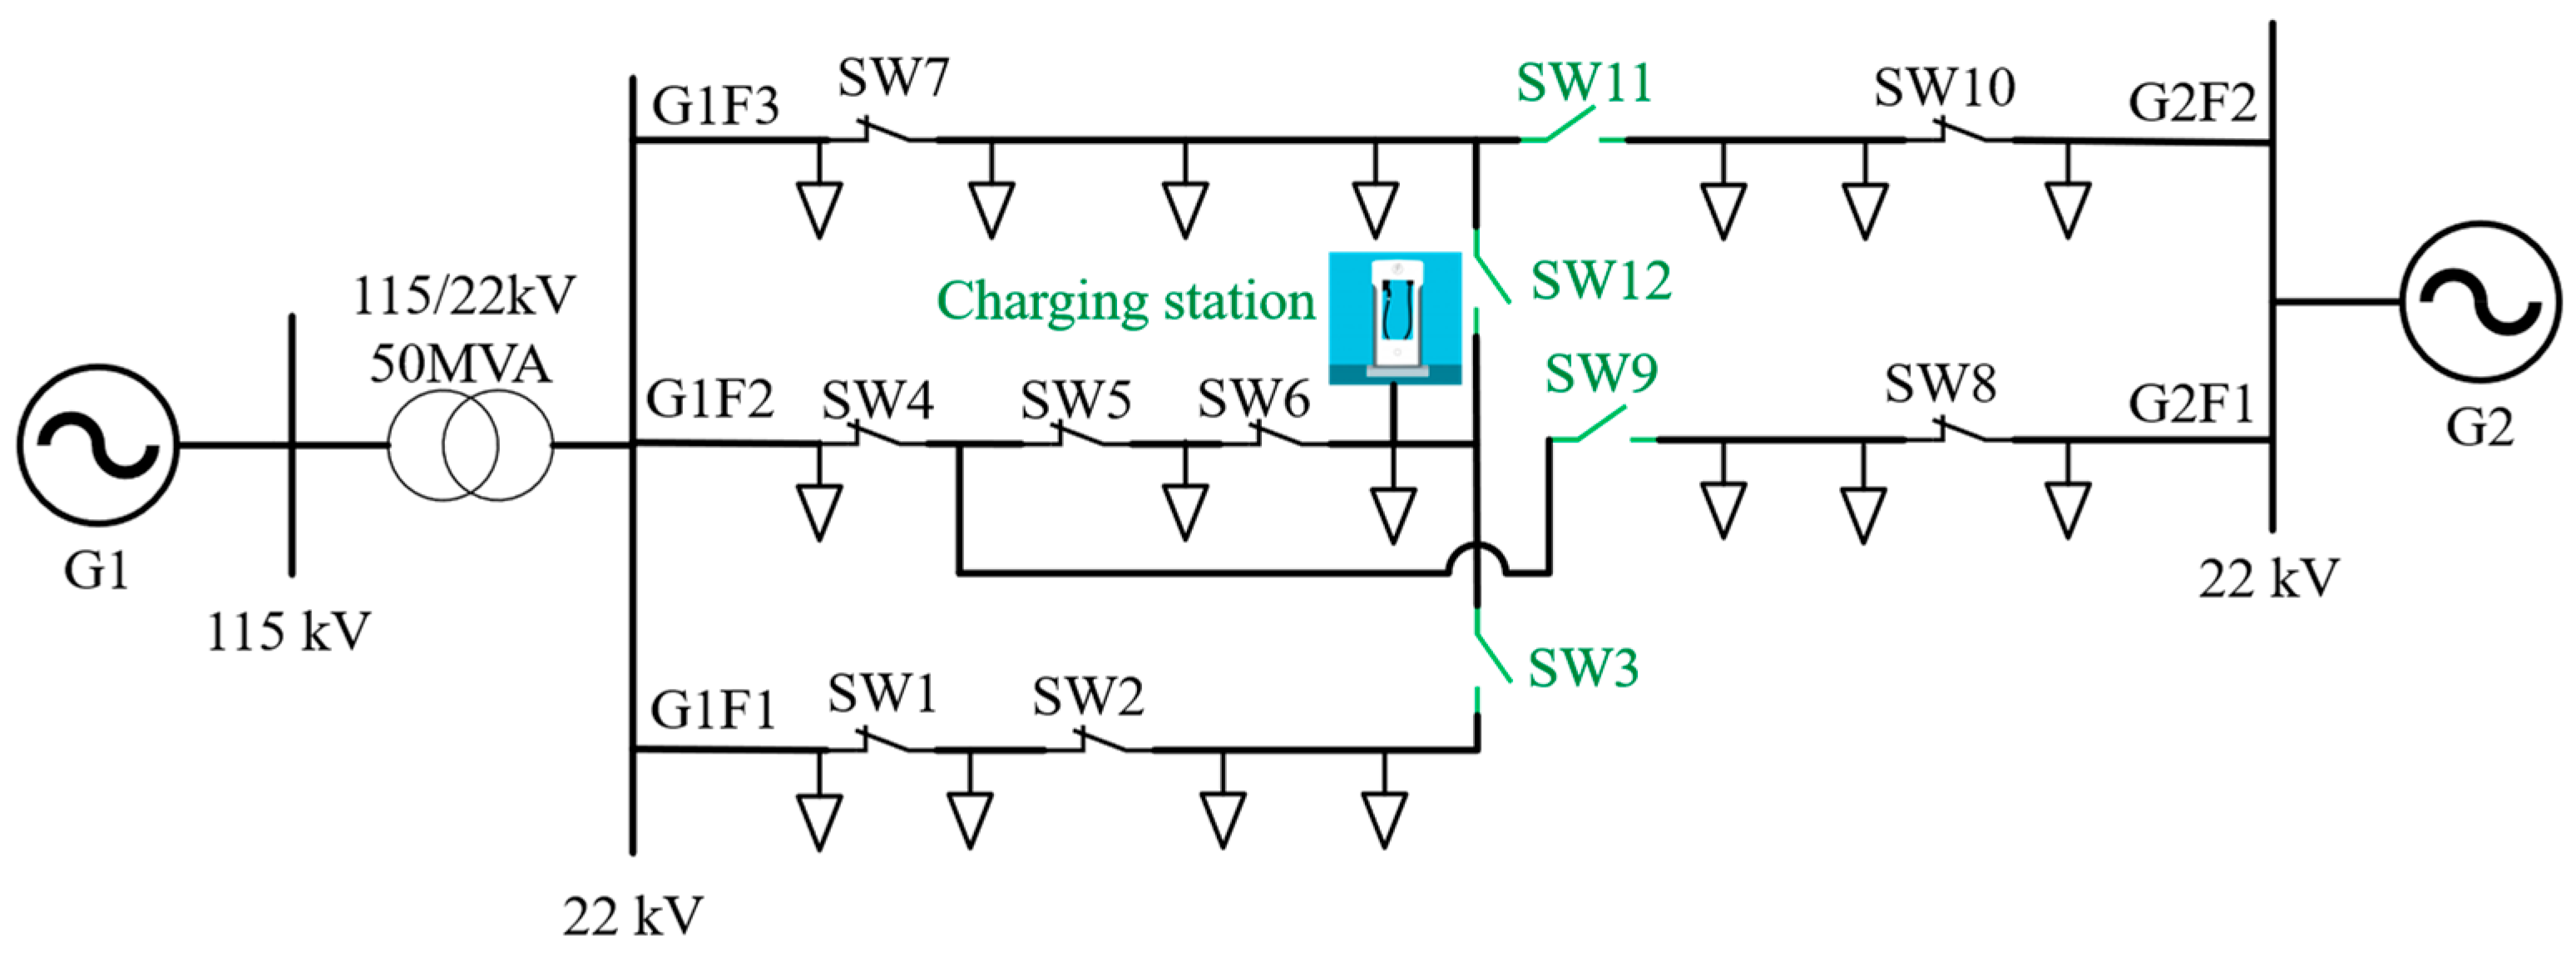
This case investigates the effectiveness of the proposed operational framework in mitigating undervoltage conditions arising from high evening load demand. A 6.5 MW load with a power factor of 0.8, representing a large-scale electric vehicle (EV) charging station, was connected to feeder G1F2 in the SW6–SW3–SW12 section, as shown in
Figure 13.
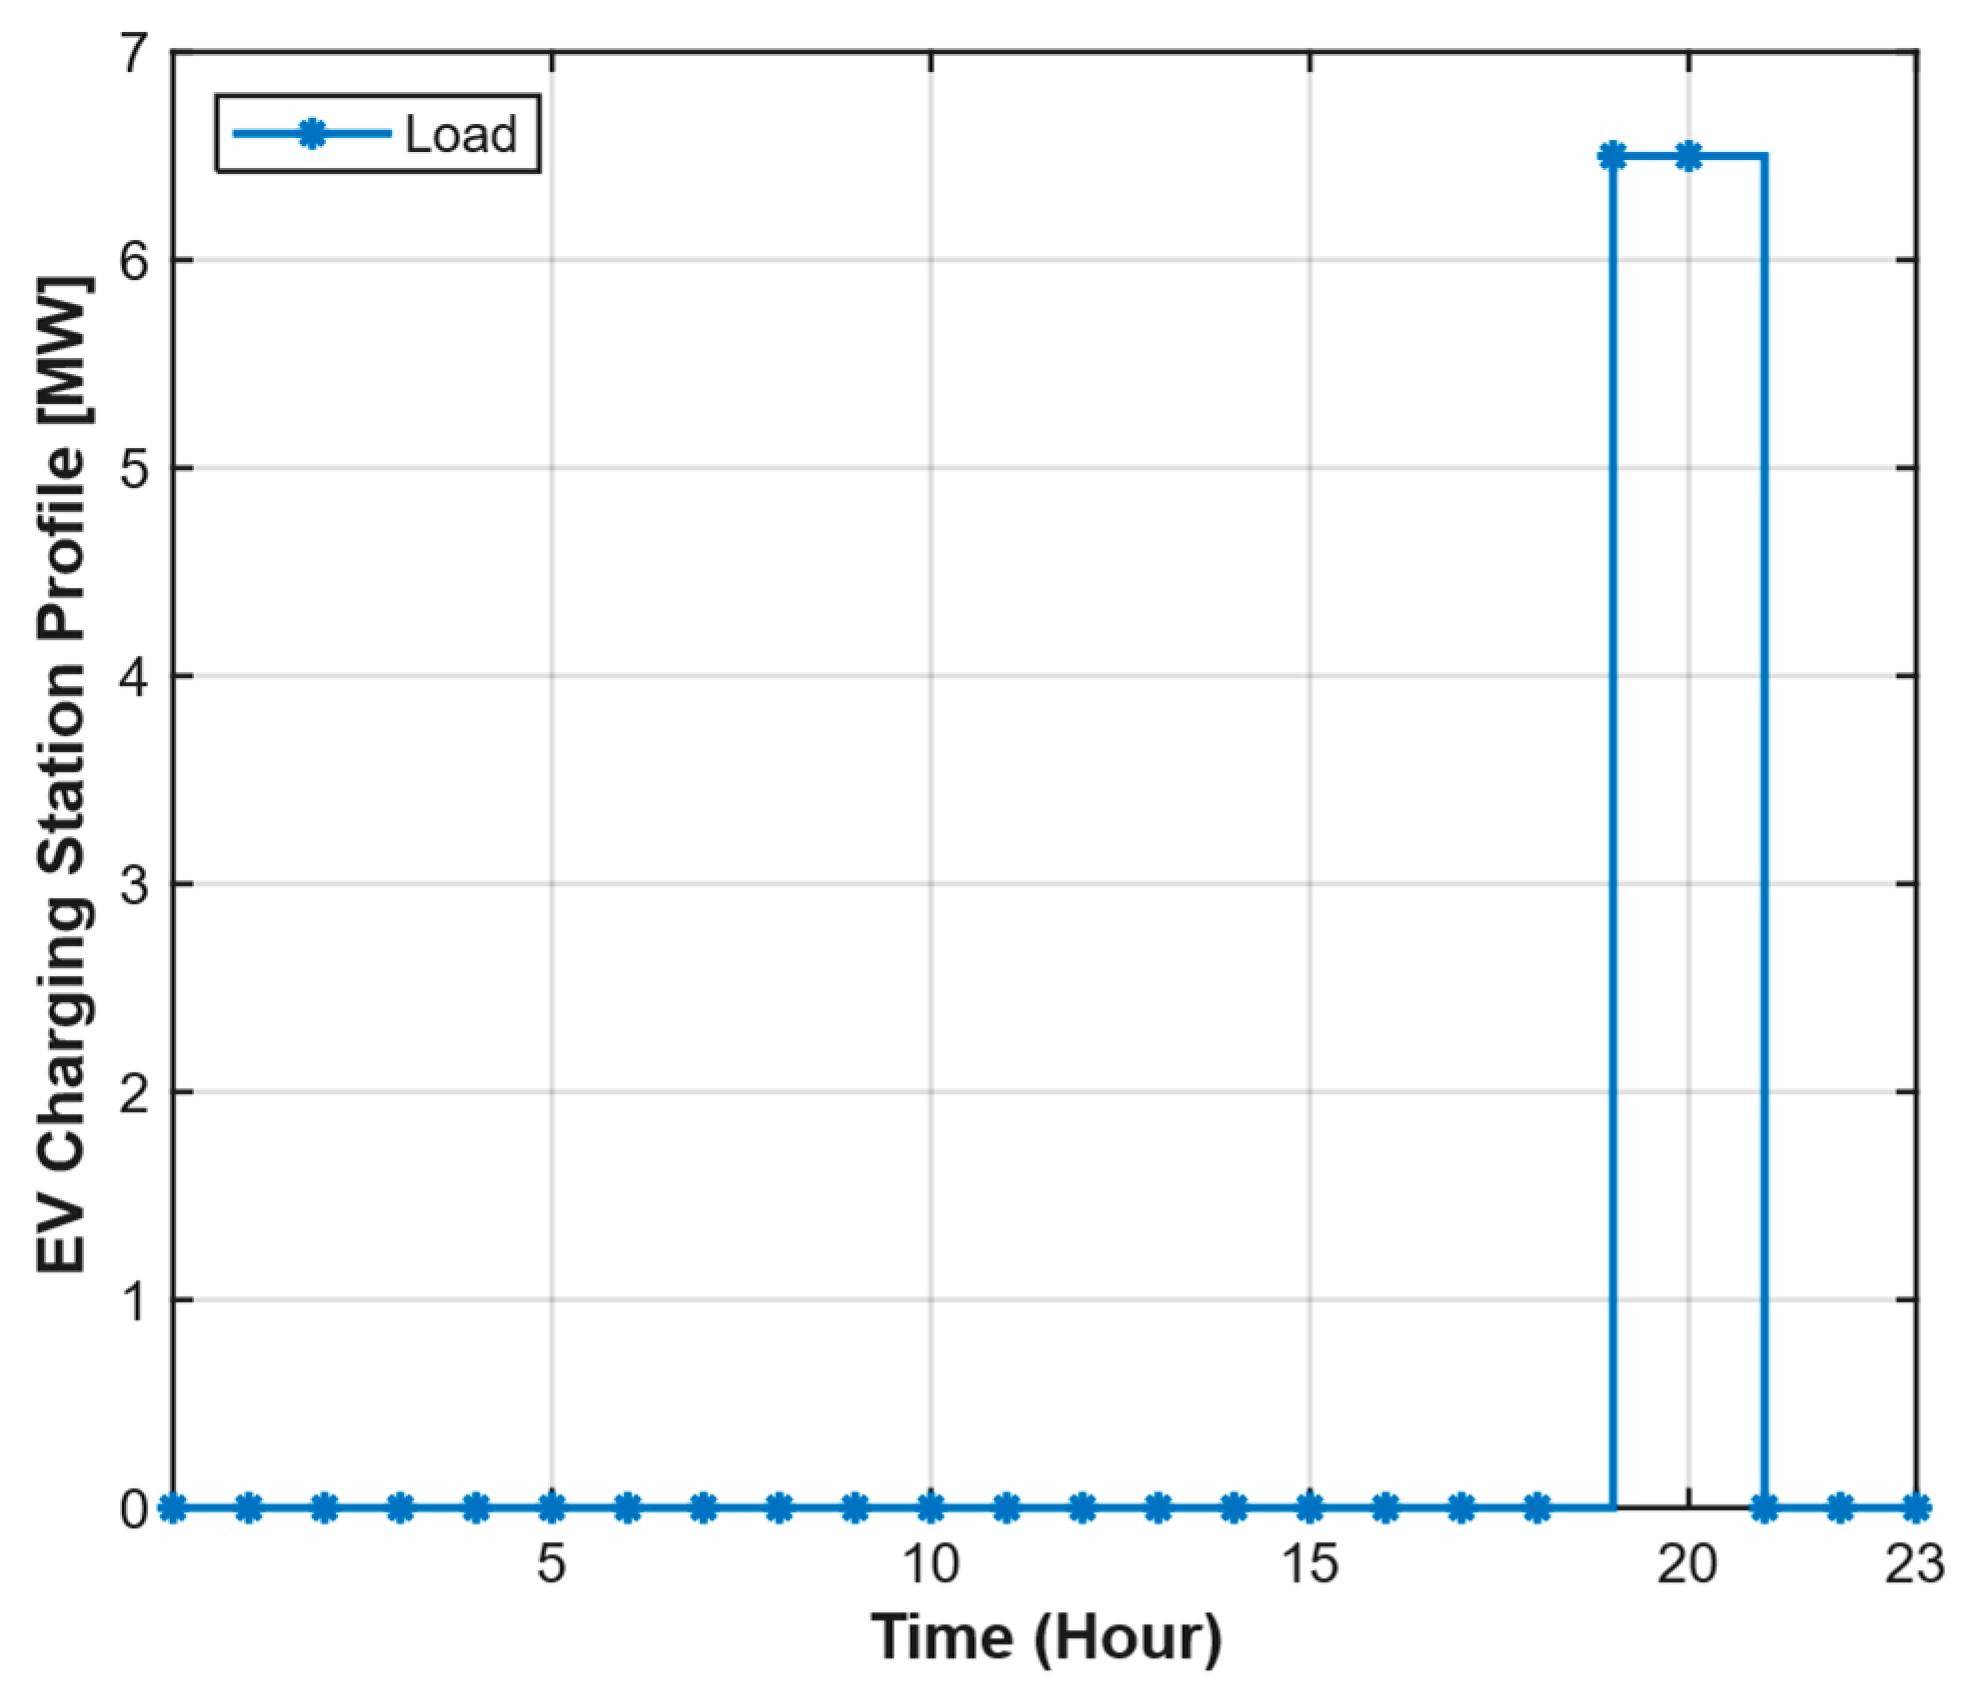
The corresponding load profile (
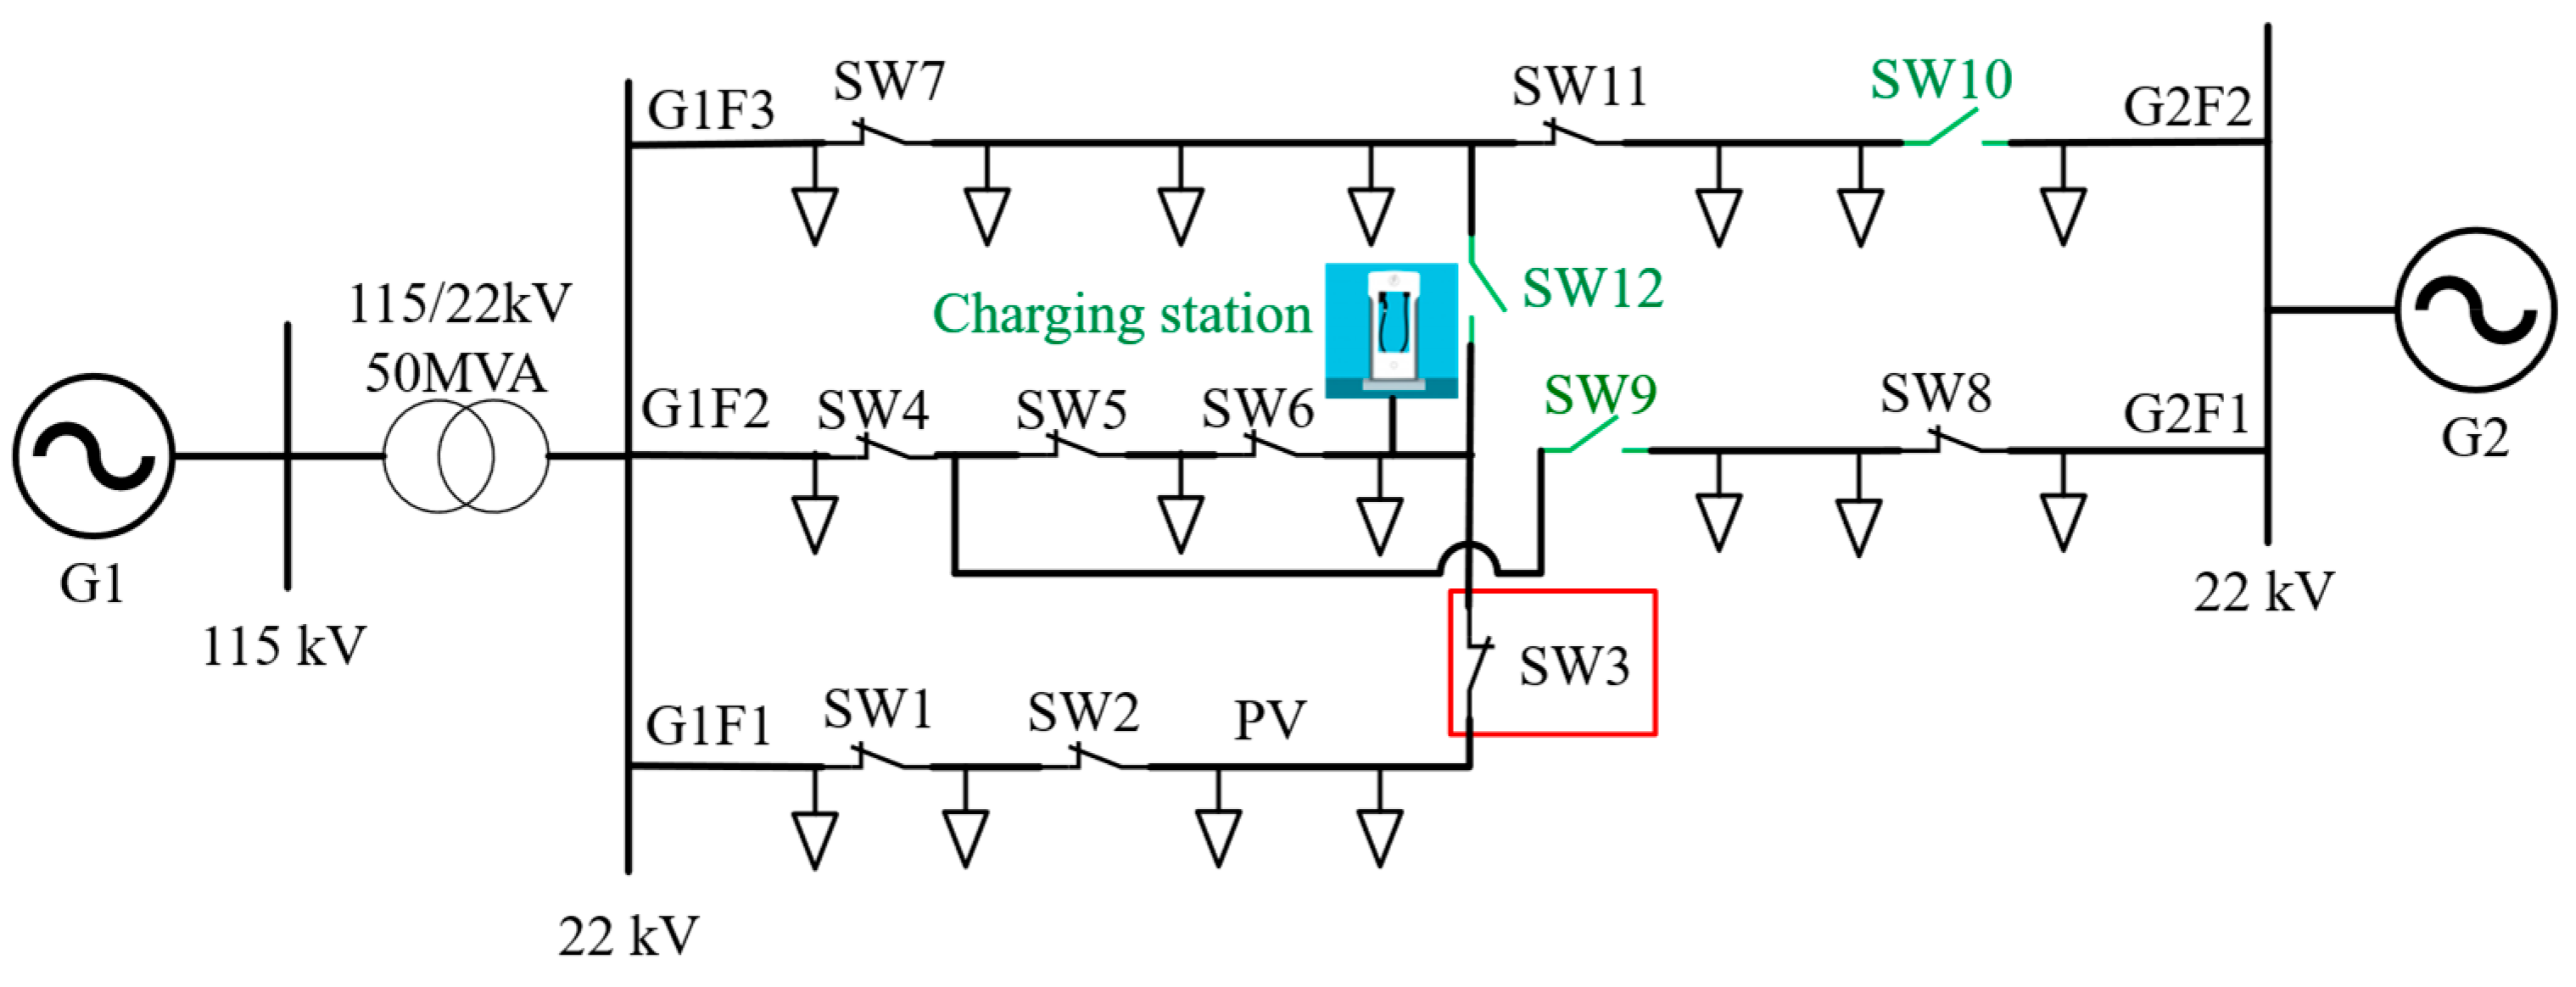
Figure 14) shows a sharp increase in power demand to 6.5 MW during the evening hours (19:00–20:00), leading to significant voltage drops across the feeder. To maintain the voltage within acceptable limits, the proposed framework executed an adaptive radial–mesh reconfiguration sequence. At 09:00 a.m., the framework initiated a cost-oriented switching action by closing SW11 and opening SW10, thereby transferring the import source from substation G2 to the lower-cost substation G1, while maintaining radial operation. During the evening peak (19:00–20:00), SW3 was closed to form a temporary meshed topology between feeders G1F1 and G1F2, as illustrated in
Figure 15, enabling real-time voltage support and current sharing under heavy load conditions. Once the undervoltage event subsided, SW5 was opened at 21:00, restoring the network to a radial configuration.
The complete switching sequence applied in this case is summarized in
Table 12. All switching operations were validated using the safe-switching-sequencing logic embedded in the proposed framework, ensuring that no infeasible or unsafe transitions occurred during the process. As a result, the system maintained continuous, secure power delivery throughout the event without compromising network integrity or violating operational constraints.
However, at 20:00, although the optimization stage identified a target configuration (Close SW10, Open SW11), the safe switching sequence validation (Stage 3) determined that no feasible intermediate switching sequence could satisfy all operational constraints. Consequently, this transition was rejected, and the system remained in the meshed configuration. This outcome further highlights the critical role of Stage 3 in actively preventing unsafe or infeasible topology transitions, rather than merely providing a binary validation result.
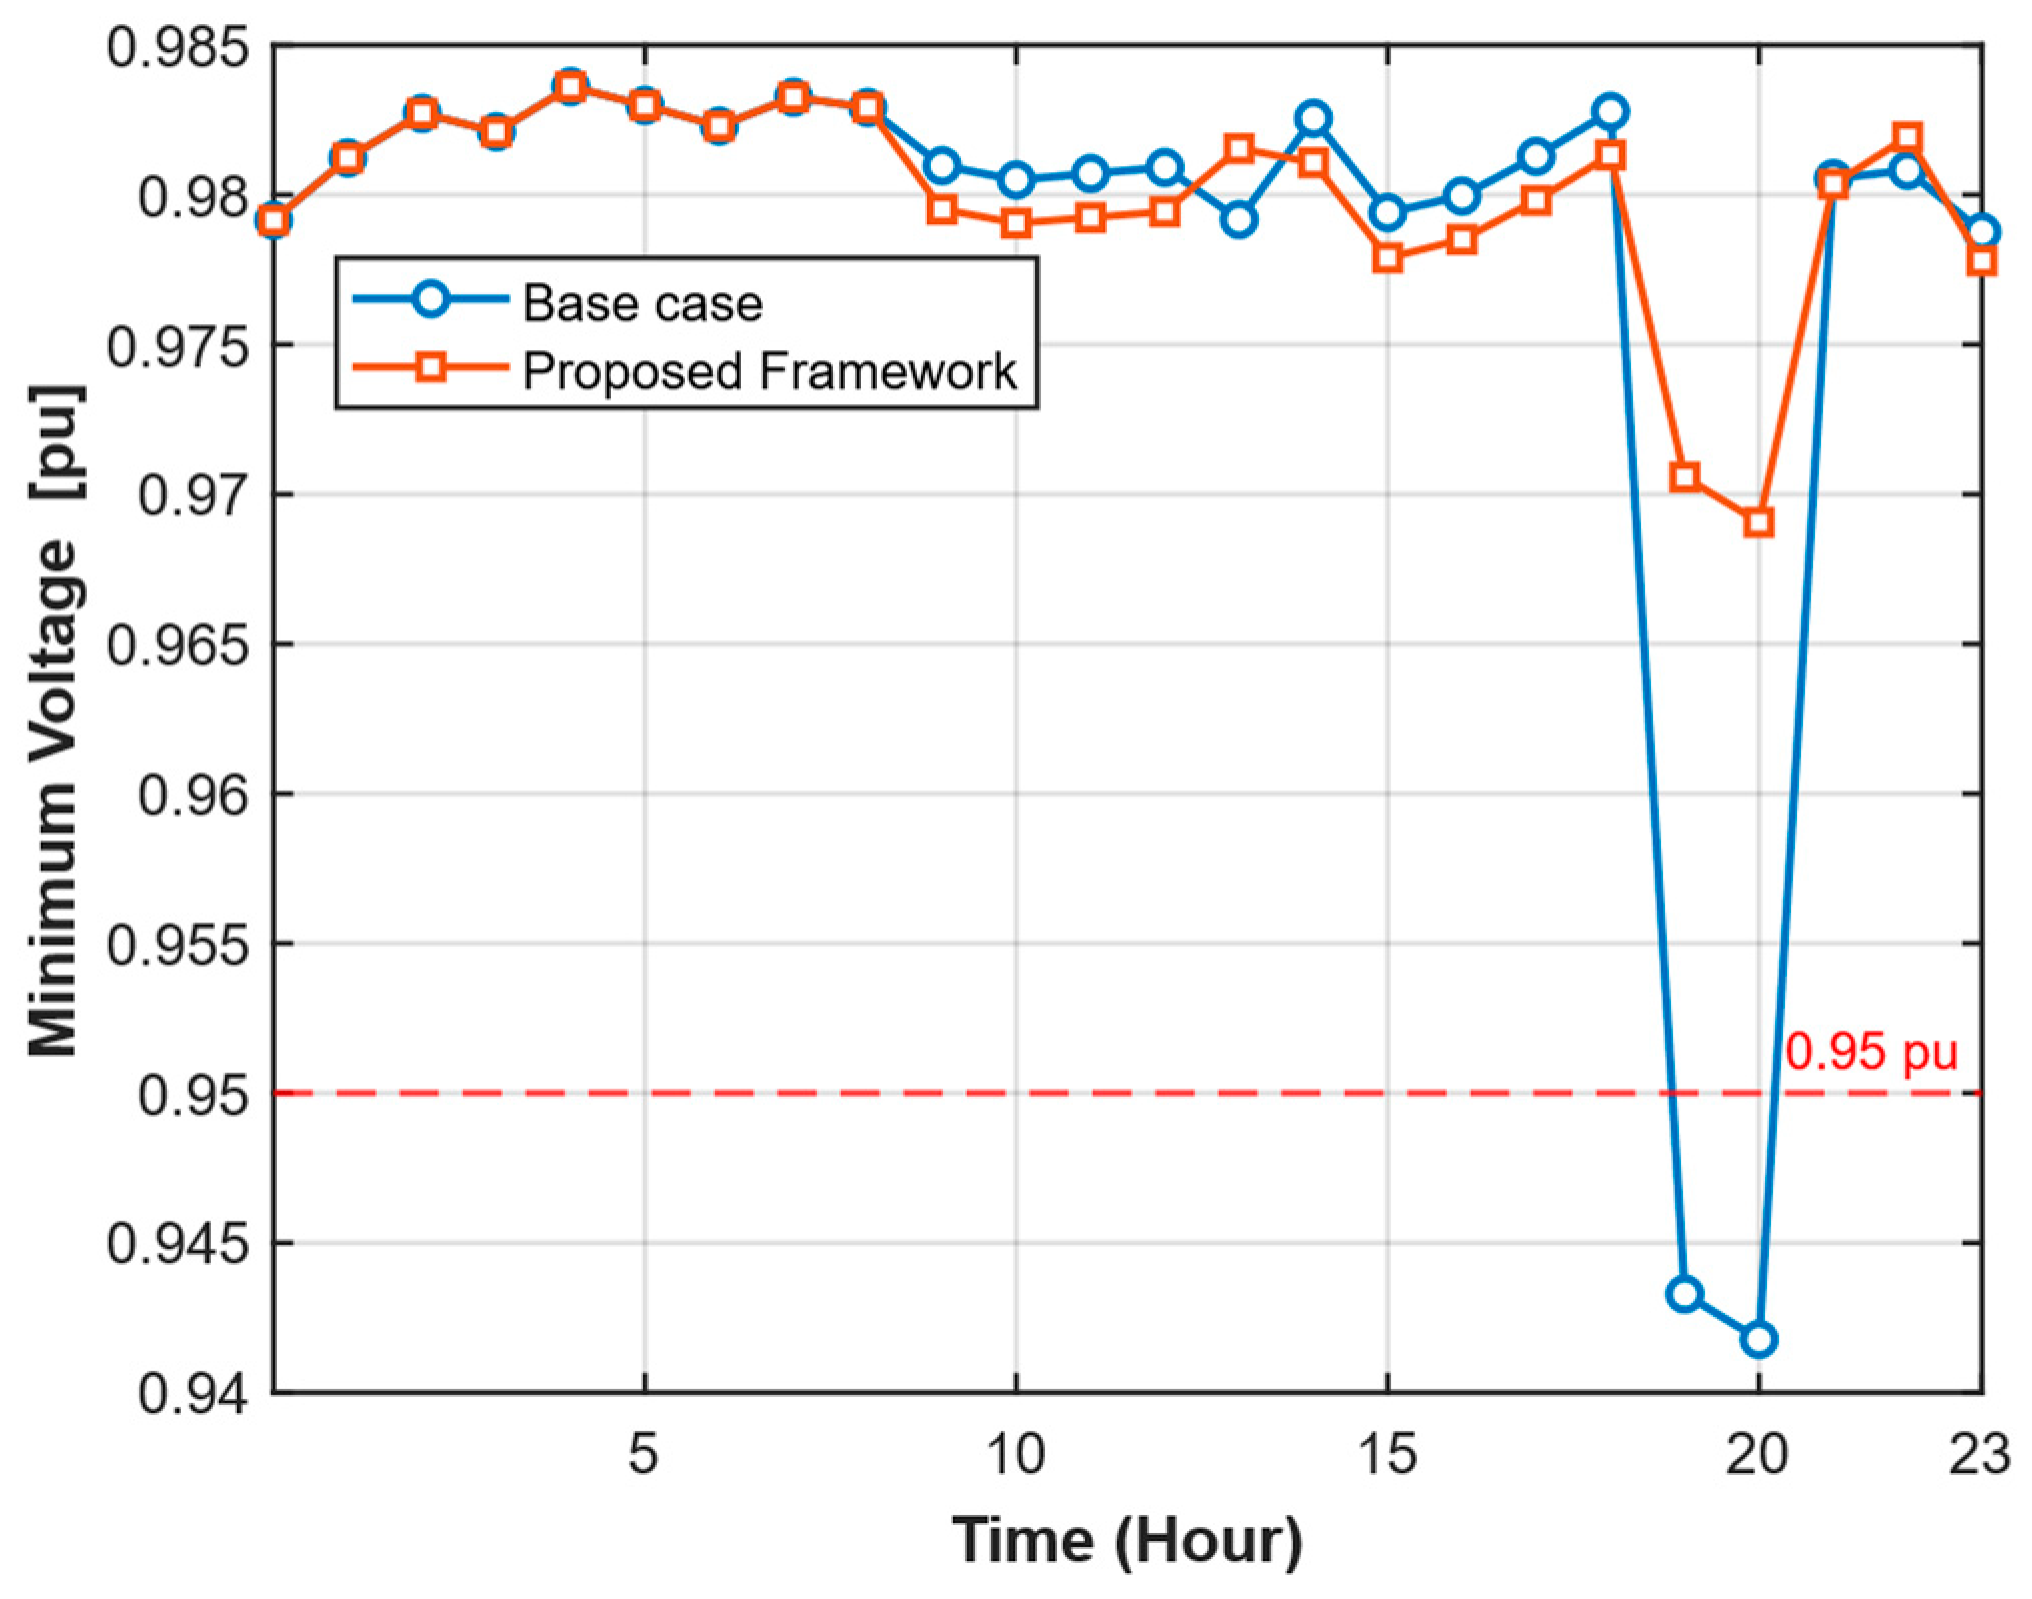
Figure 16 illustrates the improved voltage performance. It compares the minimum-voltage profiles of the base case and the optimized configurations. In the base case configuration, the voltage dropped to 0.94 p.u. This drop occurred during the evening peak. This violated the 0.95 p.u. lower bound. The minimum voltage improved to 0.97 p.u. after optimization. This improvement effectively eliminated undervoltage violations.
The quantitative results presented in
Table 13 further confirm the technical and economic benefits of the proposed strategy. The total operational cost decreased from USD 33,915.86 in the base case to USD 33,381.75 after optimization. This shows a cost reduction of USD 534.11, which is equal to a 1.57% decrease. While this reduction is moderate, the technical improvements are substantial. The minimum bus voltage increased by 0.03 p.u., and the maximum feeder loading decreased from 74.61% to 64.01%, representing a 14.21% improvement and indicating more balanced current sharing among feeders. The total active power losses decreased from 5.66 MWh to 5.37 MWh, which represents a 5.13% reduction achieved by the algorithm. The optimized configuration maintained all node voltages above 0.95 p.u. throughout the day, demonstrating that the proposed framework effectively alleviates undervoltage conditions.
This undervoltage case represents the first scenario requiring the complete three-stage framework. Stage 1 (Radial Network Reconfiguration) was initially applied, but could not fully resolve the severe voltage drop caused by the 6.5 MW EV charging station while maintaining radial topology. Consequently, the framework automatically transitioned to Stage 2 (Mesh Network Reconfiguration), temporarily closing SW3 to create a meshed topology between feeders G1F1 and G1F2 during the evening peak (19:00–20:00). This temporary mesh operation enabled current sharing and voltage support under heavy loading conditions. Once the undervoltage event subsided, the framework restored radial operation at 21:00. Critically, all topology transitions, including both radial-to-mesh and mesh-to-radial transitions, were validated in Stage 3 (Safe Switching Sequence Search) to ensure no customer outages or transient violations occurred during the reconfiguration. This case demonstrates the framework’s adaptive capability: Stage 1 handles normal conditions, Stage 2 provides mesh reinforcement when radial solutions are insufficient, and Stage 3 ensures practical implementability throughout.
5.4. Case 4: Overload and Reverse Power Flow
This case demonstrates the proposed optimization framework to address overload conditions and reverse power flow in the distribution network. An 11 MW photovoltaic (PV) system with voltage control capability was integrated into feeder G2F2, located between switches SW11 and SW10, as illustrated in
Figure 17. The PV generation profile, identical to that used in case 2, peaks at 11 MW at approximately 12:00 p.m.
During periods of high PV generation, excess PV active power from feeder G2F2 flows back toward substation G2, resulting in a reverse power flow condition that is undesirable as no power purchase agreement (PPA) is established for reverse energy export. Moreover, reverse power flow can negatively impact system stability and economic performance.
The optimized switching schedule, summarized in
Table 14, consists of four key reconfiguration events executed between 10:00 a.m. and 3:00 p.m. The reconfiguration sequence is designed to dynamically manage power flow and prevent reverse energy injection from feeder G2F2 during high PV generation periods.
The first three switching actions (at 10:00, 11:00, and 12:00) aim to increase the load demand on the PV-connected feeder G2F2, thereby using the excess generation and preventing reverse power flow toward substation G2. At 10:00 a.m., SW11 is closed, and SW7 is opened to modify the feeder interconnection, allowing additional load transfer into G2F2.
At 11:00 a.m., SW12 and SW3 are closed while SW2 and SW6 are opened to further extend the loading area of the PV feeder. A third adjustment at 12:00 p.m. involves closing SW6 and opening SW4 to optimize the network configuration for efficient PV power absorption. Finally, at 15:00, SW4 is closed, and SW11 is opened to reconfigure the network to a cost-optimal radial arrangement after PV output has substantially decreased, thereby minimizing operational cost under normal loading conditions. All switching actions were verified as safe and maintained radial operation throughout the optimization process.
During the PV-generation peak at 12:00 p.m., the optimized configuration (
Figure 18) allows feeder G2F2 to extend its service area, creating additional load demand that uses locally produced PV power. This strategy prevents reverse power injection to substation G2 while maintaining network voltage and thermal conditions within secure operating limits.
The results presented in
Table 15 show that the proposed framework is effective and has achieved its objective. The total operational cost decreased. The base case cost was USD 28,644.36. The optimized case cost was USD 26,015.14. This represents a 9.18% reduction. This improvement primarily results from eliminating reverse-power penalties at the G2 substation. It also comes from the enhanced utilization of PV generation within the distribution network.
As illustrated in
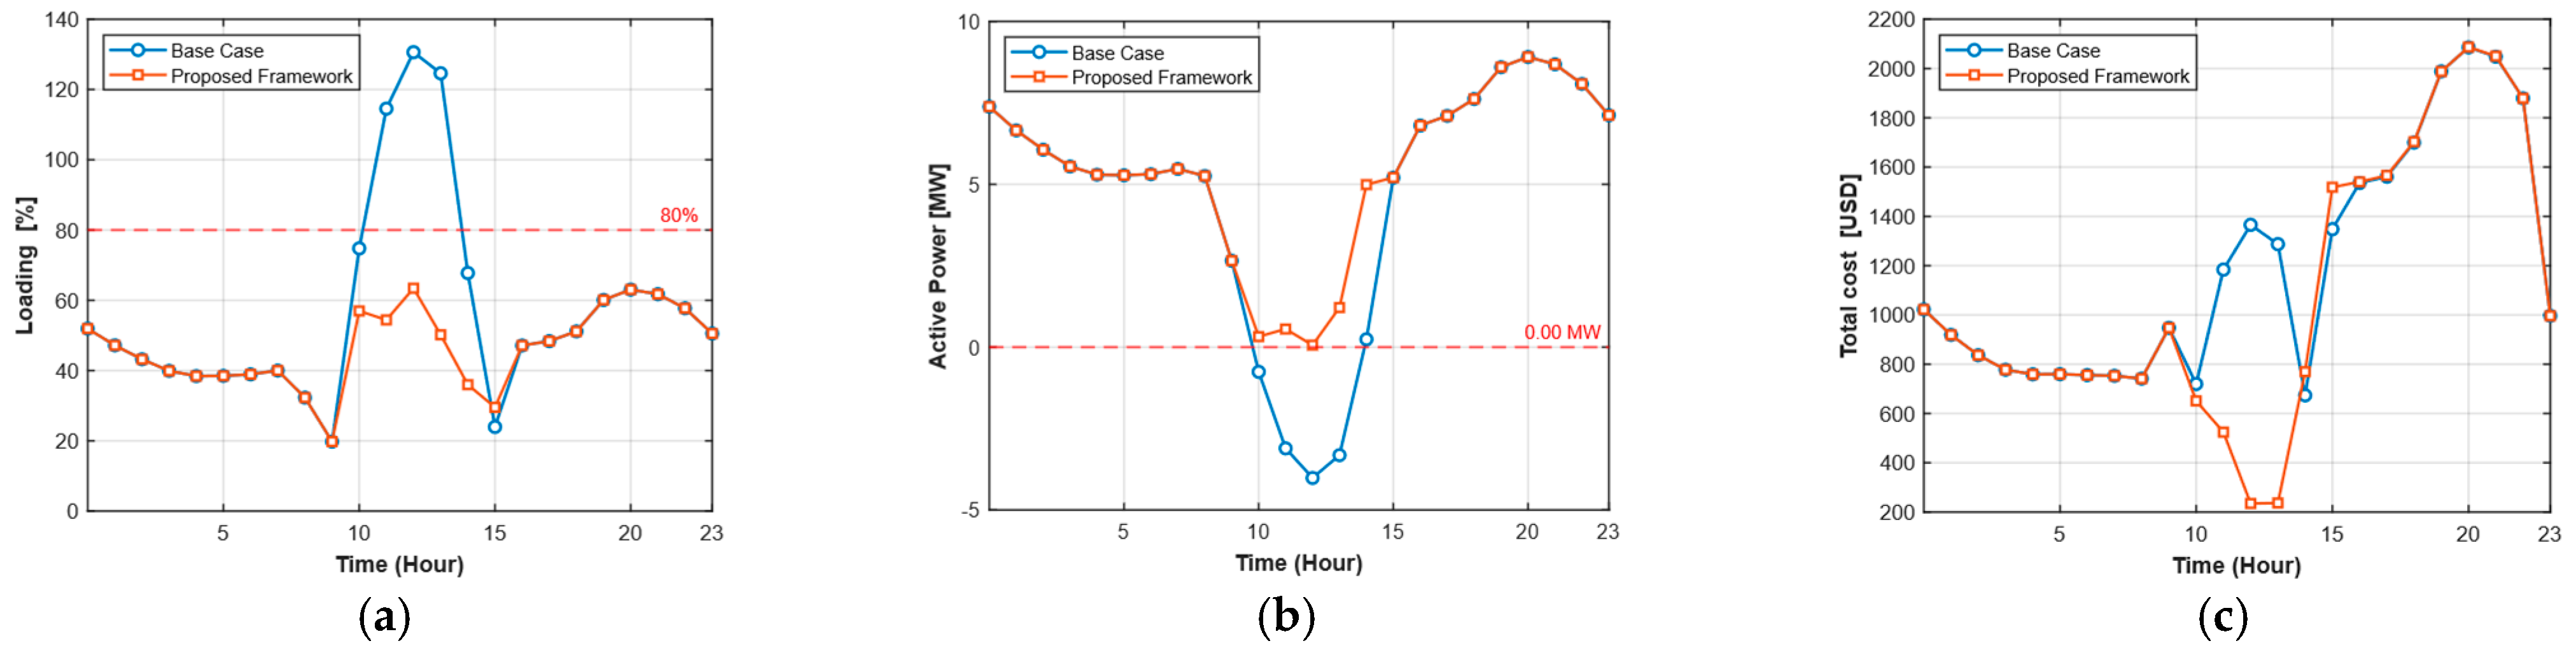
Figure 19a, the proposed framework reduced the maximum loading from 130.62% to 63.43%, ensuring compliance with thermal-loading limits. The comparison of import active power from substation G2, shown in
Figure 19b, reveals that the base case exhibited significant reverse flow from feeder G2F2 to substation G2, while the optimized network maintained unidirectional flow during all PV generation periods. Although total active power losses increased by 1.93% from 5.17 MWh to 5.27 MWh due to increased feeder utilization, this was more than offset by a 9.18% reduction in costs. A plot of the hourly operational costs in
Figure 19c shows that the optimized network achieved lower total operational costs during high-generation hours.
This overload and reverse power flow case demonstrates the framework’s advanced capabilities in Stage 1 radial optimization for managing complex congestion that involves both thermal constraints and economic penalties. Stage 2 (Mesh Network Reconfiguration) was not required, as the radial reconfiguration provided sufficient operational flexibility. This case illustrates that Stage 1 alone can address certain forms of severe congestion when the network has adequate tie-switch infrastructure for load transfer. In contrast, Stage 2 availability provides additional capacity when radial solutions are exhausted.
5.5. Sensitivity Analysis
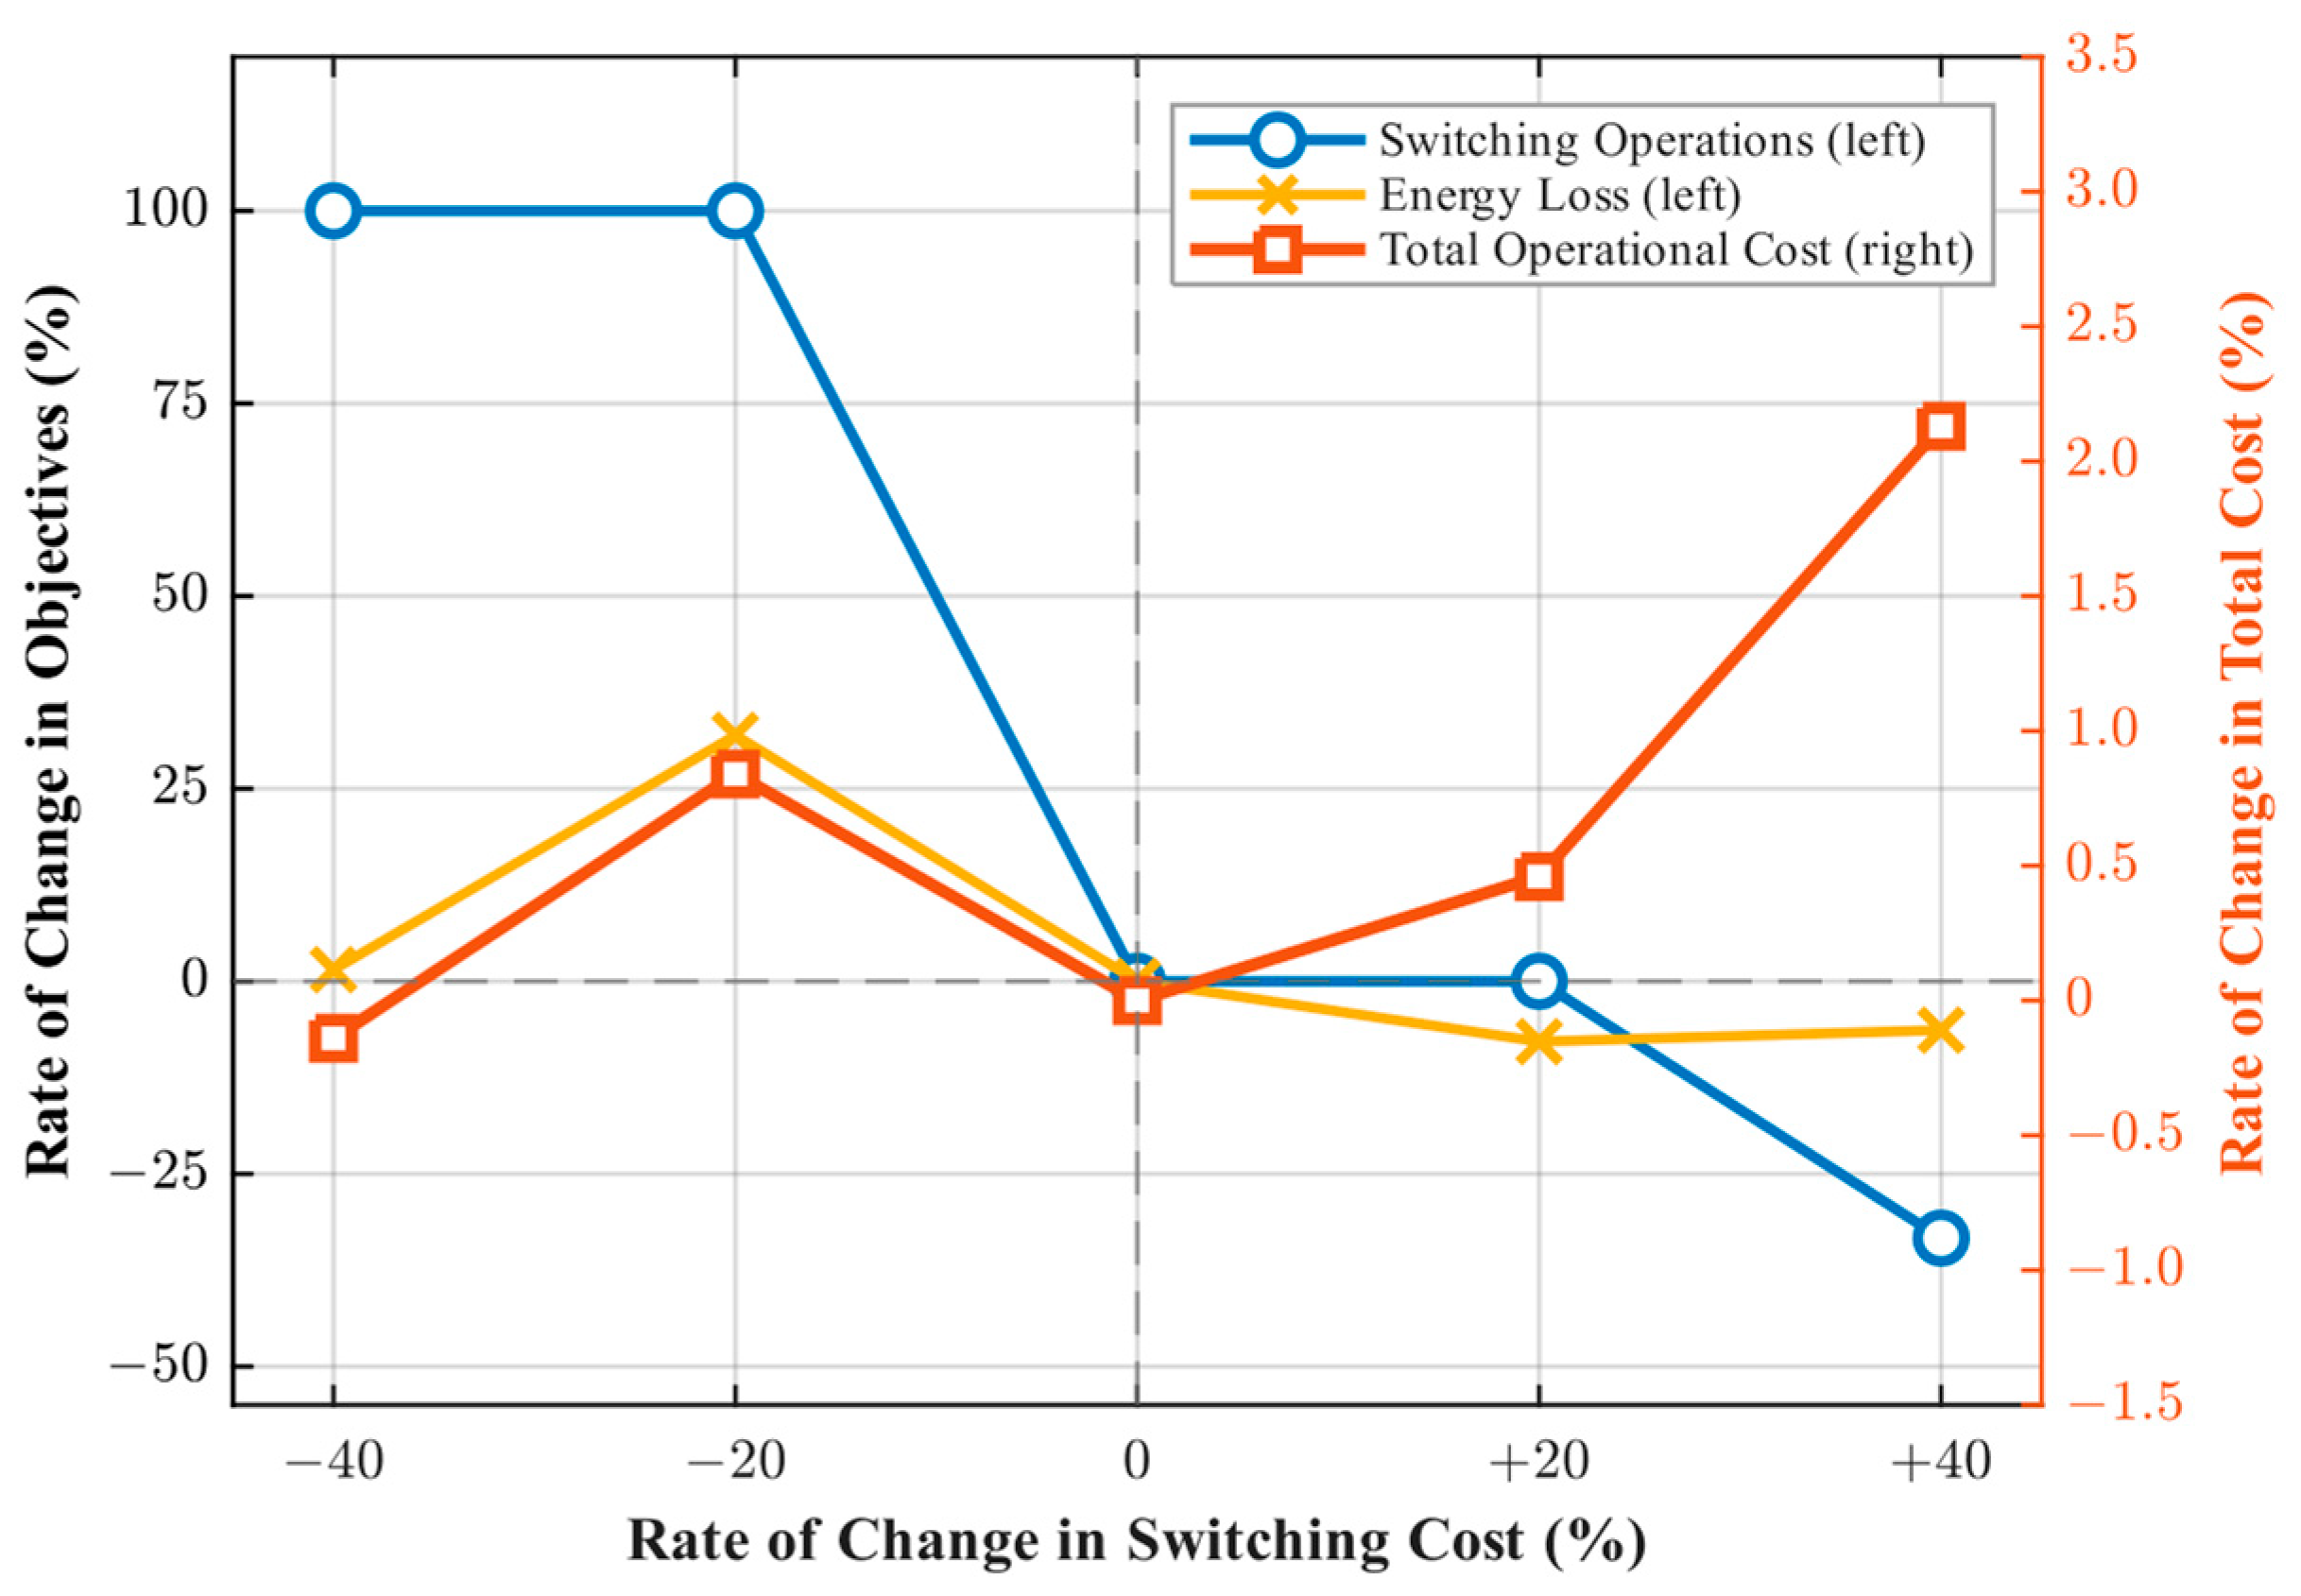
To evaluate the parametric robustness of the proposed framework, a one-at-a-time (OAT) sensitivity analysis was performed by varying the per-operation switching cost (
) within a range of ±40% from the base case value (16.67 USD/operation) under the overvoltage scenario. The results, presented in
Table 16 and
Figure 20, demonstrate that the total operational cost is highly insensitive to variations in switching costs, with a maximum deviation of only +2.13% across the full parametric range. Conversely, the total number of switching operations exhibits significant sensitivity to negative cost deviations, increasing by 100% (from 6 to 12 operations) when
is reduced by 20% to 40%. At elevated switching costs, the reconfiguration frequency decreases by up to 33.33% (specifically under the +40% scenario), while energy losses are reduced by up to 7.83%. Although energy loss exhibits a non-monotonic response—peaking at an increase of +31.93% under the −20% scenario—no voltage violations or thermal overloads were recorded across any of the evaluated conditions. These findings validate the stability of the proposed objective formulation across the evaluated parametric range. It should be noted that the base-case value of 16.67 USD/operation corresponds to the actual switching cost currently applied by the PEA in practice, thereby confirming the practical relevance and direct applicability of the proposed framework to the real PEA 22 kV distribution network.
5.6. Benchmarking Against Representative DNR Methods
Table 17 presents a feature-level comparison between the proposed framework and two representative approaches: a dynamic cost-aware method and a switching-sequence-aware method. The comparison covers key aspects, including objective functions, time-of-use (TOU) pricing consideration, hourly reconfiguration capability, support for temporary meshed topology, and switching sequence validation.
The results indicate that the proposed framework provides a more comprehensive and practically oriented solution. It uniquely integrates TOU-based cost modeling, hourly adaptive reconfiguration, and the ability to transition between radial and temporary meshed topologies.
6. Discussion
The proposed three-stage operational framework, validated in a real 22 kV distribution network, demonstrates significant potential to help DSOs mitigate network congestion and optimize operational costs. This framework enables dynamic reconfiguration between radial and temporary mesh topologies based on congestion conditions, with safe switching sequences validated.
The distribution of stage activations across the four case studies warrants further clarification. Stage 2 (Mesh Network Reconfiguration) was activated only in Case 3, while Cases 1, 2, and 4 were fully resolved through Stage 1 (Radial Network Reconfiguration) alone. This pattern is not a limitation of the framework but rather a reflection of its hierarchical, conservative design philosophy, which prioritizes radial operation in line with standard DSO practice. The fact that radial reconfiguration successfully mitigated overvoltage (Case 2) and severe overload with reverse power flow (Case 4) demonstrates the sufficiency of Stage 1 under most congestion scenarios when adequate tie-switch infrastructure is available. Stage 2 was deliberately reserved for situations where voltage violations cannot be resolved within the radial topology constraint. This condition arose exclusively in Case 3 under the extreme 6.5 MW EV charging demand. This selective activation confirms that the framework correctly identifies when mesh reinforcement is operationally necessary rather than applying it indiscriminately. Furthermore, all four cases activated Stage 3, confirming that safe switching sequence validation is universally required regardless of whether the final topology is radial or meshed, and underscoring the practical value of this stage across all operational conditions.
Although this study employs Binary Particle Swarm Optimization (BPSO), the proposed framework is inherently algorithm-agnostic. BPSO was selected as a representative metaheuristic due to its suitability for discrete binary decision variables, such as the open/closed states of distribution switches, and its proven robustness in solving non-linear optimization problems. While more advanced optimization techniques have been proposed in the recent literature, BPSO offers a practical balance between solution quality and computational efficiency, achieving convergence within 21–33 min.
Despite the promising performance of the proposed framework, several limitations should be acknowledged. The scalability of the approach may be constrained in large-scale networks due to the combinatorial complexity of the DNR problem, potentially requiring advanced or parallel optimization techniques. The framework also depends on accurate network data; inaccuracies or missing data may degrade solution quality, necessitating fallback strategies such as using historical or previous time-step data. In addition, performance may be affected under high-uncertainty conditions, particularly with intermittent DER generation, while communication delays in SCADA systems may delay the timely execution of switching actions. Although the current framework is designed for day-ahead operation, real-time implementation is feasible with high-performance computing or dedicated workstations; however, this requires reliable data acquisition, and alternative mitigation strategies must be employed in cases of data loss or communication failure.
It is important to emphasize that this computational time is intended for day-ahead operational planning rather than real-time control. In this context, generating a complete 24 h switching schedule within approximately 30 min is operationally acceptable and well aligned with standard utility planning practices. Therefore, the computational burden does not limit real-world applicability.
Furthermore, it is important to position the proposed methodology within the context of recent AI-based and data-driven approaches, such as Deep Reinforcement Learning (DRL). These approaches offer significant advantages in fast online decision making and adaptive energy management. However, their application to physical network topology reconfiguration introduces fundamental challenges. In particular, neural network-based models have inherent difficulty in strictly enforcing hard combinatorial constraints, such as maintaining radial topology and preventing network islanding. As a result, DRL-based methods may generate infeasible or unsafe intermediate switching actions during the decision process.
In contrast, the proposed framework incorporates a deterministic, rule-based heuristic in Stage 3 to explicitly ensure safe, feasible switching sequences. This approach ensures that all operational constraints are satisfied at every step of the reconfiguration process without requiring iterative correction. Consequently, the proposed method provides a robust balance between operational cost optimization and dynamic congestion mitigation, while maintaining the strict operational security requirements mandated by real-world distribution system operators (DSOs).
The primary contribution of this work lies in demonstrating the effectiveness of coordinated radial and temporary meshed operation, rather than in benchmarking optimization algorithms. Nevertheless, the modular design of the proposed framework enables straightforward integration of more advanced optimization methods, which may further enhance convergence speed and scalability as network complexity increases.
Regarding operational security under fault conditions, particularly during temporary meshed operation, this study assumes the utilization of a dynamic protection scheme supported by modern distribution automation. Modern protection devices, such as digital relays and reclosers, support multiple protection setting groups and directional fault detection capabilities. In the proposed framework, these setting groups are assumed to be remotely adjusted via the SCADA system to align with the active topology (radial or mesh). This allows automated, synchronized adaptation of protection coordination alongside scheduled topology changes, ensuring fault currents are correctly detected and isolated, even in looped configurations. Furthermore, for Fault Location, Isolation, and Service Restoration (FLISR), the inclusion of directional fault indicators in the remote-controlled switches enables the system to accurately localize faults despite the bidirectional power flows inherent in meshed topologies. Therefore, while detailed relay setting calculations are outside the scope of this optimization study, the framework is inherently compatible with these standard adaptive protection technologies.
Given the temporal scope and uncertainty, a 24 h optimization horizon was selected to align with the standard day-ahead operational planning cycle and the daily TOU tariff structures typical of utility operations. However, the proposed framework is inherently scalable to longer time horizons. Since the optimization algorithm operates sequentially, utilizing the network topology from the previous time step (
) as the initialization seed for the current step (
), it can continuously and effectively manage network operations over extended periods (e.g., weekly or seasonal) provided that corresponding load and generation data are available. Furthermore, while this study employs deterministic load and generation profiles to validate the hierarchical reconfiguration logic, the framework is designed to be adaptable to uncertainties. Future iterations can incorporate stochastic optimization or robust optimization modules at the data input stage to account for forecast errors in renewable generation and EV charging behavior. In the near term, however, forecast uncertainty and short-term load fluctuations could cause the deterministic algorithm to recommend overly frequent topology changes in pursuit of marginal cost benefits. To mitigate this in practical DSO operations, the framework’s parameters can be conservatively adjusted. As demonstrated in the sensitivity analysis (
Section 5.5), artificially elevating the unit switching cost (
) effectively penalizes and reduces the reconfiguration frequency. Alternatively, operators can introduce a hard constraint on the maximum allowable daily switching operations to prevent excessive mechanical wear and tear driven by forecasting noise. This ensures that the generated switching schedules remain stable and practically executable, further enhancing the framework’s robustness.
Finally, the limitations of the current validation should be acknowledged to provide a balanced perspective on the framework’s applicability. The study is based on a single 22 kV distribution network with a limited number of tie switches and assumes deterministic inputs and ideal adaptive protection performance. Regarding generalizability, while the proposed hierarchical logic is mathematically and operationally applicable to larger, more complex distribution networks, practical deployments may face scalability constraints. Because the network reconfiguration problem is highly combinatorial, increasing the network size and the number of remotely controlled switches will exponentially expand the search space. Although the proposed framework is explicitly designed for day-ahead operational planning rather than real-time control—making current computational times highly manageable—excessive computational delays in massive networks could still pose a challenge for timely schedule generation or intraday forecast updates. To apply this framework to large-scale networks, future research must address these computational bottlenecks, potentially by employing network partitioning techniques or integrating faster-converging optimization solvers.




 ,
,