Article

Synergistic Analysis of Methanol–Diesel Combustion for a Marine Diesel Engine: An Integrated CFD and Experimental Method

1
School of Marine Engineering, Jimei University, Xiamen 361021, China
2
Key Laboratory of Ship and Marine Engineering, Xiamen 361021, China
3
College of Transportation and Navigation, Quanzhou Normal University, Quanzhou 362000, China
*
Authors to whom correspondence should be addressed.
Energies 2026, 19(7), 1794; https://doi.org/10.3390/en19071794
Submission received: 20 February 2026 / Revised: 19 March 2026 / Accepted: 31 March 2026 / Published: 7 April 2026
(This article belongs to the Topic Advanced Bioenergy and Biofuel Technologies)

Abstract

With the growth of global maritime transportation volume and fuel shortages caused by excessive oil consumption, energy conservation and emission reduction technologies for marine diesel engines have become a core research focus. A three-dimensional (3D) CFD model of a methanol–diesel dual-fuel marine diesel engine was developed in AVL-FIRE and coupled with a CHEMKIN reaction mechanism. The model was validated against experimental data, with errors in cylinder pressure, heat release rate, and major emissions below 5%. Based on the validated model, the effects of the methanol blending ratio (0–30%), injection advance angle, intake temperature, intake pressure, and EGR rate on combustion and emissions were investigated. The results show that increasing the methanol blending ratio reduced cylinder pressure, in-cylinder temperature, and NO and soot emissions, while increasing the peak heat release rate. Advancing injection timing improved combustion and reduced CO and soot emissions but increased NO formation. Higher intake temperature worsened combustion performance and increased NO, CO, and soot emissions. Orthogonal analysis and regression-based optimization identified an optimal condition with a methanol blending ratio of 27%, an EGR of 12.5%, an injection advance angle of 21.2 °CA, an intake temperature of 319.05 K, and an intake pressure of 0.223 MPa. Under this condition, the NOx mass fraction was 1.65 × 10⁻⁵.

1. Introduction

Shipping carries the bulk of world trade, making it indispensable to the global economy [1]. Approximately 55,000 merchant vessels worldwide are responsible for handling over 90% of global trade volume [2]. Currently, 99% of ships utilize diesel engines as their power source [3]. Diesel’s proven technology and reliability are key, coupled with their rapid start-up speed and high efficiency [4]. Most marine engines operate under high temperatures and pressures, resulting in relatively high emissions due to the lack of effective emission reduction technologies [5]. Consequently, shipping emissions have garnered increasing attention and are recognized by policymakers and scientists as an escalating problem [6]. A practical pathway toward sustainable shipping is to reduce dependence on conventional fossil fuels and promote the application of cleaner alternative fuels [7].
In the shipping industry, alternative fuels include hydrogen [8], ammonia [9], biodiesel [10], and methanol. Hydrogen and ammonia have received considerable attention as potential marine fuels [11], but their storage, transportation, and infrastructure challenges still limit near-term large-scale application [12,13]. Biofuels are commonly considered alternative feedstocks for reducing shipping emissions; the main reason for this lies in their derivation from biological matter: plant oils, waste greases, algal biomass, and related materials [14]. The CO2 released during combustion can be considered part of the short-term carbon cycle, contributing to a reduction in the shipping industry’s full life-cycle carbon emissions. Methanol not only reduces greenhouse gas emissions but also features relatively mature technology and manageable safety profiles [15]. Consequently, methanol is now widely recognized as a cornerstone fuel for decarbonizing the shipping industry [16]. Methanol has the molecular formula CH3OH, containing one carbon atom and a high oxygen content of 50% [17]. It is the simplest saturated monohydric alcohol among all alcohol compounds. As a biomass raw material, methanol mainly comes from agricultural waste, crop residues and the remaining parts of tree pruning [18]. Beyond its role as an easily handled fuel and energy reservoir, methanol also serves as a solvent and a platform molecule for producing synthetic hydrocarbons, polymers, and even single-cell proteins [19]. Due to its low toxicity to aquatic life, it was once used for denitrification in wastewater treatment plant effluents [20]. Even in the event of accidental spills, it is rapidly diluted and dissipates through biodegradation [21]. Methanol is characterized by high oxygen content, high latent heat of vaporization, and a high amount of octane, all of which strongly influence mixture formation and combustion behavior in engines [22,23]. Because methanol contains no carbon–carbon bonds and has an inherent oxygen content, it shows strong potential for reducing soot emissions, while its effect on NOx depends on the combustion mode and operating conditions [24]. It also holds the potential to achieve low-carbon or even near-zero carbon emissions [25]. Methanol can effectively reduce the environmental load caused by the shipping industry and is a renewable fuel with great potential [26]. Because of these advantages, methanol is now widely regarded as one of the most practical transition fuels for shipping decarbonization. However, methanol also has some inherent drawbacks when used in compression-ignition engines. Its low cetane number can prolong ignition delay, while its low heating value may increase fuel consumption for the same power output. In addition, the high latent heat of vaporization may reduce in-cylinder temperature and cause cold-start difficulty or combustion instability under certain operating conditions.
Traditional diesel combustion requires aftertreatment equipment for emissions control, but installing such systems increases overall costs and may also lead to reduced fuel economy [27]. NO and PM emissions drop substantially with dual fuel versus conventional diesel [28]. Currently, dual-fuel engines incorporating alternative fuels have become mainstream in shipping [29]. Among these, natural gas–diesel dual-fuel engines retain key advantages such as high efficiency and high torque due to their ability to operate at high compression ratios [30]. Natural gas contributes to this capability through its high octane level and excellent anti-knock characteristics [31], coupled with reserves that far exceed those of other conventional fuels. However, poor natural gas combustion quality leads to emissions of unburned hydrocarbons, presenting certain challenges. Because it is both renewable and clean during combustion, hydrogen frequently appears on the shortlist of alternative fuels [32]. However, hydrogen’s inherent limitations are also evident: existing technology makes hydrogen fuel less cost-competitive compared to other fuels [33], which restricts its potential for widespread substitution. Adding methanol to pure diesel engines enhances output power and brake thermal efficiency, among other benefits. Therefore, methanol blending in diesel engines contributes to improving fuel economy. Generally speaking, methanol’s strong laminar flame behavior accelerates burning and enhances overall combustion. Methanol is primarily synthesized through catalytic gas conversion from natural gas reforming or coal synthesis, offering extensive feedstock sources [34]. The energy characteristics of coal feedstocks are commonly evaluated using parameters such as the higher heat of combustion in the wet ash-free state [35]. Higher methanol ratios in diesel–methanol combustion amplify the early premixed burn, yielding a faster HRR [36]. Brake thermal efficiency (BTE) and brake-specific fuel consumption (BSFC) serve as standard indicators for assessing how effectively an engine converts fuel into work and how economically it operates. In engines running on blended fuels, higher methanol fractions drive both parameters steadily upward [37]. Cenk Sayin et al. [38] varied the methanol blend ratio (5–15%), injection pressure, and timing. Their findings indicate that more methanol leads to better thermal efficiency, improved economy, and cleaner exhaust in terms of soot, CO, and HC. In dual-fuel engines, methanol also plays a crucial role in improving emission performance. NOx formation is primarily driven by high temperatures and high oxygen concentrations. By lowering the combustion temperature via high latent heat and low calorific value, methanol creates a cooler, NOx-suppressed combustion environment. This also leads to longer ignition delays, thereby increasing carbon monoxide production in the home and inhibiting CO oxidation [39].
The high oxygen concentration in methanol and its faster laminar flame velocity can shorten combustion time, thereby reducing carbon emissions. Yang et al. [40] applied a methanol/diesel dual-fuel system to an OP2S engine to quantify the sensitivity of engine performance to port height and stroke ratio. The results indicate that the methanol blending ratio does not influence port height or stroke ratio, and the optimal methanol blending ratio for power performance ranges from 5% to 15%. Panagiotis et al. [41] investigated how port injection and direct in-cylinder methanol delivery influence marine engine behavior. Switching to methanol reduced burn time and dropped peak combustion temperatures by 1–3% compared to baseline diesel. Panda et al. [42] explored how diesel injection parameters influence combustion behavior, power output, and pollutant formation in a light-duty, single-cylinder common-rail engine fueled with methanol and diesel. Results revealed that complete methanol combustion reduced HC and CO emissions. Compared to the dual-pulse method, the pre-injection, main injection and post-injection strategies decreased the rising pressure rate, NO emissions, and average cylinder temperature.
However, several gaps remain in existing studies. Most published work has focused on individual factors, such as the methanol ratio or injection strategy. The coupled effects of intake conditions, EGR, and fuel parameters are still unclear for marine diesel engines. Moreover, only a limited number of studies have combined experimentally validated 3D CFD analysis with systematic multi-parameter evaluation. Therefore, a more comprehensive investigation is needed. Accordingly, the novelty of the present study lies in three aspects. First, an experimentally validated three-dimensional CFD model is established for a medium-speed marine methanol–diesel dual-fuel engine. Second, the effects of five key parameters, namely methanol blending ratio, injection advance angle, intake temperature, intake pressure, and EGR rate, are analyzed within a unified framework, allowing their synergistic influence on combustion and emissions to be evaluated more systematically than in previous single-factor studies. Third, orthogonal design and regression-based optimization are further employed to identify an improved operating condition that balances NOx reduction and indicated power.
In this study, a three-dimensional combustion model of the 4190ZLC-2 marine four-cylinder medium-speed diesel engine was developed in AVL-FIRE and coupled with a reaction mechanism generated in CHEMKIN. After validation against experimental data, the model was employed to investigate the effects of methanol blending ratio, injection advance angle, intake temperature, intake pressure, and EGR rate on combustion and emission characteristics. Finally, orthogonal analysis and regression-based optimization were conducted to determine a favorable operating condition for methanol–diesel dual-fuel combustion in marine engines.

2. Materials and Methods

2.1. Experimental Engine and Apparatus

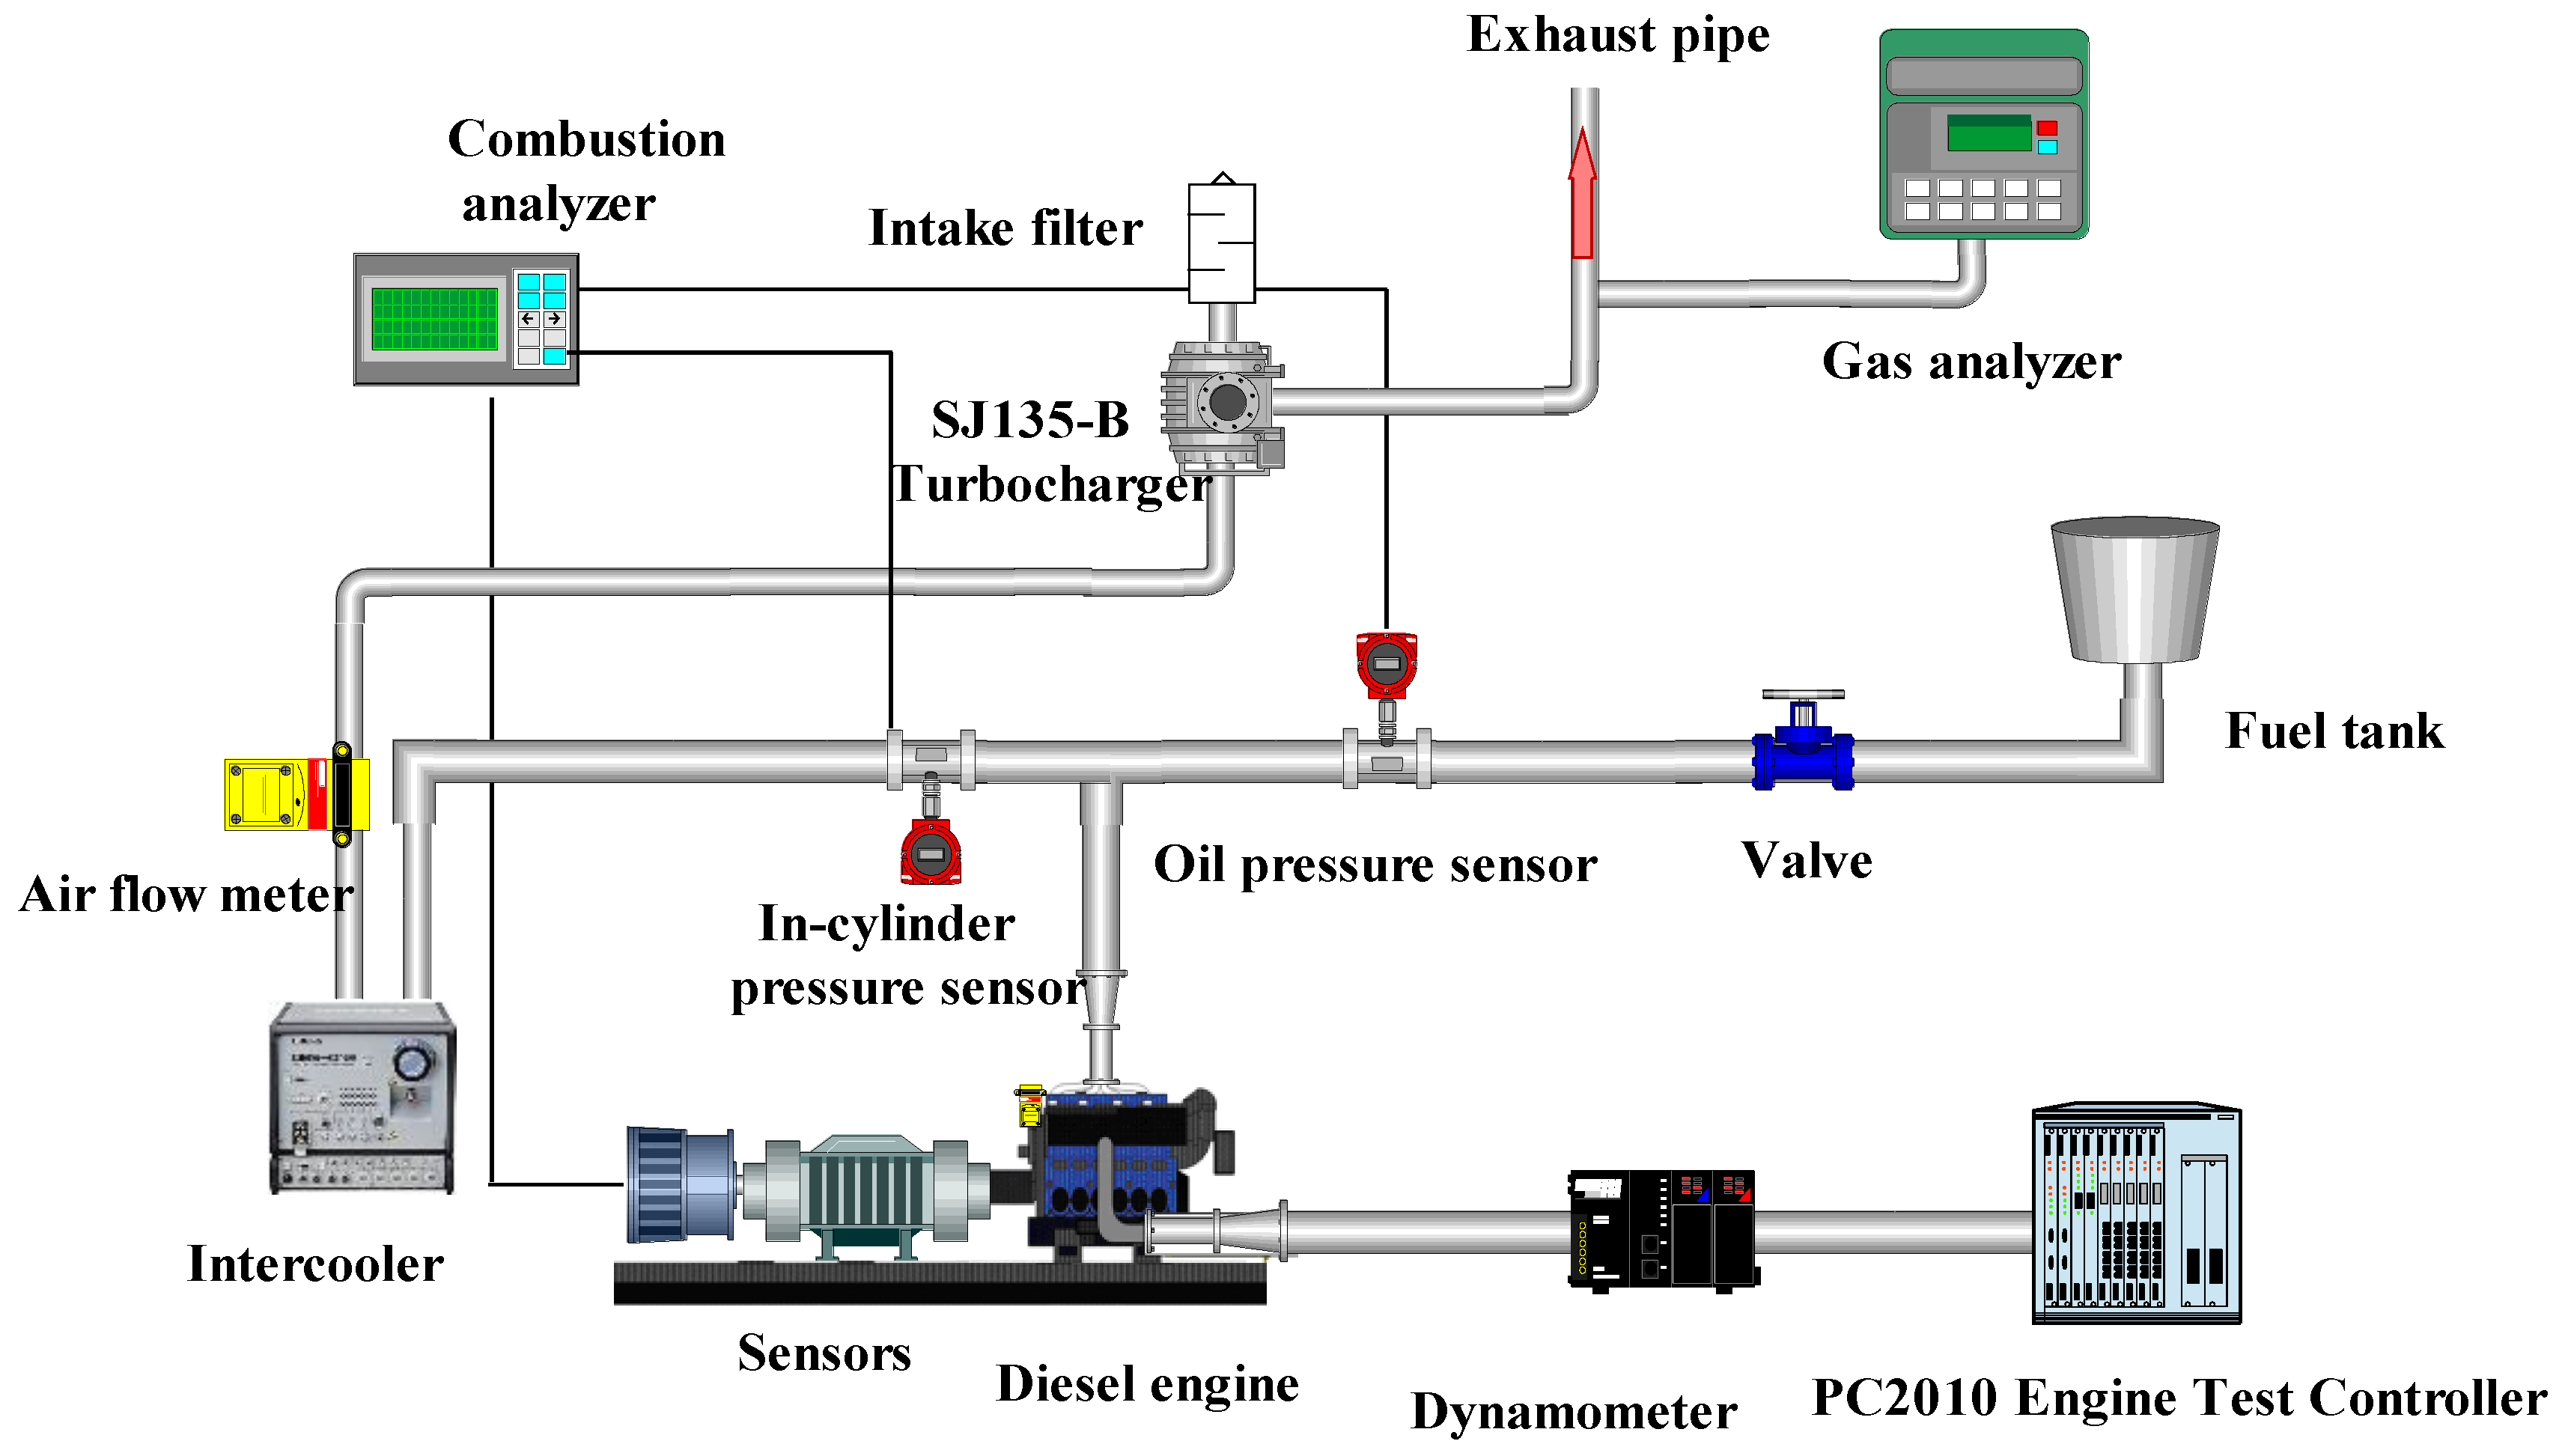
This paper investigates the 4190ZLC-2 marine four-cylinder medium-speed diesel engine manufactured by Jinan Diesel Engine Factory, located in Jinan, China. Figure 1 displays a schematic diagram of the engine test. Table 1 lists its key specifications. The measurement equipment includes: the dynamometer system, which employs the SG880 water vortex dynamometer and FC2010 measurement and control instrument manufactured by Hunan Xiangyi Company, located in Hunan, China. The HORIBA MEXA-1600DS EGR system, which measures the volumetric concentrations of NOx, CO. And additional pollutants in the raw exhaust; and the combustion analyzer, which is the DEWE-2010CA model manufactured by Dewetron (based in Graz, Austria). Sensors produced by KISTLER (based in Winterthur, Switzerland) are employed to collect data on intake and exhaust pressures, high-pressure fuel line pressure, and other parameters. The in-cylinder pressure data were recorded over 50 consecutive engine cycles under each operating condition.
The experimental setup used in this study was established based on the test bench reported in previous studies [43], with the overall configuration and measurement methodology remaining essentially consistent. On this basis, in order to further improve the reliability and clarity of the experimental results, an uncertainty analysis of the main measured parameters is incorporated into Table 2 in the present work. In previous studies, the uncertainty of engine performance parameters was evaluated on the basis of 200 cycles, and the uncertainties associated with indicated power, BSFC, and emission measurements were quantified according to the corresponding sensor and analyzer errors.

2.2. Model Establishment

Using SolidWorks software (v2020), the combustion chamber geometry is formed at a 100:1 scale. Then, the completed 2D combustion chamber geometry is imported into the software. In configuring the solver for the simulated methanol–diesel dual-fuel engine, since only the process from intake valve closure to exhaust valve opening is considered, the crank angle is used to represent time variation. TDC is located at 720 °CA along the crank angle axis. Intake valve closure occurs at 593.5 °CA, while the exhaust valve opens at 841 °CA. The process from intake valve closure to exhaust valve opening encompasses compression of the gas and expansion work, since different processes demand varying levels of computational precision.
Using the 4190ZLC-2 (based in Jinan, China), substituting the fuel consumption rate and effective power into the formula yields a single-cylinder cycle injection quantity of 0.38975 kg/cycle. For this sector mesh, which covers one-eighth of the combustion chamber, the corresponding fuel mass per injection cycle is 0.04936 kg. The injection pattern is determined by the set injection mass and duration angle, both of which are automatically calculated by the software and require no manual configuration.

Governing Equations

Irrespective of engine design specifications, the governing equations in diesel combustion simulations stem from the universal principles of mass, momentum, and energy conservation.
  • Mass conservation
In the combustion flow within the combustion chamber, the mass increase per unit of time for a given infinitesimal element equals the sum of the masses flowing into that element per unit of time:
ρ t + ρ u x + ρ v y + ρ w z = 0
where ρ represents the fluid density; u, v, and w denote the vector velocities along the x, y, and z axes in the combustion flow field.
2.
Momentum conservation
The momentum conservation equation is the Navier–Stokes equation. It states that the sum of external forces acting on any infinitesimal element within the combustion flow field equals the time rate of change in its momentum. The expression is as follows:
p u t + d i v ( ρ u U ) = d i v ( μ gradu ) p x + S u
p v t + d i v ( ρ v U ) = d i v ( μ gradv ) p y + S v
p w t + d i v ( ρ w U ) = d i v ( μ gradw ) p z + S w
where Su, Sv, and Sw are generalized sources; p denotes pressure; and μ is dynamic viscosity.
3.
Energy conservation
Within the combustion chamber, the increase in the internal energy of a small element per unit time equals the sum of the inflowing energy and the work done on it by external forces. The expression is as follows:
ρ T t + d i v ( ρ U T ) = d i v ( K C p · g r a d T ) ρ x + S T
where K represents the fluid heat transfer coefficient; Cp denotes specific heat capacity; ST denotes the amount of heat generated by the conversion of mechanical energy into thermal energy due to cylinder heat and fluid viscosity; and T denotes the fluid temperature.

2.3. Mathematical Modeling

The combustion chemistry in the present study was calculated using the AVL-FIRE-coupled CHEMKIN code. An improved skeletal chemical kinetic mechanism consisting of 134 species and 475 reactions was employed to describe the methanol–diesel combustion process. To improve methodological transparency, only the sub-models actually used in the present simulations are discussed below, together with the reasons for their selection. The selection was based on the physical characteristics of methanol–diesel combustion, the operating conditions of the marine medium-speed diesel engine, and the need to balance predictive capability with computational cost. A qualitative comparison with alternative AVL-FIRE sub-models is also provided where relevant. The final model set was further supported by validation against experimental cylinder pressure and heat release rate data.

2.3.1. Spray Model

The injection sends the premixed methanol–diesel fuel into the cylinder. This process involves injection, atomization, evaporation, and fuel–air mixing. The mixture undergoes collisions between fuel droplets and between droplets and cylinder walls due to the high temperature, pressure, and turbulent flow. This causes droplets to break into smaller liquid droplets and even smaller sub-droplets. Therefore, selecting an appropriate fuel spray mathematical model is essential for ensuring the accuracy of simulation calculations. The spray sub-models were selected to reflect the significant differences in volatility and atomization behavior between methanol and diesel, while maintaining numerical stability for direct-injection engine simulations. Therefore, model selection was based on both physical suitability and practical robustness within the AVL-FIRE framework.
  • Energy conservation
AVL-FIRE software (v2016) provides multiple evaporation models, including Dukowicz, Spalding, Abramzon, multi-component, and others. When simulating pure diesel combustion, the Dukowicz evaporation model is selected. Divergent evaporation rates stem from the contrasting physical properties of methanol and diesel. Therefore, mass transfer for each component must be considered separately during evaporation, necessitating the use of a multi-component model. Compared with single-component evaporation models, the multi-component model is more appropriate for methanol–diesel-blended fuel because it can account for the different evaporation and mass-transfer behaviors of the two fuel components. The expression for calculating heat transfer by droplets is as follows:
Q · S = m · c ¯ p F T T S B T L ¯ T S
N u * = 2 + 0.552 R e 1 2 P r 1 3 F T
S h * = 2 + 0.552 R e 1 2 S c 1 3 F M
B Y = Y v s Y v 1 Y v s
B T = 1 + B Y ϕ 1
ϕ = c ¯ p F c ¯ p g S h * N u * 1 L e
m · = π k ¯ g c ¯ p F D d N u * l n ( 1 + B T )
where Re denotes the Reynolds number; Yv denotes the droplet evaporation mass fraction; c ¯ p F and c ¯ p g denote the specific heat capacities; Sc denotes the Schmidt number; s and ∞ denote the droplet surface and the infinite distance from the droplet, respectively; and Pr denotes the Prandtl number.
2.
Spray-breakage model
The accuracy of the droplet breakup model is crucial for subsequent droplet evaporation and wall collision models. AVL-FIRE provides five models, including the WAVE model, the FIPA model, the KH-RT model, the TAB model, and the HUH-GOSMAN model. The WAVE model has relatively few adjustable parameters. However, its secondary breakup description is less suitable for the present spray condition. The KH-RT model shares the same conceptual framework as the WAVE model. Compared with the WAVE model, the KH-RT model can better represent both Kelvin–Helmholtz and Rayleigh–Taylor instabilities during primary and secondary breakup. For this reason, it is commonly adopted for high-pressure diesel spray simulations and was considered more suitable for the present methanol–diesel injection condition.
KH-RT model expression is as follows:
R a = C q Λ T a = 3.7 C 2 R Λ Ω Λ = f W e c , O h d Ω = f W e c , O h d
where Ra represents the initial radius; C1 refers to the constant; Wec represents a property of the continuous phase; τ represents the duration for which the oil jet exists; Ohd represents the characteristics of droplets; Ω represents the indicator used to quantify wave height. C2 is the spray breakup model constant, and in the present study, the default AVL-FIRE value was used, i.e., C2 = 12.0. Unless otherwise specified, the empirical constants appearing in the adopted sub-models were taken from the default AVL-FIRE implementation.
Once the blended fuel was injected into the cylinder, it underwent both primary and secondary atomization. The transition criteria for secondary atomization are the droplet diameter and the Weber number.
3.
Collision model
The fuel droplets atomized by the high-pressure injector and sprayed into the cylinder undergo collisions both between droplets and the cylinder wall surface. After colliding with each other, the droplets may coalesce or break apart again. For four-stroke diesel engines, the accuracy of collision simulations significantly impacts the numerical results of the simulation. In the AVL-FIRE software, collision probability is calculated using statistical theory and Poisson distribution, with the expression given below. Considering the spray characteristics of the present diesel engine, the Nordin collision model in AVL-FIRE was selected. The Nordin collision model was selected because it is suitable for dense droplet fields and provides practical statistical treatment for droplet–droplet interactions in diesel spray simulations:
v = N 2 V c e l l π 4 d 1 + d 2 2 u 1 u 2
where 1 and 2 represent large-diameter and small-diameter droplets, respectively; v denotes the collision probability; N2 is the number of small-diameter droplets; Vcell refers to the computational grid size for both droplet types; d1 and d2 are the diameters of the two droplet types; and u1 and u2 are the initial grid velocities of the two droplet types.
When the initial velocity of the spray is too low, adhesion to the wall surface occurs. As the initial velocity increases, phenomena such as rebound, oil film formation, and droplet breakup may also occur.
AVL-FIRE includes built-in collision models such as Walljet0, Walljet1, Walljet2, Bai Gosman, Mundo Sommerfeld, Kuhnke Wruck, Lagrangean WFW, Reflection, Solid Particle, and Michle Welgand. Because droplet-film mass transfer was not explicitly considered in the present model, the Walljet1 wall-impingement model was adopted. Among the available wall-interaction models, Walljet1 was adopted because the present study does not explicitly resolve detailed droplet-film mass transfer, and this model provides a simplified but robust treatment of wall impingement behavior.
The diameter of droplets after collision is governed by the Weber number:
d 1 = d 0 W e < 50 d 0 · f W e , i n 50 W e 300 0.2 d 0 W e > 300

2.3.2. Combustion Model

The combustion models in AVL-FIRE software include the vortex-breaking, turbulent flame velocity, characteristic time scale, correlated flame, and probability density function model. Diesel engine combustion primarily involves diffusion combustion, while also incorporating premixed combustion. As subcategories of turbulent combustion, diffusion and premixed burning rely on turbulence to facilitate heat and mass transfer. Furthermore, the reaction mechanism determines the chemical reactions occurring within the combustion chamber and their reaction times. Therefore, selecting an appropriate combustion model to represent the interaction between turbulence and chemical reactions is essential.
The ECFM-3Z combustion model was selected because it can represent both premixed and diffusion-controlled combustion features within a unified framework, which is suitable for direct-injection methanol–diesel compression-ignition combustion. The ECFM-3Z combustion model optimizes the flame surface density transport equation by incorporating a turbulent mixing model. It also describes the computational grid through a redistribution approach. The selected emission sub-models were chosen to represent the dominant NO and soot formation pathways under the investigated diesel-like combustion conditions while maintaining a manageable computational cost. The governing equations for the flame surface density transport model are as follows:
ρ σ t + ρ u P μ e f f σ t , Σ σ = 2 3 u + α Γ ε k + 2 3 ρ u b ρ b U 1 1 c c β U 1 1 C ¯
c ¯ = 1 ρ Y f ρ Y T , f
c = 1 Y f Y T , f
= ρ σ
where U1 denotes the laminar flame speed; Yf represents the fuel mass fraction; YT,f indicates the mass fraction during fuel transformation; α and β denote empirical parameters for product formation; Γ denotes the ITFNS function; μeff denotes the effective viscosity; σt,∑ denotes the turbulent Schmidt number; ρub and ρb denote the densities of unburned and burned gas, respectively; u denotes the molecular viscosity of fuel oil; and k denotes the turbulent kinetic energy.

2.3.3. Emission Model

Among the pollutants emitted by diesel engines, NOx and CO are particularly problematic. The emitted NOx emissions mainly include NO and NO2. Since NO constitutes approximately 90% of NOx, the emission model should be selected specifically for NO. NO pathways in methanol–diesel engines are summarized below. Nitrogen introduced via fresh air entering the combustion chamber generates substantial thermally formed NO in the high-temperature zone during combustion [44]. During combustion within the cylinder, a portion of excited NO is generated in the flame zone; diesel fuel contains nitrogen (N), which undergoes chemical reactions during combustion to produce small amounts of fuel-derived NO.
AVL-FIRE provides three NOx emission models: Zeldovich, Heywood, and Extended Zeldovich. NO formation is described via the Extended Zeldovich mechanism, which consists of the following three reaction steps:
N 2 + O NO + N
N + O 2 NO + O
N + OH NO + H
For soot prediction, the Frolov Kinetic model was adopted in this study. This model describes soot formation and oxidation using a simplified kinetic mechanism, making it suitable for engineering-oriented diesel spray combustion simulations with acceptable computational cost. Considering the fact that the present work emphasizes experimentally validated CFD analysis and multi-parameter operating-condition evaluation, the Frolov Kinetic model was selected as a practical balance between model fidelity and numerical efficiency.

2.3.4. Turbulence Model

In-cylinder combustion in a diesel engine is a highly complex process characterized by compressibility, anisotropy, unsteadiness, and three-dimensional flow structures, which strongly affect fuel–air mixing, combustion development, and pollutant formation. Among the turbulence models available in AVL-FIRE, the standard k-ε two-equation model was adopted in this work. This model solves the transport equations for turbulent kinetic energy and its dissipation rate, while accounting for both convection and diffusion effects. Compared with more computationally demanding turbulence models, the standard k-ε model provides a practical balance between computational cost, numerical stability, and predictive capability for in-cylinder flow simulations. Owing to its mature formulation, good convergence behavior, and relatively high computational efficiency, it was considered appropriate for the present multi-parameter CFD study of methanol–diesel combustion in a marine diesel engine:
u i = 2 3 k 1 2 s i g n 2 R n i 1 e r f 1 2 R n i 1
t t u r b = m i n C τ k ε , C 1 K 2 3 ε 1 u g + u u d
where μt is the turbulent viscosity coefficient; K denotes the turbulent kinetic energy production rate; ε represents the turbulent kinetic energy dissipation rate; μ is the laminar viscosity coefficient; and σK and σε are the turbulent Prandtl numbers. Cμ = 0.09, Cε1 = 1.14, Cε2 = 1.92, Cε3 = 0.08, and Cε4 = 0.33.

2.4. Computational Grid

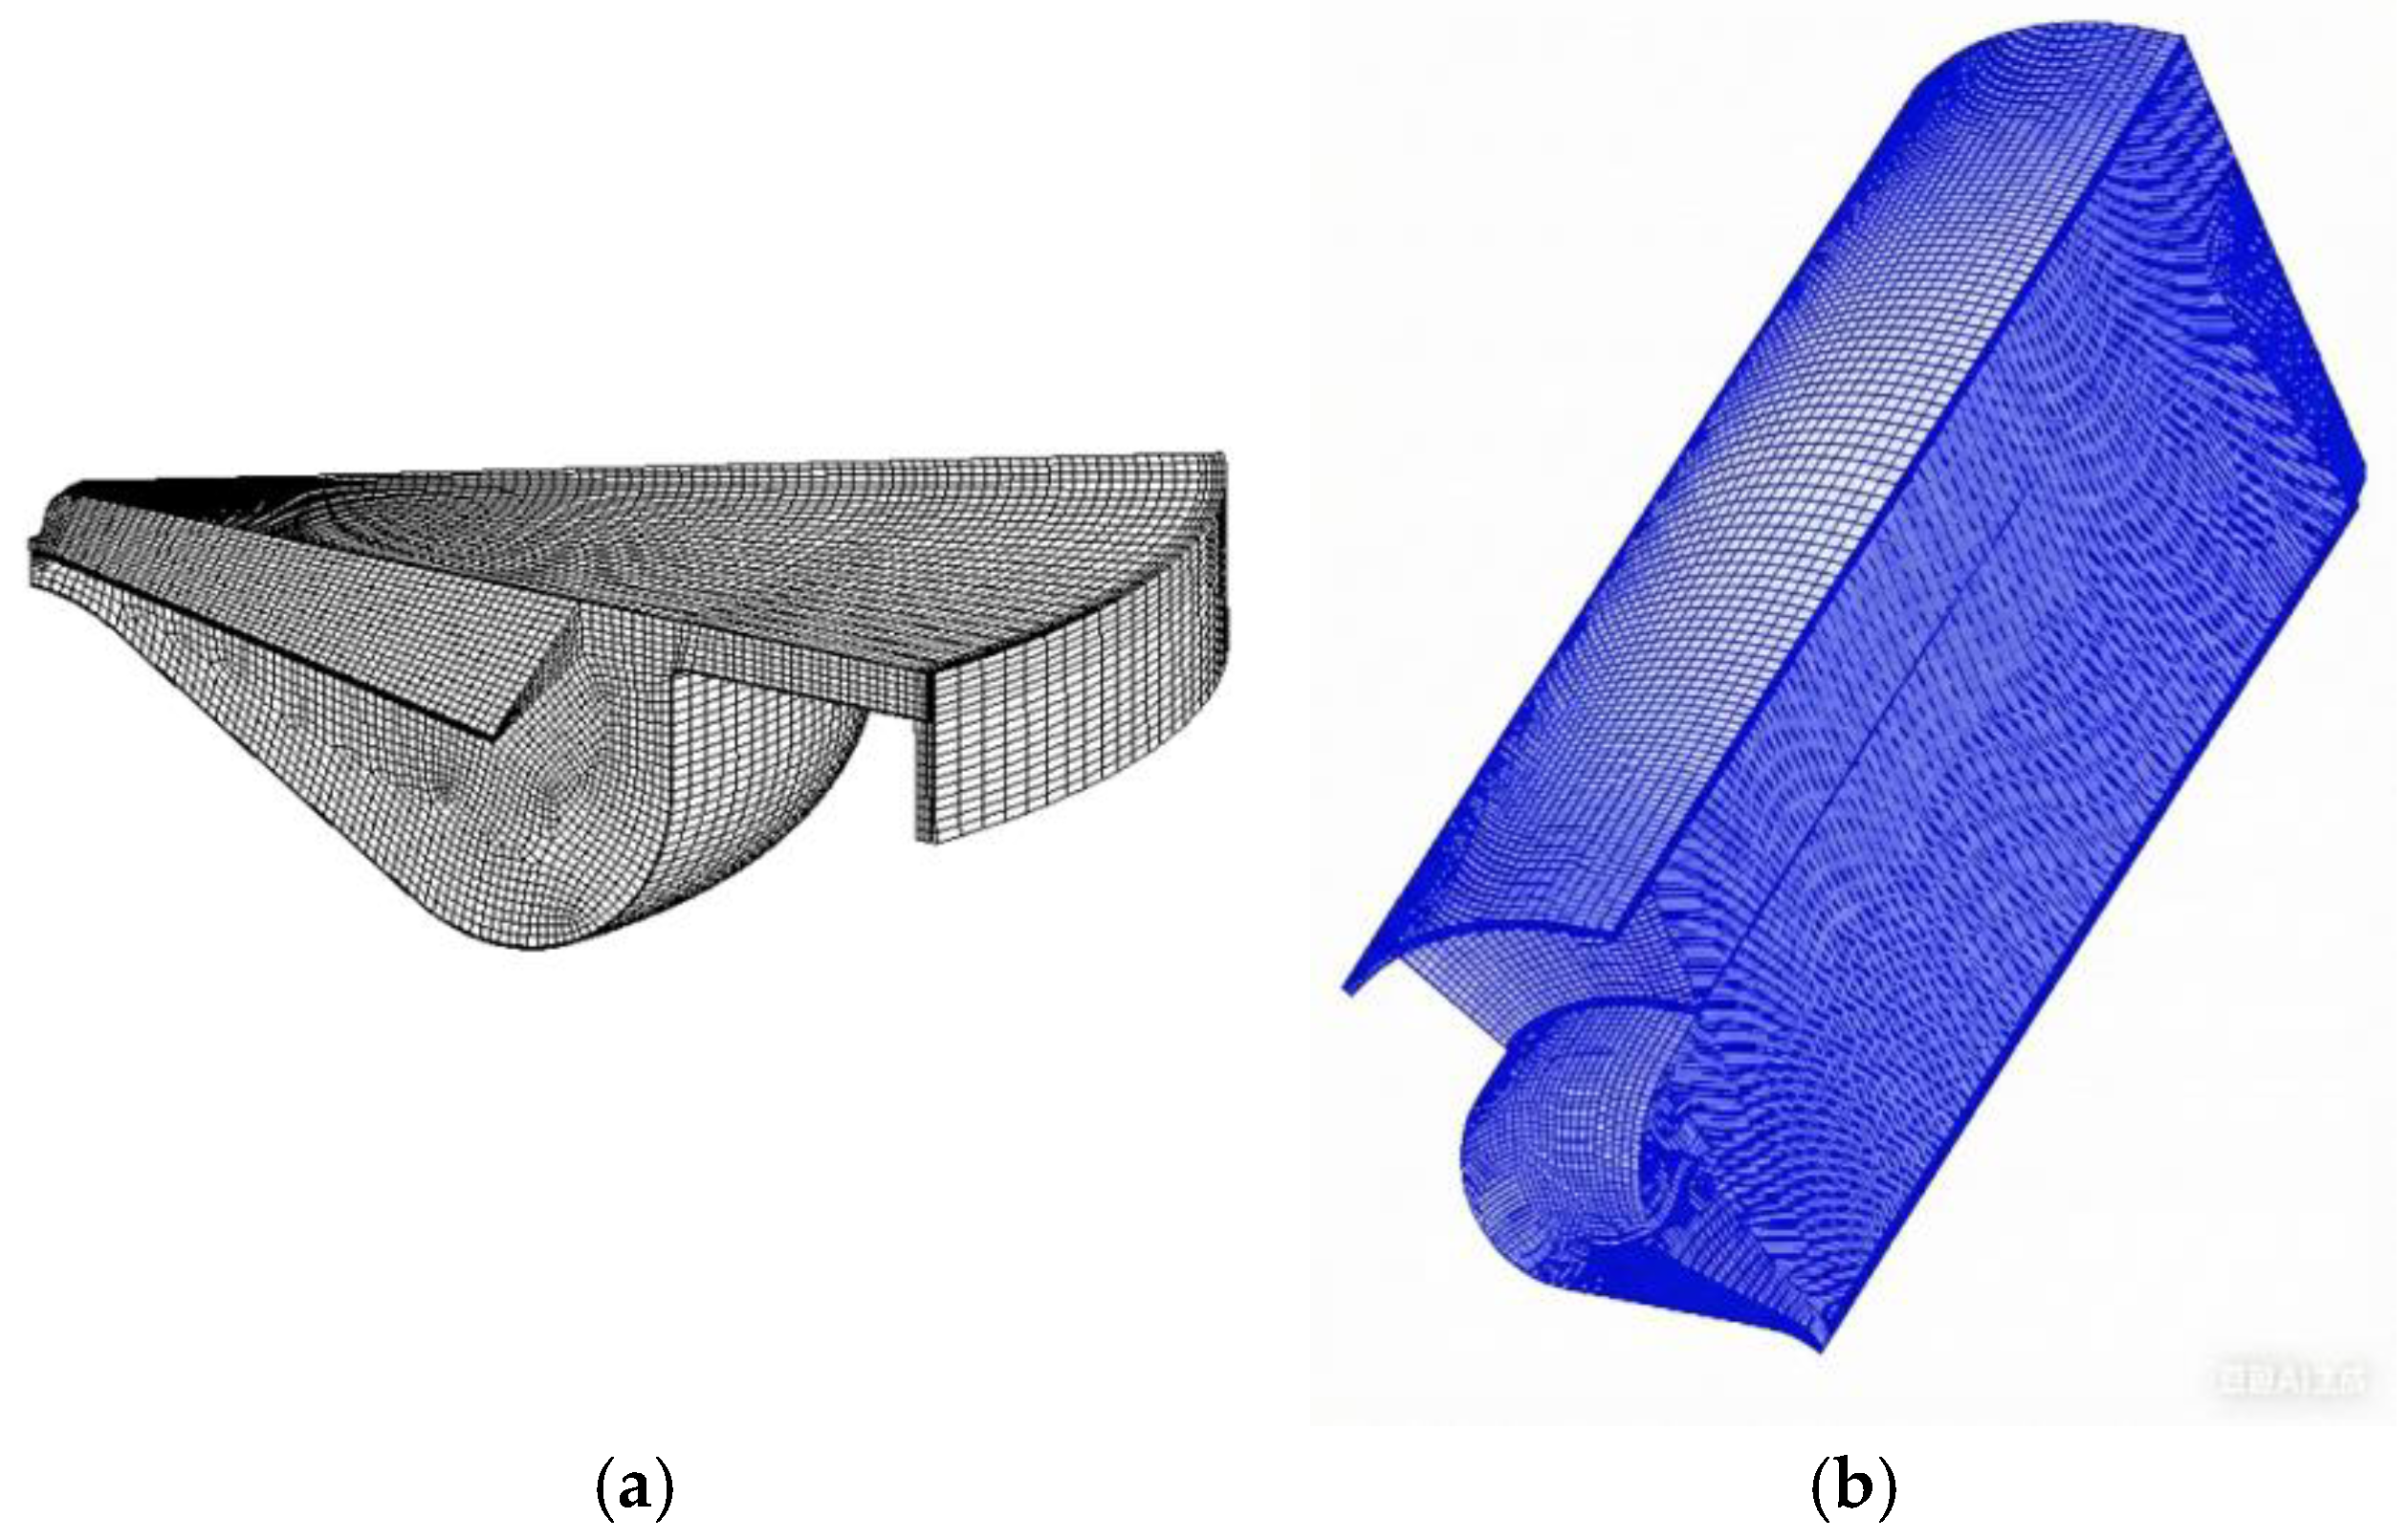
According to Table 1, the 4190ZLC-2 employs a ω-shaped, straight-throat combustion chamber that is circular in configuration. It is equipped with eight injectors arranged symmetrically. To simplify calculations, the combustion chamber can be divided into eight equal sections, with one-eighth used for simulation calculations. Upon completing the final simulation results, the AVL-FIRE software automatically scales the results up by a factor of eight. The combustion chamber 2D mesh slice should be rotated clockwise by 45° around the combustion chamber symmetry center axis. The generated combustion chamber mesh is illustrated in Figure 2.

2.5. Fuel Properties

In this article, the methanol blending ratios are 0%, 10%, 20%, and 30%. These values represent the volume proportion of methanol in the mixed fuel, denoted as M0, M10, M20, and M30, respectively. This work studies the effects of fuel blending on the evolution of combustion and emissions inside the cylinder. Table 3 presents a comparison of the physical and chemical properties of the two fuels.

2.6. Model Validation

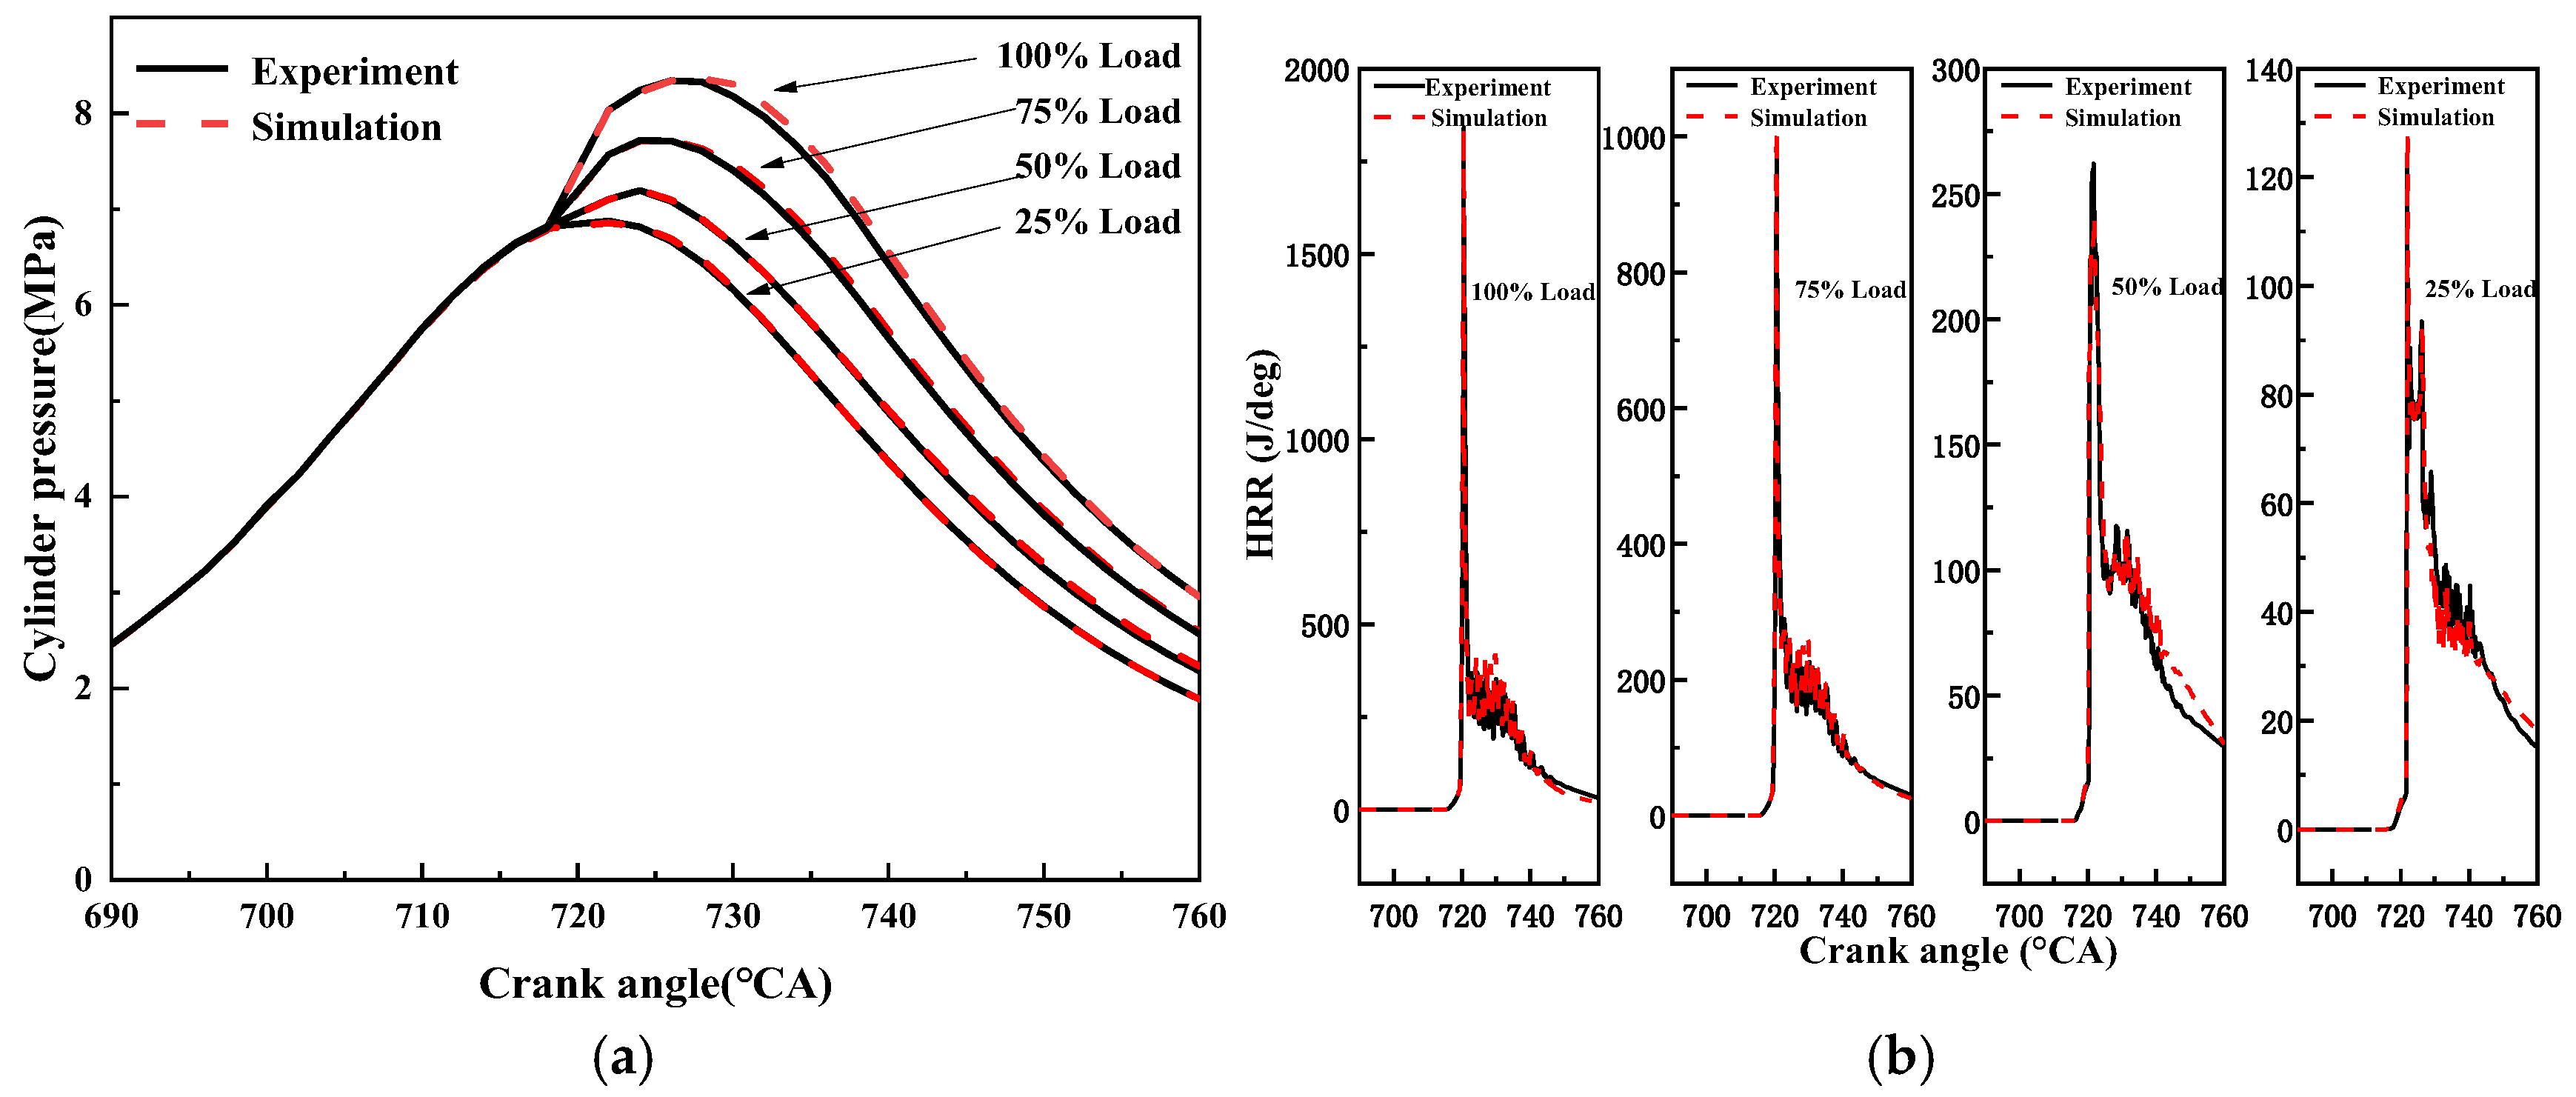
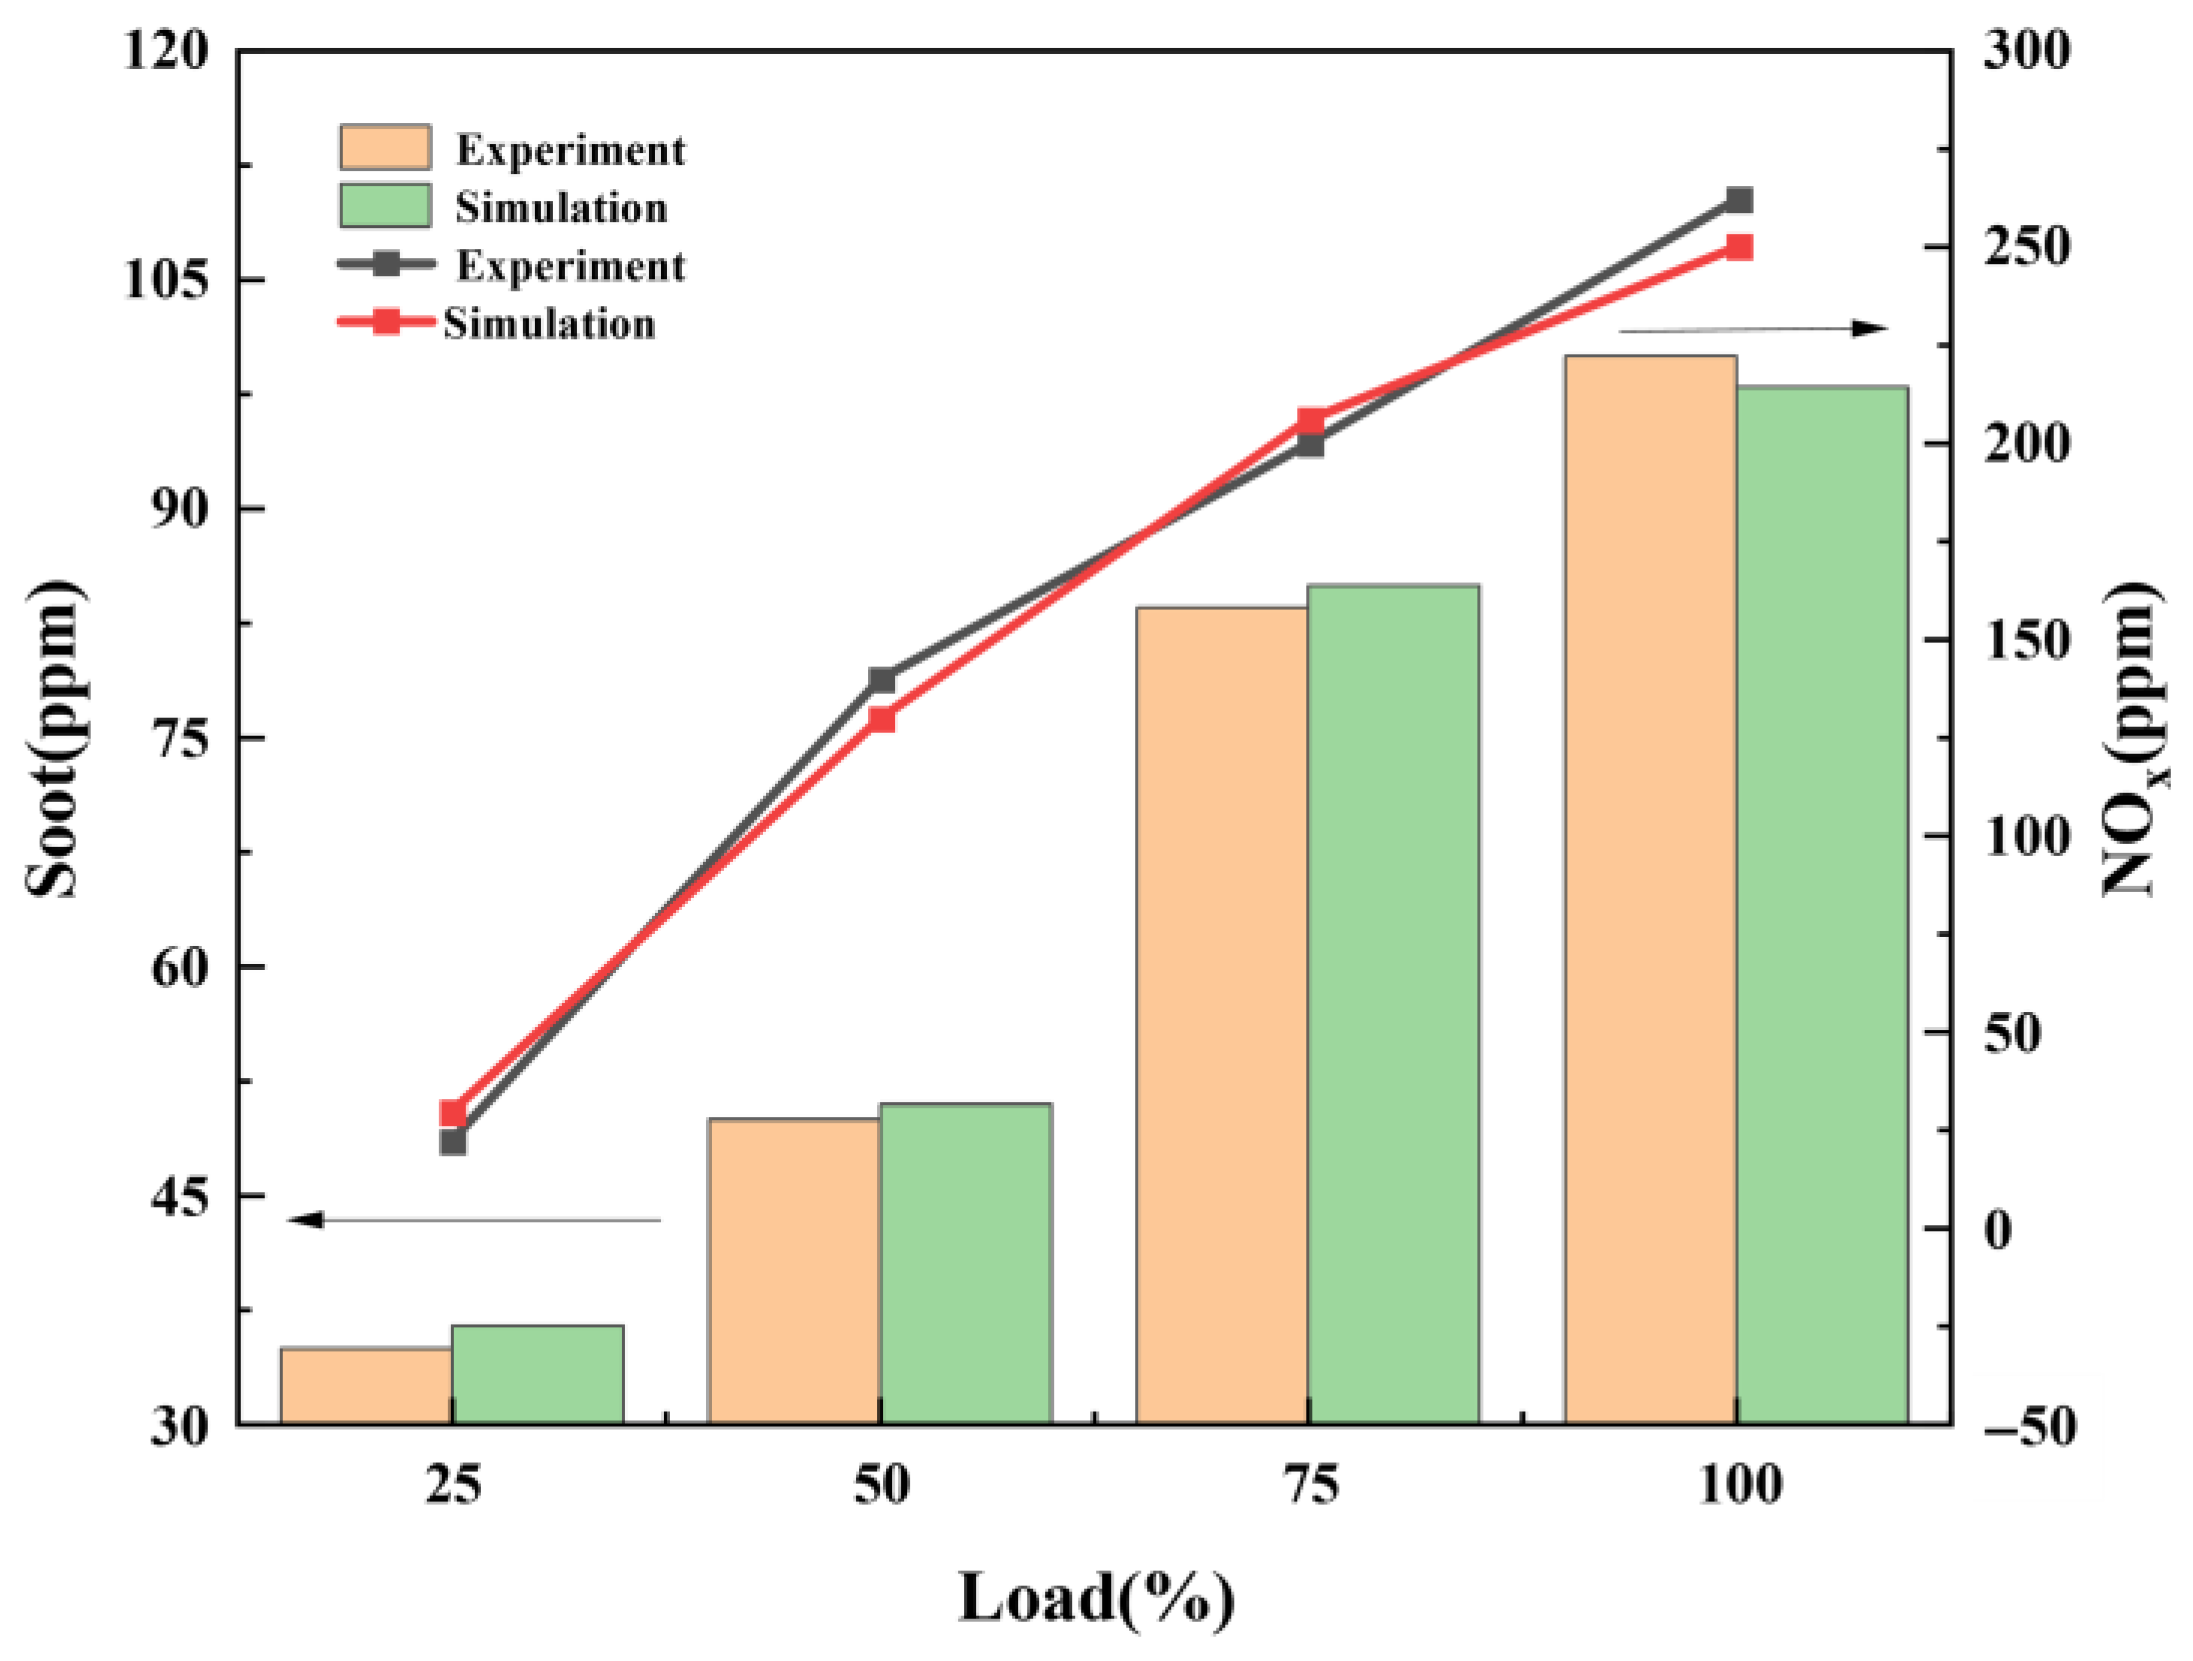
By altering the average mesh size, the 1/8 combustion chamber model was meshed to generate five distinct mesh configurations. The respective mesh counts were 12,331, 14,254, 15,805, 17,318, and 18,272. Mesh independence was validated using mean effective pressure as the evaluation metric. The data obtained are shown in Table 4. Table 4 reveals that the average effective pressure varies as the mesh is refined. Beyond 15,805 grids, the fluctuations diminish, and the relative error stabilizes at around 1.8%. Therefore, it is concluded that beyond 15,805 grids, the grid count has no significant impact on the simulation results. To reduce simulation computation time, this paper employs a mesh size of 15,805 for simulation testing. Figure 3 displays cylinder pressure and HRR curves under four load conditions. The strong match between simulation and experiment confirms the model’s validity. Figure 4 shows experimental and simulated emissions for both NOx and soot across four load levels. The simulated trends for NOx and soot emissions agree well with the experimental data, showing a maximum error below 5%. In the present study, model validation was mainly based on experimentally accessible parameters, including cylinder pressure, heat release rate, and major emission trends. Although additional validation parameters, such as in-cylinder temperature distribution, ignition delay, and combustion duration, would further strengthen confidence in the numerical model, these quantities were not independently measured or separately extracted for validation in the present work. Therefore, the current validation scope was clarified and should be regarded as a limitation of this study.

3. Results

The model is employed here to assess the individual and combined effects of the methanol blending ratio, fuel injection advance angle, and intake temperature on in-cylinder combustion and emissions.

3.1. Combustion Analysis

3.1.1. Cylinder Pressure

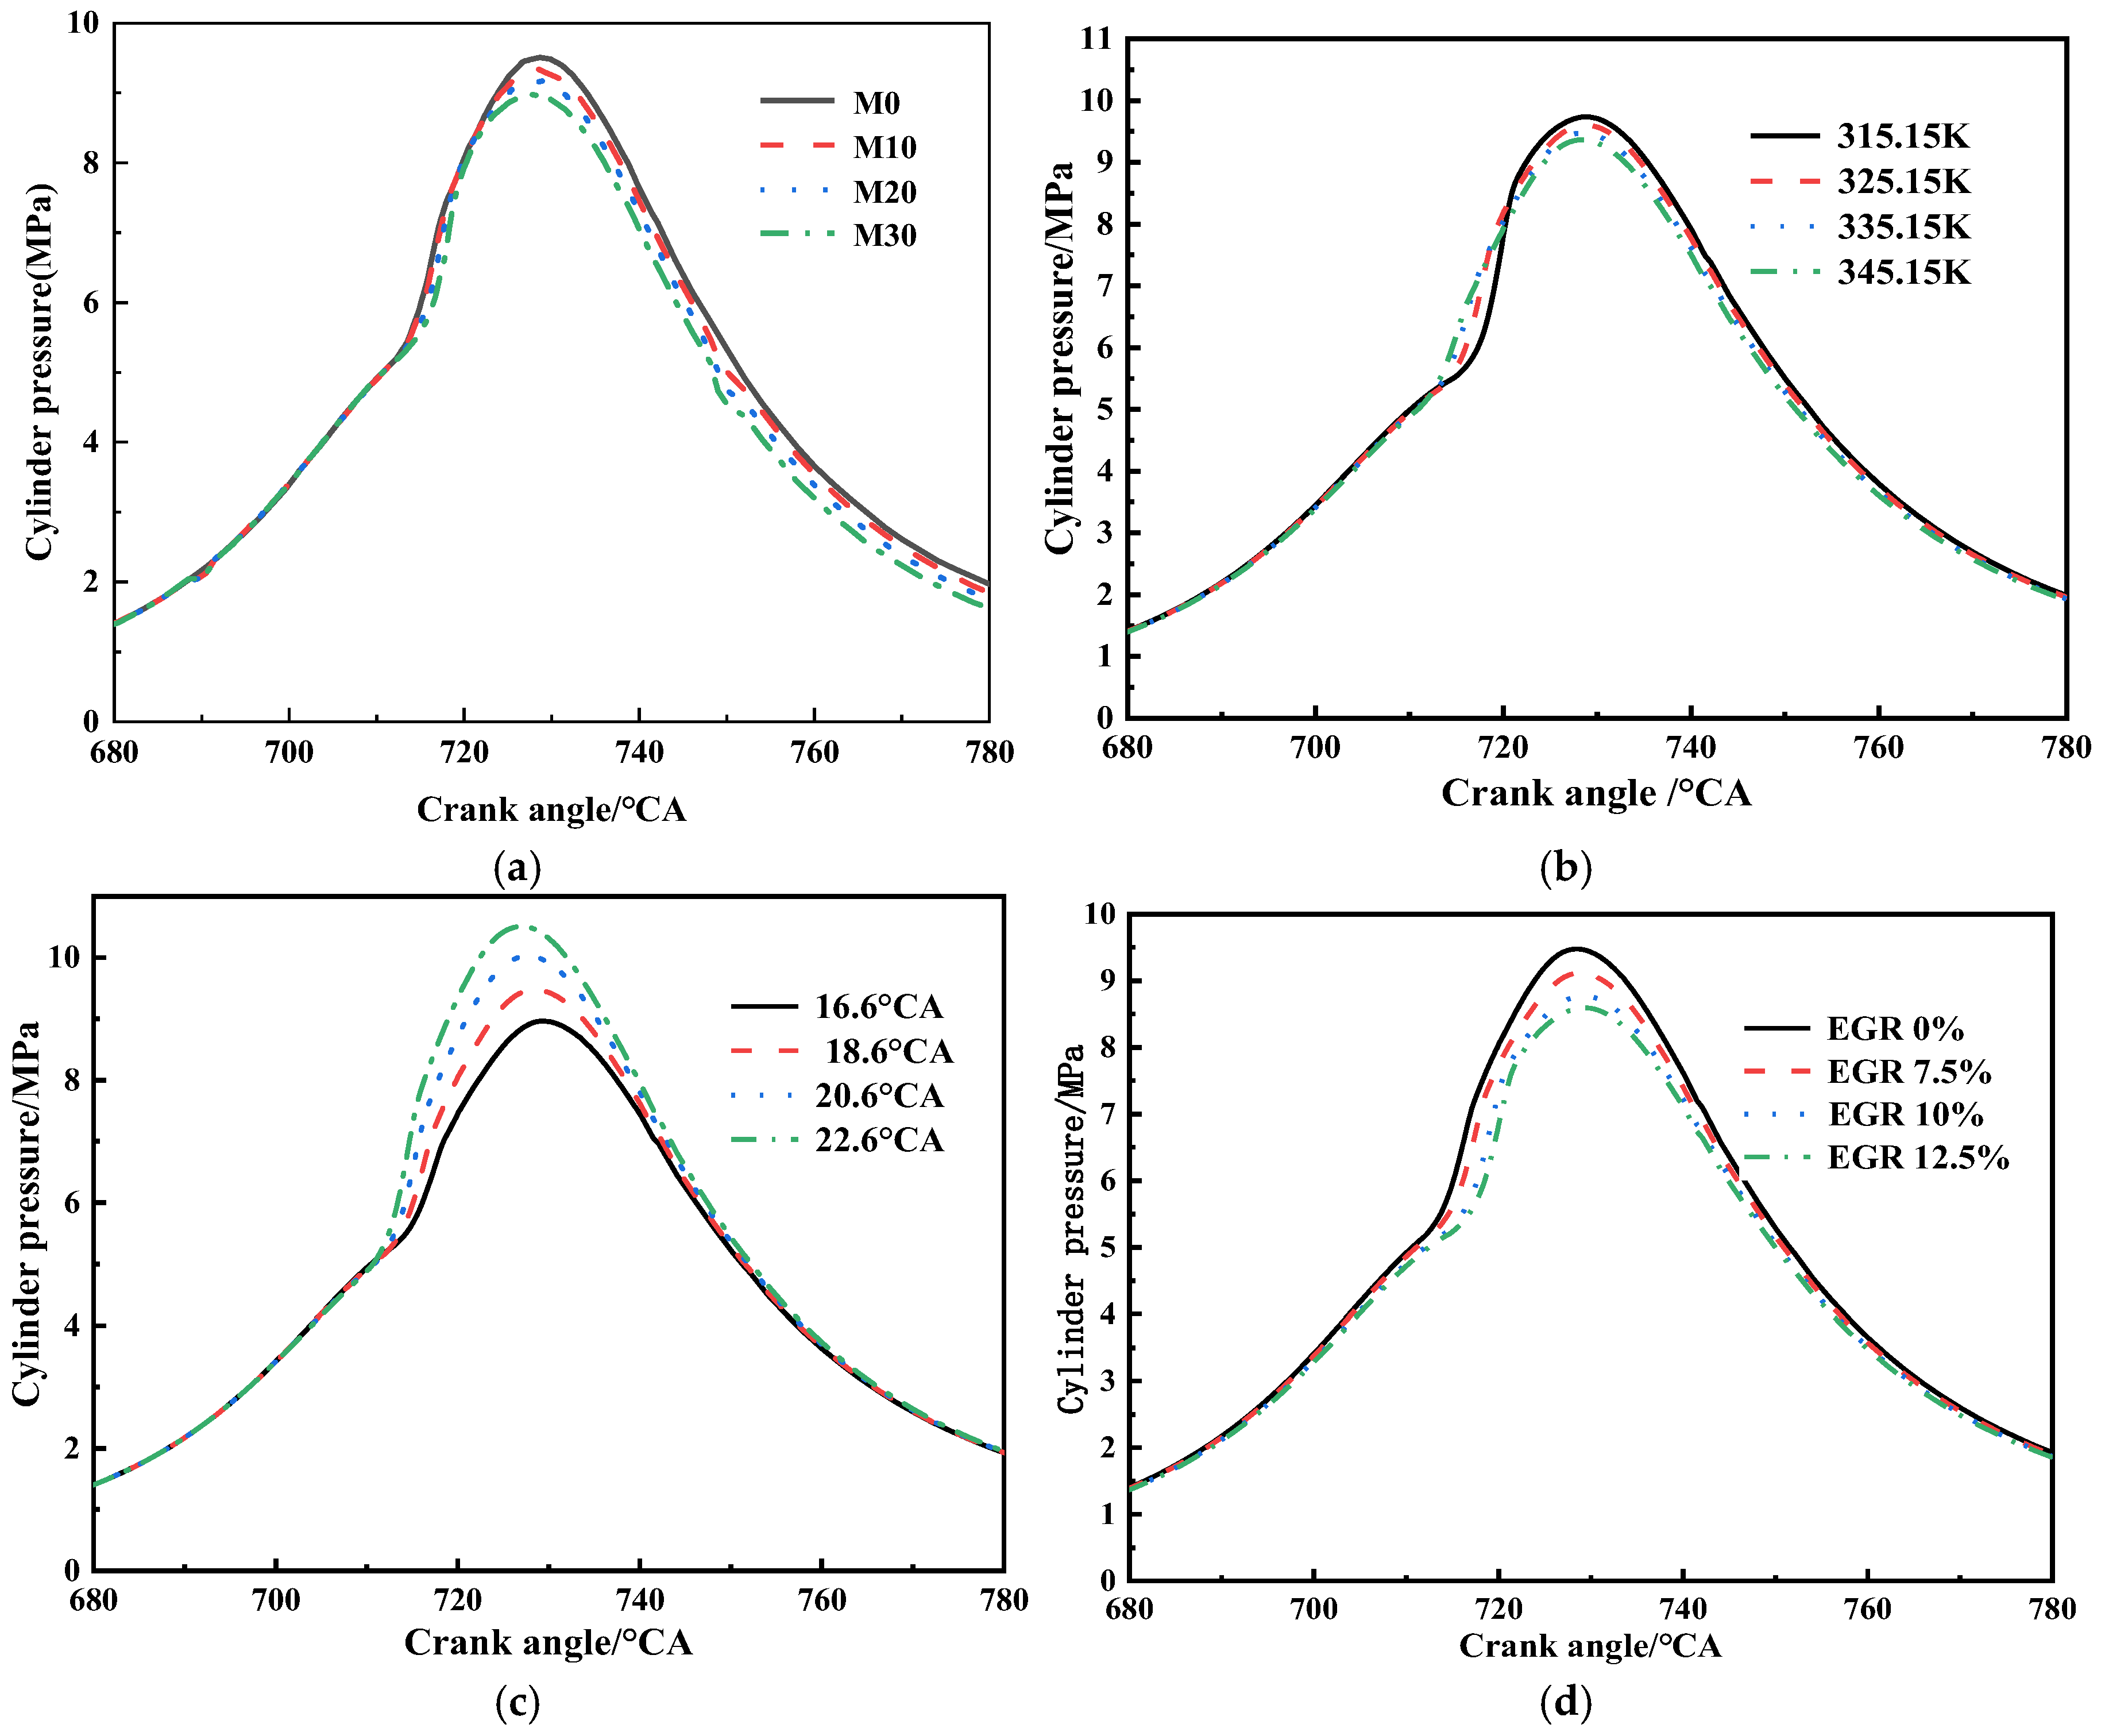
Figure 5a shows the cylinder pressure curve under different methanol blending ratios. As the methanol blending ratio increases, the peak cylinder pressure gradually decreases, and its occurrence shifts slightly away from the baseline diesel case. This trend indicates that the addition of methanol weakens the overall combustion intensity under the present operating conditions. The main reasons are the high latent heat of vaporization and low heating value of methanol, which reduce the in-cylinder temperature and slow down the energy release process. Although methanol contains oxygen, this effect does not fully compensate for the reduction in thermal intensity at higher blending ratios.
Figure 5b shows the cylinder pressure at different intake temperatures. As the intake temperature increases, the peak cylinder pressure increases, and the pressure peak shifts to an earlier crank angle. This indicates that a higher intake temperature promotes earlier combustion and a stronger in-cylinder pressure rise. According to the simulation results, the peak cylinder pressure rises from 7.89 MPa at 315.15 K to 9.81 MPa at 345.15 K, corresponding to an increase of 24.33%, while the peak phasing advances from 10.5 °CA ATDC to 8.9 °CA ATDC. This trend is consistent with the enhanced thermal conditions for ignition and combustion under higher intake temperature.
Figure 5c presents the cylinder pressure at different fuel injection advance angles. Advancing the injection timing causes the pressure curve to shift to an earlier crank angle and increases the peak cylinder pressure. This behavior is mainly associated with a longer premixing period before ignition, which improves mixture preparation and accelerates the main combustion process. As a result, combustion starts earlier, and the pressure peak becomes higher.
Figure 5d shows the cylinder pressure at different EGR rates. Increasing the EGR reduces the peak cylinder pressure and slightly delays its occurrence. Under 0% EGR, the peak pressure is 9.46 MPa and occurs at 8.5 °CA ATDC. When the EGR rate increases to 12.5%, the peak pressure decreases to 8.60 MPa, corresponding to a reduction of about 9.28%. This trend is mainly attributed to reduced oxygen availability and stronger inert-gas dilution under a high EGR, which suppresses combustion intensity and lowers the in-cylinder pressure level.

3.1.2. Cylinder Temperature

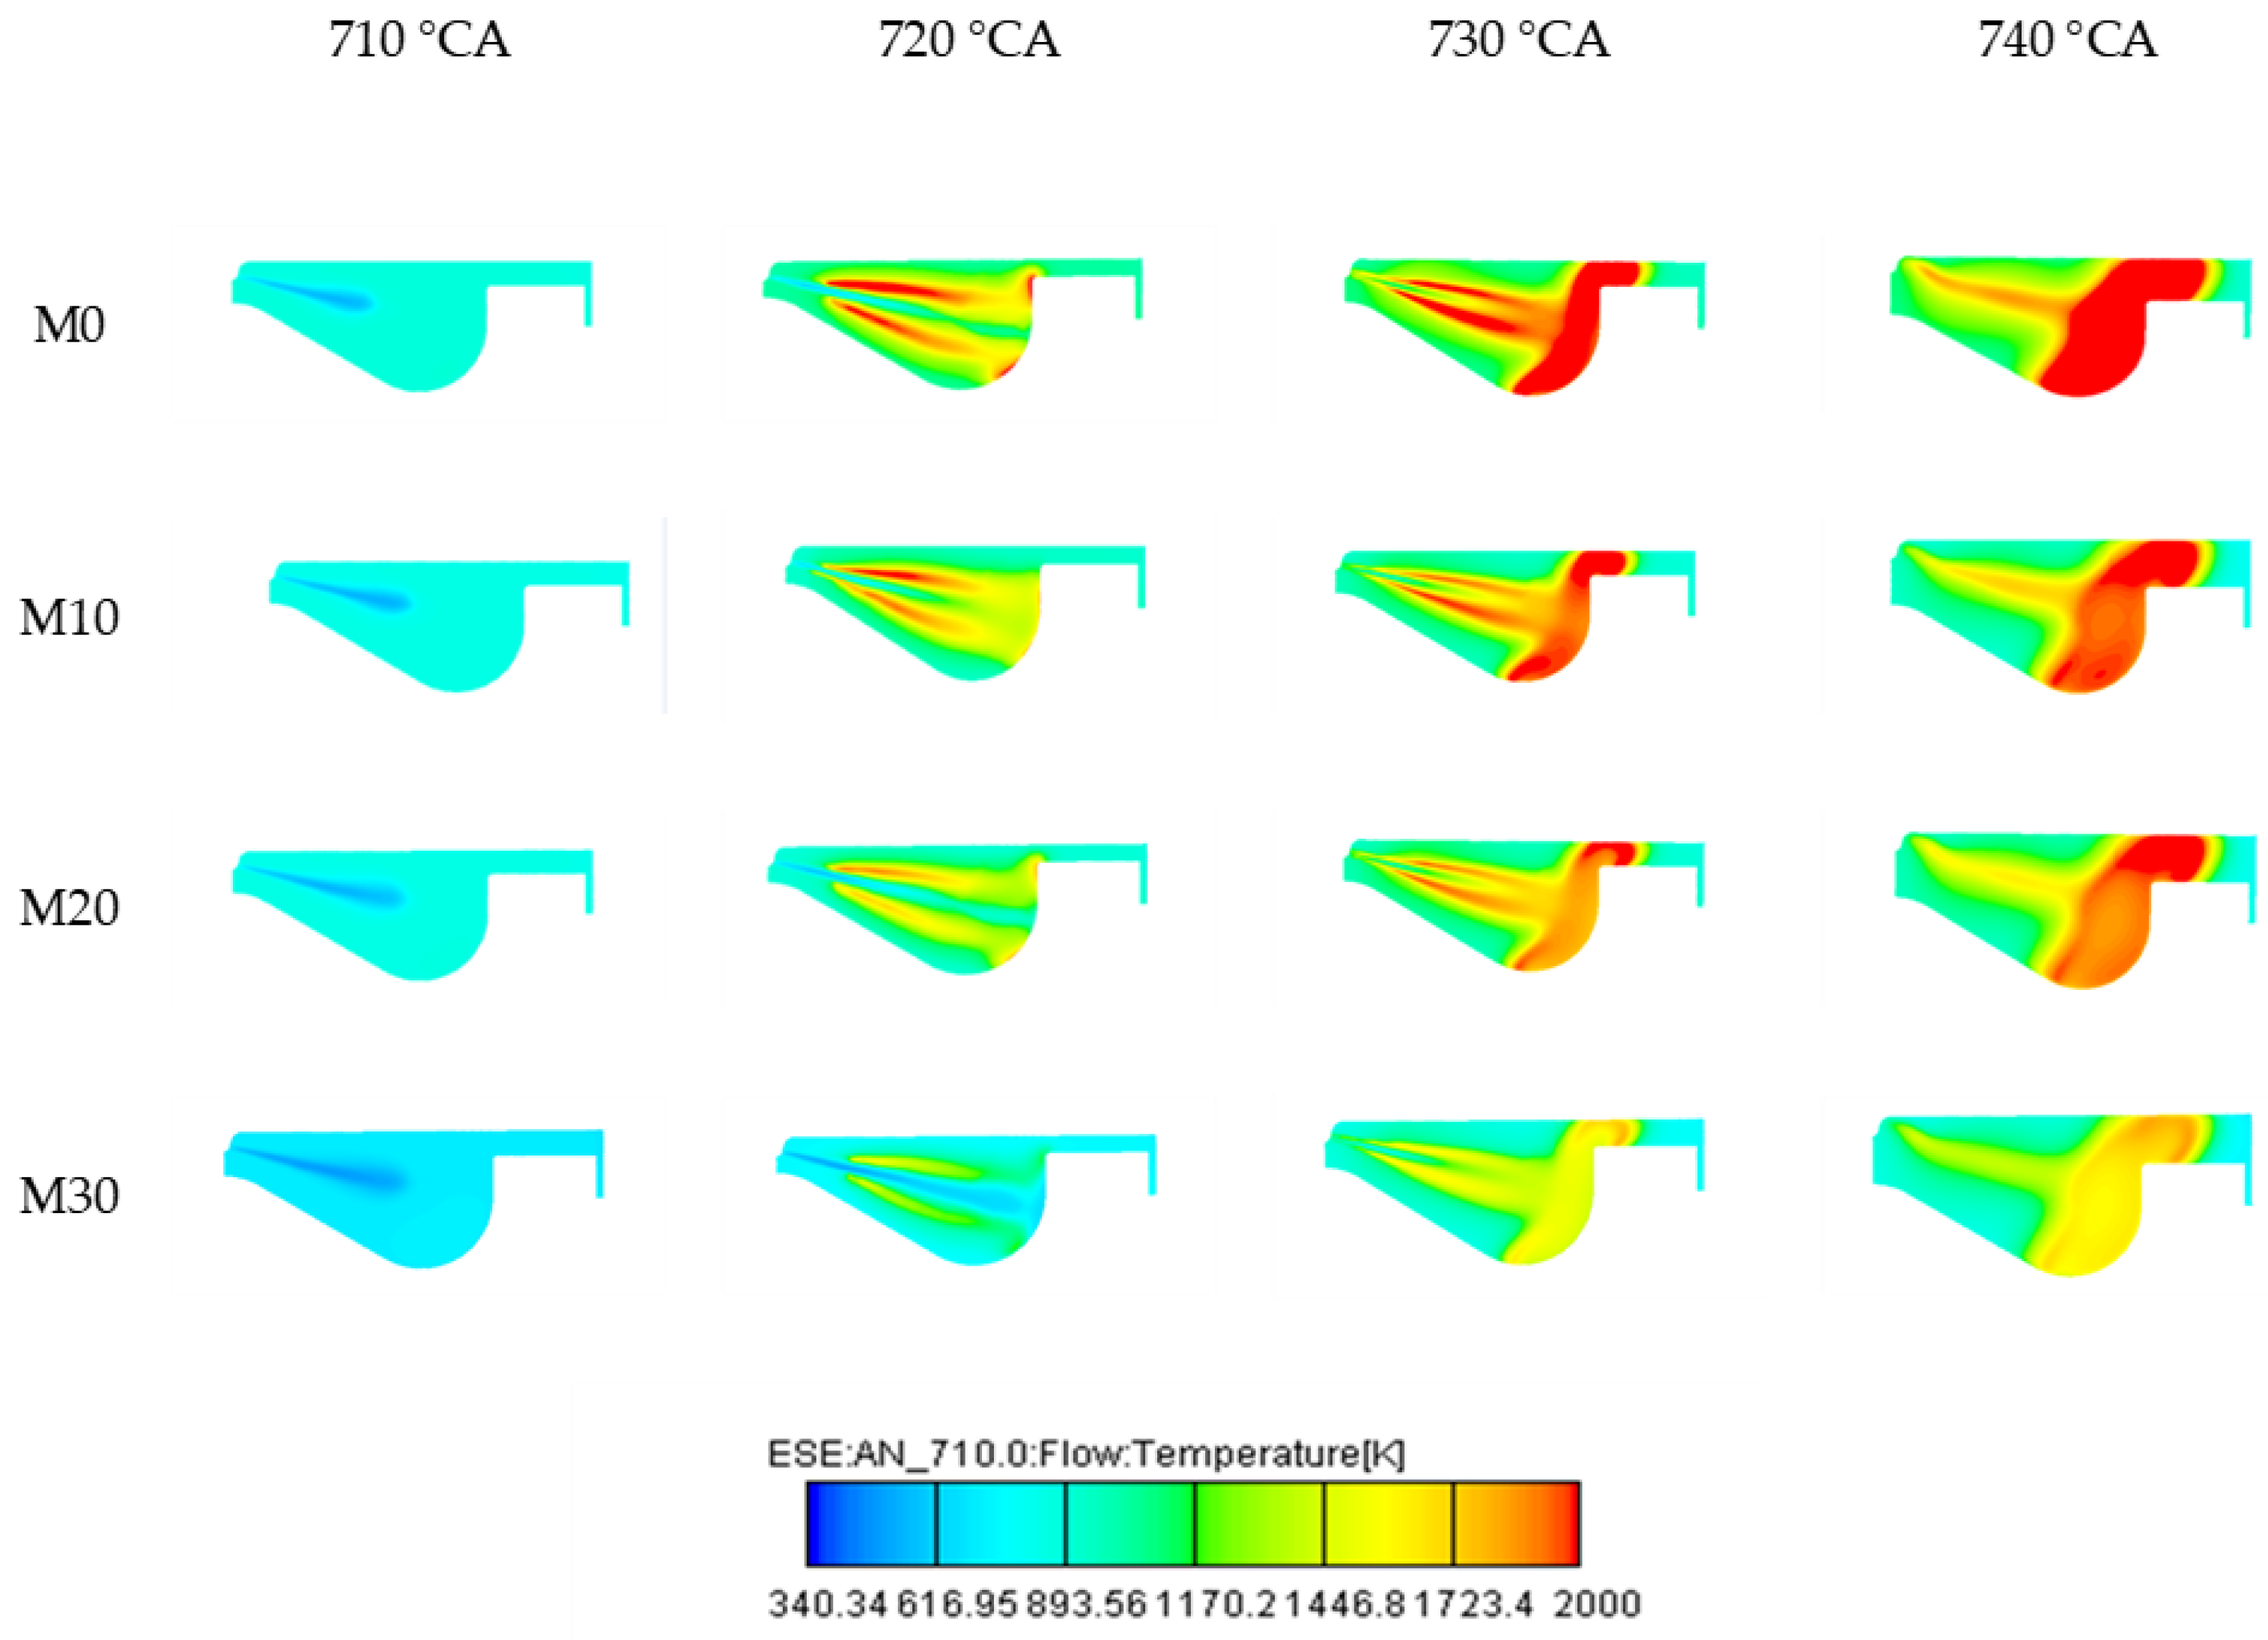
Figure 6 shows the cylinder temperature distribution under various methanol blending ratios. At the same methanol blending ratios, as the crank angle increases, the high-temperature zone expands from around the fuel injection axis toward the concave area within the cylinder. This is primarily because, as the ejected oil droplets strike the cylinder wall, they accumulate in the recesses of the cylinder and flow outward, gradually spreading throughout the cylinder. Simultaneously, combustion occurs randomly. This results in lower temperatures in the cylinder head and piston edge regions, while the bowl region and its surroundings exhibit higher temperatures, reaching up to 2000 K. At the same crank angle, it can be clearly observed that as methanol blending ratios gradually increase, the cylinder temperature decreases. Furthermore, the most significant drop occurs when the blending ratio reaches 30%. An advance in the crank angle of peak in-cylinder temperature is indicated by the simulation results. The peak temperature decreased from 1934 K under rated pure diesel mode to 1824 K at a 30% blending ratio, representing a reduction of approximately 5.69%. The crank angle position shifted earlier, moving from 738.7 °CA to 737.1 °CA. Several factors account for this behavior. Methanol possesses a high latent heat of vaporization. When added to diesel, it brings down both the ignition threshold and the peak combustion temperature. Methanol’s calorific value is under half that of diesel. Blending with diesel suppresses the heat released during burning, which directly decreases in-cylinder temperatures. Additionally, as more methanol is added to the fuel mixture, the crank angle gap between ignition onset and peak temperature narrows progressively. This occurs because after methanol combustion, its flame propagation rate exceeds that of pure diesel mode, shortening the rapid combustion phase and concentrating heat release.
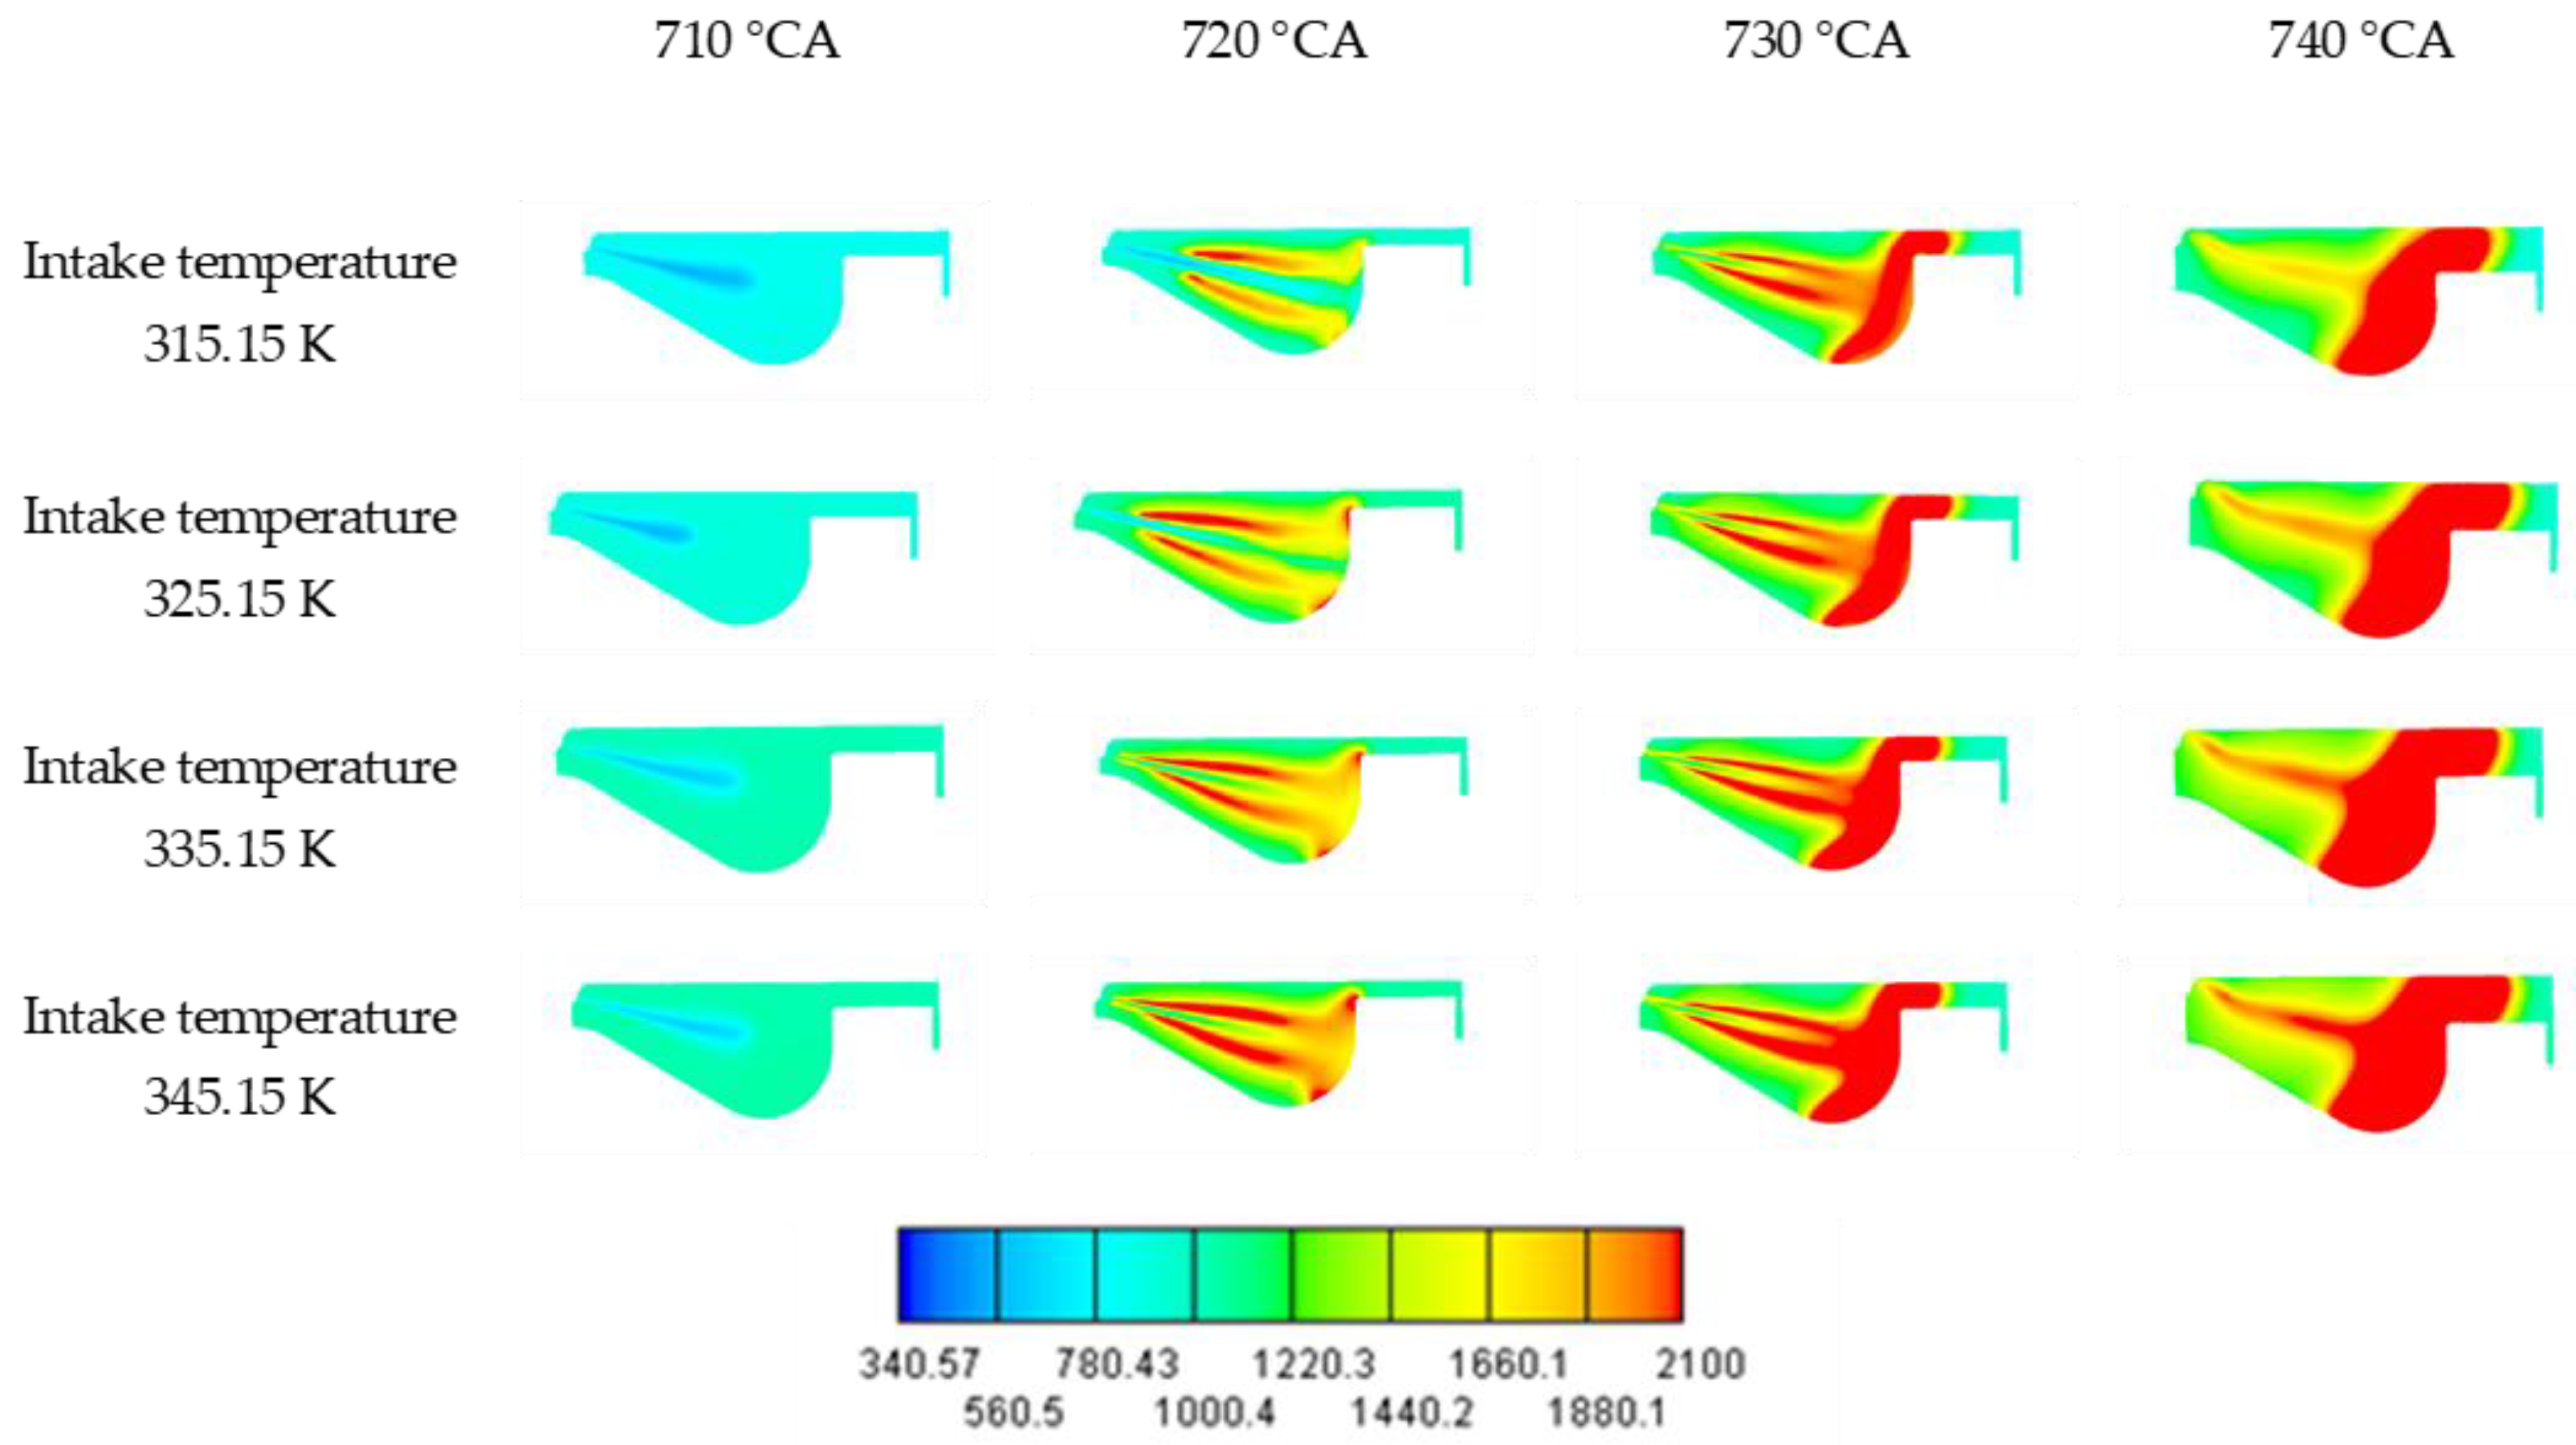
Figure 7 displays the temperature distribution under different intake temperatures. At a fixed crank angle, the cylinder temperature increases with increasing intake temperature, and the high-temperature region expands more rapidly throughout the chamber. The peak temperature rises from 1690 K at 315.15 K to 2049 K at 345.15 K, which corresponds to an increase of 21.24%. Meanwhile, the crank angle of peak temperature advances from 740.1 °CA to 739.1 °CA. These results indicate that higher intake temperature strengthens the thermal conditions for ignition and combustion, leading to earlier and more intense heat release.
Figure 8 shows the cylinder temperature distribution at different fuel injection advance angles. Vertically, the diagram clearly shows that at 710 °CA, the temperature at the fuel spray region within the cylinder is consistently lower than the surrounding areas. The thermal gap between the two zones widens steadily with an increasing fuel injection advance angle. When injection occurs at 720 °CA, the spray core near the nozzle remains persistently hotter than its surroundings. Earlier fuel injection shifts and spreads the thermal field, enlarging the high-temperature region at corresponding crank angles and locations. This is primarily due to the increased fuel injection advance angle, which extends the ignition delay period. Fuel and air mix more thoroughly and uniformly, resulting in a higher-quality mixture that optimizes combustion within the cylinder. Horizontally, the high-temperature region expands from the spray zone to the entire chamber as the piston moves. This behavior can be explained by two main factors. On the one hand, the oil jet is injected into the cylinder, colliding at the recessed area where phenomena such as adhesion and rebound occur. The oil droplets are dispersed, and combustion occurs instantaneously. On the other hand, the piston’s movement causes fuel droplets to disperse within the cylinder. Both the location of the peak in-cylinder temperature and the ignition event shift to earlier crank angles relative to the baseline case. Peak temperature rises to 8.58% when the fuel injection advance angle is increased from 18.6 °CA to 22.6 °CA, reaching 2100 K versus 1934 K. The corresponding crank angle advanced from 738.7 °CA to 736.3 °CA.
Figure 9 shows the cylinder temperature distribution under different EGR rates. Longitudinally, higher EGR rates deepen the blue tint of the temperature field, reflecting cooler conditions inside the cylinder. At 20 °CA after TDC, the temperature in the piston bowl decreases significantly. This is primarily because, as the EGR ratio increases, the concentration of inert gases in the cylinder rises. Both the combustion environment and process are compromised. Under high EGR rates, the oxygen concentration in the cylinder decreases, and the dilution effect of inert gases becomes stronger, which suppresses combustion and lowers the in-cylinder temperature. Horizontally, the thermal field at 10 °CA ATDC is restricted to the area immediately surrounding the oil jet. As the piston moves downward, the oil jet strikes the cylinder wall and splashes outward, causing the fuel to ignite. Consequently, the high-temperature zone expands.

3.1.3. Heat Release Rate

Figure 10a displays HRR at four methanol blending ratios. As the methanol blending ratio increases, the peak HRR gradually rises. As the methanol blending ratio increases, the peak HRR gradually rises and its phasing shifts to a later crank angle. Meanwhile, the double-peak profile observed under pure diesel operation gradually changes into a smoother single-peak profile. This behavior is mainly attributed to the longer ignition delay and more concentrated heat release caused by methanol addition. In addition, the oxygenated nature of methanol promotes more intense combustion once ignition occurs, which contributes to the increase in peak HRR.
Figure 10b reveals that higher intake temperatures mildly suppress the overall HRR; they cause a sharp decline in its peak and a distinct advance in its phasing. As the intake temperature increases, combustion phasing advances, and the peak HRR decreases. Compared with the baseline intake temperature of 335.15 K, the maximum HRR increases from 87.27 J/°CA at 716.5 °CA to 163.62 J/°CA at 714.7 °CA when the intake temperature is reduced to 315.15 K, corresponding to an increase of 87.49%. This result indicates that lower intake temperature improves the main heat release intensity under the present condition, whereas higher intake temperature weakens the overall combustion intensity.
Figure 10c shows the in-cylinder HRR at different fuel injection advance angles. Advancing the injection timing shifts the HRR curve to an earlier crank angle and increases the peak HRR. When the injection advance angle increases from 18.6 °CA to 22.6 °CA, the peak HRR rises from 87.27 J/°CA to 126.21 J/°CA, which is an increase of 44.62%. This trend is mainly associated with a longer premixing time before ignition, which improves mixture preparation and strengthens the main heat release.
Figure 10d shows the HRR at four EGR rates. With increasing EGR, the HRR peak shifts to a later crank angle, while its magnitude increases noticeably at EGR rates of 10% and 12.5%. This behavior reflects two competing effects: EGR reduces oxygen availability and slows combustion development, but the corresponding increase in ignition delay can also enhance premixing before ignition, leading to a sharper main heat release event.

3.2. Emission Characteristics

3.2.1. Carbon Monoxide Emission

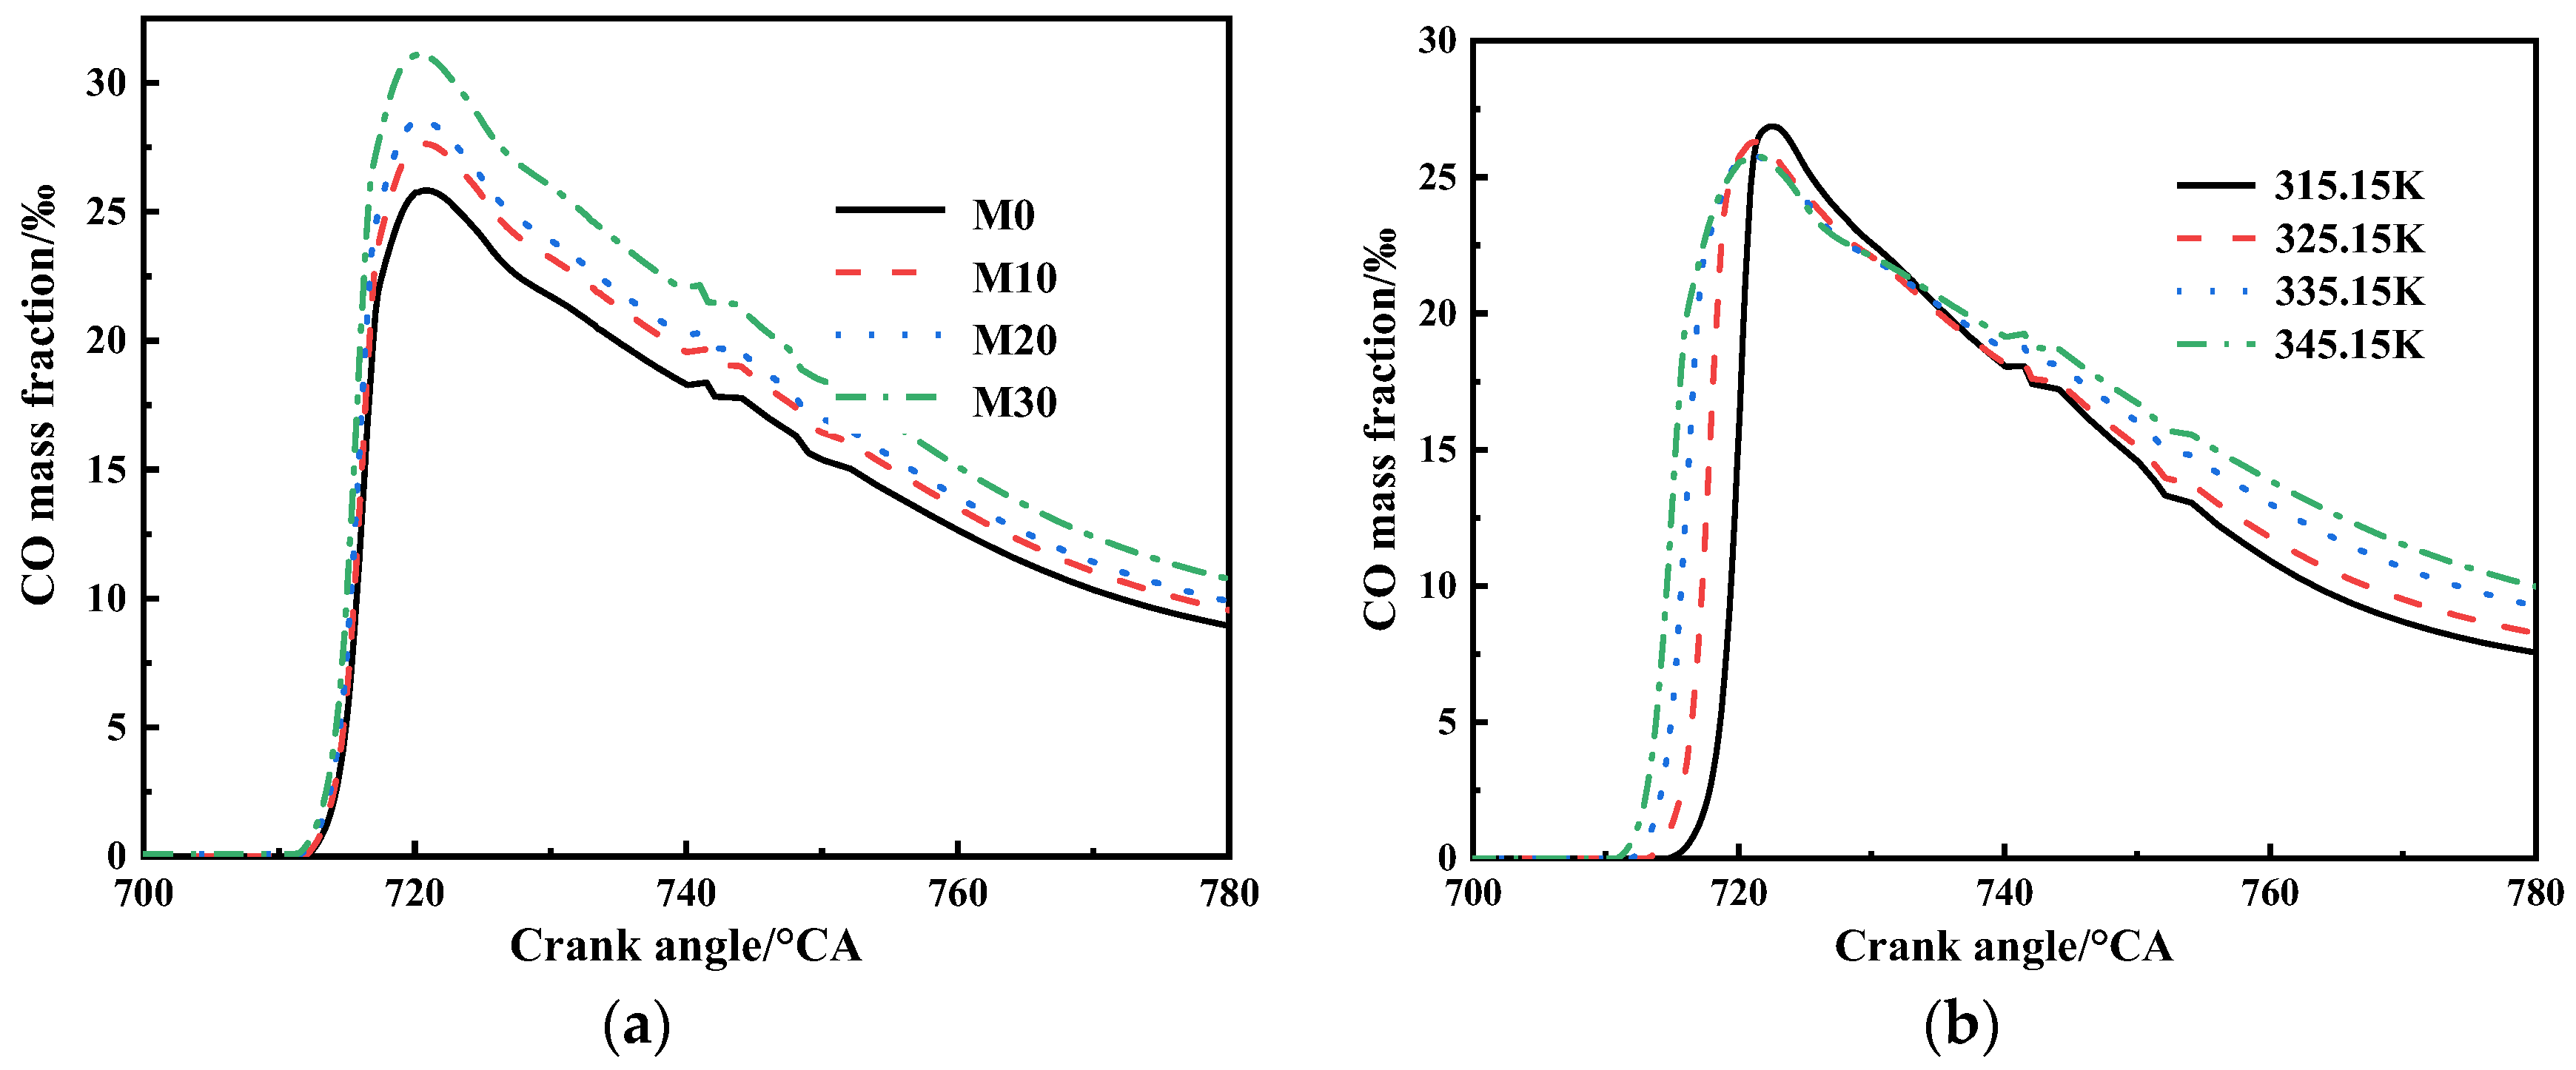
Figure 11a displays the CO mass fraction at different methanol blending ratios. The CO mass fraction increases significantly with an increasing methanol blending ratio. CO increased by 9.1% at a 20% blend versus pure diesel, while the largest increase in CO mass fraction occurred at a blending ratio of 30%. The formation of CO requires low temperatures, oxygen deficiency, and oxidation time. Several factors contribute to this phenomenon. Two notable properties of methanol are its elevated vaporization heat and its relatively low heating value. Its addition lowers combustion temperature, creating a low-temperature environment conducive to CO formation, thereby promoting CO production. With methanol in the blend, the in-cylinder process combines diesel’s diffusion flame with premixed methanol combustion. Higher methanol blending ratios lower the diesel equivalent ratio, thereby narrowing the ignition window and weakening the ignition energy of diesel. This leads to incomplete combustion and increased CO emissions. Additionally, the oxidation of CO to CO2 requires reactive OH ions, and the addition of methanol converts these reactive OH ions into inert H2O2. This decelerates CO burnout and amplifies its net formation.
Figure 11b shows the CO mass fraction curve at different intake temperatures. As shown in the figure, the overall curve shifts to the right. The peak mass fraction curve of CO generation decreases as the intake temperature gradually increases. However, the final generation amount increases, corresponding to a significantly earlier crank angle. The reason for this situation is that CO is produced under low-temperature, oxygen-deficient conditions. Higher intake temperatures during the initial combustion phase drive down the maximum CO level. As combustion proceeds into its later stages, the lower intake temperature does not introduce additional air into the cylinder at that time; instead, it increases the intake of air density during the intake process, resulting in a larger mass of trapped air and higher oxygen availability for subsequent oxidation reactions.
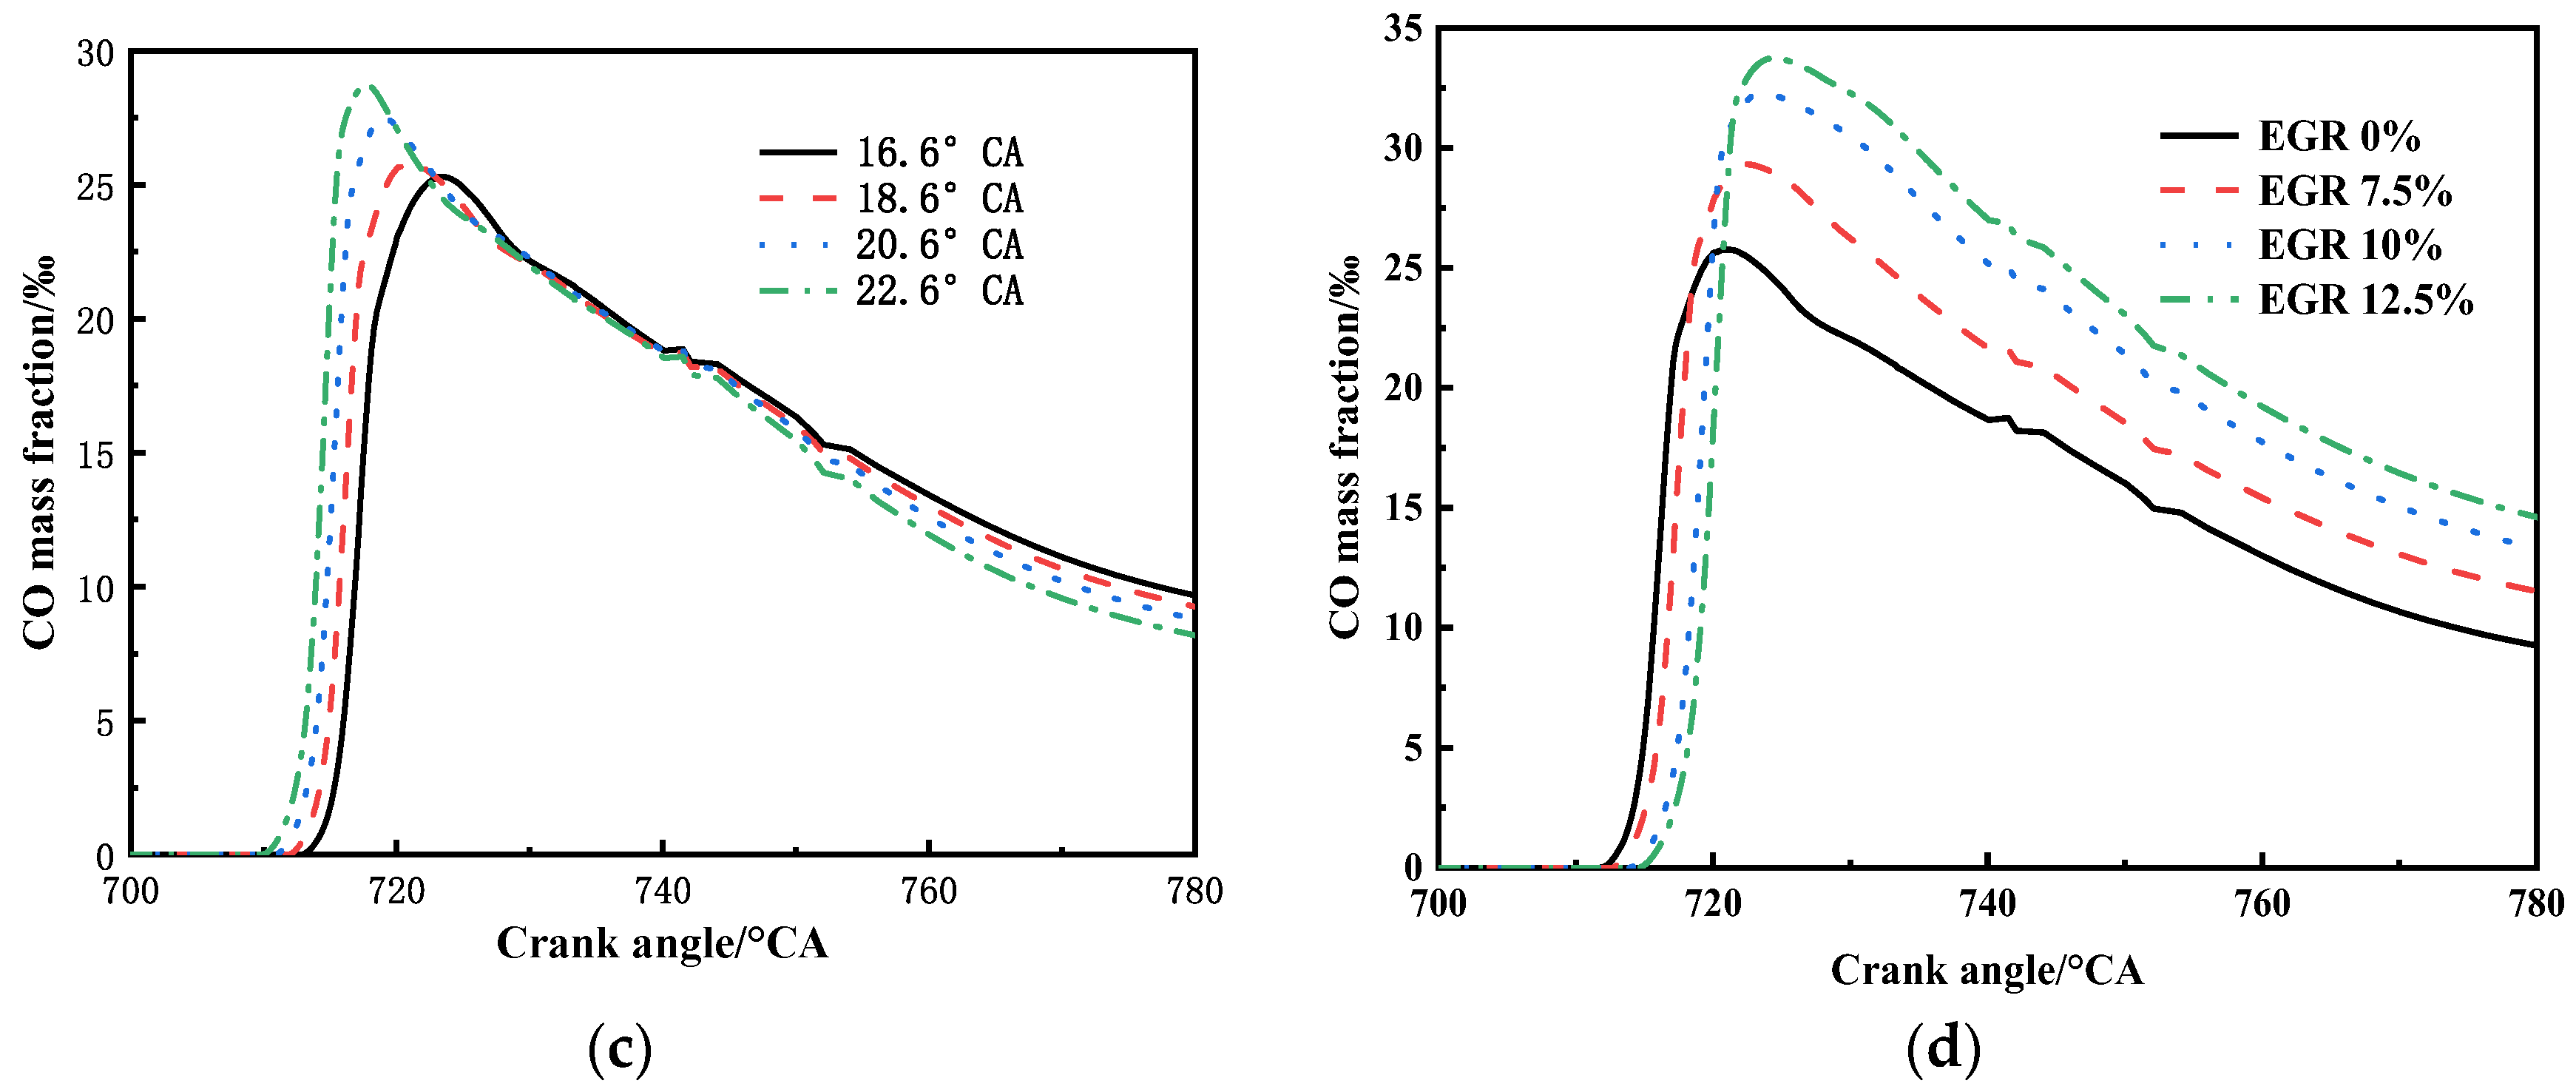
Figure 11c shows the CO mass fraction at different fuel injection advance angles. A clear forward displacement of the CO curve accompanies increases in the fuel injection advance angle. Higher and earlier HRR peaks are accompanied by a progressive drop in the final CO mass fraction. A larger fuel injection advance angle extends the ignition delay period but improves mixture quality, accounting for the observed combustion characteristics. The improved combustion is accompanied by a noticeable rise in both cylinder pressure and temperature. Combustion commences, consuming oxygen within the cylinder to create an oxygen-deficient environment that promotes CO formation. At 730 °CA, the curve changes. The CO mass fraction generated by the large fuel injection advance angle decreases, gradually falling below that of the small fuel injection advance angle. This is primarily because the small fuel injection advance angle corresponds to a delayed combustion initiation point, which coincides with the initial phase of CO formation reactions. In contrast, the large fuel injection advance angle has already passed this stage. A larger fuel injection advance angle enables more thorough combustion, yielding a lower terminal CO mass fraction than its smaller counterpart.
Figure 11d plots the evolution of CO mass fraction under varying EGR levels. As EGR gradually increases, CO emissions also rise and their generation time gradually becomes later. With EGR rising from 0% to 10%, the CO mass fraction increases by 33.92%. Introducing EGR introduces inert gases that crowd out fresh air and deplete the oxygen available for combustion. With temperatures dropping and oxygen running low inside the cylinder, the conditions are set for substantial CO production. The introduction of EGR increases specific heat and, thus, decreases the volumetric gas mass. This lowers oxygen concentration, exacerbating the low-oxygen environment in the cylinder and further increasing CO production.

3.2.2. Nitrogen Oxide Emission

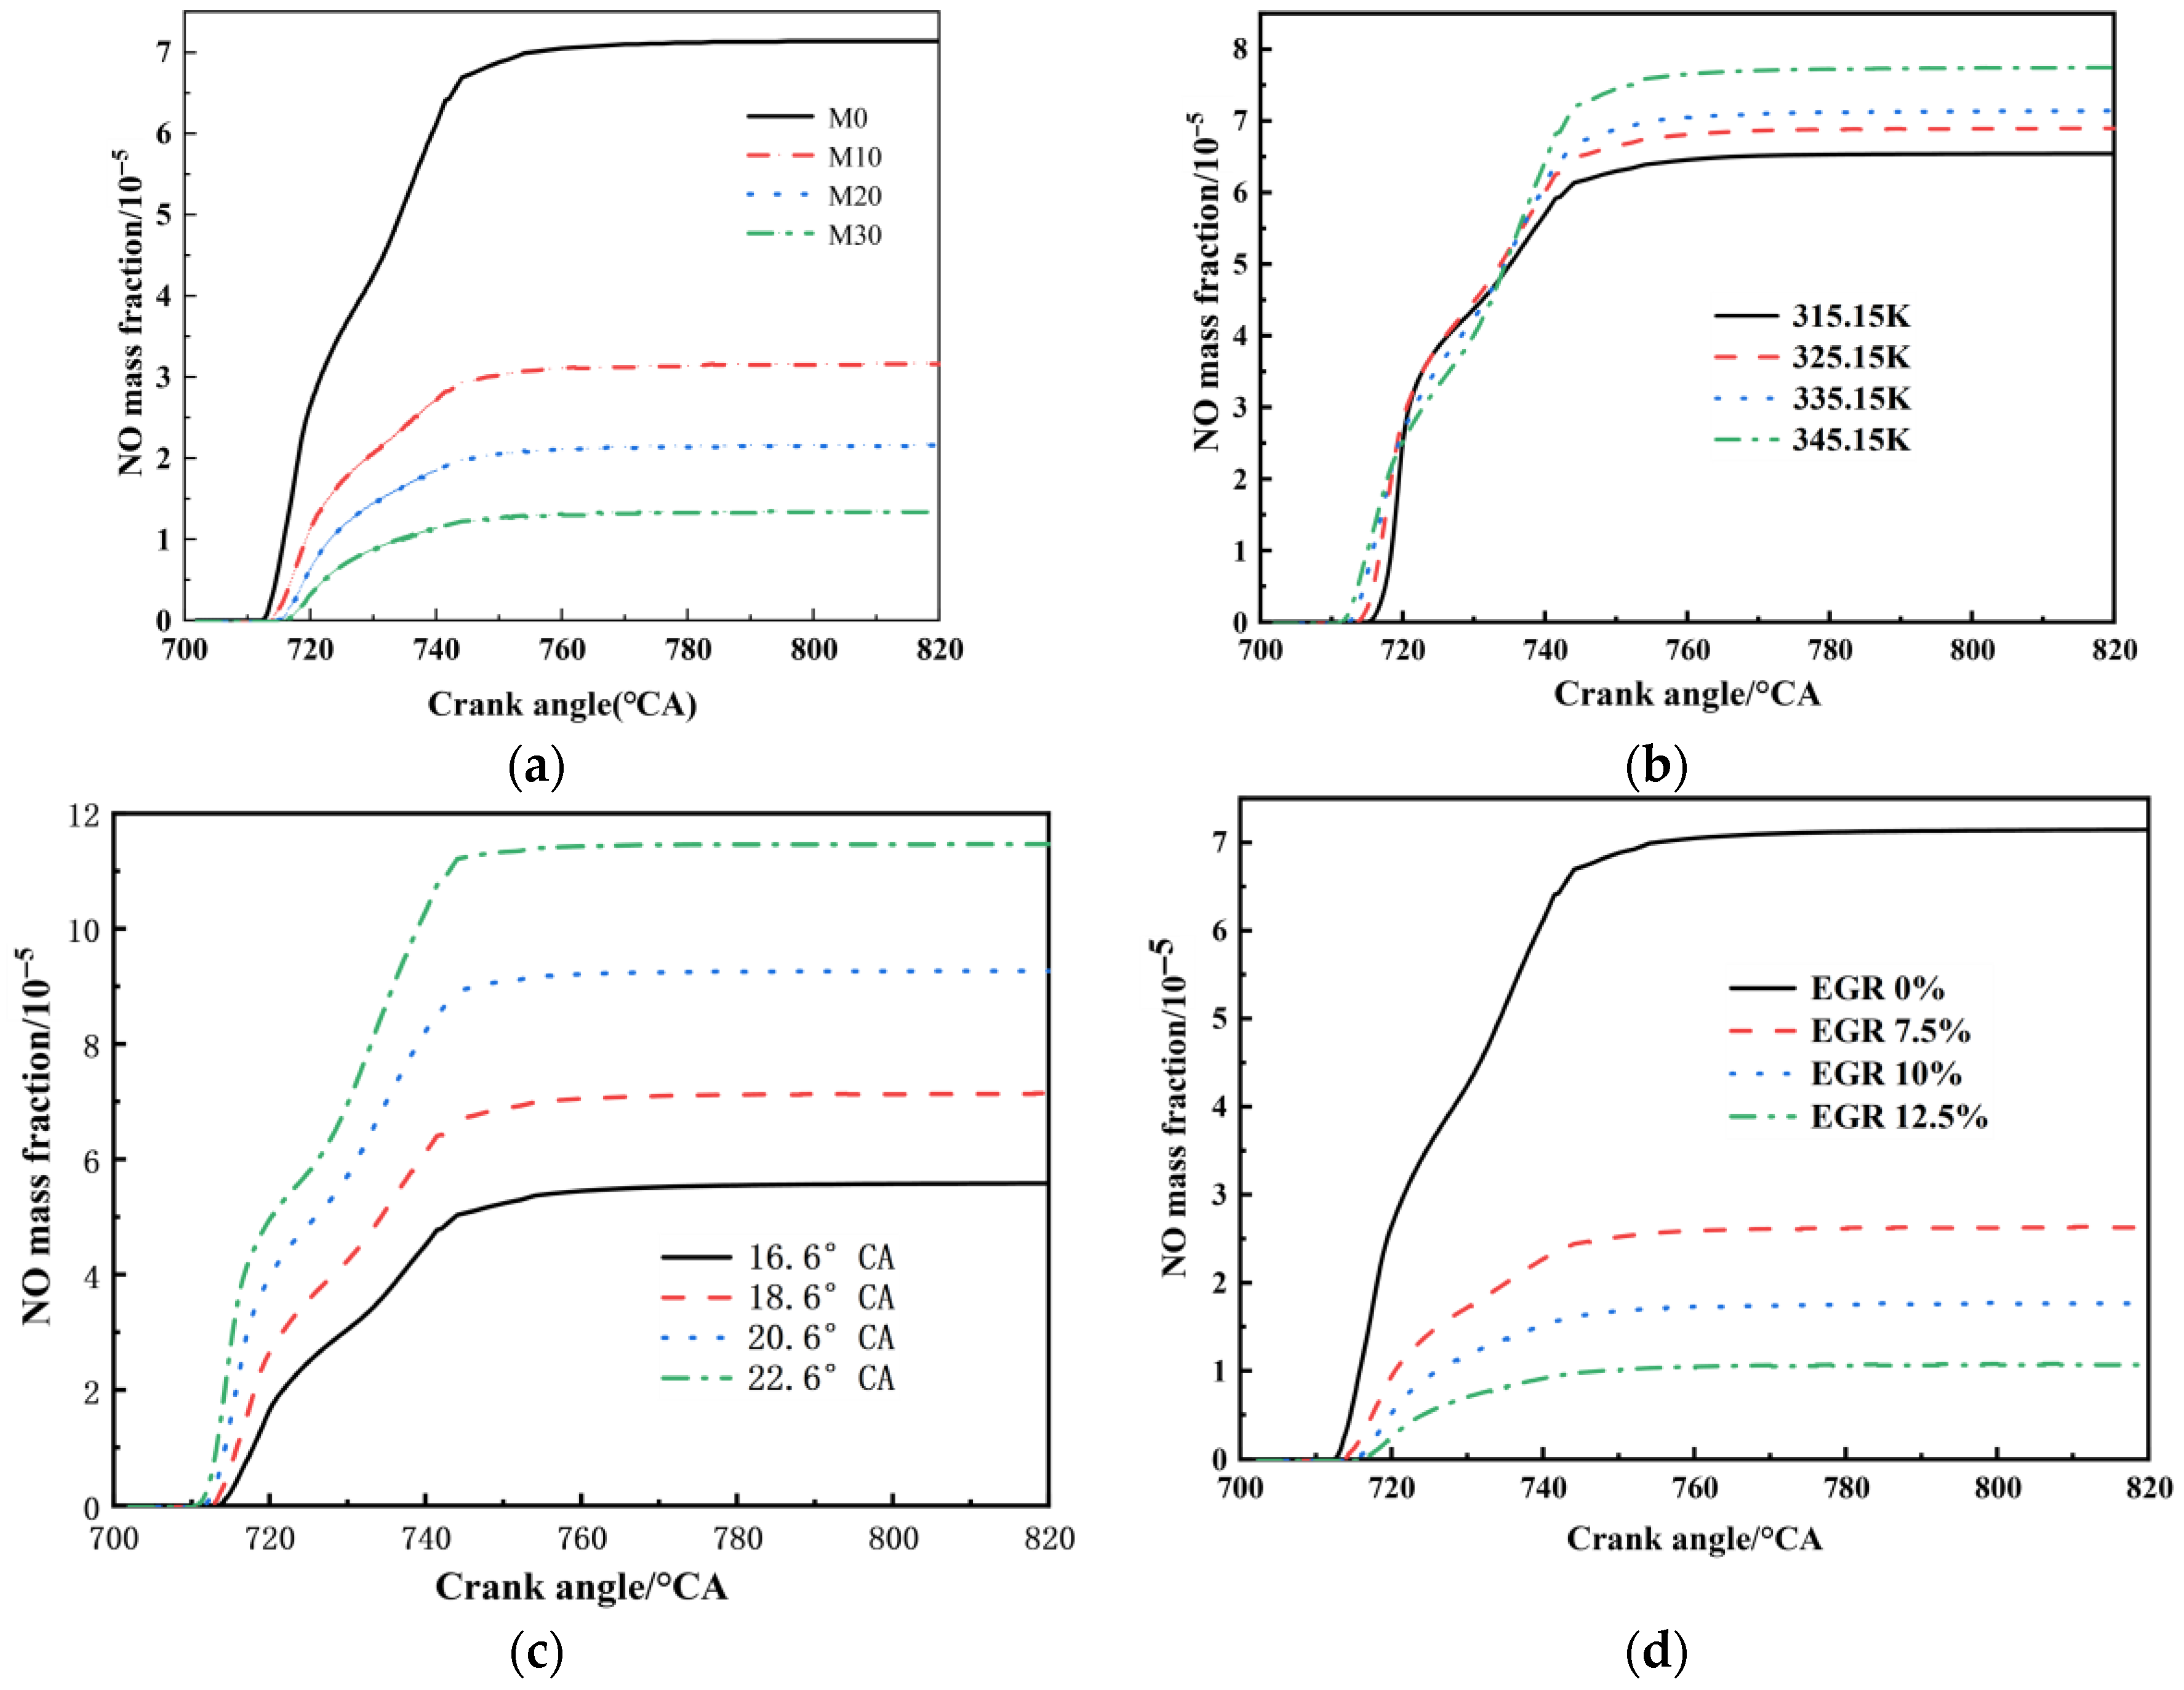
The evolution of the NO mass fraction with the methanol blending ratio is presented in Figure 12a. NO emissions decline steadily with increasing methanol content in the blend. On the one hand, the addition of methanol, with its high latent heat of vaporization, lowers combustion temperatures and shortens the duration of elevated thermal conditions. On the other hand, since methanol contains no nitrogen, the amount of nitrogen involved in combustion is reduced. In summary, the NO emission mass fraction decreases as the methanol blending ratios increase. With 20% methanol in the blend, the resulting NO mass fraction decreased to 2.71 × 10⁻⁵. This is roughly 62.1% lower than the 7.15 × 10⁻⁵ recorded for pure diesel operation. With methanol blending ratios up to 30%, the corresponding NO mass fraction was 1.35 × 10⁻⁵, representing an 88.11% reduction compared to pure diesel engines.
Figure 12b shows a NO mass fraction curve under various intake temperatures. The NO mass fraction produced increases continuously with rising intake temperatures. Progressive advances are observed in the crank angles marking both combustion initiation and peak NO generation. Due to thermal expansion and contraction of air, gas cools and contracts at low intake temperatures. The oxygen content of the air entering the cylinder increases, creating an oxygen-rich environment within the cylinder. Early in combustion, the in-cylinder thermal variation remains modest. Consequently, fluctuations occur in the curve during this early stage, where the NO mass produced at 315.5 K and 325.15 K exceeds that generated at 335.5 K and 345.15 K within a short timeframe. However, the temperature disparity across the combustion chamber widens progressively as burning proceeds. Moreover, temperature plays a primary role in NO formation. Consequently, the total NO mass produced at 335.5 K and 345.15 K exceeds that generated at 315.5 K and 325.15 K. The intake temperature of the original engine is 335.15 K, with a NO mass fraction of 7.14 × 10⁻⁵. With air intake at 315.15 K, the NO mass fraction is 6.54 × 10⁻⁵, which represents a reduction of 8.40% relative to the original engine. An intake temperature of 325.15 K yields a NO mass fraction of 6.9 × 10⁻⁵, which is 3.36% below that of the original engine. At an intake temperature of 345.15 K, the mass fraction of NO generated is 7.75 × 10⁻⁵, representing an increase of approximately 7.87% compared to the baseline engine.
The NO mass fraction as a function of the fuel injection advance angle is given in Figure 12c. A clear positive correlation exists between the fuel injection advance angle and the resulting NO mass fraction. Moreover, the onset of NO generation occurs earlier. This is primarily because increasing the fuel injection advance angle prolongs the ignition delay period. Fuel–air mixing is improved, leading to enhanced combustion efficiency, elevated temperatures, and increased cylinder pressure. Moreover, the greater the fuel injection advance angle, the more significantly the cylinder temperature and pressure increase. Elevated temperatures trigger vigorous bonding of oxygen and nitrogen atoms inside the cylinder, sharply raising NO levels. At a baseline fuel injection advance angle of 18.6 °CA, the NO mass fraction is 7.14 × 10⁻⁵. Reducing the angle to 16.6 °CA lowers it to 5.59 × 10⁻⁵, which is a decrease of 21.71%. Increasing the angle to 20.6 °CA and 22.6 °CA raises it to 9.27 × 10⁻⁵ and 1.15 × 10⁻⁴, respectively, corresponding to gains of 29.83% and 61.1%.
Figure 12d shows the NO emission mass fraction curves for different EGR rates. The EGR demonstrates a significant inhibitory effect on NO emissions. This reduction is most pronounced when the EGR increases from 0% to 7.5%. In this range, the NO emissions decrease sharply from 7.14 × 10⁻⁵ to 2.64 × 10⁻⁵, representing a substantial reduction of 63.03%. Overall, increasing EGR suppresses NO formation across the tested range. This can be traced to the following causes. First, with EGR activated, the cylinder’s oxygen supply drops sharply due to dilution of the intake charge. This disrupts the combustion environment. Consequently, it lowers both the peak and average temperatures during the combustion process. Ultimately, this cuts off the primary pathways for NO formation. Additionally, it is clearly observable that the phase angle corresponding to the NO generation point shifts backward as the EGR increases. This finding corroborates the earlier observation of delayed combustion and initiation points based on the cylinder pressure and HRR.
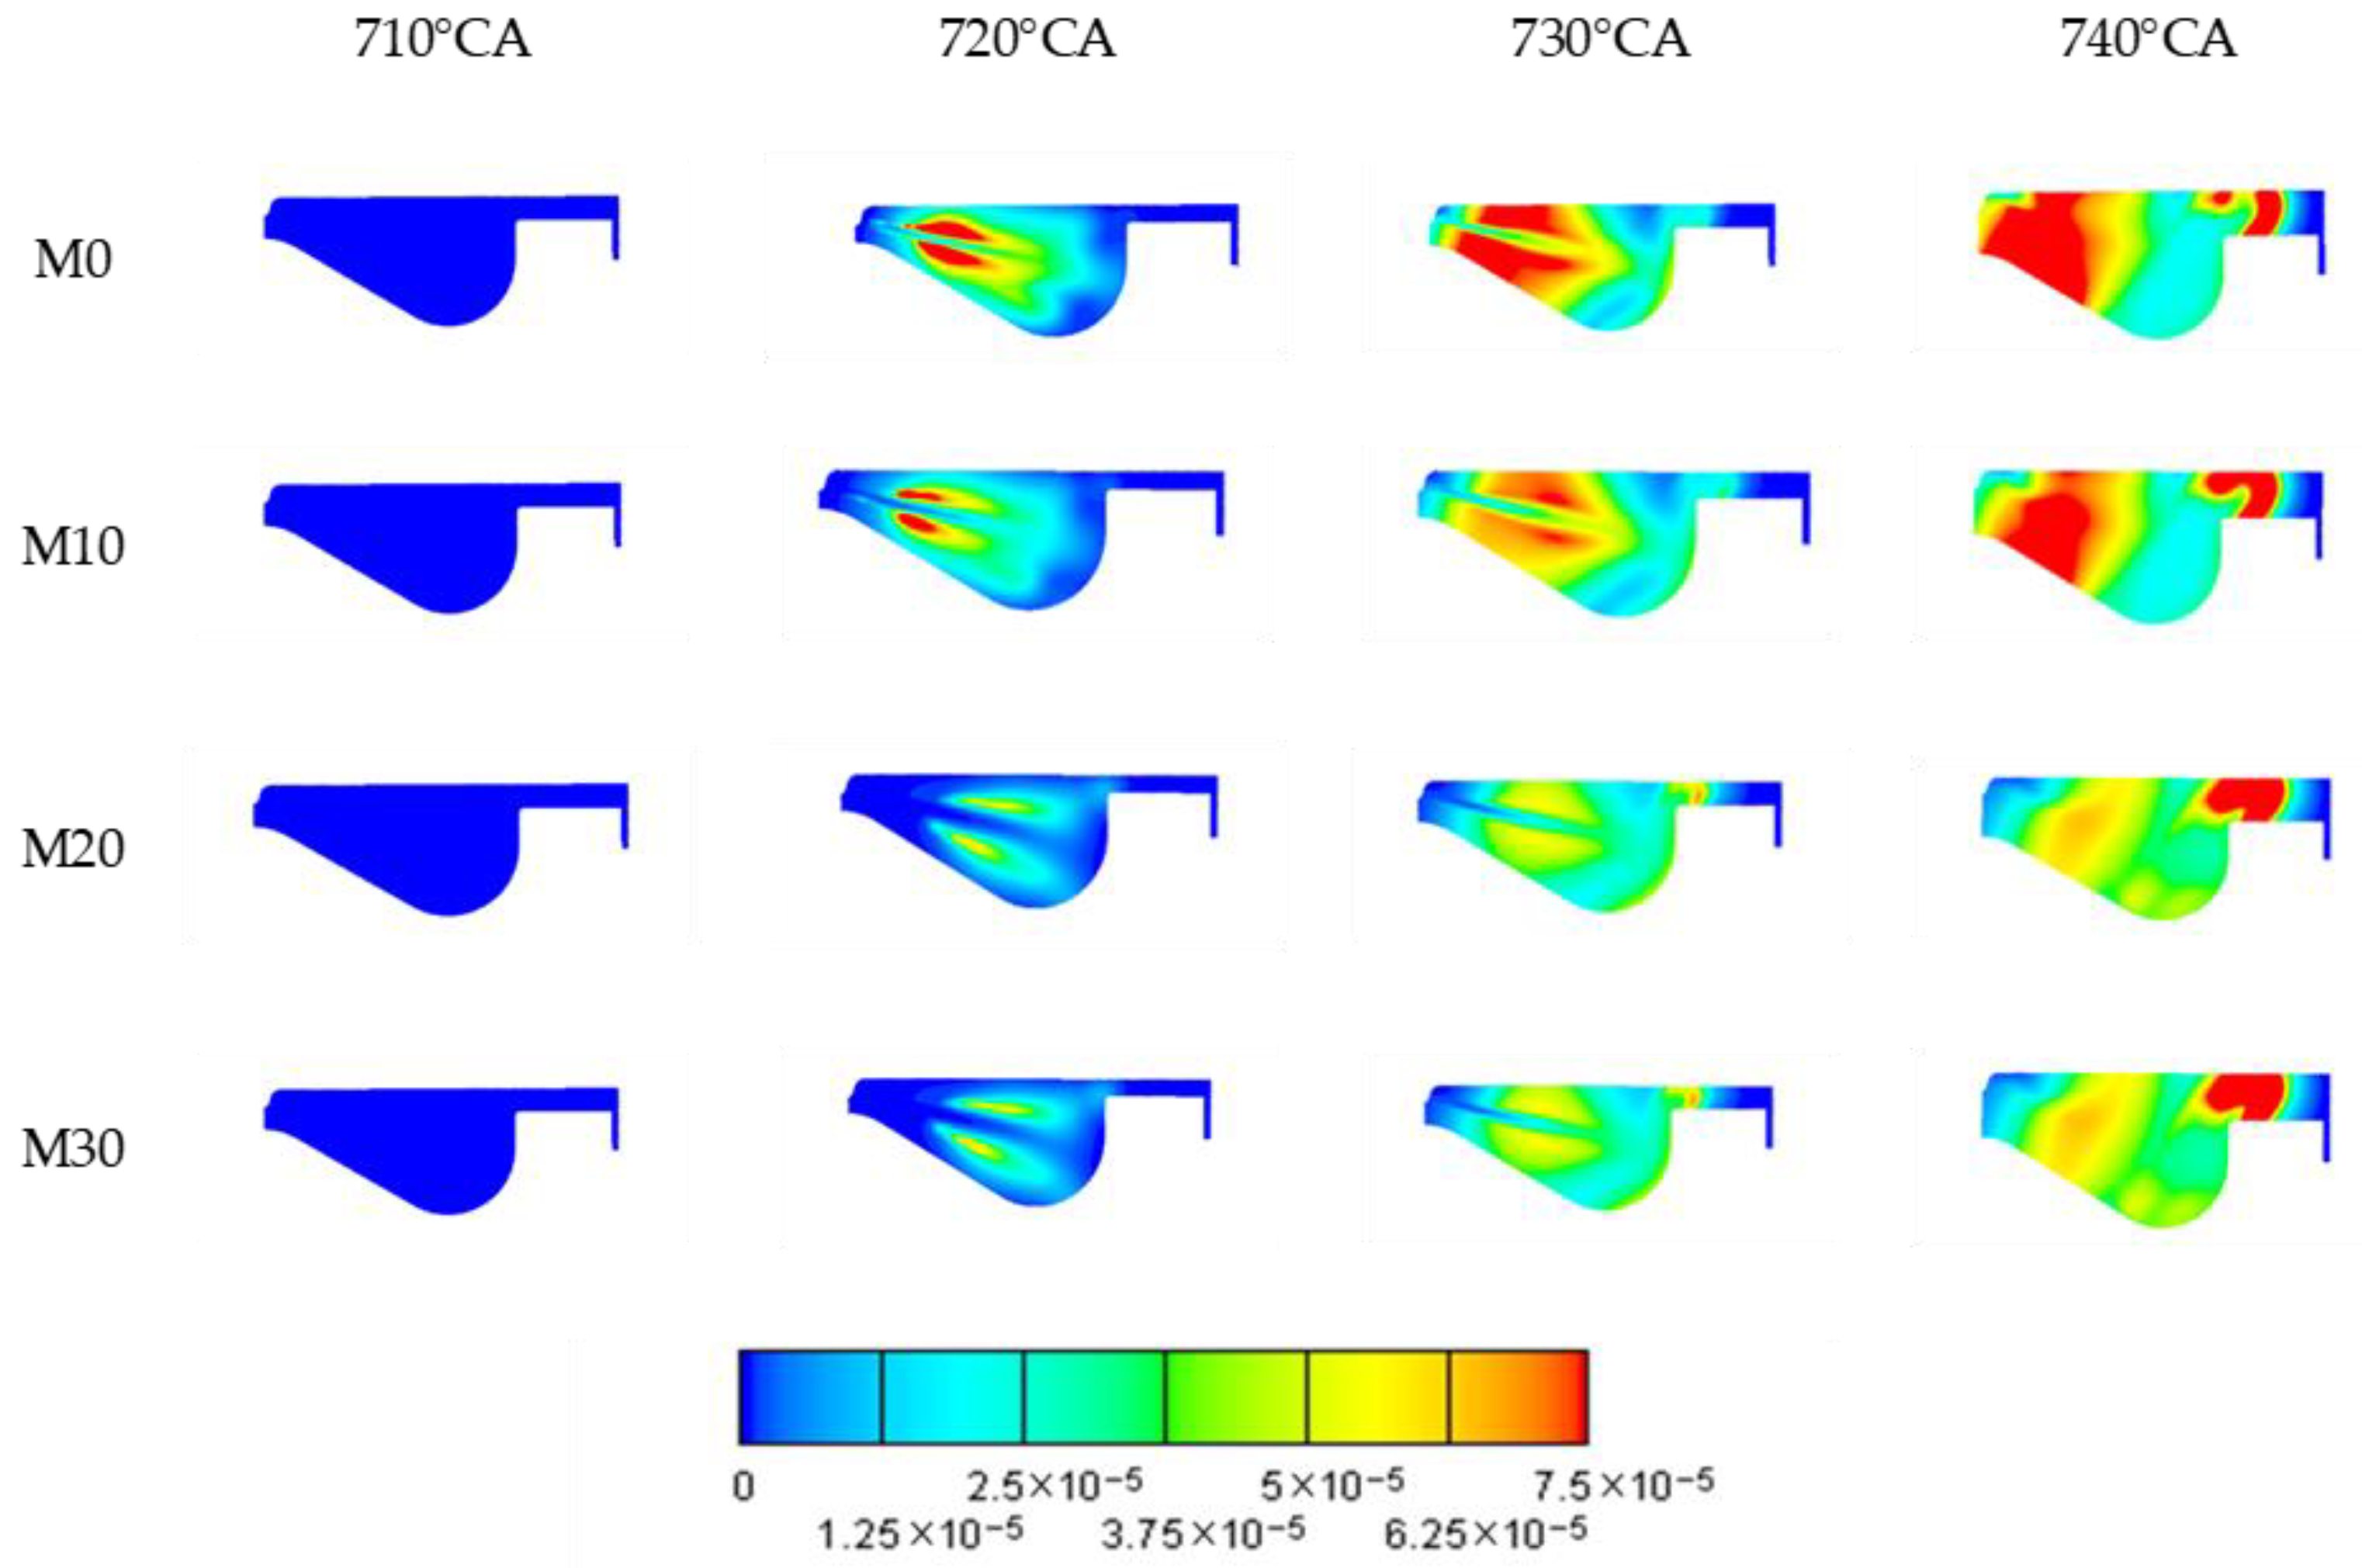
Figure 13 shows the NO concentration field at different methanol blending ratios. At 710 °CA, the cross-sectional views for all fuel blending ratios are uniformly blue, indicating zero NO concentration. This is because the cylinder temperature at 710 °CA has not yet reached the ignition point of the blended fuel, and thus, no combustion occurs. The HRR increases after 710 °C, indicating that combustion occurs within the cylinder. Horizontally, at the same blending ratio, as the crank angle gradually increases, the NO concentration in the cylinder rises. At 720 °CA, it first forms around the nozzle oil jet and subsequently diffuses into the cylinder’s concave area. Longitudinally, a clear inverse correlation links the methanol blending ratio and NO concentration. The addition of methanol raises in-cylinder oxygen levels, which, in turn, refines the combustion process. However, because methanol has high latent heat during vaporization, more heat is absorbed when the injected blended fuel droplets evaporate, which lowers the local in-cylinder temperature. Consequently, the NO concentration decreases substantially.
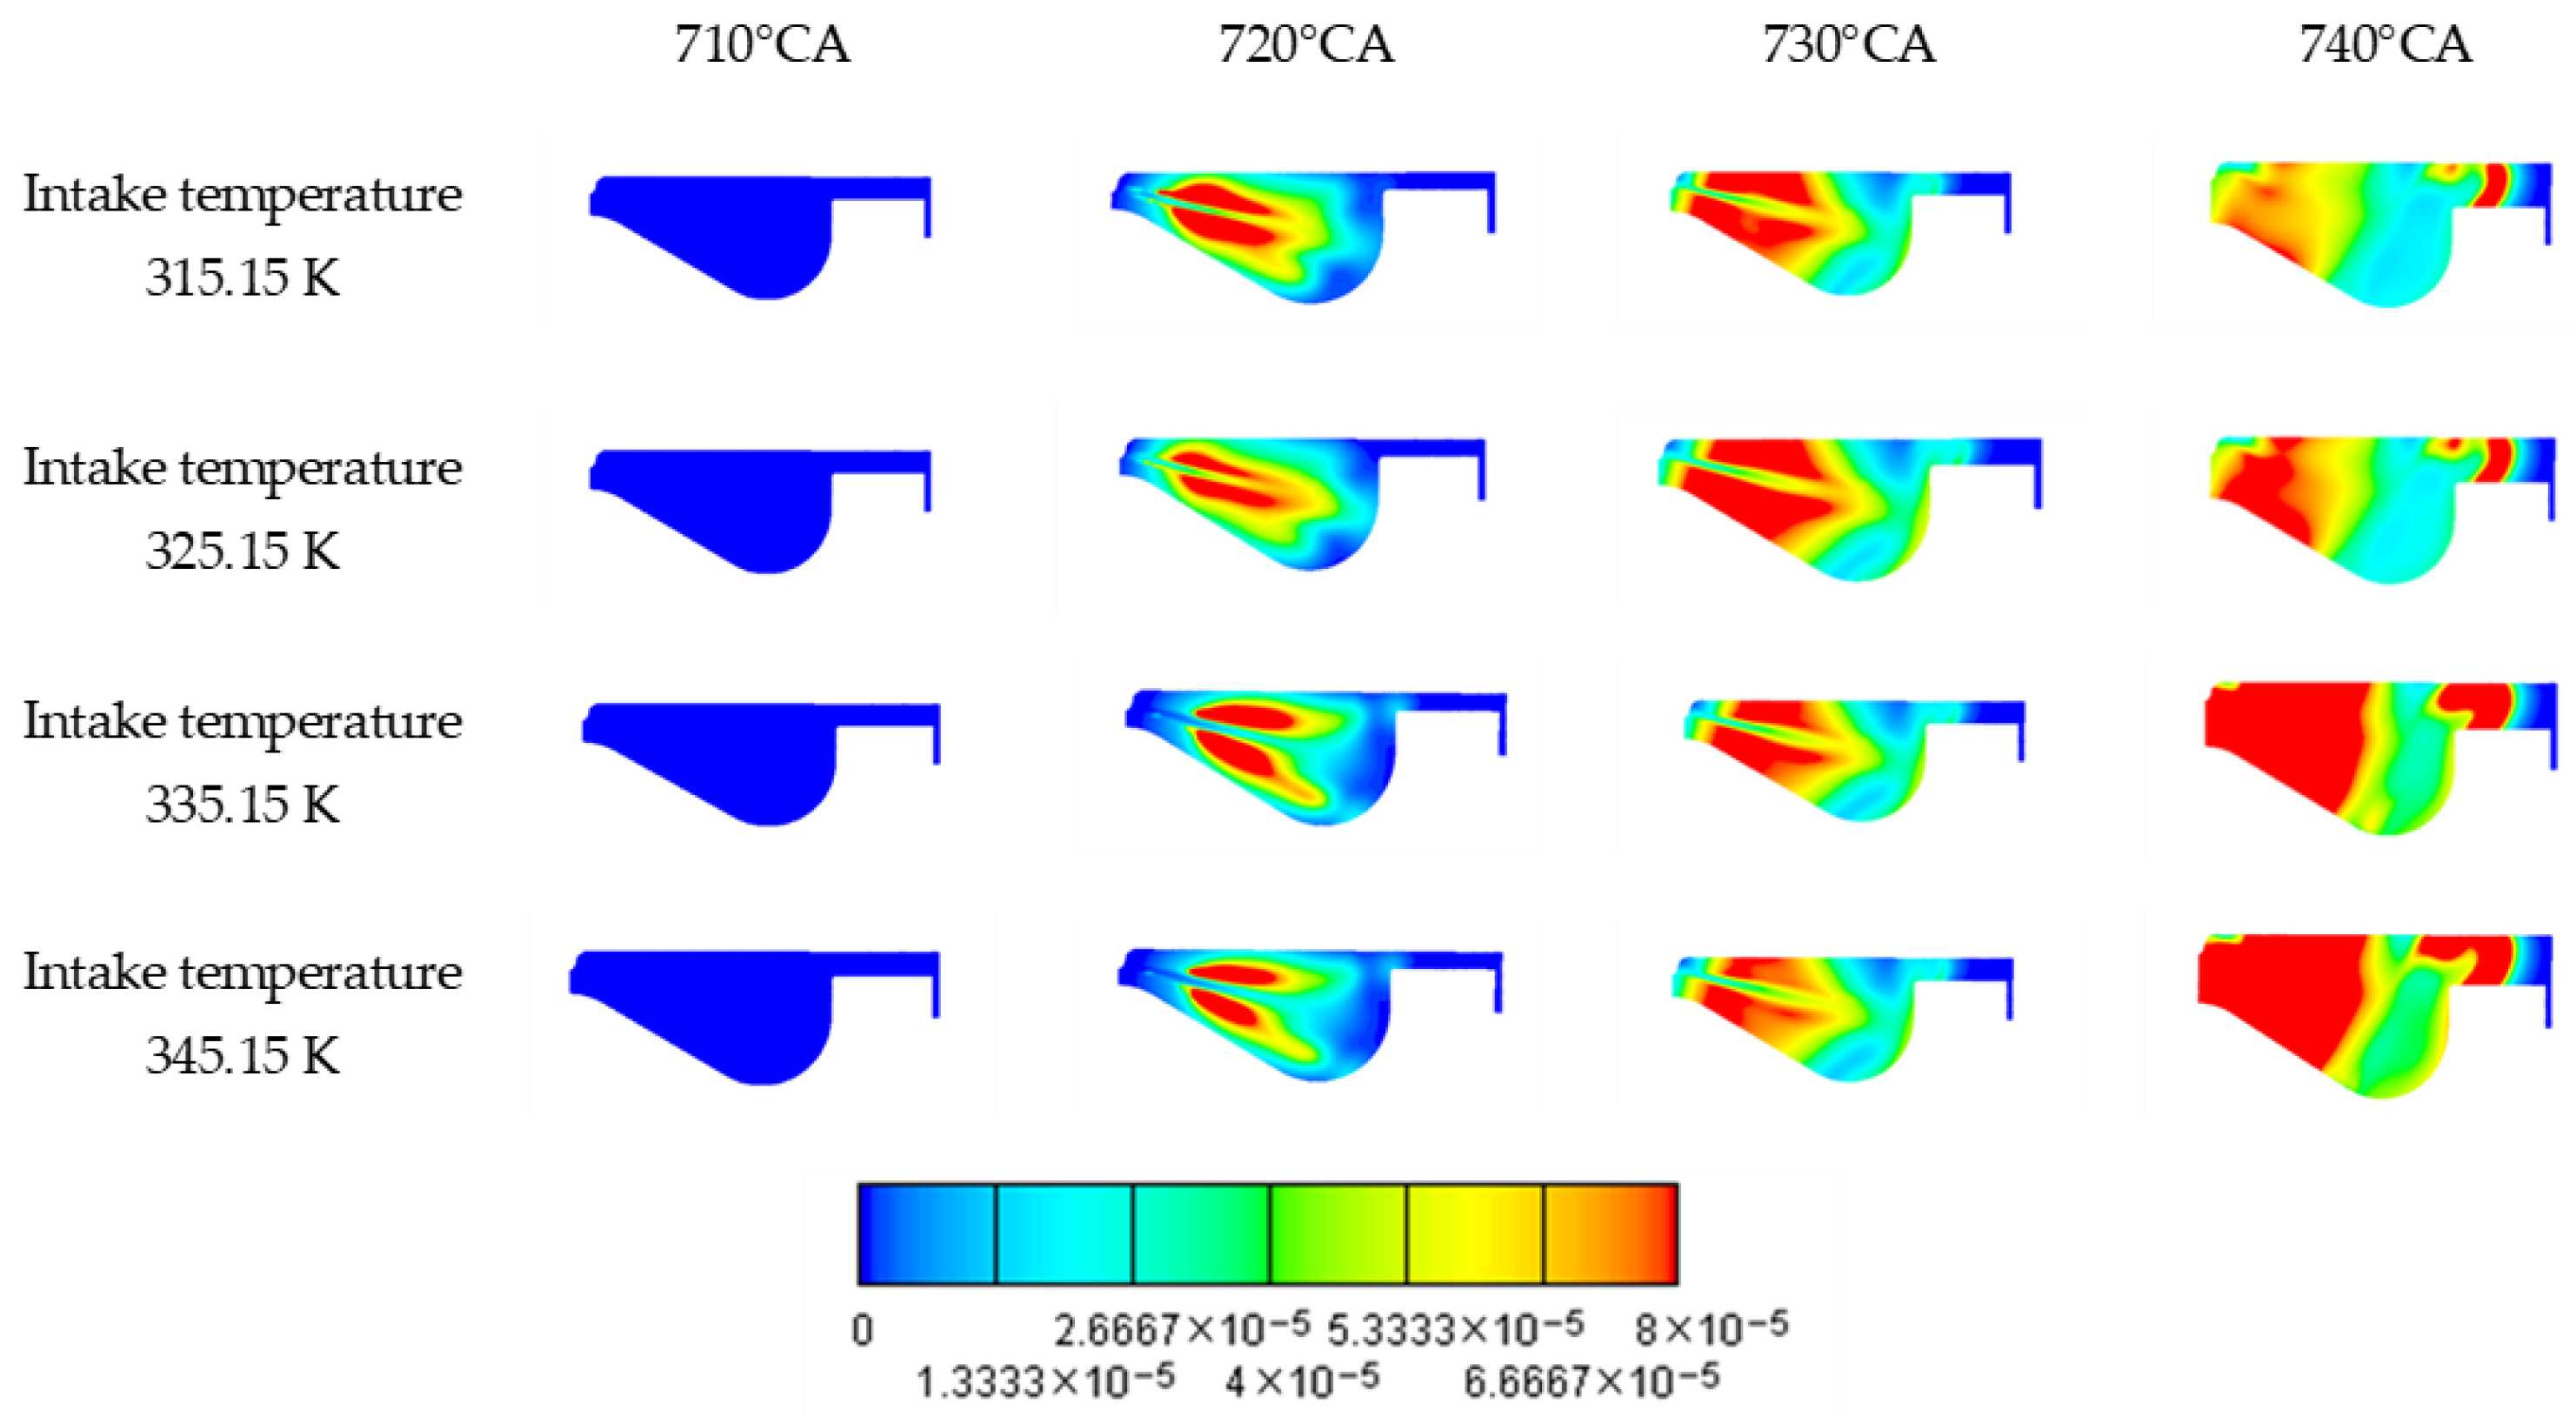
NO concentration fields at several intake temperatures are compared in Figure 14. Increasing the intake temperature drives up the final NO generation, mainly localized in the central bowl and top clearance area. Additionally, at 720 °CA, the concentrations at 315.15 K and 325.15 K are higher than those at 335.15 K and 315.15 K.
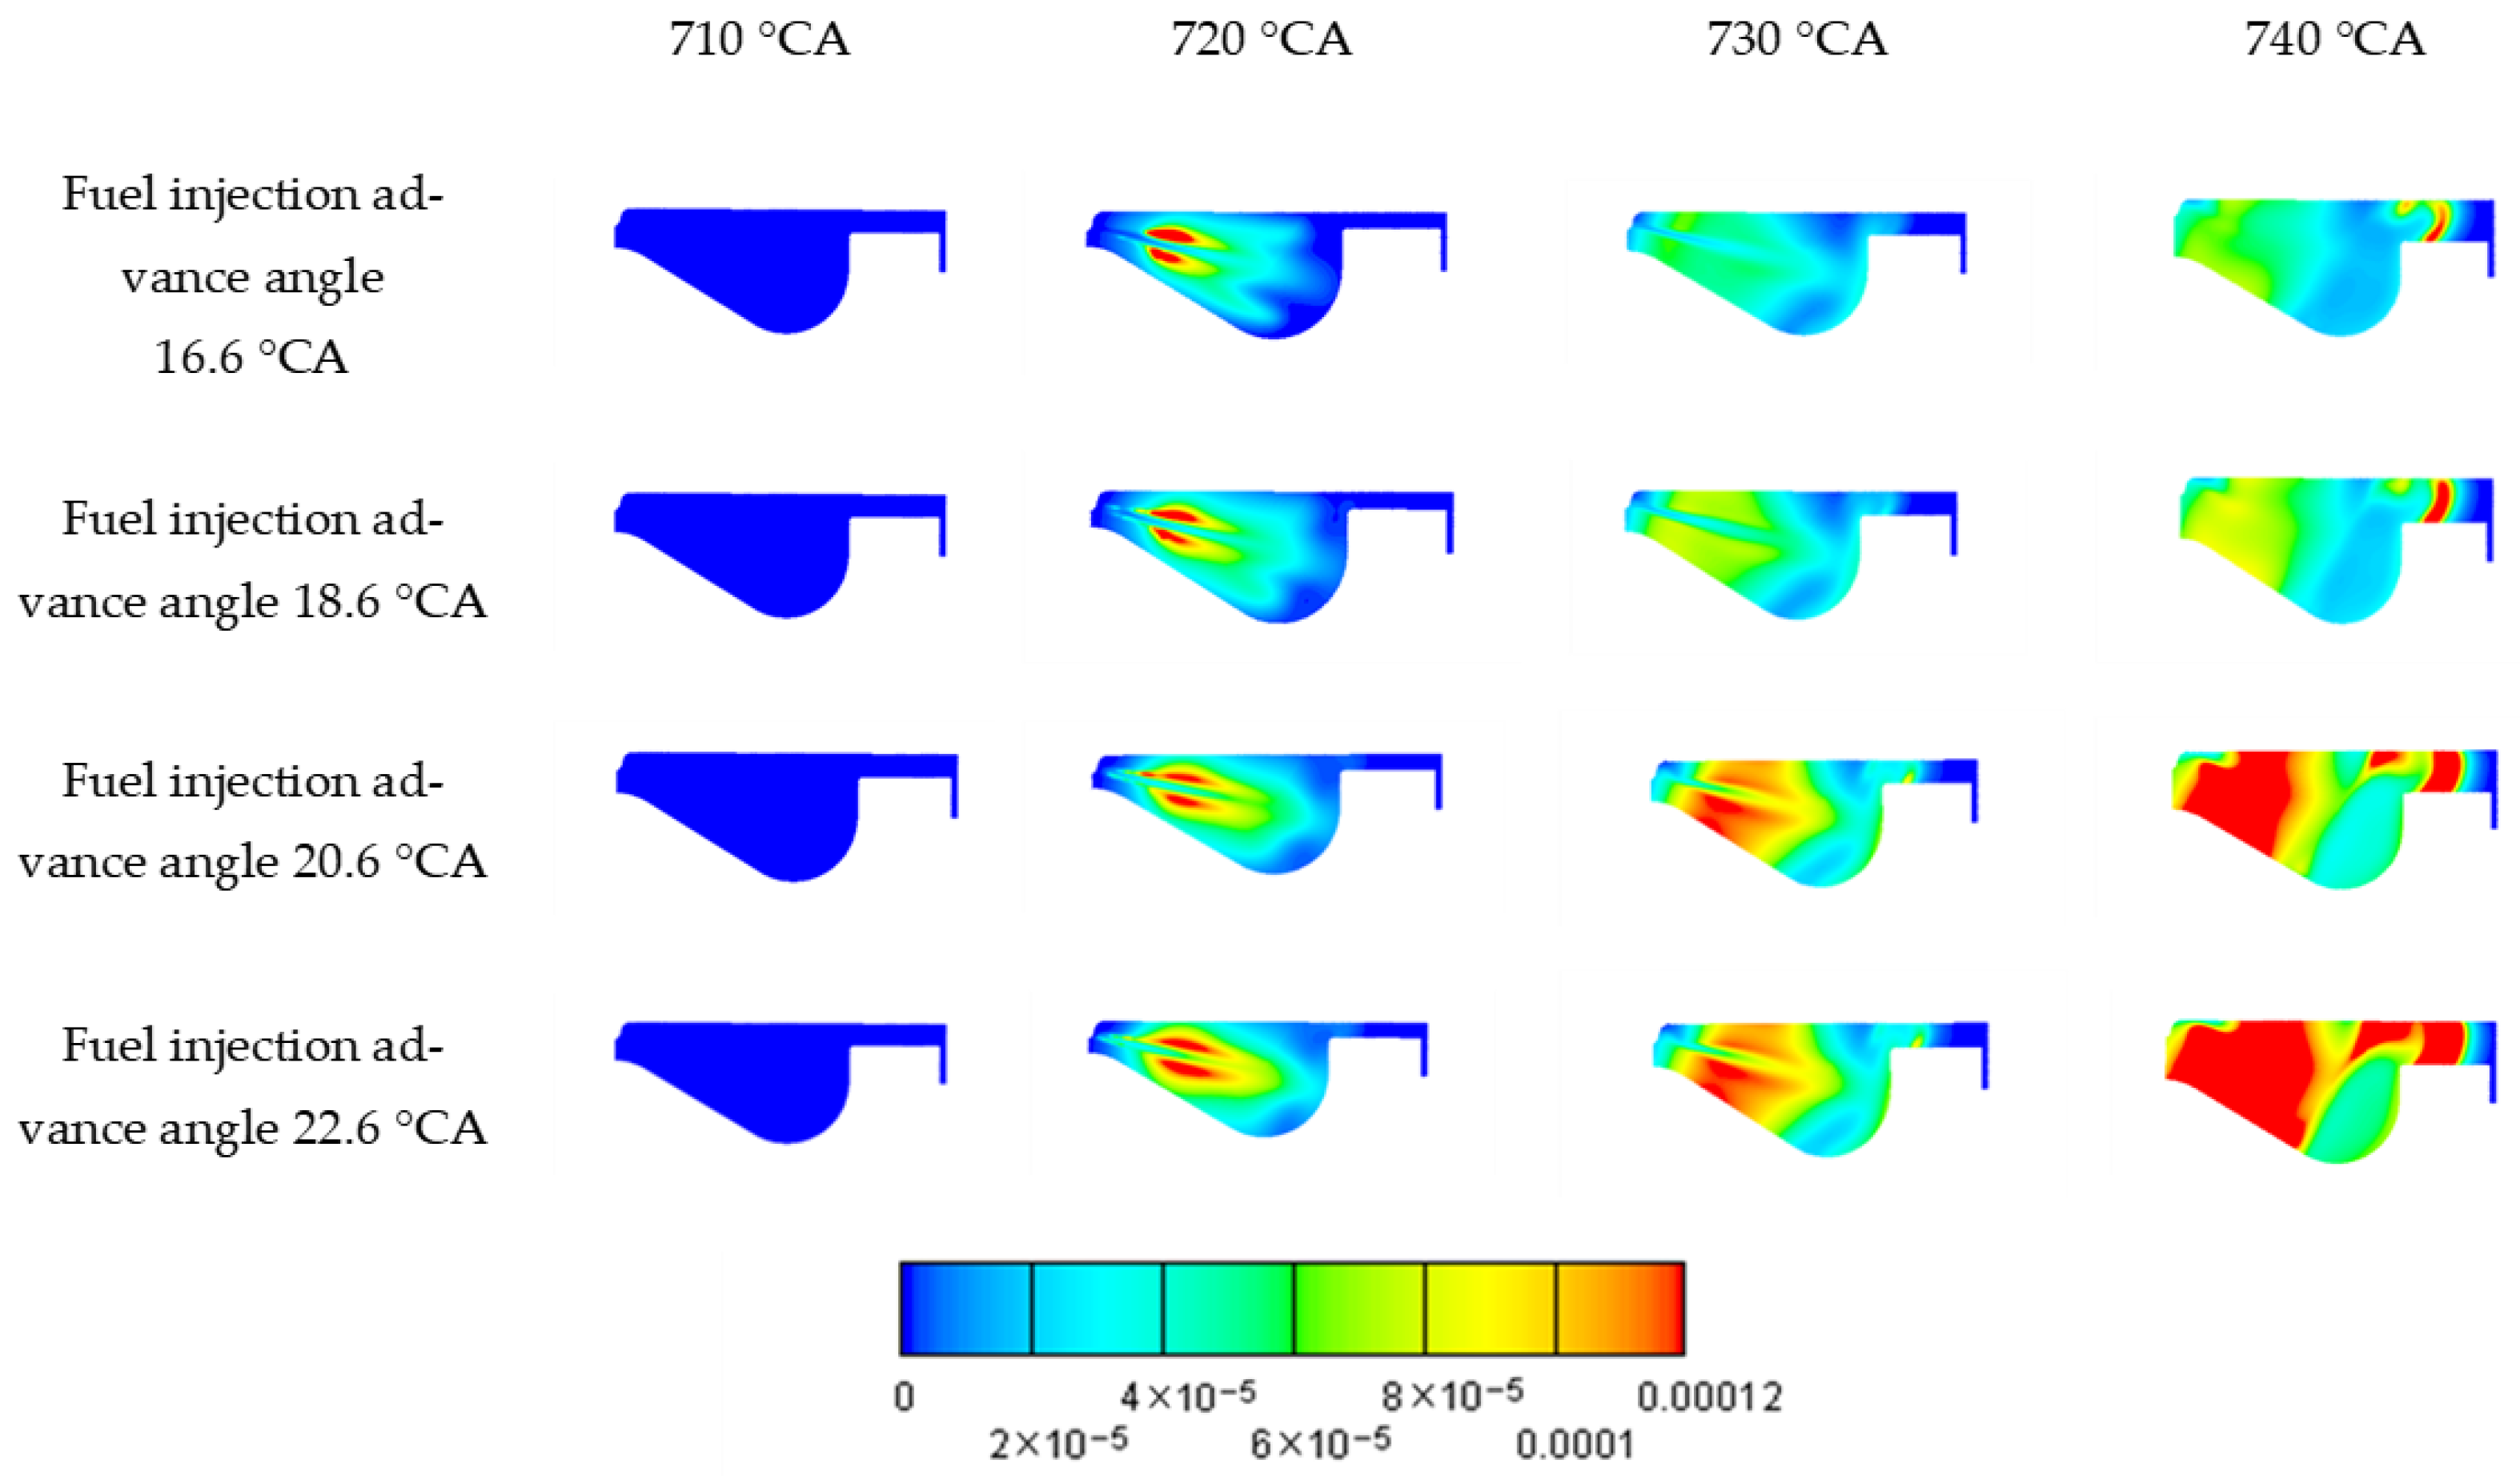
Figure 15 shows the NO concentration field distribution under various fuel injection advance angles. At a fuel injection advance angle of 20.6 °CA, the NO concentration in the cylinder suddenly increases. NO initially forms around the oil jet. As the piston continues to move, the NO concentration range within the cylinder expands. It gradually diffuses outward from the edge of the oil jet and is eventually distributed throughout the combustion chamber. The NO distribution at 740 °CA is concentrated toward the upper half of the chamber and the top land clearance.

3.2.3. Soot Emission

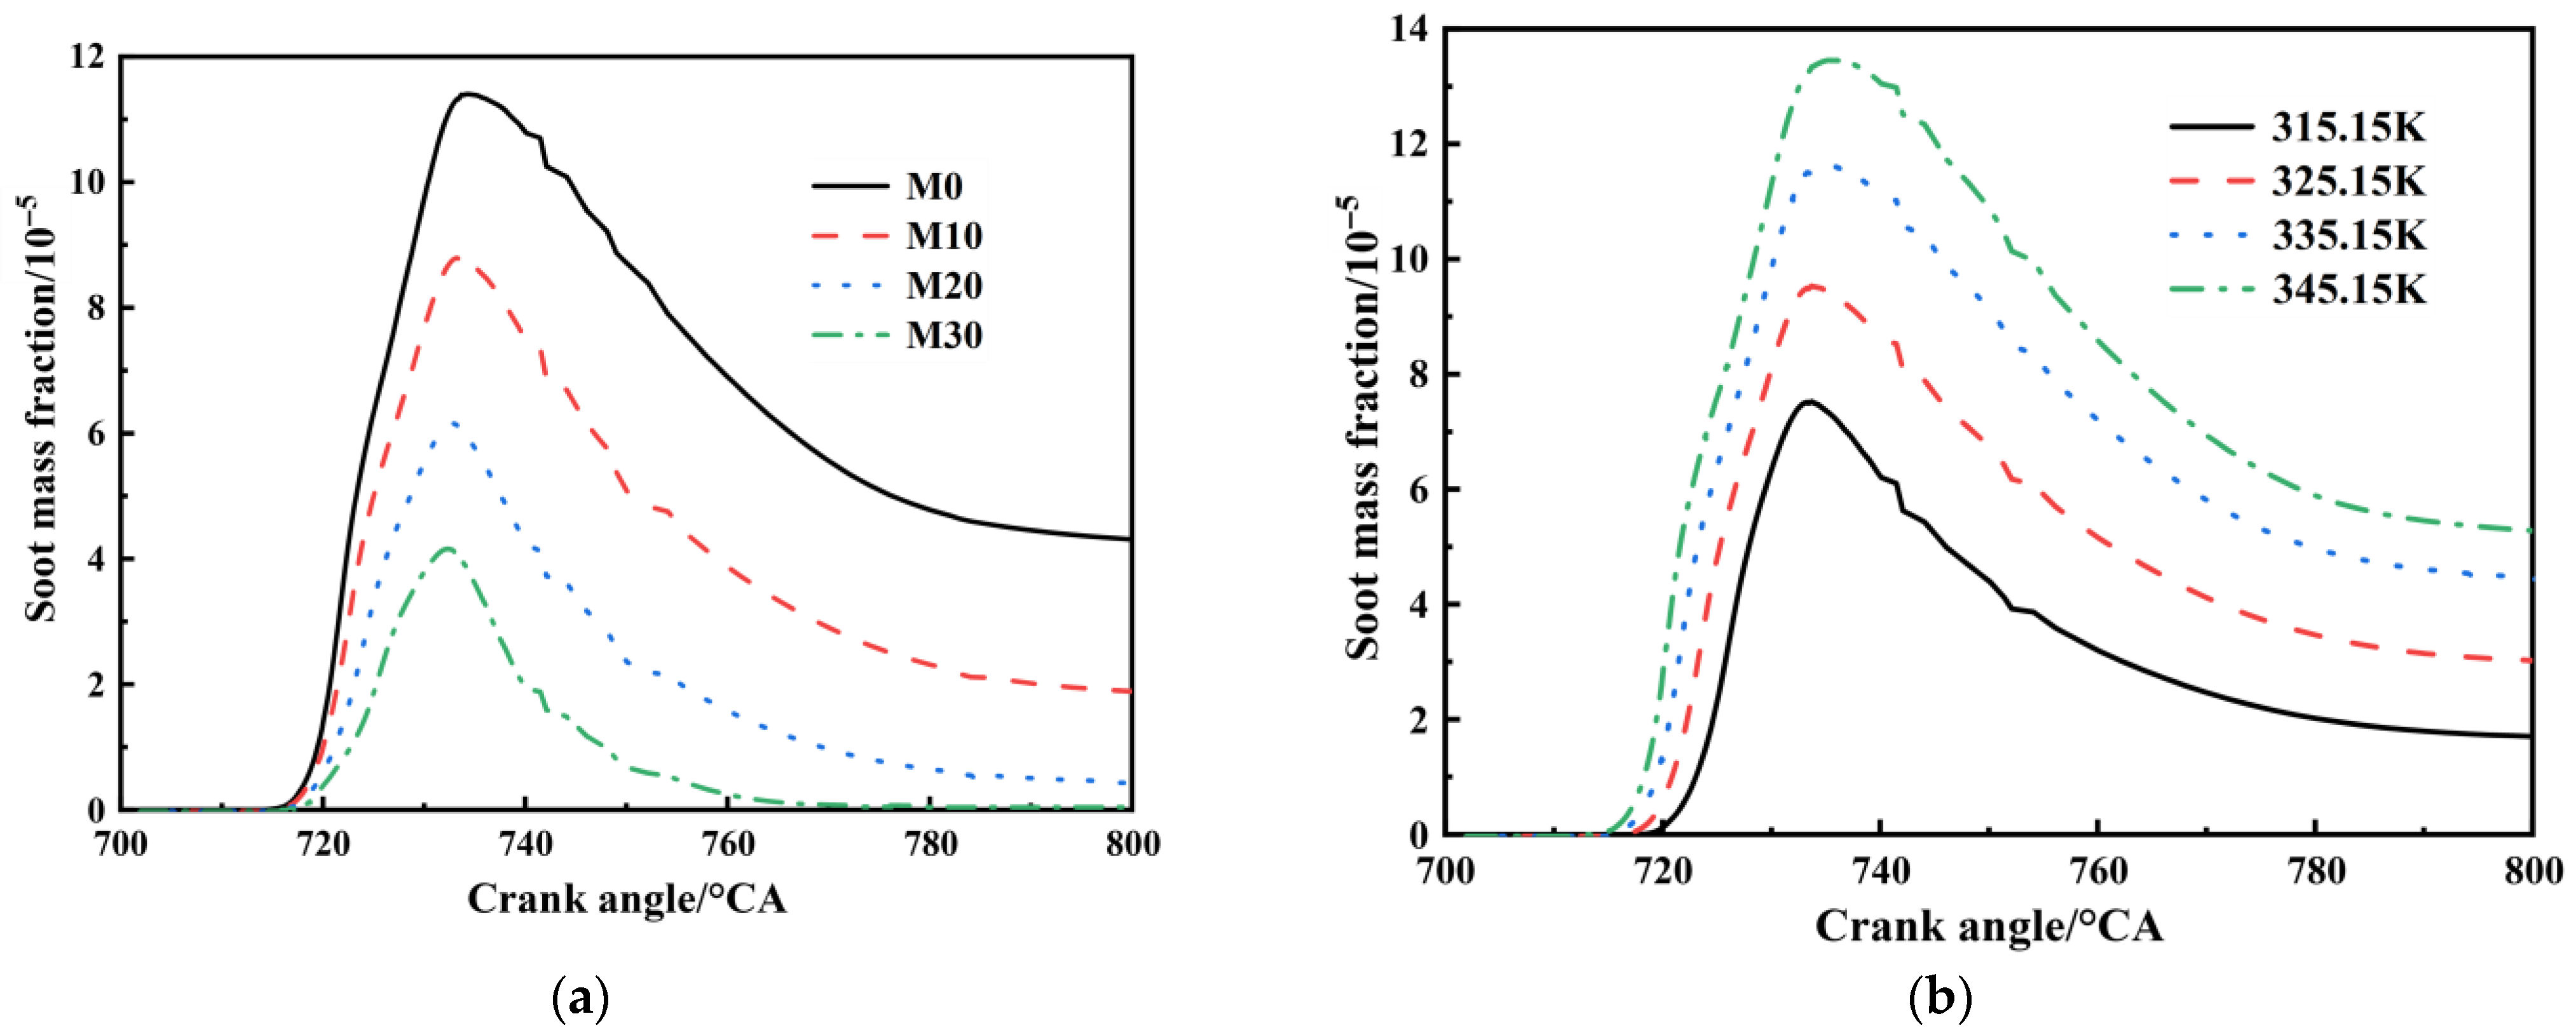
The soot mass fraction as a function of the methanol blending ratio is plotted in Figure 16a. The soot mass fraction decreases sharply as the methanol blending ratio increases. Under rated operating conditions, soot is reduced by 71.2% at a 20% methanol blending ratio compared to pure diesel, and by approximately 85.9% at 30% methanol. This reduction in soot is mainly attributed to improved fuel–air mixing, the oxygenated nature of methanol, and the absence of C–C bonds in methanol, all of which suppress soot formation during diffusion combustion.
Figure 16b shows the soot mass fraction under different intake temperatures. Soot formation increases continuously with increasing intake temperatures, and both the onset and peak of soot formation are shifted accordingly. At an intake temperature of 315.15 K, the soot mass fraction is 1.65 × 10⁻⁵. Increasing the intake temperature to 325.15 K raises the soot mass to 2.92 × 10⁻⁵, with further increases in temperature from 335.15 K to 345.15 K increasing the soot mass fraction from 4.33 × 10⁻⁵ to 5.12 × 10⁻⁵. This trend indicates that a higher intake temperature promotes soot formation by creating a hotter local environment that favors soot generation in oxygen-deficient regions.
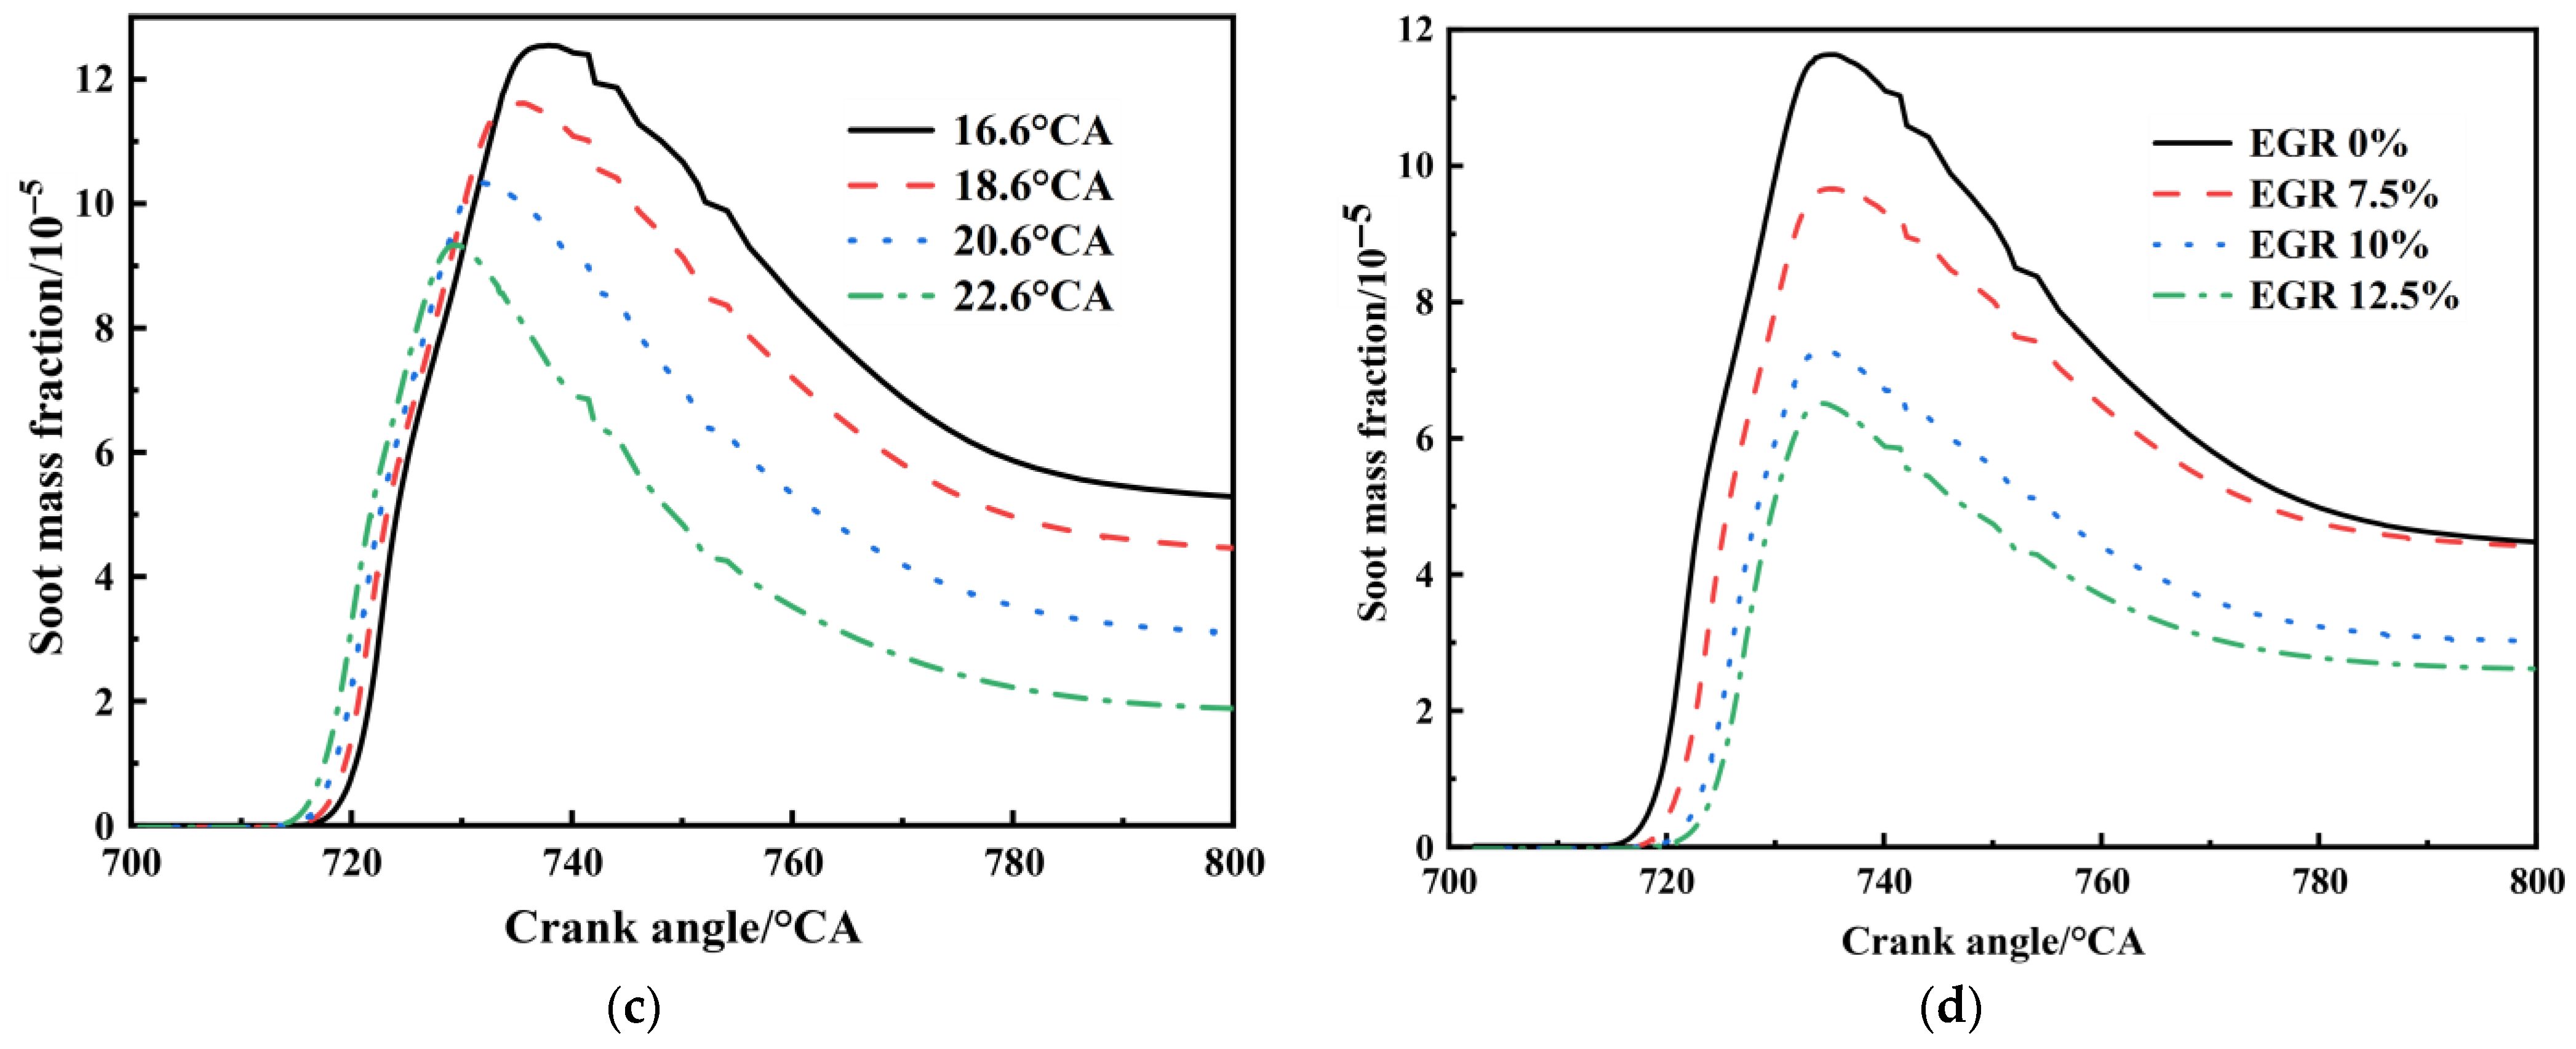
Figure 16c plots the soot mass fraction against the fuel injection advance angle, revealing a consistent downward trend as the injection is advanced. Furthermore, the onset of soot generation progressively shifts earlier in relation to the crank angle, revealing a distinct trade-off effect when compared to NO. This behavior stems from the prolonged ignition delay caused by increasing the fuel injection advance angle. The improved mixing quality between air and atomized diesel droplets allows the diesel fuel to reach its ignition point earlier. More complete burning inside the cylinder sharply cuts soot levels. As the fuel injection advance angle increases from 16.6 °CA to 22.6 °CA, the soot mass fraction drops progressively, from 5.13 × 10⁻⁵ to 4.33 × 10⁻⁵, then to 3.01 × 10⁻⁵, and finally to 1.82 × 10⁻⁵.
Figure 16d shows the soot mass fraction under different EGR rates. The soot mass fraction gradually decreases as the EGR rate increases. The introduction of 10% EGR yields a peak soot value of 2.98 × 10⁻⁵, which is markedly lower than the 4.3 × 10⁻⁵ recorded at 0% EGR, corresponding to a 31.18% reduction. The underlying cause lies in the increased specific heat capacity caused by EGR in the combustion chamber. A lower piston temperature at TDC prolongs the ignition delay period, thereby enabling more complete fuel–air mixing and reducing soot formation. The sustained decline in cylinder temperature is attributed to the degraded combustion environment caused by the introduction of EGR. This undermines the high-temperature condition necessary for soot formation.

3.3. Optimization Process

3.3.1. Orthogonal Experiment and Optimization

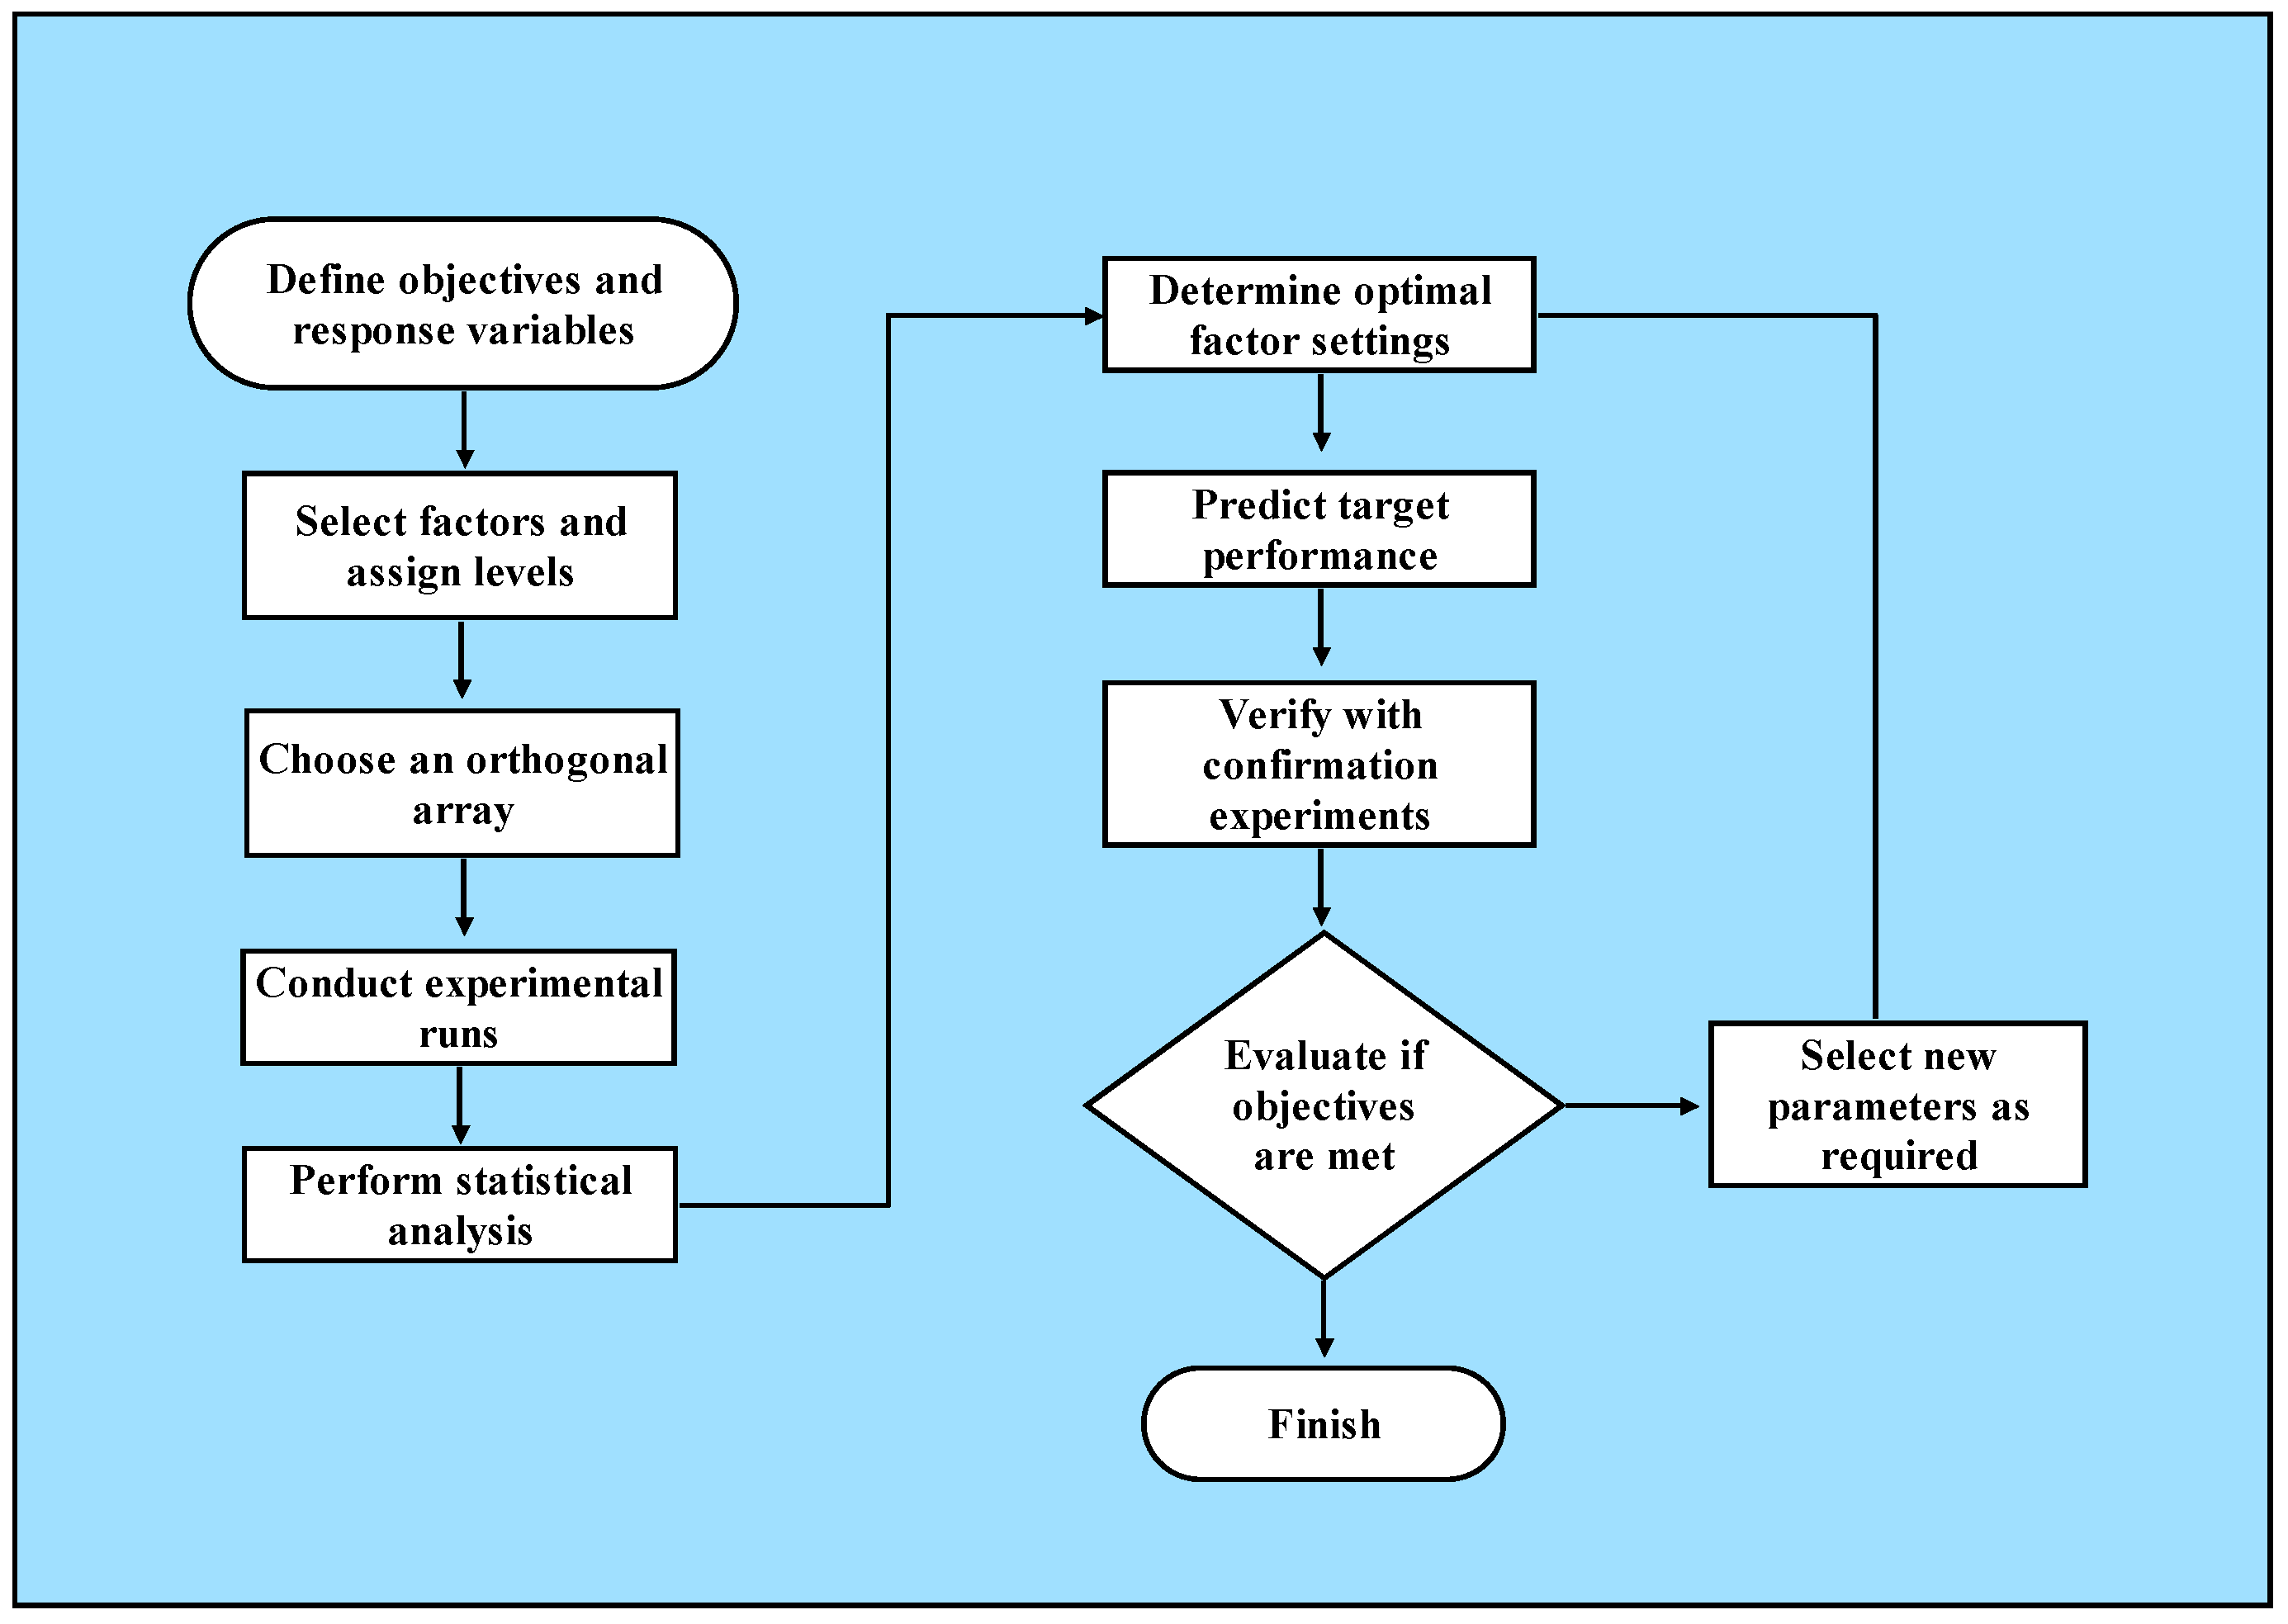
Figure 17 shows a flowchart for multi-parameter matching optimization via orthogonal design. The methanol blending ratio (A), EGR (B), fuel injection advance angle (C), and intake temperature (D) mentioned in the previous section, together with the additional intake pressure factor (E), were selected as the five factors for the orthogonal experiment, each comprising four levels. An orthogonal array was employed at a rated load, with indicated power and NOx emissions serving as the key performance metrics. The factor-level table is shown in Table 5. Each factor was assigned to four levels based on the parameter ranges investigated in the previous sections. To reduce the number of simulations while preserving a balanced multi-factor comparison, an L16(45) orthogonal array was selected for the primary screening analysis.
According to the factor-level table, this experiment involves five factors and four levels. The L16(45) orthogonal was selected to arrange the simulation experiment. Orthogonal design layout and simulation data are compiled in Table 6. In the L16(45) matrix, each row represents one simulation case, and each column corresponds to one factor. This arrangement provides a balanced distribution of the factor levels to compare their main effects on NOx mass fraction and indicated power.
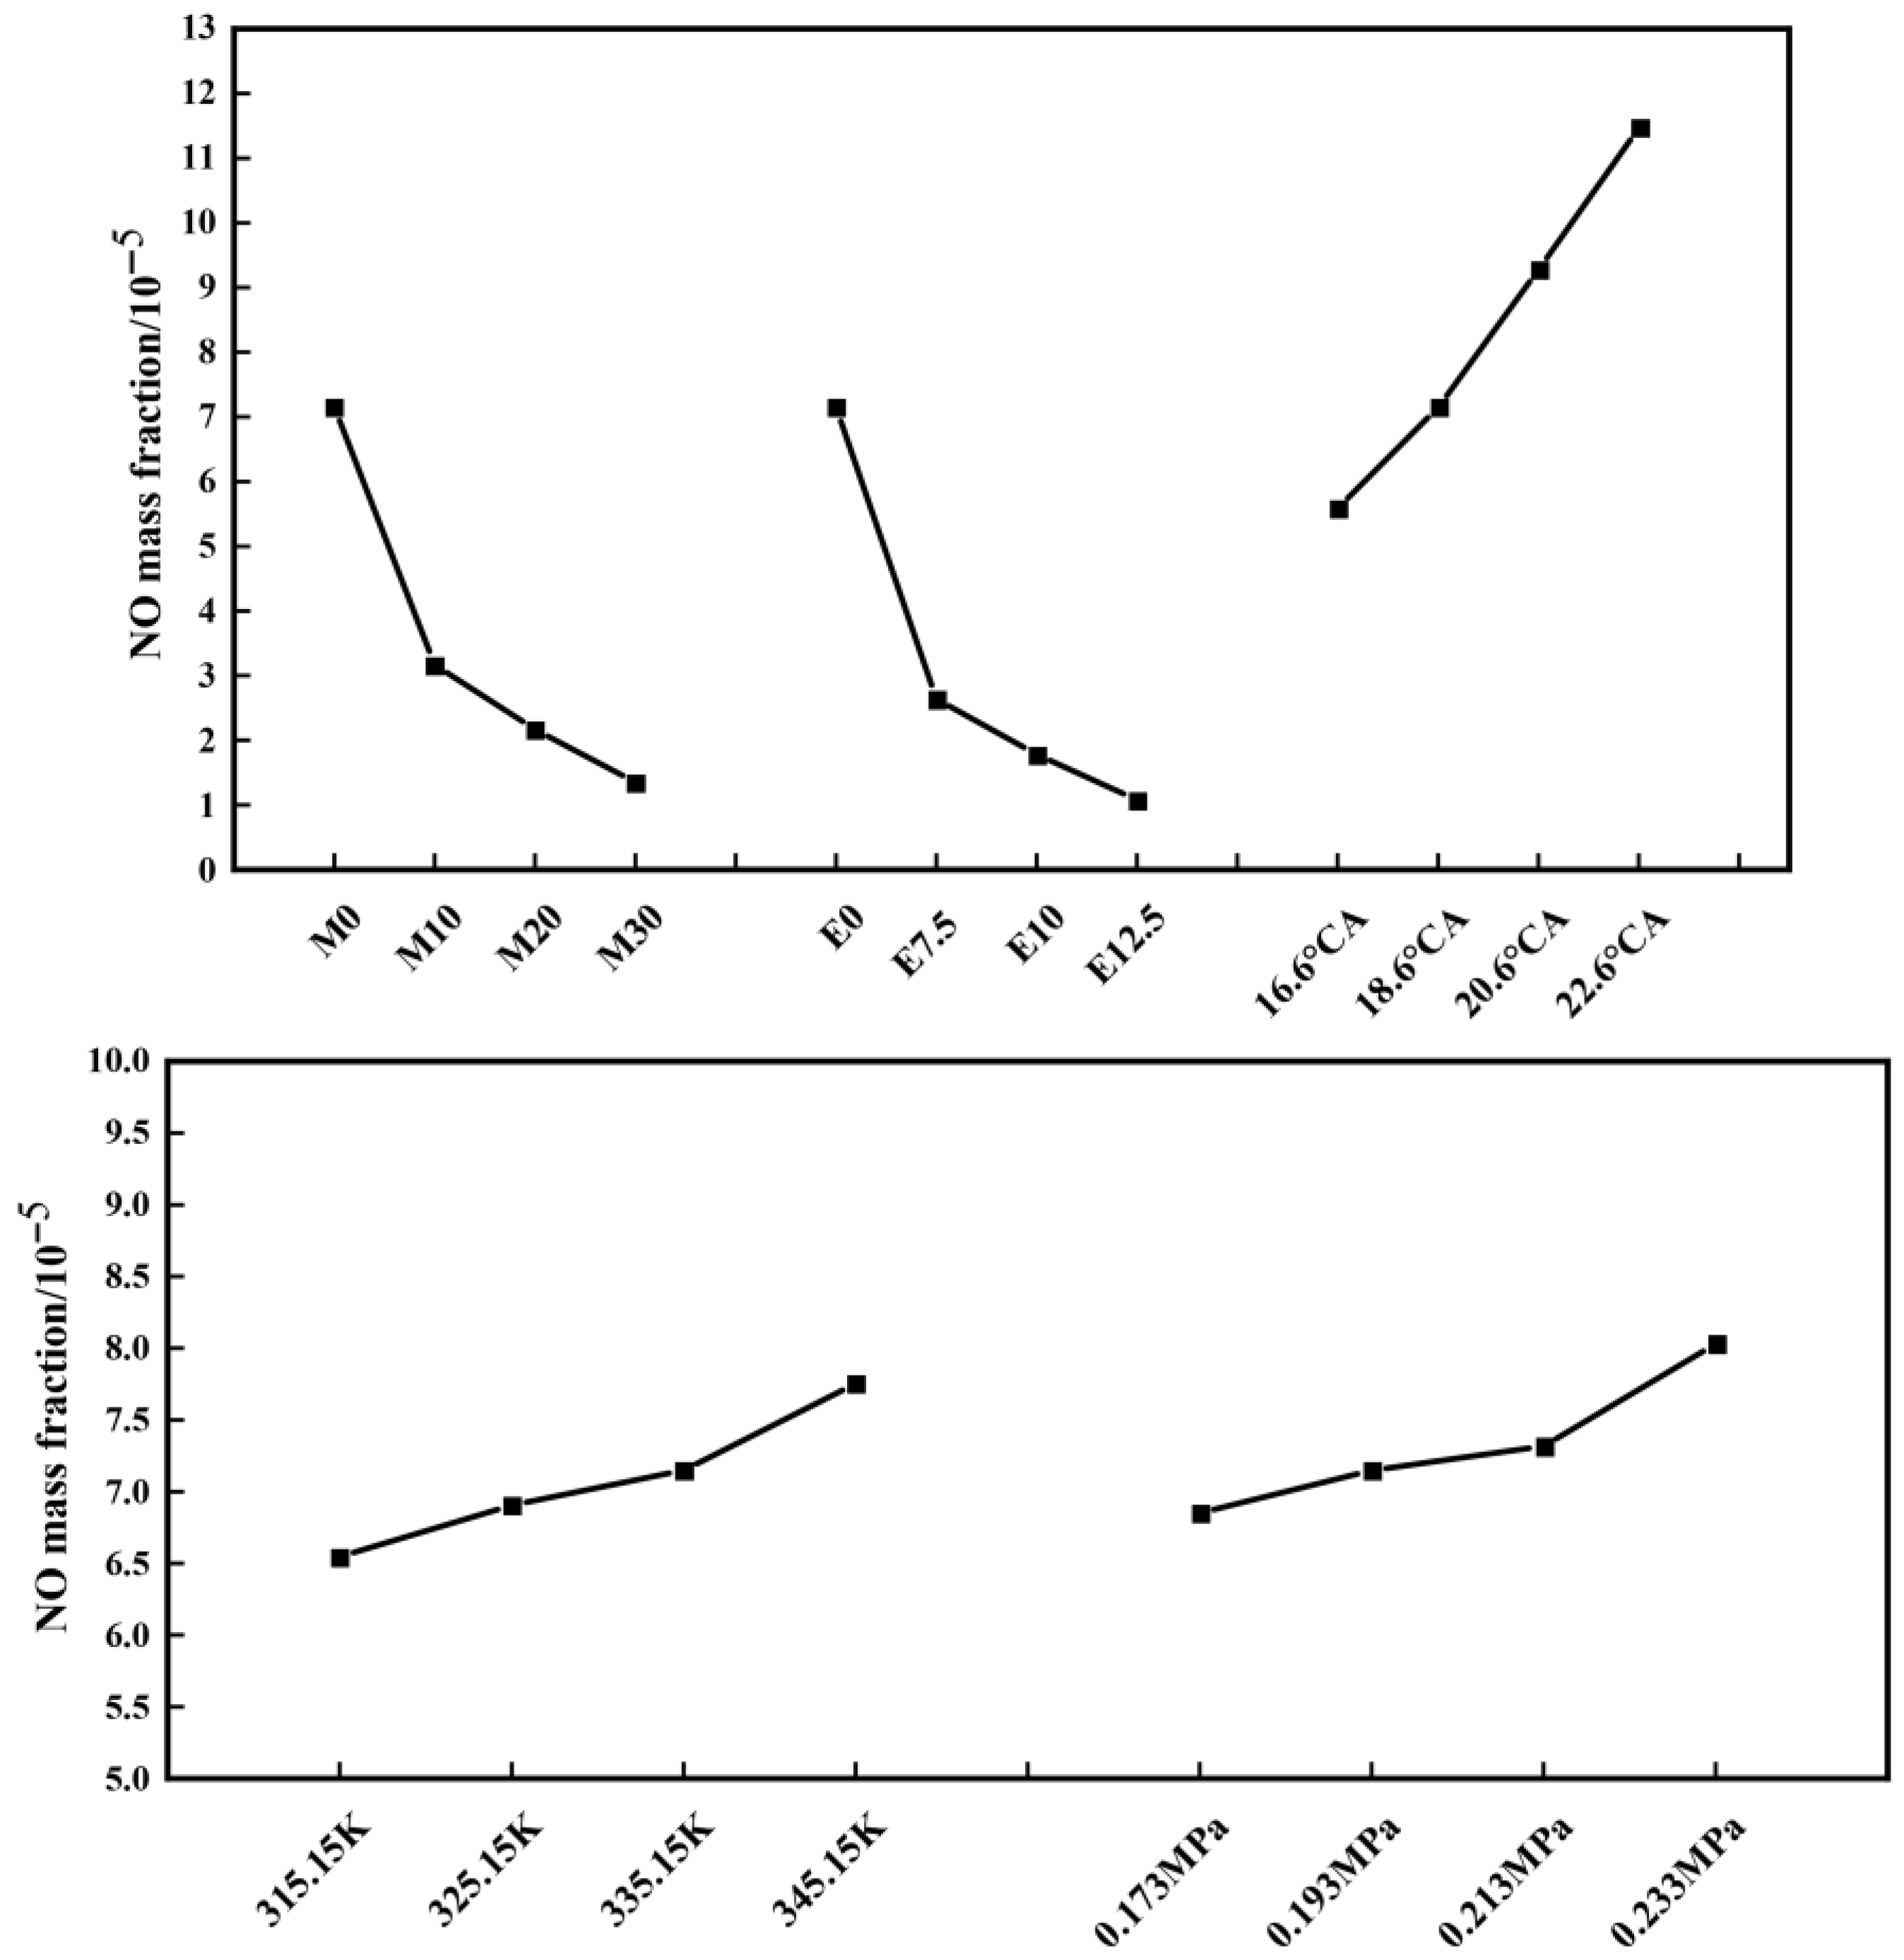
A comprehensive range analysis of these new target values revealed the factors influencing NOx mass fraction generation in order of significance: EGR, methanol blend ratio, fuel injection advance angle, intake temperature, and intake pressure. Within the scope of this experiment, an optimized solution was derived: A4B4C1D1E1. Figure 18 shows the trend diagrams of the NOx mass fraction. Additionally, the trend plots reveal that intake temperatures of 315.15 K, 325.15 K, and 335.15 K, along with intake pressures of 0.173 MPa, 0.193 MPa, and 0.213 MPa, have limited effectiveness in influencing NO generation. Further analysis incorporating indicated power can be conducted to refine the optimization strategy.
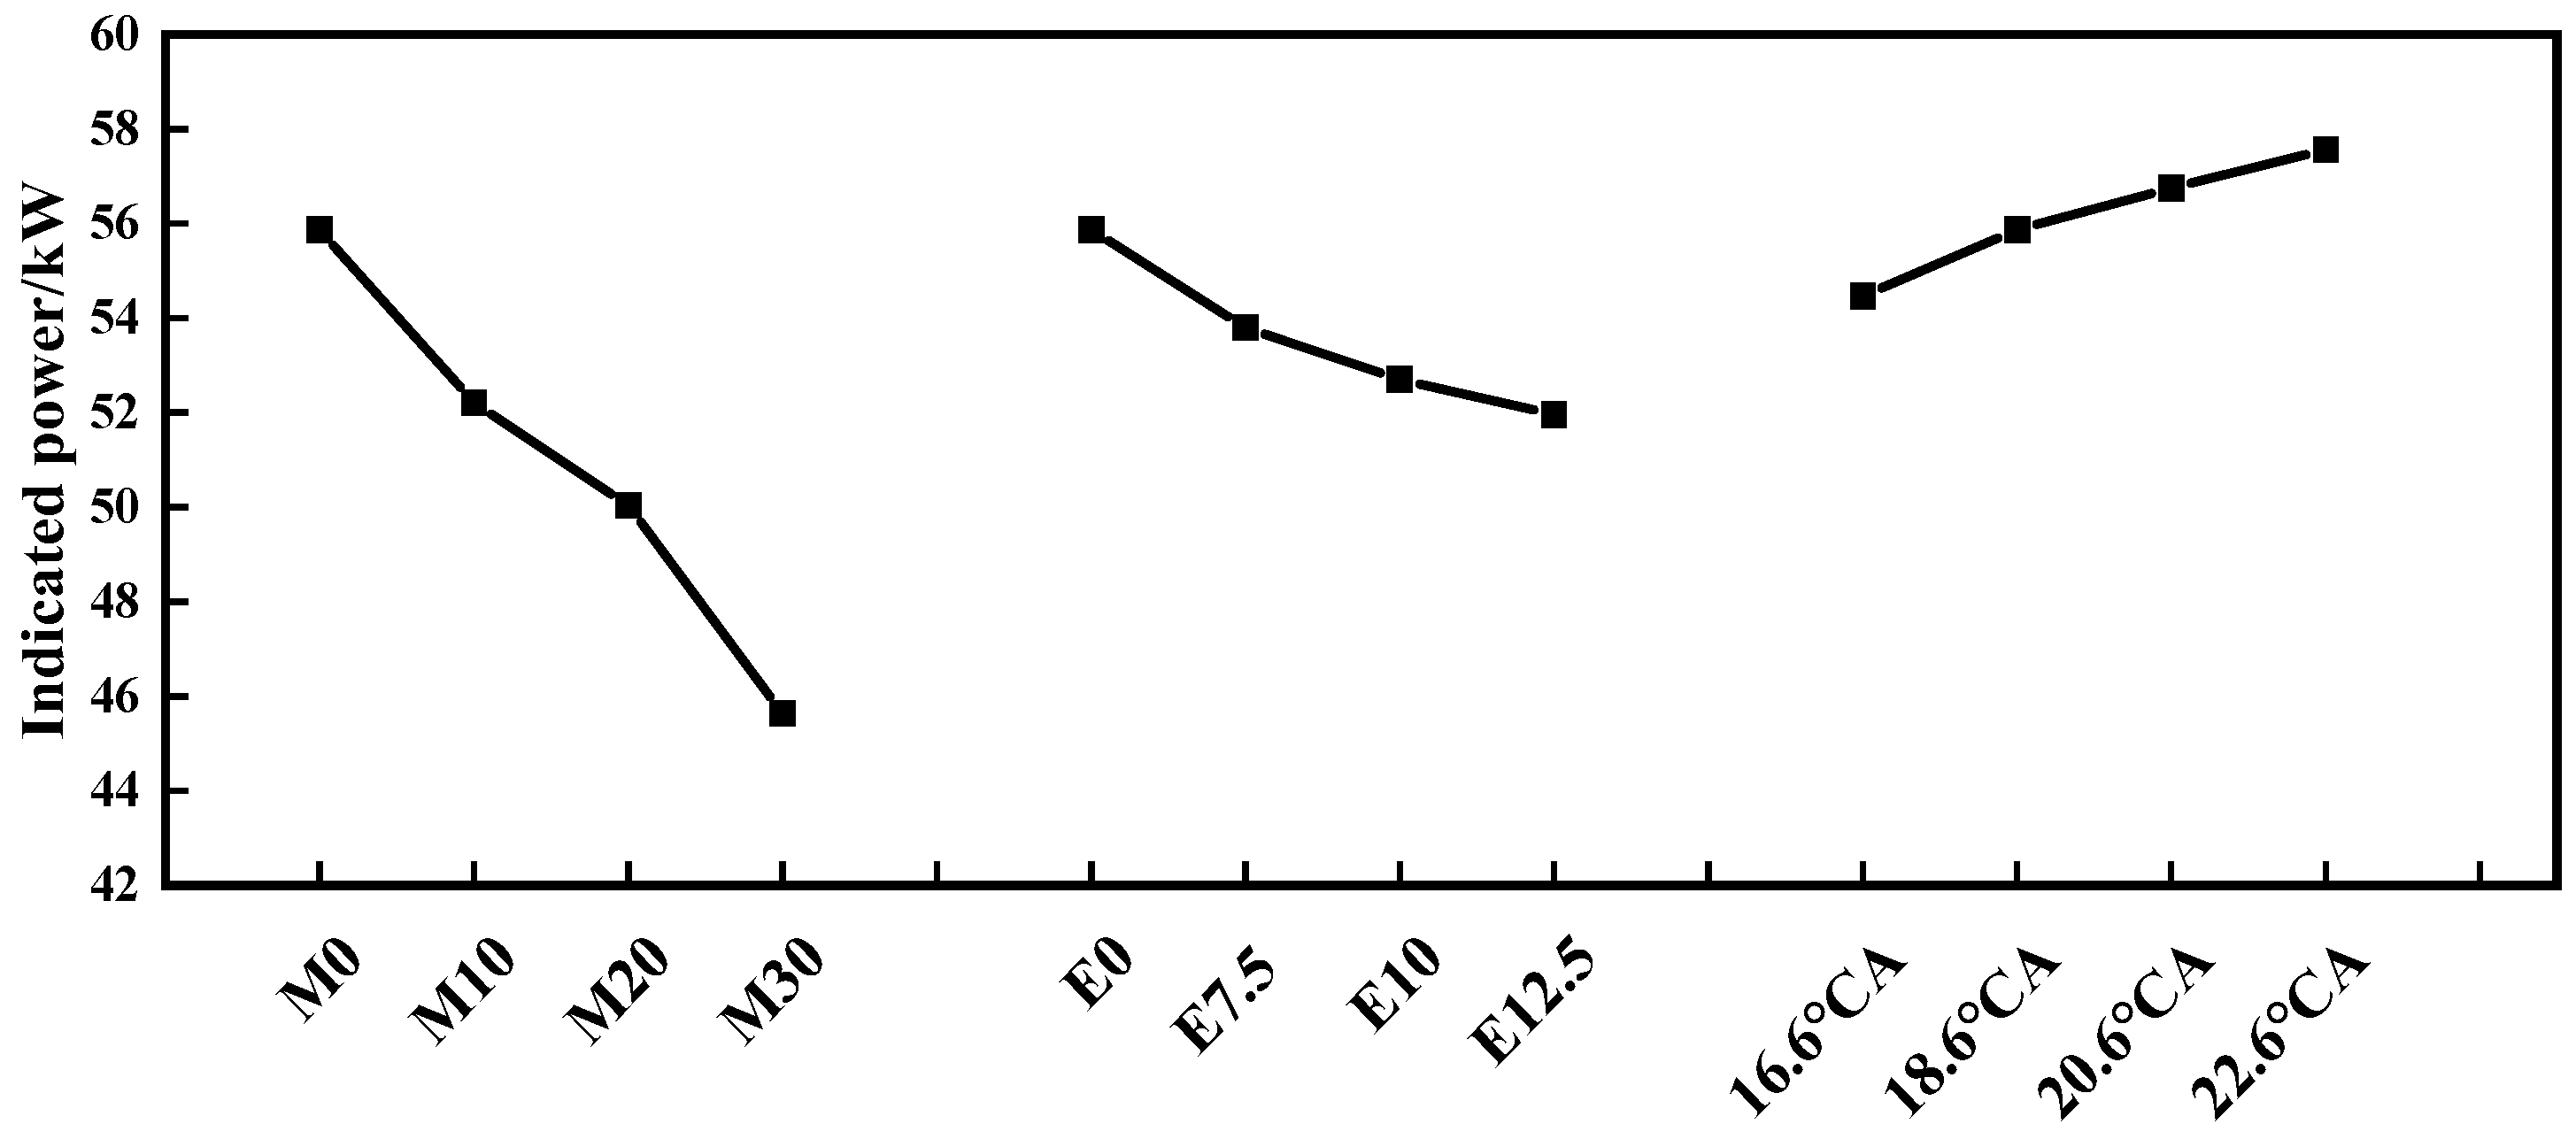
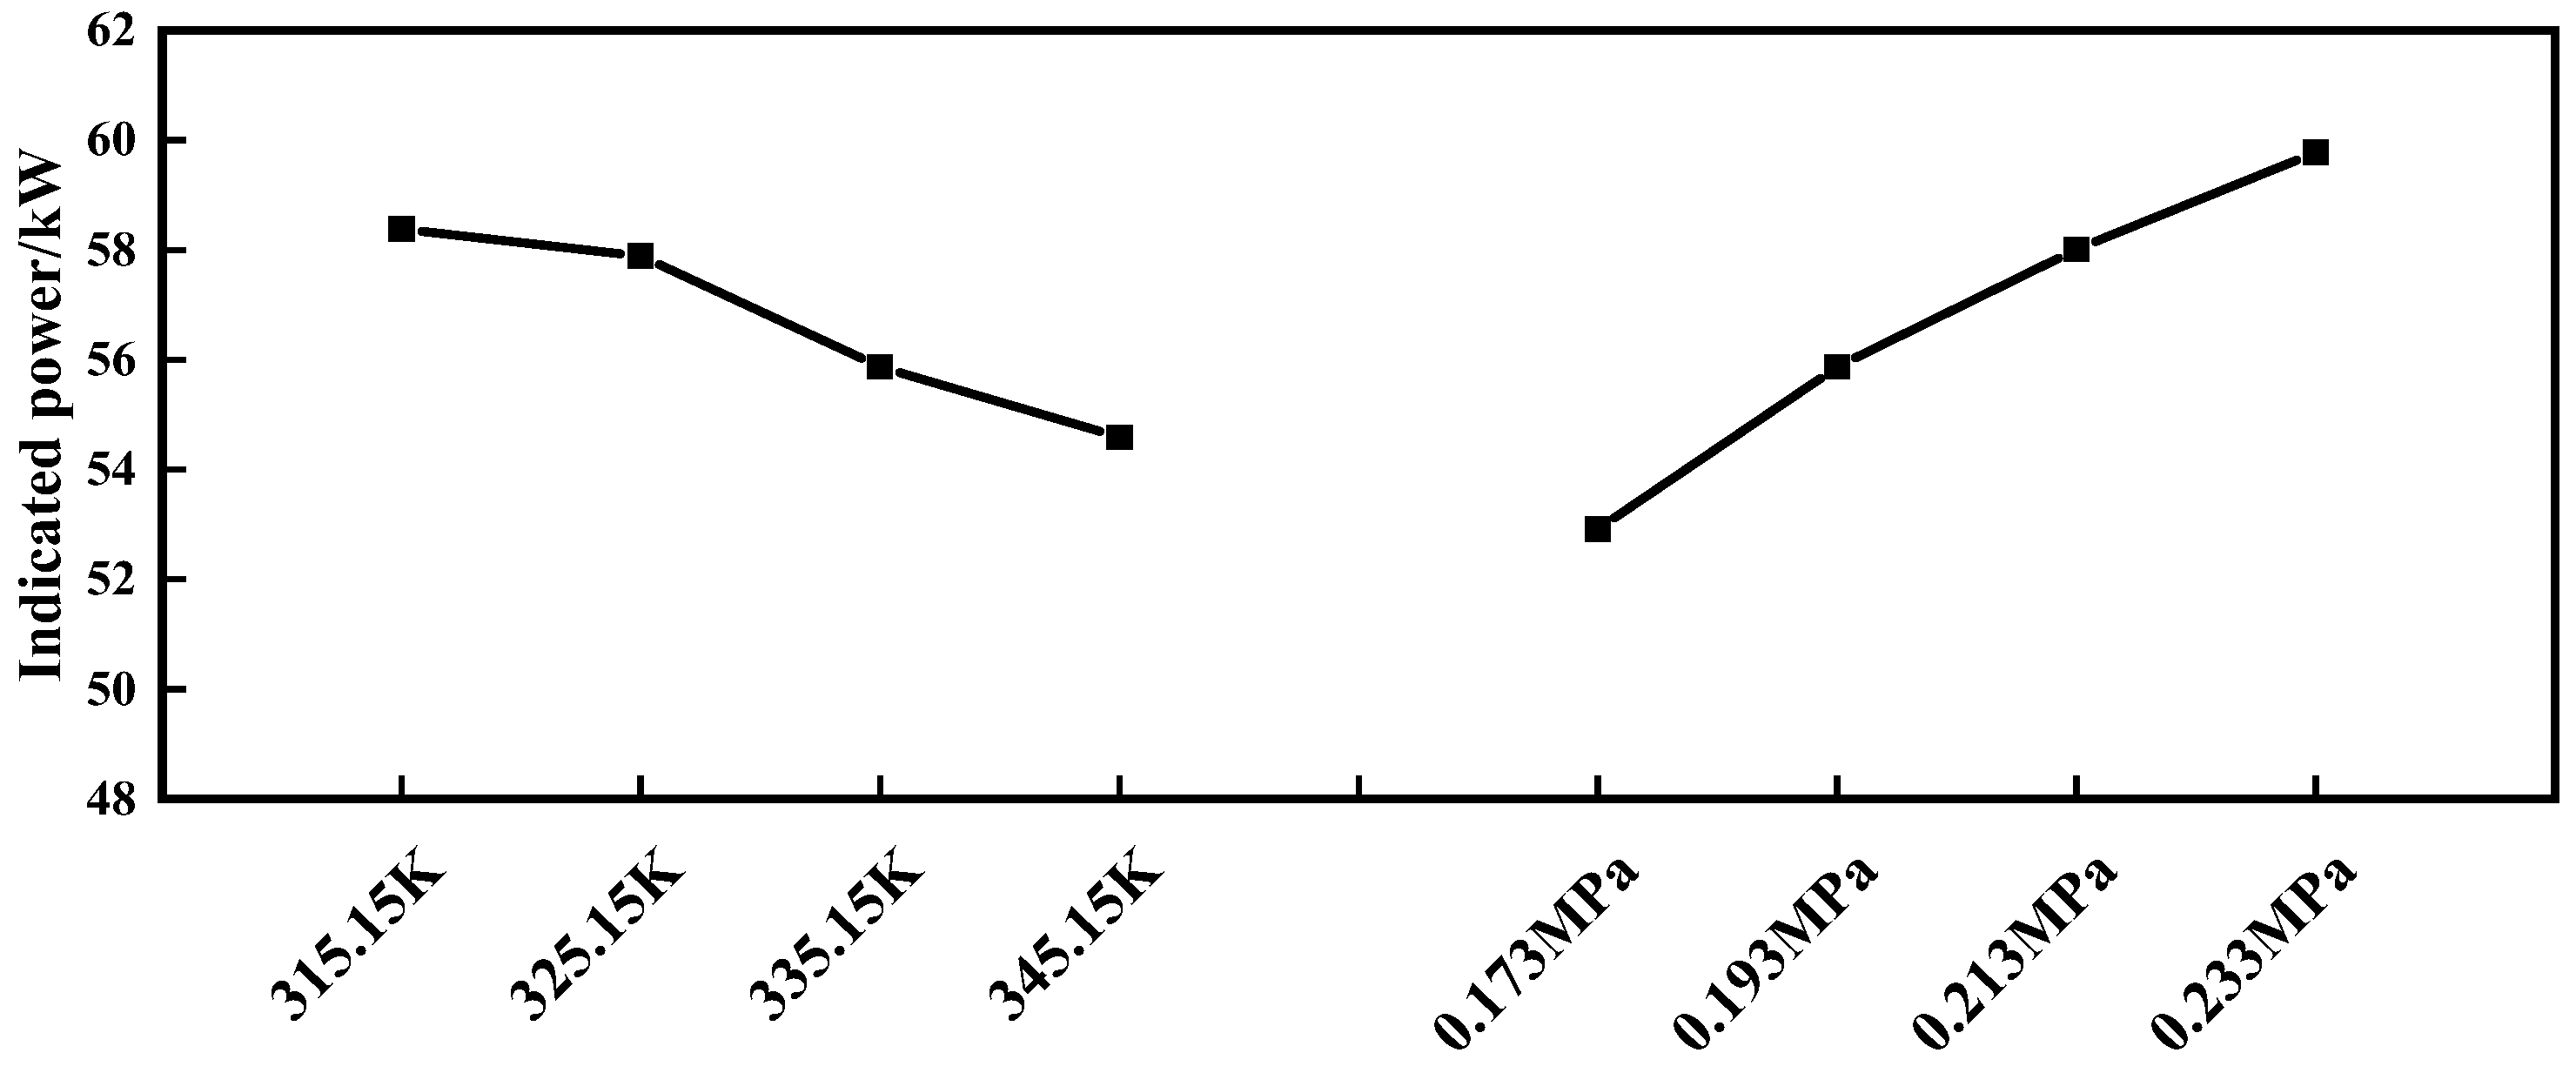
A comprehensive range analysis of these new target values revealed the factors influencing indicated power in order of significance: methanol blend ratio, EGR, fuel injection advance angle, intake pressure, and intake temperature. Within the scope of this test, an optimized solution was derived: A1B1C4D1E4. Figure 19 presents the trend plots of indicated power. The figures indicate power peaks at 0% methanol blending ratio, 0% EGR, a fuel injection advance angle of 22.6 °CA, intake temperature of 315.15K, and intake pressure of 0.233MPa, consistent with the optimization scheme from range analysis. Additionally, the trend plots reveal that the effects of 7.5% and 10% ERGs, as well as intake temperatures of 315.15K and 325.15K, have a relatively minor impact on indicated power. These parameters can be further analyzed in conjunction with NOx mass fraction generation to refine the optimization strategy.

3.3.2. First-Order Orthogonal Regression Optimization

A first-order orthogonal regression design was employed for second-stage multi-parameter optimization of the methanol–diesel dual-fuel engine, with the objective of reducing NOx emissions while avoiding excessive loss of indicated power. In this regression design, selected interaction effects were considered to improve the accuracy of local optimization. According to the first-order orthogonal regression design, an L8 orthogonal array was selected for the second-stage analysis, as shown in Table 7. The third and fifth columns were assigned to the interaction terms between the methanol blending ratio and EGR, and between the methanol blending ratio and intake temperature, respectively. Three additional center-point runs were added to improve the reliability of the regression analysis near the design center. In this regression design, methanol blending ratio, EGR, fuel injection advance angle, intake temperature, and intake pressure were coded as z1-z5, respectively, and the NOx mass fraction was taken as the response variable.
After calculating the coefficients of the regression equation, substituting them provided the regression equation for the natural variable, representing the generation of the NOx mass fraction:
y 1 = 6.693 0.172 x 1 0.480 x 2 0.173 x 3 + 0.023 x 4 + 53.330 x 5 + 0.006 x 1 x 2 + 0.004 x 1 x 3
Based on the absolute values of the regression coefficients, the relative influence of the factors and interaction terms on NOx mass fraction can be ranked as follows: x2 > x1 > x1x2 > x4 > x3 > x1x3 > x5. The result aligns with the range analysis from the previous subsection. Based on the regression equation for the natural variables of NOx mass fraction and the defined ranges of x1–x5, the minimum NOx mass fraction was achieved when the intake pressure was 0.223 MPa, the methanol blending ratio was 27%, the EGR was 12.5%, the injection timing was 21.2 °CA, and the intake temperature was 319.05 K.

3.3.3. Selection and Verification of Optimization Scheme

The optimized schemes determined from the orthogonal analysis and the first-order regression orthogonal analysis were first compared, and the comparison results are listed in Table 8. It can be seen that the scheme obtained from the first-order regression orthogonal analysis showed better overall performance than that obtained from the orthogonal analysis. This is because the orthogonal analysis directly selects the best combination only from the discrete cases included in the orthogonal test matrix, whereas the first-order regression orthogonal analysis allows a more continuous optimization search within the investigated parameter space based on the fitted response relationship.
After that, the optimized parameter set obtained from the first-order regression orthogonal analysis is re-simulated using the 3D CFD model in AVL-FIRE. The predicted indicated power of this optimized case is 53.65 kW, which is still noticeably lower than that of the original engine (58.85 kW). Therefore, according to the varying trends for the methanol blending ratio, EGR rate, injection advance angle, intake temperature, and intake pressure with indicated power and NOx mass fraction, the EGR rate and intake temperature are further adjusted to improve power performance while maintaining a low NOx level. The corresponding 3D CFD simulation results are listed in Table 9.
As can be observed from Table 9, adjusting the EGR and intake temperature both improve the indicated power, but the NOx mass fraction generated in the exhaust subsequently increases. The optimized parameter combination should be interpreted as a practical compromise rather than a universal optimum. Under the rated-load condition considered in this study, a feasible calibration direction is provided for balancing NOx reduction and indicated power. In particular, the results highlight the important roles of methanol substitution level, EGR matching, and injection timing in practical marine engine operation. These findings may provide useful guidance for the calibration and control of methanol–diesel dual-fuel marine engines.

4. Conclusions

AVL-FIRE was used to build a methanol–diesel dual-fuel combustion chamber model that is geometrically faithful to the 4190ZLC-2 diesel engine. Furthermore, the boundary conditions, initial conditions, and in-cylinder flow field calculation model were appropriately configured. The validated model was then extended to investigate the impacts of methanol ratios, injection advance angle, and intake temperature on diesel engine combustion and emission behavior. The main contributions and findings of this work are summarized below.
(1) The addition of methanol suppresses peak cylinder pressure and combustion temperature to the extent that reduction is scaled with the blend ratio. The peak HRR shows a trend of increasing magnitude, with a significant rise. Concurrently, this reduces the formation of NO and soot, thereby improving the diesel engine’s emission characteristics.
(2) Increasing the fuel injection advance angle prolongs the in-cylinder combustion delay period, which, in turn, improves combustion phasing and elevates efficiency. This results in increased peak cylinder temperatures, peak HRR, and maximum combustion pressures. On the one hand, CO and soot emissions are curbed; on the other hand, NO production intensifies.
(3) As intake temperature continues to rise, it causes a decline in fuel–air mixture quality and worsens combustion efficiency. This results in a minor elevation in the peak cylinder temperature and a drop in the highest combustion pressure. However, in terms of emissions, the formation of CO, soot, and NO shows an increasing trend.
(4) Based on orthogonal experimental design, EGR and methanol blending ratio are identified as the dominant factors affecting NOx emissions, whereas the methanol blending ratio and EGR also play leading roles in determining indicated power. A first-order regression-based orthogonal optimization incorporating interaction effects is further conducted, yielding an optimal parameter combination of a 27% methanol blending ratio, 12.5% EGR, 21.2 °CA injection advance angle, 319.05 K intake temperature, and 0.223 MPa intake pressure, which achieves minimum NOx emissions while maintaining acceptable engine power performance.
The present results suggest that methanol–diesel dual-fuel combustion has good potential for cleaner marine engine operation and partial diesel substitution. These findings provide useful guidance for marine engine decarbonization and engine calibration. Future work should extend the present analysis to a wider range of engine loads, rotational speeds, and transient operating conditions, together with further experimental validation. More attention should also be given to finer methanol blending increments, fuel economy, combustion stability, and practical control strategies for marine applications.


Author Contributions

Conceptualization, K.C.; Methodology, Z.Y. (Zixiao Ye) and K.C.; Software, Z.Y. (Zixiao Ye) and Z.Z.; Validation, K.C. and J.H.; Formal analysis, J.H.; Investigation, Z.Y. (Zibin Yin); Resources, Z.Y. (Zibin Yin) and Y.L.; Data curation, Y.L.; Writing—original draft, Z.Y. (Zixiao Ye), J.F. and Z.Z.; Writing—review & editing, Z.Y. (Zixiao Ye), J.F. and Z.Z.; Supervision, P.Z.; Project administration, P.Z.; Funding acquisition, P.Z., Y.L. and J.F. All authors have read and agreed to the published version of the manuscript.

Funding

This research was financially supported by the Natural Science Foundation of Fujian Province (Grant numbers: 2022J01812) and Fujian Provincial Department of Education General Project (Grant numbers: JAT251375).

Data Availability Statement

The original contributions presented in this study are included in the article. Further inquiries can be directed to the corresponding author.

Conflicts of Interest

The authors declare no conflict of interest.

Abbreviations

The following abbreviations are used in this manuscript:
TDCTop dead center
NOxNitrogen oxide
BTEBrake thermal efficiency
NONitric oxide
COCarbon monoxide
CNCetane number
ATDCAfter top dead center
CFDComputational fluid dynamics
DIDirect injection
HRRHeat release rate
BDCBottom dead center

References

  1. Zincir, B.; Deniz, C.; Tunér, M. Investigation of environmental, operational and economic performance of methanol partially premixed combustion at slow speed operation of a marine engine. J. Clean. Prod. 2019, 235, 1006–1019. [Google Scholar] [CrossRef]
  2. Zhang, Z.; Li, D.; Liu, C.; Yin, Z.; Guan, W.; Wang, Y.; Lu, K.; Yu, W.; Pan, M. Multi-objective optimization of urea injection parameters of selective catalytic reduction system based SSABP-NSGA-II-TOPSIS. Case Stud. Therm. Eng. 2026, 78, 107709. [Google Scholar] [CrossRef]
  3. Tezdogan, T.; Demirel, Y.K.; Kellett, P.; Khorasanchi, M.; Incecik, A.; Turan, O. Full-scale unsteady RANS CFD simulations of ship behaviour and performance in head seas due to slow steaming. Ocean Eng. 2015, 97, 186–206. [Google Scholar] [CrossRef]
  4. Zhang, Z.; Lv, J.; Li, W.; Long, J.; Wang, S.; Tan, D.; Yin, Z. Performance and emission evaluation of a marine diesel engine fueled with natural gas ignited by biodiesel-diesel blended fuel. Energy 2022, 256, 124662. [Google Scholar] [CrossRef]
  5. Canakci, M.; Sayin, C.; Ozsezen, A.N.; Turkcan, A. Effect of Injection Pressure on the Combustion, Performance, and Emission Characteristics of a Diesel Engine Fueled with Methanol-blended Diesel Fuel. Energy Fuels 2009, 23, 2908–2920. [Google Scholar] [CrossRef]
  6. Eyring, V.; Isaksen, I.S.A.; Berntsen, T.; Collins, W.J.; Corbett, J.J.; Endresen, O.; Grainger, R.G.; Moldanova, J.; Schlager, H.; Stevenson, D.S. Transport impacts on atmosphere and climate: Shipping. Atmos. Environ. 2010, 44, 4735–4771. [Google Scholar] [CrossRef]
  7. Gray, N.; McDonagh, S.; O’Shea, R.; Smyth, B.; Murphy, J.D. Decarbonising ships, planes and trucks: An analysis of suitable low-carbon fuels for the maritime, aviation and haulage sectors. Adv. Appl. Energy 2021, 1, 100008. [Google Scholar] [CrossRef]
  8. Zhang, Z.; Ye, J.; Tan, D.; Feng, Z.; Luo, J.; Tan, Y.; Huang, Y. The effects of Fe2O3 based DOC and SCR catalyst on the combustion and emission characteristics of a diesel engine fueled with biodiesel. Fuel 2021, 290, 120039. [Google Scholar] [CrossRef]
  9. Li, J.; Lu, K.; Tan, D.; Zhang, Z.; Yin, Z.; Li, D.; Shao, H. Multi-objective optimization of combustion and emission characteristics of ammonia-diesel dual-fuel engines under HPDI strategy based on ELM-MOPSO. Results Eng. 2026, 29, 108705. [Google Scholar] [CrossRef]
  10. Tan, D.; Li, D.; Wang, S.; Zhang, Z.; Tian, J.; Li, J.; Lv, J.; Zheng, W.; Ye, Y. Evaluation and optimization of hydrogen addition on the performance and emission for biodiesel dual-fuel engines with different blend ratios based on the response surface method. Energy 2023, 283, 129168. [Google Scholar] [CrossRef]
  11. Abdalla, A.M.; Hossain, S.; Nisfindy, O.B.; Azad, A.T.; Dawood, M.; Azad, A.K. Hydrogen production, storage, transportation and key challenges with applications: A review. Energy Convers. Manag. 2018, 165, 602–627. [Google Scholar] [CrossRef]
  12. Mehra, R.K.; Duan, H.; Juknelevičius, R.; Ma, F.; Li, J. Progress in hydrogen enriched compressed natural gas (HCNG) internal combustion engines—A comprehensive review. Renew. Sustain. Energy Rev. 2017, 80, 1458–1498. [Google Scholar] [CrossRef]
  13. Lu, K.; Zhang, Z.; Zhang, J.; Wang, Y.; Liu, C.; Yin, Z.; Huang, M.; Tan, D. Investigation in impact of ammonia energy ratio and operating parameters on combustion process and multi-objective optimization in an ammonia-diesel dual-fuel engine. Case Stud. Therm. Eng. 2025, 76, 107416. [Google Scholar] [CrossRef]
  14. Dhinesh, B.; Annamalai, M.; Lalvani, I.J.; Annamalai, K. Studies on the influence of combustion bowl modification for the operation of Cymbopogon flexuosus biofuel based diesel blends in a DI diesel engine. Appl. Therm. Eng. 2017, 112, 627–637. [Google Scholar] [CrossRef]
  15. Saeed, M.N.; Henein, N.A. Combustion Phenomena of Alcohols in C. I. Engines. J. Eng. Gas Turbines Power 1989, 111, 439–444. [Google Scholar] [CrossRef]
  16. Blumberg, T.; Tsatsaronis, G.; Morosuk, T. On the economics of methanol production from natural gas. Fuel 2019, 256, 115824. [Google Scholar] [CrossRef]
  17. Najafia, G.; Yusaf, T.F. Experimental investigation of using methanol-diesel blended fuels in diesel engine. In Proceedings of the Fourth International Conference on Thermal Engineering: Theory and Applications, Abu Dhabi, United Arab Emirates, 12–14 January 2009. [Google Scholar]
  18. Huber, G.W.; Iborra, S.; Corma, A. Synthesis of Transportation Fuels from Biomass:  Chemistry, Catalysts, and Engineering. Chem. Rev. 2006, 106, 4044–4098. [Google Scholar] [CrossRef]
  19. Arapatsakos, C.; Karkanis, A.; Sparis, P.D. Behavior of a Small Four-Stroke Engine Using as Fuel Methanol—Gasoline Mixtures. In Small Engine Technology Conference & Exposition; SAE Technical Paper; SAE International: Warrendale, PA, USA, 2003. [Google Scholar]
  20. Zhen, X.; Wang, Y.; Zhu, Y. Study of knock in a high compression ratio SI methanol engine using LES with detailed chemical kinetics. Energy Convers. Manag. 2013, 75, 523–531. [Google Scholar] [CrossRef]
  21. Bozzano, G.; Manenti, F. Efficient methanol synthesis: Perspectives, technologies and optimization strategies. Prog. Energy Combust. Sci. 2016, 56, 71–105. [Google Scholar] [CrossRef]
  22. Svanberg, M.; Ellis, J.; Lundgren, J.; Landälv, I. Renewable methanol as a fuel for the shipping industry. Renew. Sustain. Energy Rev. 2018, 94, 1217–1228. [Google Scholar] [CrossRef]
  23. Canakci, M.; Sayin, C.; Gumus, M. Exhaust Emissions and Combustion Characteristics of a Direct Injection (DI) Diesel Engine Fueled with Methanol−Diesel Fuel Blends at Different Injection Timings. Energy Fuels 2008, 22, 3709–3723. [Google Scholar] [CrossRef]
  24. Verhelst, S.; Turner, J.W.G.; Sileghem, L.; Vancoillie, J. Methanol as a fuel for internal combustion engines. Prog. Energy Combust. Sci. 2019, 70, 43–88. [Google Scholar] [CrossRef]
  25. Zhen, X.; Wang, Y. An overview of methanol as an internal combustion engine fuel. Renew. Sustain. Energy Rev. 2015, 52, 477–493. [Google Scholar] [CrossRef]
  26. Ganesh, I. Conversion of carbon dioxide into methanol—A potential liquid fuel: Fundamental challenges and opportunities (a review). Renew. Sustain. Energy Rev. 2014, 31, 221–257. [Google Scholar] [CrossRef]
  27. Yao, M.; Zheng, Z.; Liu, H. Progress and recent trends in homogeneous charge compression ignition (HCCI) engines. Prog. Energy Combust. Sci. 2009, 35, 398–437. [Google Scholar] [CrossRef]
  28. Lata, D.B.; Misra, A.; Medhekar, S. Effect of hydrogen and LPG addition on the efficiency and emissions of a dual fuel diesel engine. Int. J. Hydrogen Energy 2012, 37, 6084–6096. [Google Scholar] [CrossRef]
  29. Sayin, C.; Ilhan, M.; Canakci, M.; Gumus, M. Effect of injection timing on the exhaust emissions of a diesel engine using diesel–methanol blends. Renew. Energy 2009, 34, 1261–1269. [Google Scholar] [CrossRef]
  30. Abdelaal, M.M.; Hegab, A.H. Combustion and emission characteristics of a natural gas-fueled diesel engine with EGR. Energy Convers. Manag. 2012, 64, 301–312. [Google Scholar] [CrossRef]
  31. Nguyen, V.N.; Nayak, S.K.; Le, H.S.; Kowalski, J.; Deepanraj, B.; Duong, X.Q.; Truong, T.H.; Tran, V.D.; Cao, D.N.; Nguyen, P.Q.P. Performance and emission characteristics of diesel engines running on gaseous fuels in dual-fuel mode. Int. J. Hydrogen Energy 2024, 49, 868–909. [Google Scholar] [CrossRef]
  32. Saravanan, N.; Nagarajan, G.; Narayanasamy, S. Experimental Investigation on Performance and Emission Characteristics of DI Diesel Engine with Hydrogen Fuel; SAE Technical Paper; SAE Mobilus: Warrendale, PA, USA, 2007. [Google Scholar]
  33. Saravanan, N.; Nagarajan, G.; Kalaiselvan, K.M.; Dhanasekaran, C. An experimental investigation on hydrogen as a dual fuel for diesel engine system with exhaust gas recirculation technique. Renew. Energy 2008, 33, 422–427. [Google Scholar] [CrossRef]
  34. Sun, W.; Jiang, M.; Guo, L.; Zhang, H.; Jia, Z.; Qin, Z.; Zeng, W.; Lin, S.; Zhu, G.; Ji, S.; et al. Numerical study of injection strategies for marine methanol/diesel direct dual fuel stratification engine. J. Clean. Prod. 2023, 421, 138505. [Google Scholar] [CrossRef]
  35. Miroshnichenko, D.V.; Balaeva, Y.S. Calculating the higher heat of coal combustion in the wet ash-free state. Coke Chem. 2013, 56, 85–89. [Google Scholar] [CrossRef]
  36. Bayraktar, H. An experimental study on the performance parameters of an experimental CI engine fueled with diesel–methanol–dodecanol blends. Fuel 2008, 87, 158–164. [Google Scholar] [CrossRef]
  37. Qi, D.H.; Lee, C.F. Combustion and emissions behaviour for ethanol–gasoline-blended fuels in a multipoint electronic fuel injection engine. Int. J. Sustain. Energy 2016, 35, 323–338. [Google Scholar] [CrossRef]
  38. Sayin, C.; Ozsezen, A.N.; Canakci, M. The influence of operating parameters on the performance and emissions of a DI diesel engine using methanol-blended-diesel fuel. Fuel 2010, 89, 1407–1414. [Google Scholar] [CrossRef]
  39. Saxena, M.R.; Maurya, R.K.; Mishra, P. Assessment of performance, combustion and emissions characteristics of methanol-diesel dual-fuel compression ignition engine: A review. J. Traffic Transp. Eng. (Engl. Ed.) 2021, 8, 638–680. [Google Scholar] [CrossRef]
  40. Yang, W.; Li, F.; Ma, F.; Xu, D.; Xu, J.; Wang, F. Influence of the Port Height to Stroke Ratio on the Performance of an OP2S Engine Fueled with Methanol/Diesel. Energies 2022, 15, 2186. [Google Scholar] [CrossRef]
  41. Karvounis, P.; Theotokatos, G.; Patil, C.; Xiang, L.; Ding, Y. Parametric investigation of diesel–methanol dual fuel marine engines with port and direct injection. Fuel 2025, 381, 133441. [Google Scholar] [CrossRef]
  42. Panda, K.; Ramesh, A. Diesel injection strategies for reducing emissions and enhancing the performance of a methanol based dual fuel stationary engine. Fuel 2021, 289, 119809. [Google Scholar] [CrossRef]
  43. Zhang, Z.; E, J.; Deng, Y.; Pham, M.; Zuo, W.; Peng, Q.; Yin, Z. Effects of fatty acid methyl esters proportion on combustion and emission characteristics of a biodiesel fueled marine diesel engine. Energy Convers. Manag. 2018, 159, 244–253. [Google Scholar] [CrossRef]
  44. Beelen, R.; Raaschou-Nielsen, O.; Stafoggia, M.; Andersen, Z.J.; Weinmayr, G.; Hoffmann, B.; Wolf, K.; Samoli, E.; Fischer, P.; Nieuwenhuijsen, M.; et al. Effects of long-term exposure to air pollution on natural-cause mortality: An analysis of 22 European cohorts within the multicentre ESCAPE project. Lancet 2014, 383, 785–795. [Google Scholar] [CrossRef] [PubMed]
Figure 1. Schematic diagram of engine test.
Energies 19 01794 g001
Figure 2. Three-dimensional grid: (a) the top dead center; (b) the bottom dead center.
Energies 19 01794 g002
Figure 3. Comparison of experiment and simulation: (a) Cylinder pressure; (b) HRR curve.
Energies 19 01794 g003
Figure 4. Comparison of simulated vs. experimental results for major emissions.
Energies 19 01794 g004
Figure 5. Cylinder pressure curve at different methanol blending ratios (a); intake temperatures (b); fuel injection advance angles (c); and EGR (d).
Energies 19 01794 g005
Figure 6. Temperature distribution at different methanol blending ratios.
Energies 19 01794 g006
Figure 7. Temperature distribution at different intake temperatures.
Energies 19 01794 g007
Figure 8. Temperature field distribution at different fuel injection advance angles.
Energies 19 01794 g008
Figure 9. Temperature field distribution at different EGR rates.
Energies 19 01794 g009
Figure 10. HRR at different methanol blending ratios (a); intake temperatures (b); fuel injection advance angles (c); and EGR rates (d).
Energies 19 01794 g010
Figure 11. CO mass fraction at different methanol blending ratios (a); intake temperatures (b); fuel injection advance angles (c); and EGR (d).
Energies 19 01794 g011aEnergies 19 01794 g011b
Figure 12. NO emission mass fraction at different methanol blending ratios (a); intake temperatures (b); fuel injection advance angles (c); and EGR (d).
Energies 19 01794 g012
Figure 13. NO concentration fields at different methanol blend ratios.
Energies 19 01794 g013
Figure 14. NO concentration fields at different intake temperatures.
Energies 19 01794 g014
Figure 15. NO concentration fields at different fuel injection advance angles.
Energies 19 01794 g015
Figure 16. Soot emission mass fraction for different methanol blending ratios (a); intake temperatures (b); fuel injection advance angles (c); and EGR (d).
Energies 19 01794 g016aEnergies 19 01794 g016b
Figure 17. Flowchart for multi-parameter matching optimization via orthogonal design.
Energies 19 01794 g017
Figure 18. Trend of NOx mass fraction.
Energies 19 01794 g018
Figure 19. Trends in factors and indicated power.
Energies 19 01794 g019aEnergies 19 01794 g019b
Table 1. Key parameters for the diesel engine.
Performance IndexUnitValue or Description
Nozzle orifice diametermm0.3
Bore × strokemm × mm190 × 210
Rating power outputkW220
Total displacementL23.82
Average effective pressureMPa1.109
Spray angle°150
Crank radiusmm105
Average effective pressureMPa1.109
Fuel injection holes-8
Combustion chamber shape-straight-throat ω
Engine type-four-stroke, water-cooled DI
Compression ratio-14:1
Connecting rodmm410
Rated engine speedr/min1000
Table 2. List of measurements, the measuring range, and accuracy.
MeasurementsMeasuring RangeAccuracy
Engine speed1–2000 rpm±0.2%
Air flow mass0–33.3 kg/min±1%
NOx emissions0–5000 ppmBelow 1.0%FS
Crank angle encoder0–720 °CA±0.2 °CA
Torque0–5000 N·m±0.2%FS
Fuel consumption1000 g±0.2%
CO2 emission0–16%volBelow ± 1.0%FS
CO emission0–3000 ppmBelow ± 1.0%FS
Exhaust gas temperature0–1000 °C±1 °C
HC emission0–20,000 ppmBelow ± 1.0%FS
Table 3. Comparison of physical and chemical properties of the two fuels.
PropertiesUnitMethanolDiesel
Chemical formula-CH3OHC10–22
Oxygen volume fraction%500.4
Densitykg·m−30.790.82–0.85
Low calorific valueMJ/kg19.6642.5
Latent heat of vaporizationKJ/kg1109270
Cetane number-345–55
Flash point°C1155
Chemical formula-CH3OHC10–22
Oxygen volume fraction%500.4
Densitykg·m−30.790.82–0.85
Low calorific valueMJ/kg19.6642.5
Ignition temperature°C470230–260
Boiling point°C64.8175–360
Theoretical air–fuel ratiokg/kg6.514.4
Table 4. Grid count independence verification.
Number of GridsAverage Effective Pressure
/MPa
Relative Error
(%)
12,3311.132
14,2541.1743.58
15,8051.1961.83
17,3181.2181.81
18,2721.2341.78
Table 5. Factor level.
LevelA (%)B (%)C (°CA)D (K)E (MPa)
10016.6315.150.173
2107.518.6325.150.193
3201020.6335.150.213
43012.522.6345.150.233
Table 6. Orthogonal design and simulation data.
LevelA (%)B (%)C (°CA)D (K)E (MPa)NOx Mass Fraction (10−5%)Indicated Power (kW)
10016.6315.150.1736.8861.23
207.518.6325.150.1935.8959.34
301020.6335.150.2135.1759.12
4012.522.6345.150.2334.3958.66
510018.6345.150.2137.3558.16
6107.516.6335.150.2335.9957.11
7101022.6325.150.1734.3656.49
81012.520.6315.150.1933.4154.41
920020.6325.150.2336.5253.95
10207.522.6315.150.2135.4452.83
11201016.6345.150.1933.0750.35
122012.518.6335.150.1732.1649.13
1330022.6335.150.1936.5748.16
14307.520.6345.150.1734.4146.35
15301018.6315.150.2333.1745.48
163012.516.6325.150.2132.3643.62
Table 7. Design for a first-order orthogonal regression experiment.
Exp.z1z2z1 × z2z3z1 × z3z4z5
1z1111111
2111−1−1−1−1
31−1−111−1−1
41−1−1−1−111
511−11−11−1
6−11−1−11−11
7−1−111−1−11
8−1−11−111−1
9−1000000
100000000
110000000
Table 8. Comparison of plans.
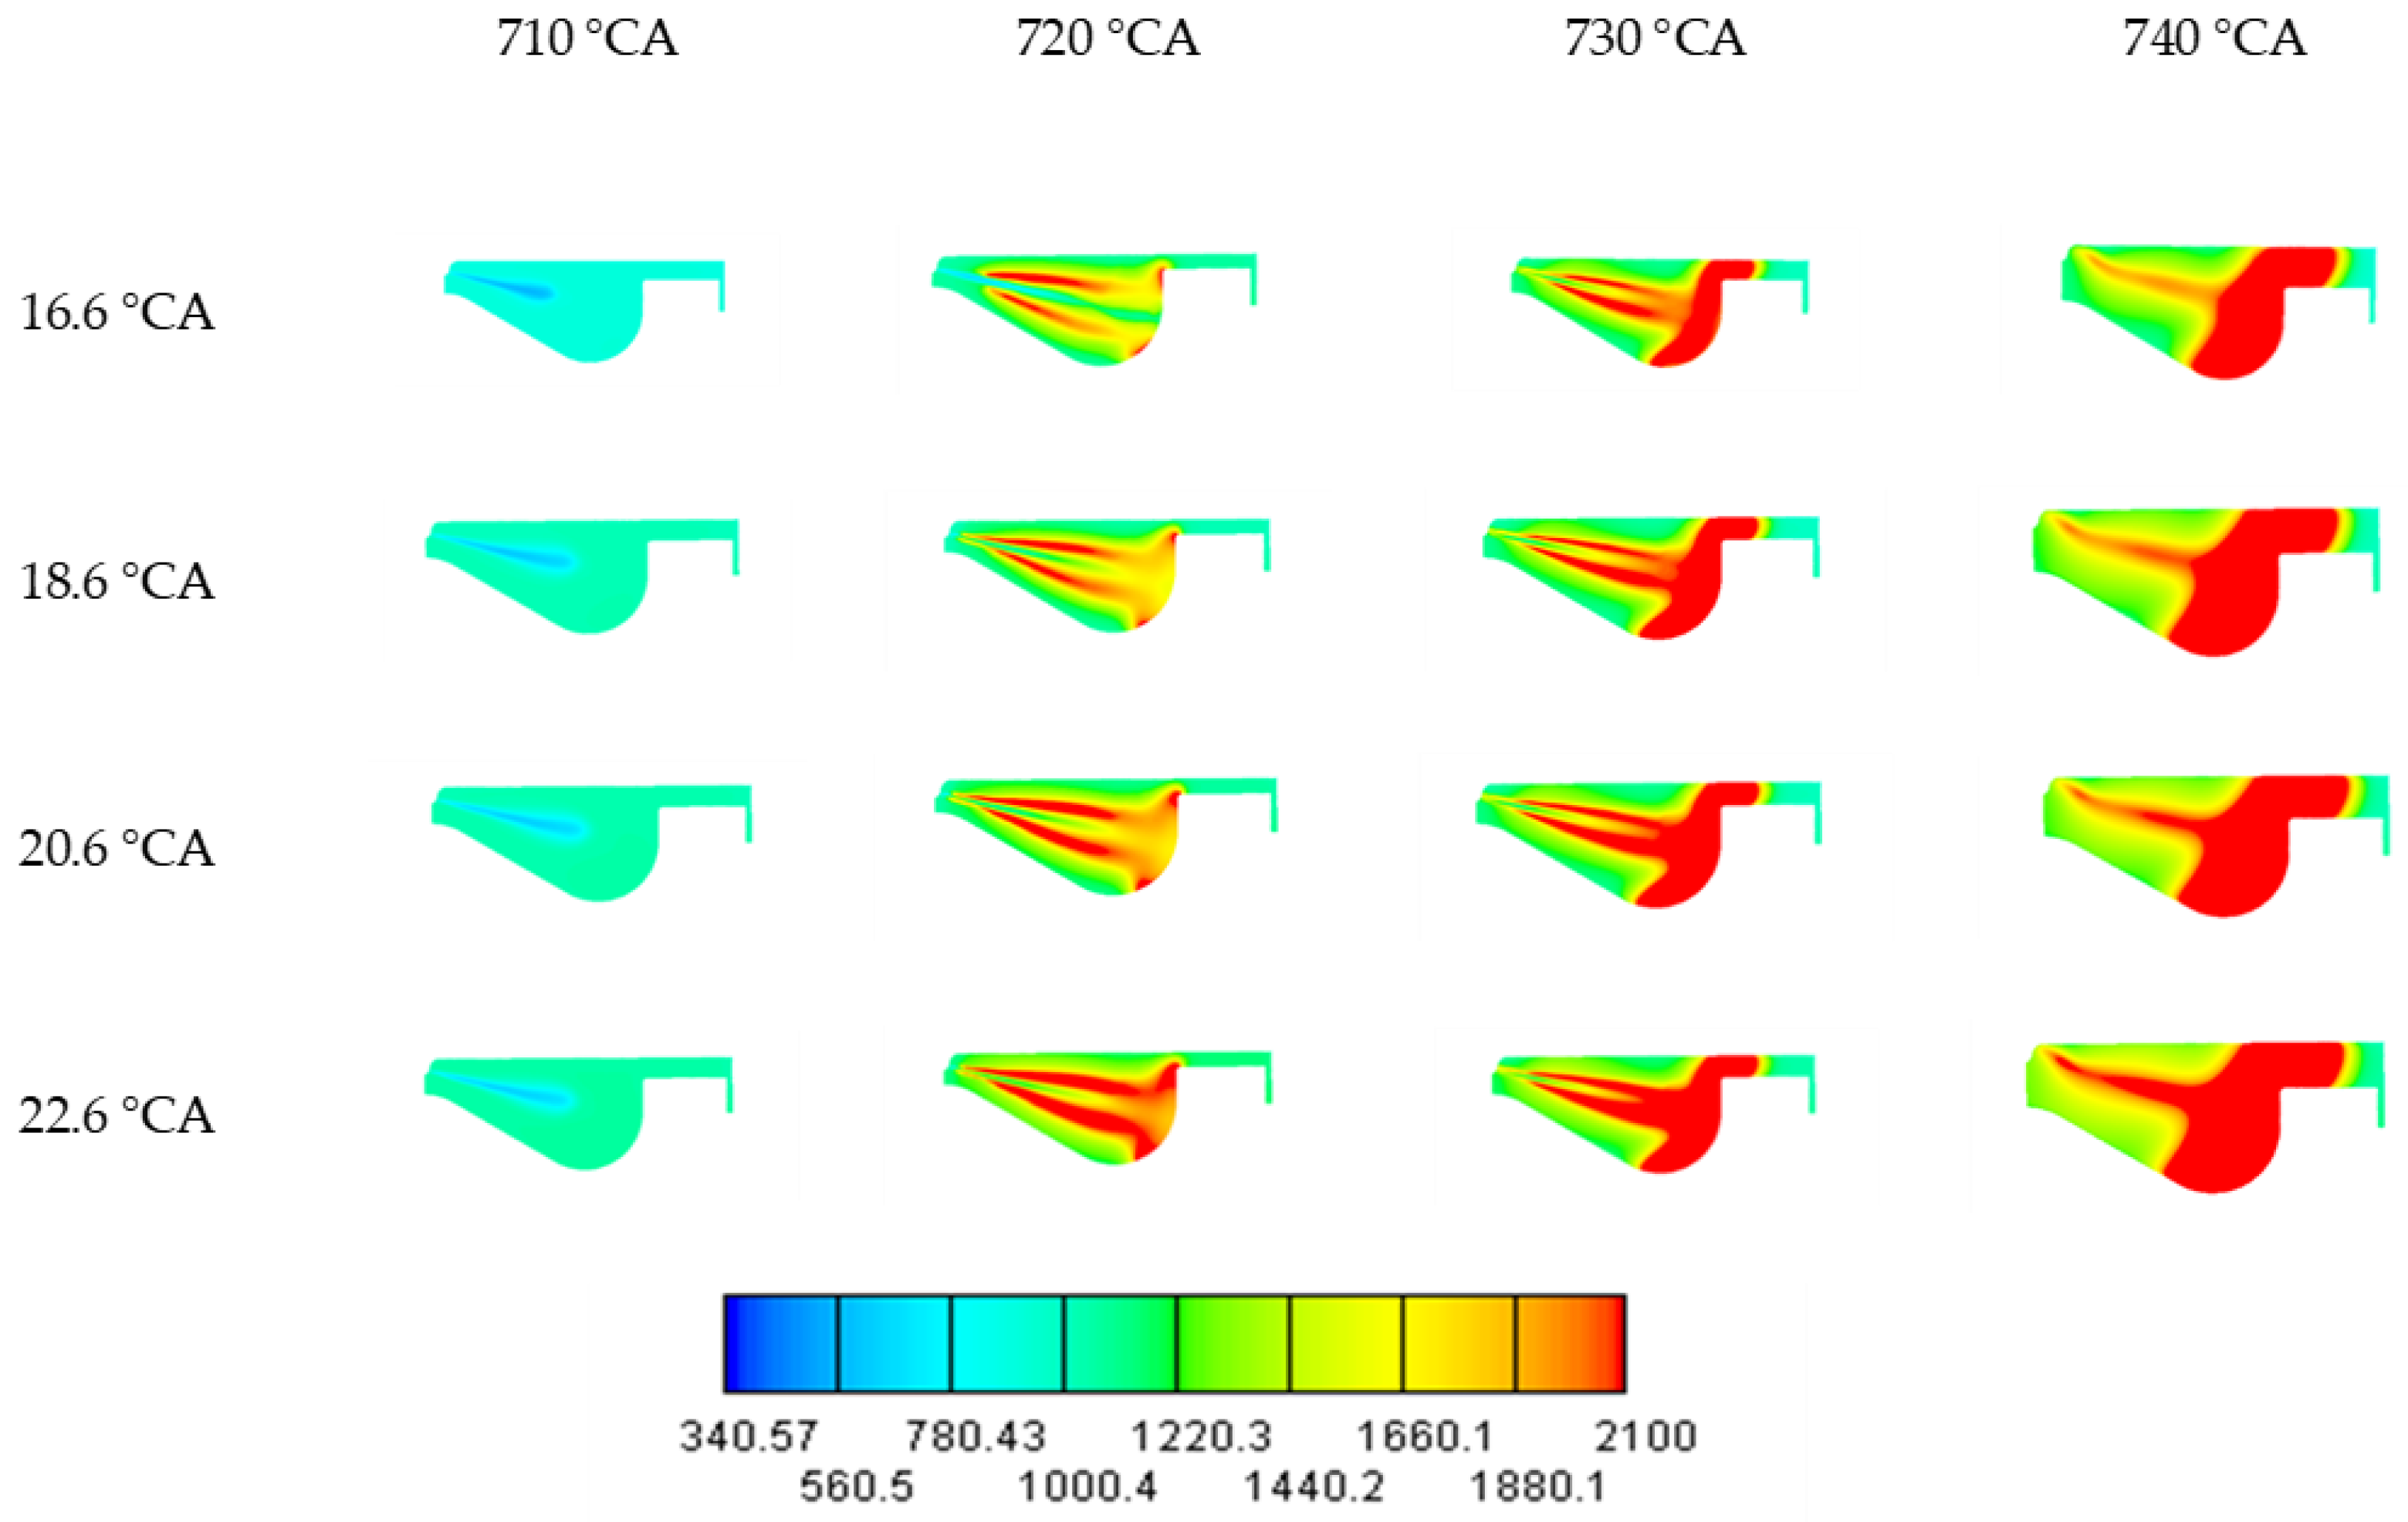
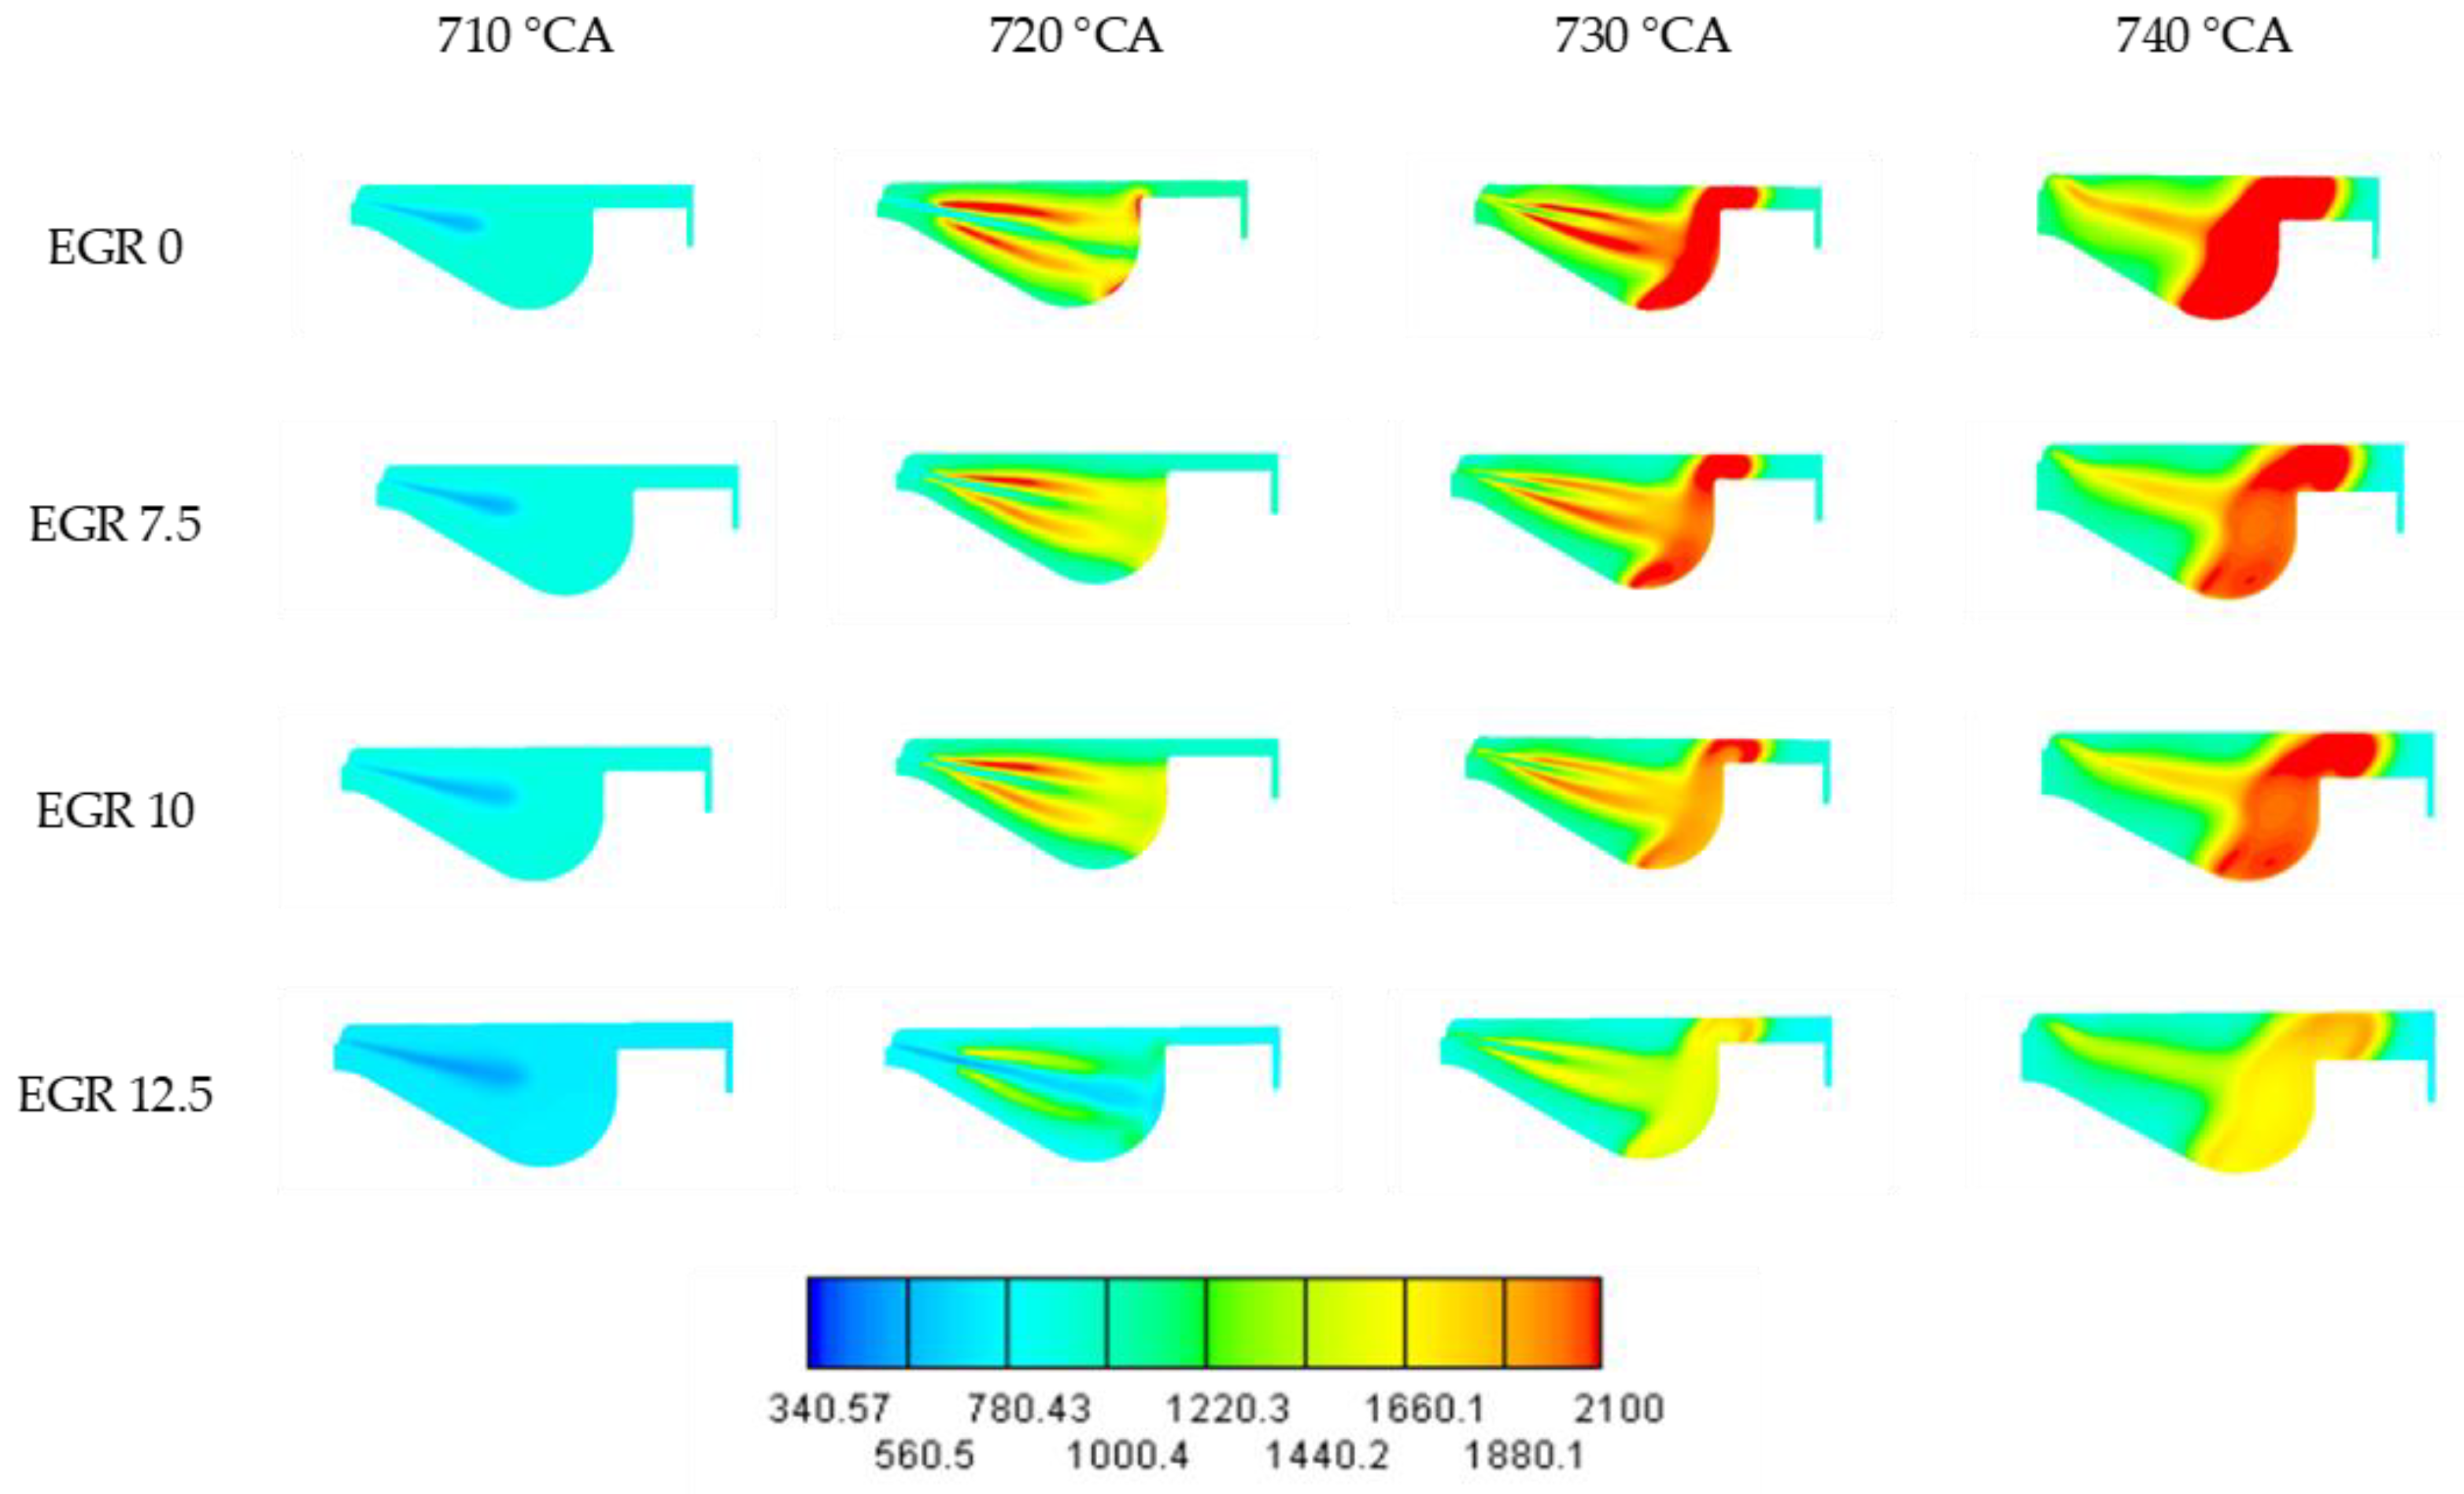
DesignABCDENOx Mass Fraction (10−5%)
13012.516.6315.150.1732.06
22712.521.2319.050.2231.65
Table 9. Comparison of revised optimization schemes.
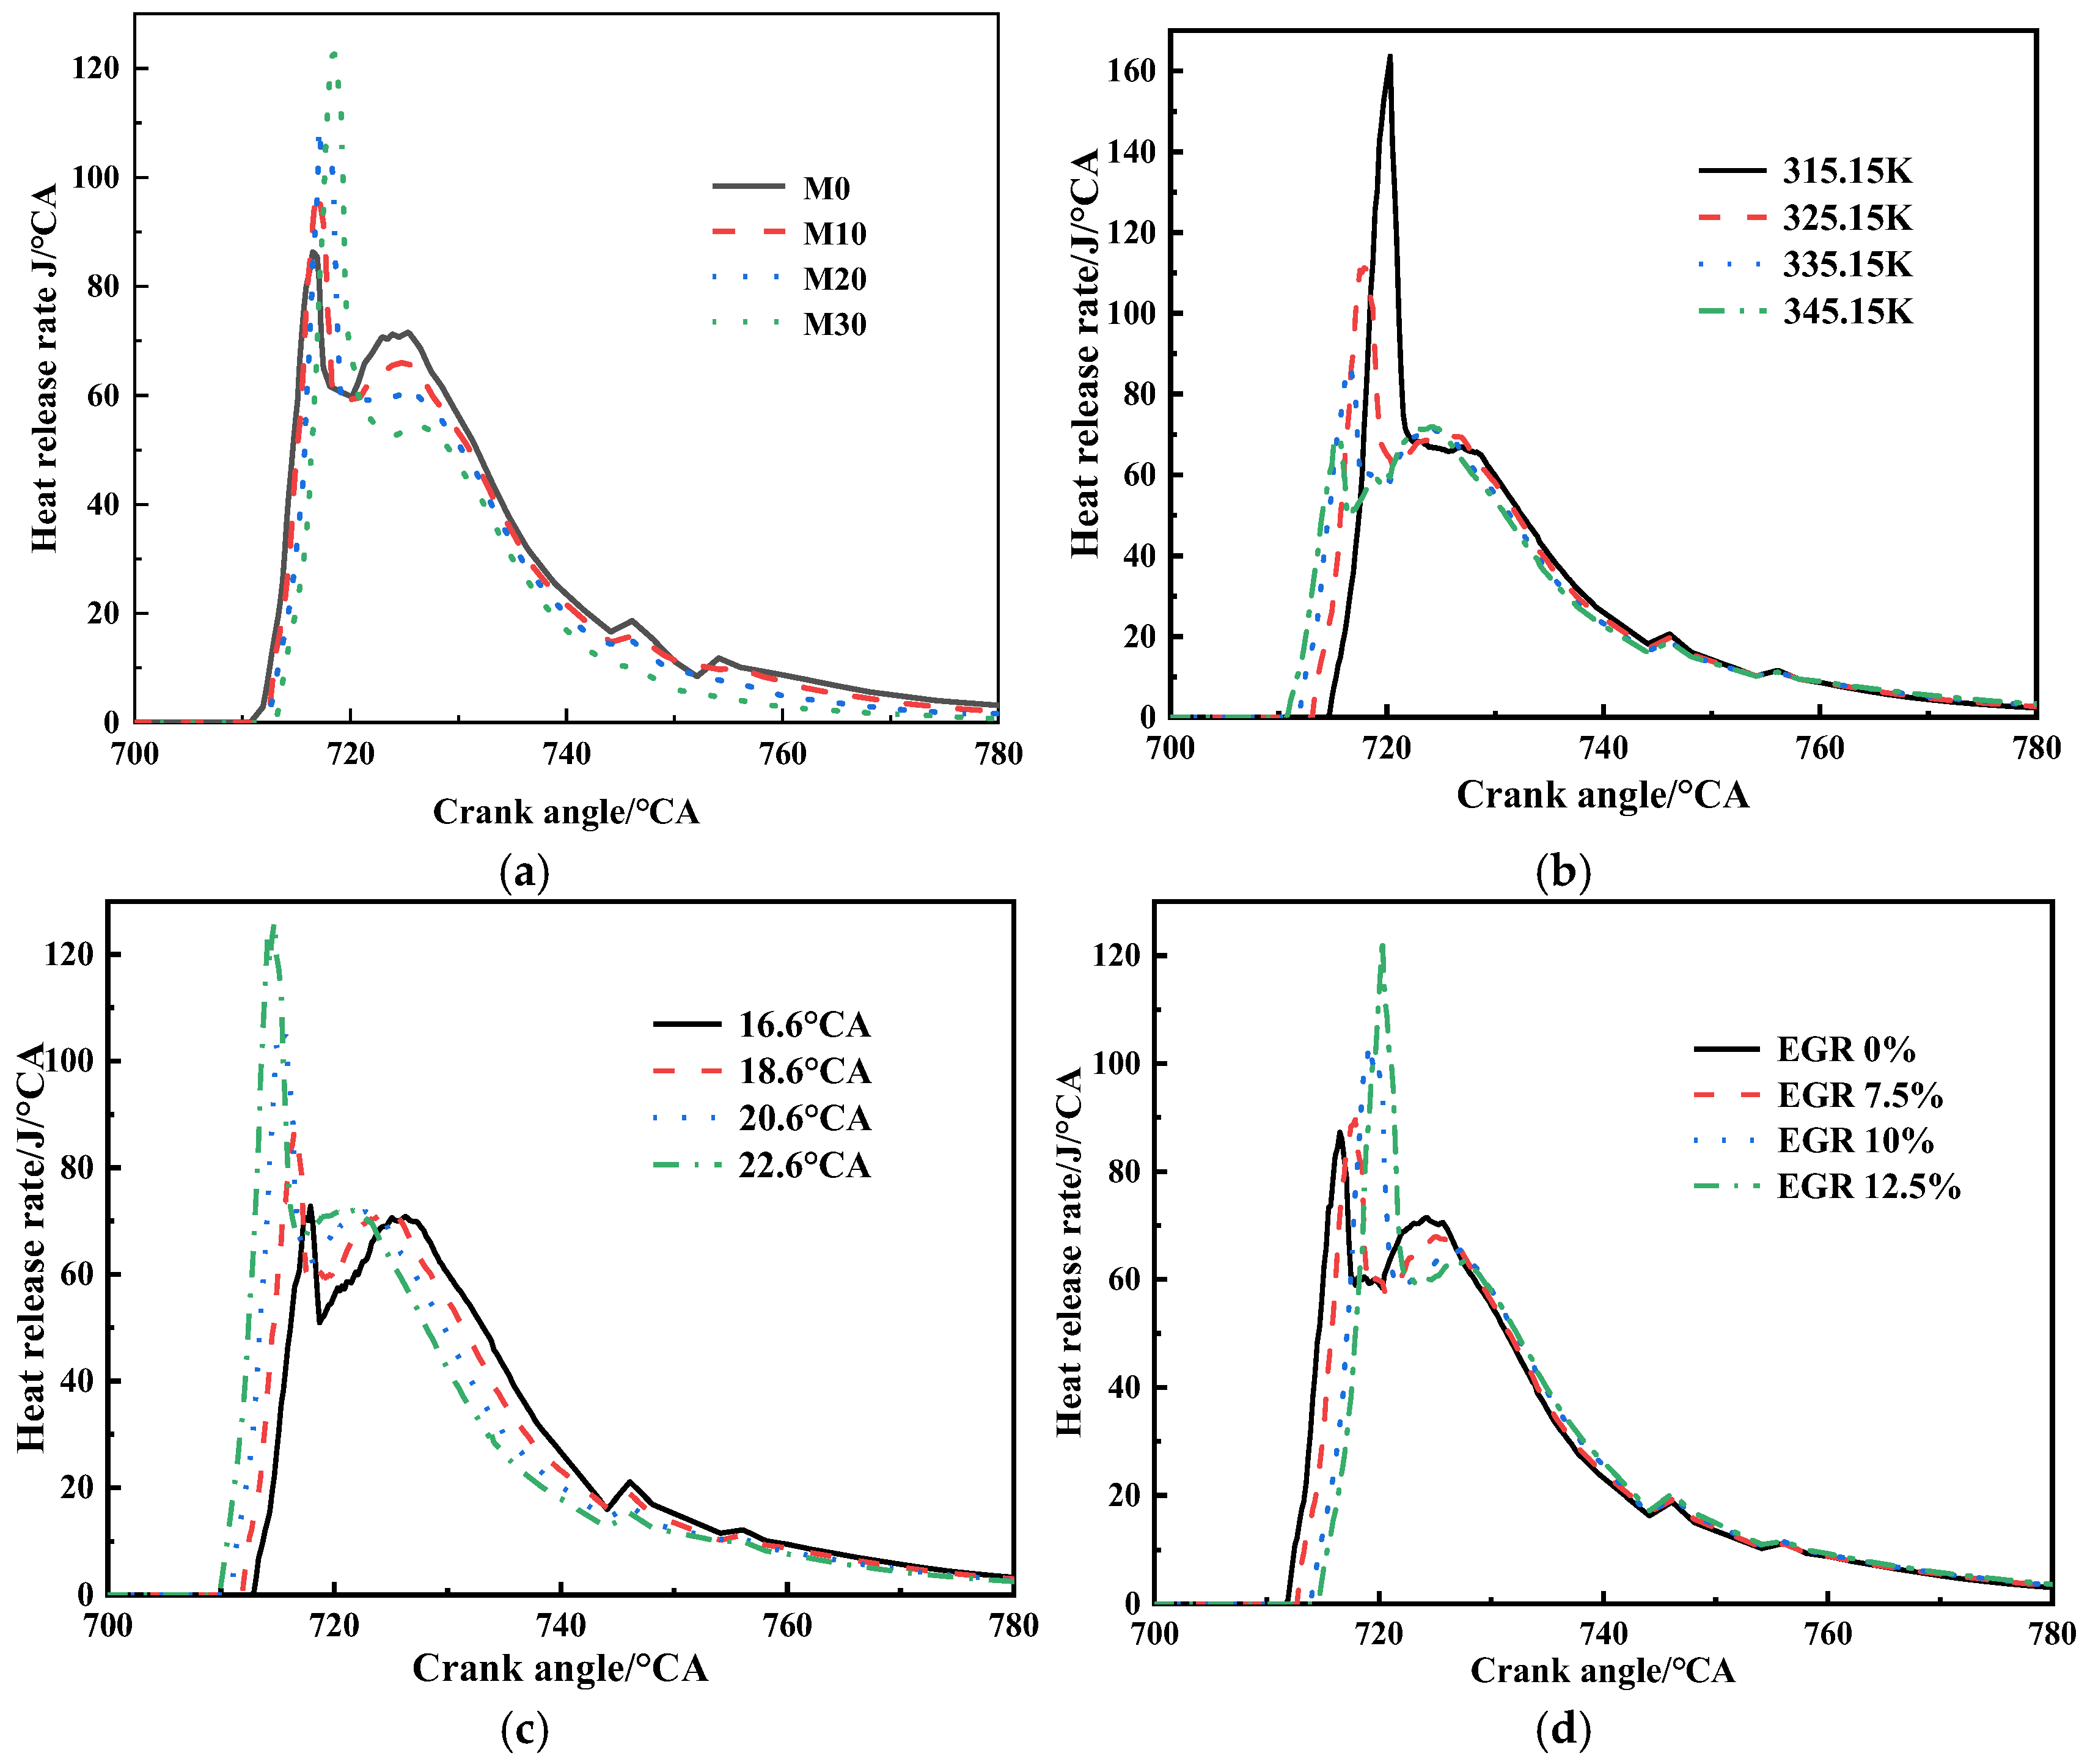
SchemeABCDENOx Mass Fraction (10−5%)Indicated Power (kW)
1271021.2319.050.2232.0853.84
22712.521.2315.150.2232.3654.06
32712.521.2319.050.2231.6553.65
Disclaimer/Publisher’s Note: The statements, opinions and data contained in all publications are solely those of the individual author(s) and contributor(s) and not of MDPI and/or the editor(s). MDPI and/or the editor(s) disclaim responsibility for any injury to people or property resulting from any ideas, methods, instructions or products referred to in the content.