Article

A Hybrid Framework of Quantitative Infrared Thermography and Building Energy Simulation for Cost-Optimal Building Envelope Retrofitting

by
Egemen Kaymaz
Department of Architecture, Bursa Uludağ University, 16059 Bursa, Türkiye
Energies 2026, 19(7), 1727; https://doi.org/10.3390/en19071727
Submission received: 20 February 2026 / Revised: 26 March 2026 / Accepted: 30 March 2026 / Published: 1 April 2026

Abstract

This study integrates in situ Quantitative Infrared Thermography (QIRT) and Building Energy Simulation (BES) to optimize the energy performance of an existing multi-story residential building in Istanbul, Türkiye. QIRT was utilized to diagnose thermal anomalies at the interfaces of uninsulated walls, the RC skeleton and fenestration junctions, revealing significant thermal bridging and air infiltration while enabling the calculation of the Temperature Index (TI) at critical interfaces. A key finding of the non-destructive diagnostic phase was the discrepancy between in situ (UINSITU) and theoretical (UCALC) thermal transmittance values, providing an empirical baseline for subsequent optimization. A multi-objective analysis, employing genetic algorithms (GAs), was conducted to evaluate 192 retrofit combinations, involving three insulation materials at four thicknesses and 16 glazing types. The impacts on primary energy consumption, CO2 emissions, and 30-year global costs (per EN 15459-1:2017) were quantified under volatile economic conditions. Findings indicate that the energy-optimal solution reduces primary energy by 53% and CO2 emissions by 51%, while the cost-optimal configuration reduces global costs by 52% relative to the reference case. The Pareto analysis reveals a robust convergence between financial and energy efficiency targets, proving that deep retrofitting is an economically imperative strategy for achieving national decarbonization goals and the 2053 net-zero vision.

1. Introduction

In Türkiye, the residential sector stands as a critical pillar of energy consumption, trailing only industry and transportation [1]. Accounting for 21% of electricity use and 20% of total end-use energy, dwellings represent 9% of national carbon emissions [2]. With a building stock exceeding 10 million units and housing 24 million households [3], the decarbonization of existing residential structures is not merely a technical challenge but a national imperative for achieving the Nearly Zero Energy Building (NZEB) and 2053 net-zero carbon vision [4]. Given that space heating constitutes approximately 48% of household energy demand [2], the building envelope remains the primary target for enhancing thermal resilience and energy efficiency.
The national energy policy landscape has evolved through a sequence of regulatory instruments, primarily anchored by the Thermal Insulation Requirements for Buildings (TS 825) [5,6], and the Building Energy Performance (BEP) Regulation [7,8]. The introduction of the Energy Performance Certificate (EPC) program via BEP-tr in 2010 marked a shift toward mandatory documentation and verification of efficiency [9].
Recent updates, particularly the 2024 revisions to TS 825, reflect an iterative policy approach aimed at tightening thermal bridging considerations and insulation standards [6]. In their study on Turkish residential buildings, Caglayan et al. [10] demonstrated that GA-based envelope optimization can achieve energy savings 20–25% below the standard regulatory limits. While these regulations provide a baseline for new constructions, their application to the complex, uninsulated existing stock remains a significant area of research.
While external thermal insulation is widely recognized for mitigating thermal bridging, preventing condensation, and enhancing indoor comfort, its effectiveness is highly sensitive to climate-specific variables and material synergies. Research consistently demonstrates that insulation thickness, glazing efficiency, and heating, ventilation, and air conditioning (HVAC) capacities are interdependent factors [11]. For instance, studies have shown that inadequate consideration of thermal bridges can lead to an ‘energy performance gap’ where actual savings deviate significantly from theoretical projections [12,13,14]. Therefore, achieving deep retrofits requires more than generic compliance; it demands a precise alignment of in situ performance diagnostics with multi-objective optimization to ensure both energy efficiency and economic viability under current market dynamics [15]. Furthermore, envelope retrofits can be complemented by active cooling load management. Recent research by Li et al. [16] suggests that residential air conditioning offers potential for demand-side flexibility, where operational adjustments help mitigate peak loads without compromising thermal comfort. Integrating such control strategies with passive improvements may help bridge the gap between static retrofits and dynamic energy needs, offering a synergetic approach toward more resilient building operation.
In 2024, the national standard TS 825 underwent a significant revision, tightening the recommended U-values, insulation thicknesses, and glazing selection criteria to align with modern efficiency targets [6]. However, as Aydin and Biyikoglu [17] emphasized through life cycle assessment (LCA) analysis for Turkey, earlier standards often fell short of economic optimums; by accounting for both heating and cooling loads, energy savings can be further increased by up to 21.5% beyond these regulatory limits. The evolutionary trajectory of TS 825—comparing the reference U-values for the years 2008 and 2024—illustrates an increasingly rigorous regulatory environment for both new constructions and retrofitting projects within the 3rd climatic zone, as summarized in Table 1.
Global energy and environmental policies have heightened the urgency of reducing the life-cycle energy impacts of the built environment, positioning the building envelope as the primary target for intervention since it fundamentally dictates space-conditioning demand. In accordance with the European Union (EU) Construction Products Regulation (CPR) [18] and the latest Energy Performance of Buildings Directive (EPBD 2024 recast) [19], building components are required to maintain high-performance standards —moving towards zero-emission targets—over an economically reasonable service life. In the context of the European ‘Renovation Wave’ strategy, deep retrofit is recognized as a critical mechanism for achieving these targets and decarbonizing the building stock [20]. Unlike incremental interventions, this approach entails a holistic, whole-building strategy aimed at significant energy demand reduction [21]. By integrating high-performance envelope upgrades with optimized HVAC systems, deep retrofit frameworks transition residential buildings toward ‘nearly zero-energy’ standards, effectively addressing the performance gap inherent in existing building stocks. This performance is largely governed by the envelope’s hygrothermal behavior, which not only shapes long-term energy efficiency and durability but also directly impacts thermal comfort and indoor air quality through its influence on surface temperatures and moisture regulation.
Dampness within the building envelope acts as a primary catalyst for thermal degradation. Persistent moisture—originating from construction residues, wind-driven rain, or interstitial condensation—triggers a cascade of chemical and physical deterioration that undermines structural durability and indoor air quality [22]. Consequently, the building envelope must fulfill a complex set of hygrothermal objectives: controlling water ingress, minimizing seasonal heat transfer, and eliminating thermal bridges. Thermal bridges, particularly those arising from the RC structural frame (beams, columns, floor slabs) and geometric junctions, create localized paths of high thermal conductivity. These anomalies not only elevate the effective U-value but also lower interior surface temperatures, significantly increasing the risk of mold growth and material decay [23]. Field audits by Tabet Aoul et al. [24] underscore that even in modern constructions, significant energy loss occurs due to such recurring defects as insulation discontinuity, which directly compromises occupant health and energy costs.
Thermal bridges are technically classified into material, geometric, and mixed types [25]; however, they all share a common characteristic: the deformation of the temperature field, which necessitates the use of partial differential equations for accurate internal surface temperature calculation. Beyond their impact on thermal transmittance (U-values), the elimination of thermal bridges is paramount for maintaining a healthy indoor environment by preventing condensation and mold growth, adhering to essential hygiene criteria. Furthermore, as established in the literature, the significance of these junctions tends to escalate in retrofitted buildings where insulation levels are increased [26].
Infrared thermography (IRT) has established itself as a robust non-destructive tool for evaluating the hygrothermal performance of building envelopes. The theoretical reliability of IRT lies in its ability to relate surface temperature gradients to subsurface structures via passive or active methods [27]. Visualizing subsurface thermal failures that result in substantial heat loss enables the precise diagnosis of diverse defects, ranging from structural thermal bridges and air leakage to water ingress and interstitial condensation. Following Herschel’s early-19th-century discovery of the infrared (IR) spectrum, the technology transitioned from basic surface temperature mapping in the 1960s to today’s sophisticated Quantitative Infrared Thermography (QIRT). The process involves measuring IR radiation emitted by a surface—a parameter directly correlated with its absolute temperature—which is captured by micro-detectors and converted into pixelated thermograms in false color or grayscale. Each pixel within these thermograms is mapped to a specific temperature value, enabling the generation of precise line and area profiles. This level of granularity facilitates quantitative diagnostics of diverse thermal issues, ranging from missing insulation and structural thermal bridges to imbalanced HVAC operations [28,29]. When the internal structure of the building envelope is unknown, QIRT remains a viable option for measuring actual thermal bridging performance by correlating surface temperatures with dynamic heat transfer coefficients [30].
Earlier foundational work has established IRT as a versatile tool for building envelope diagnostics. Balaras and Argiriou [31] provided a foundational overview, identifying IRT’s potential for non-destructive assessment of moisture accumulation, air leakage, and thermal bridges. However, the accuracy of such assessments is heavily dependent on measurement conditions. This sensitivity was explored by Barreira and Freitas [32], who demonstrated the influence of emissivity, reflectivity, and wetting–drying cycles on thermographic reliability through laboratory and in situ work, while Avdelidis and Moropoulou [33] further characterized material-specific emissivity across various surface states. To bridge the gap between measured and theoretical values, integrating high-resolution thermal imaging into building energy models has been shown to drastically reduce simulation errors [34].
To overcome the inherent limitations of single-sensor inspections, researchers have increasingly integrated multimodal and thermophysical approaches into building diagnostics. For instance, Meola et al. [35] successfully combined IRT with ultrasonics and geophysics to detect structural defects in masonry specimens and applied in situ IRT to detect tile detachment, while Li et al. [36] elucidated the thermophysics of facade defects through lab-calibrated specimens and rainy-period field tests. Their findings demonstrated that moisture-laden areas exhibit lower surface temperatures due to evaporative cooling, whereas debonded patches appear as relatively warmer zones due to the increased thermal resistance of the entrapped air layers compared to sound structural regions. A recent study focusing on educational buildings in Türkiye further highlighted the thermal advantages of specific envelope materials over standard systems when evaluated through such in situ IRT and thermal simulations [37].
Advancements have also been achieved in the quantification of thermal defects. Choi et al. [38] developed a quantitative facade evaluation methodology that correlates thermal imagery with heat-flow models, validating a diagnostic index based on the temperature difference ratios between defective and intact wall sections. Complementing this quantitative approach, Ribaric et al. [39] advanced a knowledge-based system that fuses co-registered IR and visual images. By transforming these fused datasets into diagnostic histograms via a dedicated graphical user interface, their work facilitates the automated identification of facade insulation anomalies.
The focus of IRT research has recently shifted towards high-fidelity digital integration and automated analysis. Adamus and Pomada [40] demonstrated the effectiveness of field-based thermography in isolating complex thermal bridges at window-to-wall interfaces. More recently, Rojas-Colmenares [41] introduced advanced digital twin workflows that encompass photogrammetry, Building Information Modeling (BIM), and thermography for comprehensive energy assessments. In parallel, integrating BIM, IRT, and heat flux sensors offers a practical framework for high-accuracy energy modeling even under real-world data scarcity [42]. The integration of Artificial Intelligence (AI) has also become a frontier; Abdulridha et al. [43] highlighted the effectiveness of convolutional neural networks in automating the detection of thermal anomalies. Beyond anomaly detection, deep learning and neural network architectures have begun to redefine building energy performance modeling, offering superior predictive power in processing complex, non-linear environmental datasets [44,45]. Consequently, recent research is increasingly pivoting toward hybrid optimization frameworks that integrate the transparency of classical deterministic and heuristic approaches with the high-speed predictive capabilities of deep learning to overcome the computational complexity of building performance simulations [46,47,48].
Furthermore, the role of multi-objective optimization has evolved; Wang et al. [49] highlighted how energy consumption prediction methods can be coupled with diagnostic data to optimize envelope retrofits under varying climatic conditions. To achieve long-term resilience, researchers now utilize advanced algorithms to identify optimal envelope configurations that balance immediate energy savings with climate considerations [11,50].
Despite these advancements, a significant methodological fragmentation remains in the literature; most research focuses either on qualitative defect detection or isolated, theoretically driven simulation models. A critical gap persists in the seamless integration of in situ QIRT as the direct empirical engine for multi-objective optimization—particularly for existing residential stock, where the discrepancy between as-built conditions and design specifications is most pronounced. Decision support tools are essential for aligning sustainability goals with technical outcomes throughout this process, particularly in building diagnosis and performance estimation [51]. This demand for efficiency necessitates a synergy where field-based diagnostics inform, rather than just follow, simulation-based analyses. Recent systematic reviews by Shan and Junghans [52] indicate that approximately 88% of building performance optimization studies focus on residential and office sectors, emphasizing the critical role of evolutionary algorithms in resolving these trade-offs between demand, cost, and comfort.
Among various optimization techniques, metaheuristic algorithms—specifically GA—have historically served as the benchmark for their global search capabilities in simulation-based environments [15,52]. While the integration of GAs with platforms like EnergyPlus was the dominant strategy for over two decades [53], the contemporary landscape of the field is undergoing a significant transition. Recent research increasingly favors deep learning architectures and data-driven surrogate models to handle high-dimensional datasets and reduce computational costs. However, metaheuristic approaches remain a reliable and physically interpretable choice for retrofit scenarios where empirical transparency is paramount. Addressing these methodological shifts, Asadi et al. [54] demonstrated that hybrid models combining Artificial Neural Networks (ANN) with GAs can effectively bridge the gap between predictive speed and optimization accuracy. Furthermore, Al-Saadi and Al-Jabri [55] emphasized that comparing these cost-optimal designs with regional building codes remains essential for determining the practical efficacy of insulation and glazing types.
This study introduces an integrative framework aimed at narrowing the ‘performance gap’ by calibrating BES models with empirical QIRT-derived thermal transmittance (UINSITU) and Temperature Indices (TI). The research objective is twofold. First, non-destructive diagnostic inspections were conducted using QIRT to assess the in situ performance of uninsulated walls, identifying systemic thermal failures and quantifying the discrepancy between theoretical and as-built thermal resistance. Second, these empirical findings were utilized to establish a more representative baseline for the BES model, ensuring that the subsequent optimization reflects the physical characteristics of the existing envelope.
Under this framework, 192 retrofit scenarios—comprising twelve insulation thicknesses and sixteen glazing types—were analyzed for a multi-story residential building in Istanbul, a case representative of the uninsulated post-1999 seismic building stock. Unlike studies relying on idealized ‘as-designed’ parameters, this hybrid approach offers a technically grounded methodology for retrofitting. By evaluating 30-year global costs alongside energy savings, the framework provides a structured roadmap for energy efficiency. This type of decision support can be particularly relevant in volatile economic landscapes, where inflation and fluctuating energy prices necessitate more risk-aware investment strategies, offering a potential template for building stocks with similar climatic and structural profiles.

2. Materials and Methods

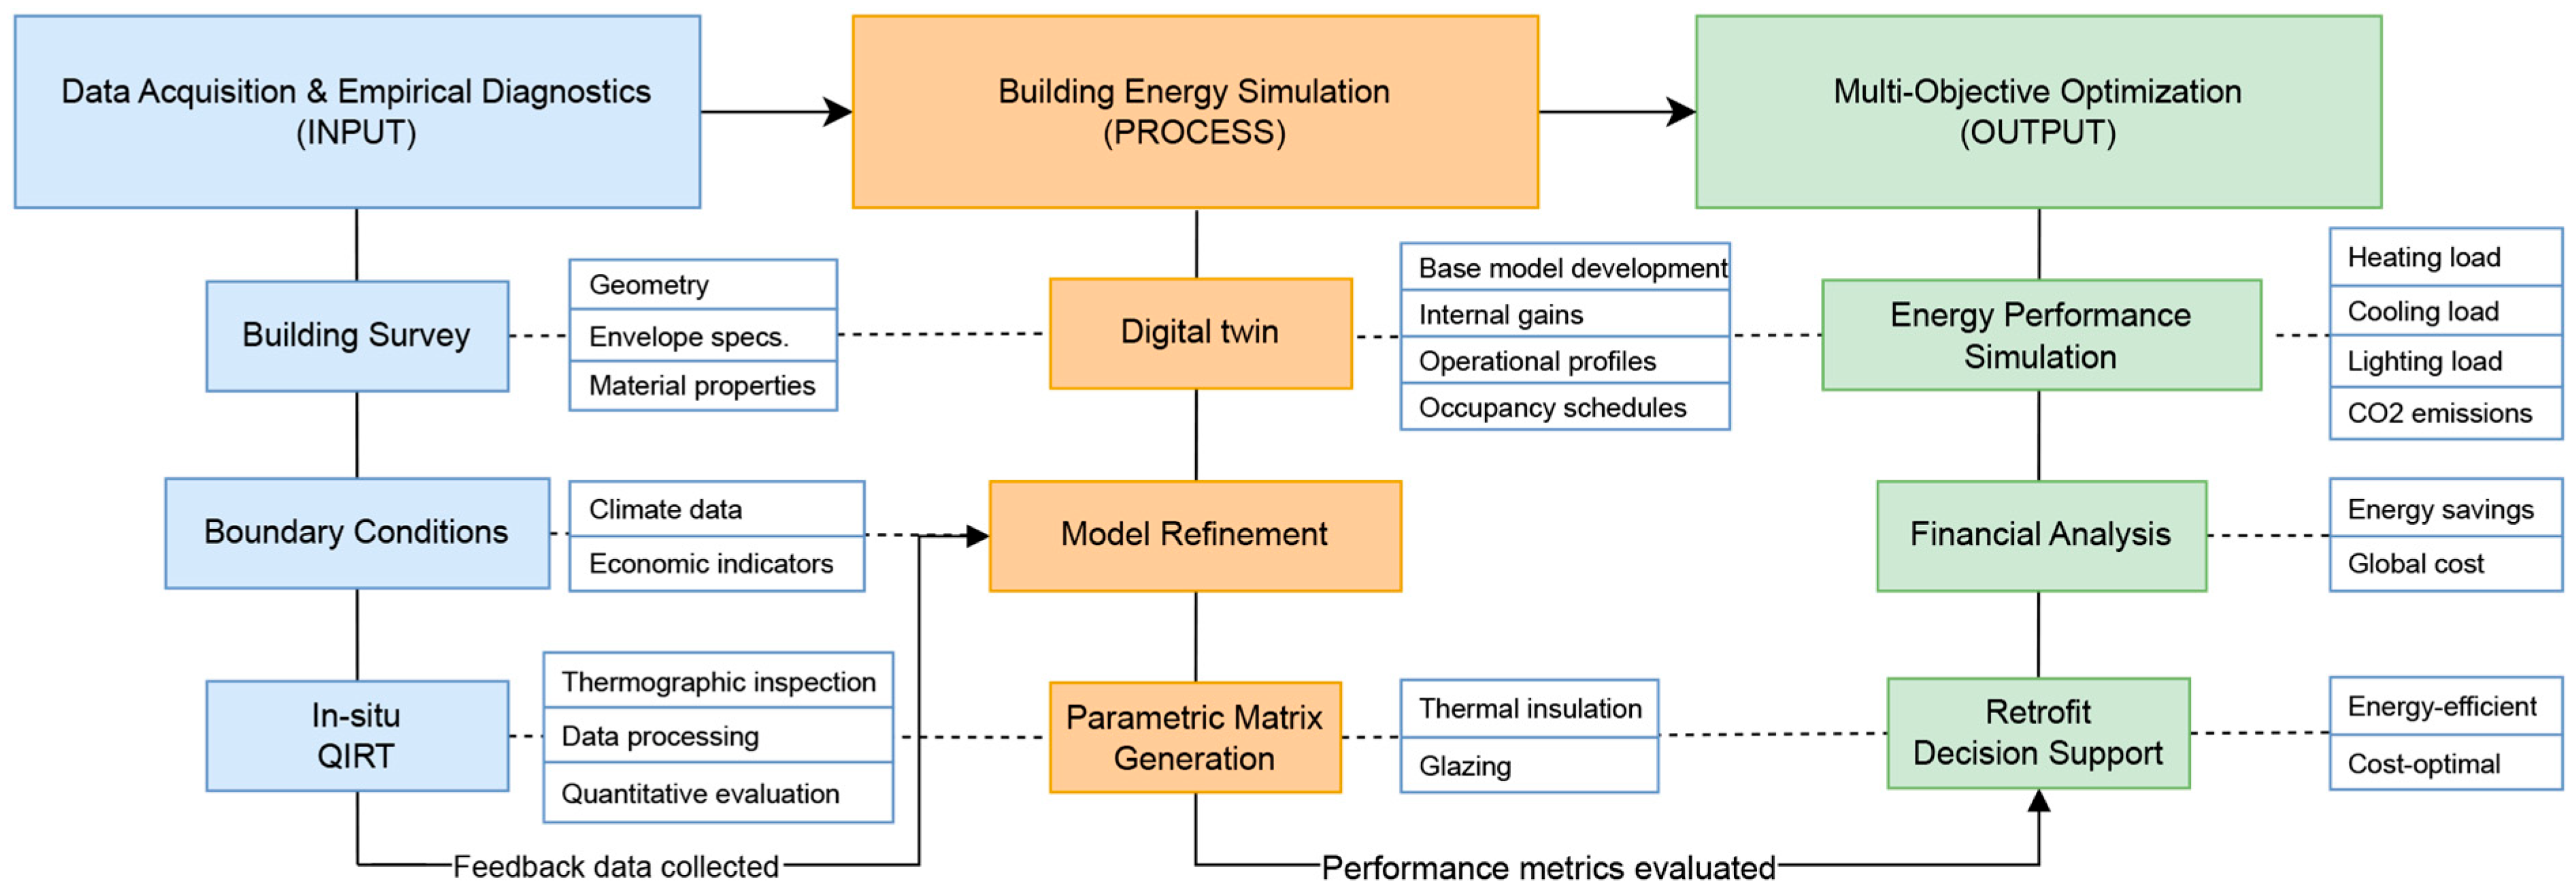
The methodological framework of this study integrates non-destructive diagnostics with simulation-based optimization to evaluate building retrofit strategies. To maintain methodological rigor, this BES-based framework utilizes the DesignBuilder v7.0 interface (DesignBuilder Software Ltd., Stroud, UK) to facilitate the EnergyPlus v9.4 dynamic simulation engine (U.S. Department of Energy, Washington, DC, USA), enabling a robust evaluation of transient thermal performance. As illustrated in Figure 1, the research focuses on combining in situ QIRT with a dynamic BES environment. The workflow provides an overview of this integrated approach, detailing the data acquisition, processing, and multi-objective optimization stages.
The proposed framework utilizes a feedback loop where field-based empirical data refines the building energy model (digital twin), ensuring a high-fidelity baseline. This refined model enables the evaluation of retrofit combinations—focusing on external wall insulation and glazing upgrades—to identify energy-efficient and cost-optimal pathways for the residential case study.

2.1. Residential Retrofit Case Study

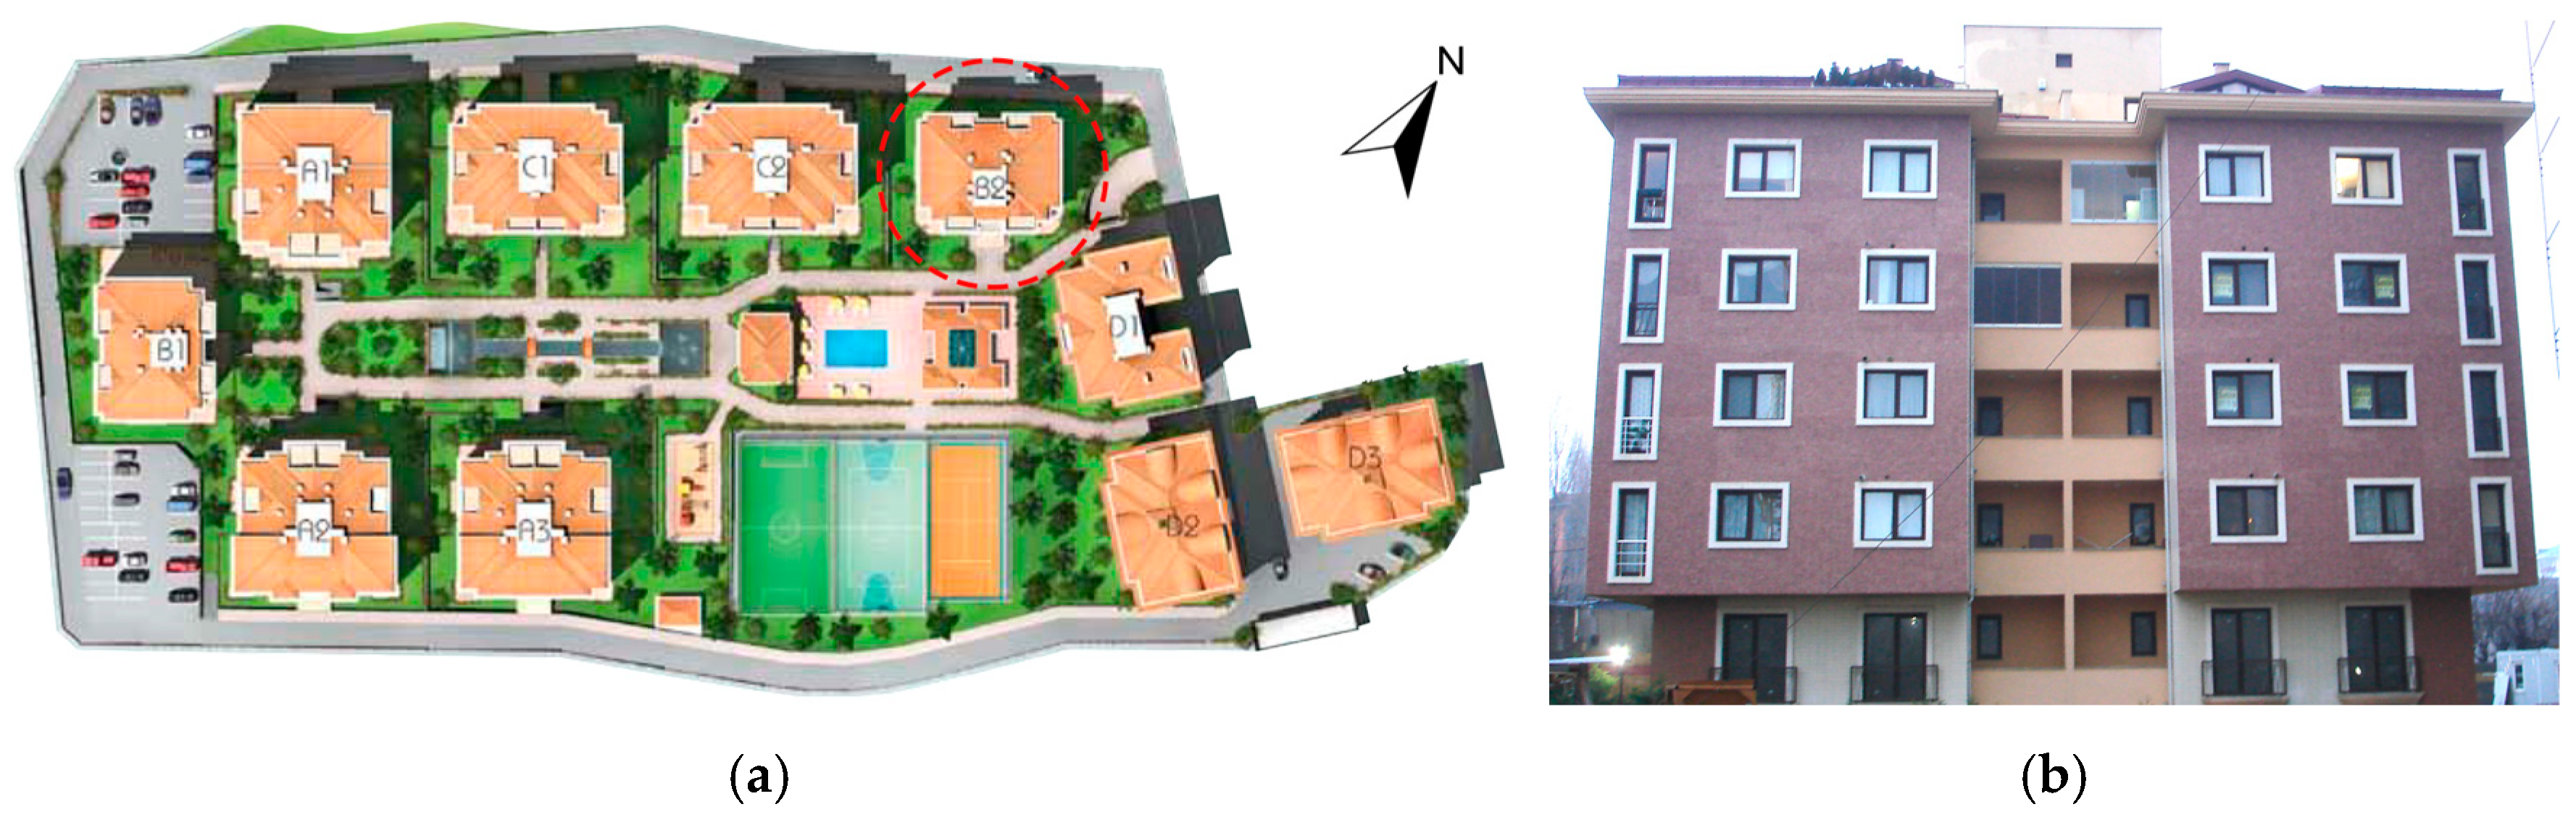
The selected case study represents a typical mid-2000s residential development in Istanbul, which is designated as a 3rd climatic zone under the national TS 825 thermal insulation standard [6] and characterized by a transitional climate (specifically influenced by both Mediterranean and Humid Subtropical characteristics in the Köppen–Geiger Csa/Cfa classification) [56]. To establish a representative digital twin as outlined in the methodological framework (Figure 1), the architectural geometry and material thermophysical properties were surveyed as primary inputs. The reinforced concrete (RC) complex comprises ten apartment blocks completed in 2007. Reflecting the post-1999 Marmara earthquake construction standards, the buildings were designed in compliance with the 2005 Earthquake Regulations, utilizing a raft-general foundation system [57]. The case building is a six-story block consisting of a basement, a ground floor, and five upper floors. Each floor contains two independent flats (approx. 165 m2 each), featuring four bedrooms and a living room. Despite being equipped with acoustic insulation for internal floors, the building’s envelope represents the era’s standard uninsulated RC characteristics. In terms of building systems, each dwelling is naturally ventilated and equipped with an individual gas boiler and split air-conditioning units, operated according to occupants’ thermal comfort preferences. The case building was selected primarily due to the significant thermal abnormalities detected during preliminary inspections. The spatial layout and the current state of the building are illustrated in Figure 2, which presents the site plan of the residential complex (Figure 2a) and the south-east façade of the investigated block (Figure 2b).
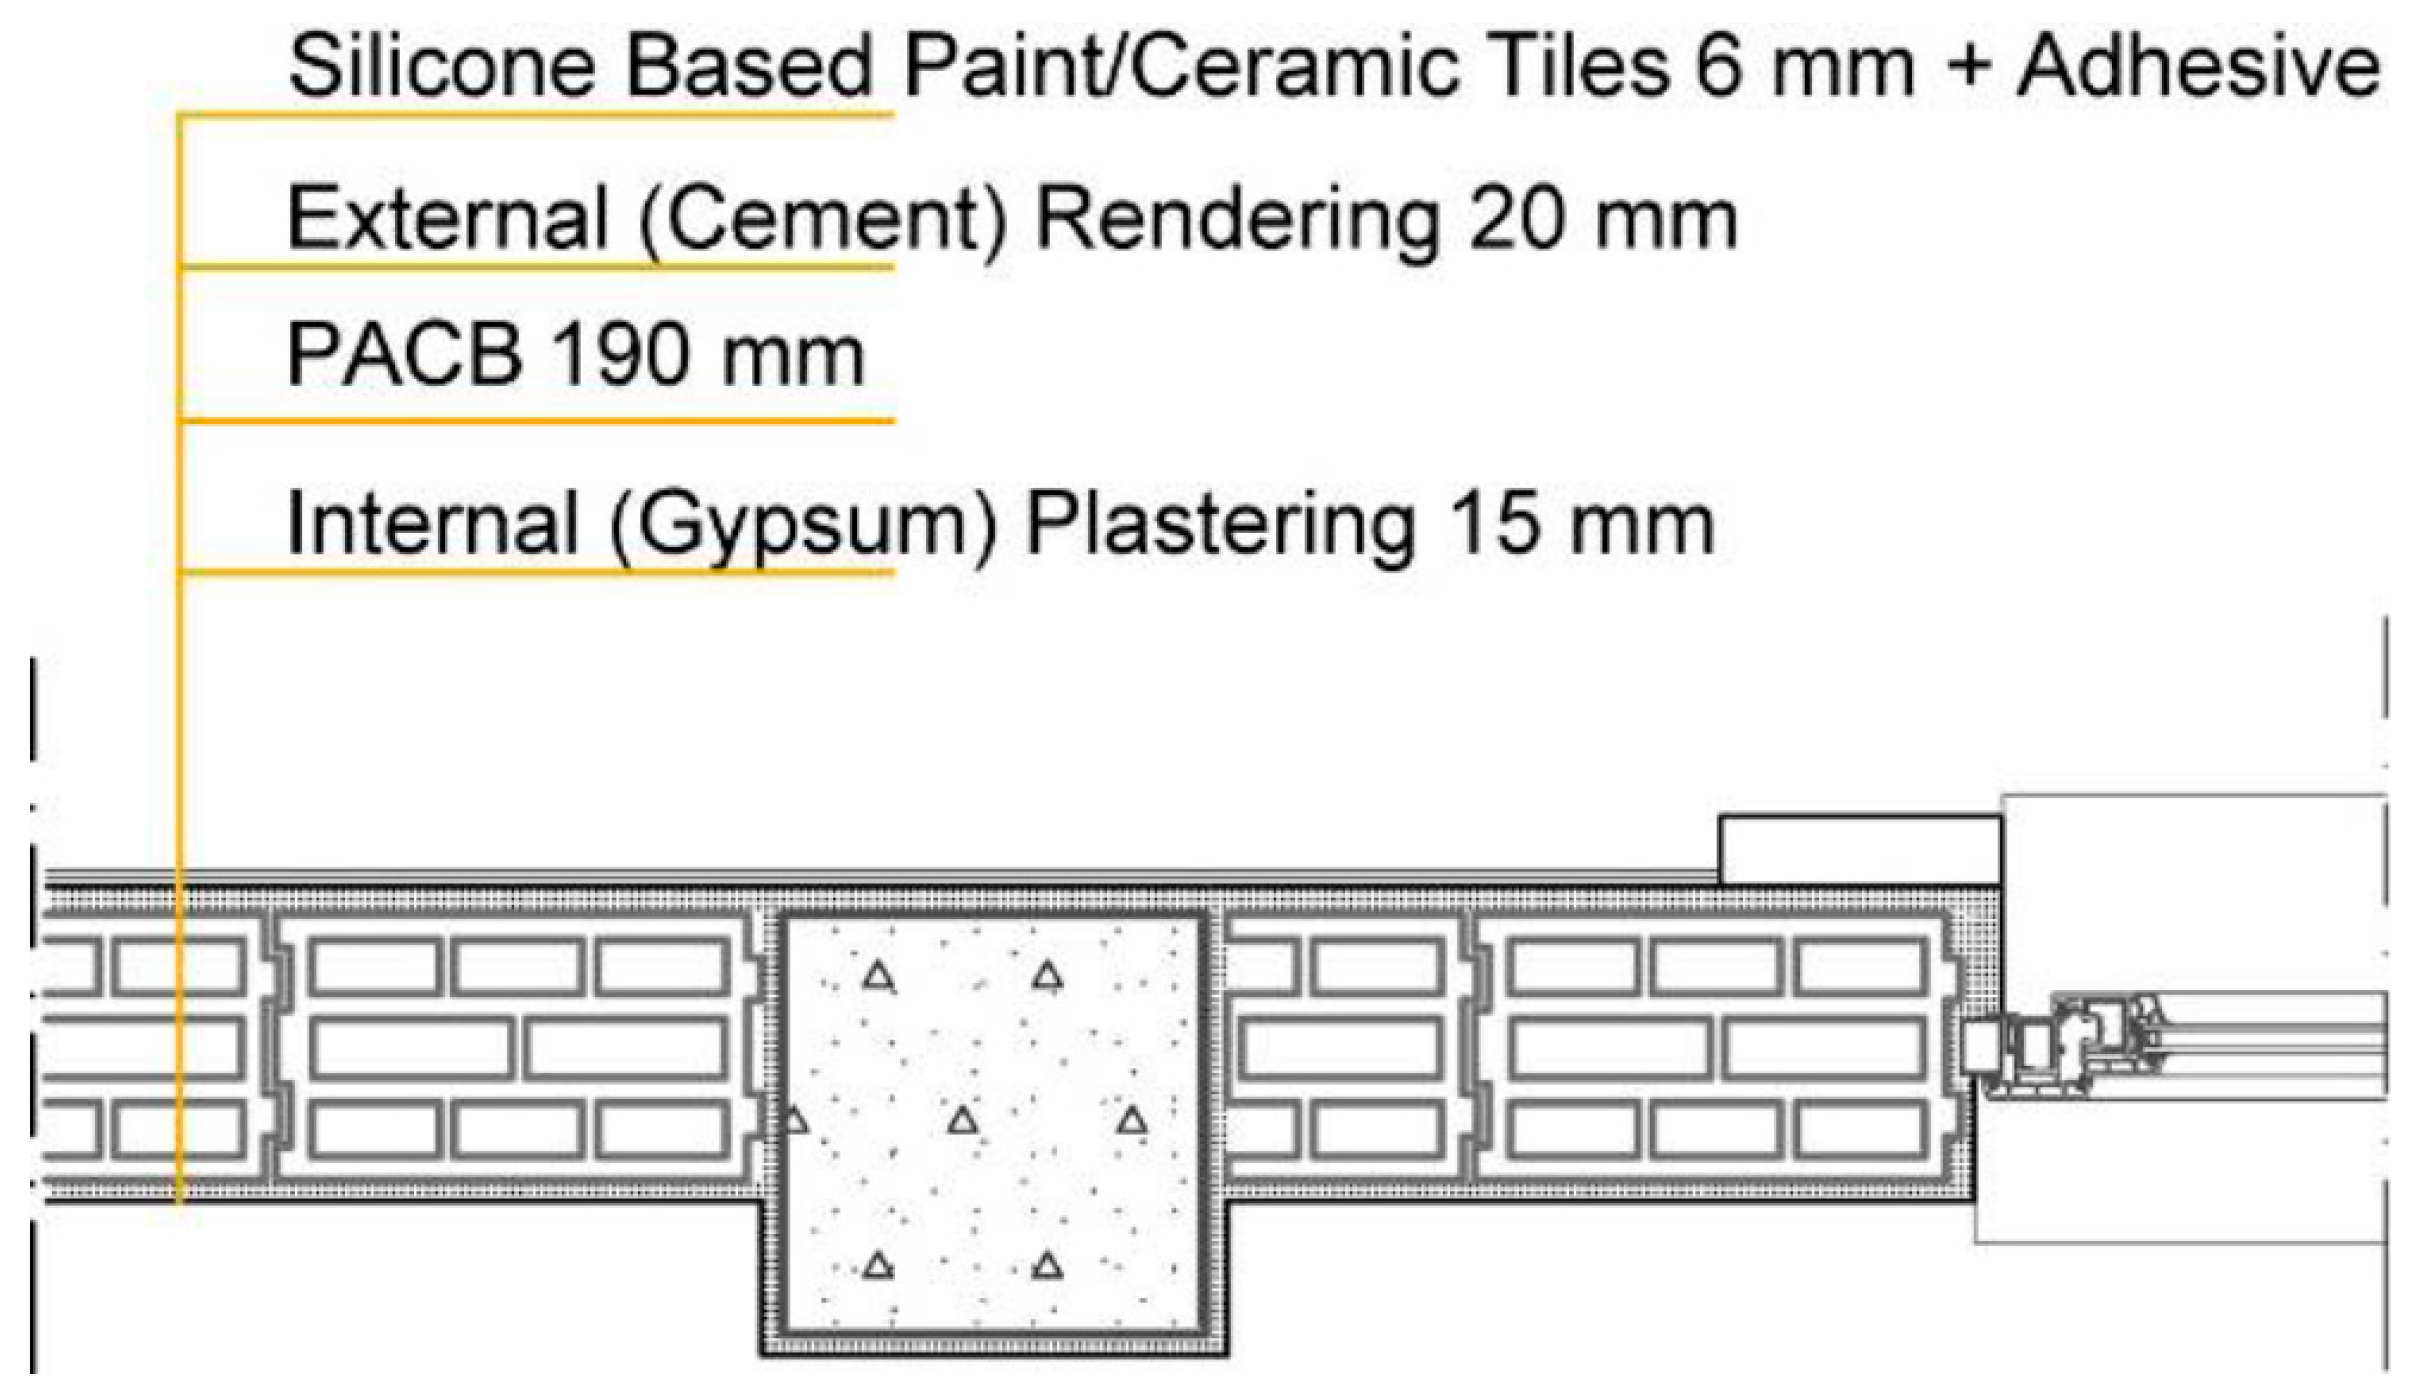
The external infill walls were constructed using locally produced pumice aggregate concrete blocks (PACBs). These 19 cm-thick blocks feature tongue-and-groove edges and three rows of hollows, bonded with approximately 15 mm of cement bedding mortar. The interior is finished with a gypsum-based plaster, while the exterior features a cement-based render with either a silicone-based paint or ceramic tiles as the final coating. No thermal insulation was applied to either the infill walls or the RC elements. As shown in the plan detail in Figure 3, the interface between the masonry infill, the RC structural frame, and the fenestration was specifically examined, as these junctions represent the primary locations for potential thermal bridges.
The theoretical performance of the building elements is determined using standard heat-transfer calculations, with thermal conductivity values (λ) assigned to each material layer in accordance with TS 825 [5,6], TS EN 1745 [58], and TS EN ISO 6946 [59]. Table 2 presents the cross-sections of the PACB infill and the RC structural elements of the reference building. It also presents theoretical thermal transmittance (UCALC) derived from Formula 1, in accordance with the thermal insulation requirements for buildings [5,60].
U C A L C = 1 R s i + d i λ i + R s e
where
  • Rsi and Rse are heat transfer coefficients of the internal and external surfaces, respectively (W/(m2·K));
  • d is the thickness of each material layer (m);
  • λ is the thermal conductivity of each layer (W/(m·K)).

Table 2. UCALC of external wall configurations according to the data provided in TS 825 standard [5].
Building ElementsTS 825 Standard Code and DefinitionMaterial
Thickness
d (m)
Thermal
Conductivity
λ (W/(m·K))
Thermal
Resistance
R((m2·K)/W)
Thermal
Transmittance
UCALC (W/(m2·K))
Energies 19 01727 i001Rsi: Surface heat transfer coefficient 0.13
4.4: Gypsum plastering0.0150.510.03
7.4.5.6: Pumice aggregate concrete blocks0.190.210.9
4.2: Cement rendering0.021.60.01
Silicon-based paint----
Rse: Surface heat transfer coefficient 0.04
Non-insulated cavity wall (Total) 1.110.896
Energies 19 01727 i002Rsi: Surface heat transfer coefficient 0.13
4.4: Gypsum plastering0.0150.510.03
5.1.1: Reinforced concrete0.252.50.1
4.2: Cement rendering0.021.60.01
Silicon-based paint----
Rse: Surface heat transfer coefficient 0.04
Non-insulated load-bearing wall (Total) 0.313.206
As presented in Table 2, the thermal transmittance of non-insulated RC elements is nearly four times higher than that of non-insulated PACB walls. Furthermore, all UCALC values significantly exceed the 0.40 W/(m2·K) threshold—the thermal transmittance limit for energy-efficient wall components in the 3rd climatic zone according to the updated TS 825 standard [6].

2.2. IR Thermography Analysis

Interpreting building thermography is highly sensitive to three factor groups: building characteristics (surface emissivity, absorptance, moisture content, roughness), environmental conditions (indoor–outdoor temperature/pressure differences, solar radiation, wind, precipitation, relative humidity), and equipment setup (camera resolution, viewing angle, distance, acquisition settings). Surface contamination and wetting can alter apparent emissivity, while sun-exposed façades store heat that dissipates over time based on thermal mass and temperature gradients (ΔT), potentially masking defects. To minimize transient and reflective effects, surveys are ideally conducted at night or under heavy overcast conditions with a sufficient indoor–outdoor temperature difference, away from extraneous heat sources. This is critical because rain can distort readings through evaporative cooling, while moisture accumulation increases material thermal conductivity, which may artificially amplify anomalies under starker temperature gradients or with induced pressure differences [11,12,31].
The case study building’s envelope underwent in situ examinations from both the interior and exterior. Surface temperatures of exterior wall components and junctions were recorded using a FLIR ThermoCAM E65 IR camera (FLIR Systems, Wilsonville, OR, USA) [61]. Simultaneously, microclimatic variables—indoor/outdoor dry-bulb temperature, relative humidity, and near-surface wind speed—were measured using handheld digital instruments (thermometer, hygrometer, and anemometer). Camera-to-target distances were verified with a laser meter, and thermal images were captured from multiple angles using a constant surface emissivity for all scans.
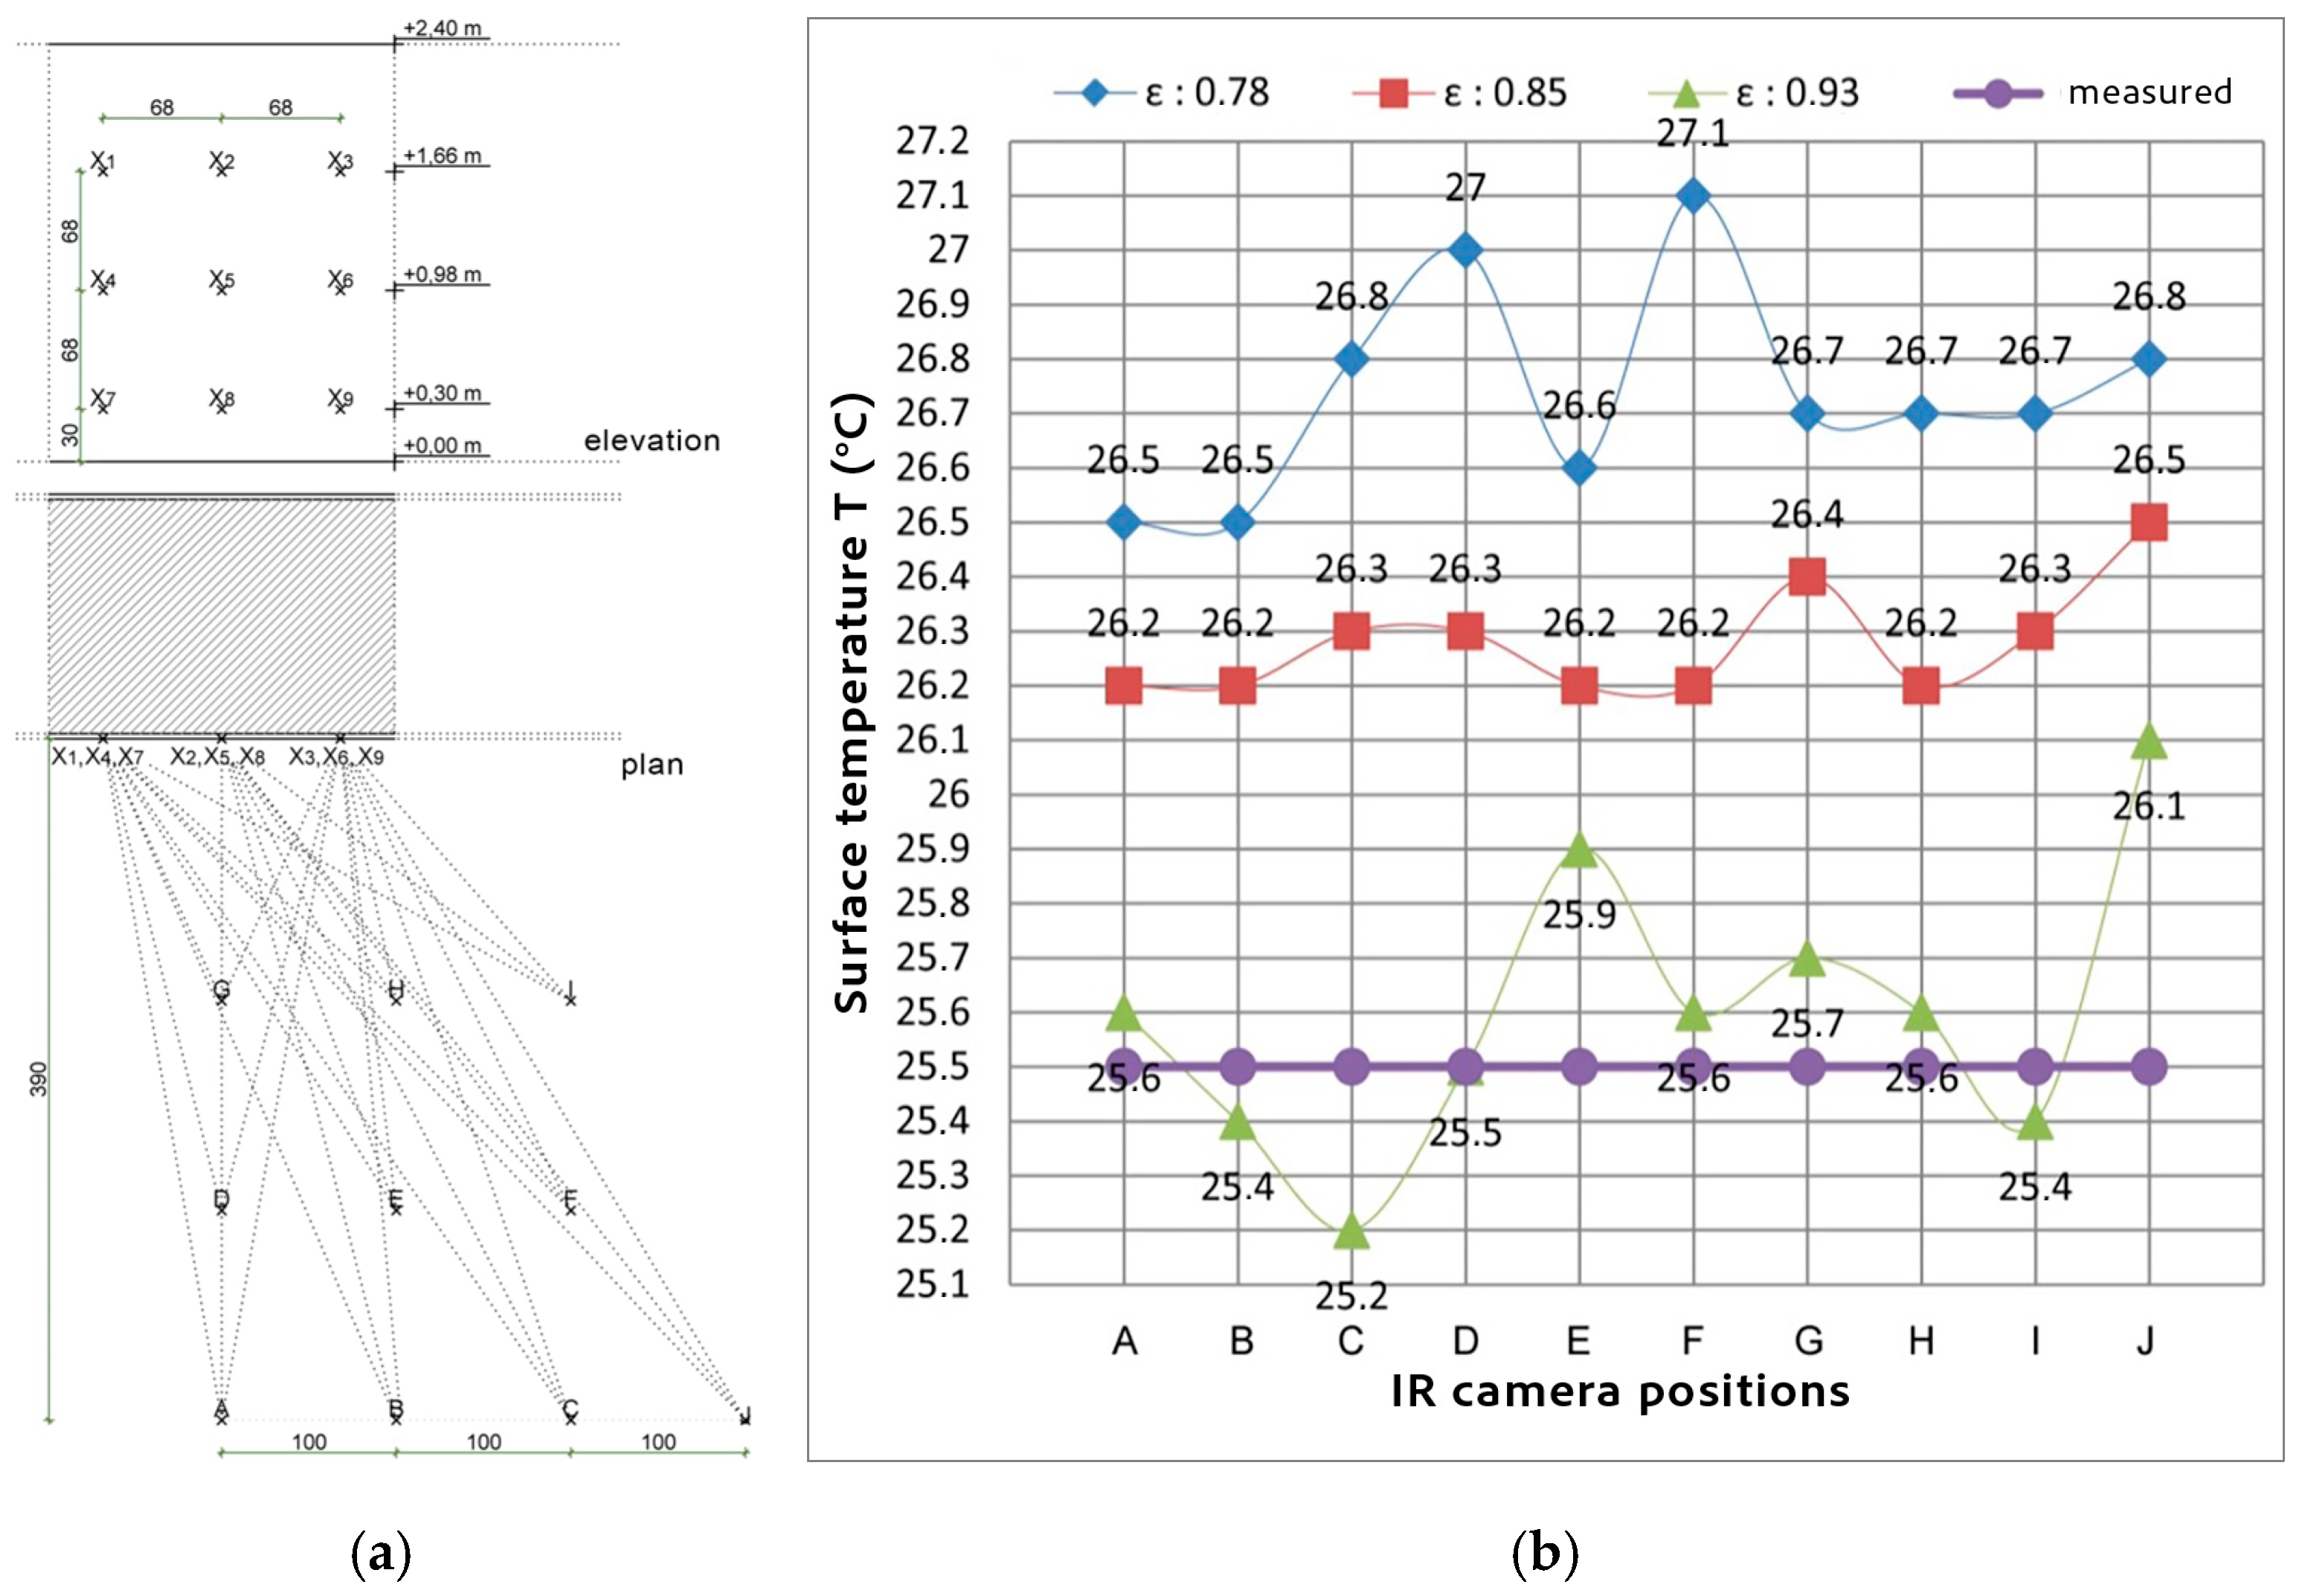
To ensure the reliability of these measurements, a preliminary calibration procedure was conducted under controlled indoor conditions (Tin: 25.3 °C, RHin: 21%, vin < 0.1 m/s) prior to the field data collection. The experimental setup for this procedure, including the layout of nine measurement locations (X1–X9) on the interior wall surface and ten designated camera positions (A–J) on the ground plane, is illustrated in Figure 4a.
This process involved assessing the sensitivity of the IR camera to key parameters—viewing angle (25–90°), distance (1.5–5.3 m), and surface emissivity (ε = 0.78–0.93)—using a solid 140 cm thick masonry wall with plaster finish as a reference. As shown in Figure 4b, the comparative analysis of these settings confirmed that an emissivity value of ε = 0.93 provided the highest accuracy, aligning most closely with reference temperatures obtained from thermocouples. During the calibration and subsequent field measurements, a thermal stability criterion of less than ±0.1 °C was maintained to minimize transient errors. While variations in viewing angle and distance caused a minor average deviation of ±0.2 °C, the recorded maximum deviation remained within 0.6 °C, which is consistent with standard IRT guidelines for building diagnostics [62].
The measurement conditions were aligned with ISO 9869-1:2014 [60] ensuring a stable temperature gradient. To minimize experimental uncertainty, periods with consistent temperature differentials were prioritized. Specifically, IR measurements were conducted during the winter season under near-steady-state conditions—early morning or after sunset—to eliminate the influence of direct solar radiation and precipitation. A minimum indoor–outdoor temperature difference of 5 °C was maintained throughout the data collection. Thermograms were evaluated alongside floor plans, photographs, and supporting measurements to identify thermal anomalies. Detailed IR camera specifications are provided in Table 3 [61].
The actual thermal performance of the bulding envelope was determined using temperature data obtained via IRT. Based on the equations provided below (Equations (2)–(4)), in situ measurements were conducted on both internal and external surfaces to derive the thermal transmittance values (UINSITU, W/(m2·K)) and temperature indices (TI, unitless) for the non-insulated PACB infill and RC structural elements. Following the methodology proposed by Fokaides and Kalogirou [63], internal surface measurements were used to establish a baseline, while the external heat balance—incorporating radiative and convective heat transfer—was calculated according to the refined models by Albatici and Tonelli [64] and Albatici et al. [65]. These in situ results were subsequently compared with the theoretically calculated values (UCALC, W/(m2·K)) to evaluate the deviation between design-based assumptions and real-world performance.
U I N S I T U =   R s i × T i n T s i T i n T o u t
U I N S I T U = 5.67   × ε × T s o 100 4 T o u t 100 4 + 3.8054 × v × T s o T o u t T i n T o u t
T I = T i n T s o T i n T o u t  
where
  • 5.67 is the constant derived from Stefan–Boltzmann constant (σ = 5.67 × 10 8   W / m 2 K 4 ) ;
  • ε is the thermal emissivity of the surface (unitless), assumed to be 0.93 based on material characteristics;
  • Tsi and Tso represent the in situ internal and external surface temperatures (K), respectively;
  • Tin and Tout are the indoor and outdoor ambient temperatures (K);
  • v denotes the local wind velocity (m/s).

2.3. BES-Based Energy Optimization Analysis

The BES-based optimization analysis aims to minimize the reference building’s primary energy consumption and identify cost-optimal energy-efficiency levels tailored for the local climatic conditions of Istanbul. The core performance metrics include fluctuations in heating, cooling, and lighting energy use, alongside total annual primary energy consumption, operational carbon emissions, and global costs. To evaluate these parameters, a dynamic BES approach was employed, allowing for a high-fidelity comparison between the baseline and various retrofit scenarios.
The building energy model was developed using DesignBuilder v7.0, utilizing the EnergyPlus v9.4 engine for detailed dynamic simulations. To ensure environmental accuracy, the analysis integrates Typical Meteorological Year extended (TMYx) data via an Istanbul EPW (EnergyPlus Weather) file, spanning records from 2009 to 2023 [66]. This dataset provides a representative profile of the region’s Mediterranean climate, characterized by specific monthly variations in dry-bulb temperature, relative humidity, and solar radiation.
To ensure the simulation accurately reflects real-world performance, the BES model incorporates operational schedules and occupancy patterns derived from face-to-face interviews with the residents, along with realistic efficiency rates and the building’s actual geometrical dimensions, including window-to-wall ratios (WWR). Key parameters—such as thermal setpoints for indoor environmental quality, HVAC and lighting system operating hours, efficiency and occupant-driven load profiles—are integrated to enhance the model’s reliability. The boundary conditions and specific parameter settings used for the reference scenario are summarized in Table 4.
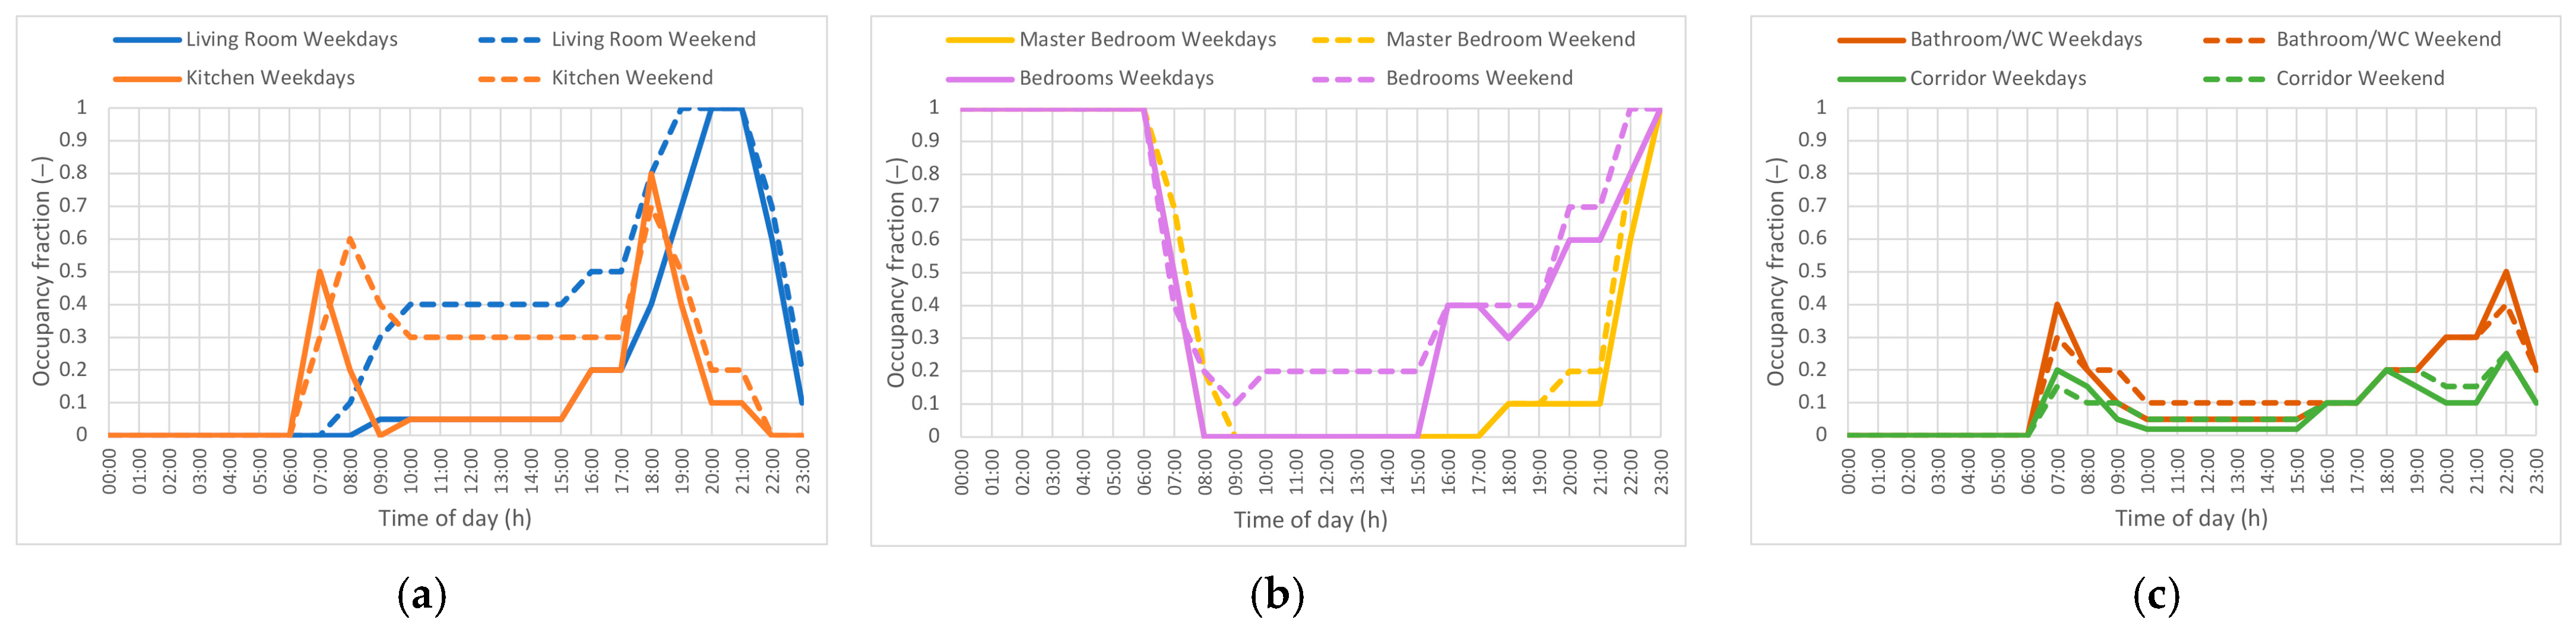
The simulation follows specific temporal patterns to represent typical residential behavior. During the heating season, combi boilers scheduled to operate daily from 06:00 to 00:00, governed by indoor operative temperature setpoints. Conversely, the cooling schedules for multi-split air conditioners and the lighting system (active between 07:00 and 00:00) are dynamically adjusted based on room occupancy. As illustrated in Figure 5, the occupancy model utilizes a normalized hourly fraction to dictate both the internal heat gains and the operational frequency of the HVAC and lighting systems. This approach ensures that energy consumption is linked to real-time room usage across weekdays and weekends through a normalized occupancy fraction; where a value of 1 represents full-hour occupancy, 0.5 indicates a half-hour duration, and 0 denotes an unoccupied state. This temporal data ensures that the BES model accurately captures the stochastic nature of internal heat gains and energy demand.
Following the establishment of the reference energy profile, various retrofit measures were examined through multi-objective optimization. Two key envelope variables—insulation thickness and glazing types—were assessed, comprising 28 discrete options. Through the application of these variables across different thermal zones, a total of 192 unique design combinations were generated.
To identify Pareto-optimal solutions, a GA within DesignBuilder v7.0 was employed to estimate the balance between Life-Cycle Cost (LCC)—consistent with the Global Cost methodology—and annual final energy consumption (electricity and natural gas). As an unconstrained optimization problem, the search space was limited to the predefined physical and technical range of the insulation and available glazing specifications. The optimization process was conducted over a full annual cycle (8760 h), utilizing an initial population of 20, a convergence threshold of 10, and a maximum limit of 100 generations to explore the solution space. The GA helped navigate these combinations to highlight configurations that offer a practical balance between initial capital expenditures (CAPEX) and long-term operational expenditures (OPEX).
End-use energy data derived from the optimization results were subsequently converted into primary energy consumption and operational carbon emissions. This conversion utilized national factors: 1.0 for natural gas and 1.677 for electricity, while operational emissions were quantified using 0.234 kgCO2-eq/kWh for natural gas and 0.478 kgCO2-eq/kWh for electricity, in accordance with benchmarks from the Turkish Republic Ministry of Environment, Urbanization, and Climate Change [69]. These data were processed and visualized to derive final performance metrics and comparative analytical charts.

2.3.1. Retrofit Scenarios and Design Variables

To identify the most effective strategies for reducing energy consumption and global costs, a series of retrofit scenarios were defined based on the most impactful envelope components. The optimization framework evaluates a total of 192 design combinations, systematically generated from 28 discrete options involving external wall insulation and glazing systems. These scenarios aim to explore the trade-offs between initial investment costs and long-term energy savings, ultimately determining the cost-optimal configurations for the 3rd climatic zone in TS 825 [6]. The specific technical properties and variations in these design parameters are detailed in the following sub-sections.

2.3.2. External Wall Insulation Scenarios

Various insulation materials and thicknesses were simulated to evaluate their impact on reducing transmission heat losses through the building envelope. Table 5 details the insulation configurations applied to external cavity walls, including their thermophysical properties and associated unit prices used in the cost–benefit analysis. To systematically improve the thermal performance beyond the regulatory limit (Uwall = 0.4 W/(m2·K)) established for the 3rd climatic zone in the updated national insulation standard [6], solid-wall assemblies were analyzed by including various insulation materials such as Expanded Polystyrene (EPS), Extruded Polystyrene (XPS), and stone wool, along with their respective thicknesses (6 to 12 cm).
The initial investment costs —comprising material, labor, transportation, and applicable taxes—were sourced from the Construction and Installation Unit Prices published by the Ministry of Environment, Urbanization, and Climate Change [70], supplemented by current local market surveys. The service life expectancy of the insulation materials and glazing systems were determined in accordance with the ISO 15686-1 standard [71] to ensure accuracy in the long-term life-cycle cost analysis.

2.3.3. Glazing and Window System Scenarios

Variations in glazing systems were analyzed to evaluate their potential in balancing heating, cooling, and lighting energy demands while optimizing the global costs. Sixteen double-pane glazing configurations were developed by combining key design parameters: glazing types (low-e, solar low-e, and temperable solar low-e), pane thicknesses (4 mm or 6 mm), gap widths (12 mm or 16 mm), and cavity fillings (air or argon). For each configuration, critical thermo-physical and optical properties—specifically visible transmittance (Tvis), solar heat gain coefficient (SHGC), and thermal transmittance (U-value)—were integrated into the model. These scenarios were established based on the certified product catalogs of a prominent national glass manufacturer in Türkiye [68]. The technical specifications of the glazing retrofit options are summarized in Table 6.

2.4. Global Cost Analysis

The economic viability of the reference building and the proposed retrofit solutions is evaluated through a global cost analysis, conducted in accordance with the EN 15459-1 standard [72]. Given that the reference building is currently 20 years old and has an estimated total service life of 50 years, a 30-year calculation period is adopted, with 2025 established as the base year. The global cost incorporates the initial investment, annual running costs, replacement costs, and residual value, is calculated using Equation (5):
C g ( τ ) =   C i n v + [ ( C y ( τ ) + C r ( τ ) )   V f ,   τ ( j ) ]
where
  • Cg (τ) represents the global cost,
  • Cinv represents initial investment costs,
  • Cy (τ) denotes the yearly running costs (including energy and maintenance),
  • Cr (τ) signifies replacement costs for components with shorter life cycles, and
  • Vf,τ (j) represents the residual value for the combination of measures j at the end of the calculation period (τ).
The financial calculations account for the time value of money by discounting future expenditures to their present value, considering January 2025 as the reference starting point (Year 0) for all projections. Based on the Federal Reserve Economic Data (FRED) and Central Bank of the Republic of Türkiye (CBRT) statistics spanning 2016–2025 [73,74,75,76], the model utilizes the average annual inflation rate (Ri) and market interest rate (R) to derive the nominal discount rate (RATdisc), ensuring the financial model accounts for the specific macroeconomic volatility of the region. The negative real interest rate reflects the high-inflation environment where the annual consumer price increase outpaces market interest rates.
To ensure international comparability and mitigate the impact of domestic inflation, all financial metrics, including initial investment costs (CInv), were calculated based on January 2025 prices in Turkish Lira (TRY) and subsequently converted to United States Dollars (USD) [77]. Annual energy costs were computed by multiplying these base year unit prices [78,79] by the corresponding end-use energy values obtained from the simulations.
A specialized discounting approach was adopted to integrate energy-specific escalation rates for electricity (ee) and natural gas (eg). These rates were derived separately because residential energy price trends over the last decade have diverged from general consumer price inflation. To reflect this divergence, historical price trends from the Energy Market Regulatory Authority (EMRA) [78] and the regional natural gas distributor (İGDAŞ) [79] were cross-referenced with inflation data from the CBRT [74]. Consequently, future energy expenditures were projected using these escalation factors before being discounted to their present value. Following the EN 15459-1 standard [72], the set of economic indicators, rates and unit prices utilized in the global cost analysis is summarized in Table 7.

3. Results and Discussion

3.1. IRT Assessment of Building Envelope

To assess the hygrothermal performance of the building envelope, a series of thermographic inspections was conducted using a holistic approach, progressing from the component to the façade scale. Periodic measurements were recorded across several apartment blocks within the same residential complex to derive thermal values, utilizing internal surface temperatures for indoor calculations and external parameters for outdoor assessments. However, this paper specifically focuses on the external envelope conditions of the thermally most critical apartment in Block B, which features a cantilevered first-floor configuration exposed to outdoor conditions from both the walls and the floor. The external wall system—comprising infill masonry (units, mortar, and surface finish), the RC structural frame (columns, beams, shear walls, and floor slabs), and window assemblies (frames, casements, glazing, sills, and sealants)—was analyzed systematically. Inspection points and critical junctions were documented and schematically illustrated on the floor plans and elevations in Table 8. These inspection points (1–8) correspond directly to the measurement data presented in Table 9, with building components categorized according to defect categories (I–III) defined in Table 8.
The in situ thermal monitoring revealed thermal inefficiencies within the external envelope and identified problem zones of elevated heat loss, thereby elucidating both the spatial distribution and the probable causes of thermal abnormalities. Surface temperature data from both reference and defect areas were used to compute UINSITU and TI of the building components. The thermograms were matched with photographs from a smartphone-based photogrammetric survey, and the findings are summarized in Table 9, which provides a detailed analysis of the defect categories defined in Table 8, specifically focusing on masonry wall sections (I), RC structural frame junctions (II), and fenestration interfaces (III).
The in situ thermal analysis conducted across various building envelope sections reveals a significant divergence between standardized reference points and structural anomalies. Although the PACB fabric is designed to provide thermal resistance through its porous solid matrix and staggered hollow geometry, its field performance varies significantly. Reference wall sections (I-A) exhibited UINSITU values ranging from 1.15 to 2.71 W/(m2·K). These empirical results notably exceed the theoretical transmittance calculated for the masonry wall (UCALC = 0.896 W/(m2·K)), indicating a substantial performance gap. This discrepancy suggests that real-world thermal efficiency is diminished by factors such as, material aging, workmanship inconsistencies, and moisture content.
A primary source of this discrepancy stems from the input data used for the thermal conductivity of PACBs in relevant standards. According to TS 825 [5], theoretical calculations should utilize thermal conductivities of materials in equilibrium with 80% relative humidity. However, standards also provide dry-state thermal conductivity values, which can be misleading; utilizing dry-state data in theoretical models leads to significant underestimations of heat loss, particularly for highly porous materials that are prone to moisture absorption. Furthermore, the high thermal conductivity inherent in the cement bedding mortar and cement rendering layers likely facilitates additional heat bypass, undermining the theoretical insulative properties of the masonry units.
Thermal bridges at beam–column junctions (II-A) and floor slab edges (II-B) reached critical UINSITU levels as high as 4.55 W/(m2·K), representing a localized heat flux increase of nearly 250% compared to the reference masonry. Due to the high thermal conductivity of RC and the extensive surface area of the uninsulated exposed structural frame, a substantial decrease in thermal resistance was observed at RC components relative to the reference area (I-A) within the same thermograms. At these thermal failure zones, the increase in thermal transmittance indicates a severe compromise of the envelope’s integrity. Notably, the discrepancy between UINSITU and UCALC for RC elements was relatively lower than that of the masonry sections. This suggests that while RC components act as high-conductivity pathways for energy dissipation, their in situ performance aligns more closely with theoretical expectations for uninsulated concrete.
The thermal performance was further evaluated using the TI, which served as a primary diagnostic tool for assessing condensation risks. Experimental data indicated that several junction points fell critically below the 0.70 threshold in ISO 13788 [20], a value widely regarded as the safety limit for preventing surface mold growth. The most significant performance degradation was observed in internal measurements where surface condensation risks were high; for instance, a reference point on the PACB wall (I-A) yielded a TI as low as 0.35 with a corresponding UINSITU value of 2.71 W/(m2·K). On the other hand, the thermal performance analysis revealed a critical paradox at the PACB wall-to-wall junction (I-B): despite a deceptively high TI of 0.82, the UINSITU value reached an extreme 6.34 W/(m2·K). This discrepancy arises because the low indoor temperature (17.2 °C) mathematically inflates the TI, even though the surface temperature (12.5 °C) closely approximates the outdoor ambient conditions.
This performance failure is driven by a vicious cycle of moisture dynamics. The measured surface temperature of 9.7 °C equilibrated with the calculated dew point (9.75 °C), confirming the observed surface condensation. In this scenario, the ceramic tiles, acting as an impermeable surface finish, function as a water barrier that restricts the transmission of water vapor. This entrapment of moisture may lead not only to tile detachment through bond failure but also to deeper moisture penetration into the PACB fabric. Such saturation significantly increases the material’s thermal conductivity (λ), leading to accelerated heat loss and a further decline in surface temperatures. Consequently, the persistent moisture accumulation and rising damp result in a fundamental failure of the building envelope, severely compromising both energy efficiency and occupant comfort. Such a low TI signifies that the internal surface temperature (Tsi) is almost equivalent to the outdoor ambient conditions (Tout), creating a high probability of interstitial condensation and long-term microbiological degradation of the building fabric.
Furthermore, the thermographic evidence identified distinct patterns of warm air leakage (III-A and III-B) that compound the overall energy inefficiency of the envelope. In these zones, the synergy between convective heat loss and conductive thermal bridging led to a precipitous drop in internal surface temperatures, exemplified by a Tsi of only 10.4 °C despite an indoor temperature of 18.2 °C. These anomalies, typically resulting from defective joinery seals or poor integration between the window/door frames and the masonry, necessitate a more comprehensive retrofit strategy than standard insulation upgrades alone. The findings suggest that improving the energy rating of existing buildings requires not only the application of thermal insulation but also a rigorous focus on airtightness and the mitigation of geometric thermal bridges at the design and construction stages.
A critical performance gap was identified when comparing the building’s current state to national benchmarks. All analyzed wall types exhibit UINSITU values that significantly exceed the 0.60 W/(m2·K) threshold defined for energy-efficient wall components in TS 825 [5], and fall even further behind the more stringent 0.40 W/(m2·K) limit introduced in the revised TS T825 standard [6] for the 3rd climatic zone. This finding, further corroborated by UCALC values, highlights a non-compliance with modern energy regulations.
Consequently, even exterior wall surfaces that do not exhibit specific structural failures maintain temperatures notably higher than the ambient outdoor environment, signaling continuous heat dissipation from the interior. These IRT findings visually and numerically confirm that the current thermal resistance of the building envelope is insufficient to comply with local climatic requirements, updated national BEP regulations [8], and current thermal insulation standards [6].
To address these systemic deficiencies, it is necessary to evaluate the impact of holistic retrofit strategies. Accordingly, the following section explores BES-based optimization scenarios, focusing on the integration of continuous external thermal insulation and high-performance glazing improvements to restore the building’s thermal integrity and reduce energy consumption and operational carbon emissions.

3.2. BES-Based Optimization Results

The analysis evaluates the energy and economic performance of various retrofit scenarios for the reference building between 2016 and 2025. Crucially, to better reflect actual building performance, the envelope’s thermal properties were updated by incorporating site-specific UINSITU and TI values—derived from QIRT analysis—into the BES boundary conditions, rather than relying solely on standard thermal bridge multipliers. This empirical shift allows the optimization calculations to transition from idealized ‘as-designed’ assumptions toward the building’s ‘as-built’ thermal reality. By employing a 30-year life-cycle perspective in accordance with EN 15459-1 standard [72], the study identifies the most viable strategies for reducing annual primary energy consumption and global costs relative to this empirical baseline.
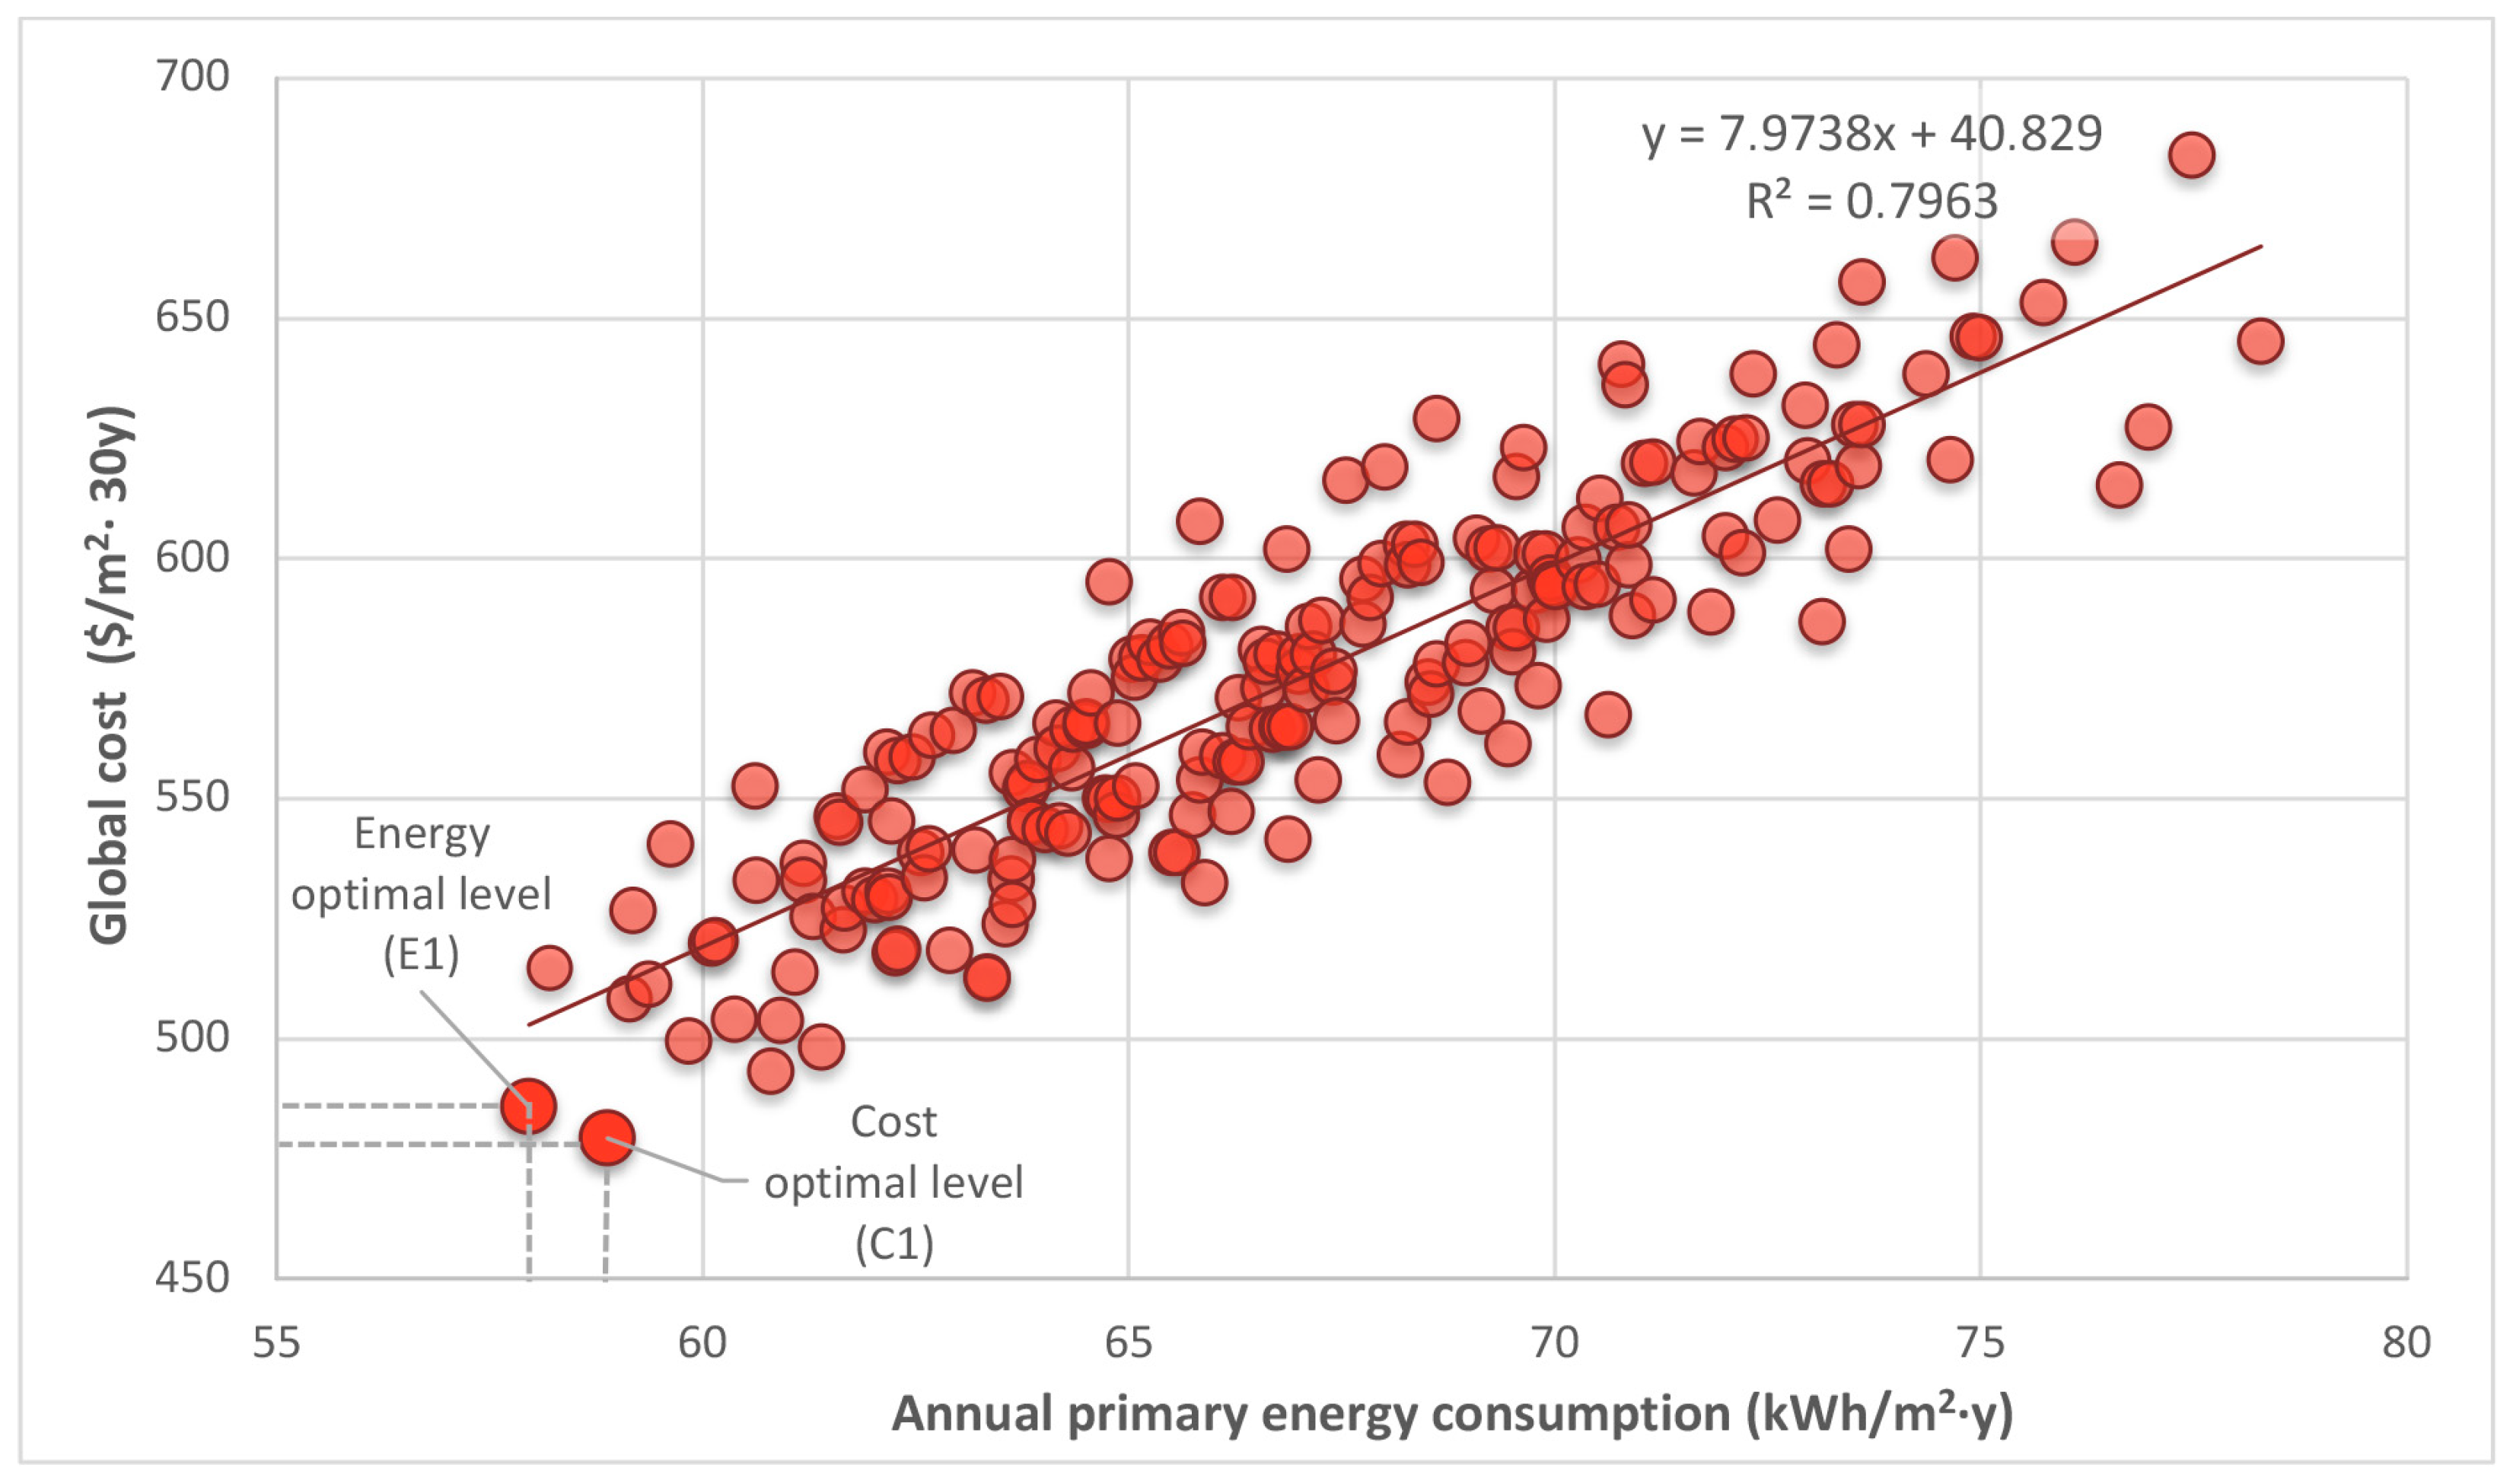
Figure 6 presents a scatter plot of various insulation and glazing combinations that outperform the reference building, specifically highlighting the energy-optimal (E1) and cost-optimal (C1) solutions. The x-axis represents the annual primary energy consumption, while the y-axis denotes the global cost, including initial investment, annual operation, and replacement costs for thermal insulation and glazing. The reference building is excluded from the focused scatter plot axes to maintain visual clarity among the Pareto-optimal solutions, as its primary energy consumption and global cost significantly exceed the optimized range.
The Pareto analysis identifies a series of non-dominated solutions that significantly outperform the baseline, revealing a robust correlation between energy savings and global costs. The regression analysis indicates a strong linear relationship (R2 = 0.7963), confirming that approximately 80% of the variance in global cost is explained by primary energy consumption. This statistically significant correlation demonstrates that as primary energy consumption decreases, total life-cycle costs follow a consistent downward trend. Furthermore, the model quantifies the economic impact of energy performance: each 1 kWh/m2·y increase in primary energy consumption is associated with a marginal global cost increase of approximately $7.97/m2 over the 30-year study period. Additionally, the fixed cost component of the regression model—representing initial investment, maintenance, and periodic repairs regardless of energy use—was calculated at $40.83/m2.
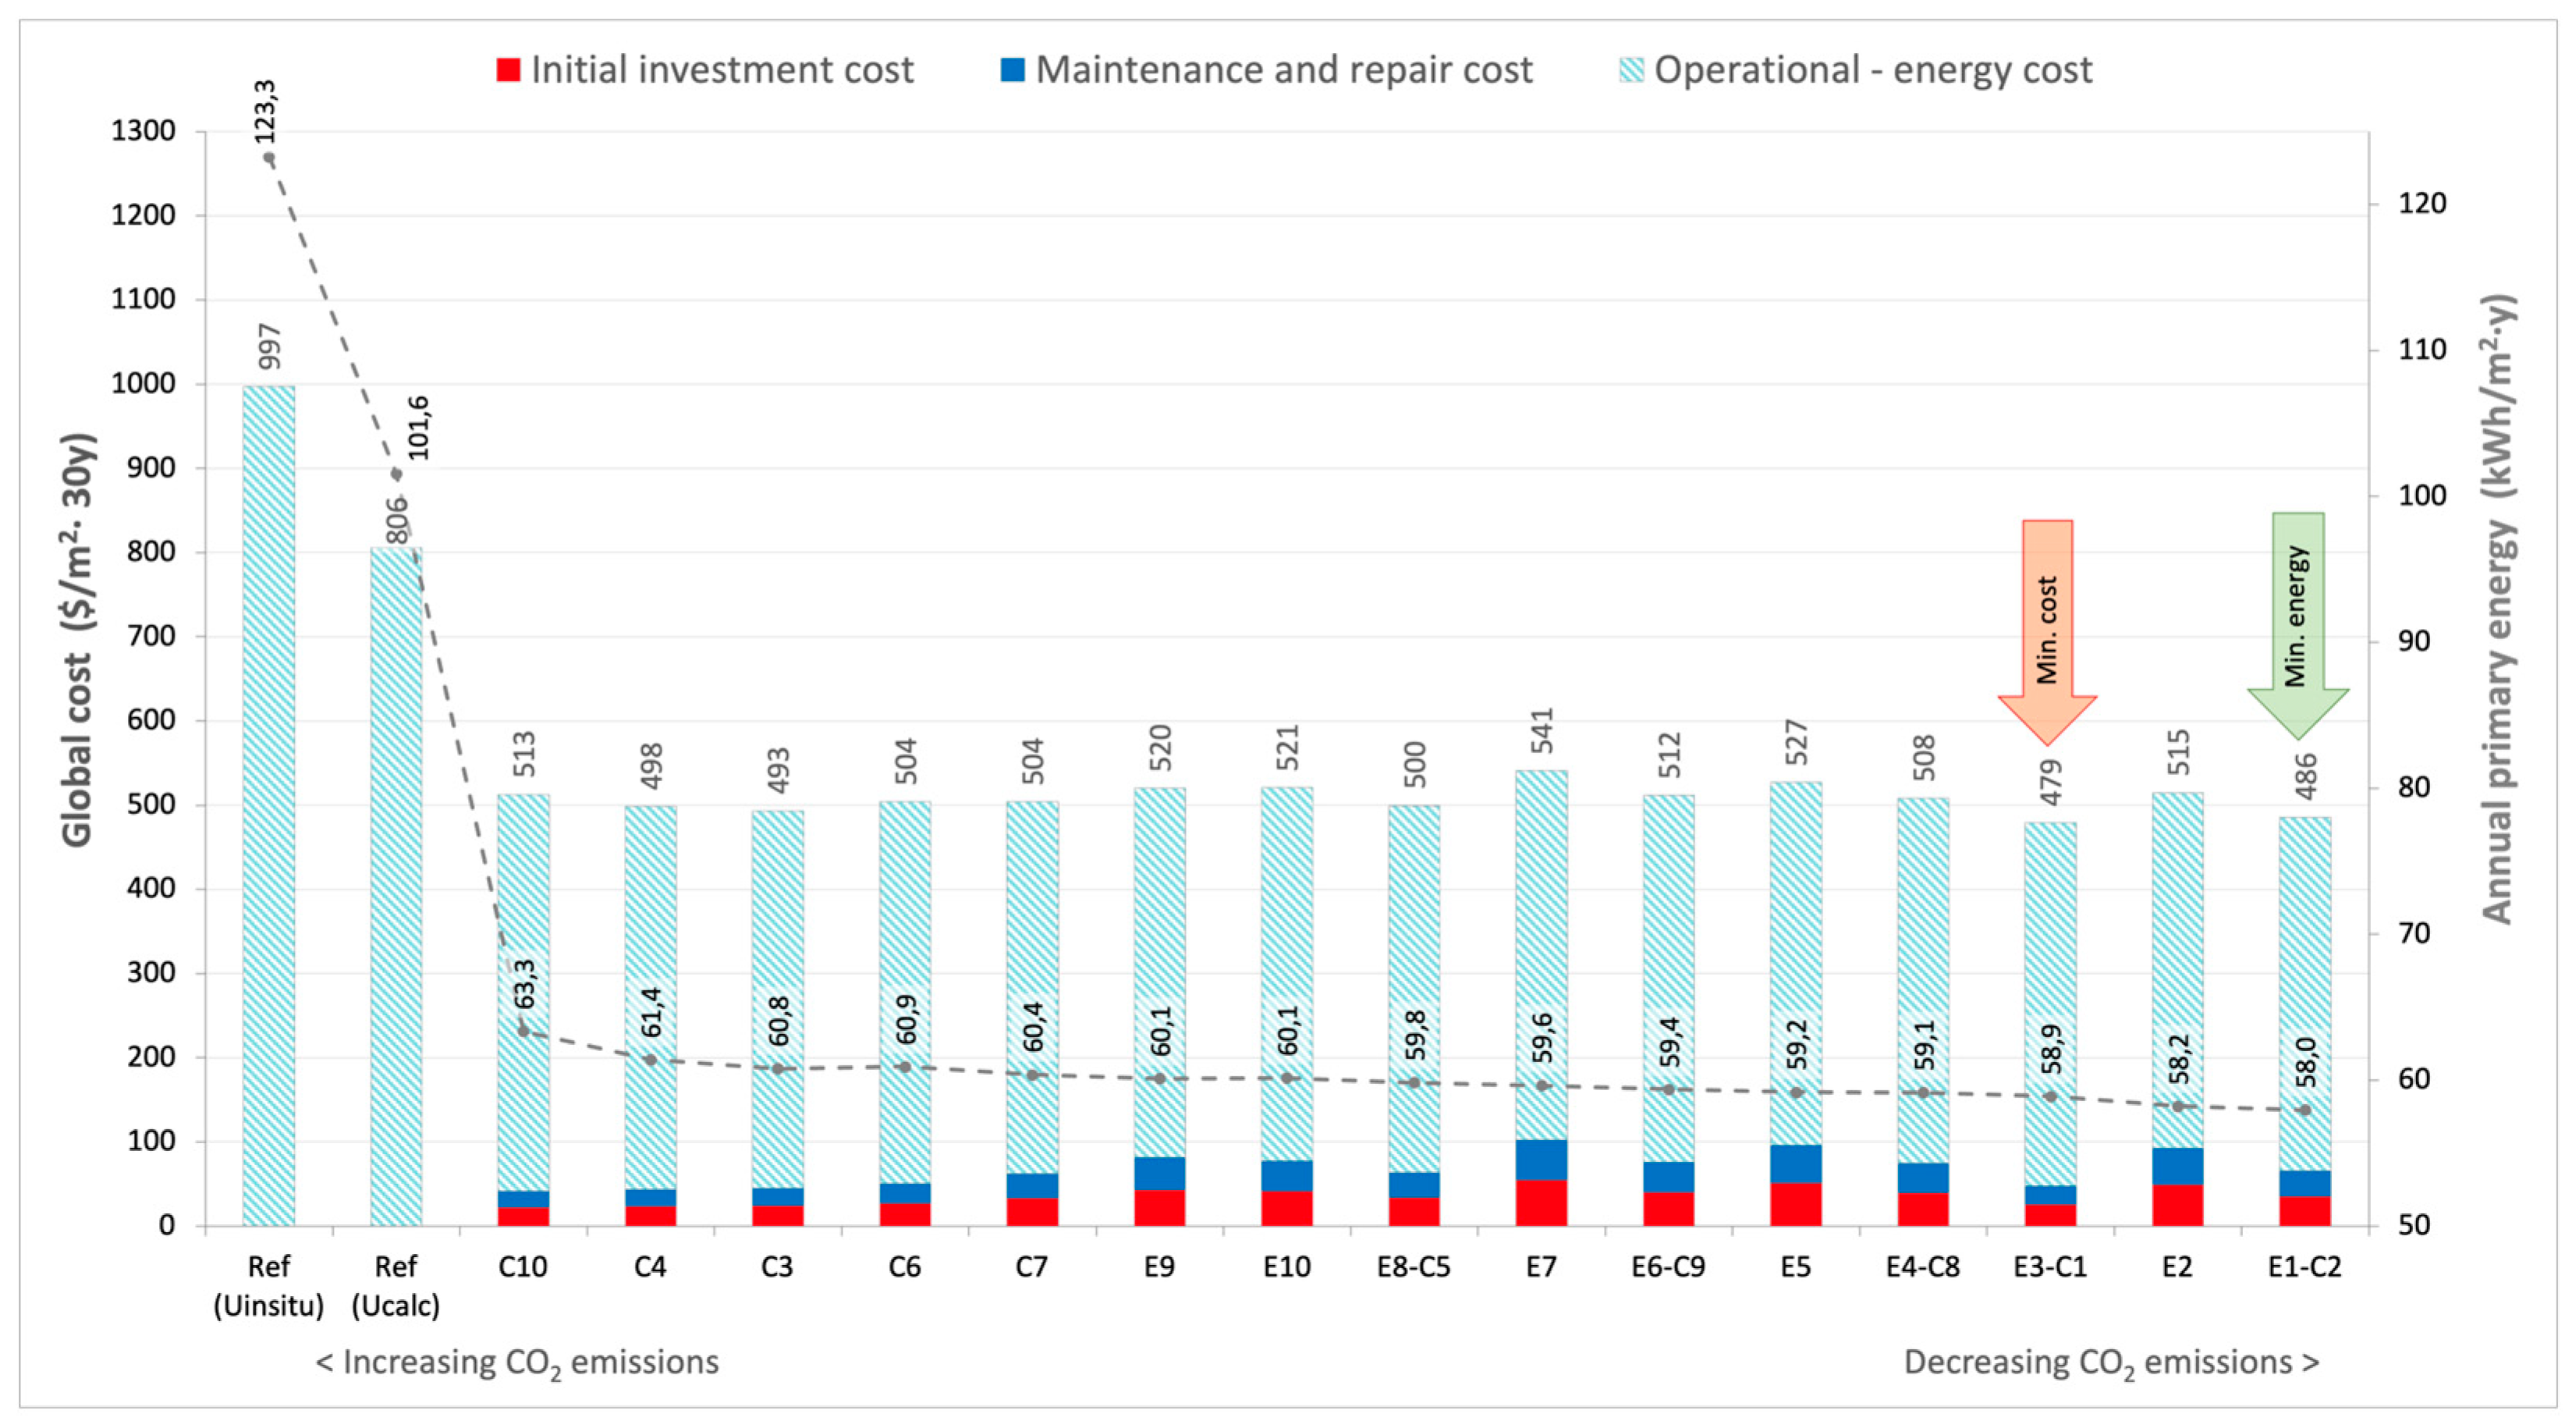
Following the trend observed in the regression, specific optimal points emerge as key strategic benchmarks. Figure 7 illustrates the Pareto-optimal frontier, where a convergence analysis focusing on the top 10 cost-optimal and the top 10 energy-optimal solutions reveals that these targets frequently coincide in high-performance envelope configurations. These solutions are further categorized into energy-oriented (E) configurations, prioritizing the minimization of annual primary energy consumption, and cost-oriented (C) options, focused on reducing life-cycle global costs. To emphasize environmental impact, the solutions are arranged from left to right in descending order of operational carbon emissions. Furthermore, Table 10 details the specific improvement rates achieved by these Pareto-optimal solutions across key performance metrics—including heating, cooling, lighting, operational carbon emissions, and global cost—using the baseline (Ref-UINSITU) for comparison.
A comparative economic breakdown in Figure 7 reveals that operational energy costs remain the dominant expenditure, accounting for 87.7–92% in cost-oriented (C) solutions and 81–85.4% in energy-oriented (E) solutions. Conversely, initial capital investments constitute only 4.6–7.7% in C scenarios and 9.1–12.4% in E scenarios, respectively. This indicates that the slight increase in upfront investment for Pareto-optimal scenarios can be seen as a strategic trade-off, largely offset by the long-term savings in operational energy costs.
To quantify the impact of the empirical update, a comparative analysis was performed between the UCALC and UINSITU models. The results show that the reference building, when adjusted for identified thermal anomalies, exhibits an annual primary energy consumption of 123.3 kWh/m2·y, a total global cost of 997 $/m2, with an operational carbon footprint of 30.2 kgCO2-eq/m2·y. Specifically, the transition to UINSITU leads to a 21.8% increase in heating energy and a 17.6% increase in annual primary energy consumption, highlighting the risk of underestimation in non-empirical models.
Building on this empirical baseline, the results indicate that energy-oriented (E) configurations achieve a primary energy reduction ranging from 51% to 53%, while cost-optimal (C) solutions lower global expenditures by 49% to 52%. A critical finding of this study is the identified convergence between these two objectives, where cost-optimal and energy-optimal points coincide. Among these, the best performing energy-oriented configuration (E1) lowers primary energy consumption to 58.0 kWh/m2·y with a corresponding 30-year global cost of 485.8 $/m2. Simultaneously, the cost-optimal option (C1) maximizes long-term financial feasibility by reducing the global cost to 479.3 $/m2, representing a 51.9% saving (58.9 kWh/m2·y) over the reference case.
The marginal difference between these two scenarios—only 0.9 kWh/m2·y in energy performance and 6.5 $/m2 in global cost—highlights a significant convergence between environmental and financial objectives. This coinciding behavior indicates that high-performance energy targets are achievable without an exponential increase in global costs. The synergy suggests that the selected insulation and high-performance glazing strategies are highly effective in balancing financial feasibility with energy efficiency goals. Specifically, the transition from uninsulated walls to 12 cm insulation layers (EPS, XPS or stone wool) reduces Uwall to as low as 0.226 W/(m2·K). When combined with argon-filled, low-e/solar low-e units (G2, G12), this configuration not only lowers Uglazing from 2.4 to 1.1 W/(m2·K) but also strategically optimizes solar gains (SHGC: 56–63%) and light transmittance (Tvis: 79%). Such a balance effectively manages the trade-off between heating and cooling energy while preventing the overheating risks typically associated with high insulation thicknesses in a temperate–humid Mediterranean climate.
Beyond energy and cost savings, the BES-based optimization analysis reveals a significant reduction in the building’s environmental footprint. Scenario E1 achieves a reduction of 15.4 kgCO2-eq/m2·y, representing a 50.9% decrease in annual operational carbon emissions. This lowers the operational carbon footprint from 30.2 to 14.8 kgCO2-eq/m2·y relative to the UINSITU baseline.

4. Conclusions and Future Work

4.1. Insights from the IRT Survey

In this study, a QIRT survey was integrated to assess the thermal integrity of the building, providing an empirical foundation for the subsequent BES-based optimization. This diagnostic approach enabled the identification of significant thermal bridges and the validation of surface temperature distributions, particularly at critical interfaces of non-insulated external wall surfaces, the RC structural frame, and fenestration boundaries. The results suggest that IRT should be routinely employed in building inspections, as quantitative surface temperature analysis offers a reliable pathway for assessing real-world thermal conditions and refining the energy ratings of existing buildings.
A critical finding of the in situ measurements is the discrepancy between predicted and actual thermal performance. The data indicate that the in situ thermal transmittance of non-insulated PACB walls is significantly higher than the theoretically calculated values, confirming that the actual thermal resistivity is lower than expected. This performance gap is attributed to several factors inherent in aging building stocks, including material degradation over time, moisture content and workmanship inconsistencies. While UINSITU and UCALC values for the RC components were more closely aligned, the widespread structural thermal bridges at beam–column junctions and floor slab edges remain primary conduits for continuous heat dissipation in a non-insulated building envelope.
The calculation of the TI served as a diagnostic tool for assessing condensation risks and long-term durability. The analysis revealed that several junction points fell critically below the 0.70 threshold defined in ISO 13788 [20], a safety limit for preventing surface mold growth. Such low TI values signal a high susceptibility to interstitial condensation and the subsequent microbiological degradation of the building fabric. Furthermore, the survey identified significant warm air leakage stemming from defective joinery seals. These empirical findings visually and numerically confirm that the current thermal resistance of the envelope is insufficient to meet the demands of updated national insulation standards, providing a powerful justification for retrofit strategies explored in the optimization phase.
It is crucial to acknowledge that the observed in situ performance is driven by complex, three-dimensional heat conduction, particularly at the structural junctions between the RC skeleton, infill masonry, and fenestration systems. While the current QIRT-based framework effectively diagnoses these thermal anomalies, the persistent discrepancies between in situ and theoretical U-values partially stem from these 3D heat flow effects that transcend traditional 1D or 2D modeling. Addressing these failures requires structural interventions beyond the simple application of thermal insulation. Specifically, repositioning fenestration components to the thermal plane—the interface between the masonry and the insulation layer—emerges as a critical strategy to mitigate geometric thermal bridging. Consequently, these findings underscore that improving the energy rating of existing building stocks requires a dual-track approach: integrating high-performance insulation with a rigorous focus on airtightness and the strategic mitigation of thermal bridges during both the design and execution phases.

4.2. Insights from the BES-Based Optimization Analysis

The integration of BES-based optimization and cost-optimal analysis confirms that the thermal deficiencies identified via QIRT can be effectively mitigated through a strategic building envelope reconfiguration. Economic data from CBRT and FRED for the 2016–2025 period reveals an average annual inflation rate of 33.23%. Critically, natural gas prices outpaced this general inflation by 7.74 percentage points, highlighting Türkiye’s energy dependency and the necessity of thermal improvements as a hedge against volatile energy markets.
The Pareto analysis demonstrates a strong correlation between primary energy savings and life-cycle global costs (calculated per EN 15459-1). A key finding is the convergence of cost-optimal and energy-optimal targets; in the building’s current state, global costs are dominated by operational energy expenditures.
The optimized scenarios shift this economic balance; the life-cycle global cost calculation explicitly aggregates both CAPEX and OPEX. Therefore, the optimized scenarios, which identify 10–12 cm of insulation and argon-filled low-e glazing as the optimal solution set, prove that minimizing long-term costs is achievable while simultaneously addressing the complexities of a transitional Mediterranean climate. The reduction in total global costs observed in these scenarios does not stem from a decrease in initial investment requirements, but rather from the substantial mitigation of operational energy expenditures (OPEX) in the face of escalating energy prices. While initial capital investment for insulation and high-performance glazing is significant —reaching up to 12.4% under optimal configurations—the financial payback period within the Turkish market is considerably accelerated compared to stable-economy contexts. Thus, retrofitting functions effectively as a financial hedge against market volatility, prioritizing long-term economic stability over traditional short-term investment metrics.
The results highlight a preference for glazing configurations that maintain a high visible light transmittance and a moderate-to-high solar factor, thereby leveraging passive solar gains during heating seasons without compromising natural lighting. It is important to note that while high levels of insulation significantly reduce heating demand, they must be balanced with appropriate glazing and ventilation strategies to prevent summer overheating. As building envelopes become more airtight and thermally resistant, the risk of heat entrapment increases, potentially elevating cooling energy demand. Therefore, the selected glazing configurations—specifically those with selective solar control properties—serve as a critical balancer by managing potential increases in cooling loads, ultimately achieving a holistic performance–cost equilibrium.
This holistic optimization leads to a transformative impact, where annual primary energy use, global costs, and carbon emissions are approximately halved compared to the reference building. In conclusion, these findings underscore that deep retrofitting is both an economic necessity against volatile energy markets and a critical instrument for achieving national decarbonization goals.
This study reveals that residential stocks constructed post 1999 earthquake era—while seismically resilient—remain thermally inadequate, representing a primary target for energy efficiency improvements. By providing actionable recommendations for the building stock, this research informs designers and policymakers that aligning building envelope efficiency with long-term economic viability represents a key strategic pathway toward the NZEB and 2053 net-zero carbon vision. Furthermore, the synergy between non-destructive QIRT assessment and BES-based optimization provides a robust hybrid framework for enhancing energy efficiency and user comfort, directly aligning with global climate initiatives.

4.3. Limitations and Future Research

Several limitations should be considered when interpreting the results of this study. First, the lack of long-term sub-metering data for individual apartments precluded a formal model calibration based on Normalized Mean Bias Error (NMBE) and the Coefficient of Variation in the Root Mean Square Error (Cv(RMSE)) indices. To mitigate this, the base model was validated by integrating theoretical benchmarks with on-site IRT findings, ensuring that observed thermal anomalies and thermal bridges were represented. While this approach provides a reliable basis for comparative retrofit analysis, integrating real-time monitoring and longitudinal utility data in future research could further refine the simulation’s absolute accuracy.
Second, the calculation of the UINSITU values relies on the assumption of a uniform surface emissivity. To mitigate potential errors, a preliminary calibration experiment was conducted in accordance with ASTM E1933-14 [62], establishing an optimal emissivity of ε = 0.93 based on thermocouple references (with a maximum deviation of 0.6 °C and thermal stability of ±0.1 °C). While this value is representative of the analyzed materials, it is acknowledged that surface aging or material heterogeneity could introduce minor uncertainties.
Third, the IR thermographic survey provides a quasi-steady-state snapshot of the building envelope’s thermal performance. Transient weather effects and thermal inertia may influence surface temperature distributions at the time of capture. Although the survey was conducted under overcast winter conditions to minimize solar interference, these dynamic variables represent inherent limitations in translating instantaneous thermal images into long-term performance data. Specifically, building airtightness was maintained at a constant baseline, reflecting existing construction characteristics rather than as an optimization variable. This simplification was adopted to maintain a focused analysis on facade material properties and to avoid the complexities of assigning localized costs to infiltration reduction measures.
To address the complexities above, future research could incorporate 3D Finite Element Analysis (FEA) for thermal bridges, combined with Computational Fluid Dynamics (CFD) simulations, to model airtightness alongside in situ heat flux measurements (HFM), or co-heating tests. Such methods would allow for a more precise modeling of the interaction between airtightness, natural ventilation rates, and localized thermal bridges, effectively bridging the gap between predicted and actual energy performance. This hybrid approach would enable the integration of dynamic environmental factors into detailed HVAC sizing, thereby enhancing the accuracy of energy performance predictions.
Furthermore, while this study emphasizes the thermal performance of the building envelope, the impact of natural ventilation patterns remains a significant variable. Future research should investigate the synergy between airtightness, optimized natural ventilation strategies, and shading systems to better manage the trade-off between winter heating energy savings and potential summer overheating risks inherent in well-insulated residential buildings. Beyond these physical and environmental variables, occupant interaction also plays a critical role in real-world performance. In this study, standardized profiles were utilized to maintain a controlled simulation baseline; however, the socio-technical gap resulting from varying resident habits remains a challenging variable to simulate accurately for residential buildings.
Regarding the economic framework, the analysis is grounded in a uniquely volatile market characterized by negative real interest rates, high inflation, and escalating energy prices. While this specific context enhances the feasibility of energy efficiency measures in present-day terms, static baseline projections remain sensitive to rapid macroeconomic shifts. To maintain a realistic trend, this study utilized the ten-year arithmetic mean of inflation rates. This approach offers a stable baseline for the 30-year global cost analysis, shifting the building’s financial profile from high OPEX to strategic CAPEX, though it remains open to varying economic interpretations. Future studies could employ stochastic cost-analysis models or Monte Carlo simulations to better account for these rapid macroeconomic fluctuations and their impact on long-term investment risks.
Finally, this study integrates three domains—non-destructive thermal diagnostics, energy simulation, and economic optimization—to propose a hybrid framework for optimizing building envelope retrofits. From an architectural perspective, the primary intent was to bridge these specialized fields into a cohesive systemic integration, rather than focusing on a singular analytical dimension. This approach aims to translate technical diagnostics into actionable design and implementation strategies. While based on a specific case, the methodology offers a transferable model for analyzing uninsulated building stocks in the Mediterranean region that are facing similar performance gaps.
This research opens pathways for further investigation. Future studies could evaluate the integration of renewable energy systems on the ‘convergence’ point of Pareto-optimal solutions or assess how climate change scenarios (shifting HDD and CDD until 2050) might affect the long-term performance of the identified insulation thicknesses. Recognizing the rapid evolution of building performance optimization, future research may transition from simulation-based workflows toward hybrid frameworks that integrate the transparency and explicit constraint-handling of classical heuristic and deterministic approaches with the high-speed predictive capabilities of deep learning [44,45]. As demonstrated in the recent literature, such AI-driven surrogate models [46,47,48] can significantly reduce computational convergence time while maintaining the interpretability of physical models. Bridging these methodologies would offer a more robust decision-support system, leveraging the predictive power of ANN to complement the empirical ground-truth provided by in situ diagnostics. Additionally, incorporating LCA to evaluate the embodied carbon of insulation materials and glazing systems would provide a more complete ‘Cradle-to-Grave’ environmental perspective on building decarbonization.

Funding

This research received no external funding.

Data Availability Statement

The original contributions presented in this study are included in the article. Further inquiries can be directed to the corresponding author.

Conflicts of Interest

The authors declare no conflict of interest.

Abbreviations

The following abbreviations are used in this manuscript:
AIArtificial Intelligence
ANNArtificial Neural Networks
BEPBuilding Energy Performance
BESBuilding Energy Simulation
BIMBuilding Information Modeling
CAPEXCapital Expenditure
CBRTCentral Bank of the Republic of Türkiye
CDDCooling Degree Day
CFDComputational Fluid Dynamics
CPRConstruction Products Regulation
EMRAEnergy Market Regulatory Authority
ENEuropean Norm
EPBDEnergy Performance of Buildings Directive
EPCEnergy Performance Certificate
EPSExpanded Polystyrene
EPWEnergyPlus Weather
EUEuropean Union
FREDFederal Reserve Economic Data
GAGenetic Algorithm
HDDHeating Degree Day
HVACHeating, Ventilation, and Air Conditioning
IGDAŞIstanbul Gaz Dağıtım Sanayi ve Ticaret A.Ş (Istanbul Natural Gas Distribution Co., Inc.)
IRInfrared
IRTInfrared Thermography
ISOInternational Organization for Standardization
LCALife Cycle Assessment
NMBENormalized Mean Bias Error
NZEBNearly Zero Energy Building
OPEXOperational Expenditure
PACBsPumice Aggregate Concrete Blocks
QIRTQuantitative Infrared Thermography
RCReinforce Concrete
SHGCSolar Heat Gain Coefficient
TITemperature Index
TMYxTypical Meteorological Year Extended
TSTurkish Standard
TSETürk Standartları Enstitüsü (Turkish Standard Institute)
TRYTurkish Lira
USDUnited States Dollar
WWRWindow-to-wall Ratio
XPSExtruded Polystyrene

References

  1. Republic of Türkiye Ministry of Energy and Natural Resources. Energy Balance Table of 2023; MENR: Ankara, Turkey, 2024. Available online: https://enerji.gov.tr/preview/tr/63d0007a-f593-458b-9610-353eb2545897 (accessed on 15 December 2025).
  2. International Energy Agency (IEA). Türkiye 2021 Energy Policy Review; IEA: Paris, France, 2021; Available online: https://www.iea.org/reports/turkey-2021 (accessed on 15 May 2022).
  3. Turkish Statistical Institute (TurkStat). Building Permit Statistics-IV. Quarter: October–December 2022; Turkstat: Ankara, Turkey, 2022. Available online: https://data.tuik.gov.tr/Bulten/Index?p=Building-Permits-Quarter-II:-April---June,-2022-45830&dil=2https://www.tuik.gov.tr/Home/Index (accessed on 15 December 2025).
  4. Republic of Türkiye Ministry of Energy and Natural Resources. Türkiye’s Energy Efficiency 2030 Strategy and II. National Energy Efficiency Action Plan (2024–2030); MENR: Ankara, Turkey, 2024. Available online: https://enerji.gov.tr//Media/Dizin/EVCED/tr/EnerjiVerimlili%C4%9Fi/UlusalEnerjiVerimlili%C4%9FiEylemPlan%C4%B1/Belgeler/EnerEffi2030Str2ndNatEnerEffiActPlan2024-2030.pdf (accessed on 15 June 2025).
  5. Ministry of Public Works and Settlement. Regulation on Thermal Insulation in Buildings (Binalarda Isı Yalıtımı Yönetmeliği). Official Gazette of the Republic of Türkiye, 9 October 2008. Available online: https://www.resmigazete.gov.tr/eskiler/2008/10/20081009-2.htm (accessed on 16 March 2026).
  6. Ministry of Environment, Urbanization and Climate Change. TS 825: Thermal Insulation Requirements for Buildings (Binalarda Isı Yalıtım Kuralları) Standard, Communiqué No: MHGM-2025/1. Official Gazette of the Republic of Türkiye, 20 February 2025. Available online: https://www.resmigazete.gov.tr/fihrist?tarih=2025-02-20 (accessed on 16 March 2026).
  7. Ministry of Environment, Urbanization and Climate Change. Energy Performance of Buildings Regulation. Official Gazette of the Republic of Türkiye, 5 December 2008. Available online: https://resmigazete.gov.tr/eskiler/2008/12/20081205-9.htm (accessed on 20 December 2025).
  8. Ministry of Environment, Urbanization and Climate Change. Regulation on Amending the Energy Performance of Buildings Regulation. Official Gazette of the Republic of Türkiye, 19 February 2022. Available online: https://www.resmigazete.gov.tr/eskiler/2022/02/20220219-2.htm (accessed on 15 December 2025).
  9. Ministry of Environment and Urbanization. Building Energy Performance National Calculation Methodology (BEP-TR). Official Gazette of the Republic of Türkiye, 7 December 2010. Available online: https://www.resmigazete.gov.tr/eskiler/2010/12/20101207M1-1.htm (accessed on 16 March 2026).
  10. Caglayan, S.; Yigit, S.; Ozorhon, B.; Ozcan-Deniz, G. A genetic algorithm-based envelope design optimisation for residential buildings. Proc. Inst. Civ. Eng. Eng. Sustain. 2020, 173, 280–290. [Google Scholar] [CrossRef]
  11. Ding, Z.; Li, J.; Wang, Z.; Xiong, Z. Multi-Objective Optimization of Building Envelope Retrofits Considering Future Climate Scenarios: An Integrated Approach Using Machine Learning and Climate Models. Sustainability 2024, 16, 8217. [Google Scholar] [CrossRef]
  12. Chown, G.A.; Burn, K.N. CBD-229 Thermographic Identification of Building Enclosure Effects and Deficiencies. Can. Build. Dig. 1983, 229, 1–11. [Google Scholar]
  13. Pettersson, B.; Axen, B. Thermography: Testing of Thermal Insulation and Airtightness of Buildings; Swedish Council for Building Research: Stockholm, Sweden, 1980. [Google Scholar]
  14. Yu, J.; Dong, Y.; Wang, T.-H.; Chang, W.-S.; Park, J. U-Values for Building Envelopes of Different Materials: A Review. Buildings 2024, 14, 2434. [Google Scholar] [CrossRef]
  15. Alexakis, K.; Benekis, V.; Kokkinakos, P.; Askounis, D. Genetic algorithm-based multi-objective optimisation for energy-efficient building retrofitting: A systematic review. Energy Build. 2025, 328, 115216. [Google Scholar] [CrossRef]
  16. Li, W.; Sui, W.; Cheng, L.; Ji, Y.; Guo, Y.; Zhu, J. Quantifying seasonal demand-side flexibility in residential air conditioning under diverse control strategies. Energy Build. 2026, 352, 116764. [Google Scholar] [CrossRef]
  17. Aydin, N.; Biyikoglu, A. Determination of optimum insulation thickness by life cycle cost analysis for residential buildings in Turkey. Sci. Technol. Built Environ. 2021, 27, 2–13. [Google Scholar] [CrossRef]
  18. European Parliament and Council of the European Union. Regulation (EU) No 305/2011 of the European Parliament and of the Council of 9 March 2011 Laying Down Harmonised Conditions for the Marketing of Construction Products and Repealing Council Directive 89/106/EEC. Official Journal of the European Union, 4 April 2011; pp. 5–43. Available online: https://eur-lex.europa.eu/legal-content/EN/TXT/?uri=CELEX:32011R0305 (accessed on 16 March 2026).
  19. European Parliament; Council of the European Union. Directive (EU) 2024/1275 of 24 April 2024 on the Energy Performance of Buildings (Recast); EU: Brussels, Belgium, 2024; Available online: https://eur-lex.europa.eu/eli/dir/2024/1275/oj/eng (accessed on 15 December 2025).
  20. European Commission. A Renovation Wave for Europe—Greening Our Buildings, Creating Jobs, Improving Lives; Communication from the Commission to the European Parliament, the Council, the European Economic and Social Committee and the Committee of the Regions; COM(2020) 662 Final; European Commission: Brussels, Belgium, 2020; Available online: https://data.consilium.europa.eu/doc/document/ST-11855-2020-INIT/en/pdf (accessed on 10 March 2026).
  21. Ma, Z.; Cooper, P.; Daly, D.; Ledo, L. Existing building retrofits: Methodology and state-of-the-art. Energy Build. 2012, 55, 889–902. [Google Scholar] [CrossRef]
  22. ISO 13788:2012; Hygrothermal Performance of Building Components and Building Elements—Internal Surface Temperature to Avoid Critical Surface Humidity and Interstitial Condensation—Calculation Methods. ISO: Geneva, Switzerland, 2012. Available online: https://www.iso.org/standard/51615.html (accessed on 15 December 2025).
  23. Trechsel, H. Moisture Analysis and Condensation Control in Building Envelopes; ASTM MNL40; ASTM International: West Conshohocken, PA, USA, 2001. [Google Scholar]
  24. Tabet Aoul, K.A.; Hagi, R.; Abdelghani, R.; Syam, M.; Akhozheya, B. Building Envelope Thermal Defects in Existing and Under-Construction Housing in the UAE; Infrared Thermography Diagnosis and Qualitative Impacts Analysis. Sustainability 2021, 13, 2230. [Google Scholar] [CrossRef]
  25. ISO 10211:2017; Thermal Bridges in Building Construction—Heat Flows and Surface Temperatures—Detailed Calculations. International Organization for Standardization: Geneva, Switzerland, 2017.
  26. Theodosiou, T.G.; Papadopoulos, A.M. The impact of thermal bridges on the energy demand of buildings with double brick wall constructions. Energy Build. 2008, 40, 2083–2089. [Google Scholar] [CrossRef]
  27. Maierhofer, C.; Röllig, M.; Schlichting, J. Active thermography for evaluation of reinforced concrete structures. In Non-Destructive Evaluation of Reinforced Concrete Structures: Volume 2: Non-Destructive Testing Methods; Maierhofer, C., Reinhardt, H.W., Dobmann, G., Eds.; Woodhead Publishing: Cambridge, UK, 2010; pp. 370–402. [Google Scholar]
  28. LaTona, R.W.; Vlagea, O. How to Detect and Observe Hidden Window Leaks Using Infrared Thermography. In Symposium on “Up Against the Wall”: An Examination of Building Envelope Interface; ASTM International: West Conshohocken, PA, USA, 2009. [Google Scholar]
  29. Mahmoodzadeh, M.; Gretka, V.; Lee, I.; Mukhopadhyaya, P. Infrared thermography for quantitative thermal performance assessment of wood-framed building envelopes in Canada. Energy Build. 2022, 258, 111807. [Google Scholar] [CrossRef]
  30. O’Grady, M.; Lechowska, A.A.; Harte, A.M. Infrared thermography technique as an in-situ method of assessing heat loss through thermal bridging. Energy Build. 2017, 135, 20–32. [Google Scholar] [CrossRef]
  31. Balaras, C.A.; Argiriou, A.A. Infrared Thermography for Building Diagnostics; Group Energy Conservation, Institute for Environmental Research and Sustainable Development, National Observatory of Athens: Athens, Greece, 2002. [Google Scholar]
  32. Barreira, E.; Freitas, V. Evaluation of Building Materials Using Infrared Thermography; Faculdade de Engenharia da Universidade do Porto: Porto, Portugal, 2005. [Google Scholar]
  33. Avdelidis, N.P.; Moropoulou, A. Emissivity Considerations in Building Thermography; Materials Research Centre, University of Bath: Bath, UK; National Technical University of Athens: Athens, Greece, 2002. [Google Scholar]
  34. Bayomi, N.; Nagpal, S.; Rakha, T.; Fernandez, J.E. Building envelope modeling calibration using aerial thermography. Energy Build. 2021, 233, 110648. [Google Scholar] [CrossRef]
  35. Meola, C.; Maio, R.; Roberti, N.; Carlomagno, G.M. Application of Infrared Thermography and Geophysical Methods for Defect Detection in Architectural Structures; Università di Napoli Federico II: Naples, Italy, 2004. [Google Scholar]
  36. Li, Z.; Yao, W.; Lee, S.; Lee, C.; Yang, Z. Application of Infrared Thermography Technique in Building Finish Evaluation. J. Nondestruct. Eval. 2000, 19, 11–19. [Google Scholar] [CrossRef]
  37. Takva, Ç.; Takva, F.G.; Çakıcı, F.Z. Thermal Analysis of the Building Envelope with Infrared Thermography and Simulation in Educational Buildings in the Cold Climate Region. Buildings 2025, 15, 1759. [Google Scholar] [CrossRef]
  38. Choi, G.-S.; Kang, J.-S.; Jeong, Y.-S.; Lee, S.-E. Development of an On-site Evaluation Method for Building Thermal Performance Using an Infrared Camera; Korea Institute of Construction Technology: Goyang, Republic of Korea, 2006. [Google Scholar]
  39. Ribarić, S.; Marčetić, D.; Vedrina, D.S. A knowledge-based system for the non-destructive diagnostics of façade isolation using the information fusion of visual and IR images. Expert Syst. Appl. 2009, 36, 3812–3823. [Google Scholar] [CrossRef]
  40. Adamus, J.; Pomada, M. Analysis of the Influence of External Wall Material Type on the Thermal Bridge at the Window-to-Wall Interface. Materials 2023, 16, 6585. [Google Scholar] [CrossRef] [PubMed]
  41. Rojas-Colmenares, L.S.; Rizo-Maestre, C.; Gómez-Donoso, F.; Saura-Gómez, P. Interactive Digital Twin Workflow for Energy Assessment of Buildings: Integration of Photogrammetry, BIM and Thermography. Appl. Sci. 2025, 15, 12599. [Google Scholar] [CrossRef]
  42. Alhaidary, H.; Al-Tamimi, A.K.; Al-Wakil, H. The combined use of BIM, IR thermography and HFS for energy modelling of existing buildings and minimising heat gain through the building envelope: A case-study from a UAE building. Adv. Build. Energy Res. 2021, 15, 709–732. [Google Scholar] [CrossRef]
  43. Abdulridha, A.A.; Alzubaidi, L.; Alver, N. Integration of artificial intelligence techniques with infrared thermography for defect detection in concrete structures: A systematic review. Measurement 2026, 267, 120491. [Google Scholar] [CrossRef]
  44. Duan, Y.; Hu, C.; Li, P.; Wei, Y.; Li, R.; Ding, X.; Yang, Y.; Qiao, J.; Zhang, T.; Gao, W. A data-driven interpretable framework for multi-objective optimization: Decoupling thermodynamic and economic constraints in cold-region rural dwelling retrofits. Energy 2026, 349, 140675. [Google Scholar] [CrossRef]
  45. Shan, R.; Jia, X.; Su, X.; Xu, Q.; Ning, H.; Zhang, J. AI-Driven Multi-Objective Optimization and Decision-Making for Urban Building Energy Retrofit: Advances, Challenges, and Systematic Review. Appl. Sci. 2025, 15, 8944. [Google Scholar] [CrossRef]
  46. Cruz, A.S.; Caldas, L.R.; Mendes, V.M.; Mendes, J.C.; Bastos, L.E.G. Multi-objective optimization based on surrogate models for sustainable building design: A systematic literature review. Build. Environ. 2024, 266, 112147. [Google Scholar] [CrossRef]
  47. Duan, Z.; Li, B.; Zi, Y.; Yao, G. Building retrofit multiobjective optimization using neural networks and genetic algorithm three for energy carbon and comfort. Sci. Rep. 2025, 15, 38076. [Google Scholar] [CrossRef] [PubMed]
  48. Luo, L.; Wei, H.; Lin, Z.; Wu, J.; Wang, W.; Sun, Y. Multi-objective optimal energy-efficient retrofit determination using hybrid urban building energy model: Considering uncertainties between models. Build. Simul. 2025, 18, 183–206. [Google Scholar] [CrossRef]
  49. Wang, H.; He, Z.; Guo, C. Multi-Objective Optimization of Buildings’ Exterior Wall Insulation Based on Comprehensive Analysis Models and Assessment Indexes. Buildings 2025, 15, 781. [Google Scholar] [CrossRef]
  50. Wang, A.; Xiao, Y.; Liu, C.; Zhao, Y.; Sun, S. Multi-objective optimization of building energy consumption and thermal comfort based on SVR-NSGA-II. Case Stud. Therm. Eng. 2024, 63, 105368. [Google Scholar] [CrossRef]
  51. Nielsen, A.N.; Jensen, R.L.; Larsen, T.S.; Nissen, S.B. Early stage decision support for sustainable building renovation—A review. Build. Environ. 2016, 103, 165–181. [Google Scholar] [CrossRef]
  52. Shan, R.; Junghans, L. Multi-Objective Optimization for High-Performance Building Facade Design: A Systematic Literature Review. Sustainability 2023, 15, 15596. [Google Scholar] [CrossRef]
  53. Li, R.; Shari, Z.; Ab Kadir, M.Z.A. A review on multi-objective optimization of building performance—Insights from bibliometric analysis. Heliyon 2025, 11, e42480. [Google Scholar] [CrossRef]
  54. Asadi, E.; da Silva, M.G.; Antunes, C.H.; Dias, L.; Glicksman, L. Multi-objective optimization for building retrofit: A model using genetic algorithm and artificial neural network and an application. Energy Build. 2014, 81, 444–456. [Google Scholar] [CrossRef]
  55. Al-Saadi, S.N.; Al-Jabri, K.S. Optimization of envelope design for housing in hot climates using a genetic algorithm (GA) computational approach. J. Build. Eng. 2020, 32, 101712. [Google Scholar] [CrossRef]
  56. Beck, H.E.; Zimmermann, N.E.; McVicar, T.R.; Vergopolan, N.; Berg, A.; Wood, E.F. Present and future Köppen-Geiger climate classification maps at 1-km resolution. Sci. Data 2018, 5, 180214. [Google Scholar] [CrossRef]
  57. Bengisu Construction Investment Co. Bengisu Evleri Project Brochure (Bengisu Evleri Proje Broşürü); Bengisu Construction Investment Co.: Istanbul, Turkey, 2007. [Google Scholar]
  58. TS EN 1745:2020; Masonry and Masonry Products—Methods for Determining Thermal Properties. TSE: Ankara, Turkey, 2020.
  59. TS EN ISO 6946:2017; Building Components and Building Elements—Thermal Resistance and Thermal Transmittance—Calculation Methods. TSE: Ankara, Turkey, 2017.
  60. ISO 9869-1:2014; Thermal Insulation—Building Elements—In-situ Measurement of Thermal Resistance and Thermal Transmittance. Part 1: Heat Flow Meter Method. ISO: Geneva, Switzerland, 2014. Available online: https://www.iso.org/standard/59697.html (accessed on 20 December 2025).
  61. FLIR Systems. User’s Manual FLIR InfraCAM & FLIR InfraCAM SD; FLIR Systems: Wilsonville, OR, USA, 2007; Available online: https://archive.org/details/manualzilla-id-6901417 (accessed on 15 May 2025).
  62. ASTM E1933-14: 2022; Standard Practice for Measuring and Compensating for Emissivity Using Infrared Imaging Radiometers. ASTM International: West Conshohocken, PA, USA, 2022.
  63. Fokaides, P.A.; Kalogirou, S.A. Application of infrared thermography for the determination of the overall heat transfer coefficient (U-Value) in building envelopes. Appl. Energy 2011, 88, 4358–4365. [Google Scholar] [CrossRef]
  64. Albatici, R.; Tonelli, A.M. Infrared thermovision technique for the assessment of thermal transmittance value of opaque building elements on site. Energy Build. 2010, 42, 2177–2183. [Google Scholar] [CrossRef]
  65. Albatici, R.; Tonelli, A.M.; Chiogna, M. A comprehensive experimental approach for the validation of quantitative infrared thermography in the evaluation of building thermal transmittance. Appl. Energy 2015, 141, 218–228. [Google Scholar] [CrossRef]
  66. Lawrie, L.K.; Crawley, D.B. Development of Global Typical Meteorological Years (TMYx). 2025. Available online: https://climate.onebuilding.org/WMO_Region_6_Europe/TUR_Turkiye/ (accessed on 16 March 2026).
  67. Standard 169-2021; Climatic Data for Building Design Standards. ASHRAE: Atlanta, GA, USA, 2021.
  68. Şişecam. Glass Solutions for Facades Product Catalogue; Şişecam Flat Glass: Istanbul, Turkey, 2021; Available online: https://www.sisecam.com/en/coated-glass-brochures (accessed on 16 March 2026).
  69. Ministry of Energy and Natural Resources (Turkey). Primary Energy and Carbon Emissions Conversion Factors for Natural Gas and Electricity (2025); Ministry of Energy and Natural Resources (Turkey): Ankara, Turkey, 2024. Available online: https://webdosya.csb.gov.tr/db/meslekihizmetler/icerikler/elektr-k-enerj-s-n-n-b-r-nc-l-enerj--katsay-s--2025-20241213085049.docx (accessed on 15 December 2025).
  70. Ministry of Environment, Urbanization and Climate Change. Unit Prices for Construction and Installations (Inşaat ve Tesisat Birim Fiyatları); High Technical Board (YFK): Ankara, Turkey, 2025. Available online: https://webdosya.csb.gov.tr/db/yfk/icerikler/2025-yili-b-r-m-f-yatlari-200105_1007-20250120090000.pdf (accessed on 15 December 2025).
  71. ISO 15686-1:2011; Buildings and Constructed Assets—Service Life Planning—Part 1: General Principles and Framework. ISO: Geneva, Switzerland, 2011.
  72. BS EN 15459-1:2017; Energy Performance of Buildings—Economic Evaluation Procedure for Energy Systems in Buildings—Part 1: Calculation Procedures, Module M1-14. BSI: London, UK, 2017.
  73. World Bank. Inflation, Consumer Prices for Türkiye; Federal Reserve Bank of St. Louis: St. Louis, MO, USA, 2025; Available online: https://fred.stlouisfed.org/series/FPCPITOTLZGTUR (accessed on 15 January 2026).
  74. Central Bank of the Republic of Türkiye (CBRT). Consumer Price Index (CPI) Data (2016–2025); CBRT: Ankara, Turkey, 2026. Available online: https://www.tcmb.gov.tr/wps/wcm/connect/EN/TCMB+EN/Main+Menu/Statistics/Inflation+Data/Consumer+Prices (accessed on 15 January 2026).
  75. Central Bank of the Republic of Türkiye (CBRT). CBRT Interest Rates: 1-Week Repo Auction Rate (2016–2025); CBRT: Ankara, Turkey, 2026. Available online: https://www.tcmb.gov.tr/wps/wcm/connect/EN/TCMB+EN/Main+Menu/Core+Functions/Monetary+Policy/Central+Bank+Interest+Rates/1+Week+Repo (accessed on 15 February 2026).
  76. International Monetary Fund (IMF). Discount Rate for Türkiye; Federal Reserve Bank of St. Louis: St. Louis, MO, USA, 2025; Available online: https://fred.stlouisfed.org/series/INTDSRTRM193N (accessed on 15 January 2026).
  77. Central Bank of the Republic of Türkiye (CBRT). Electronic Data Delivery System (EVDS): Exchange Rates Statistics (USD/TRY Time-Series); CBRT: Ankara, Turkey, 2026. Available online: https://evds3.tcmb.gov.tr/tumSeriler/2501/bie_dkdovytl (accessed on 16 March 2026).
  78. Republic of Türkiye Energy Market Regulatory Authority (EMRA). Electricity Tariff Tables for Residential and Industrial Consumers; EMRA: Ankara, Turkey, 2026. Available online: https://www.epdk.gov.tr/Detay/Icerik/3-1327/ (accessed on 16 March 2026).
  79. İGDAŞ. Natural Gas Retail Sale Tariffs and Subscription Fees; Istanbul Gaz Dağıtım Sanayi ve Ticaret A.Ş: Istanbul, Turkey, 2026. Available online: https://www.epdk.gov.tr/Detay/Icerik/1-1275/natural-gasreports (accessed on 15 February 2026).
Figure 1. Methodological framework of the integrated QIRT-BES retrofit optimization (source: author).
Energies 19 01727 g001
Figure 2. (a) Site plan of the residential complex [57]; (b) SE façade of the case-study apartment block (source: author).
Energies 19 01727 g002
Figure 3. Plan detail of the external wall interface showing the RC column, the PACB infill, and the window frame (source: author).
Energies 19 01727 g003
Figure 4. Experimental setup for the calibration procedure: (a) Measurement locations (X1–X9) and IR camera positions (A–J); (b) Comparative analysis of surface temperatures based on different emissivity (ε) settings (source: author).
Energies 19 01727 g004
Figure 5. Normalized hourly occupancy profiles and corresponding system usage frequencies for (a) living room and kitchen, (b) bedrooms, and (c) service areas during weekdays and weekends (source: author).
Energies 19 01727 g005
Figure 6. Relationship between global cost and annual primary energy consumption: Regression analysis and identification of optimal solutions (E1 and C1).
Energies 19 01727 g006
Figure 7. Pareto optimal solutions for global cost (C) and primary energy consumption (E), ranked by operational carbon emissions relative to UINSITU-based reference building.
Energies 19 01727 g007
Table 1. Comparison of regulatory U-value limits in TS 825 for Istanbul (3rd climatic zone) [5,6].
ComponentExternal WallRoof-CeilingFloorWindow
Regulatory Period2008/20242008/20242008/20242008/2024
U-value (W/(m2·K))0.60/0.400.40/0.300.60/0.352.40/1.80
Table 3. Technical specifications of the IR equipment used in the field surveys [61].
ParameterSpecification
Spectral range7.5–13 µm
Detector typeFocal plane array, uncooled microbolometer
Image frequency9 Hz
Accuracy±2.0 °C or ±2% of reading
Thermal sensitivityInfraCAM SD: 0.10 °C
Display3.5″ color LCD, 18-bit
Interpolated resolution240 × 240 pixels
Object temperature range−10 °C to +350 °C
Laser PointerSemiconductor AlGalnP diode, 1 mW, 635 nm
Operating temperature range−15 °C to +50 °C
Table 4. Input parameters and boundary conditions for building energy simulation.
CategoryParameterValue/Setting
Climatic DataLocationIstanbul (41°01′12.7″ N, 29°09′43.1″ E)
Climate zoneTS 825 3rd climatic zone [6]
Köppen Csa/Cfa (Mediterranean/Humid Subtropical) [56]
ASHRAE 3C (Warm-Marine) [67]
Climate data sourceTMY (2009–2023) based on Istanbul EPW file [66]
Heating degree day (HDD)1846 [66]
Cooling degree day (CDD)427 [66]
Annual average temp./RH15.2 °C/72% [66]
Max temp on design day32.6 °C [66]
Global solar radiation1503 kWh/m2 [66]
Building Geometry
and Envelope
Building typeMulti-story residential building
Orientation49° to North—South axis
Total conditioned area1617 m2
Apartment layout/total floor area4 + 1/165 m2
Floor-to-floor height2.90 m
Roof slope33% pitched
WWR29.4% NW, 21.3%SE, 24.5% NE and SW
U value of masonry wallsUCALC: 0.9 W/(m2·K)
U value of load bearing wallsUCALC: 3.20 W/(m2·K)
U value of roof/floorUCALC: 0.4 W/(m2·K)
U value of ground floorUCALC: 0.6 W/(m2·K)
U value of glazing systemUCALC: 2.4 W/(m2·K) (clear, double glazing)
Tvis of glazing82% [68]
SHGC of glazing78% [68]
Light reflectance of interior walls50%
Infiltration rate0.60 ach
Internal GainsLighting/equipment loads7 W/m2/4 W/m2
Occupancy density0.025 persons/m2
Metabolic rate0.86 met
Clothing level0.50 clo (summer), 1.0 clo (winter)
Building Service
Systems
Heating system type/CoPNatural gas combi boiler/0.90
Heating setpoint/setback22 °C/20 °C
Cooling system type/EERElectric split air conditioner/3
Cooling setpoint/setback25 °C/26 °C
Natural ventilation, air vent. rate10 L/s–person
Heating system operating hours06:00–00:00 (heating season)
Cooling system operating hours24/7 (cooling season, conditioned by occupancy)
Lighting system operating hours07:00–00:00 (daily, linked by room occupancy)
Table 5. Thermophysical properties, thickness, unit prices, and service life of external wall insulation scenarios [70,71].
Scenario NoInsulation
Material
Thickness
(cm)
Thermal
Conductivity (W/(m·K))
Uwall
(W/(m2·K))
Unit Price
($/m2)
Estimated Service Life (Years)
INS1EPS6 cm0.0340.3773.6225–50
INS28 cm0.3094.80
INS310 cm0.2616.00
INS412 cm0.2267.27
INS5XPS6 cm0.0350.3847.9835–50
INS68 cm0.31510.65
INS710 cm0.26714.64
INS812 cm0.23220.01
INS9Stone
wool
6 cm0.0390.41210.8030–60
INS108 cm0.34014.40
INS1110 cm0.29017.98
INS1212 cm0.25221.58
Table 6. Thermophysical, optical properties and unit prices of glazing scenarios [68].
Scenario
No
Double Pane CombinationGap FillingTvis
(%)
SHGC
(%)
Uglazing
(W/(m2·K))
Unit Price
($/m2)
Ref4 mm clear float + 12 mm gap + 4 mm clear floatAir82782.432.96
G14 mm low-e + 16 mm gap + 4 mm clear floatAir79 561.437.18
G2Argon79 561.142.25
G34 mm solar low-e + 16 mm gap + 4 mm clear floatAir72451.440.56
G4Argon72451.145.63
G56 mm solar low-e + 16 mm gap + 6 mm clear floatAir69401.457.46
G6Argon69401.162.54
G7Air69371.357.46
G8Argon69371.162.54
G9Air63431.457.46
G10Argon63431.162.54
G114 mm clear float + 16 mm gap + 4 mm temperable solar low-eAir79631.473.52
G12Argon79631.178.59
G136 mm temperable low-e + 16 mm gap + 6 mm clear floatAir72541.460.85
G14Argon72541.165.92
G156 mm temperable solar low-e + 16 mm gap + 6 mm clear floatAir58321.476.90
G16Argon58321.181.97
Table 7. Economic parameters used in the global cost analysis (2016–2025).
Parameter (Symbol)Value (Unit)Source
Inflation rate (Ri)29.74%FRED, CBRT [73,74]
Market interest rate (R) 20.33%CBRT, FRED [75,76]
Real interest rate (Rreal)−7.25%Calculated
Electricity escalation rate (ee)28.65%Calculated
Natural gas escalation rate (eg)36.87%Calculated
1 USD exchange rate ($)35.50 TRYCBRT [77]
Electricity unit price (Pe)2.97 kWh/TRYEMRA (tax included) [78]
Natural gas unit price (Pg)0.795 kWh/TRYİGDAŞ (tax included) [79]
Note: Energy prices reflect January 2025 residential tariffs: high-tier (>240 kWh/m) for electricity and standard tier (<100,000 m3/y) for natural gas.
Table 8. Thermal anomaly inspection points and building envelope junctions (Cross-referenced with Table 9).
Defect
Category
Building Envelope
Components (Code)
IR Camera Inspection Points on the Floor Plan
(Measurement Point ID, Ref. Table 9)
I
(Masonry wall)
I-AMasonry wallEnergies 19 01727 i003
I-BWall/wall corner
I-CWall/ground
II
(RC structural frame)
II-AColumn/beam
II-B1Intermediate floor
II-B2Cantilevered floor
II-B3Balcony floor slab
II-B4Roof slab
II-CBasement shear wall
III
(Fenestration)
III-AWindow
III-BDoor
IR camera inspection points on the building elevations (Measurement point ID, Ref.  Table 9)
Energies 19 01727 i004
Table 9. UINSITU and TI values for the case study building’s envelope, with reference and defect points for thermal failure in each IR image.
Ref. ID/
Location
ThermogramPhotographEnvironmental
Conditions
Defect Category
(Ref. Table 8)
UINSITU
(W/(m2·K))
TI
(Unitless)
IndoorOutdoor
1
SW Bedroom
Energies 19 01727 i005Energies 19 01727 i006Tin: 20.1 °C
RHin: 58%
vin: 0.15 m/s
Tout: 13.6 °C
RHout: 77%
vout: 1 m/s
Reference (I-A)1.300.83
Thermal bridge (II-A)4.550.58
2
NE Bedroom
Energies 19 01727 i007Energies 19 01727 i008Tin: 17.2 °C
RHin: 61%
vin: 0.2 m/s
Tout: 8.0 °C
RHout: 82%
vout: 1.5 m/s
Reference (I-A)2.710.35
Surface condensation (I-B)6.340.82
3
NW
Façade
Energies 19 01727 i009Energies 19 01727 i010Tin: 18.8 °C
RHin: 52%
vin: 0.15 m/s
Tout: 6.5 °C
RHout: 74%
vout: 1.5 m/s
Reference (I-A)1.500.86
Thermal bridge (II-B1)3.610.67
4
NE
Façade
Energies 19 01727 i011Energies 19 01727 i012Tin: 17.4 °C
RHin: 61%
vin: 0.2 m/s
Tout: 8.0 °C
RHout: 77%
vout: 1.4 m/s
Reference (I-A)1.160.88
Thermal bridge (II-B2)3.720.63
5
NE-SE
Corner
Energies 19 01727 i013Energies 19 01727 i014Tin: 17.4 °C
RHin: 48%
vin: 0.15 m/s
Tout: 6.2 °C
RHout: 71%
vout: 1.6 m/s
Reference (I-A)1.150.89
Thermal bridge (II-B2)4.030.62
6
NE
Façade
Energies 19 01727 i015Energies 19 01727 i016Tin: 17.8 °C
RHin: 56%
vin: 0.15 m/s
Tout: 7.0 °C
RHout: 80%
vout: 1.5 m/s
Reference (I-A)2.100.79
Thermal bridge (II-B3)3.420.67
7
SE
Façade
Energies 19 01727 i017Energies 19 01727 i018Tin: 18.1 °C
RHin: 53%
vin: 0.1 m/s
Tout: 6.6 °C
RHout: 74%
vout: 1.5 m/s
Reference (I-A)1.340.87
Thermal bridge (II-B1)3.410.67
Air leakage (III-A)2.330.77
8
SW
Kitchen
Energies 19 01727 i019Energies 19 01727 i020Tin: 18.2 °C
RHin: 56%
vin: 0.2 m/s
Tout: 8.1 °C
RHout: 83%
vout: 1.5 m/s
Reference (I-A)3.650.52
Warm air leakage (III-B)5.940.23
Table 10. Comparative analysis of Pareto-optimal solutions: Improvement rates (%) in energy and cost metrics relative to UINSITU-based reference building.
Retrofit OptionImprovement Rate (%)
Scenario
No
Thermal
İnsulation
GlazingHeating
Energy
Cooling
Energy
Lighting
Energy
Carbon
Emissions
Primary
Energy
Global
Cost
E1-C2INS4G1265.719.92.750.953.051.3
E2INS8G1265.419.92.750.752.848.4
E3-C1INS4G263.829.02.750.452.251.9
E4-C8INS8G263.628.92.750.252.049.0
E5INS12G1264.419.92.750.052.047.2
E6-C9INS4G1463.431.11.550.051.848.7
E7INS8G1463.131.11.549.851.645.8
E8-C5INS4G1263.819.72.249.551.549.9
E9INS7G1263.619.82.249.351.247.8
E10INS12G262.528.82.749.451.247.8
C7INS4G1163.021.52.749.151.049.4
C3INS3G262.028.72.248.950.750.5
C6INS4G460.741.81.548.950.649.5
C4INS4G161.130.22.748.450.250.0
C10INS3G159.229.92.246.948.648.6
Note: A conditional formatting color gradient (red-to-green) is applied to the improvement rates; green represents the most significant improvements, while red signifies the least significant improvements.
Disclaimer/Publisher’s Note: The statements, opinions and data contained in all publications are solely those of the individual author(s) and contributor(s) and not of MDPI and/or the editor(s). MDPI and/or the editor(s) disclaim responsibility for any injury to people or property resulting from any ideas, methods, instructions or products referred to in the content.