Non-Linear Method of Vehicle Pre-Crash Velocity Estimation Based on Random Forest Regression and Energy Equivalent Speed for Compact Vehicle Class

 ,
,  , ,
, ,  , , and
Abstract
1. Introduction
Novel Methods of Accident Reconstruction
- Non-Linear Energetic Methods: These techniques utilize non-linear functions based on the average deformation coefficient (Cs) and mass (often accompanied with deformation zone width Lt) to calculate deformation work and, consequently, pre-crash speed. For example, the application of tensor B-spline products with probabilistic weights offers significant accuracy enhancement, reducing pre-crash velocity determination error to as low as 5.2–8% [12,13,18], yielding a substantial improvement over linear approaches.
- Machine Learning (ML) Approaches: Sophisticated algorithms are employed to estimate pre-crash speed or ΔV [9,10,11,19]. Artificial neural networks (ANNs), specifically a multilayer perceptron (MLP), have been applied to frontal crash data (based on mass and deformation coefficient Cs) to estimate EES, demonstrating improvements over linear approaches, achieving a mean relative error of approximately 9%. Genetic Algorithm Model Adjustment (GAMA) [8] was also successfully utilized to optimize models defining the relationship between pre-crash velocity, mass, and deformation characteristics, yielding average relative errors around 8%.
- Image-Based Deep Learning (DL): For estimating crash characteristics directly from post-collision images, Deep Convolutional Neural Networks (CNNs) are utilized in some papers. These models learn deformation patterns to predict metrics such as ΔV (see [20]) and classify the Location of Collision (LOC), a method which offers a promising approach without requiring expensive forensic reconstruction. Video-based approaches for speed measurement utilizing deep learning also started to emerge recently [21], combining YOLO for real-time detection with Long Short-Term Memory (LSTM) networks. Their practical usefulness in crash reconstruction remains to be seen, as video material from an appropriate perspective is infrequently available.
- Simulation-Based Modeling: To efficiently compute collision severity parameters, time-discrete simulation tools (like impactEES [17]) use 2D vehicle substitute models derived from 3D EES models and fundamentals of mechanical impact calculation, enabling rapid calculation along with comparison against real crash-test data.
- Vision-Based Monocular Methods: Monocular camera systems, a cost-efficient alternative to range sensors, traditionally use homographies to map the road plane to a Bird’s Eye View (BEV) or rely on measuring displacement between virtual intrusion lines [22]. However, these methods can suffer from the Projection Displacement Difference (PDD) problem, where above-plane features (like license plates) are incorrectly mapped to the ground plane, leading to speed overestimation. A motion plane-based approach proposed in [23] addresses this by using the license plate center as a reference point and estimating the hypothetical plane on which it moves via a Shape-from-Template (SfT) technique, thereby mitigating PDD and significantly reducing the need for camera calibration. These techniques have not been widely utilized in accident analysis yet. Nevertheless, with growing access to data collected just prior to the accident, said methods also indicate an interesting direction of research.
- For risk injury assessment, it has been proven that impact-related variables are of greater significance than the vehicle-related features [24]. The results obtained by the authors in both [24,25] indicate that pre-crash speed estimation techniques are not the only possible way to utilize the impact data—this information can also be utilized to reduce the risks related to vehicle operation in general.
- In ref. [26], the authors utilize driver input data (such as braking, steering wheel usage, etc.) for predicting a binary variable indicating whether the driver participated in an accident.
- The authors of [27,28] use ensemble methods (the first one uses simpler techniques, and the latter uses a rather sophisticated attention-based transformer accompanied with a conformer) to predict the likelihood of a crash based on the infrastructure-based detector data. The initial limitations of the low coverage from such data are alleviated via the connected vehicle trajectory data discussed in [28].
- Lastly, the neat article by Wu, Meng and Song [29] provides a nice exposition of prediction of the number of crashes in various regions of China utilizing (among others) ensemble methods for CART trees for prediction and selection of the most influential variables.
2. Materials and Methods
2.1. Dataset Description
2.2. Measuring the Average Deformation Coefficient
2.3. From Decision Trees to Random Forests
2.4. Hyperparameter Choice
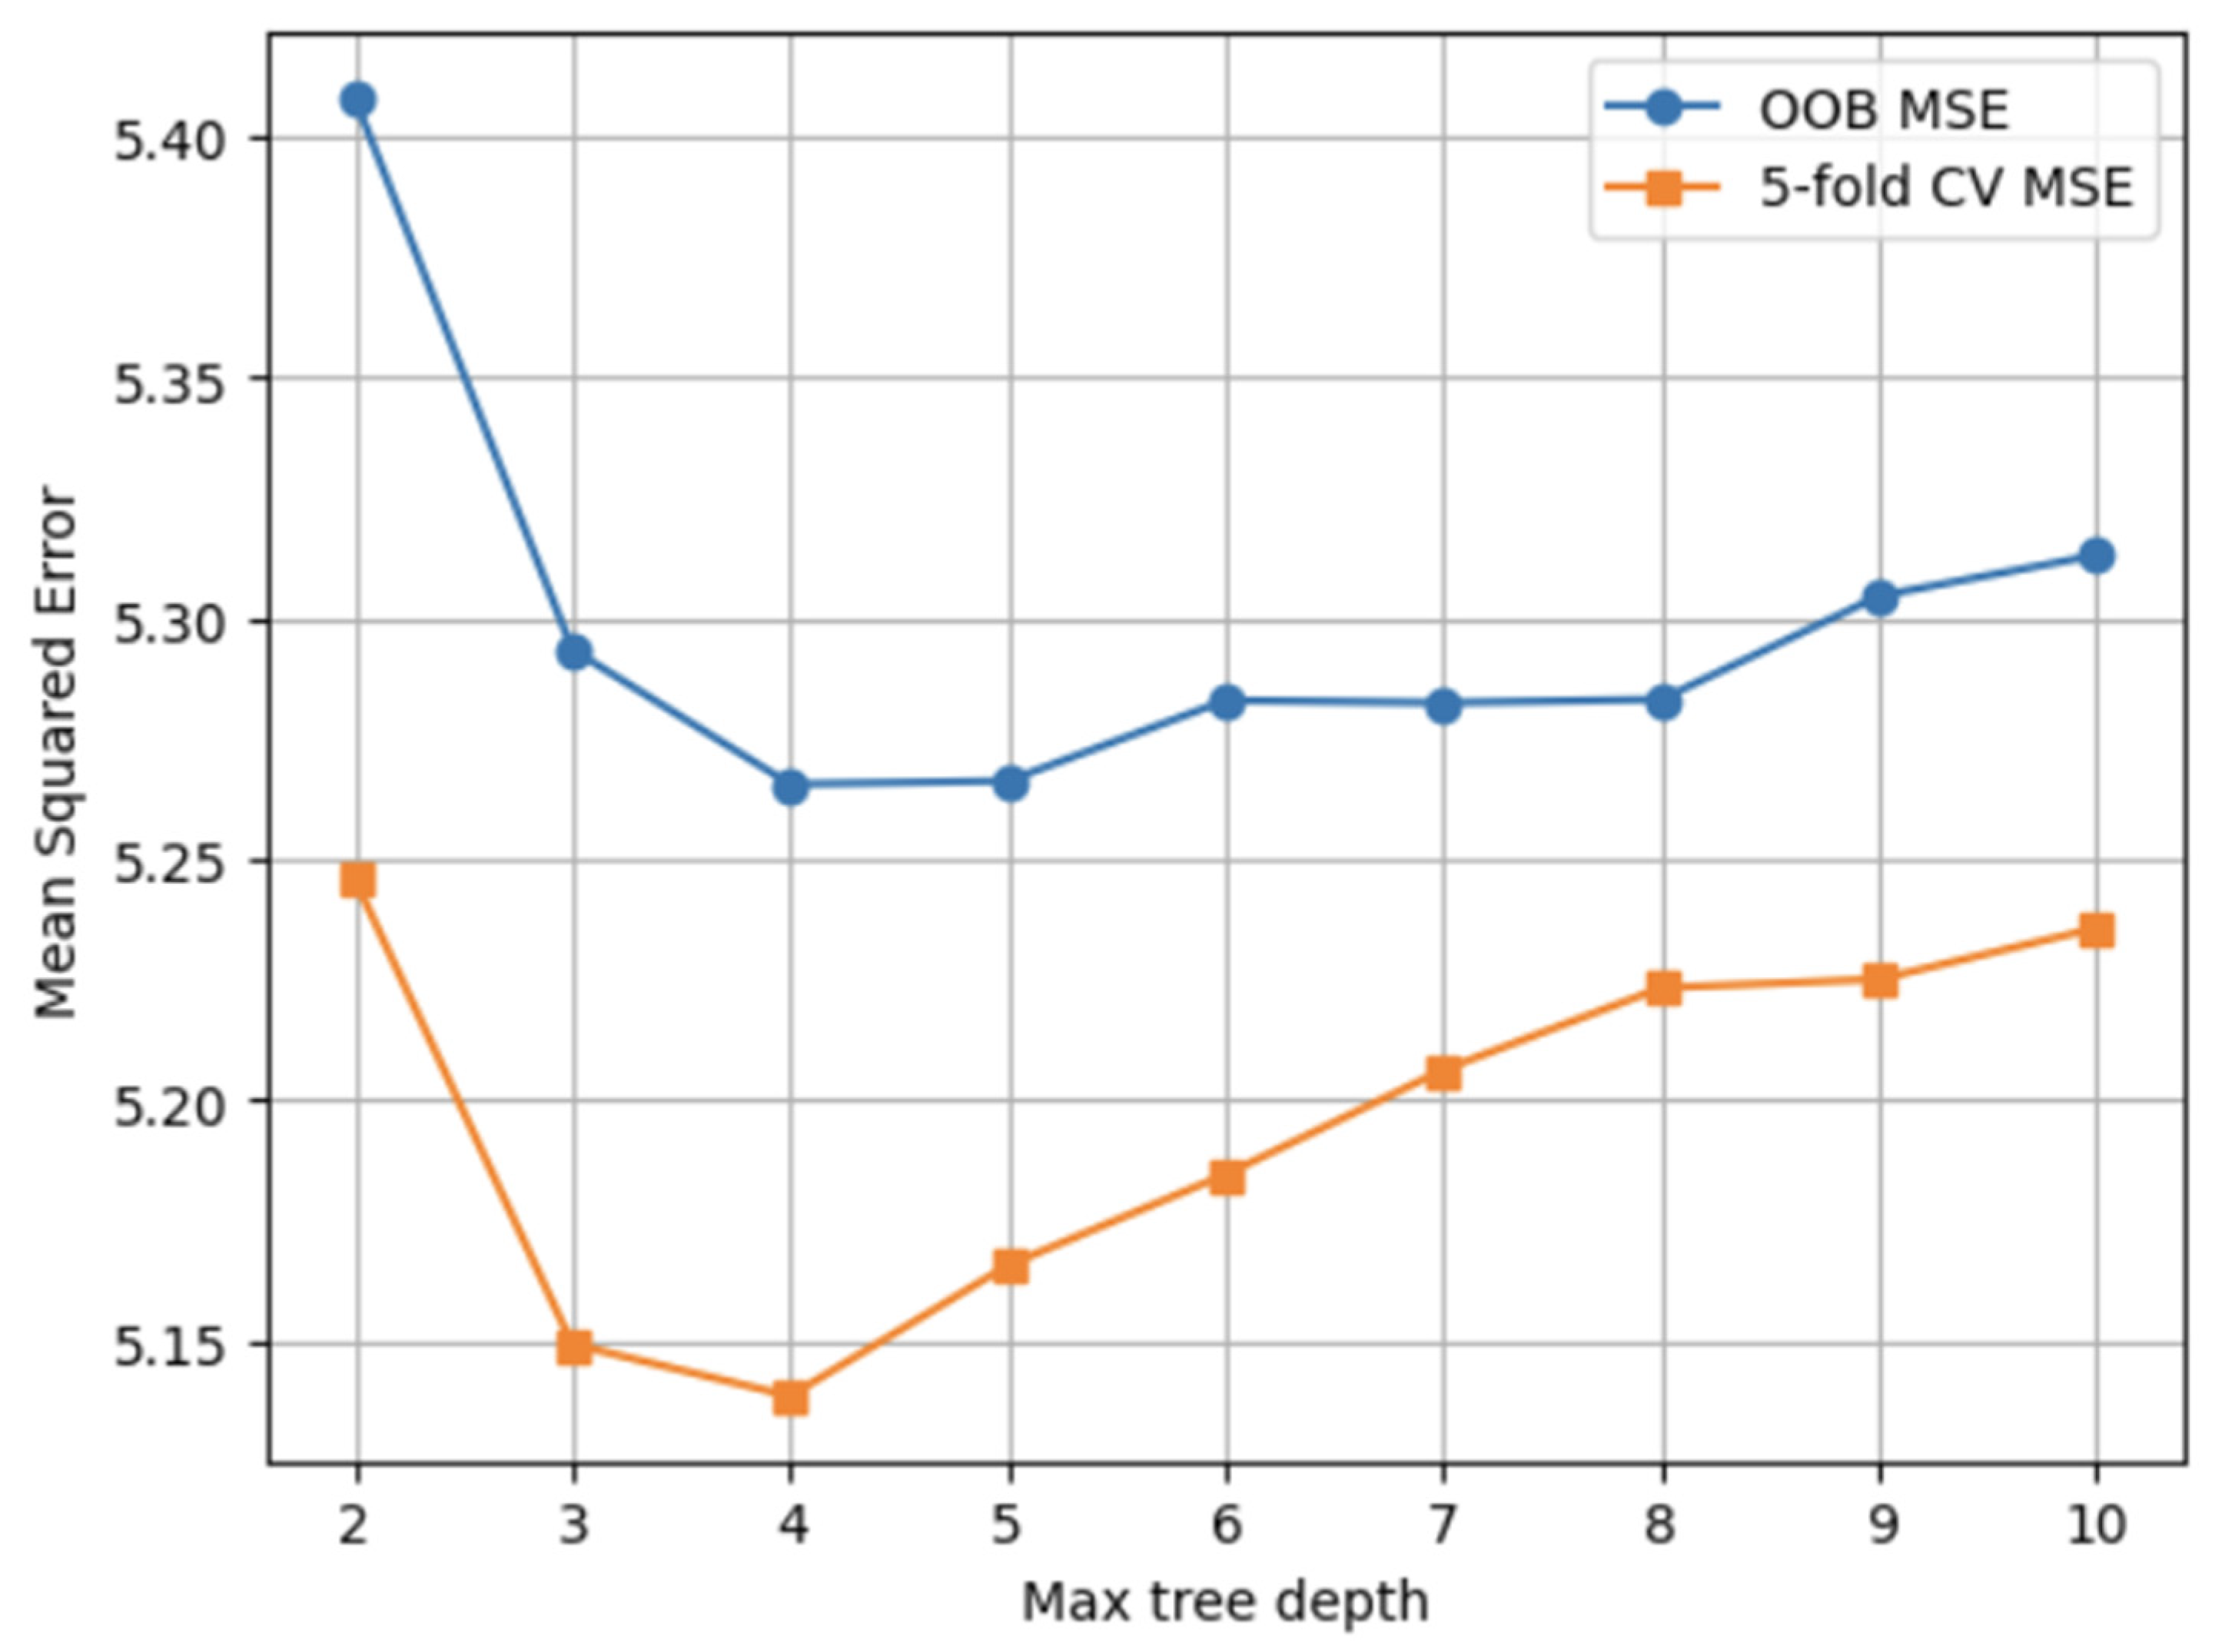
- Maximal depth of a single tree, ranging from 4 to 20.
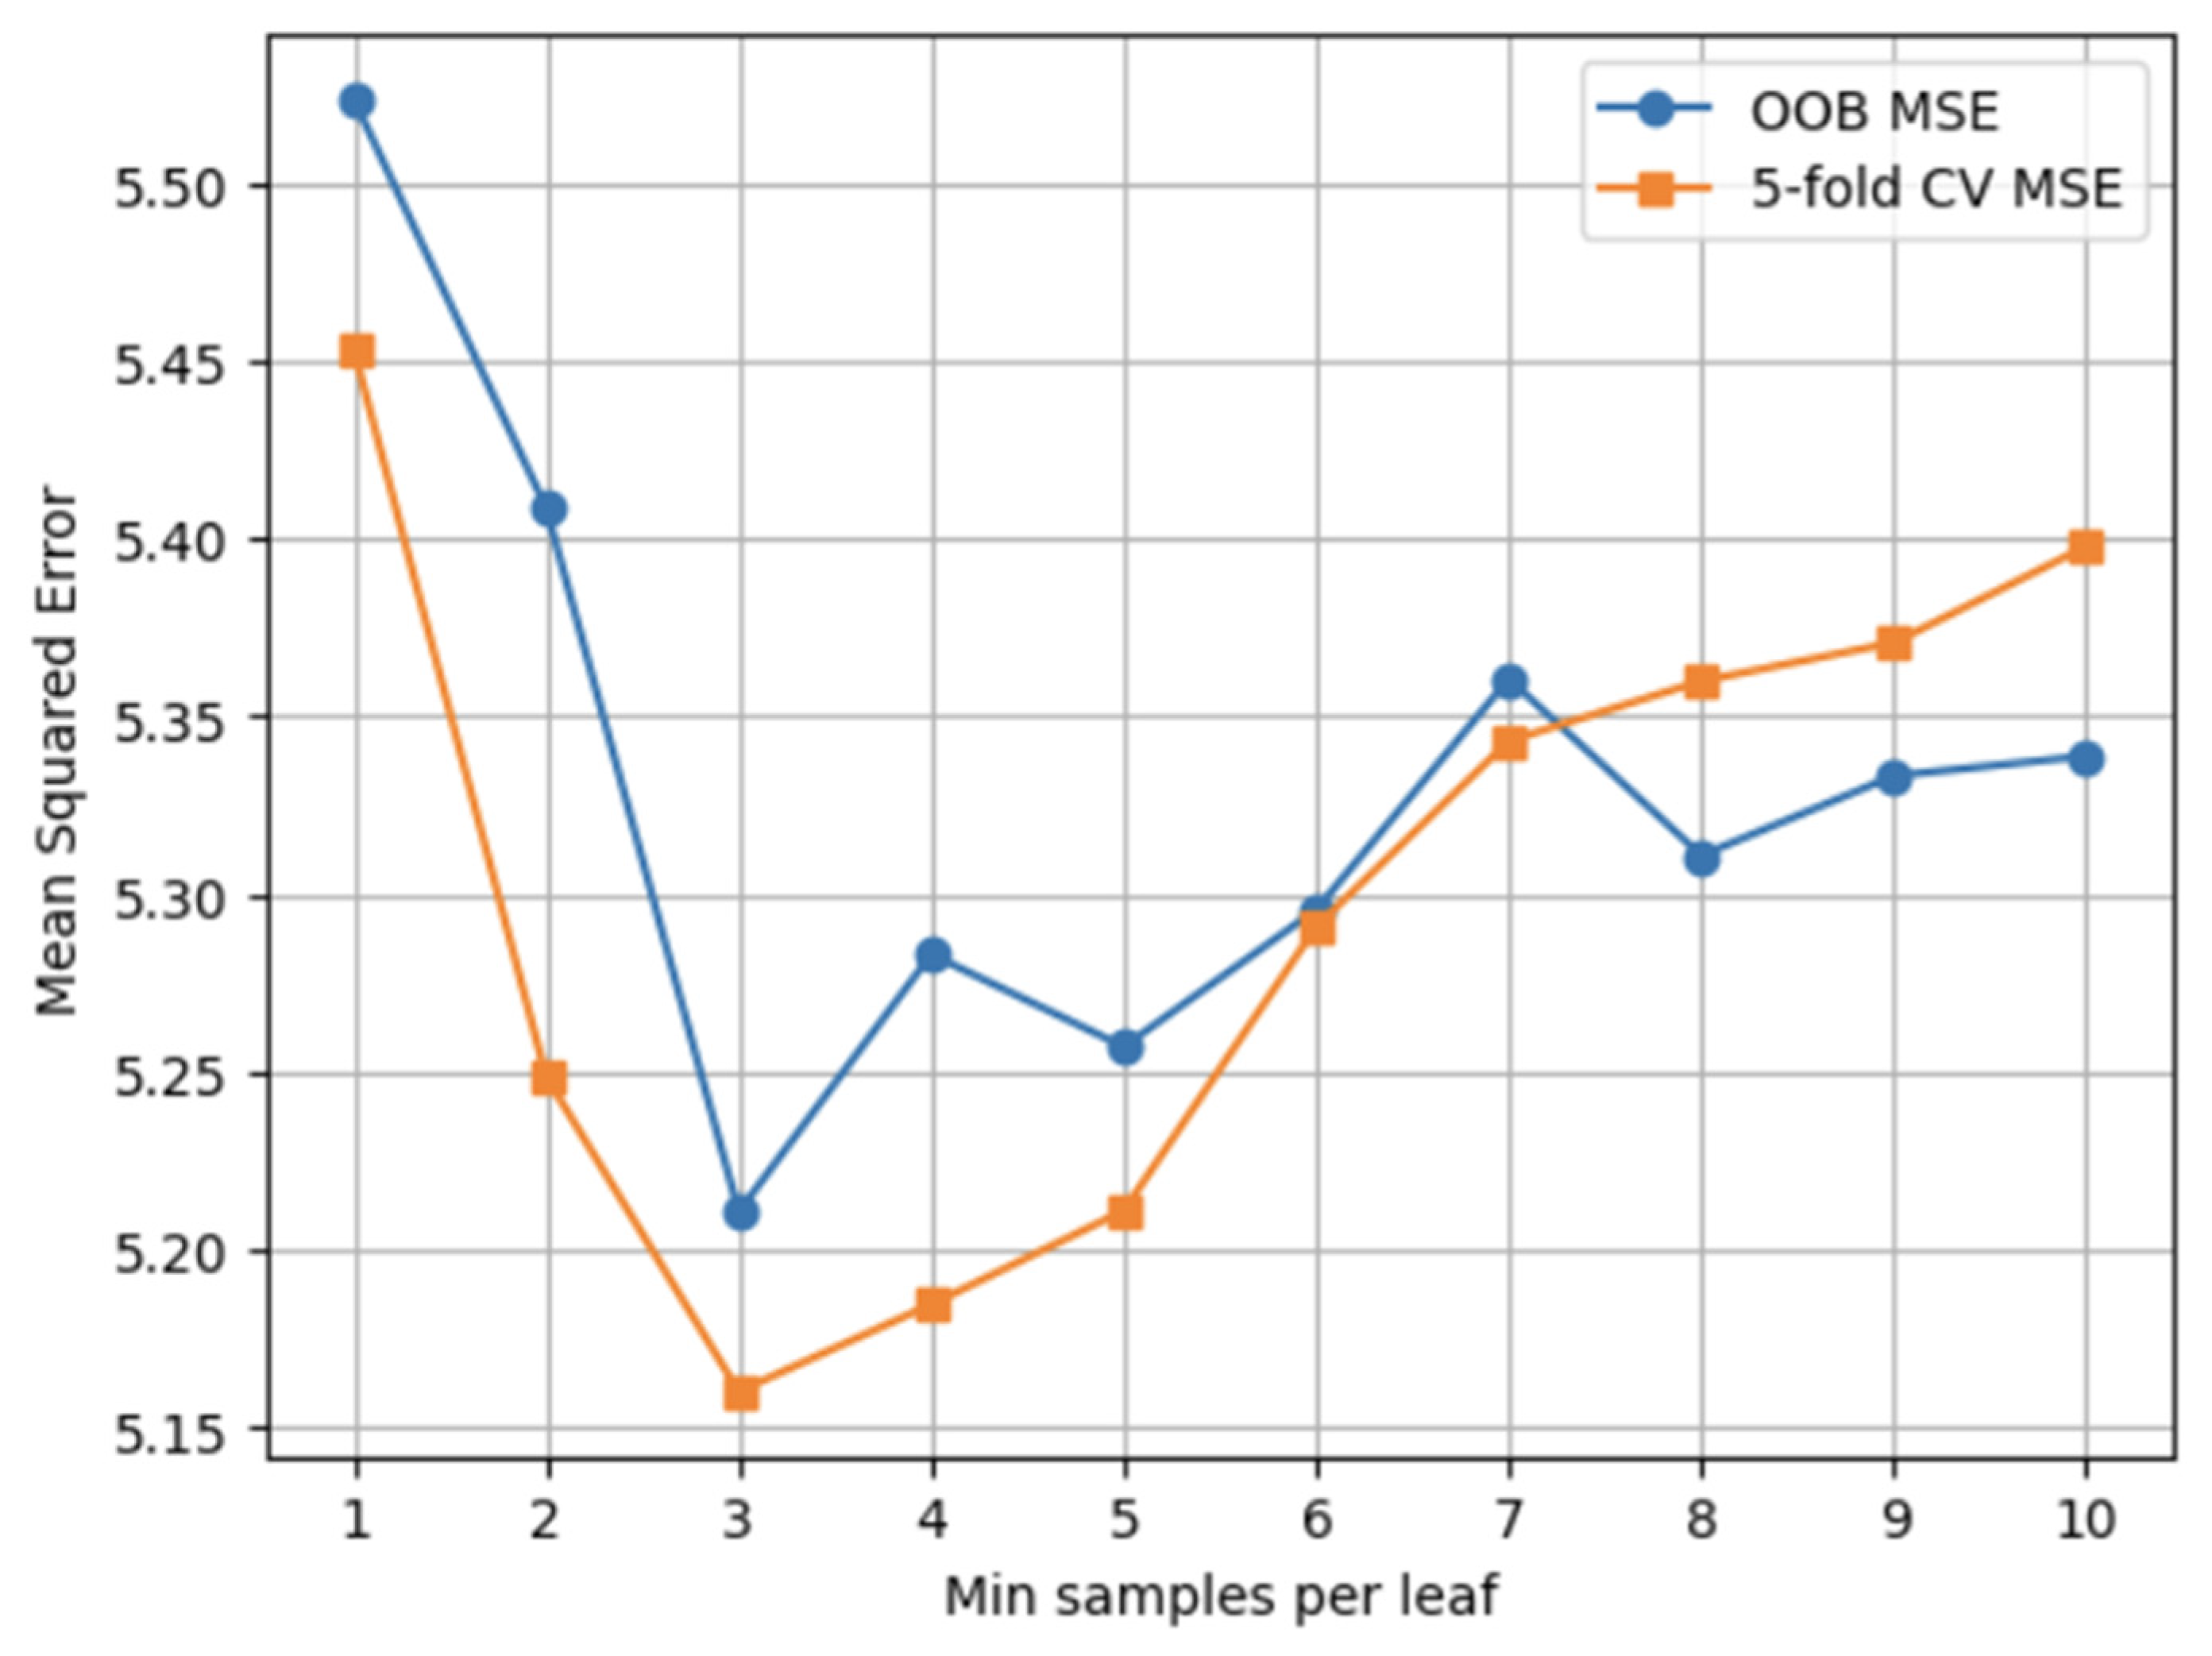
- Minimal number of samples in the leaf, ranging between 1 and 10.
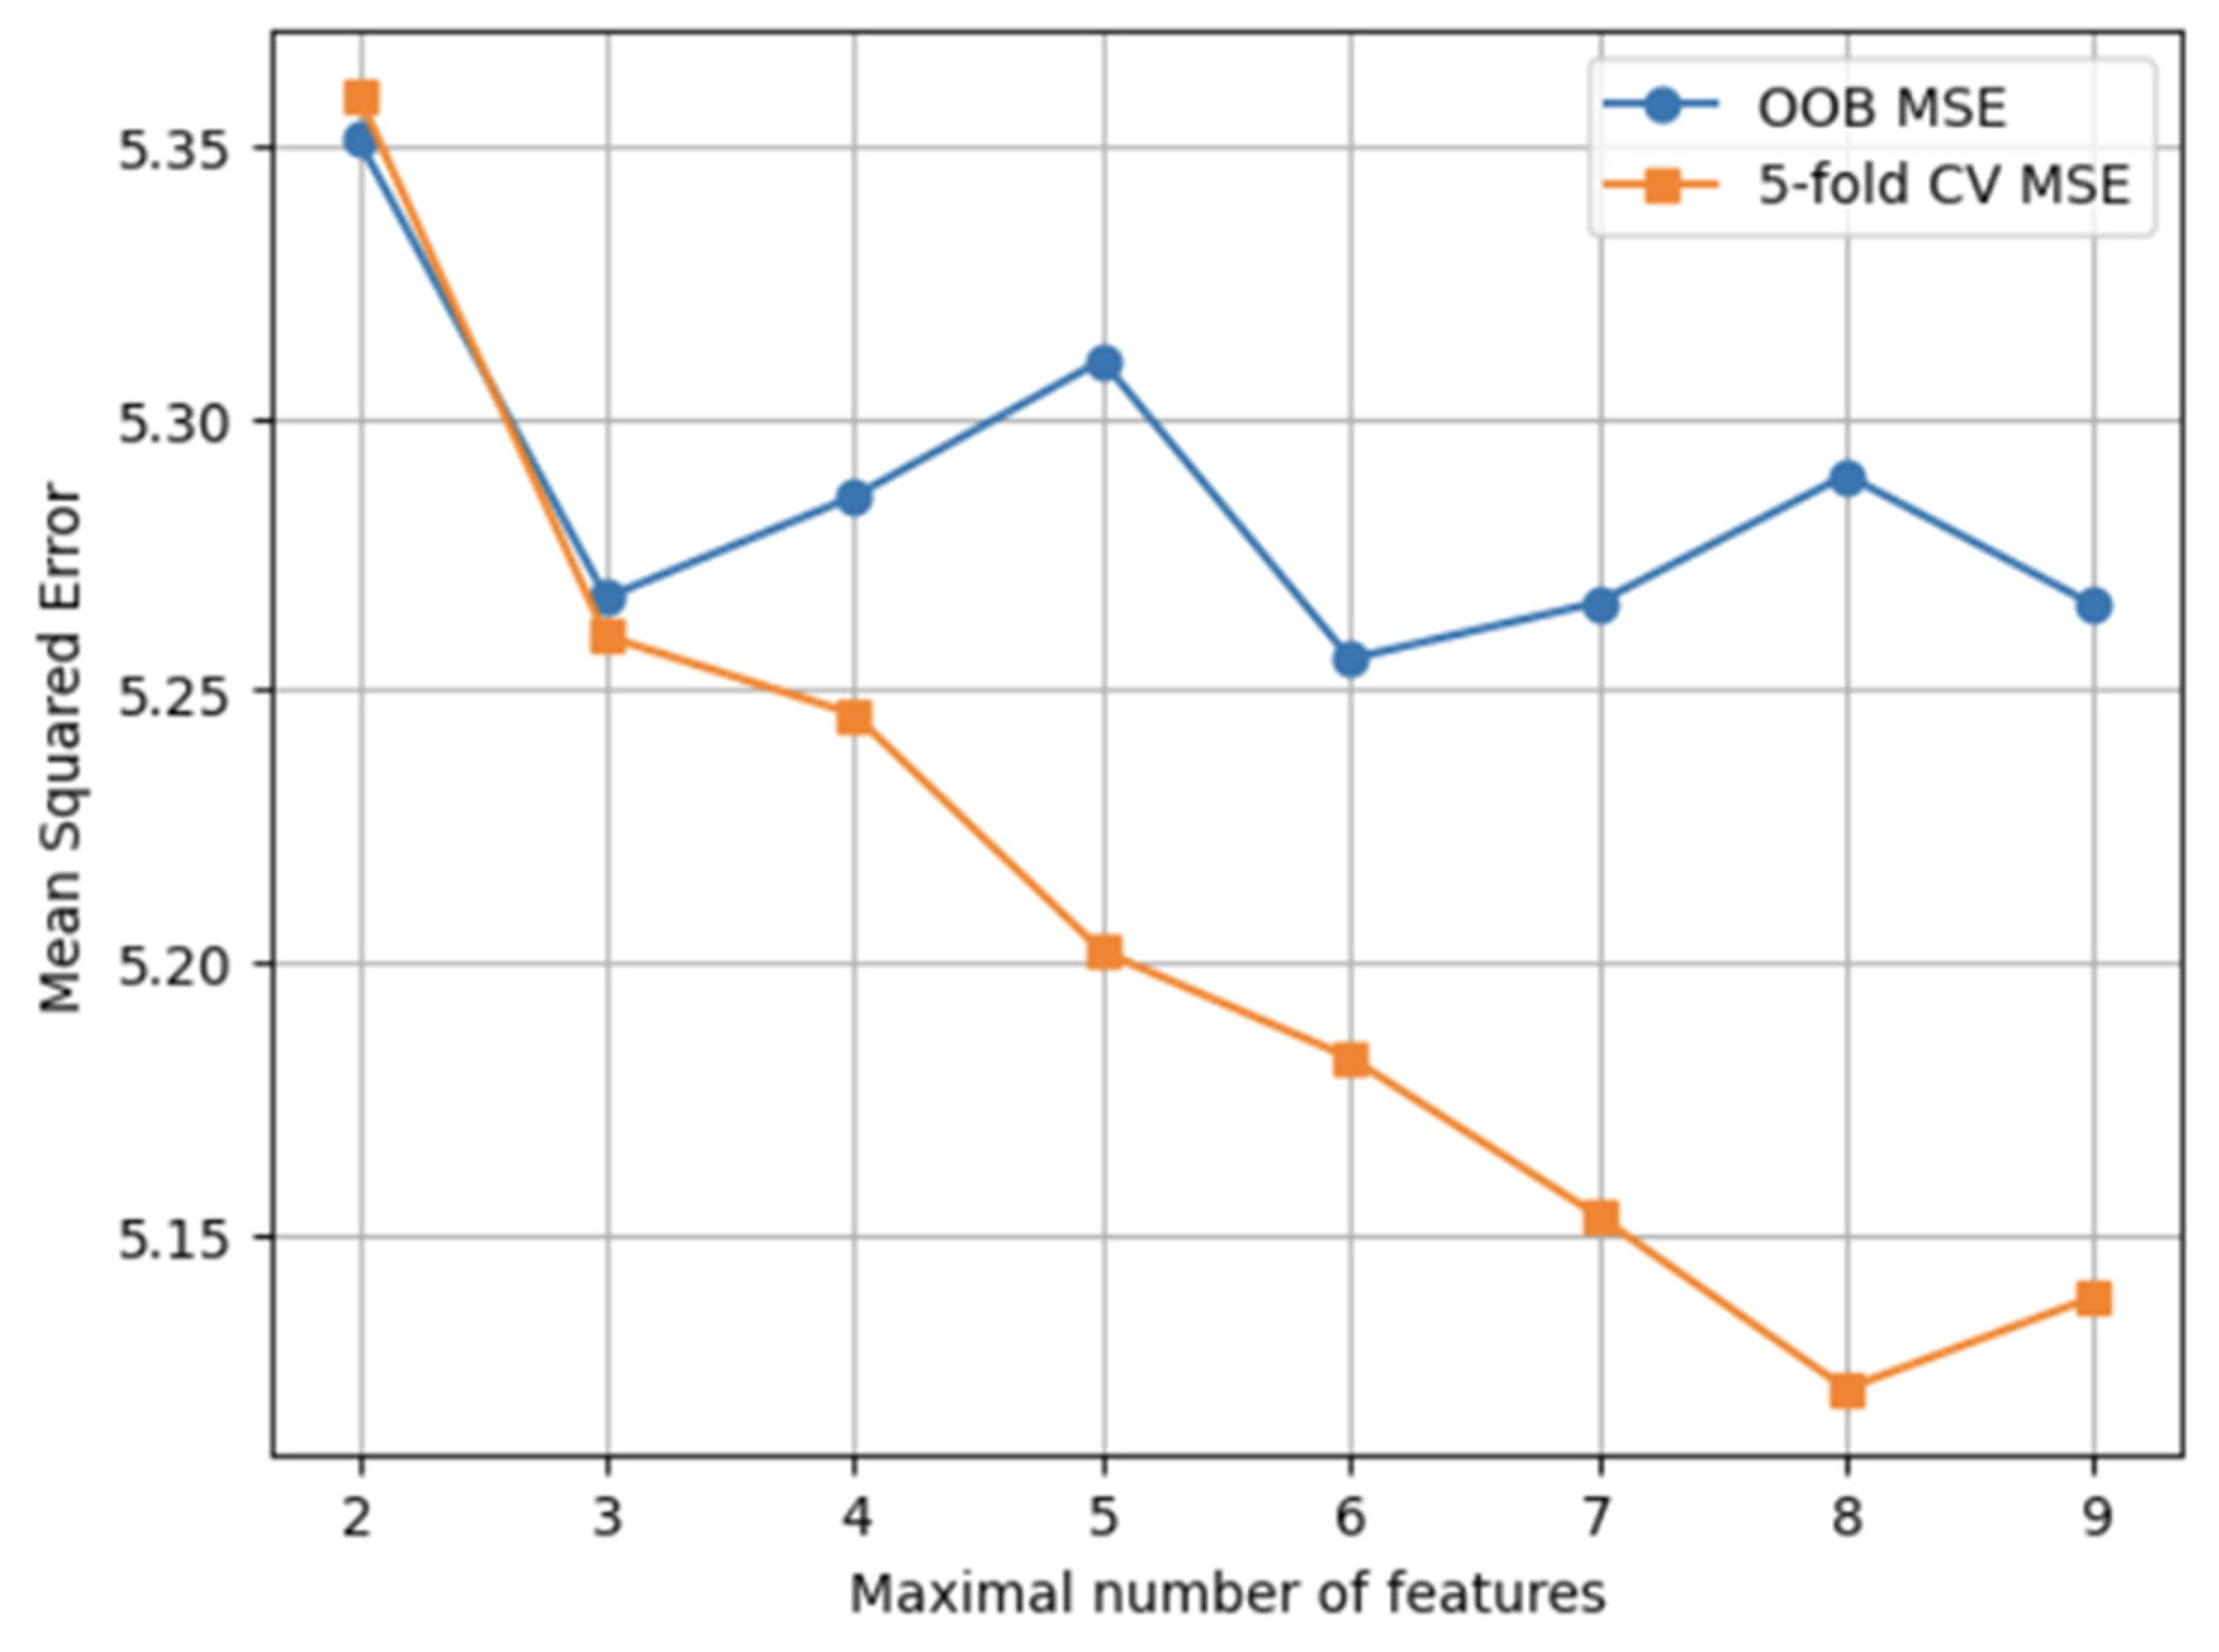
- Maximal number of features, ranging from 2 to 9 (number of columns).
- Minimal number of samples required to split a node, ranging from 2 to 20.
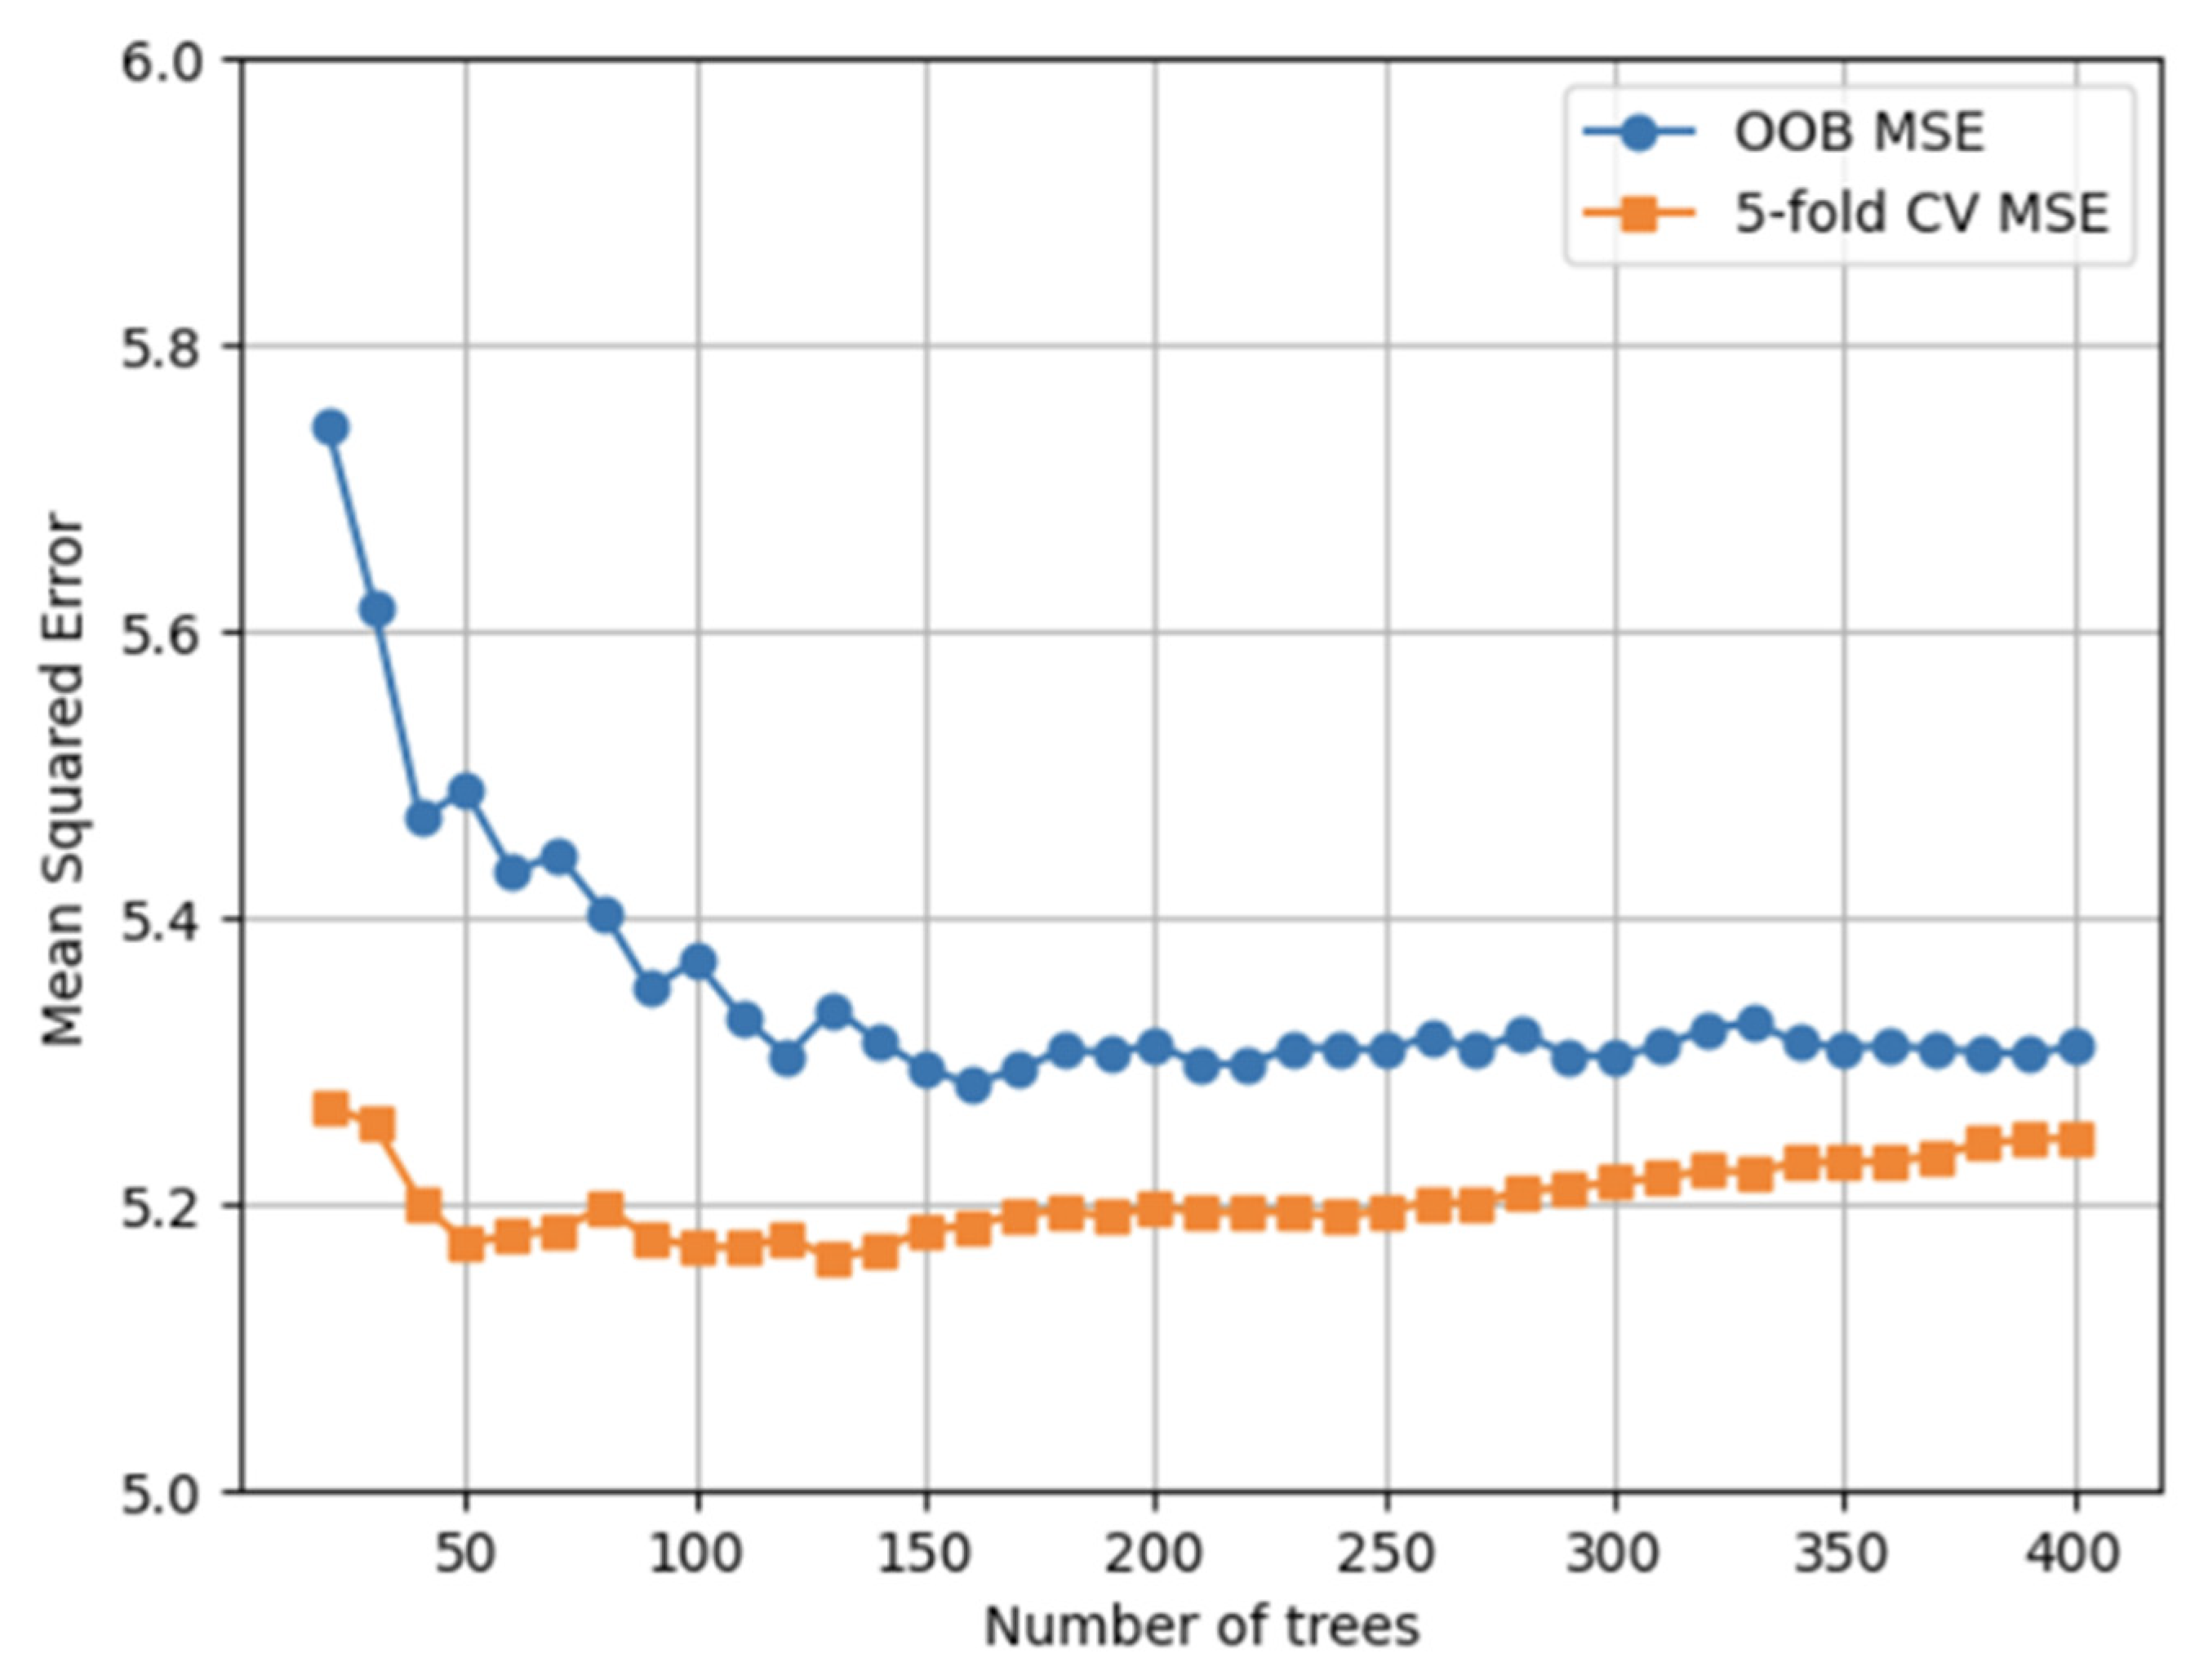
- Number of trees, between 20 and 400, with step 10.
- Maximal depth = 6;
- Minimal leaf = 1;
- Maximum number of features = 9;
- Minimal samples for split = 4;
- 160 trees.
2.5. Software
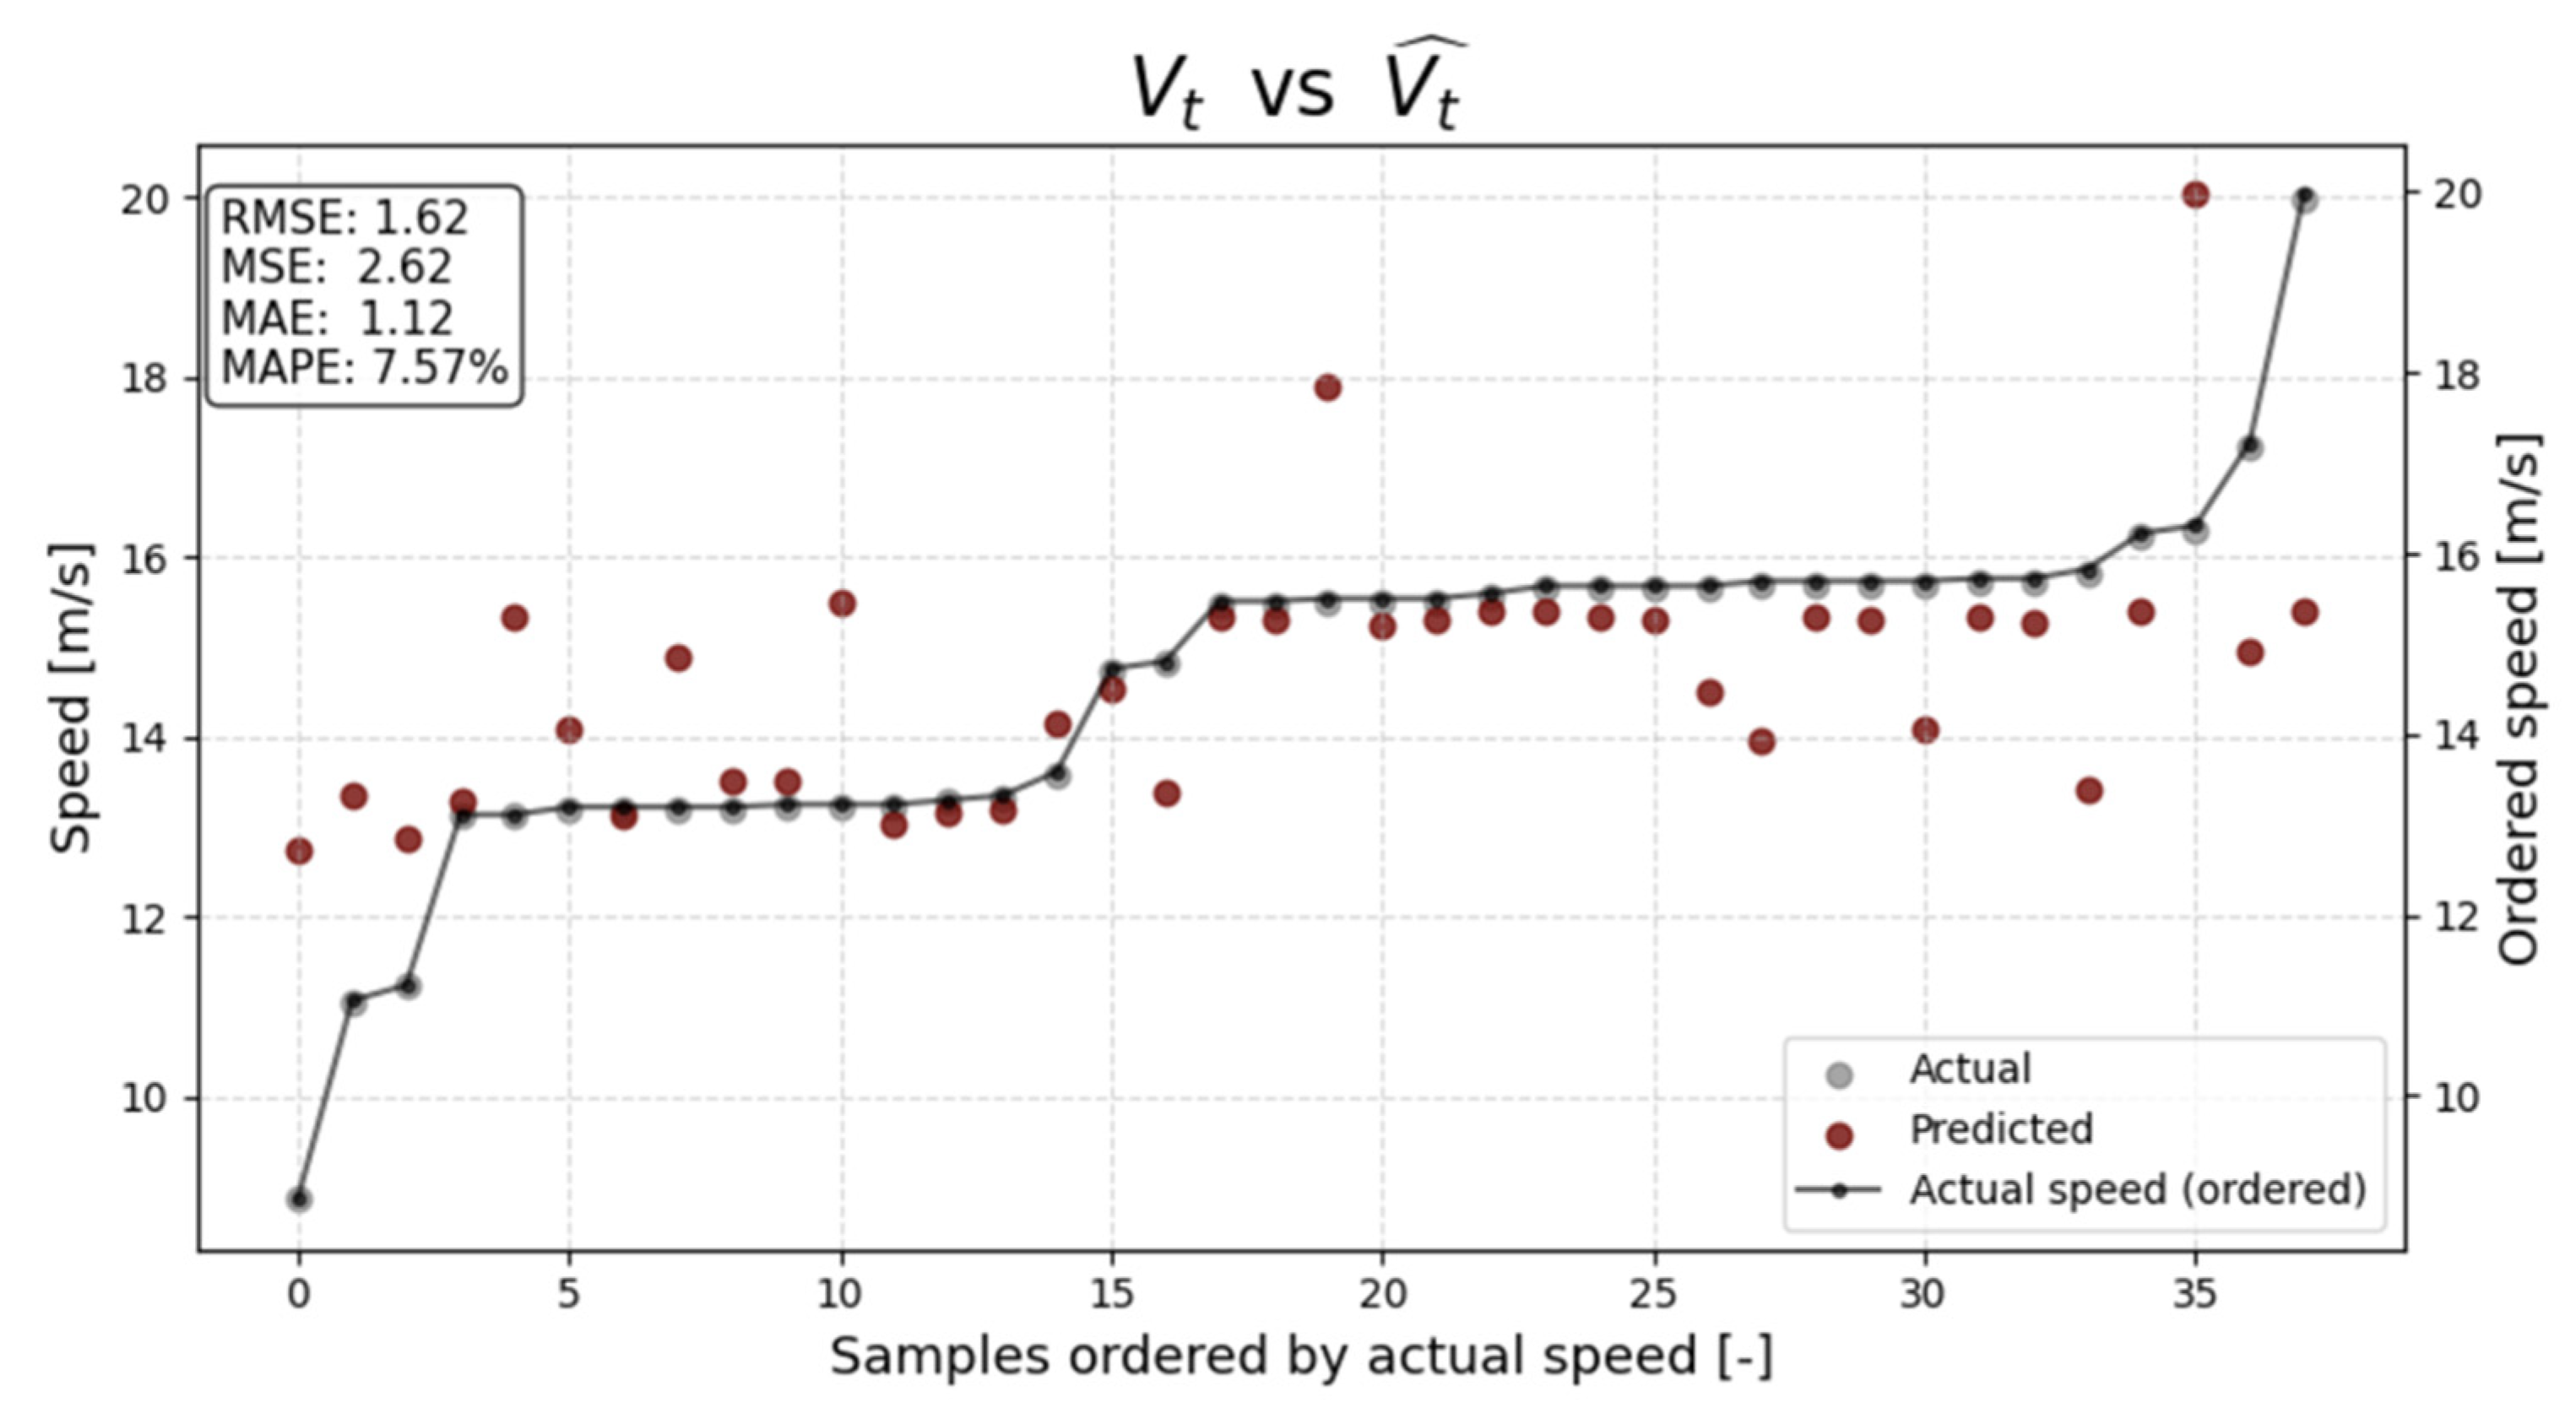
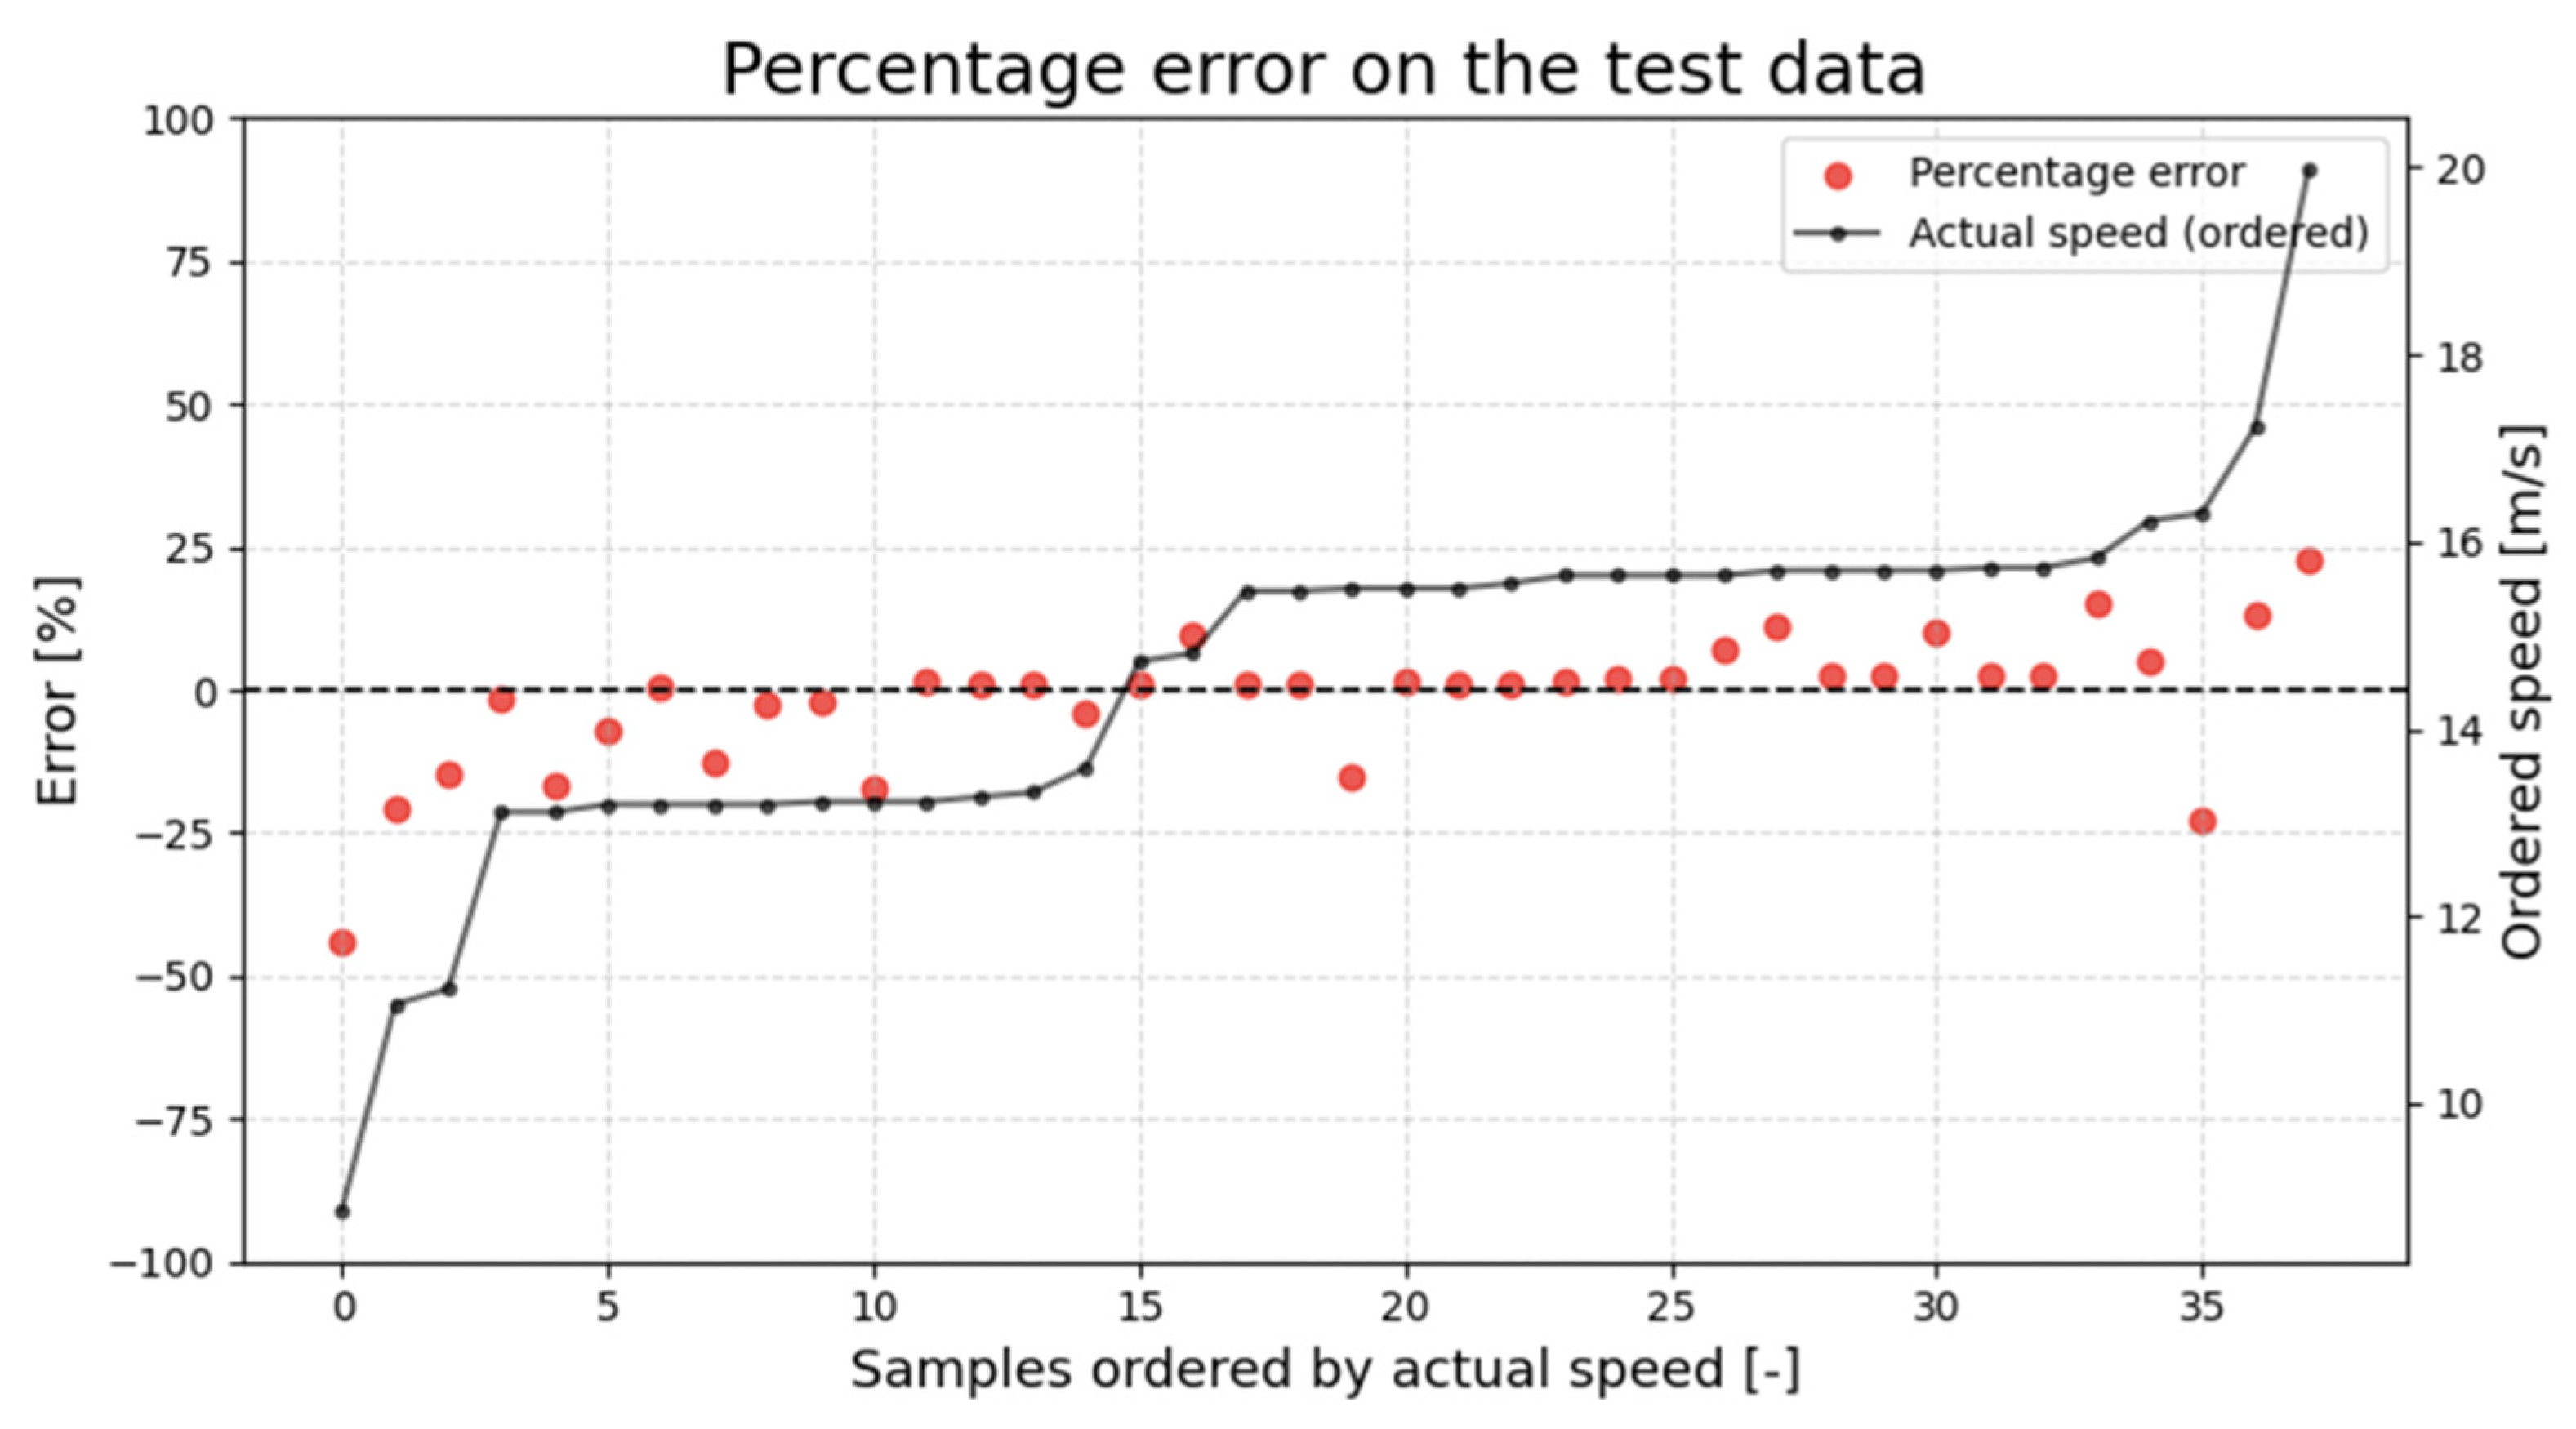
3. Results
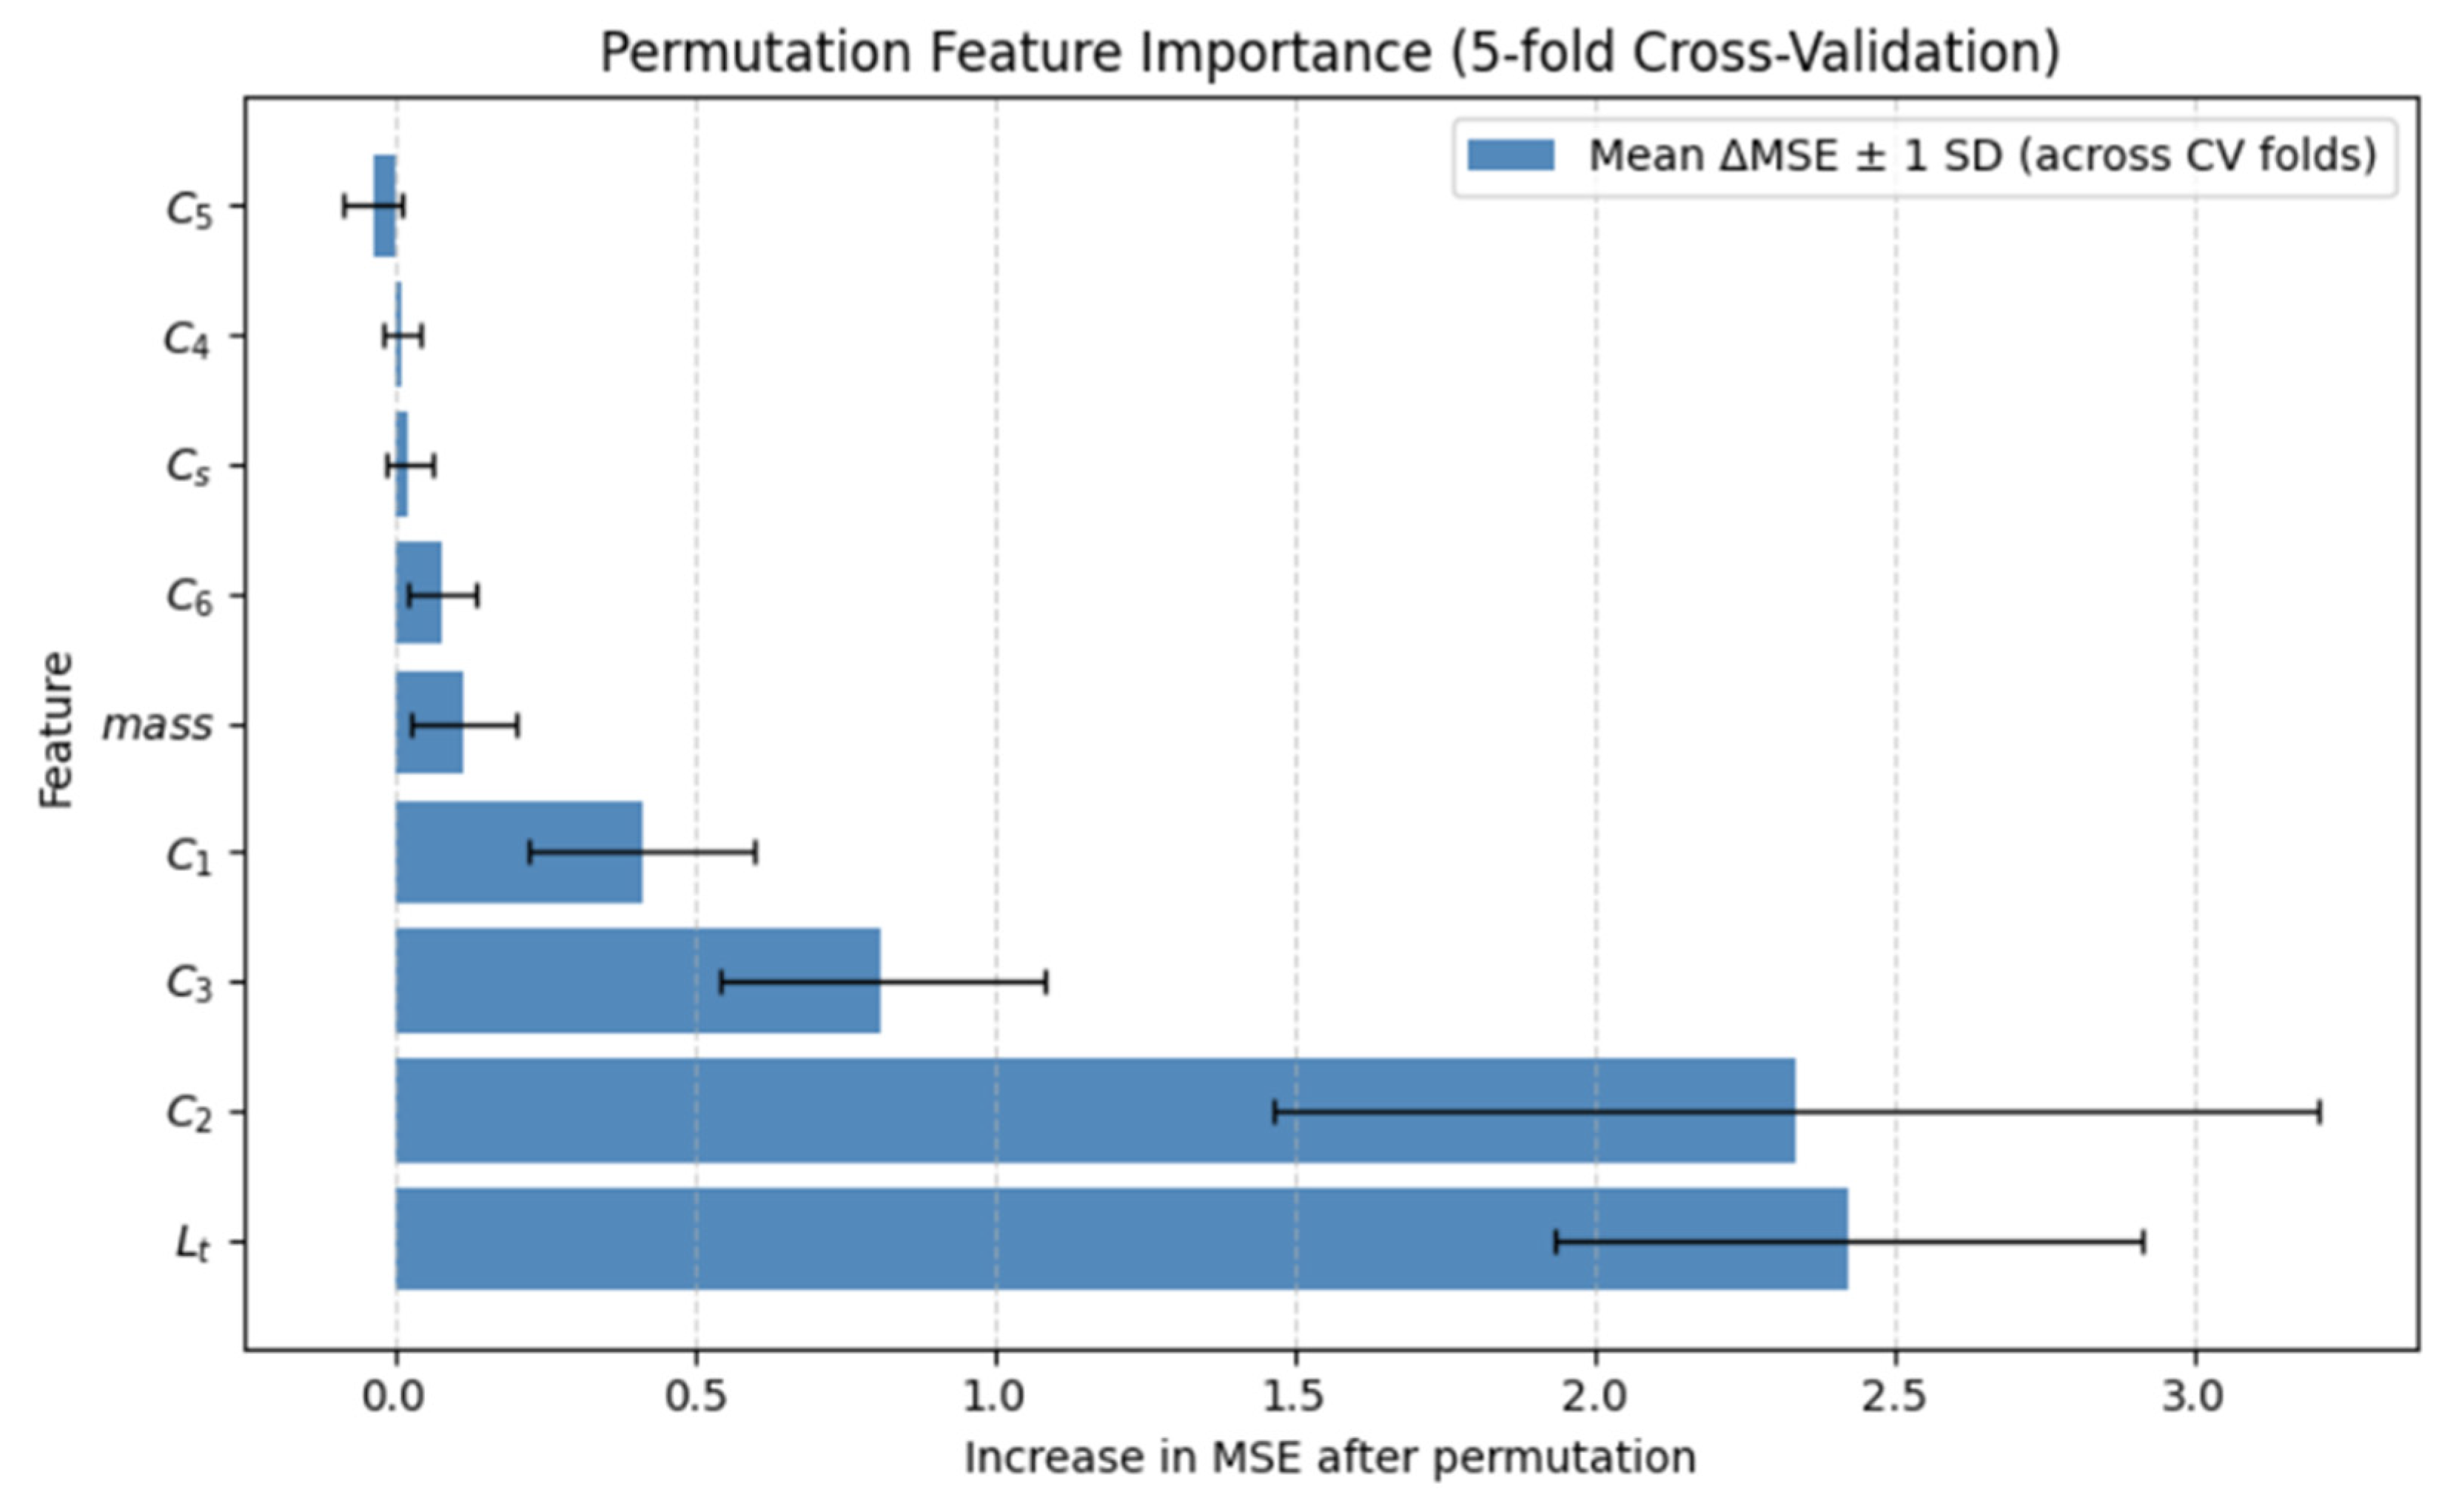
3.1. Sensitivity Analysis
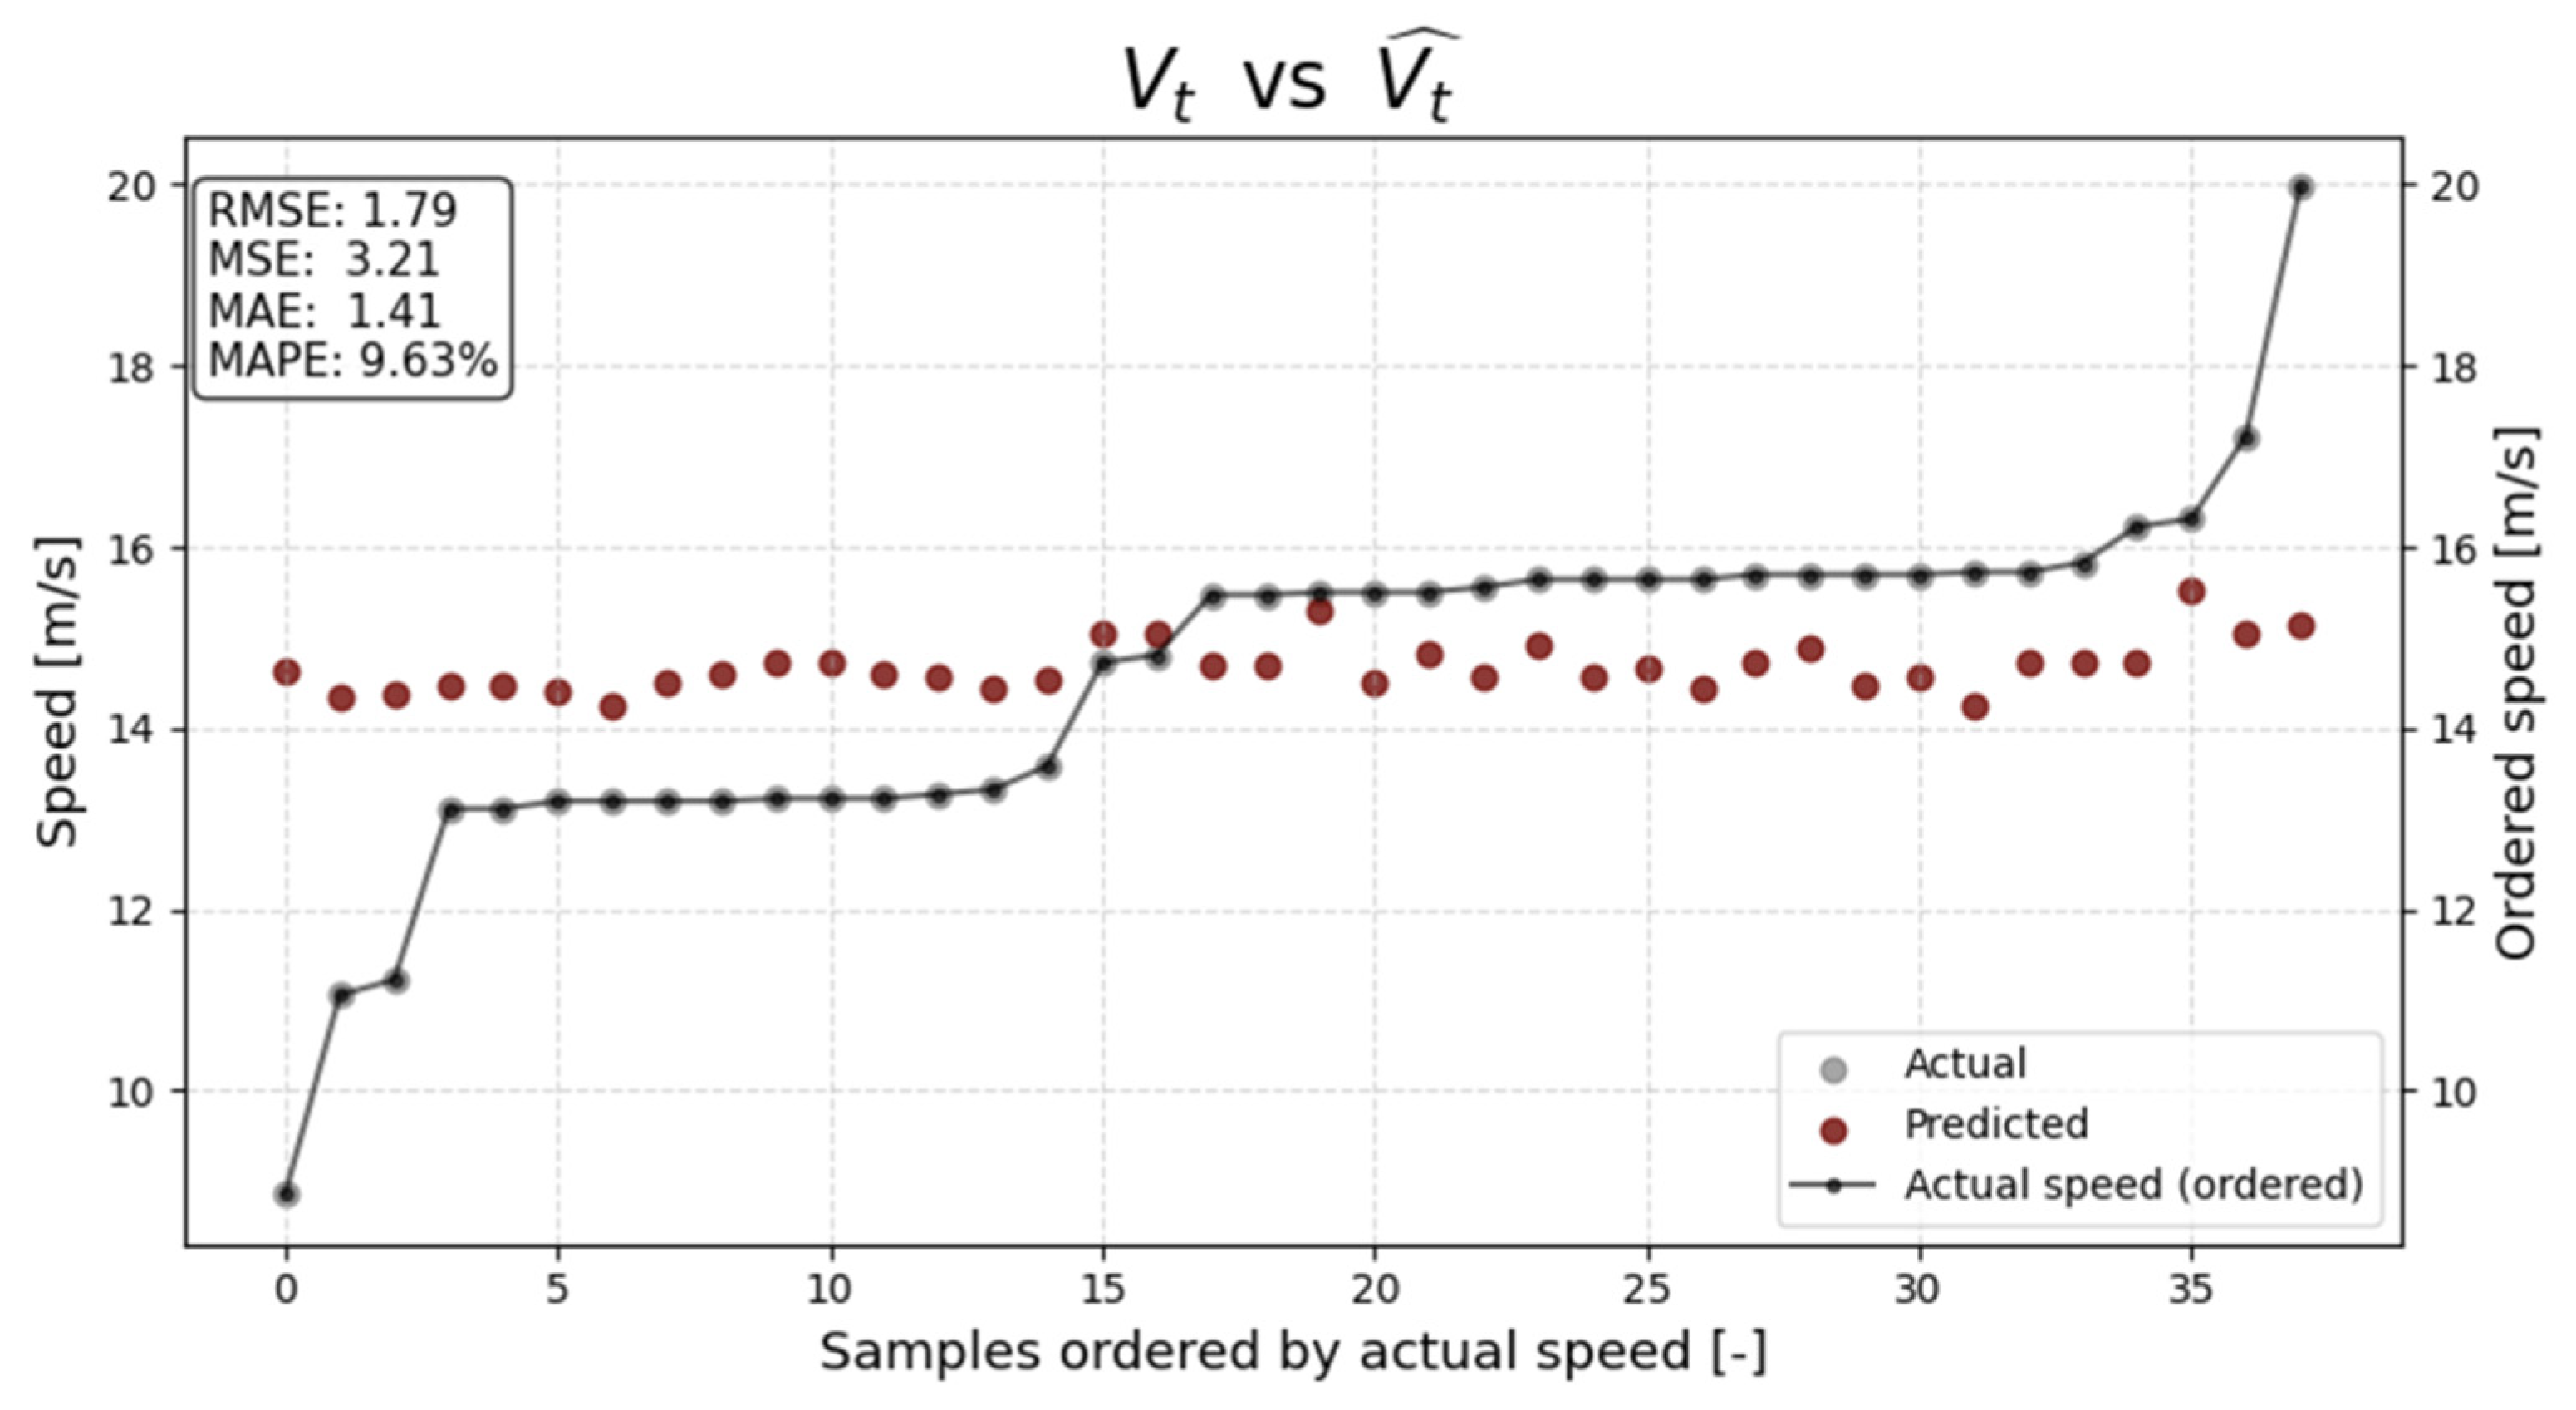
3.2. Comparison with Basic Linear Model
4. Discussion and Conclusions
- FEM approaches suggested in [32] yield error values ranging from 1.19% to 4.29%. However, these methods require significantly more data and computational power and were tested mainly via simulations. For comparison, the RF-based model presented in this paper does not require any stiffness analysis of the vehicle under consideration (although such data could possibly be used to improve the regressor substantially).
- In comparison with FEM techniques [32], all the data necessary for pre-crash velocity estimation can be gathered from the accident site. The deformation measurements along with vehicle mass are easy to both obtain and instantly process via the pre-trained regressor, while finite element methods are much more effort- and time-consuming, without providing a truly significant advantage.
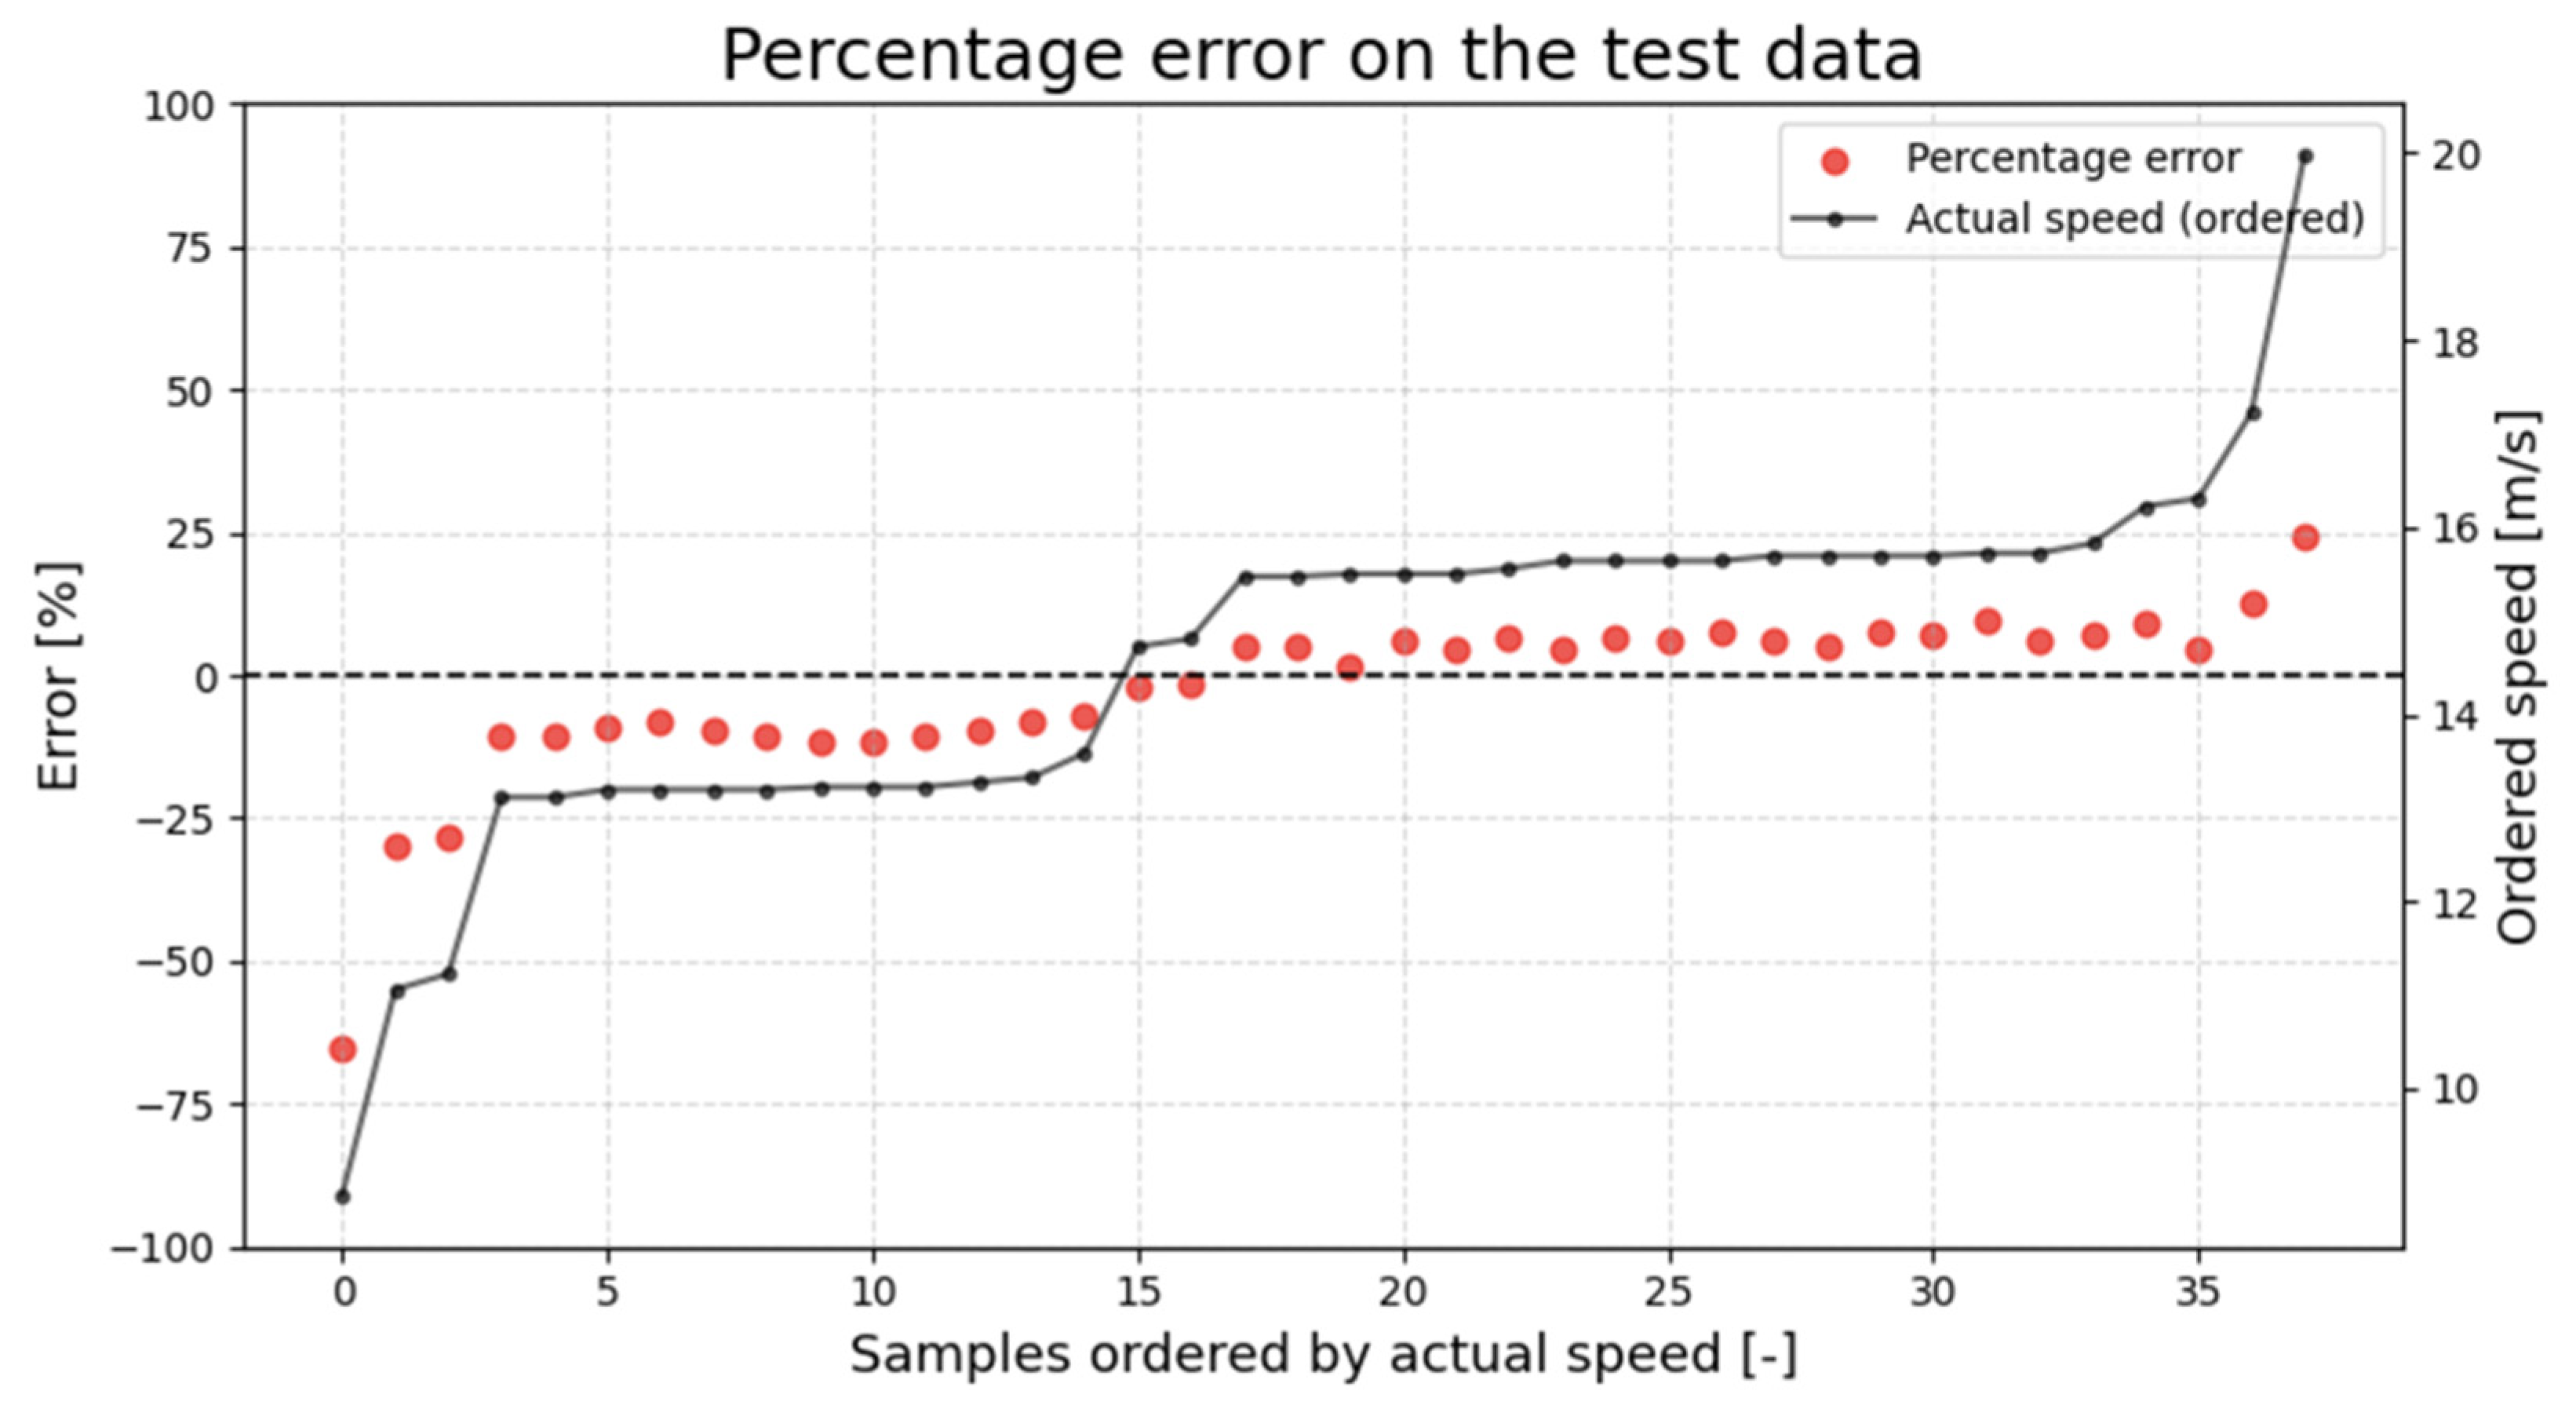
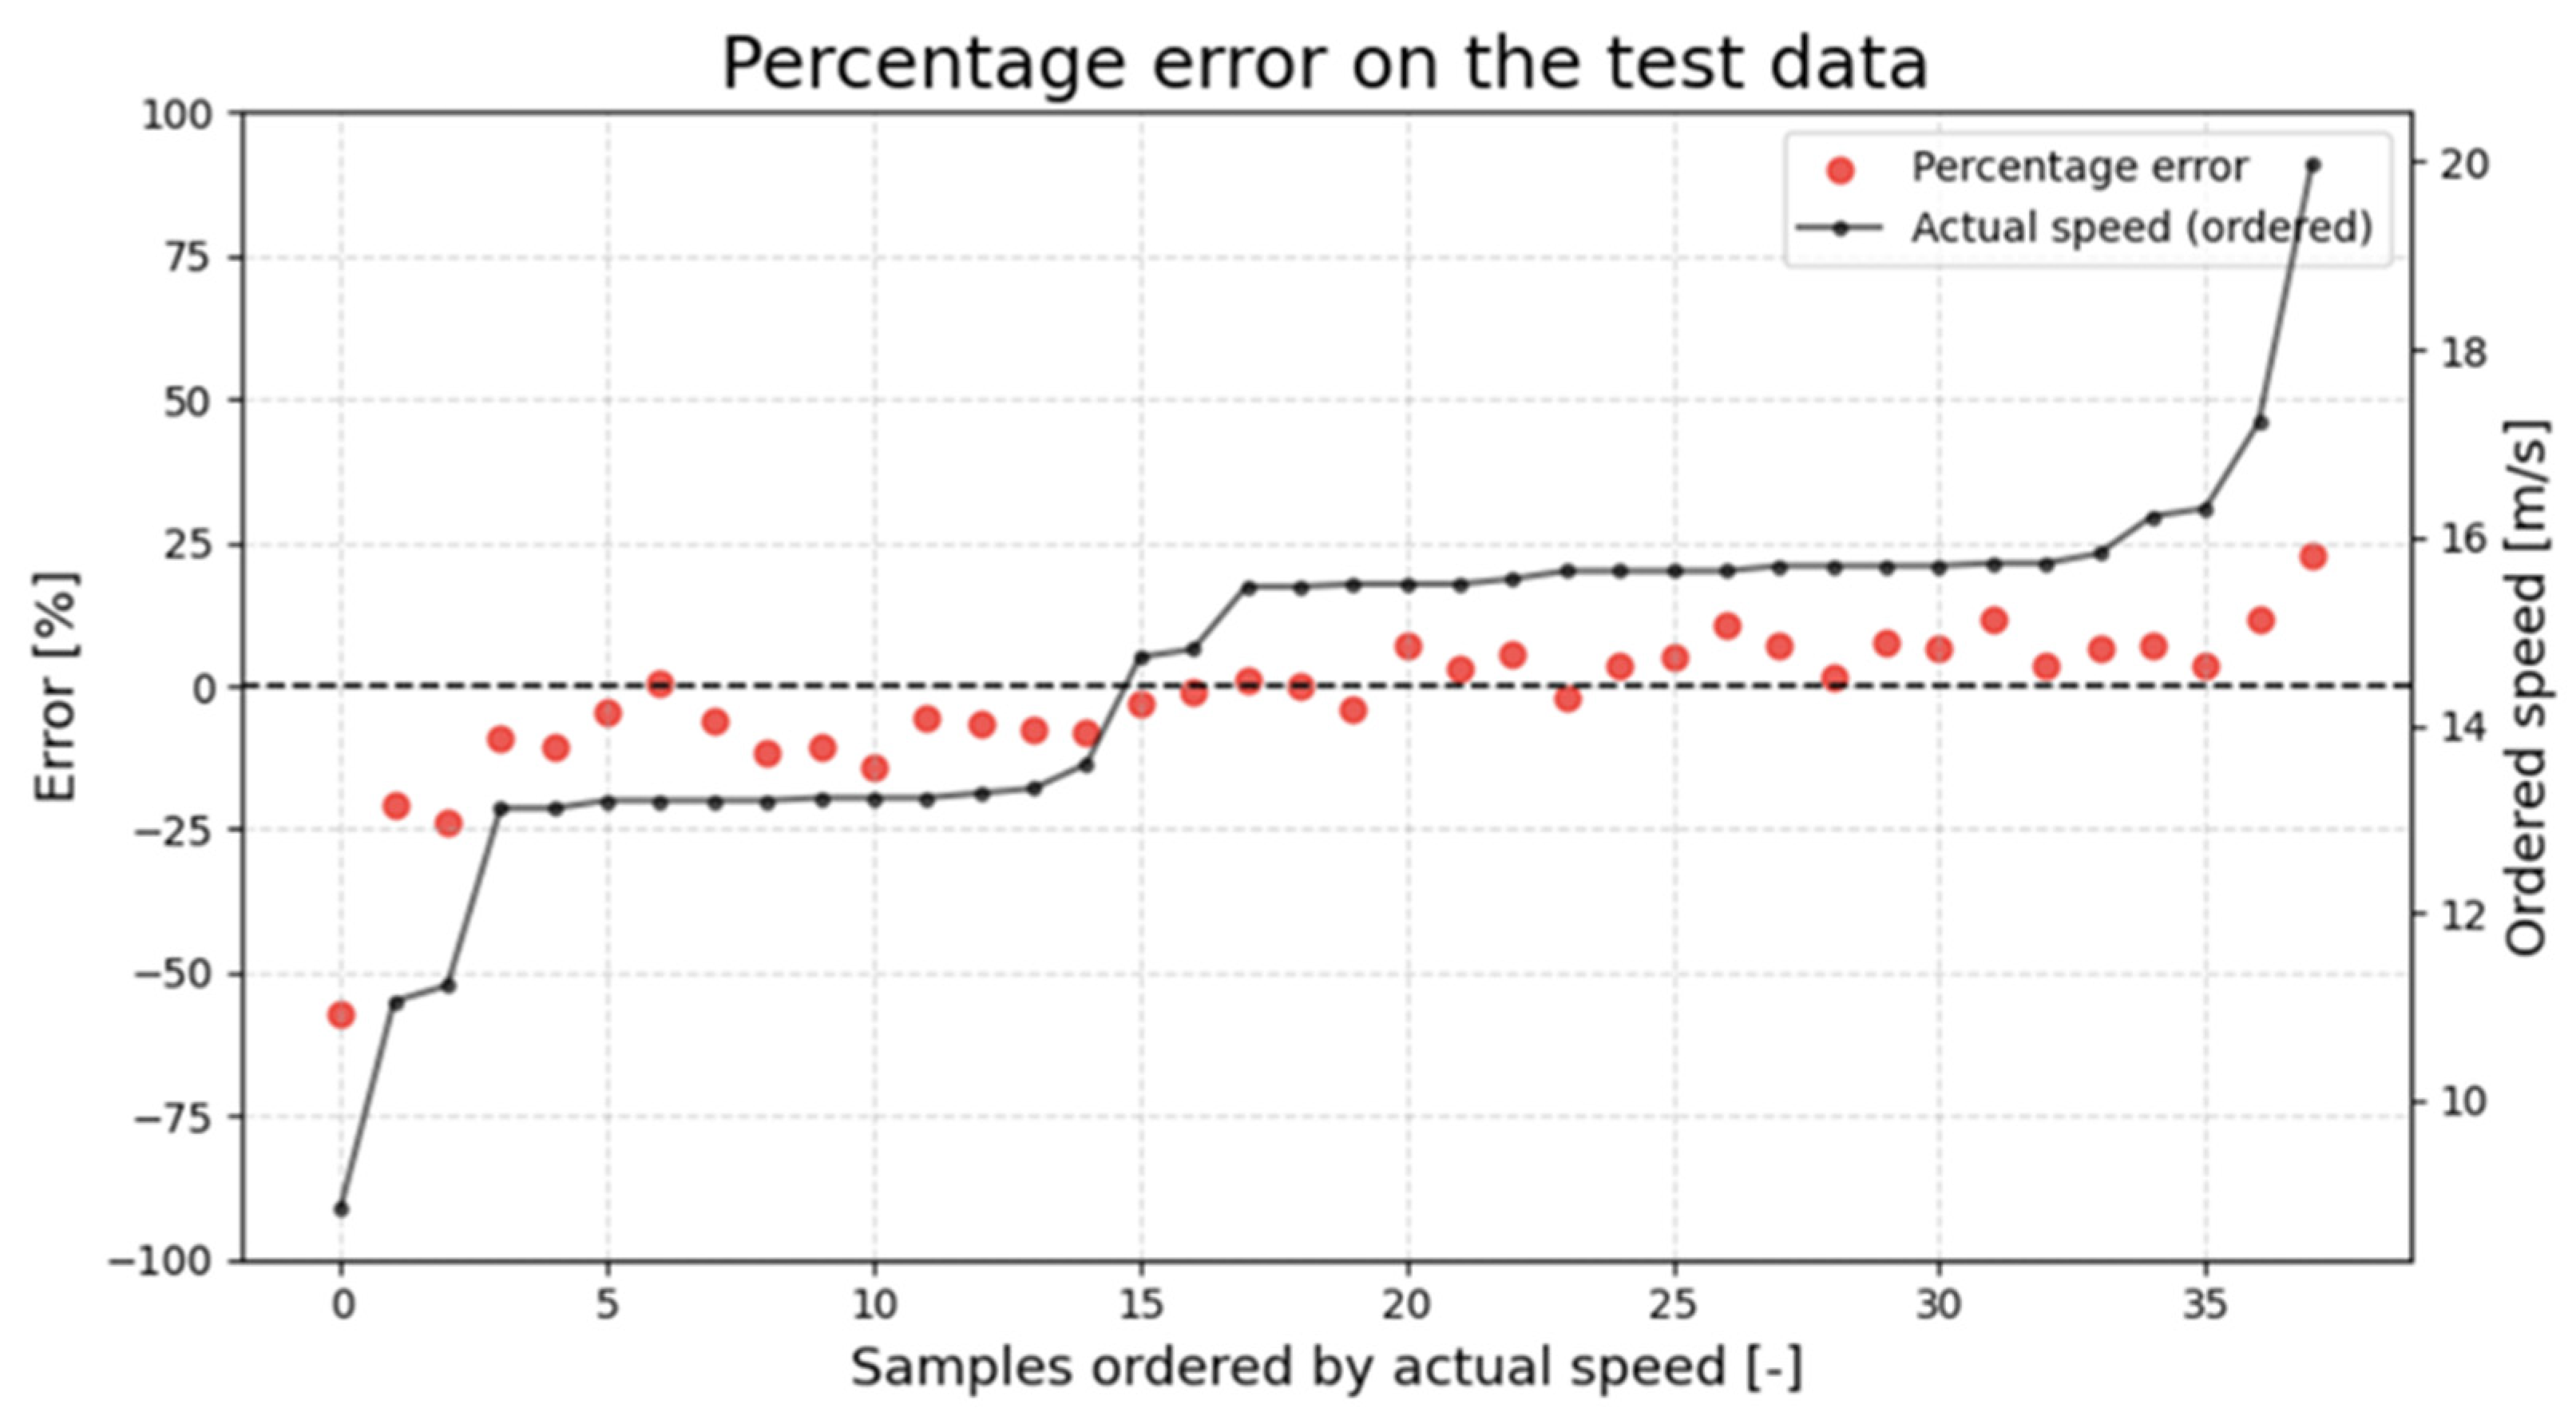
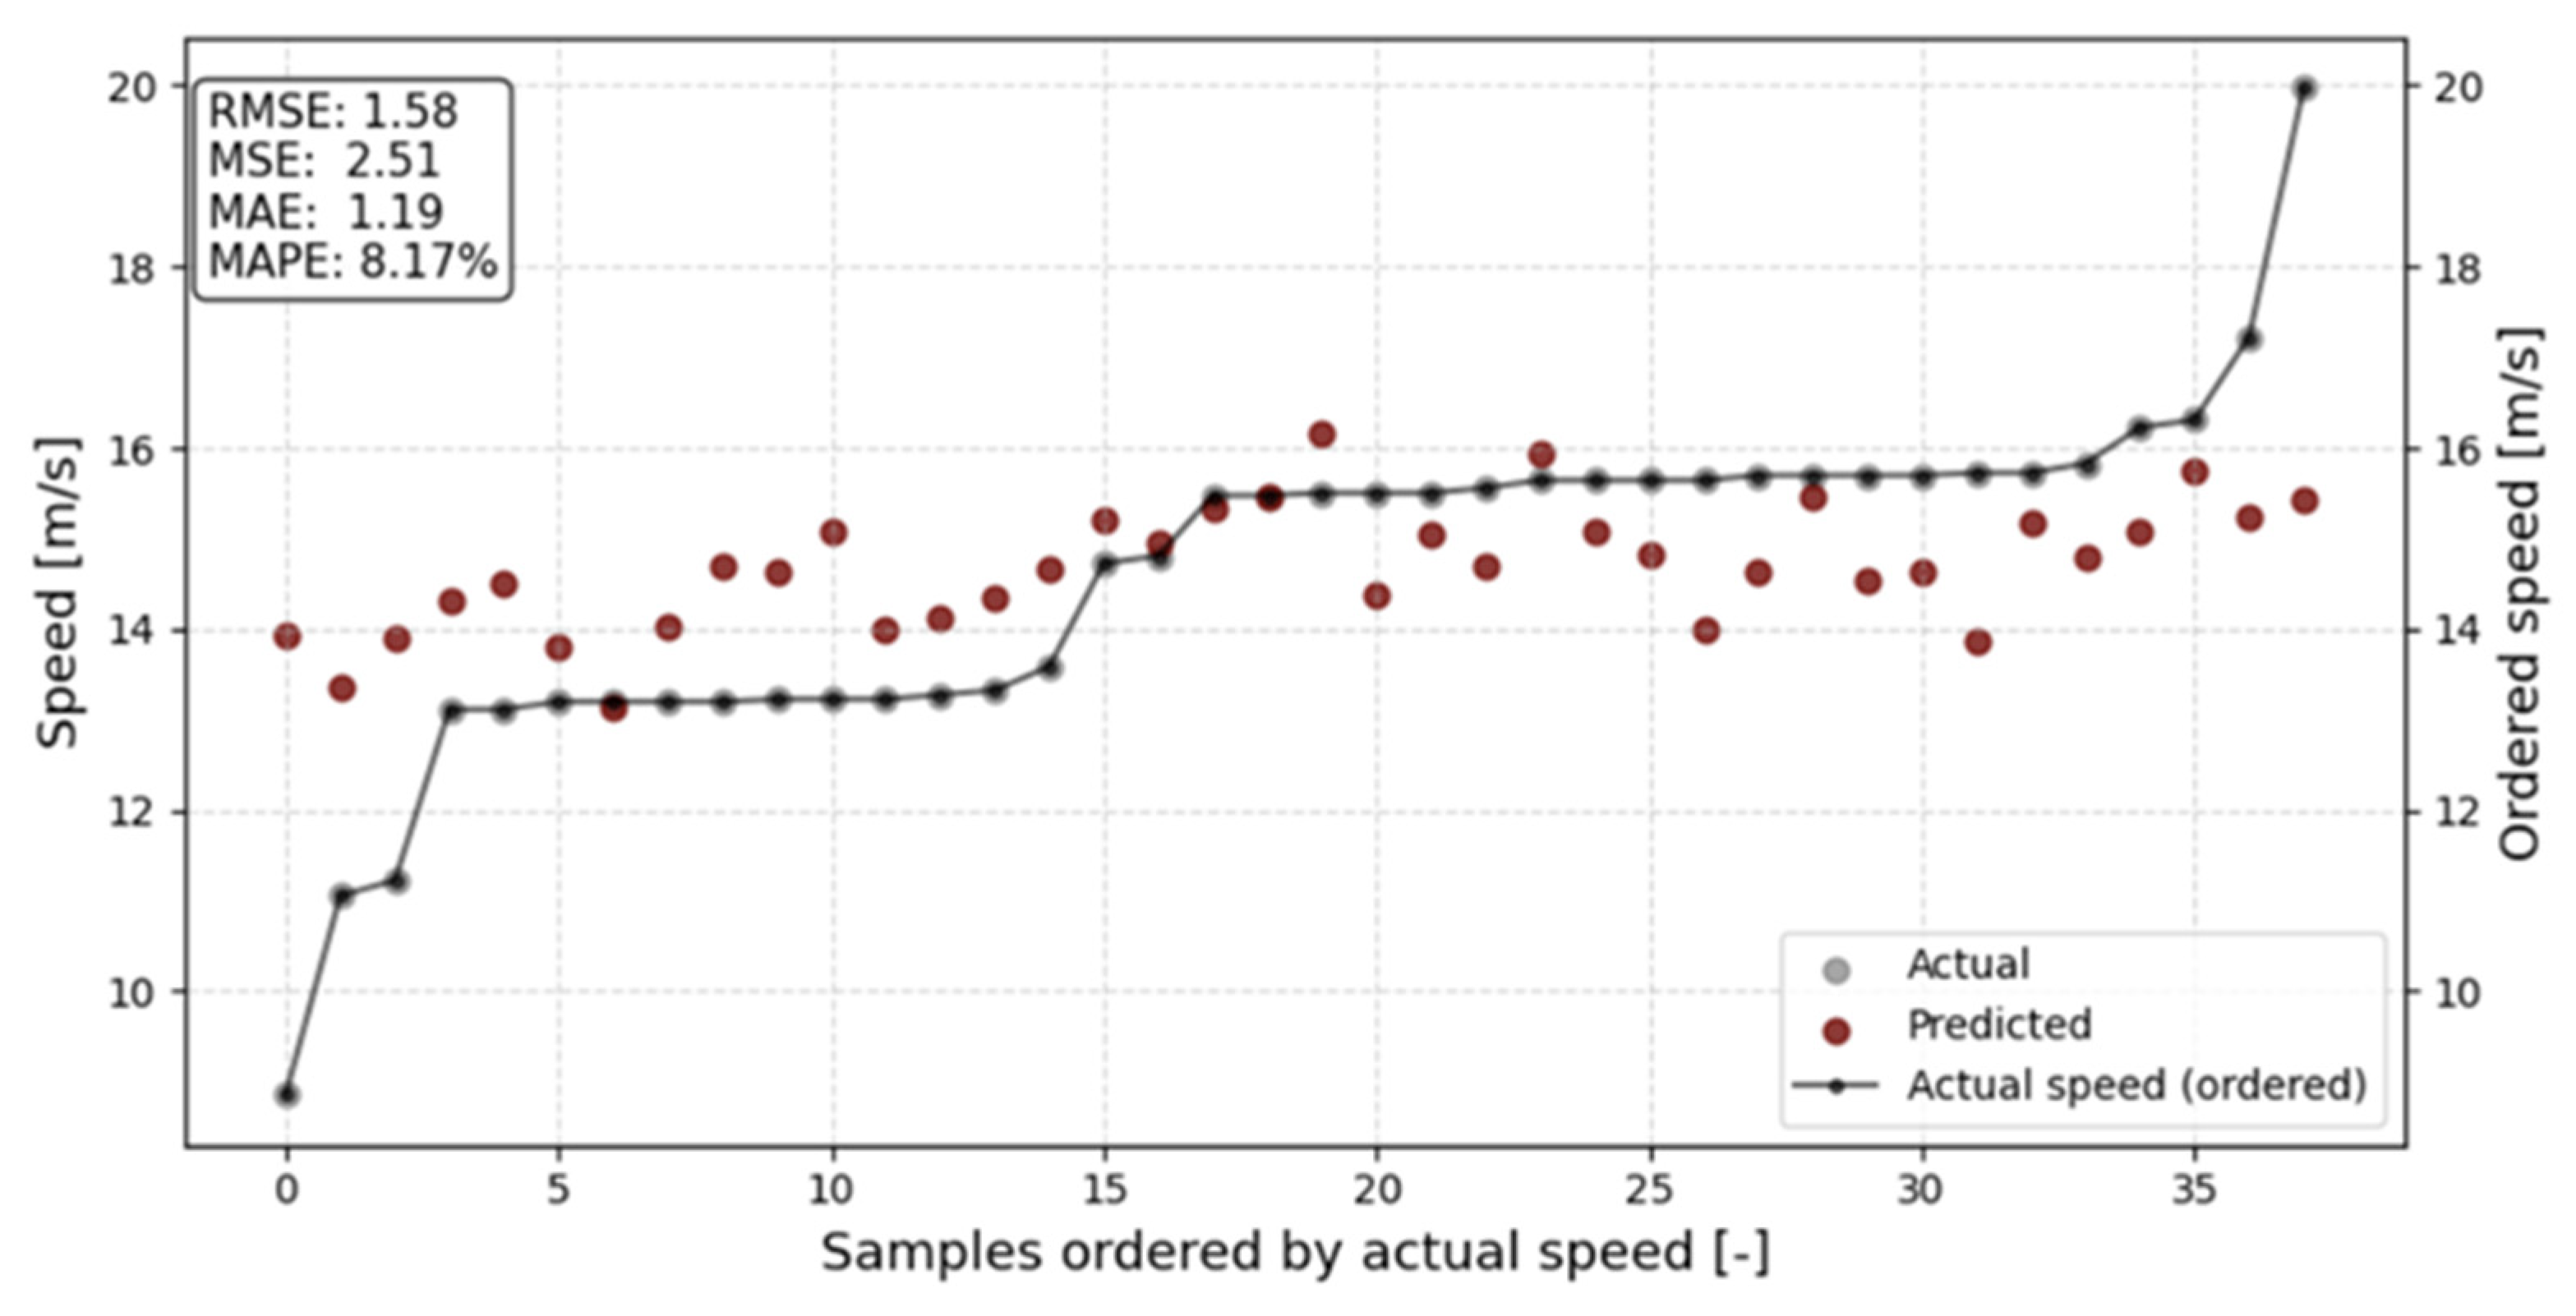
- In [43], the authors’ work on Legendre polynomials for the compact class yields relative error rates ranging between 6.3% and 6.74%; similar level of accuracy is obtained via usage of tensor-product or B-spline approaches shown in [18]. It is important to point out that the latter paper uses weighted error measurements; i.e., the weight of each error corresponds to the typicality of the observation. The unweighted, stratified approach for the error measurements therein yielded slightly worse results (with MAPE 8.02%).
Further Research
- Experimental feature reconstruction, involving the impact deflection angle (which can possibly be inferred from the deformation coefficients Ci and the relationship between these).
- Preparation of an analogous model based on the data collected from EDRs from modern vehicles.
- Including feature engineering via preliminary stiffness analysis in applicable cases.
Author Contributions
Funding
Data Availability Statement
Acknowledgments
Conflicts of Interest
Abbreviations and Symbols
| EES | Equivalent Energy Speed [] |
| NHTSA | National Highway Traffic Safety Administration |
| deformation coefficients [] | |
| average deformation coefficient [] | |
| vehicle speed [] | |
| mass of car [] | |
| deformation zone width | |
| = 399 | number of cases [] |
| Mean Root-Square Error [] | |
| Mean Absolute Percentage Error [] | |
| Mean Absolute Error [] | |
| Mean Squared Error [] |
References
- Gaj, P.; Kopania, J.; Wójciak, K.; Bogusławski, G. Assessment of sound absorbing properties of composite made of recycling materials. Vib. Phys. Syst. 2019, 30, 2019109. [Google Scholar]
- Bukvić, M.; Milojević, S.; Gajević, S.; Đorđević, M.; Stojanović, B. Production Technologies and Application of Polymer Composites in Engineering: A Review. Polymers 2025, 17, 2187. [Google Scholar] [CrossRef]
- Wójciak, K.; Kopania, J.M. Correlation Between the Shape of Substitution Ducts and Insertion Loss of Silencers. Vib. Phys. Syst. 2022, 33, 2022212. [Google Scholar] [CrossRef]
- Campbell, K.L. Energy Basis for Collision Severity; SAE Technical Paper 740565; SAE: Warrendale, PA, USA, 1974. [Google Scholar] [CrossRef]
- Brach, R.M.; Brach, R.M. Crush Energy and Planar Impact Mechanics for Accident Reconstruction; SAE Technical Paper 980025; SAE: Warrendale, PA, USA, 1998. [Google Scholar] [CrossRef]
- Rose, N.A. Restitution Modeling for Crush Analysis: Theory and Validation; SAE Technical Paper 2006-01-0908; SAE: Warrendale, PA, USA, 2006. [Google Scholar] [CrossRef]
- Brach, R.M.; Brach, R.M.; Mink, R.A. Nonlinear Optimization in Vehicular Crash Reconstruction. SAE Int. J. Transp. Saf. 2015, 3, 17–27. [Google Scholar] [CrossRef]
- Mrowicki, A.; Krukowski, M.; Turoboś, F.; Jaśkiewicz, M.; Radkowski, S.; Kubiak, P. Determining vehicle pre-crash speed in frontal barrier crashes using genetic algorithm model adjustment techniques for intermediate car class. Int. J. Crashworthiness 2021, 27, 1009–1016. [Google Scholar] [CrossRef]
- Mrowicki, A.; Krukowski, M.; Turoboś, F.; Kubiak, P. Determining vehicle pre-crash speed in frontal barrier crashes using artificial neural network for intermediate car class. Forensic Sci. Int. 2020, 308, 110179. [Google Scholar] [CrossRef] [PubMed]
- Bayarri, M.J.; Berger, J.O.; Kennedy, M.C.; Kottas, A.; Paulo, R.; Sacks, J.; Cafeo, J.A.; Lin, C.-H.; Tu, J. Predicting Vehicle Crashworthiness: Validation of Computer Models for Functional and Hierarchical Data. J. Am. Stat. Assoc. 2009, 104, 929–943. [Google Scholar] [CrossRef]
- Wang, X.; Shi, L. A new metamodel method using Gaussian process based surrogate modeling for crashworthiness design. Int. J. Crashworthiness 2014, 19, 311–321. [Google Scholar] [CrossRef]
- Eilers, P.H.C.; Marx, B.D. Flexible Smoothing with B-splines and Penalties. Stat. Sci. 1996, 11, 89–121. [Google Scholar] [CrossRef]
- Piegl, L.; Tiller, W. The NURBS Book, 2nd ed.; Springer: Berlin/Heidelberg, Germany, 1997. [Google Scholar]
- Neades, J.; Smith, R. The determination of vehicle speeds from delta-V in two vehicle planar collisions. Proc. Inst. Mech. Eng. Part D J. Automob. Eng. 2011, 225, 43–53. [Google Scholar] [CrossRef]
- Doecke, S.D.; Dutschke, J.K.; Baldock, M.R.J.; Kloeden, C.N. Travel speed and the risk of serious injury in vehicle crashes. Accid. Anal. Prev. 2021, 161, 106359. [Google Scholar] [CrossRef]
- Spek, A.; Otjens, J. Understanding pre-crash speed sampling by the VAG Event Data Recorder. Forensic Sci. Int. 2023, 351, 111831. [Google Scholar] [CrossRef]
- Breitlauch, P.; Erbsmehl, C.T.; van Ratingen, M.; Mallada, J.L.; Sandner, V.; Ferson, N.; Urban, M. A novel method for the automated simulation of various vehicle collisions to estimate crash severity. Traffic Inj. Prev. 2023, 24, 116–123. [Google Scholar] [CrossRef]
- Poliak, M.; Kubiak, P.; Krukowski, M.; Turoboś, F.; Jaśkiewicz, M.; Jaśkiewicz, J.; Frej, D. Non-Linear Method of Vehicle Velocity Determination Based on Tensor Product B-Spline Approximation with Probabilistic Weights for NHTSA Database of Compact Vehicle Class. Appl. Sci. 2026, 16, 401. [Google Scholar] [CrossRef]
- Bruski, D.; Pachocki, L.; Sciegaj, A.; Witkowski, W. Speed estimation of a car at impact with a W-beam guardrail using numerical simulations and machine learning. Adv. Eng. Softw. 2023, 184, 103502. [Google Scholar] [CrossRef]
- Silver, D.; Manek, H.; Kay, M.; Travis, P. Estimating Automobile Crash Characteristics from Images using Deep Learning. In Proceedings of the International FLAIRS Conference Proceedings, Clearwater Beach, FL, USA, 14–17 May 2022; The Florida Artificial Intelligence Research Society: Coral Gables, FL, USA, 2022; Volume 35. [Google Scholar] [CrossRef]
- Thapa Magar, A.; Osthi, S.; Adhikari, N.; Saban Kumar, K.C. Multi-model Deep Learning Approaches for Vehicle Speed Estimation. Kathford J. Eng. Manag. 2025, 4, 21–30. [Google Scholar] [CrossRef]
- Fernández Llorca, D.; Hernández Martínez, A.; García Daza, I. Vision-based vehicle speed estimation: A survey. IET Intelligent Transport Systems 2021, 15, 987–1005. [Google Scholar] [CrossRef]
- Famouri, M.; Azimifar, Z.; Wong, A. A Novel Motion Plane-Based Approach to Vehicle Speed Estimation. IEEE Trans. Intell. Transp. Syst. 2019, 20, 1237–1246. [Google Scholar] [CrossRef]
- Gulino, M.; Di Gangi, L.; Sortino, A.; Vangi, D. Injury risk assessment based on pre-crash variables: The role of closing velocity and impact eccentricity. Accid. Anal. Prev. 2020, 150, 105864. [Google Scholar] [CrossRef] [PubMed]
- Andricevic, N.; Junge, M.; Krampe, J. Injury risk functions for frontal oblique collisions. Traffic Inj. Prev. 2018, 19, 518–522. [Google Scholar] [CrossRef]
- Ameksa, M.; Mousannif, H.; Al Moatassime, H.; Elamrani Abou Elassad, Z. Crash Prediction using Ensemble Methods. In Proceedings of the 2nd International Conference on Big Data, Modelling and Machine Learning—BML, Kenitra, Morocco, 15–16 July 2021; SciTePress: Setúbal, Portugal, 2022; pp. 211–215. ISBN 978-989-758-559-3. [Google Scholar] [CrossRef]
- Lin, L.; Wang, Q.; Sadek, A.W. A novel variable selection method based on frequent pattern tree for real-time traffic accident risk prediction. Transp. Res. C Emerg. Technol. 2015, 55, 444–459. [Google Scholar] [CrossRef]
- Islam, Z.; Abdel-Aty, M.; Anik, B.M.T.H. Transformer-Conformer Ensemble for Crash Prediction Using Connected Vehicle Trajectory Data. IEEE Open J. Intell. Transp. Syst. 2023, 4, 979–988. [Google Scholar] [CrossRef]
- Wu, P.; Meng, X.; Song, L. A novel ensemble learning method for crash prediction using road geometric alignments and traffic data. J. Transp. Saf. Secur. 2020, 12, 1128–1146. [Google Scholar] [CrossRef]
- National Highway Traffic Safety Administration (NHTSA). CRASH3 User’s Guide and Technical Manual; Report No. DOT HS 805 732; National Highway Traffic Safety Administration: Washington, DC, USA, 1982.
- Lindquist, M.; Hall, A.; Björnstig, U. Real world car crash investigations—A new approach. Int. J. Crashworthiness 2003, 8, 375–384. [Google Scholar] [CrossRef]
- Droździel, P.; Pasaulis, T.; Pečeliūnas, R.; Pukalskas, S. Evaluation of the Energy Equivalent Speed of Car Damage Using a Finite Element Model. Vehicles 2024, 6, 632–650. [Google Scholar] [CrossRef]
- Breiman, L. Random Forests. Mach. Learn. 2001, 45, 5–32. [Google Scholar] [CrossRef]
- Salman, H.A.; Kalakech, A.; Steiti, A. Random Forest Algorithm Overview. Babylon. J. Mach. Learn. 2024, 2024, 69–79. [Google Scholar] [CrossRef]
- Schonlau, M.; Zou, R.Y. The random forest algorithm for statistical learning. Stata J. 2020, 20, 3–29. [Google Scholar] [CrossRef]
- Roy, M.H.; Larocque, D. Robustness of random forests for regression. J. Nonparametric Stat. 2012, 24, 993–1006. [Google Scholar] [CrossRef]
- Genuer, R.; Poggi, J.M. Random Forests. In Random Forests with R; Use R! Springer: Cham, Switzerland, 2020. [Google Scholar] [CrossRef]
- Mandler, H.; Weigand, B. A review and benchmark of feature importance methods for neural networks. ACM Comput. Surv. 2024, 56, 318. [Google Scholar] [CrossRef]
- Fisher, A.; Rudin, C.; Dominici, F. All models are wrong, but many are useful: Learning a variable’s importance by studying an entire class of prediction models simultaneously. J. Mach. Learn. Res. 2019, 20, 1–81. [Google Scholar]
- Molnar, C.; König, G.; Bischl, B.; Casalicchio, G. Model-agnostic feature importance and effects with dependent features: A conditional subgroup approach. Data Min. Knowl. Disc. 2024, 38, 2903–2941. [Google Scholar] [CrossRef]
- Ishwaran, H.; Lu, M. Standard errors and confidence intervals for variable importance in random forest regression, classification, and survival. Stat. Med. 2018, 38, 558–582. [Google Scholar] [CrossRef] [PubMed]
- Speiser, J.L.; Miller, M.E.; Tooze, J.; Ip, E. A Comparison of Random Forest Variable Selection Methods for Classification Prediction Modeling. Expert Syst. Appl. 2019, 134, 93–101. [Google Scholar] [CrossRef] [PubMed]
- Kubiak, P.; Mierzejewska, P.; Krukowski, M. Nonlinear methods of vehicle velocity determination based on inverse systems and tensor products of Legendre polynomials in compact car class. Forensic Sci. Int. 2018, 295, 19–29. [Google Scholar] [CrossRef]



| 0.439 | 0.482 | 0.491 | 0.467 | 0.430 | 0.386 | 0.456 | 1.496 | 1364.729 | 14.679 | |
| 0.182 | 0.157 | 0.156 | 0.159 | 0.161 | 0.165 | 0.142 | 0.144 | 61.09 | 2.574 | |
| 0.038 | 0.092 | 0.093 | 0.049 | 0.079 | 0.015 | 0.103 | 1.05 | 1251.0 | 4.472 | |
| 0.314 | 0.376 | 0.383 | 0.363 | 0.309 | 0.245 | 0.362 | 1.400 | 1324.0 | 13.222 | |
| 0.432 | 0.480 | 0.495 | 0.475 | 0.437 | 0.384 | 0.455 | 1.499 | 1363.0 | 15.5 | |
| 0.543 | 0.566 | 0.580 | 0.571 | 0.537 | 0.508 | 0.543 | 1.586 | 1410.5 | 15.694 | |
| 1.367 | 1.290 | 1.336 | 1.349 | 1.356 | 1.344 | 1.328 | 1.914 | 1478.0 | 26.861 |
| Linear Method Absolute Error | Linear Method Relative Error | Random Forest Prediction | Random Forest Absolute Error | Random Forest Relative Error | |||||
|---|---|---|---|---|---|---|---|---|---|
| 0.38 | 1.370 | 1263 | 11.06 | 14.35 | 3.30 | 29.84 | 13.34 | 2.28 | 20.65 |
| 0.38 | 1.425 | 1423 | 13.11 | 14.49 | 1.38 | 10.50 | 13.29 | 0.18 | 1.38 |
| 0.67 | 1.321 | 1284 | 15.72 | 14.24 | 1.49 | 9.45 | 15.33 | 0.40 | 2.52 |
| 0.48 | 1.524 | 1369 | 16.22 | 14.73 | 1.49 | 9.21 | 15.40 | 0.82 | 5.05 |
| 0.54 | 1.417 | 1402 | 13.11 | 14.47 | 1.36 | 10.36 | 15.32 | 2.21 | 16.83 |
| 0.10 | 1.658 | 1368 | 14.81 | 15.05 | 0.25 | 1.68 | 13.37 | 1.44 | 9.71 |
| 0.28 | 1.380 | 1475 | 11.22 | 14.38 | 3.16 | 28.13 | 12.86 | 1.64 | 14.64 |
| 0.49 | 1.565 | 1322 | 15.50 | 14.83 | 0.67 | 4.34 | 15.31 | 0.19 | 1.26 |
| 0.28 | 1.322 | 1321 | 13.19 | 14.24 | 1.04 | 7.91 | 13.14 | 0.06 | 0.43 |
| 0.43 | 1.401 | 1465 | 13.32 | 14.43 | 1.11 | 8.32 | 13.19 | 0.13 | 1.01 |
| 0.70 | 1.461 | 1251 | 15.69 | 14.58 | 1.12 | 7.13 | 14.09 | 1.60 | 10.22 |
| 0.54 | 1.524 | 1406 | 15.72 | 14.73 | 0.99 | 6.32 | 15.28 | 0.44 | 2.79 |
| 0.64 | 1.511 | 1429 | 15.47 | 14.70 | 0.78 | 5.01 | 15.33 | 0.14 | 0.93 |
| 0.52 | 1.455 | 1397 | 15.56 | 14.56 | 0.99 | 6.39 | 15.39 | 0.17 | 1.10 |
| 0.41 | 1.473 | 1437 | 13.19 | 14.60 | 1.41 | 10.69 | 13.52 | 0.33 | 2.50 |
| 0.28 | 1.452 | 1389 | 13.27 | 14.55 | 1.28 | 9.66 | 13.14 | 0.13 | 0.96 |
| 0.26 | 1.658 | 1364 | 17.22 | 15.05 | 2.17 | 12.59 | 14.95 | 2.27 | 13.17 |
| 0.23 | 1.658 | 1363 | 14.72 | 15.05 | 0.33 | 2.25 | 14.55 | 0.18 | 1.19 |
| 0.55 | 1.420 | 1407 | 15.69 | 14.48 | 1.22 | 7.76 | 15.29 | 0.40 | 2.58 |
| 0.29 | 1.524 | 1465 | 15.82 | 14.73 | 1.10 | 6.93 | 13.40 | 2.43 | 15.33 |
| 0.46 | 1.427 | 1280 | 13.19 | 14.49 | 1.30 | 9.84 | 14.89 | 1.70 | 12.87 |
| 0.60 | 1.499 | 1316 | 15.64 | 14.67 | 0.97 | 6.21 | 15.31 | 0.33 | 2.11 |
| 0.29 | 1.486 | 1254 | 8.86 | 14.64 | 5.78 | 65.17 | 12.75 | 3.89 | 43.88 |
| 0.35 | 1.468 | 1256 | 13.22 | 14.59 | 1.37 | 10.36 | 13.01 | 0.21 | 1.58 |
| 0.43 | 1.524 | 1439 | 13.22 | 14.73 | 1.51 | 11.39 | 15.48 | 2.26 | 17.06 |
| 0.76 | 1.504 | 1402 | 15.47 | 14.68 | 0.79 | 5.12 | 15.29 | 0.18 | 1.16 |
| 0.78 | 1.851 | 1301 | 16.31 | 15.52 | 0.78 | 4.81 | 20.03 | 3.72 | 22.82 |
| 0.37 | 1.524 | 1349 | 13.22 | 14.73 | 1.51 | 11.39 | 13.49 | 0.27 | 2.05 |
| 0.27 | 1.689 | 1378 | 19.97 | 15.13 | 4.84 | 24.25 | 15.39 | 4.58 | 22.94 |
| 0.63 | 1.588 | 1320 | 15.69 | 14.88 | 0.81 | 5.17 | 15.33 | 0.37 | 2.35 |
| 0.41 | 1.525 | 1340 | 15.69 | 14.73 | 0.96 | 6.14 | 13.96 | 1.73 | 11.05 |
| 0.50 | 1.392 | 1253 | 13.19 | 14.41 | 1.21 | 9.20 | 14.10 | 0.90 | 6.85 |
| 0.49 | 1.400 | 1324 | 15.64 | 14.43 | 1.21 | 7.75 | 14.51 | 1.13 | 7.24 |
| 0.68 | 1.461 | 1419 | 15.64 | 14.58 | 1.06 | 6.80 | 15.33 | 0.31 | 1.99 |
| 0.58 | 1.600 | 1468 | 15.64 | 14.91 | 0.73 | 4.64 | 15.38 | 0.26 | 1.63 |
| 0.49 | 1.755 | 1339 | 15.50 | 15.29 | 0.21 | 1.36 | 17.89 | 2.39 | 15.41 |
| 0.51 | 1.438 | 1339 | 15.50 | 14.52 | 0.98 | 6.32 | 15.24 | 0.26 | 1.66 |
| 0.48 | 1.440 | 1473 | 13.58 | 14.52 | 0.94 | 6.93 | 14.16 | 0.58 | 4.25 |
| Regression Method | ||||||||
|---|---|---|---|---|---|---|---|---|
| XGBoost (150 Trees) | XGBoost (300 Trees) | XGBoost (500 Trees) | LightGBM (150 Trees) | LightGBM (300 Trees) | LightGBM (500 Trees) | Random Forest (Section 2.4) | ||
| Error metric | RMSE [m/s] | 1.85 | 1.82 | 1.85 | 1.81 | 1.77 | 1.77 | 1.62 |
| MAPE [%] | 7.99 | 8.46 | 9.01 | 7.97 | 8.29 | 8.51 | 7.57 | |
| MAE [m/s] | 1.23 | 1.28 | 1.35 | 1.21 | 1.25 | 1.28 | 1.12 | |
| MSE [m2/s2] | 3.42 | 3.31 | 3.42 | 3.27 | 3.14 | 3.13 | 2.62 | |
Disclaimer/Publisher’s Note: The statements, opinions and data contained in all publications are solely those of the individual author(s) and contributor(s) and not of MDPI and/or the editor(s). MDPI and/or the editor(s) disclaim responsibility for any injury to people or property resulting from any ideas, methods, instructions or products referred to in the content. |
© 2026 by the authors. Licensee MDPI, Basel, Switzerland. This article is an open access article distributed under the terms and conditions of the Creative Commons Attribution (CC BY) license.
Share and Cite
Poliak, M.; Lewandowski, B.; Turoboś, F.; Kubiak, P.; Jaśkiewicz, M.; Markiewicz, M.; Frej, D.; Jaśkiewicz, J. Non-Linear Method of Vehicle Pre-Crash Velocity Estimation Based on Random Forest Regression and Energy Equivalent Speed for Compact Vehicle Class. Energies 2026, 19, 1678. https://doi.org/10.3390/en19071678
Poliak M, Lewandowski B, Turoboś F, Kubiak P, Jaśkiewicz M, Markiewicz M, Frej D, Jaśkiewicz J. Non-Linear Method of Vehicle Pre-Crash Velocity Estimation Based on Random Forest Regression and Energy Equivalent Speed for Compact Vehicle Class. Energies. 2026; 19(7):1678. https://doi.org/10.3390/en19071678
Chicago/Turabian StylePoliak, Milos, Bartosz Lewandowski, Filip Turoboś, Przemysław Kubiak, Marek Jaśkiewicz, Marcin Markiewicz, Damian Frej, and Justyna Jaśkiewicz. 2026. "Non-Linear Method of Vehicle Pre-Crash Velocity Estimation Based on Random Forest Regression and Energy Equivalent Speed for Compact Vehicle Class" Energies 19, no. 7: 1678. https://doi.org/10.3390/en19071678
APA StylePoliak, M., Lewandowski, B., Turoboś, F., Kubiak, P., Jaśkiewicz, M., Markiewicz, M., Frej, D., & Jaśkiewicz, J. (2026). Non-Linear Method of Vehicle Pre-Crash Velocity Estimation Based on Random Forest Regression and Energy Equivalent Speed for Compact Vehicle Class. Energies, 19(7), 1678. https://doi.org/10.3390/en19071678