Article

Effects of Pyrolysis Carbonization Time of Corn Stalks on Microbial Communities in Biogas Production with Livestock and Poultry Manure as Fermentation Substrate

1
Heilongjiang Academy of Agricultural Sciences, Harbin 150086, China
2
Heilongjiang Academy of Black Soil Conservation and Utilization, Harbin 150086, China
3
Heilongjiang Provincial Key Laboratory of Straw Energy Utilization, Harbin 150086, China
4
Baiquan County Agricultural Service Center, Qiqihar 164700, China
*
Author to whom correspondence should be addressed.
Energies 2026, 19(7), 1614; https://doi.org/10.3390/en19071614
Submission received: 25 February 2026 / Revised: 16 March 2026 / Accepted: 19 March 2026 / Published: 25 March 2026
(This article belongs to the Topic Advanced Bioenergy and Biofuel Technologies)

Abstract

In the process of anaerobic digestion for manure treatment, adding conductive materials is one of the most used methods to enhance methane yield. Biochar, a stable conductive material, shows significant potential in facilitating direct interspecies electron transfer in anaerobic digestion systems. However, biochar’s structure and properties are influenced by its preparation method, and the mechanisms by which structural characteristics affect methane yield and microbial community structure in fermentation systems require further investigation. This study investigates the effects of pyrolysis duration (1 h for A3O and 2 h for A3T) at 550 °C using corn straw as raw material. Through characterization analyses including SEM, FTIR, conductivity, and elemental composition, we explore the impacts on gas production efficiency and key parameters in anaerobic digestion systems. By analyzing microbial community structure and changes in methanogenic functional bacteria, we elucidate the mechanisms by which biochar materials with different pyrolysis times influence anaerobic digestion processes and microbial community composition. These findings provide theoretical foundations and support for optimizing biochar preparation techniques and their targeted applications in anaerobic digestion fields. It was found that the biochar-treated group exhibited higher methane production. Compared with the CK group without biochar, the methane production of A3O and A3T increased by 8.53% and 5.16%, respectively. While methane yield differed little between A3O and A3T, longer pyrolysis time increased the biochar’s specific surface area, promoting the system’s reaction rate and enabling faster methanogenesis. High-throughput analysis showed that biochar enriched methanogenic archaea like Methanosarcina and Methanobrevibacter while upregulating methanogenesis metabolic pathways and enhancing system metabolic potential. This study elucidates the influence of pyrolysis conditions on biochar performance and its regulatory role in anaerobic digestion, providing a basis for energy recovery from organic waste and biochar application in anaerobic fermentation.

1. Introduction

With the rapid development of agriculture and animal husbandry in China, a substantial amount of agricultural residues and livestock manure is generated annually [1]. Crop straw and livestock waste in China are characterized by large quantities, wide distribution, and complex composition. Annual crop straw production is approximately 870 million tons, while livestock and poultry manure production exceeds 3.8 billion tons [2]. These wastes, without proper management, pose significant risks to soil, water, and atmospheric environments. China attaches great importance to resource utilization and the treatment of agricultural waste. In recent years, its comprehensive utilization rate has remained stable at over 80%, covering the entire chain management of source reduction, process control, and resource utilization [3]. Such wastes are rich in essential nutrients, including carbon (C), nitrogen (N), and phosphorus (P), making their resource-oriented utilization a feasible approach to mitigating environmental pollution and alleviating energy shortages. Anaerobic digestion (AD) [4] technology for treating organic waste offers advantages such as high efficiency, environmental friendliness, and high resource utilization. The resulting product biogas, as a clean and renewable energy source, can effectively replace fossil fuels.
AD is a complex biochemical process mediated by diverse microbial consortia, enabling the effective treatment of agricultural and livestock wastes while simultaneously producing methane, thereby contributing to greenhouse gas mitigation and sustainable energy development [5]. Appropriate fermentation temperature, pH, and C/N ratio are critical for maintaining AD efficiency by regulating microbial interactions and sustaining process stability. However, the accumulation of microbial metabolites remains a major bottleneck for the continuous and stable operation of AD systems. Nitrogen-rich substrates are readily converted into ammonium (NH4+) and free ammonia (NH3·H2O), which can accumulate and exert ammonia inhibition, impairing microbial activity and suppressing methane production [6]. Similarly, the degradation of carbon-rich substrates often leads to the accumulation of volatile fatty acids (VFAs), resulting in acidification and further inhibition of microbial function. Therefore, the buildup of intermediate metabolites, particularly ammonia and VFAs, represents a key limitation to AD performance and methane yield. Enhancing microbial activity, promoting methanogenic enrichment, and alleviating ammonia and acid inhibition are thus essential for improving AD stability and efficiency.
Biochar is a highly aromatic and stable carbonaceous material produced through high-temperature pyrolysis of organic biomass such as agricultural and forestry residues or animal manure under oxygen-limited conditions [7]. Due to its well-developed porous structure, biochar can serve as a microbial carrier, providing a favorable habitat that promotes microbial immobilization and enrichment [8,9]. Hence, biochar materials have been applied in fields such as soil remediation and wastewater treatment [10,11], thereby effectively improving microbial community activity and symbiotic relationships. Studies have found that adding biochar to anaerobic digestion systems helps support their growth and reproduction, increases the quantity and metabolic activity of methanogenic communities, and ultimately enhances methane yield [12]. However, the properties of biochar and its effects on anaerobic fermentation vary depending on the preparation method, raw materials, and dosage. Generally, methane yield increases with higher pyrolysis temperatures, which may be due to significant changes in the specific surface area and volume of biochar as the temperature rises [13]. For example, Wang [14] and colleagues investigated the relationship between the preparation temperature of sawdust biochar (300–700 °C) and methane yield. The results showed that sawdust biochar produced at 700 °C was the most effective in enhancing methane yield. This may be because biochar prepared at higher temperatures contains more abundant oxygen-containing functional groups. In addition, the particle size of biochar also plays an important role in its performance and in anaerobic fermentation [4]. Adding smaller-sized biochar to the digestion system can increase the contact area between methanogens and organic matter in the system, thereby improving the hydrolysis rate and increasing methane production. A review by Masebinu et al. [13] indicated that when the particle size of biochar decreased, methane yield could be increased by 23.47% and the lag phase could be shortened. It is worth noting that smaller particle size does not always promote microbial attachment—if the particles are too small, they may actually have a negative impact on the fermentation system. Numerous studies have shown that when the particle size of biochar ranges from 0.7 to 1.2 mm, it is more conducive to enhancing methane production.
Interspecies electron transfer is a key factor influencing the efficiency and stability of AD and has a direct impact on methane yield. As a conductive material, biochar has been shown to promote direct interspecies electron transfer (DIET) between syntrophic bacteria and methanogens, thereby enhancing methane production. Generally, biochar exhibits an alkaline nature and possesses a high specific surface area. These properties allow it to buffer the pH of the AD system and adsorb volatile fatty acids (VFAs), both of which are essential for maintaining optimal digestion conditions. Due to these multiple beneficial attributes, the role of biochar in anaerobic digestion has attracted increasing research attention in recent years. For instance, Ref. [15] reported that the addition of 1% biochar to an aqueous pyrolysis liquid (APL)-based AD system significantly enhanced methane production. In another study [8], it was shown that biochar particle size can also influence AD performance. Specifically, biochars within the 50 μm to 3 cm range significantly increased average methane yield. However, larger particles (1–3 cm) tend to float during digestion, which may hinder microbial colonization and reduce treatment efficiency.
Biochar can also influence the methanogenesis process by regulating the microbial community structure within AD systems. For instance, it has been reported that biochar enhances methane production in carbon-rich digesters by stimulating the hydrogenotrophic methanogenesis pathway [16]. Moreover, the recovered biochar was enriched with dominant microbial populations from the AD system. Similarly, studies have found that the addition of biochar can effectively enrich methanogens, improve the conversion efficiency of propionic acid to acetic acid, and enhance system stability and microbial activity [17]. Meanwhile, it can improve the microbial community structure, promote direct interspecies electron transfer (DIET) between methanogens and their symbiotic partners, and effectively mitigate the inhibitory effect of volatile fatty acids (VFAs) on methane production [18]. Furthermore, the addition of rice straw biochar inhibited the carbohydrate metabolism of bacteria and the glycan biosynthesis and metabolism of archaea to a certain extent while promoting lipid metabolism in archaea; the addition of biochar also inhibited the production of acetic acid in the system and promoted methane production based on hydrogen and carbon dioxide levels [19].
The physicochemical properties of biochar can vary substantially depending on preparation conditions such as pyrolysis temperature and residence time. However, the specific effects and underlying mechanisms by which corn straw-derived biochars with different pyrolysis durations influence methane yield and microbial community dynamics during anaerobic digestion remain unclear. Therefore, the main objectives of this study were: (1) to investigate the effects of corn straw biochars produced at different pyrolysis durations on methane production and environmental parameters within AD systems; (2) to clarify the regulatory effects and mechanisms of such biochars on microbial community structure and methanogenic functional taxa in anaerobic digestion. This study aims to provide insights into the application of corn straw biochar with varying pyrolysis durations in anaerobic digestion systems, thereby offering practical guidance for improving the performance and stability of methane-producing processes.

2. Materials and Methods

2.1. Experimental Materials

Cattle manure used in this study was collected from the dairy farm of Mengniu Modern Dairy (Shuangcheng) Co., Ltd., located in Harbin, China. After sampling, the manure was sealed in transparent polyethylene bags and stored at 4 °C for subsequent use. The inoculum slurry was obtained from the biogas digester of the same dairy farm. Prior to the experiment, the inoculum was pre-incubated at 35 °C on a shaker at 2 Hz for 24 h to minimize the influence of residual endogenous biogas production. Biochar was prepared from corn stalk sourced from the National Agricultural Science and Technology Demonstration Park of the Heilongjiang Academy of Agricultural Sciences. The stalk was crushed and passed through a 40-mesh sieve. Biochar was then produced at 550 °C with two different pyrolysis durations: 1 h (A1) and 2 h (A2). After pyrolysis, the biochar was immediately transferred to the outlet of the pyrolysis furnace for 5 min of air-cooling to prevent spontaneous combustion of high-temperature products upon exposure to oxygen. Once cooled to room temperature, the biochar was ground, sieved, and washed with deionized water to remove ash residues. The washed biochar was then dried in an oven at 100 °C and stored for further use. The physicochemical properties of the experimental materials are summarized in Table 1.

2.2. Experimental Design

The experiment was conducted at the Key Laboratory of Straw Energy Utilization in Heilongjiang Province. Based on previous studies [19], the anaerobic digestion (AD) conditions specified in this experiment are shown in Table 2. Three experimental groups were established: A3O (with 1 h pyrolysis of corn straw biochar), A3T (with 2 h pyrolysis of corn straw biochar), and a control group without biochar (CK). Each treatment was set up with three replicates and incubated in a constant-temperature incubator at 40 ± 1 °C, with a fermentation cycle of 30 days.
The experiment employed sequential batch anaerobic digesters, using 500 mL wide-mouth bottles as reactors. After the addition of substrate materials, 100 mL of inoculum slurry was introduced into each bottle, and the total volume was adjusted to 400 mL using distilled water. Then, nitrogen gas was purged into the bottles at a flow rate of 100 mL/min for more than 6 min to ensure a strictly anaerobic environment. The fermentation bottles were connected to gas collection and measurement bottles using latex tubing. All joints were sealed with paraffin wax, and the entire apparatus was tested for air tightness prior to use to ensure proper sealing throughout the digestion process.

2.3. Analysis Method

2.3.1. Characterization of Biochar

The biochar-to-water mixing ratio is 1:10, and its pH is measured using a pH meter (PHS-3G, Shanghai Yidi Science Instrument Co., Ltd., Shanghai, China). The morphology and structure of the biochar are observed using a scanning electron microscope (Regulus8220, Hitachi High-Tech(Shanghai) Co., Ltd., Shanghai, China). The specific surface area and pore size distribution of the biochar are determined by nitrogen adsorption measurements using a specific surface area analyzer (ASAP 2460, Micromeritics Instrument (Shanghai) Ltd., Shanghai, China). The functional group composition of the biochar is analyzed using a Fourier transform infrared spectrometer (ALPHA model, Bruker Corporation, Karlsruhe, Germany). The elemental composition of the biochar is determined with an elemental analyzer (Elementar Unicube, Elementar Analysensysteme GmbH, Frankfurt, Germany); the bulk phase elemental composition is measured using an X-ray fluorescence spectrometer (ZSXPrimusIIX, Rigaku Corporation, Tokyo, Japan). The potential difference is measured using an electrochemical workstation.

2.3.2. Determination of Physicochemical Properties of Fermentation Products

After the start of anaerobic fermentation, the gas displacement method with saturated saline solution was used to measure biogas production daily [12]. Based on changes in gas production and at different stages of anaerobic digestion, samples were taken every 2–5 days. The pH of the fermentation liquid was measured using a pH meter (PHS-3G, Shanghai Yidi Science Instrument Co., Ltd., Shanghai, China). ammonia nitrogen (NH3-N) concentration was determined by ultraviolet spectrophotometry. Chemical oxygen demand (COD) of the fermentation liquid was measured using a COD analyzer (Orion AQ4001, Thermo Fisher Scientific, Waltham, MA, USA), and the concentration of volatile fatty acids (VFAs) in the fermentation system was determined using gas chromatography (Agilent 7860A, Agilent Technologies, Inc., Santa Clara, CA, USA).

2.3.3. Microbial Analysis

Samples before and after anaerobic fermentation under different treatments were collected. Using the paired-end sequencing method, a small fragment library was constructed for sequencing. Reads were assembled, filtered, clustered, or denoised for species annotation and abundance analysis. The selected region for 16S rDNA amplification was V3-V4. The primers for bacterial sequencing were 341F (sequence F: CCTACGGGNGGCWGCAG) and 805R (sequence R: GACTACHVGGGTATCTAATCC), and the primers for archaeal sequencing were 304F (sequence F: CCCTAYGGGGYGCASCAG) and 1000R (sequence R: GGCCATGCACYWCYTCTC). According to the results of 16S rDNA, the metabolic pathway of microbial metabolism was predicted by PICRUSt (Phylogenetic Investigation of Communities by Reconstruction of Unobserved States) and FAPROTAX (Functional Annotation of Prokaryotic Taxa).

2.3.4. Statistical Analysis

All statistical data in this study were visualized using OriginPro 8.5 software (Originpro, OriginLab Corporation, Northampton, MA, USA). Using repeated measures analysis, each treatment or sample was analyzed in triplicate under identical conditions. Each treatment was carried out in three replicates to ensure reproducibility. The software of SPSS 23.0 (Statistical Product and Service Solutions) was used to analyze the data and their correlation. Adopting PERMANOVA (Permutational Multivariate Analysis of Variance) and NMDS (Non-metric Multidimensional Scaling) enabled us to analyze the differences in microbial community structure. The values shown in figures and tables represent the mean of the replicates. Differences were considered statistically significant when p < 0.05.

3. Results

3.1. Characteristics of Biochar Under Different Pyrolysis Time

The pH, TS, VS, SSA (Specific Surface Area), and TPV (Total Pore Volume) of biochar at different pyrolysis temperatures are shown in Table 3. According to the data in the table, as the pyrolysis time increases, the pH of the biochar does not change significantly, rising by only 0.1 units. This is because, unlike chemically modifying biochar, biochar itself is alkaline, and extending the pyrolysis time does not change its pH. However, as the pyrolysis time increases, some of the pore structures collapse or new pores are formed because the volatile substances release and the specific surface area consequently increases. After 2 h of pyrolysis, compared to 1 h, the total solids content of the biochar decreased by 2.1%, while the volatile solids content increased by 2.5%. The specific surface area of biochar increased from 2 to 6.32 m2/g with longer pyrolysis time, and the total pore volume also increased from 0.001175 cm3/g to 0.005366 cm3/g, which indicated that the longer pyrolysis duration time could promote biomass transferred to biochar and thus enhance its specific area [20].
Table 4 presents the measured voltage differences and relative elemental compositions of corn stalk-derived biochar under different pyrolysis durations. The results indicate that the voltage difference in sample A3O (−0.15 V) was slightly higher than that of A3T (−0.13 V), which may suggest that A3O possesses a more developed graphitic structure or retains more oxygen-containing functional groups such as C-O, C=O, thereby facilitating electron transfer and enhancing the methanogenic activity of microbes. In addition, compared with A3O, the relative carbon (C) content in A3T decreased to 65.19%, while the relative proportions of metallic elements increased, in which the content of Fe and Ni reached 0.547% and 0.025%, respectively, representing increases of 47.44% and 38.89%. This trend is likely due to the further volatilization of organic components such as cellulose and hemicellulose in the straw at the high temperature with prolonged pyrolysis time, resulting in a relative enrichment of metallic elements.
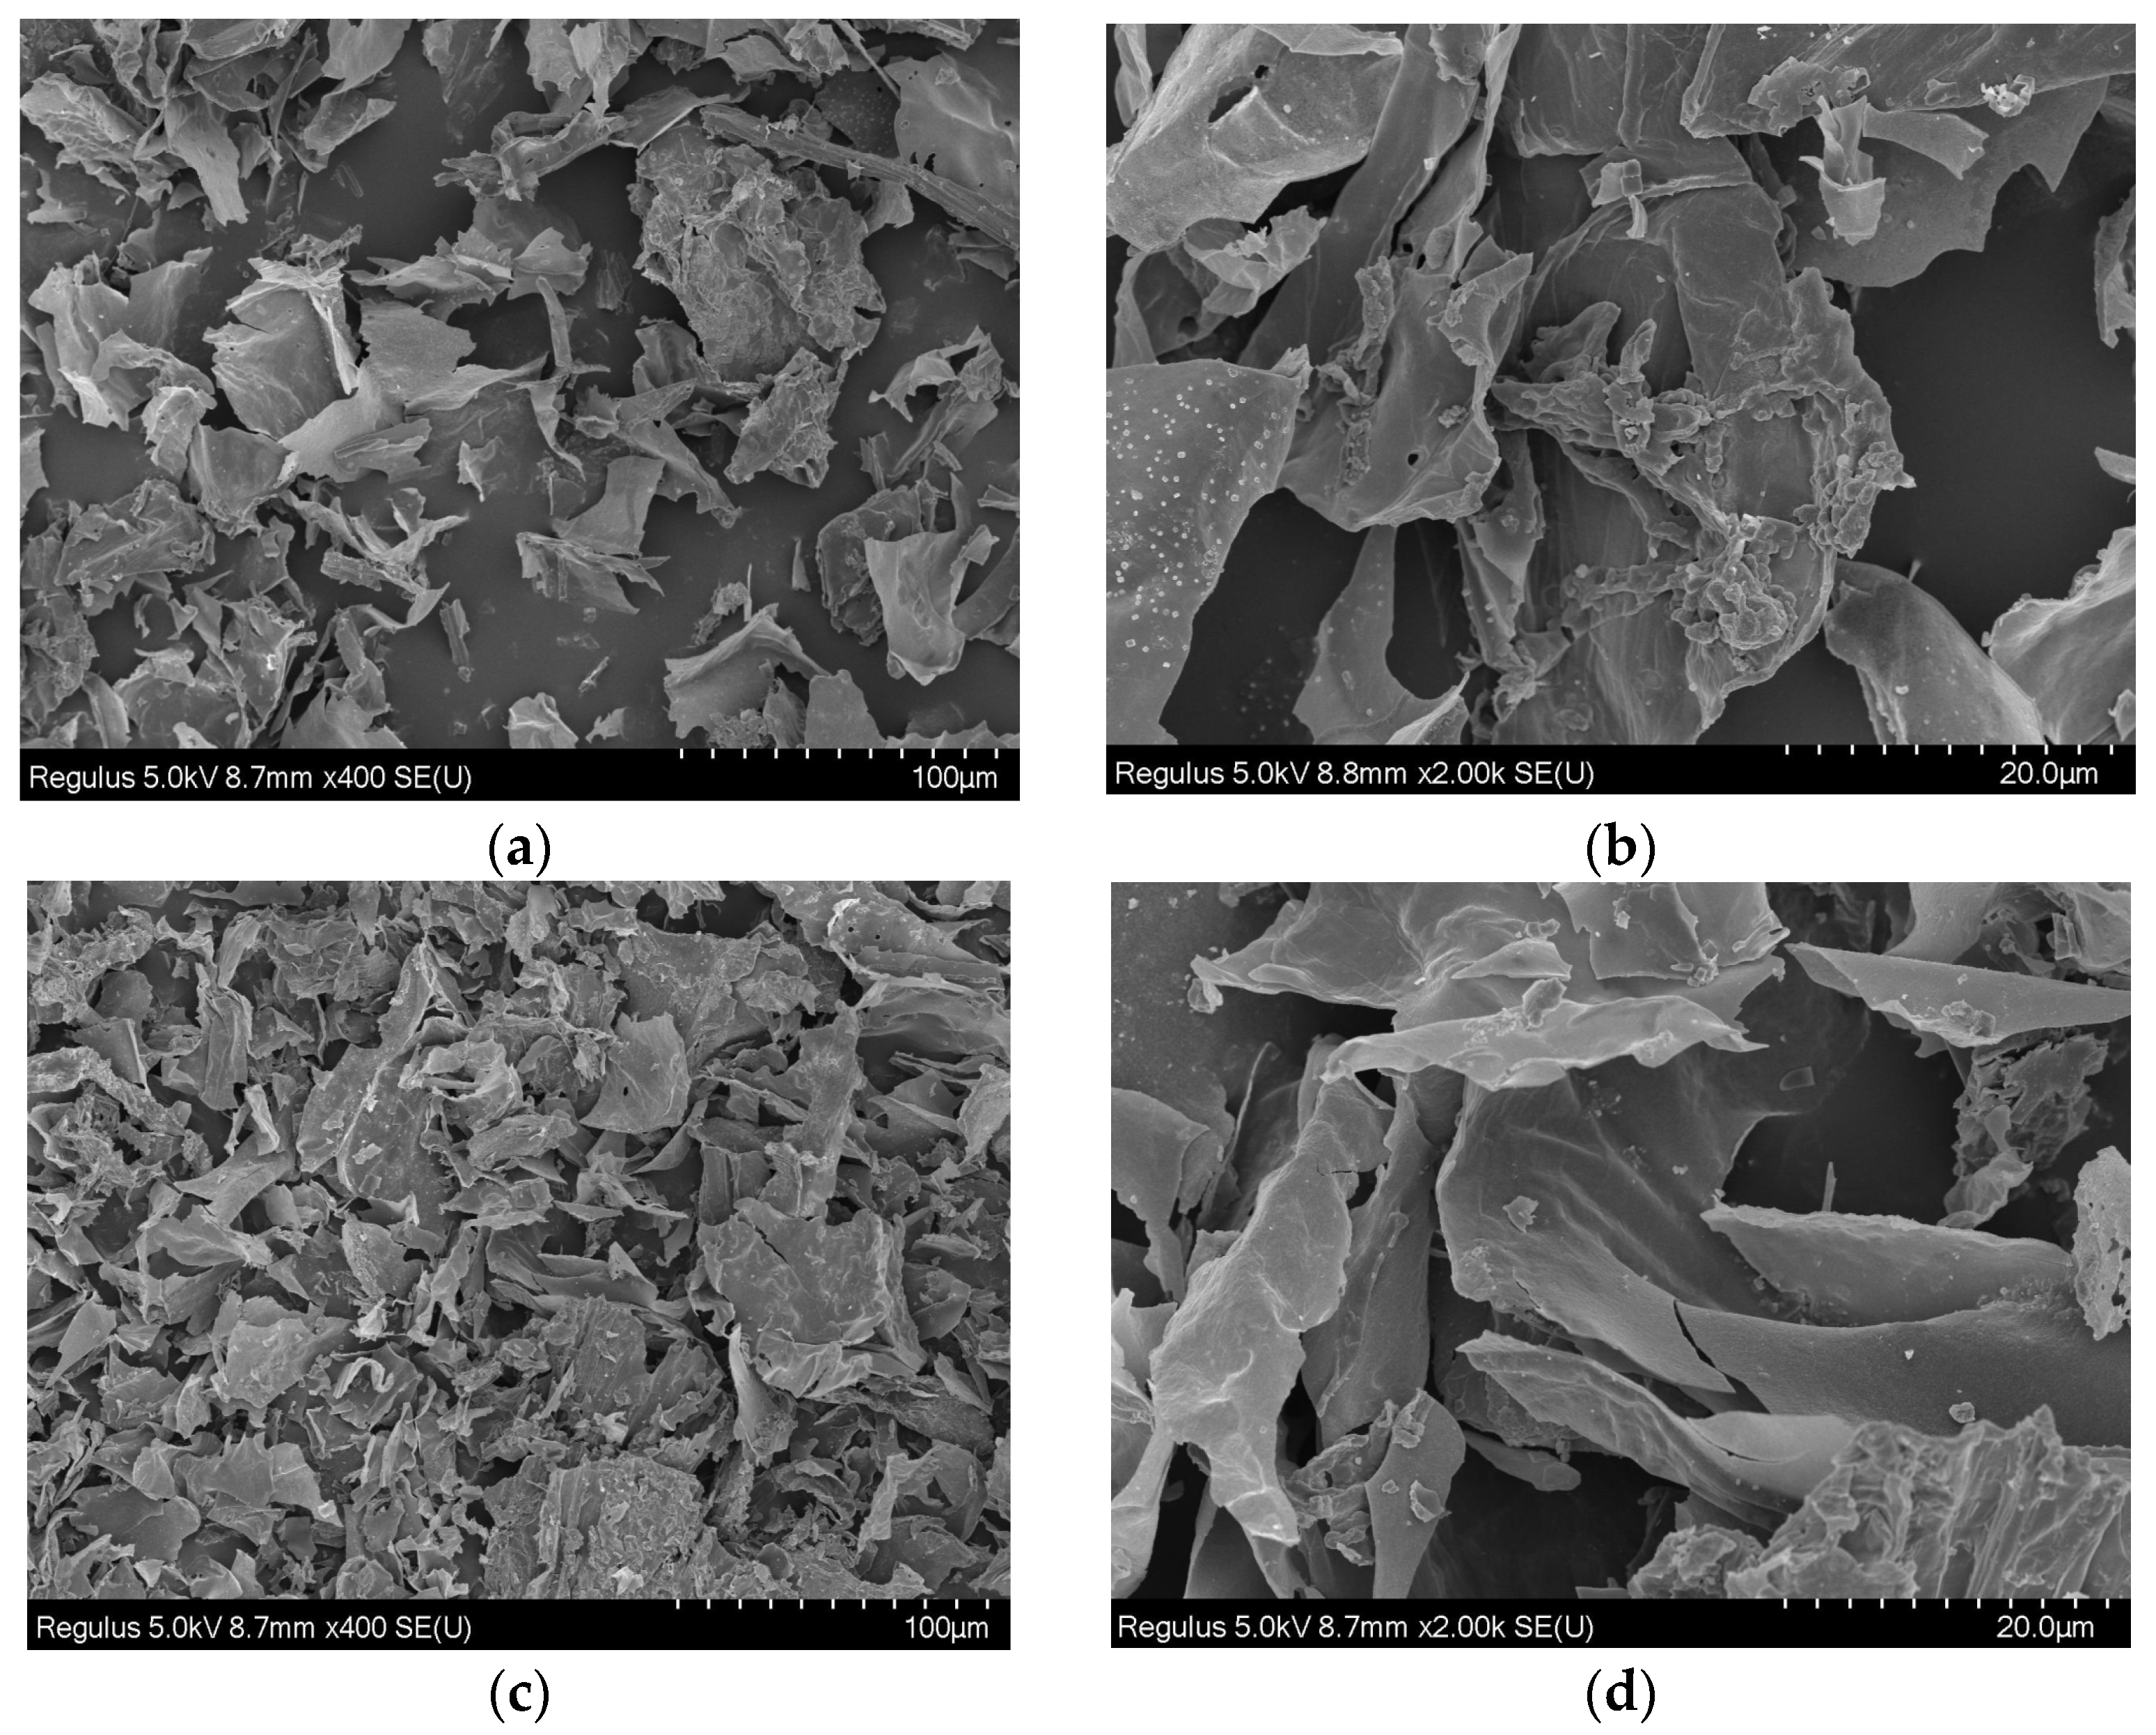
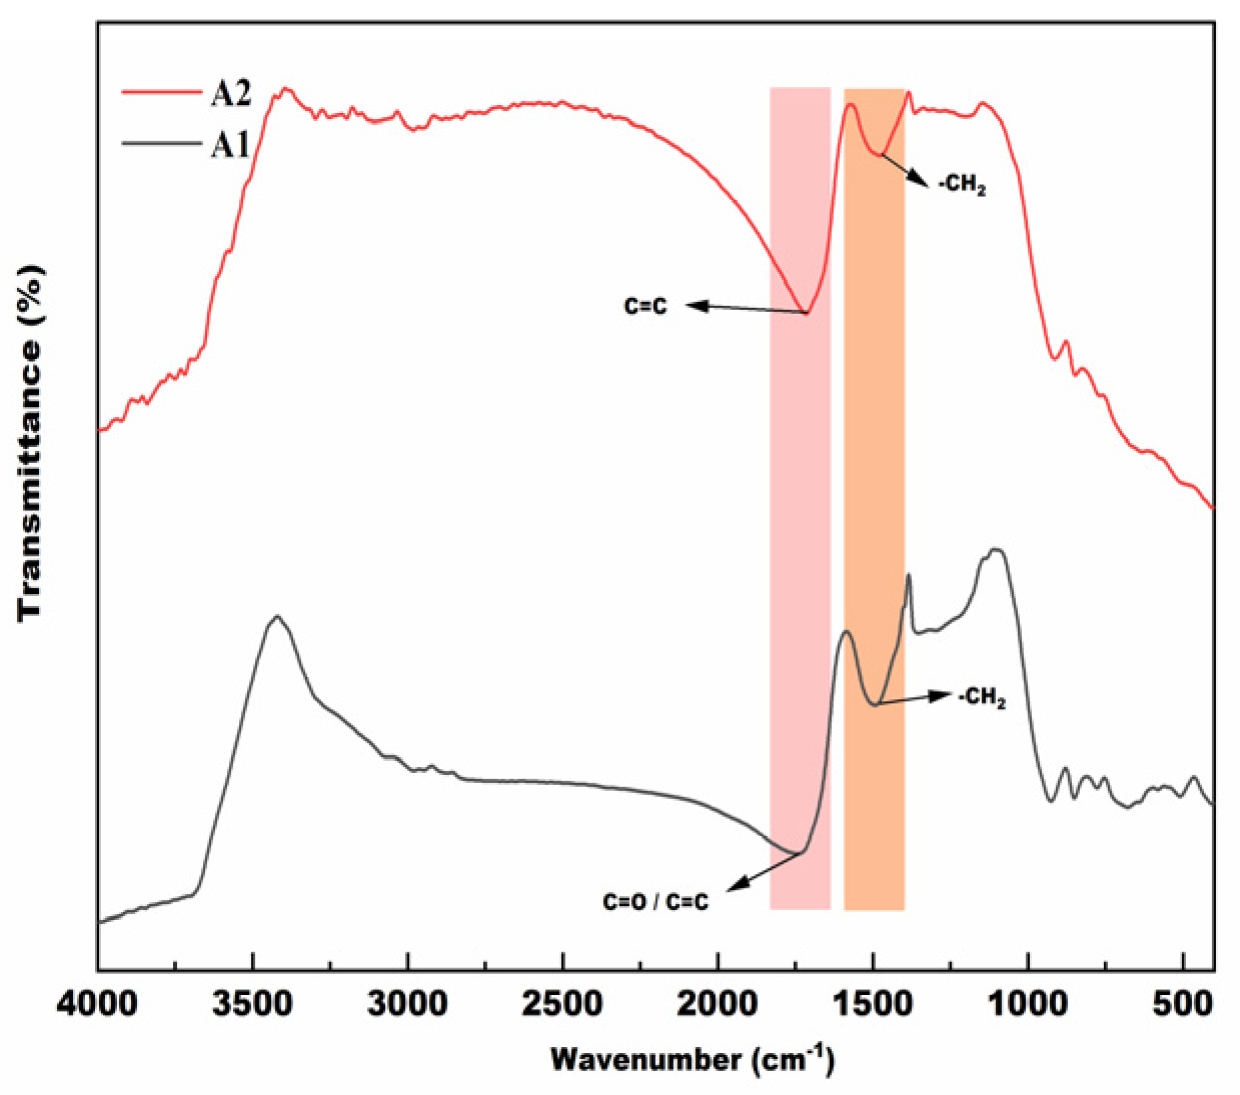
The microstructure properties of biochar under different pyrolysis time were shown on Figure 1a–d. Under different pyrolysis times, all of the biochar present irregular shapes. Compared with biochar prepared by pyrolysis 1 h, biochar that underwent pyrolysis for 2 h has a smoother surface with little impurities. The stalk is rich in organic constituents such as cellulose and lignin. Prior studies have demonstrated that heating rate and residence time markedly affect the contents of surface functional groups in biochar. In Figure 2, this study found that compared to biochar pyrolyzed for 1 h (A3O), the biochar pyrolyzed for 2 h (A3T) exhibited a weaker characteristic absorption peak for the C=O, while the characteristic peak for the aromatic framework (C=C) was relatively stronger [21]. The trend indicates that longer carbonization promotes decarboxylation/dehydration and thus increases aromaticity. These changes are consistent with the expected deoxygenation and structural ordering during thermal treatment. In addition, because prolonged heating leads to more complete carbonization, the total amount of acidic surface groups is correspondingly lower [22]. Therefore, through physicochemical property analysis of biochar, different pyrolysis times significantly shape the core characteristics of biochar. Biochar materials pyrolyzed and carbonized for 1 h retain more functional groups, demonstrating stronger adsorption active sites and modifiable potential. In contrast, those pyrolyzed and carbonized for 2 h exhibit continuously enhanced aromatization, stabilized pore structures with more concentrated pore size distribution, and significantly increased fixed carbon content. These characteristics may provide superior effects in promoting microbial enrichment and interspecies electron transfer.

3.2. Methane Production During Batch Experiment of AD

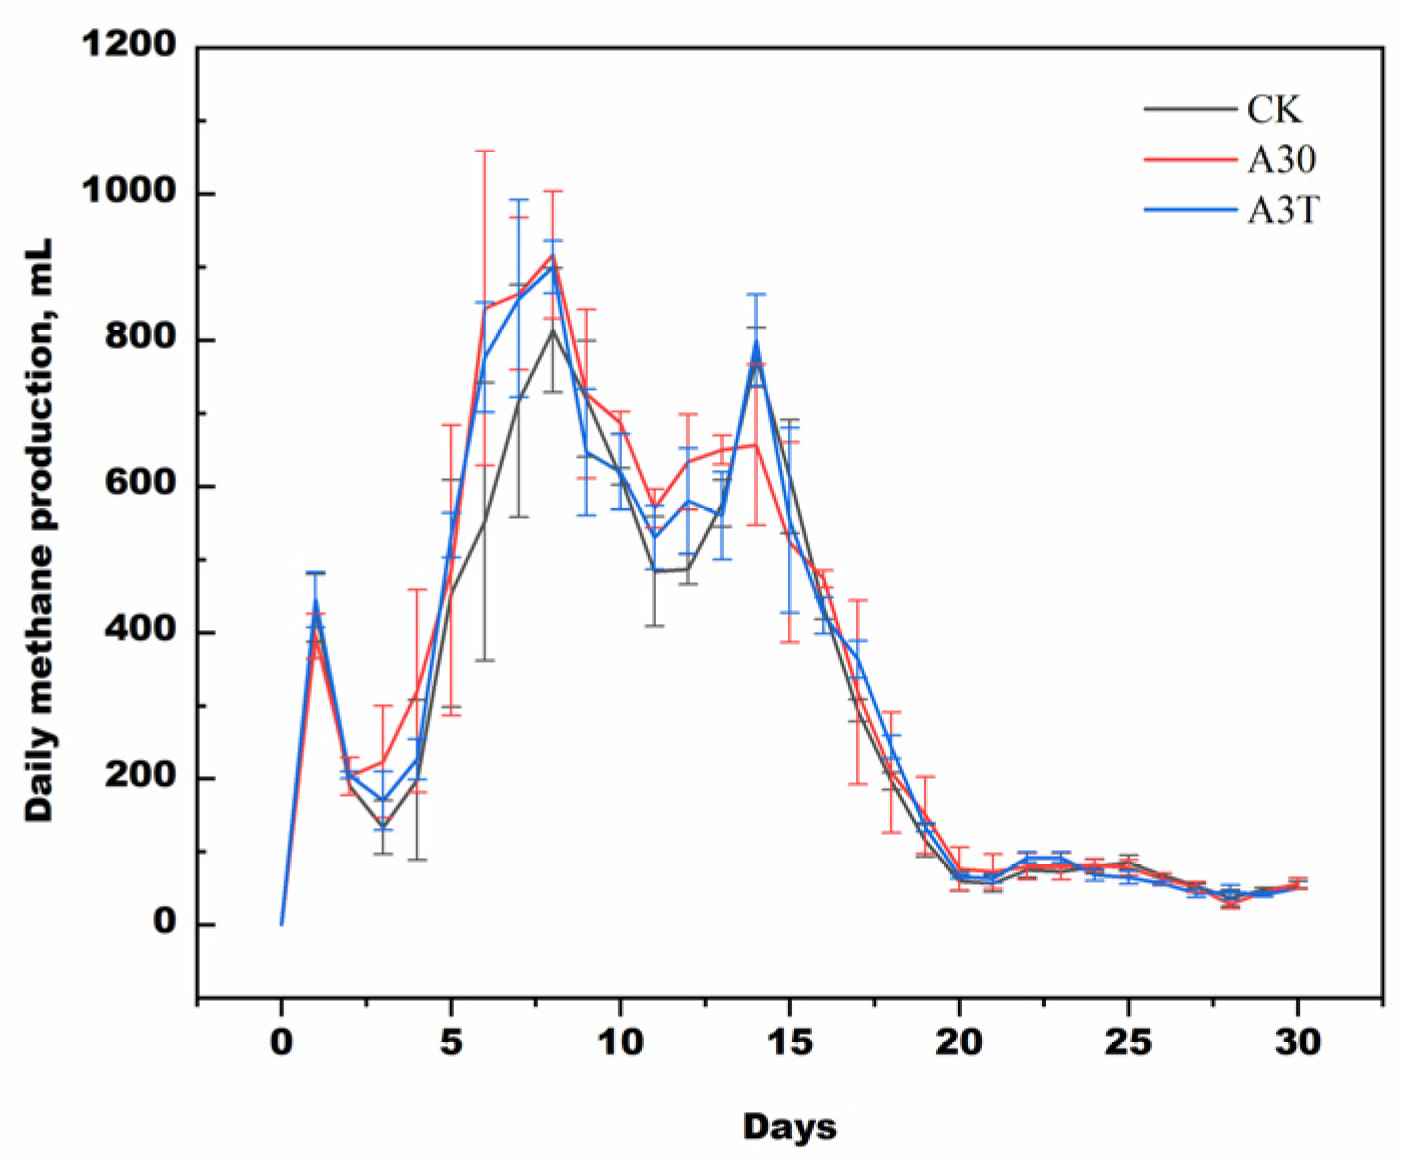
Methane yield is a key indicator for evaluating AD efficiency. As shown in Figure 3, the overall trend of methane production in AD systems under different treatments is generally consistent, exhibiting a rapid accumulation, reaching a peak, and then declining sharply. Compared to CK, the systems with added stalk-derived biochar (A3O and A3T) significantly increased the cumulative methane yield during the start-up phase. This may be because the introduction of biochar effectively promoted the anaerobic metabolic activity and electron transfer efficiency of microorganisms. Overall, the total methane production of A3O and A3T was similar, and the average cumulative methane production was 10,680 and 10,352 mL, respectively, representing increases of 8.48% and 5.15% compared to CK (9845 mL). In the early stage of fermentation (0–5 days), the gas production was low after each treatment was initiated, primarily due to the accumulation of acids, which led to a rapid decline in biogas yield. However, the addition of biochar treatment demonstrated superior overall biogas production efficiency compared to the control group (CK), with enhanced system stability. This might be related to the higher specific surface area of biochar and more developed pore structure, favoring the attachment and colonization of methanogens on the biochar surface. From the fifth day, the gas production of A3T and A3O continued to rise, and gradually entered into the peak gas production period. On the eighth day, the average biogas production of CK was 814 mL, while that of A3O and A3T was 916 mL and 901 mL respectively. Based on the biochar material test results, A3O demonstrated superior performance in voltage difference, which to some extent facilitates early electron interaction among microorganisms. Biogas production in each treatment showed a gradual decline on day 9, but rebounded between days 12 and 14. Notably, the A3T treatment achieved an average daily biogas yield of 800 mL on day 14. It may be attributed to the higher specific surface area of A3T biochar, which facilitates the attachment and colonization of methanogens on its surface. After day 15, the gas production in all treatments gradually stabilized, indicating substantial consumption of easily degradable substrates and the system reaching a steady state. This indicates that biochar served as both an electron donor and mediator, facilitating hydrogenotrophic methanogenesis and providing a stable interface for microbial electron transfer [23]. Compared with A3O, A3T contained fewer oxygen-containing functional groups (e.g., –COOH, –OH) but exhibited stronger aromaticity, which improved its electrical conductivity and electron transport capacity, resulting in a higher methane production efficiency.

3.3. The Characteristics of the Slurry

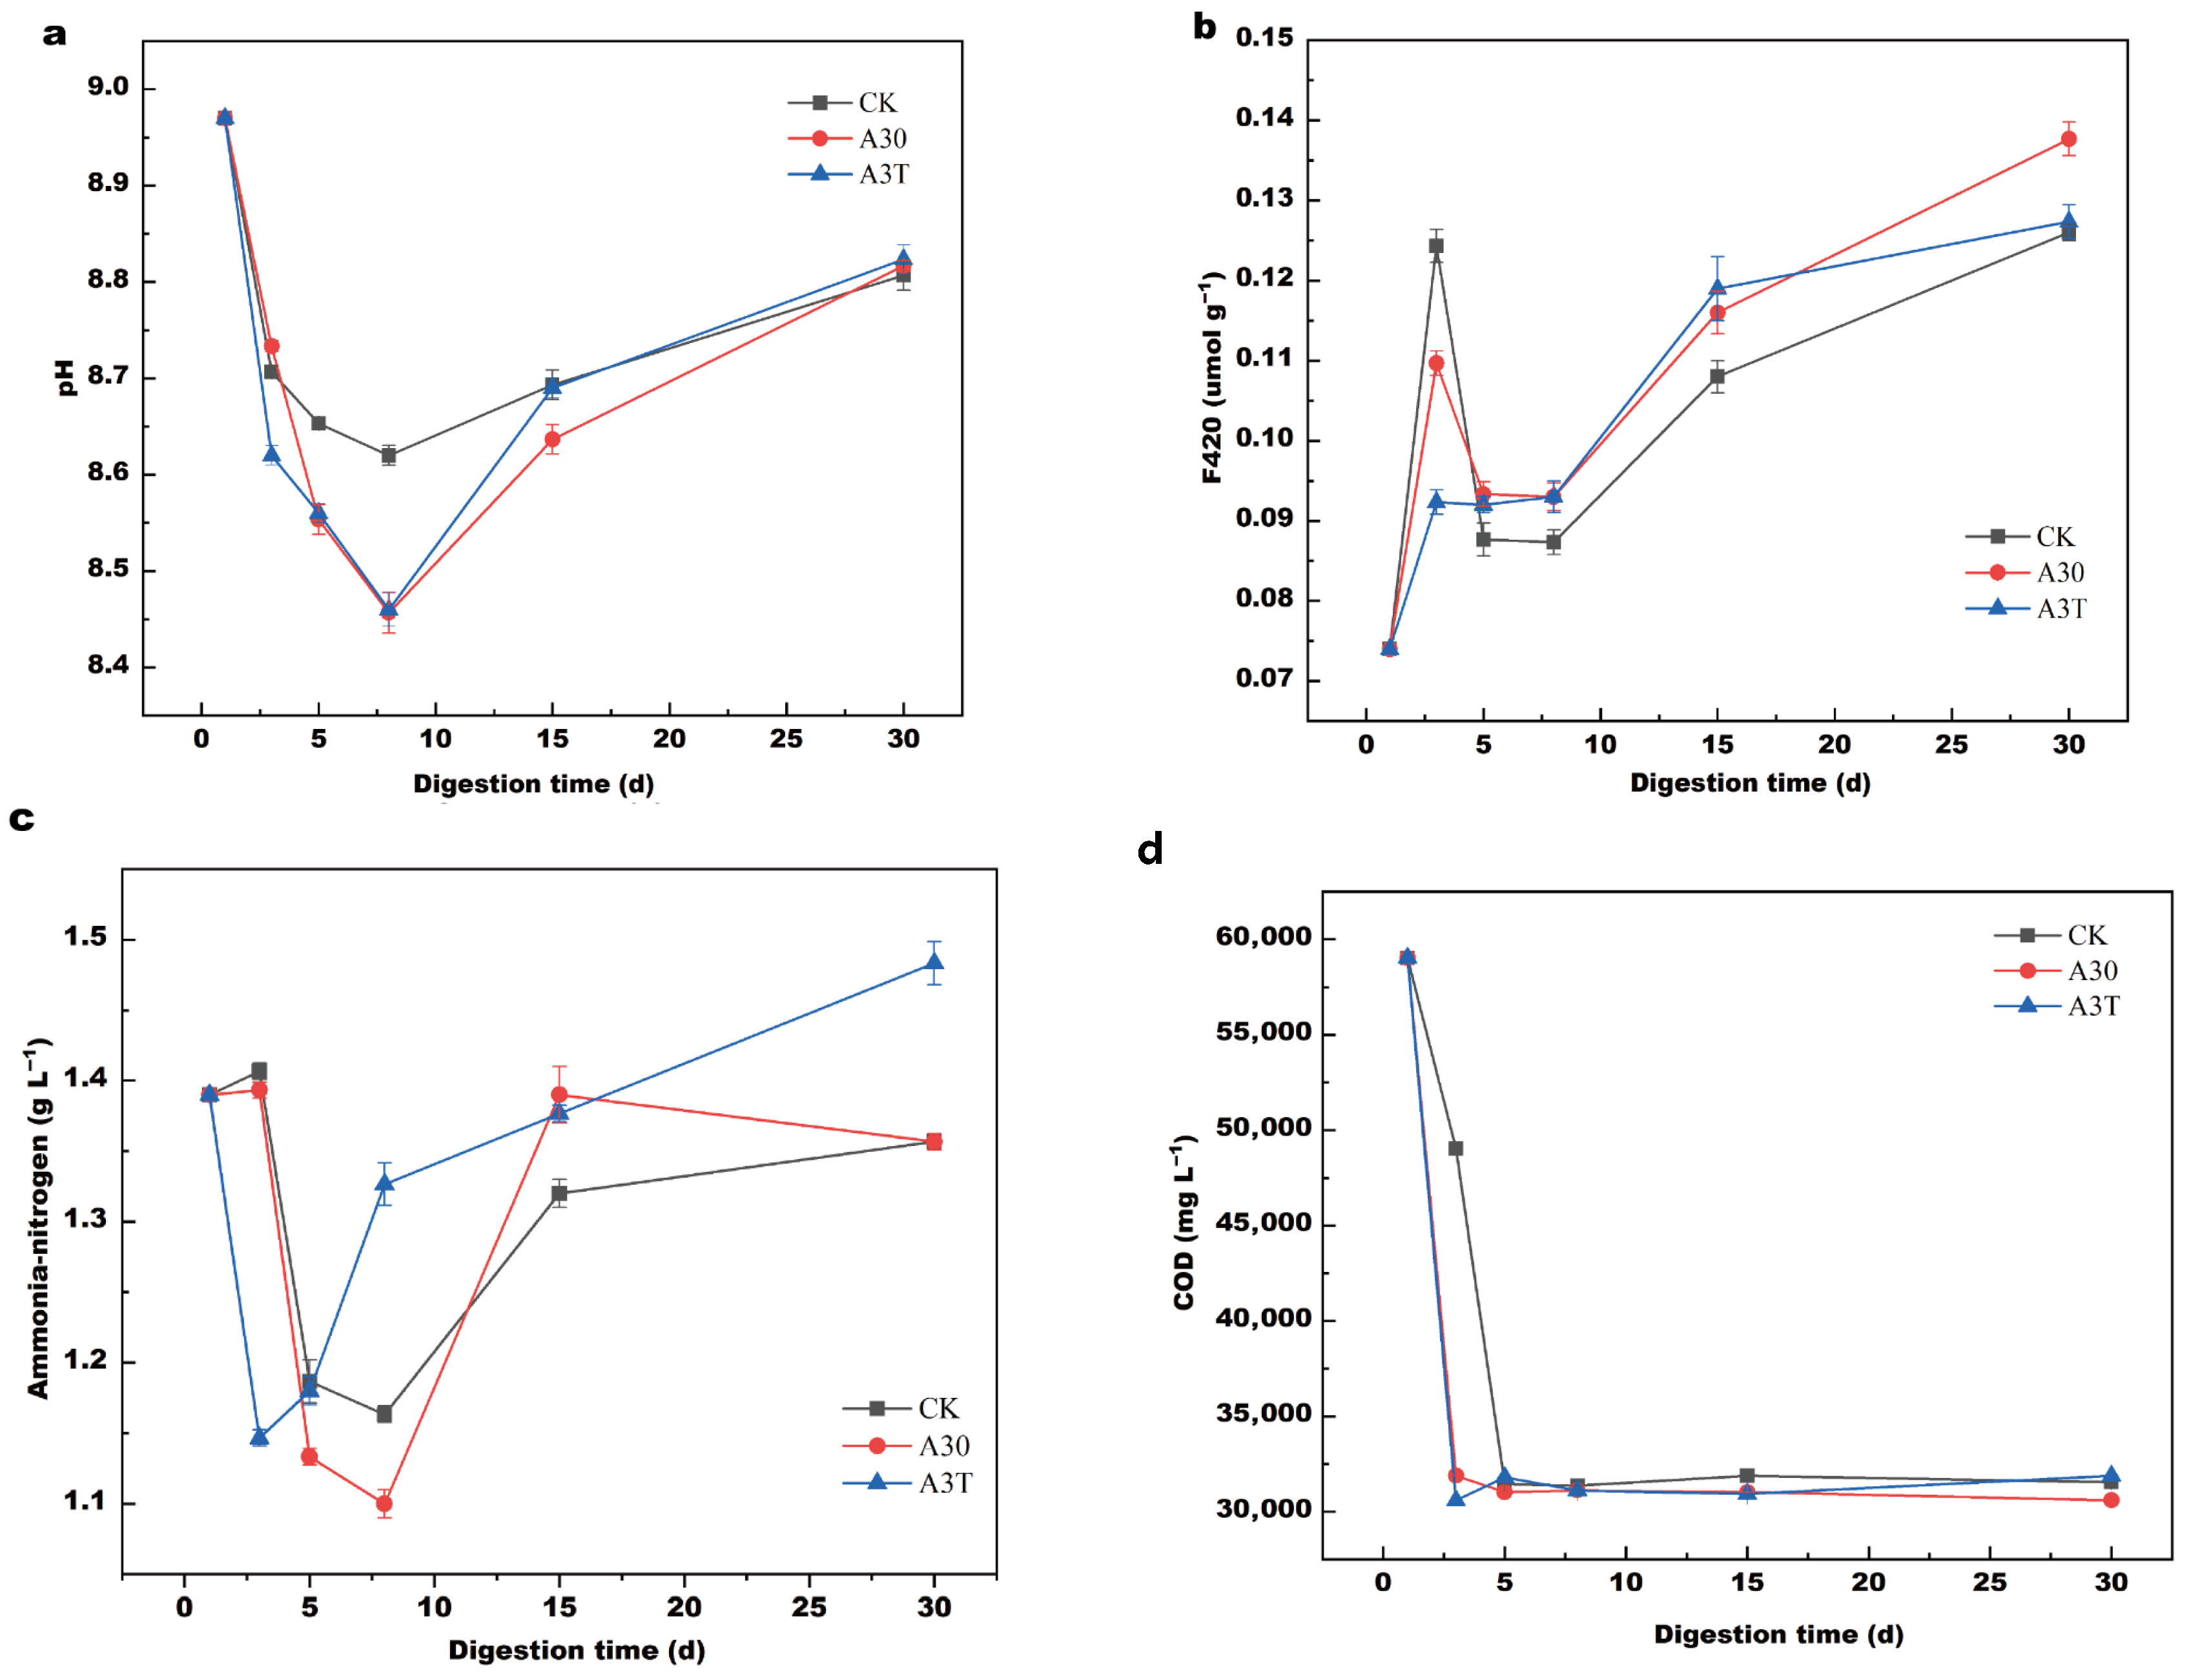
The activity and metabolic capacity of microorganisms during anaerobic digestion are closely related to the system’s pH, which is one of the key indicators for determining whether the anaerobic fermentation system can operate stably. Generally, an appropriate pH is more conducive to stable gas production in the fermentation system, whereas excessively high or low pH may inhibit microbial activity, resulting in poor gas production efficiency [24]. As shown in Figure 4, overall, the pH values under different experimental treatments exhibit a similar trend, first decreasing and then increasing. Among them, compared to CK (8.62), the decreases in pH for A3O and A3T are more pronounced, reaching as low as 8.46. F420, a key coenzyme in the methanogenesis process, plays an important role in methane production and yield improvement [25]. Figure 4b shows the F420 content under different treatments. The figure indicates that although the F420 content in the CK treatment is the highest at the initial stage of the reaction, it gradually decreases as the reaction proceeds, while the F420 content in the A3O and A3T treatments begins to increase, reaching a maximum of 0.14 µmol g−1. This may be because the addition of biochar can buffer the inhibitory effects of the fermentation environment on methanogenic archaea, promoting better synthesis of cofactors within the cells.
The nitrogen content in cow manure is abundant and can be gradually converted into free ammonia and ammonium ions during anaerobic digestion [26]. The accumulation of these substances inhibits microbial metabolic activity, leading to a lower methane yield. Figure 4c shows the ammonia nitrogen content under different treatments. In the initial stage of the reaction, the ammonia nitrogen content in all treatments shows a rapid decline, which may be due to the large demand for ammonia nitrogen resulting from the massive proliferation of microorganisms during the reaction. As the reaction continues, microbial utilization of nitrogen tends to stabilize, causing a rebound in ammonia nitrogen levels. In addition, between days 5 and 10, the ammonia nitrogen content in the A3O treatment is the lowest at 1.1 g L−1, corresponding to the highest methane yield. This indirectly indicates that a lower ammonia nitrogen concentration in the system results in a higher methane yield. The value of COD can intuitively reflect the amount of organic matter in the reaction system. Figure 4d shows that in the early stage of the reaction, the COD of different treatments is 59,000 mg L−1, and as fermentation proceeds, the COD in A3O and A3T rapidly drops to 31,886 and 30,591 mg L−1, respectively, both significantly lower than the 49,037 mg L−1 observed in the CK treatment. It indicates that the addition of biochar in the early stage of the reaction helps to promote the rapid and extensive hydrolysis of organic matter, thereby providing sufficient substrates for methane synthesis. However, this study found that the effects of biochar pyrolyzed at different times on COD did not show statistically significant differences.
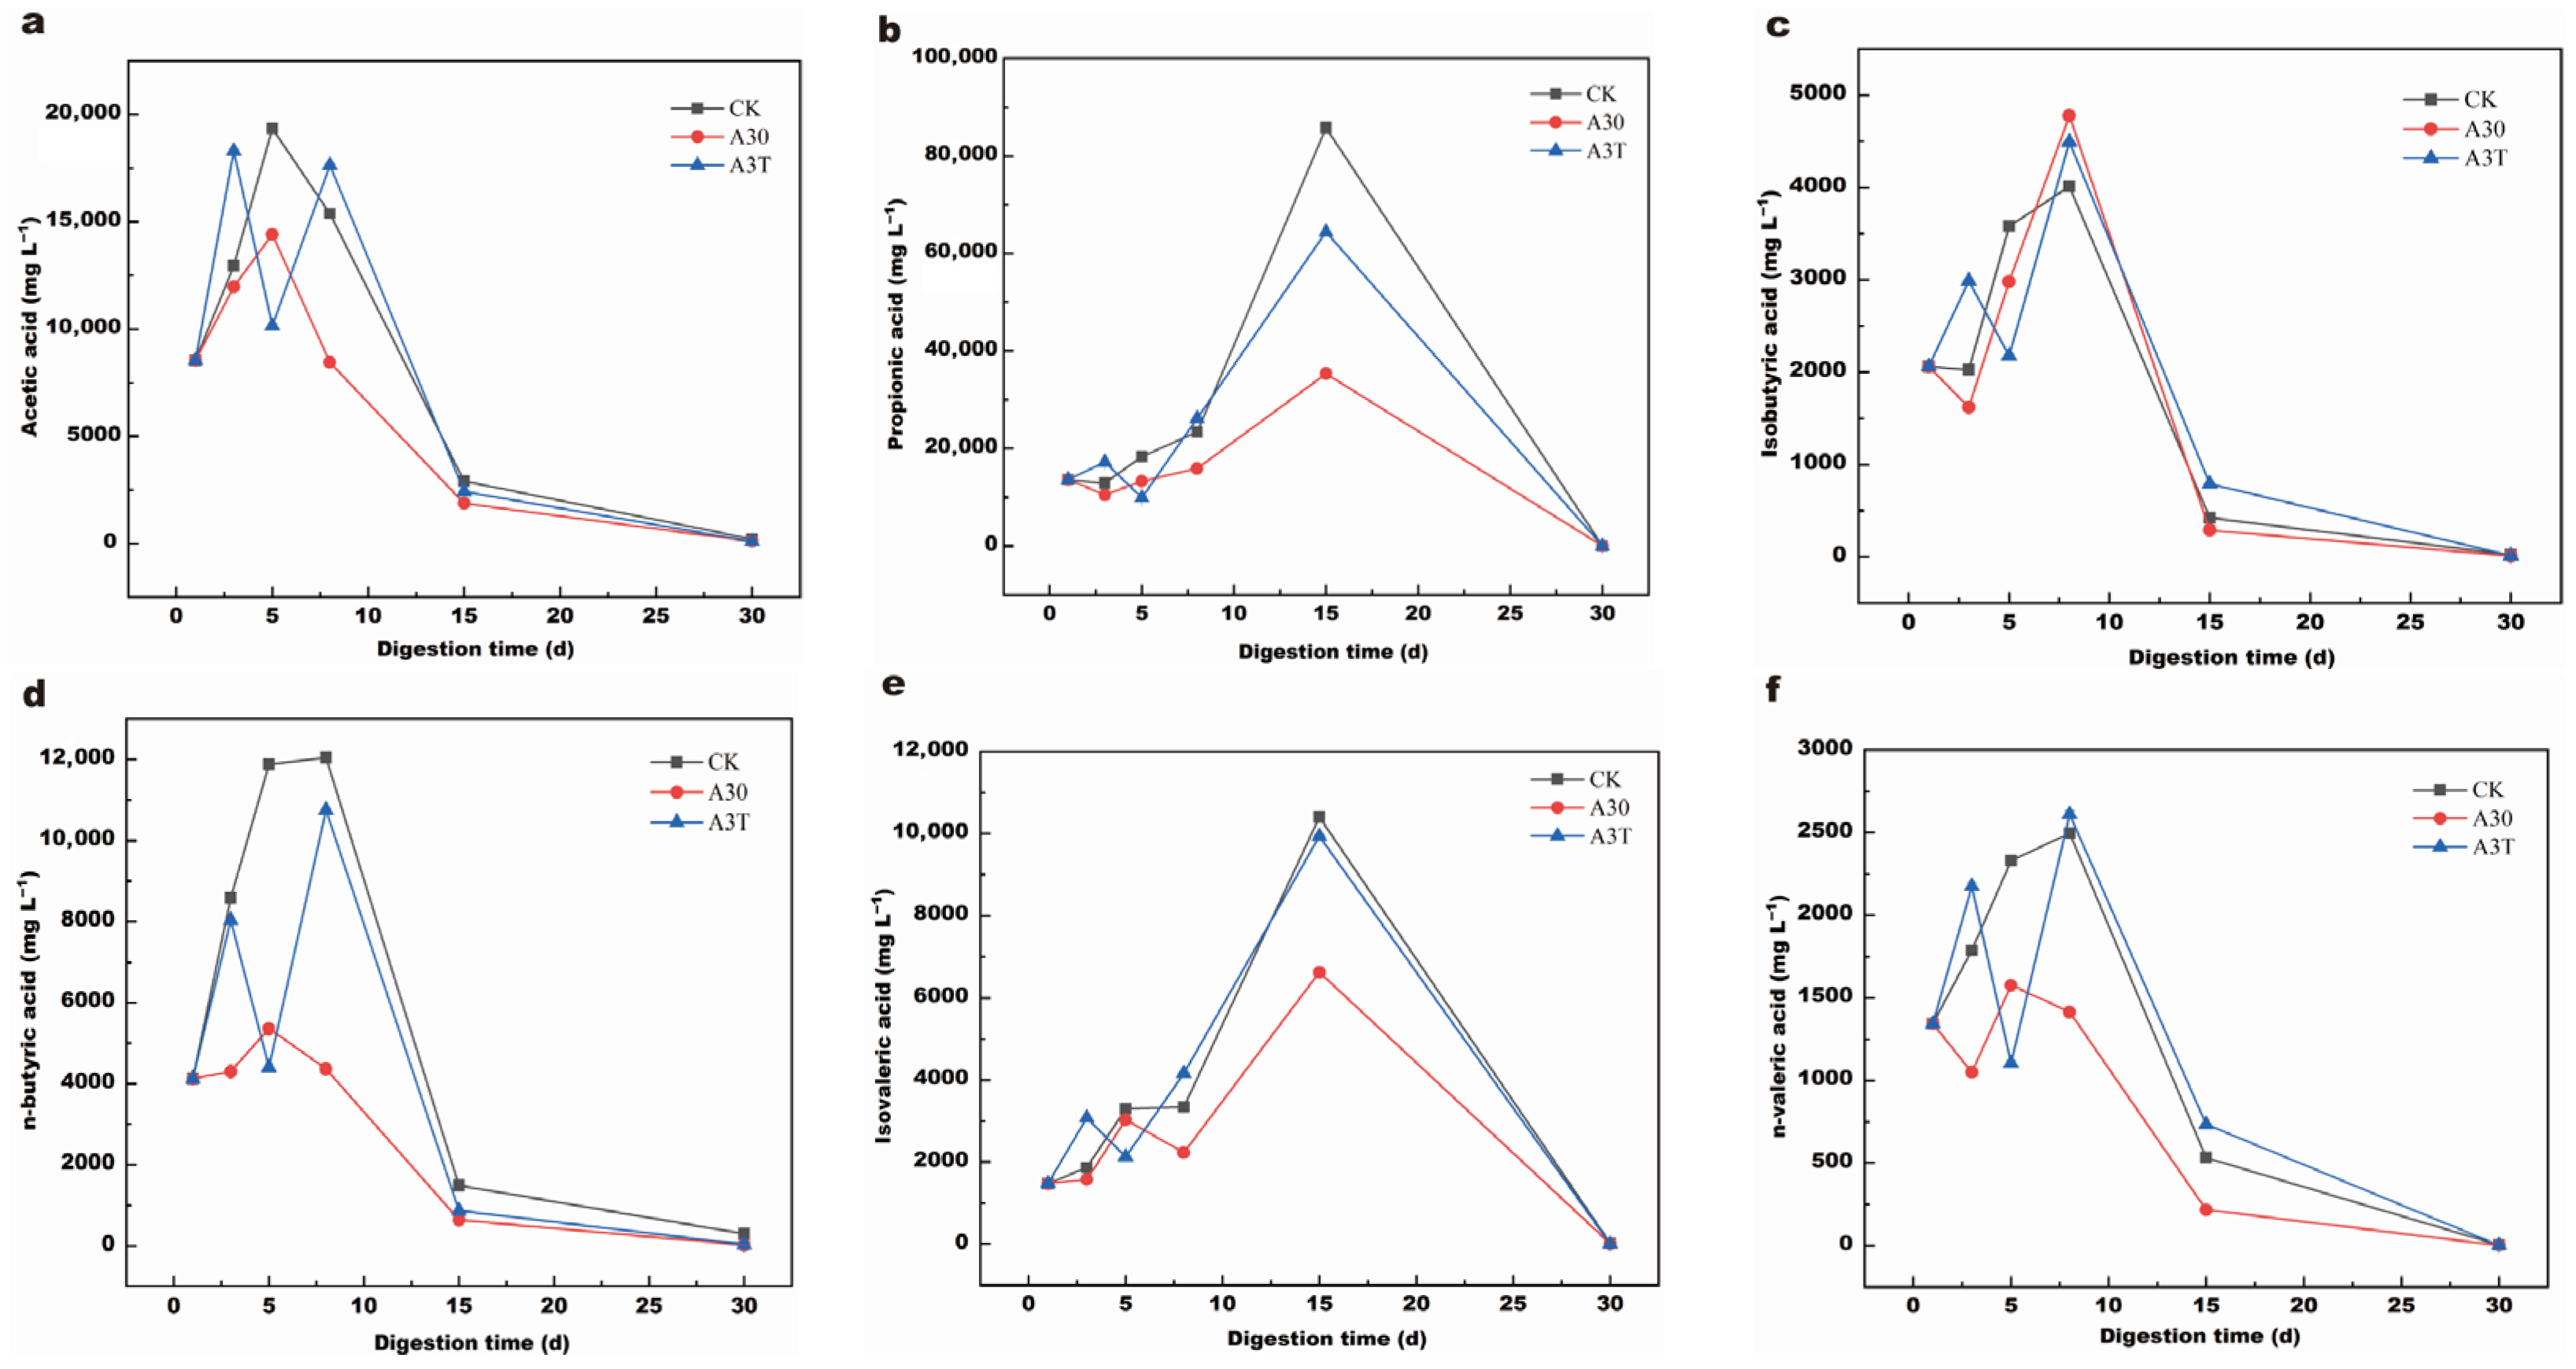
The changes in volatile fatty acids under different treatments are shown in Figure 5. Figure 5a–f indicates that the trends in the concentrations of different organic acids under each treatment are opposite to the changes in pH. This further confirms that as organic acids accumulate, the system’s pH correspondingly fluctuates downward. Overall, as the fermentation reaction progresses, the concentrations of various organic acids under different treatments show an upward trend, but during the middle and later stages, the concentrations of organic acids continuously decrease. The concentration of acetic acid rapidly increases and accumulates during the initial fermentation stage. The concentrations of CK and A3O reached their maximum on the fifth day of fermentation, then gradually decreased. Notably, the CK treatment achieved the highest acetic acid concentration of 19,359.14 μg/g. The concentration of acetic acid in A3T reached 18,309.52 μg/g on the third day of fermentation and began to decrease with the anaerobic fermentation process continued; it then rose again to 17,638.84 μg/g after the peak of gas production which was followed by a rapid decrease, and finally it remained essentially the same as the other treatments. The concentration of propionic acid in each treatment increased gradually with the anaerobic fermentation process and reached the peak value in the late stage of gas production. The concentration of propionic acid in CK treatment reached 85,791 μg/g, and then decreased rapidly and remained below 25 μg/g. The accumulation of each treated organic acid showed a positive correlation trend. It may be that the massive reproduction and secretion of various extracellular hydrolases by microorganisms promoted the decomposition and transformation of organic matter, resulting in the production of large quantities of volatile fatty acids in the early stage of the reaction. Subsequently, as the process enters the methanogenesis stage, methanogenic bacteria continuously consume the volatile fatty acids in the system, leading to a decrease in the volatile fatty acid content [27]. In summary, biochar materials can regulate the pH stability of anaerobic digestion systems, promote the synthesis and accumulation of key coenzyme F420, and modulate the ammonia nitrogen conversion process. The dynamic changes in volatile fatty acids (VFA) exhibit a certain negative correlation with system pH values, and their accumulation and consumption can reflect microbial metabolic activity and fermentation stage transformations to some extent. The addition of biochar materials further facilitates the modification of VFA accumulation peaks and temporal characteristics, enhances efficient VFA consumption during the methanogenesis phase, mitigates acid inhibition risks, and provides critical support for stable gas production in the system.

3.4. The Changes in Bacterial Communities

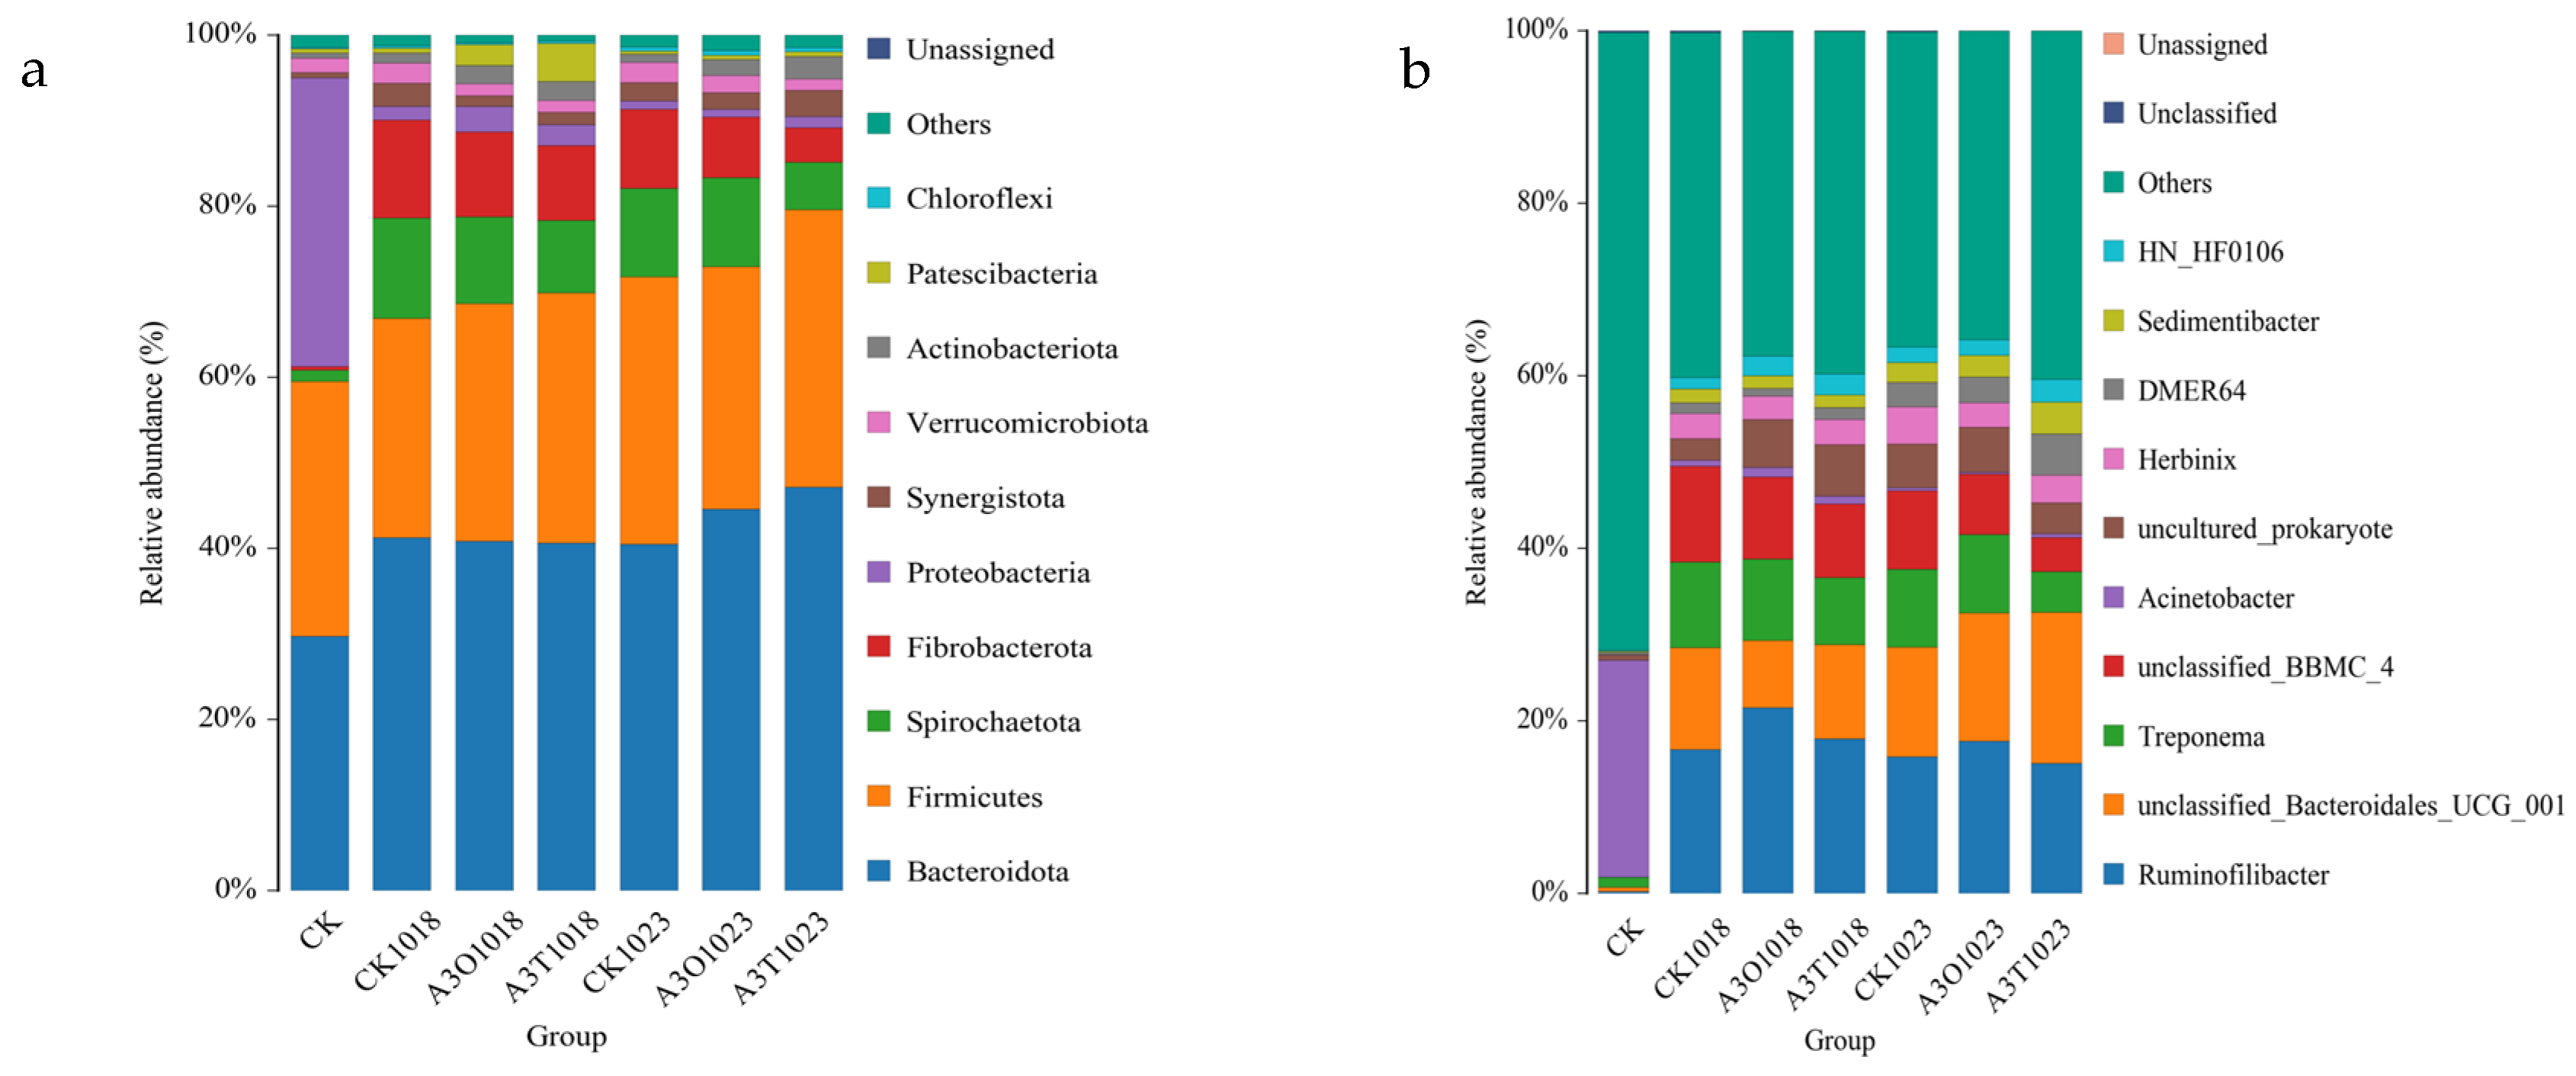
Under normal circumstances, bacteria play a crucial role in the hydrolysis and conversion of complex organic polymers and proteins into small-molecule monomers that are usable by microorganisms. Therefore, different substrates and fermentation environments determine the structure and composition of bacterial communities. Based on the variation in gas production during anaerobic fermentation, fermentation broth samples were collected during the peak and late peak periods of gas production. To distinguish the samples, the sampling group and sampling time (1018 and 1023) were used as suffixes in the sample names for facilitating the analysis of bacterial microbial relative abundance, as shown in Figure 6a,b. This study found that the dominant bacterial groups at the phylum level in different treatments were generally similar, The Firmicutes phylum consistently maintained a dominant position throughout the entire fermentation cycle. On the other hand, as fermentation progressed, the relative abundance of Bacteroidetes phylum significantly increased, coexisting with Firmicutes as the predominant microbial community. The relative abundance of Bacteroidota in all treatments increased from 29.74% (CK) at the initial stage of fermentation to over 40% on the fifth day. By the 11th day, when all treatments reached the late stage of the gas production peak, the relative abundance of Bacteroidota slightly decreased to 40.48% in the CK treatment, but increased slightly from 40.60% to 47.14% and from 40.85% to 44.58% in A3T and A3O, respectively. The relative abundance of Firmicutes increased from 29.77% at the start of fermentation, showing a slight decline during the anaerobic fermentation process (Day 5), and rose to approximately 30% by the late stage of gas production (Day 10), with the A3T treatment achieving the highest relative abundance of 32.41%. Bacteroidota and Firmicutes play important roles in organic matter hydrolysis and acid production, and changes in their relative abundance within the microbial community also reflect issues related to acid accumulation in the system [28,29]. In addition, it is noteworthy that in the CK treatment, the relative abundance of Proteobacteria and Fibrobacterota was relatively low. As the fermentation reaction proceeded, the relative abundance of Proteobacteria significantly decreased, while that of Fibrobacterota increased markedly. Previous studies have found that the phylum Fibrobacterota consists of bacteria closely related to anaerobic fermentation, capable of further converting small-molecule sugars into small-molecule organic acids that can be utilized by methanogenic archaea, thereby providing available substrates for methanogens. However, biochar produced at different pyrolysis times had a relatively minor impact on the main microbial community composition in the fermentation system.
At the genus level, the microbial community composition at different treatments and time points displayed distinct structural differences and exhibited certain patterns of succession over the course of digestion. Overall, aside from Unassigned/Unclassified and Others, Ruminofilibacter showed relatively high abundance in all treatments, which was about 2.14% before fermentation and increased to 16.66% in CK, 17.93% in A3T and 21.51% in A3O during anaerobic digestion. Its relative abundance decreased slightly after the peak of biogas production. Unclassified_Bacteroidales_UCG_001, a member of Bacteroidales, initially constituted less than 0.5% of the total bacterial abundance in the fermentation slurry. As anaerobic fermentation progressed, it gradually emerged as a dominant microbe, accounting for approximately 10% of the total. During the late biogas production peak, its abundance reached 12.68% in the CK treatment, 14.81% in the A3O treatment, and peaked at 17.50% in the A3T treatment. While Acinetobacter reached a relative abundance of 25.14% in the initial samples of CK, its abundance consistently declined below 1.13% after anaerobic digestion began. On the other hand, Treponema [30], which is associated with the hydrolysis or fermentation of complex carbon sources such as polysaccharides and cellulose, accounted for 1.15% in CK but gradually increased to around 10% in all treatments as fermentation progressed. These results indicate that a typical community succession occurred in the anaerobic digestion system between the start-up and stabilization phases, and the changes in the relative abundance of bacterial groups such as Acinetobacter and Treponema may be related to variations in environmental factors during the fermentation process.
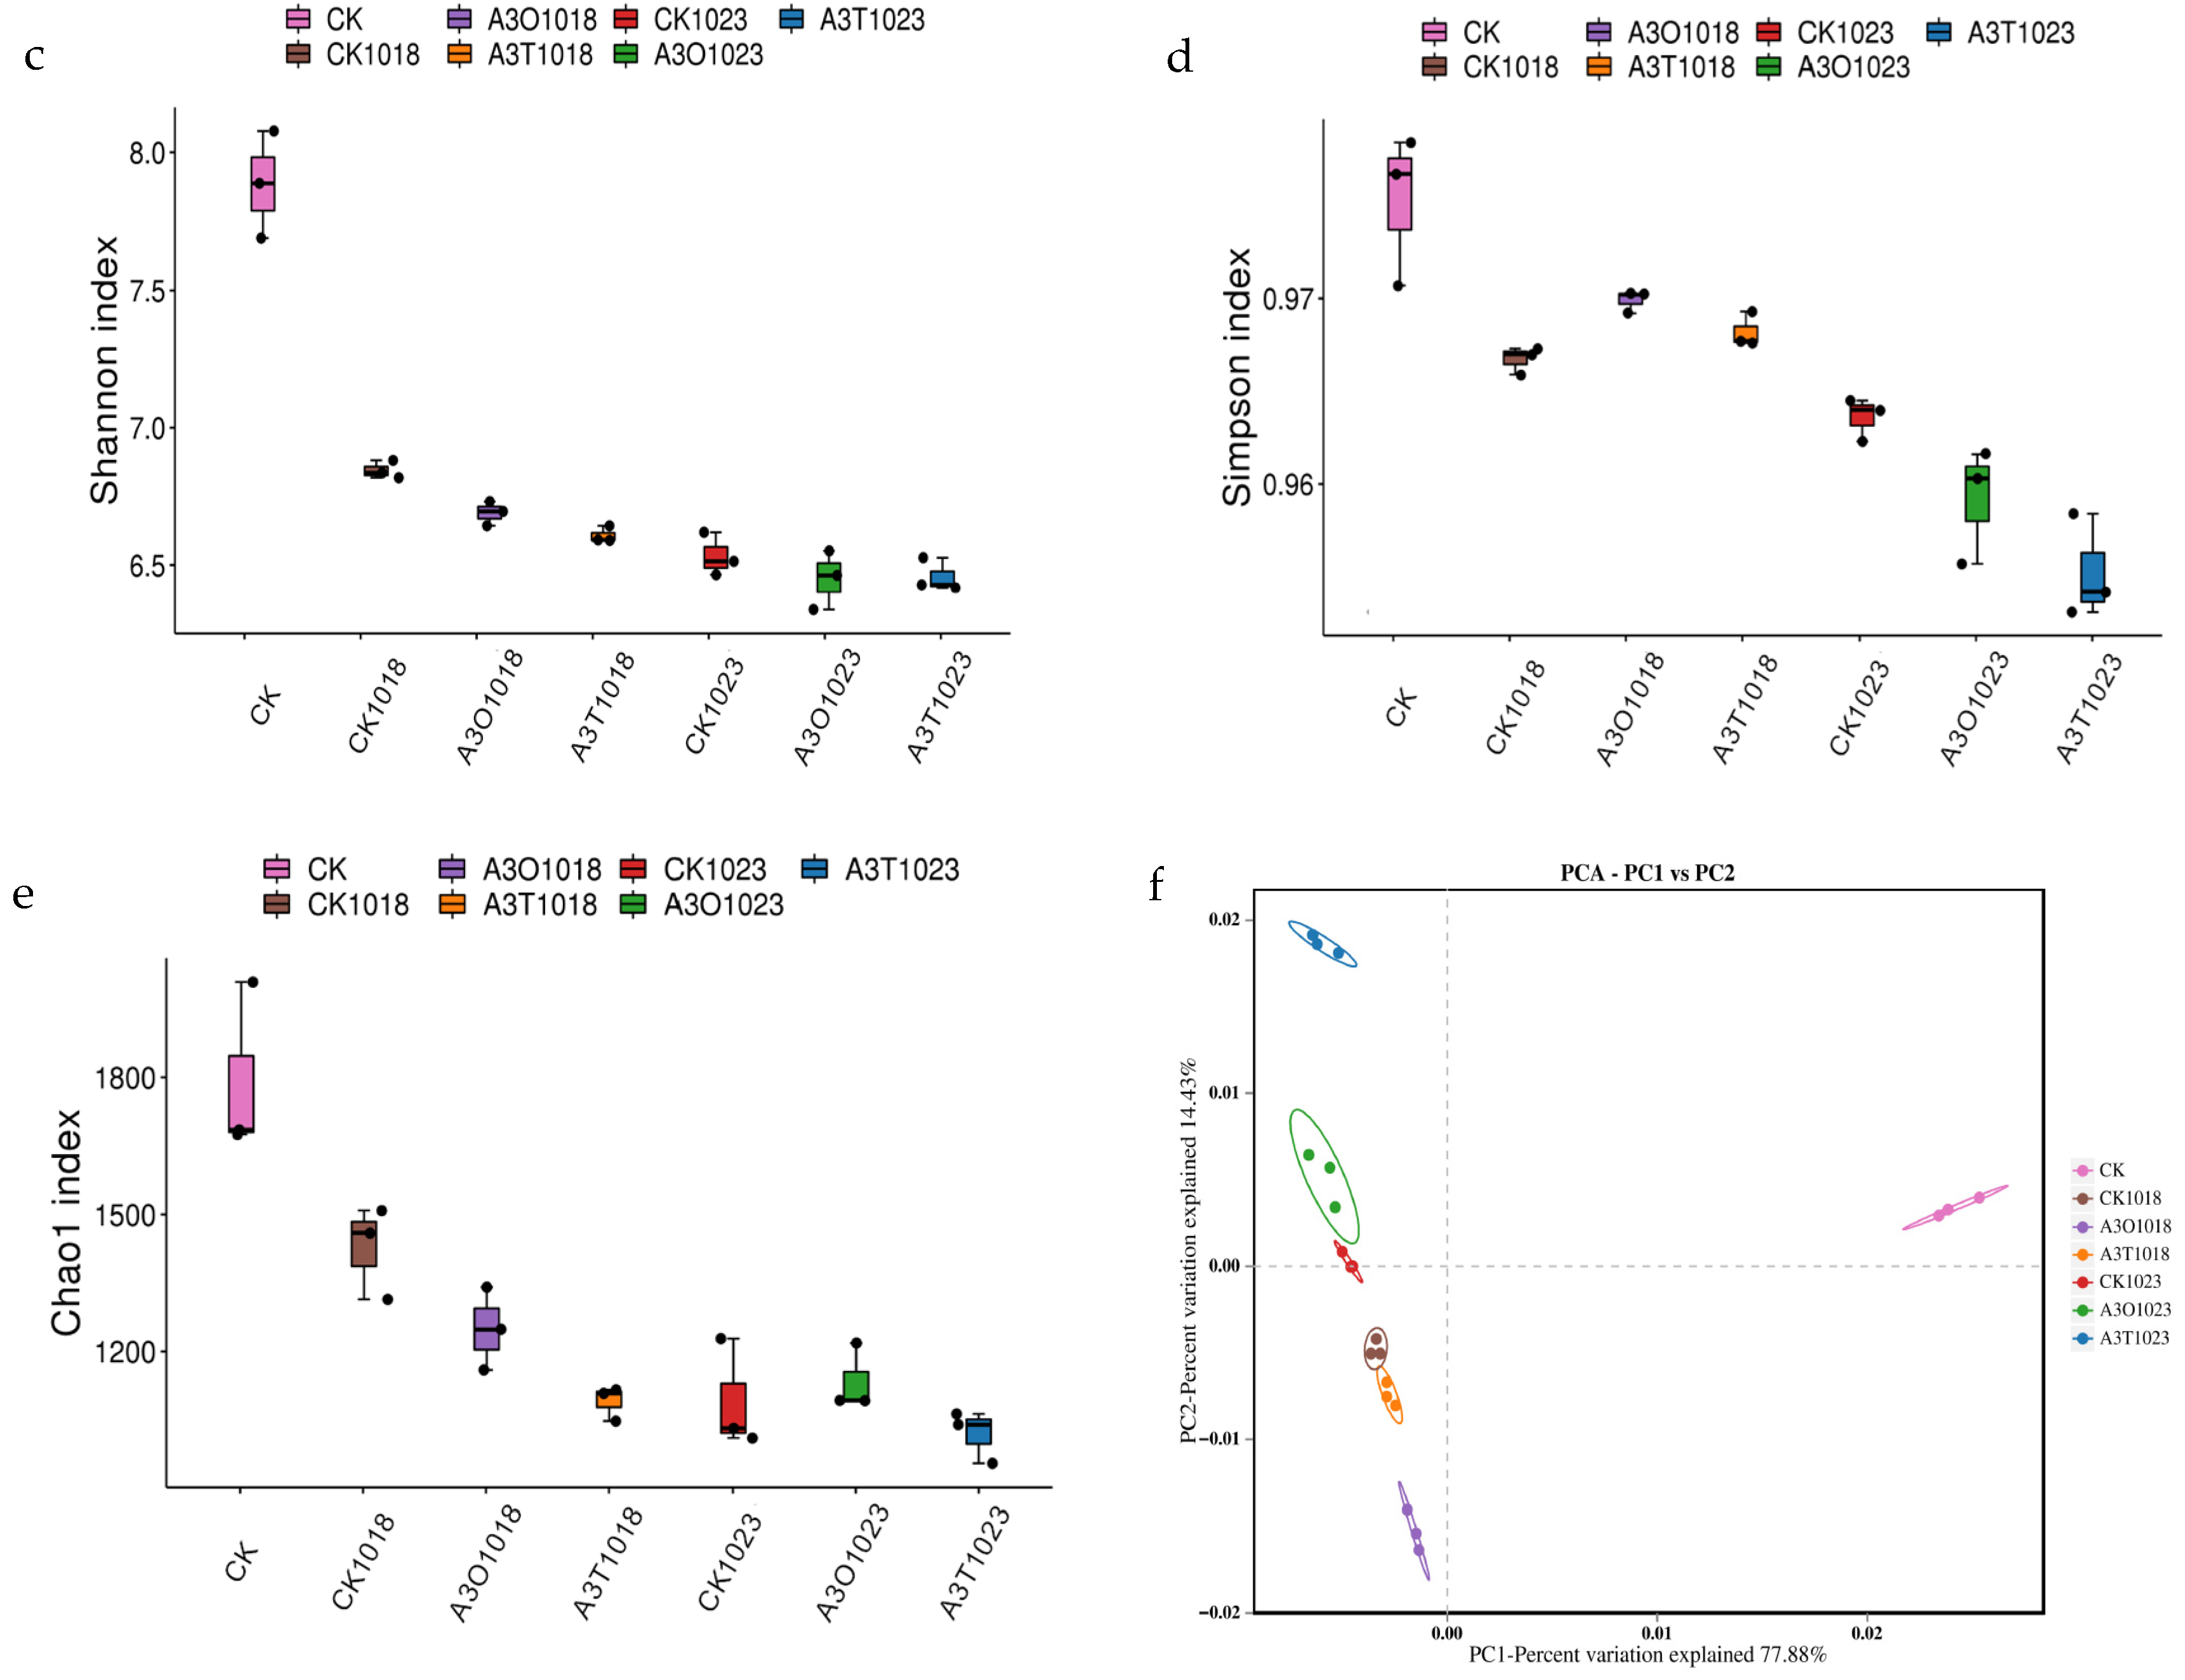
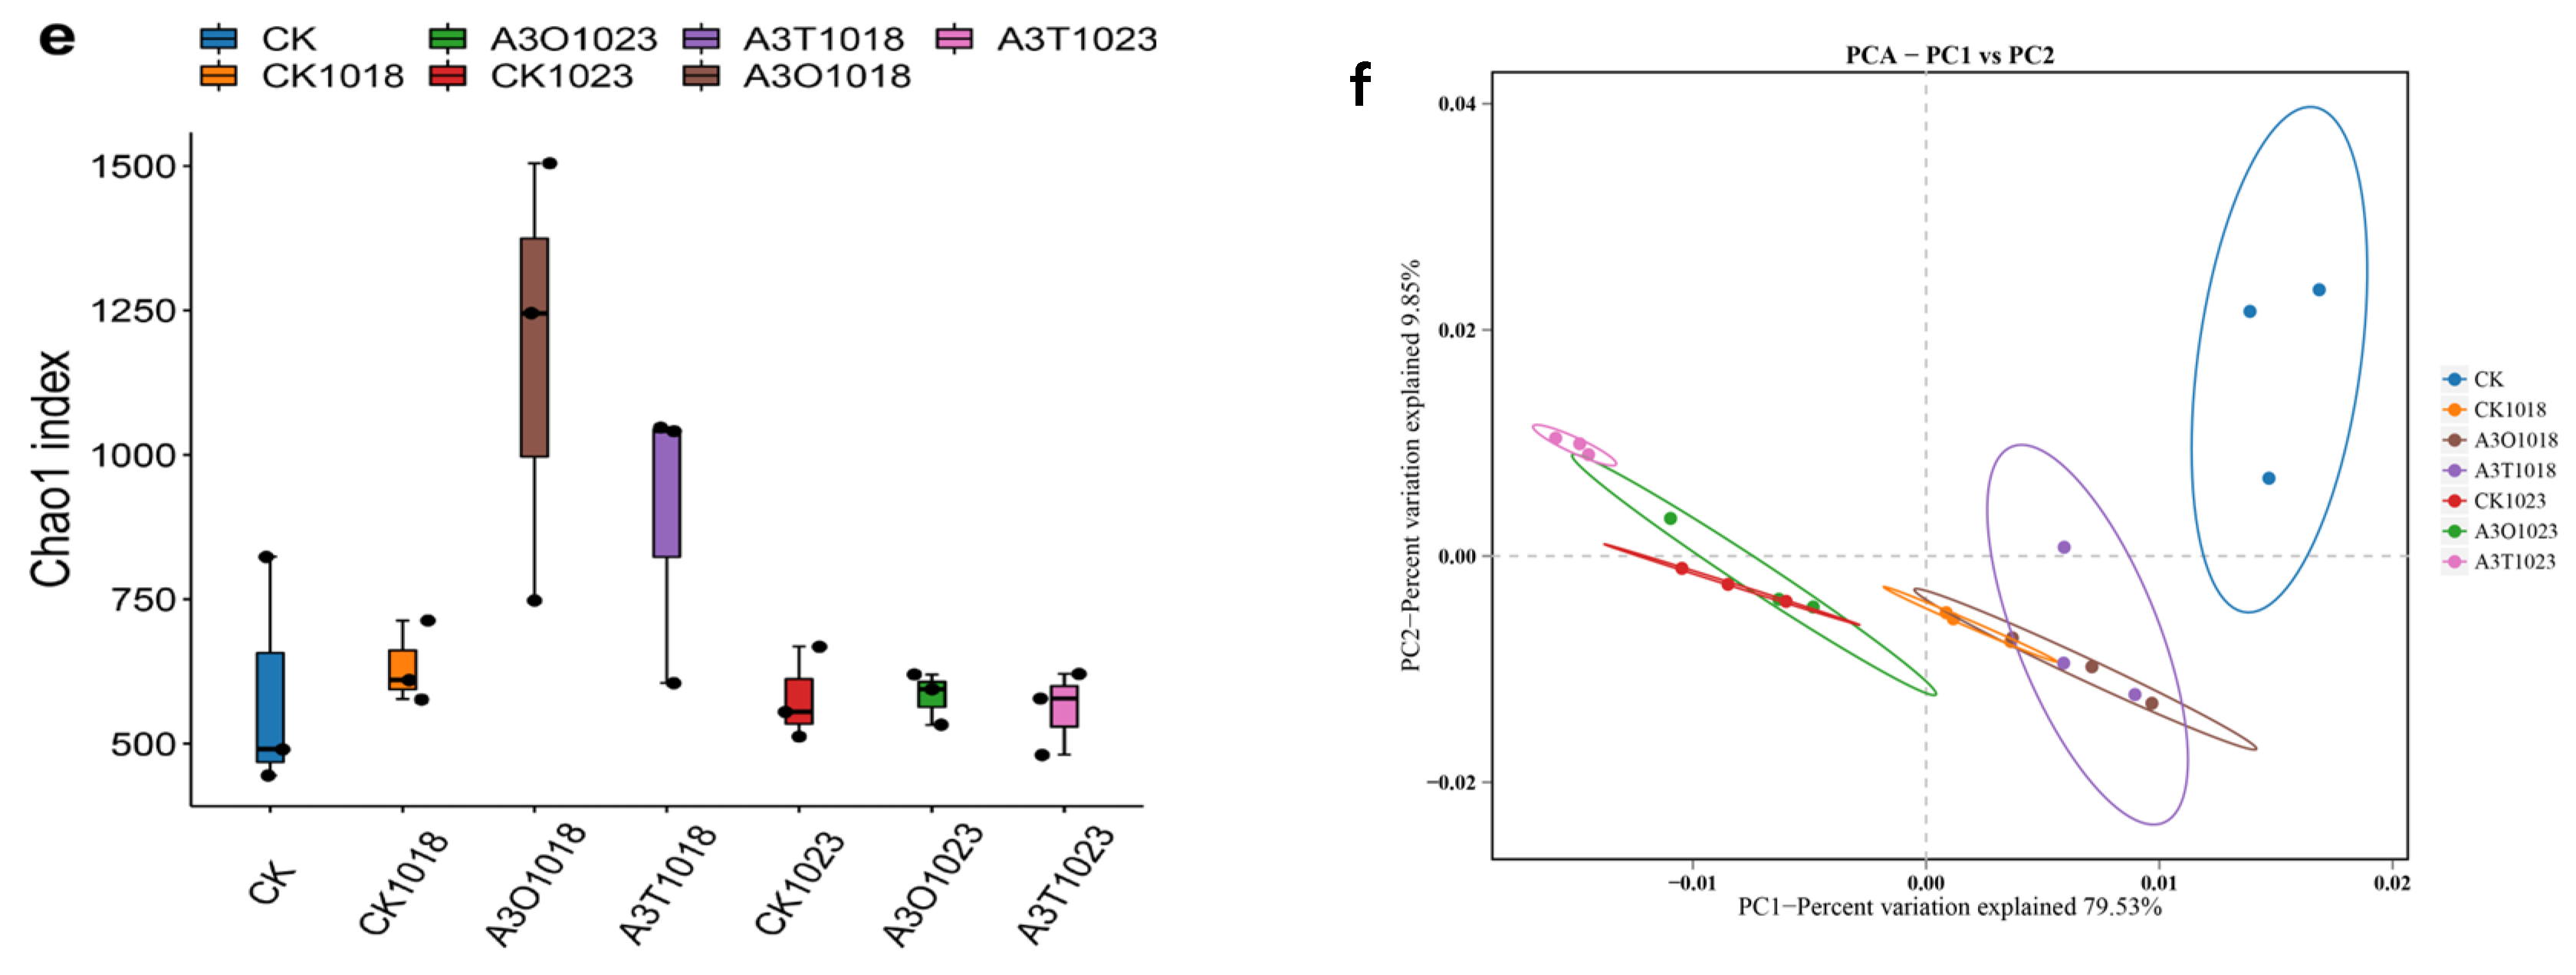
Figure 6c–e shows the microbial α-diversity under different treatments. The Shannon index, Simpson index, and Chao 1 index in the CK treatment were all significantly higher than those in the other treatment groups. As the fermentation reaction proceeded, both the microbial diversity and abundance in the CK treatment declined compared to the initial stage. This result indicates that, as macromolecular organic matter undergoes hydrolysis and acid production, the composition of the microbial community also changes with substrate variations in the system. When the hydrolysis or acid production products become similar, the microbial community composition adjusts adaptively. On the other hand, during anaerobic fermentation, the treatment groups with biochar addition exhibited changes in microbial diversity and richness similar to those of the CK treatment. Overall, the α-diversity of A3O was slightly higher than that of the A3T treatment.
Figure 6f shows the microbial β-diversity under different treatments. As seen in the figure, the distances between different treatments are relatively large, indicating that the microbial community structure varies at different stages of anaerobic fermentation depending on the treatment. This further confirms that the continuous changes in the composition of substances in the system have a persistent impact on the microbial community, thereby affecting hydrolysis, organic acid production, and methane yield, among other factors.

3.5. The Changes in Archaea Communities

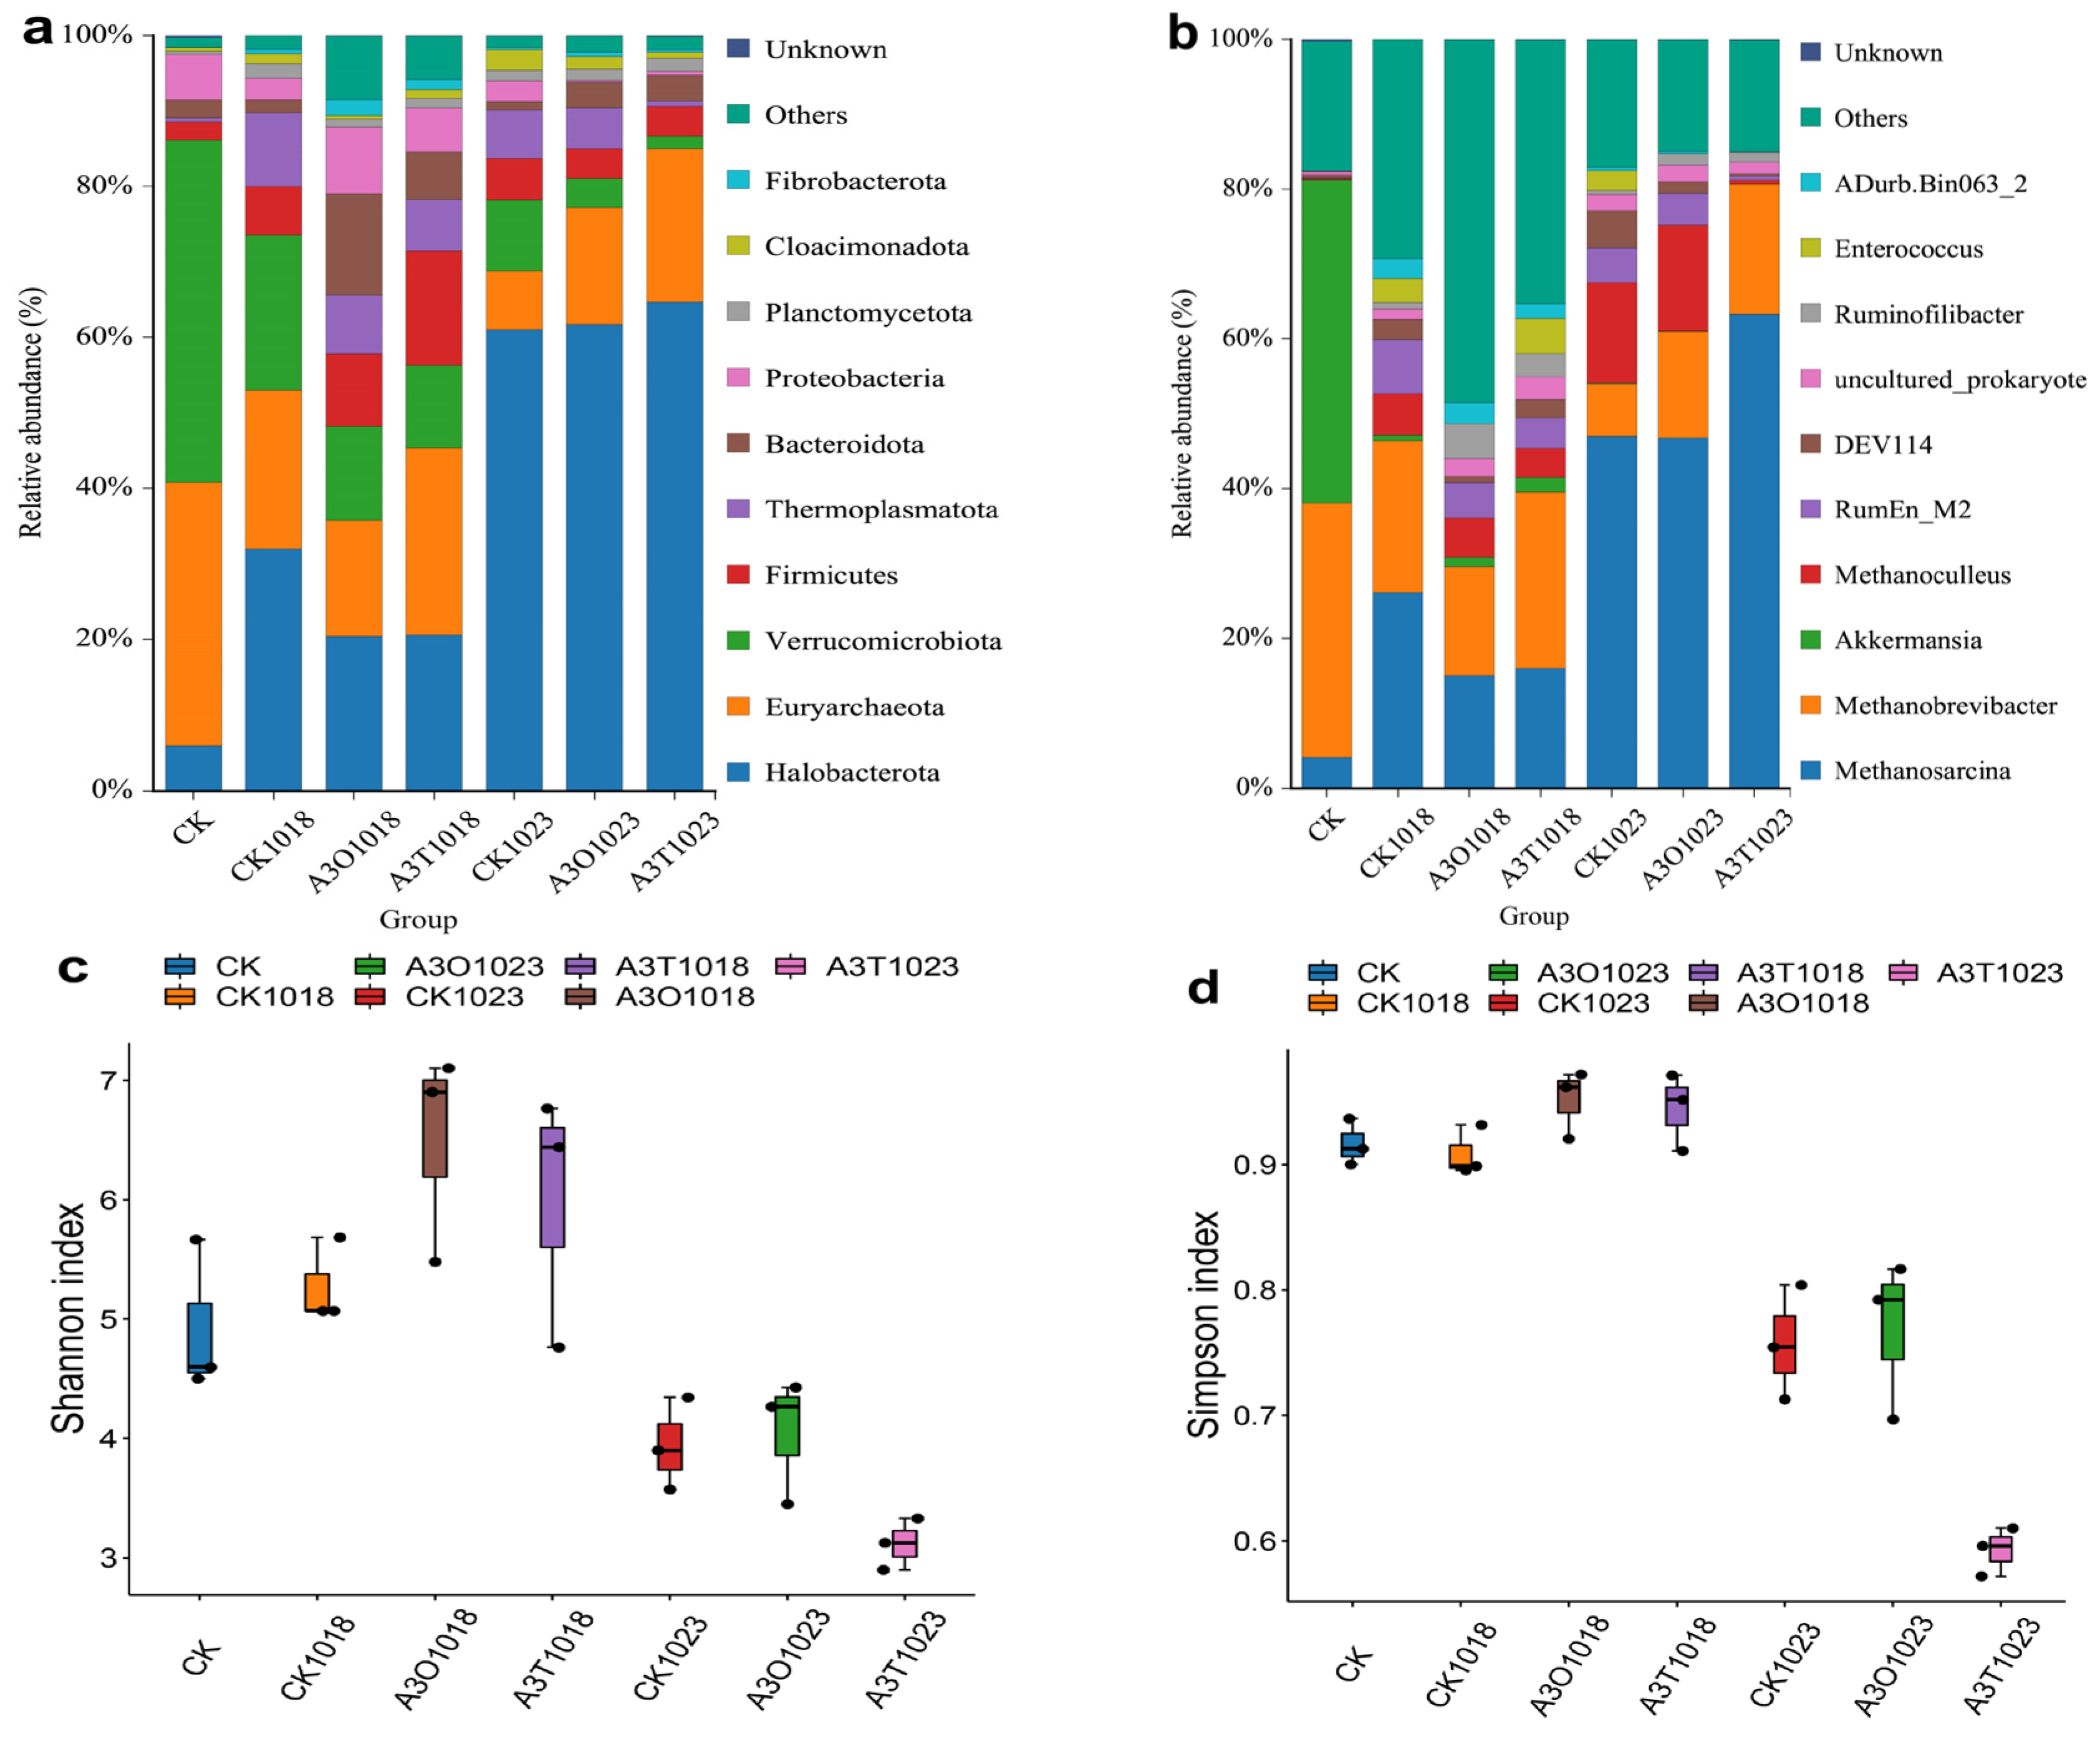
In the anaerobic digestion system, archaea, particularly methanogenic archaea, play a decisive role in the final conversion of organic matter into methane [31]. Different treatment conditions and fermentation stages can significantly influence the composition and diversity characteristics of the archaeal community. Similar to the sampling and nomenclature of bacterial community diversity, the fermentation broth samples collected during the peak and late peak periods of gas production were named according to the sampling group and time (1018 and 1023) to facilitate the comparison and analysis of archaeal relative abundance, as shown in Figure 7. At the phylum level (Figure 7a), the archaeal community structure of each treatment is generally similar, mainly comprising Halobacterota and Euryarchaeota. Among them, Halobacterota holds a dominant position in most treatments, and its relative abundance shows an overall increasing trend as the fermentation process progresses; it is at its highest at 32.28% in the early stage of the gas production peak (1018), followed by A3O (21.53%) and A3T (20.74%). In the late stage of gas production peak (1023), the relative abundance of Halobacterota in all treatments reached more than 60%, and A3T was the highest at 64.62%. While the relative abundance of Euryarchaeota exhibits a certain degree of stage-specific fluctuation during the anaerobic fermentation process, the relative abundance of Euryarchaeota reached the highest value of 25.14% in A3T treatment in the early stage of gas production peak (1018), decreased from 21.25% to 7.78% in CK in the late stage (1023), and declined relatively slightly in A3T (20.24%) and A3O (15.31%). Previous studies have shown that these two archaeal phyla are widely involved in the methanogenesis process during the later stages of anaerobic digestion, and their abundance changes are usually closely related to the types of substrates in the system and the transformation of metabolic intermediates. In addition, in the control group (CK), other low-abundance archaeal groups account for a relatively higher proportion, whereas under the additive treatment conditions, the community structure gradually concentrates toward the dominant methanogenic archaea, indicating an enhanced selectivity of the system.
At the genus level (Figure 7b), the differences in archaeal composition among the different treatments are even more pronounced. Methanosarcina, Methanobrevibacter, and Akkermansia are the main dominant genera. As the anaerobic digestion process progresses in the CK group as well as in the biochar-amended A3O and A3T treatments, the relative abundances of Methanosarcina and Methanobrevibacter both show a gradual increasing trend. The relative abundance of Methanosarcina in A3T reached 63.29%, 47.36% in CK and 45.88% in A3O in the late stage of the gas production peak (1023). The relative abundance of Methobrevibacter in A3T reached the maximum value of 17.37%, followed by 14.07% in A3O and the minimum value of 6.99% in CK in the late stages of gas production peaks in all the treatments (1023). This change indicates that the microbial community is shifting from being dominated by hydrolysis and acidogenesis towards a system primarily governed by methanogenesis, with methanogenic archaea continuously accumulating and becoming the key functional groups in the terminal metabolic processes. Methanosarcina [32,33,34], a methanogen with high metabolic flexibility, is capable of participating in methane production via the acetoclastic pathway and is highly tolerant of organic acid fluctuations and environmental stresses; its increased relative abundance usually suggests an enhanced capacity of the system to convert acetate into methane. Meanwhile, the enrichment of Methanobrevibacter, which is primarily a hydrogenotrophic methanogen, helps to reduce the partial pressure of hydrogen in the system through continuous hydrogen consumption, thereby promoting the synergistic oxidation of intermediate products such as propionate and butyrate [35]. The simultaneous increase in these two methanogenic archaea reflects the gradual establishment and synergistic operation of both acetoclastic and hydrogenotrophic methanogenic pathways in the system, which is beneficial for maintaining the stable transformation of intermediate metabolites during anaerobic digestion. Together with the aforementioned results on VFA dynamics and methane production characteristics, this may imply that the enrichment of methanogenic functional groups provides a microbiological foundation for the rapid consumption of small molecular organic acids and methane production during the mid-to-late stages. It is worth noting that although both the CK and biochar-treated groups show an increase in the relative abundance of methanogenic archaea, biochar addition may accelerate the establishment and functional activity of methanogenic groups by improving microbial attachment environments, buffering the system’s physicochemical conditions [36], and enhancing the coupling efficiency between acidogenesis and methanogenesis, thereby helping to improve the overall stability and process efficiency of the anaerobic digestion system [37,38]. Furthermore, Akkermansia plays a significant role in the degradation of fermentation materials. It typically utilizes substrates such as mucin for metabolism, breaking down organic compounds and short-chain fatty acids, thereby providing a material foundation for methanogenic bacteria. With the progression of anaerobic digestion, the relative abundance of Akkermansia decreases significantly: it decreased from 43.07% at the beginning to its lowest (less than 0.1%) in A3T and A3O at the end of the anaerobic digestion process (1023). This might be closely related to the degradation degree of the material and the activity of the methanogens. Methanoculleus, as a methanogenic bacterium, exhibited distinct variations in relative abundance across treatments. During the early gas production peak (1018), its abundance in CK, A3O and A3T treatments was 5.58%, 5.54% and 3.91% respectively. In the late gas production peak (1023), the abundance of Methanoculleus in CK and A3O treatments increased to 13.39% and 14.52%, respectively, whereas it remained at the lowest level of 4.53% in A3T. This indicates that different pyrolysis times of biochar may lead to variations in the metabolic pathways promoting anaerobic digestion.
Figure 7c–e show the changes in archaeal community α-diversity under different treatments and fermentation times. The results indicate that both the diversity and richness of archaeal communities under different treatments change significantly during fermentation. Overall, the Shannon index, Simpson index, and Chao1 index of all three treatment groups are generally higher in the early stage of fermentation (1018) than in the later stage (1023), suggesting that as fermentation progresses, the overall diversity and species richness of archaeal communities tend to decrease.
In the early stage of fermentation, the overall Shannon index for all treatments was relatively high, with the Shannon indices of the A3O and A3T treatments generally higher than that of the control (CK). This indicates that the addition of biochar at this stage helps maintain higher archaeal community diversity. At the same time, the Simpson indices for all treatments were at a high level, showing that the archaeal community structure was relatively even, and the evenness of the two biochar treatments was slightly higher than that of the control group. In terms of species richness, the Chao1 index showed that the A3O treatment had the highest species richness, followed by A3T and CK, suggesting that different types of biochar have varying effects on archaeal community richness in the early stage of fermentation [39].
As the fermentation reaction progresses, both the Shannon index and Chao1 index for each treatment are significantly lower in the late fermentation stage compared to the early stage, indicating an overall decrease in archaeal community diversity and species richness. Among them, the A3T treatment shows the lowest Shannon and Simpson indices in the late fermentation stage, suggesting that its archaeal community structure during this phase is more dominated by a few predominant groups. In contrast, the CK and A3O treatments maintain relatively higher Simpson indices in the late fermentation stage, indicating that the decline in community evenness is relatively less pronounced. Overall, changes in archaeal community α-diversity are mainly influenced by the fermentation stage, with the differences between early and late stages being much greater than those among different treatments. As the fermentation system gradually stabilizes, the archaeal community structure increasingly concentrates around dominant groups, and the impact of the two biochar treatments on archaeal community diversity and richness during the early fermentation stage diminishes in the late fermentation stage.
Figure 7f shows the β-diversity analysis results of archaeal communities under different treatment conditions. The samples from different treatments are clearly separated in the principal component space, with considerable distances between groups, indicating that different treatments and fermentation stages significantly altered the structure and composition of archaeal communities. This result suggests that the ongoing changes in material composition within the system during anaerobic digestion have a long-term impact on archaeal community structure, thereby further influencing methanogenesis pathways and the overall methane production performance of the system [40]. In summary, the structure and function of archaeal communities in anaerobic digestion undergo systematic succession during fermentation stages. The addition of biochar enables targeted regulation of archaeal community composition, promoting the enrichment of dominant methanogenic archaea such as Methanosarcina and Methanobrevibacter. This provides a microbial foundation for the system to transition from acid-producing hydrolysis dominance to methane generation dominance, facilitating rapid consumption of small organic acids and efficient methane production. It also enhances the synergistic interaction between acetate-dependent and hydrogen-dependent methanogenic pathways.

3.6. KEEG Functional Predictive Analytics

3.6.1. KEEG Bacterial Function Prediction

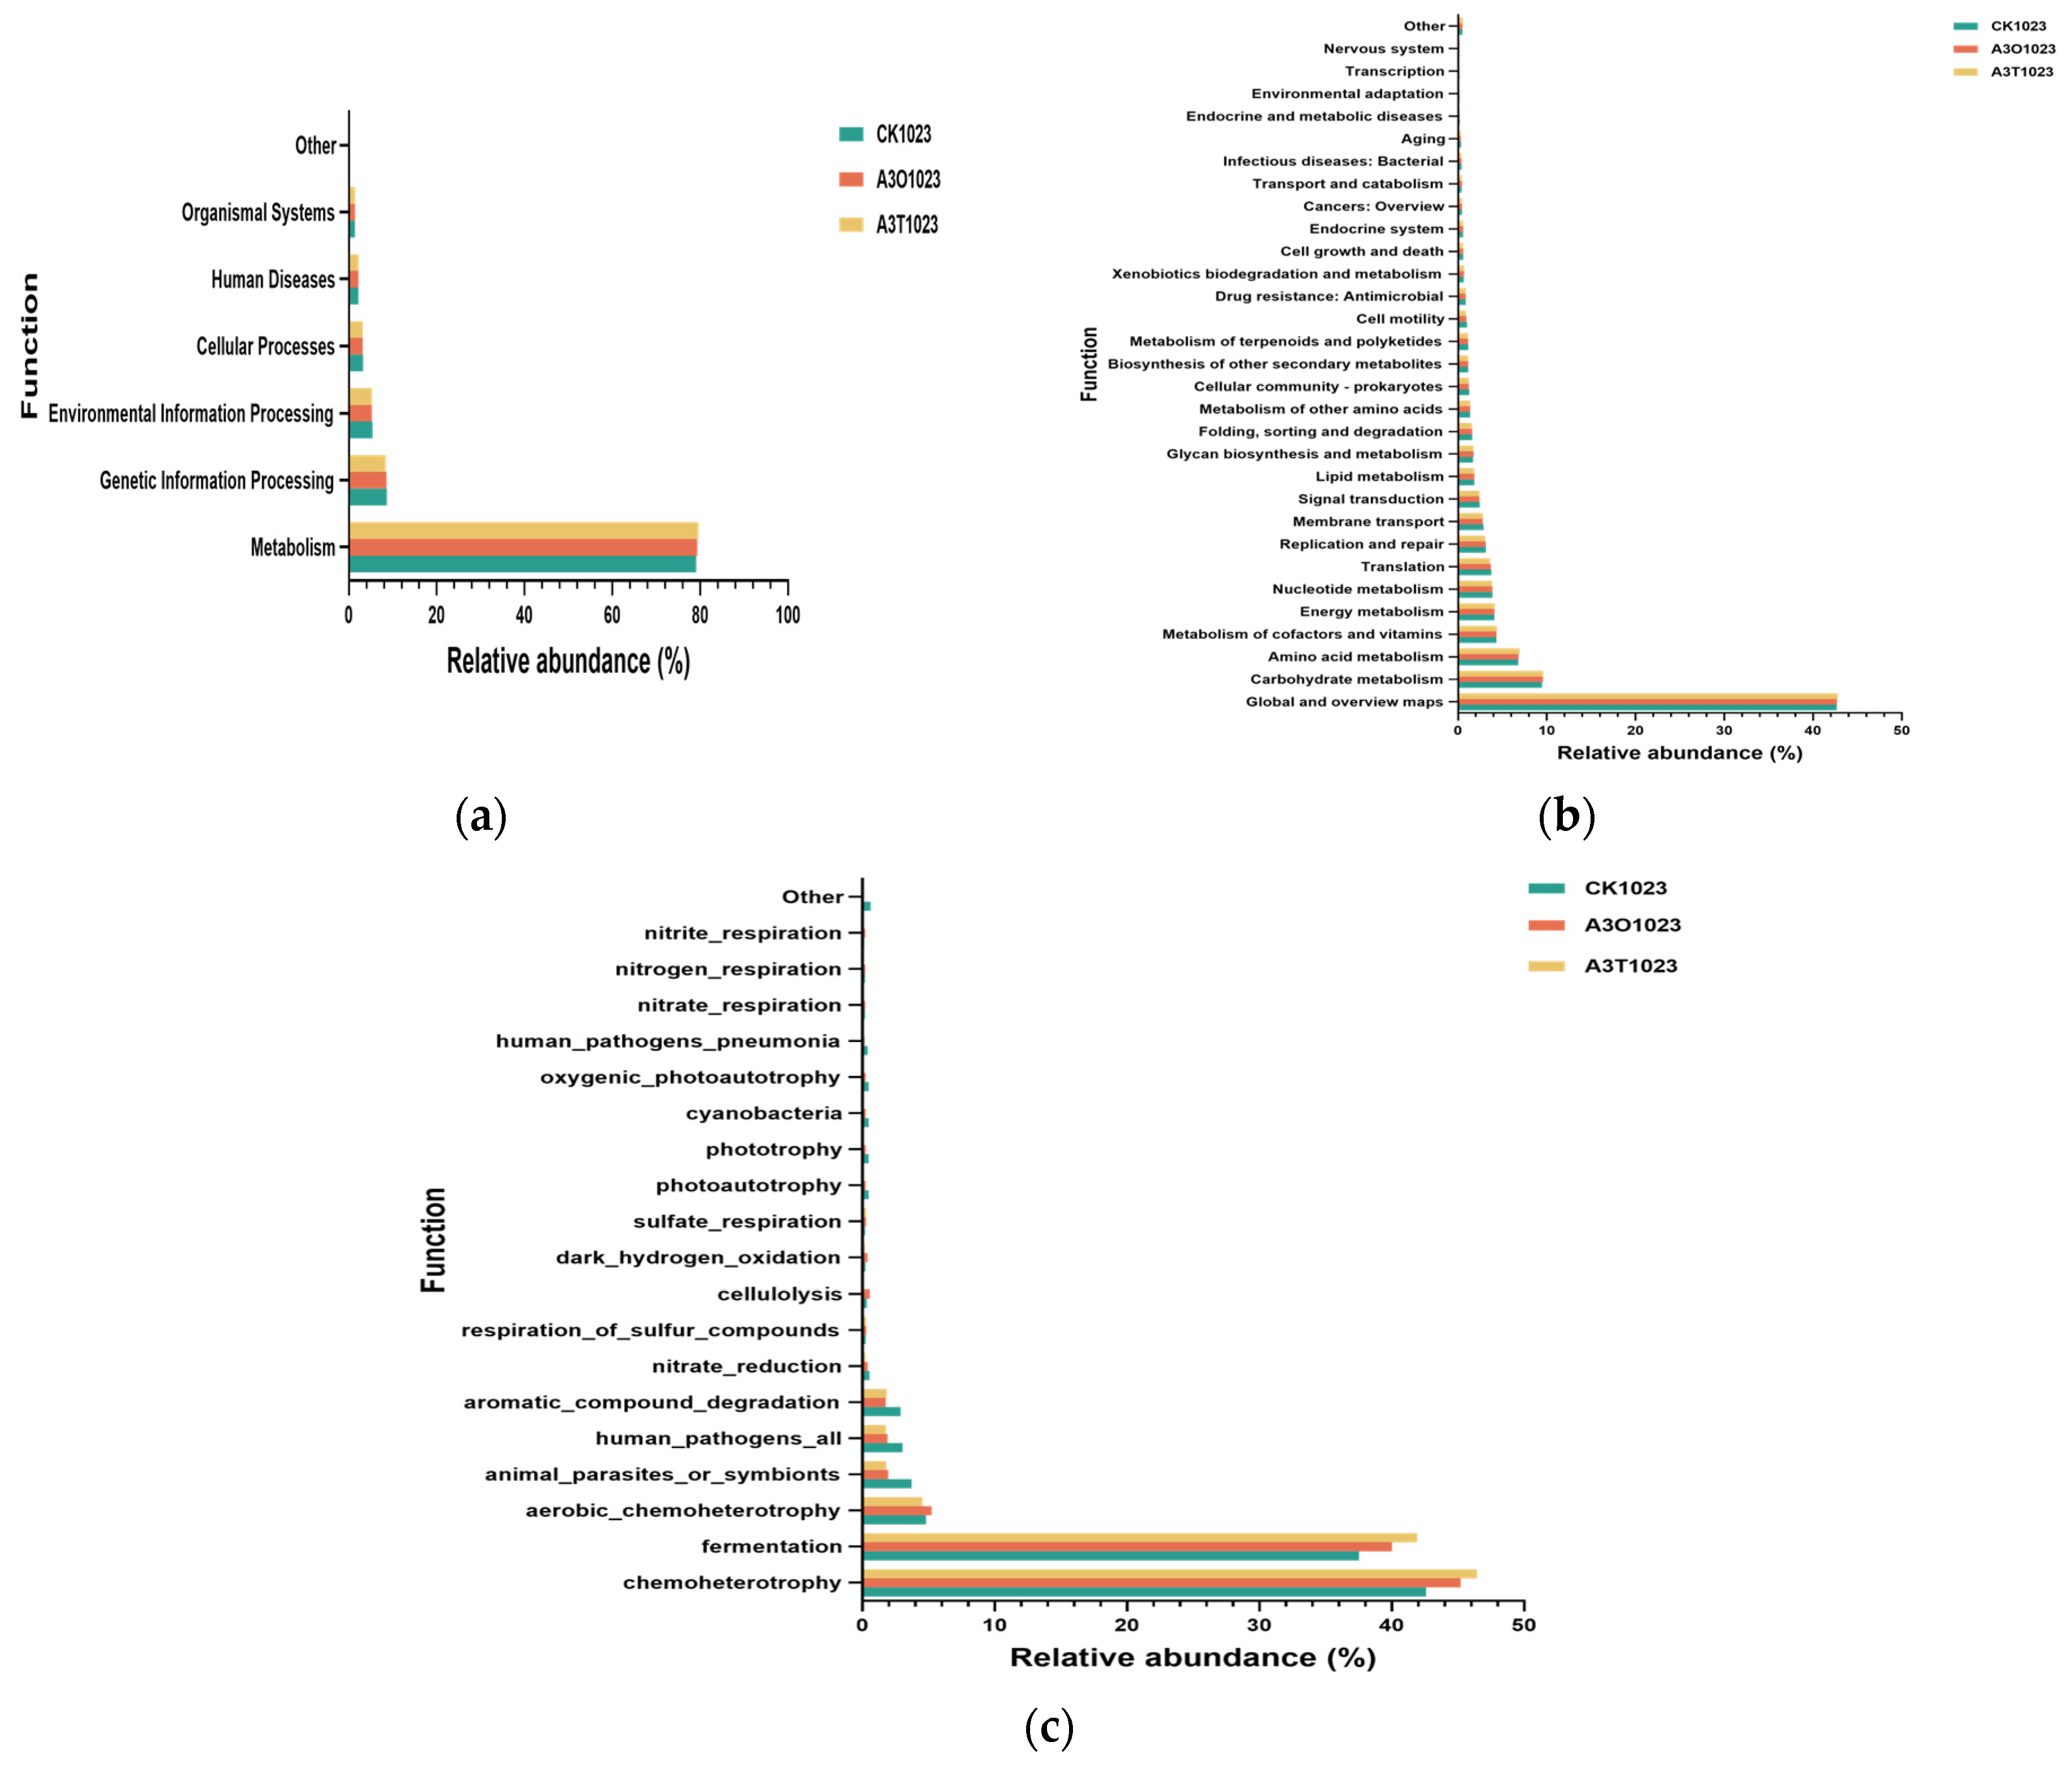
KEGG functional prediction infers the potential metabolic pathways and functional modules of microbial communities based on the relative abundance of individual microorganisms. As shown in Figure 8a, the overall functional composition of the microbial communities under CK (1023), A3O (1023), and A3T (1023) was highly consistent, with Metabolism being the dominant functional category, accounting for 79.10%, 79.35%, and 79.58%, respectively. This was followed by Genetic information processing and Environmental information processing, indicating that the microbial community was primarily oriented toward material transformation and energy metabolism. Compared with the CK treatment, the relative abundance of metabolism-related functions was slightly increased in the biochar-amended treatments, suggesting that biochar addition did not induce a substantial reconstruction of functional categories but rather enhanced the overall metabolic potential of the microbial community.
At the KEGG level 2 functional classification (Figure 8b), Global and overview maps remained the predominant functional module, with relative abundances of 42.67%, 42.70%, and 42.78% in CK (1023), A3O (1023), and A3T (1023), respectively, highlighting the central role of fundamental metabolic networks within the community. In addition, pathways closely associated with organic matter transformation and energy acquisition, including Carbohydrate metabolism, Amino acid metabolism, and Energy metabolism, exhibited relatively higher abundances in the treated groups. These results suggest that the treatments may facilitate the degradation of complex organic substrates and enhance energy conversion potential. In contrast, functional categories related to basic cellular maintenance, such as Translation, Replication and repair, and Membrane transport, showed only minor variations among treatments, further indicating that the overall functional structure of the microbial community remained stable.
Figure 8c shows the bacterial ecological functional composition based on functional classification. In all treatment groups, chemoheterotrophy and fermentation-related functions were the main functional types, and their proportions were generally higher in the A3O and A3T treatments compared to CK, indicating that under biochar addition, the bacterial community still primarily functions in organic matter degradation and energy acquisition. In addition, aerobic chemoheterotrophy showed a certain enrichment trend in the A3O biochar treatment. Overall, at the later stages of fermentation, the functional composition of bacterial communities under different treatments was mainly related to metabolism, and the differences between treatments at the KEGG functional prediction level were relatively limited. The addition of biochar affected the relative abundance of certain functional groups to some extent but did not significantly change the overall functional structure characteristics of the bacterial community. Overall, by integrating functional prediction, VFA dynamics, and methane production characteristics, it can be observed that biochar addition did not markedly alter the peak methane production level of the anaerobic digestion system, but substantially accelerated the onset of methane generation and promoted the rapid conversion of intermediate metabolites. Functional prediction results indicated that biochar amendment enhanced the potential of the microbial community for complex organic substrate degradation and energy metabolism. Consistently, VFA analysis further demonstrated that biochar addition facilitated the production of acetate and other low-molecular-weight organic acids during the start-up phase while significantly reducing the accumulation of propionate, butyrate, and branched-chain fatty acids during the middle and later stages of digestion. Correspondingly, methane production rates were noticeably higher in the early phase under biochar-amended conditions, and the overall digestion process exhibited improved stability. The results demonstrate that the functional structure of bacterial microbial communities in anaerobic digestion systems across different treatment groups remained largely consistent. Although biochar did not significantly alter the overall functional structure of bacterial communities, it modestly increased the abundance of metabolic-related functions and enhanced the potential for complex substrate degradation and energy metabolism. Analysis of gas production efficiency and dynamic changes in volatile fatty acids indicates that biochar addition primarily promotes anaerobic digestion by enhancing the coupling efficiency between acidogenesis and methanogenesis, accelerating methane generation initiation, and facilitating rapid conversion of intermediate metabolites, thereby improving system stability rather than simply increasing peak methane production.

3.6.2. KEEG Archaea Function Prediction

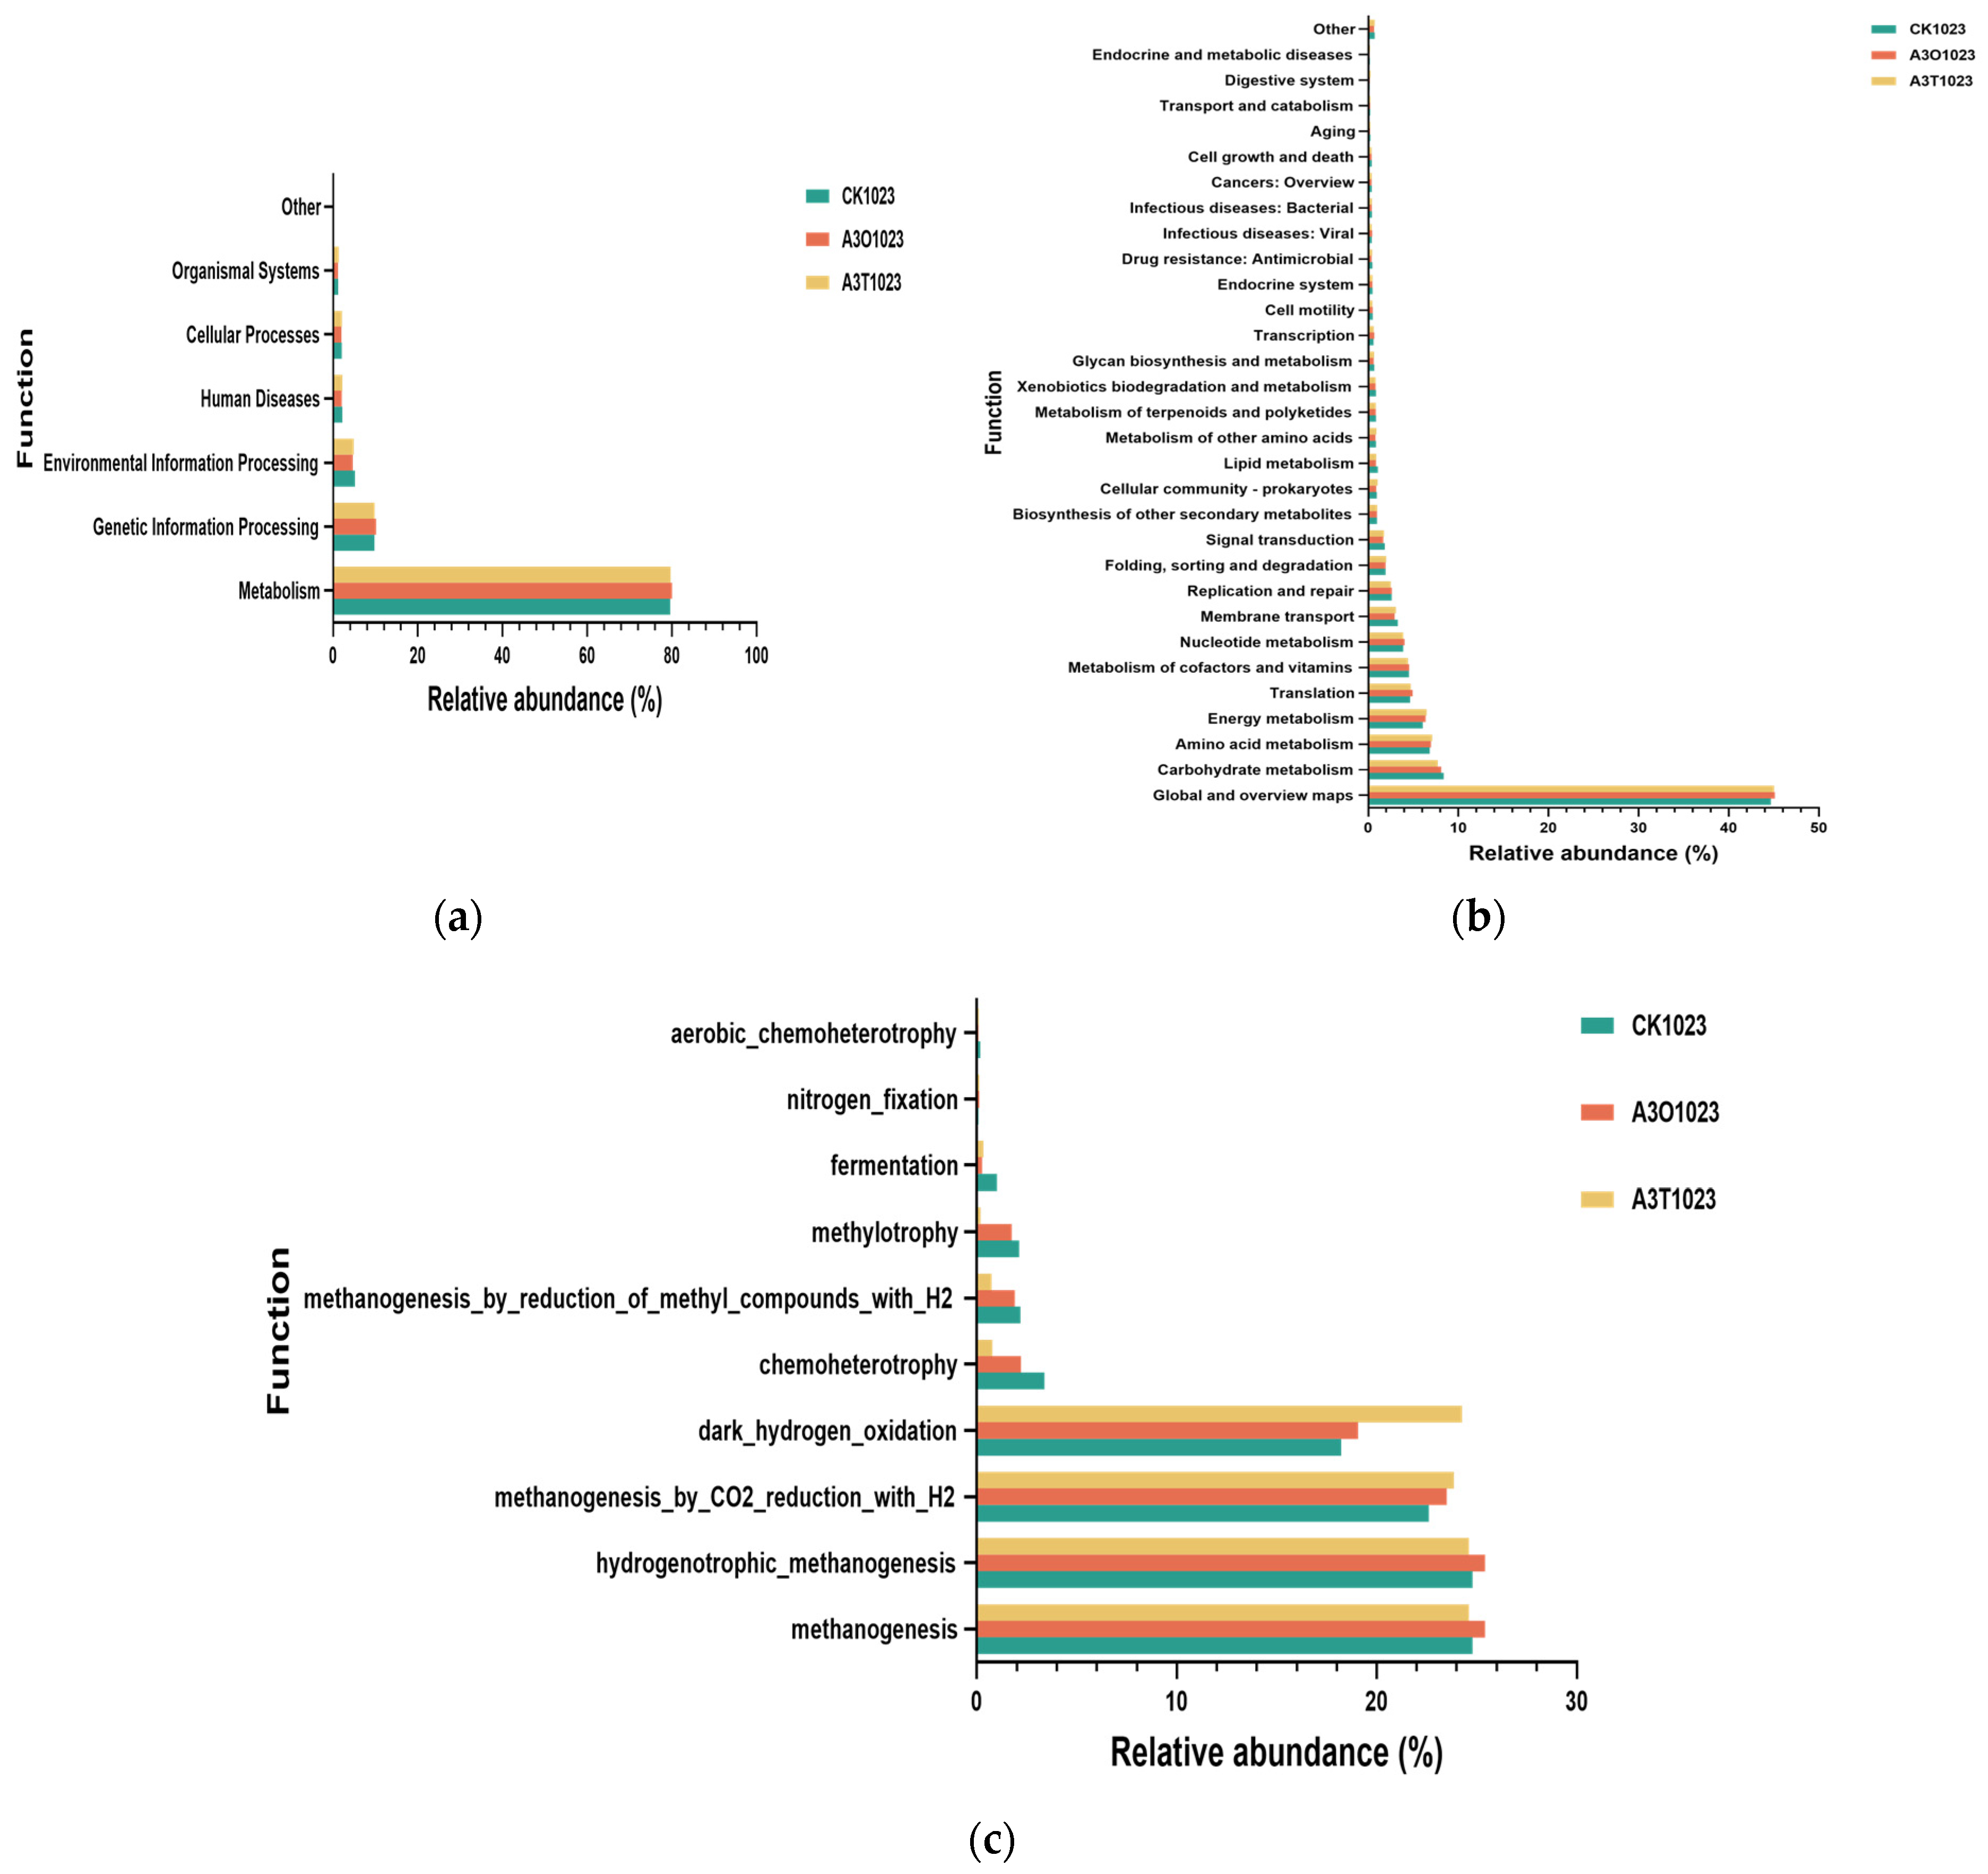
As shown in Figure 9a, CK (1023), A3O (1023), and A3T (1023) exhibit a high degree of consistency in functional composition, indicating that the core structures remain relatively stable under different treatments. Among these, metabolic functions hold an absolute advantage, with relative abundances of CK (79.61%), A3O (80.01%), and A3T (79.70%), making them the dominant function in the microbial community. Other functions, such as Genetic information processing and Environmental information processing, account for a smaller proportion. However, the relative abundance of metabolism in A3O and A3T is slightly higher than that in CK. This suggests that although the addition of biochar does not alter the types of microbial functions present, it does enhance the metabolic potential.
At the KEGG Level 2 functional classification (Figure 9b), carbohydrate metabolism had the highest relative abundance, followed by amino acid metabolism, energy metabolism, and the metabolism of cofactors and vitamins. The relative abundance of these functional categories showed minimal differences among the various treatments, indicating that during the peak fermentation period, the bacterial communities in each treatment system were still primarily focused on basic material metabolism and energy conversion functions. Regarding the overall impact of biochar type on the distribution of metabolic functions in the secondary classification (Figure 9b), the functional module composition of the three treatments was relatively similar. Among these, the modules reflecting basic metabolic networks (carbon metabolism and energy metabolism) occupied a dominant position, accounting for 44.66%, 45.12%, and 45.04% in the three treatments, respectively. Additionally, carbohydrate metabolism, amino acid metabolism, and energy metabolism were relatively abundant, with respective proportions of 8.37%, 8.10%, and 7.71%; 6.81%, 6.96%, and 7.10%; and 6.10%, 6.38%, and 6.47% in the three treatments. Overall, although the addition of biochar did not result in a statistically significant improvement in the composition and relative proportion of metabolic modules, the energy metabolism and amino acid metabolism in A3O and A3T were slightly higher than those in the CK treatment. This may indicate that biochar enhanced the substrate conversion and energy acquisition capabilities [41].
Figure 9c shows the FAPROTAX prediction results for different treatments. In this study, methanogenesis and its associated functional categories dominated across all treatments, with relative abundances of 24.79%, 25.41%, and 24.60% under the different treatments, respectively. Among these, hydrogenotrophic methanogenesis accounted for 25.41% in A3O1023, 24.79% in CK1023, and 24.60% in A3T1023; methanogenesis by CO2 reduction with H2 also accounted for a relatively high proportion, with relative abundances of 22.60% in CK1023, 23.50% in A3O1023, and 23.85% in A3T1023, respectively. The above results indicate that the main methane production pathway in the fermentation system is through H2/CO2 reduction. Notably, compared with CK (18.22%), dark hydrogen oxidation showed a certain degree of enrichment in the A3O1023 and A3T1023 treatment groups, at 19.06% and 24.26%, respectively. This result indicates that adding biochar effectively enhanced H2 reutilization within the system, helping to promote interspecies electron/hydrogen transfer, which is beneficial for methanogenesis. In addition, the proportions of fermentation and chemoheterotrophy, although relatively low, remained stable, while nitrogen fixation and aerobic chemoheterotrophy showed extremely low abundances. This further demonstrates that the fermentation system was under strictly anaerobic conditions, focusing mainly on carbon and energy conversion [42].
Based on comprehensive KEGG functional annotation and metabolic function prediction results, this study found that the addition of biochar does not enhance methane production capacity by altering the overall functional composition of the microbial community, but rather by increasing the relative abundance of metabolism-related functions, especially energy metabolism and methanogenesis-related pathways. This, in turn, enhances the system’s metabolic potential. FAPROTAX results indicate that the community mainly utilizes the hydrogenotrophic methanogenesis pathway, and the addition of biochar increases the abundance of functions related to dark_hydrogen_oxidation [43]. KEGG functional analysis revealed that metabolic functions dominated all treatment groups (accounting for over 79%). Biochar addition significantly enhanced archaeal functions directly related to anaerobic digestion efficiency, including energy metabolism and methane production. This strengthened the microbial community’s degradation capacity and energy conversion potential for complex organic substrates. Notably, hydrogen production and utilization within the system became more efficient, which helped maintain lower hydrogen partial pressure and promoted methane production.

4. Discussion

With the increasing depletion of fossil fuels and the growing prominence of energy shortages in economic development, countries around the world are promoting the transition from fossil fuel systems to low-carbon energy systems to address global warming. The production of biogas from organic waste such as livestock and poultry manure and agricultural straw is an effective method for organic waste management [44]. As a major energy supplier and consumer, China produces 12 billion cubic meters of biogas annually, with approximately 70% of the raw materials coming from agricultural waste and livestock and poultry manure. China’s biogas and biomethane development potential is enormous, with an annual resource volume reaching 135 billion cubic meters [45]. Currently, exogenous additives, particularly biochar materials, have been extensively studied in anaerobic digestion systems [46]. Biochar materials can promote the attachment, growth, and enrichment of microorganisms, and further extend to metal element loading, catalyzing carbon dots to enhance microbial metabolic electron transfer and conversion capabilities, thereby improving the performance of anaerobic digestion systems [47].
This study utilizes corn stalks to prepare biochar under varying carbonization conditions. This research directly applies the biochar as an exogenous additive in livestock manure anaerobic digestion systems. The study investigates how biochar prepared under different pyrolysis conditions enhances anaerobic digestion efficiency, while also exploring its regulatory effects and mechanisms on microbial community structure and methane-producing functional groups.
The results showed that the biochar prepared by pyrolysis for 1 h at 550 °C (A3O) retained more oxygen-containing functional groups such as C-O and C=O, and the voltage difference was relatively higher. The biochar prepared by pyrolysis for 2 h (A3T) had better aromatic structure, the relative proportion of metal elements such as Fe and Ni increased, and the specific surface area and total pore volume of the biochar increased to 6.32 m2/g and 0.005366 cm3/g, respectively. The addition of biochar to the anaerobic fermentation system significantly enhances its buffering capacity and gas production efficiency. Compared to the control group (CK), the cumulative gas production of A3O and A3T increased by 8.48% and 5.15%, respectively. Furthermore, biochar promotes a sustained rise in the system’s coenzyme F420 content, improves COD removal efficiency, and effectively mitigates the inhibition of organic acids such as acetic acid and propionic acid. The enhanced oxygen-containing functional groups and voltage gradient in A3O significantly improve microbial electron transfer and organic degradation during the initial anaerobic fermentation phase, resulting in a two-day earlier peak gas production with higher output. Meanwhile, the superior specific surface area of A3T facilitates methanogens’ adhesion and colonization on biochar surfaces, continuously degrading volatile fatty acids to ensure consistent and stable gas production throughout the system’s intermediate and late stages.
The addition of biochar significantly enhances the abundance of hydrolytic acidification and methanogenic microbial communities, including Ruminofilibacter, unclassified_Bacteroidales_UCG_001, Methanosarcina, and Methobrevibacter. In the anaerobic digestion system, the predominant microbial activities are archaeal carbon metabolism and energy metabolism. Biochar addition markedly boosts energy metabolism and amino acid metabolism. In the methane generation pathway, H2/CO2 reduction is the primary mechanism, while the dark hydrogenation pathway is also promoted. The fermentation effects of A3O treatment are better than those of CK treatment because of different carbonization times and the changes in physical and chemical properties of materials. The main reason is that A3O treatment can accelerate and improve the gas production efficiency in the start-up period and promote the activity of hydrogenotrophic methanogens more significantly than CK treatment. The biochar with a longer carbonization time in A3T develops a superior pore structure and specific surface area, creating an optimal microenvironment for microbial attachment and growth, thereby enhancing microbial enrichment. Hence, the significant increase in the abundance of Methanosarcina and Methobrevibacter, the dominant methanogenic archaea, is pivotal in driving the improvement of dark hydrogenation function, in which Methanosarcina also can facilitate direct electron transfer through biochar materials, interacting with transmembrane electron transport chains such as cytochrome c [48].
Studies have demonstrated that biochar materials can enhance the abundance of methanogenic bacteria, improve interspecies electron transfer capacity, reduce hydrogen partial pressure, and alleviate metabolic inhibition by leveraging their high specific surface area and conductivity, thereby boosting the metabolic efficiency of key microbial communities [8]. Biochar materials prepared under different pyrolysis carbonization time conditions exhibit distinct physicochemical properties and demonstrate varying functionalities in anaerobic digestion systems. Specifically, A3O-treated biochar with 1 h carbonization time contains oxygen-functional groups and higher voltage differences, accelerating gas production efficiency during the initial stage of anaerobic digestion. In contrast, A3T-treated biochar with 2 h carbonization time utilizes its superior pore structure and specific surface area to provide an optimal attachment and colonization environment for methanogens, establishing a conductive microenvironment. Thus, the favorable aromatic structure and surface functional groups of biochar are pivotal in its role as an electron transfer medium [49,50]. Overall, biochar addition promotes hydrolytic enzyme activation [51], effectively enhances system buffering capacity [52], improves gas production efficiency, and facilitates the construction of conductive microenvironments that support key methanogen enrichment and interspecies electron transfer [16]. This enhances dark hydrogen oxidation capacity, increases the abundance of hydrolytic acidifying and methanogenic microorganisms, balances hydrolysis, acidification, and methanogenesis [53], mitigates the inhibitory effects of organic acid accumulation, promotes energy and amino acid metabolism, and strengthens the H2/CO2 reduction pathway for methanogenesis.
The application of corn straw and other organic waste as raw materials for biochar production has been proved to be effective, because of their low cost and easy availability. By designing pyrolysis parameters (temperature and time length) according to different stages and requirements of anaerobic fermentation gas production, strategic regulation of biochar properties can be achieved to enhance system functionality. This approach synergistically improves methane production efficiency, system resilience to shocks, and rapid activation in anaerobic digestion systems, thereby providing a referable, controllable, and designable engineering pathway for efficient resource utilization of livestock and poultry manure. Moreover, unlike other promotion processes such as bentonite, zeolite, and metal loading [54], considering the safe and fertilization utilization of biogas slurry, the biochar materials prepared from organic waste such as corn stalks will not increase the potential hazards of heavy metal element accumulation in the soil environment. Therefore, this is an effective approach to reduce environmental pollution, promote the transition to renewable energy, reduce carbon emissions, and build a regional circular low-carbon agricultural industrial chain, which is highly consistent with China’s strategic goals of “carbon peak and carbon neutrality” and has broad application prospects.

Author Contributions

The F.S. and S.W. conceived the experiment; S.W., F.S., P.L., Y.B. and S.L. conducted the experiments; Z.P. and X.Y. analysis and interpreted the results; S.W. and F.S. wrote and edited the manuscript. All authors have read and agreed to the published version of the manuscript.

Funding

This work was supported by National Natural Science Foundation of China (U21A20162); Heilongjiang Province Agricultural Science and Technology Innovation and Leaping Project (CX22YQ35); Heilongjiang Provincial-level Scientific Research Institutes Scientific Research Business Expense Project (CZKYF2022-1-C002); Heilongjiang Provincial Key Research Projects (2022ZXJ08B02).

Data Availability Statement

The original contributions presented in this study are included in the article. Further inquiries can be directed to the corresponding author.

Conflicts of Interest

The authors declare no conflict of interest.

References

  1. Wang, S.M.; Wang, Z.; Wang, N.; Wang, S.L.; Zeng, S.; Xu, Z.Z.; Liu, D.; Zhao, X.L.; Liu, F.; Xu, J.L.; et al. Efficient conversion of corn straw to feed protein through solid-state fermentation using a thermophilic microbial consortium. Waste Manag. 2025, 194, 298–308. [Google Scholar] [CrossRef]
  2. Wang, X.X.; Du, R.Y.; Wang, Y.F.; Tan, R. Exploration of Agricultural Solid Waste Management Models under the Background of Chinese Path to Modernization. Issues Agric. Econ. 2026, 1, 120–132. [Google Scholar] [CrossRef]
  3. Di, J.Y.; Li, G.Q.; Zhang, Y.N.; Yang, L.; Wang, S.W. Research and Prospect on Status and Standardization Technology of Agricultural Waste Recycling in China. Outlook Agr. 2022, 12, 73–78. [Google Scholar] [CrossRef]
  4. Chen, M.; Liu, S.J.; Yuan, X.F.; Li, Q.X.; Wang, F.Z.; Xin, F.J.; Wen, B.T. Methane production and characteristics of the microbial community in the co-digestion of potato pulp waste and dairy manure amended with biochar. Renew. Energ. 2021, 163, 357–367. [Google Scholar] [CrossRef]
  5. Chiappero, M.; Norouzi, O.; Hu, M.Y.; Demichelis, F.; Berruti, F.; Maria, F.D.; Masek, O.; Fiore, S. Review of biochar role as additive in anaerobic digestion processes. Renew. Sust. Energ. Rev. 2020, 131, 110037. [Google Scholar] [CrossRef]
  6. Nie, W.K.; Lin, Y.; Wu, X.; Wu, S.H.; Li, X.; Cheng, J.J.; Yang, C.P. Chitosan-Fe3O4 composites enhance anaerobic digestion of liquor wastewater under acidic stress. Bioresour. Technol. 2023, 377, 128927. [Google Scholar] [CrossRef]
  7. He, Y.; Wang, S.L.; Shen, C.H.; Wang, Z.; Liu, Y.Y.; Meng, X.Y.; Li, X.Y.; Zhao, X.L.; Chen, J.M.; Xu, J.L.; et al. Biochar accelerates methane production efficiency from Baijiu wastewater: Some viewpoints considering direct interspecies electron transfer. Chem. Eng. J. 2024, 497, 154527. [Google Scholar] [CrossRef]
  8. Zhang, L.; Lim, E.Y.; Loh, K.C.; Ok, Y.S.; Lee, J.T.E.; Shen, Y.; Wang, C.H.; Dai, Y.J.; Tong, Y.W. Biochar enhanced thermophilic anaerobic digestion of food waste: Focusing on biochar particle size, microbial community analysis and pilot-scale application. Energ. Convers. Manag. 2020, 209, 112654. [Google Scholar] [CrossRef]
  9. Shen, Y.; Linville, J.L.; Leon, I.D.; Schoene, R.P.; Urgun-Demirtas, M. Towards a sustainable paradigm of waste-to-energy process: Enhanced anaerobic digestion of sludge with woody biochar. J. Clean. Prod. 2016, 135, 1054–1064. [Google Scholar] [CrossRef]
  10. Lehmann, L.; Rillig, M.C.; Thies, J.; Masiello, C.A.; Hockaday, W.C.; Crowley, D. Biochar effects on soil biota—A review. Soil Biol. Biochem. 2011, 43, 1812–1836. [Google Scholar] [CrossRef]
  11. Ahmad, M.; Rajapaksha, A.U.; Lim, J.E.; Zhang, M.; Bolan, N.; Mohan, D.; Vithanage, M.; Lee, S.S.; Yong, S.O. Biochar as a sorbent for contaminant management in soil and water: A review. Chemosphere 2013, 99, 19–33. [Google Scholar] [CrossRef]
  12. Luo, C.; Fan, L.; Shao, L.; He, P. Application of eco-compatible biochar in anaerobic digestion to relieve acid stress and promote the selective colonization of functional microbes. Water Res. 2015, 68, 710–718. [Google Scholar] [CrossRef]
  13. Masebinu, S.O.; Akinlabi, E.T.; Muzenda, E.; Aboyade, A.O. A review of biochar properties and their roles in mitigating challenges with anaerobic digestion. Renew. Sust. Energ. Rev. 2019, 103, 291–307. [Google Scholar] [CrossRef]
  14. Wang, G.J.; Li, Q.; Li, Y.; Xing, Y.; Yao, G.F.; Liu, Y.Z.; Chen, R.; Wang, X.C. Redox-active biochar facilitates potential electron tranfer between syntrophic partners to enhance anaerobic digestion under high organic loading rate. Bioresour. Technol. 2020, 298, 122524. [Google Scholar] [CrossRef]
  15. Demirer, S.U.; Xu, M.C.; Marks, A.; Liu, Y.; Saffron, C.; Liao, W. Influence of biochar on microbial communities and anaerobic digestion of aqueous pyrolysis liquid (APL). Biomass Bioenerg. 2025, 198, 107891. [Google Scholar] [CrossRef]
  16. Shao, Z.J.; Fan, Q.B.; Gao, F.F.; Xia, T.; Wang, Y.; Liang, Y.; Guo, X.H.; Yang, X.M.; Yao, Y.Q.; Qiu, L.; et al. Sustained methane production enhancement by magnetic biochar and its recovery in semi-continuous anaerobic digestion with varying substrate C/N ratios. Chem. Eng. J. 2025, 514, 163050. [Google Scholar] [CrossRef]
  17. Yang, Y.; Zhang, Y.; Li, Z.; Quan, X.; Zhao, Z. Adding granular activated carbon into anaerobic sludge digestion to promote methane production and sludge decomposition. J. Clean. Prod. 2017, 149, 1101–1108. [Google Scholar] [CrossRef]
  18. Sirohi, R.; Kumar, M.; Vivekanand, V.; Shakya, A.; Tarafdar, A.; Singh, R.; Sawarkar, A.D.; Hoang, A.T.; Pandey, A. Integrating biochar in anaerobic digestion: Insights into diverse feedstocks and algal biochar. Environ. Technol. Innov. 2024, 36, 103814. [Google Scholar] [CrossRef]
  19. Wang, S.; Shi, F.M.; Li, P.F.; Yang, F.S.; Pei, Z.J.; Yu, Q.Y.; Zuo, X.; Liu, J. Effects of rice straw biochar on methanogenic bacteria and metabolic function in anaerobic digestion. Sci. Rep. 2022, 12, 6971. [Google Scholar] [CrossRef]
  20. Loc, G.X.; Phuong, D.T.M. Optimizing biochar production: A review of recent progress in lignocellulosic biomass pyrolysis. Front. Agr. Sci. Eng. 2025, 12, 148–172. [Google Scholar] [CrossRef]
  21. Li, G.; Ye, R.C.; Wu, S.M.; Liu, X.H.; Huang, M.J.; Guo, J.D.; Gao, Y.; Chen, W.; Ma, Y. Fly ash-doped biochar fabricated by pyrolysis and hydrothermal strategies: Characteristics and potentialities of carbon sequestration. Carbon Res. 2025, 4, 23. [Google Scholar] [CrossRef]
  22. Lin, H.; Xie, J.; Dong, Y.; Liu, J.; Meng, K.; Jin, Q. A complete review on the surface functional groups in pyrolyzed biochar and its interaction mechanism with heavy metal in water. J. Envir. Chem. Eng. 2025, 13, 116681. [Google Scholar] [CrossRef]
  23. Shen, R.X.; Jing, Y.; Feng, J.; Zhao, L.X.; Yao, Z.L.; Yu, J.D.; Chen, J.K.; Chen, R.L. Simultaneous carbon dioxide reduction and enhancement of methane production in biogas via anaerobic digestion of cornstalk in continuous stirred-tank reactors: The influences of biochar, environmental parameters, and microorganisms. Bioresour. Technol. 2021, 319, 124146. [Google Scholar] [CrossRef]
  24. Liu, Z.R.; Fu, Q.Z.; Wang, J.Y.; Liang, X.H.; Yang, F.; Liu, X.R.; Wang, D.B. Role of initial pH in modulating sulfur cycle dynamics in sludge anaerobic fermentation. Bioresour. Technol. 2025, 423, 132222. [Google Scholar] [CrossRef]
  25. Feng, L.K.; Mu, H.Z.; Gao, Z.L.; Hu, T.Y.; He, S.F.; Liu, Y.; You, S.J.; Zhao, Q.L.; Wei, L.L. Comprehensive insights into the impact of magnetic biochar on protein hydrolysis in sludge anaerobic digestion: Protein structures, microbial activities and syntrophic metabolisms. Water Res. 2024, 260, 121963. [Google Scholar] [CrossRef]
  26. Dai, X.F.; Bai, Y.R.; Lian, S.J.; Qi, X.J.; Feng, K.; Fu, S.F.; Guo, R.B. Distinct Mechanisms between Free Iron Species and Magnetite Addition in Anaerobic Digestion on Alleviating Ammonia Inhibition. Acs. Est. Eng. 2024, 4, 1990–2001. [Google Scholar] [CrossRef]
  27. Tian, W.; Khan, E.; Tsang, D.C.W. Strategy to improve anaerobic fermentation performance of lactate-rich wastewater by combining biochar augmentation and acetate supplementation. Chem. Eng. J. 2025, 506, 159782. [Google Scholar] [CrossRef]
  28. Cheng, X.S.; Wei, Z.C.; Cao, W.B.; Feng, Q.; Liu, J.C.; Wu, Y.; Feng, L.Y.; Wang, D.B.; Luo, J.Y. Untangling the interplay of dissolved organic matters variation with microbial symbiotic network in sludge anaerobic fermentation triggered by various pretreatments. Water Res. 2024, 260, 121930. [Google Scholar] [CrossRef]
  29. Qiu, L.P.; Zhang, Q.; Zhu, H.S.; Reich, P.B.; Banerjee, S.; Van, D.H.M.; Sadowsky, M.J.; Lshii, S.; Jia, X.X.; Shao, M.G.; et al. Erosion reduces soil microbial diversity, network complexity and multifunctionality. ISME J. 2021, 15, 2474–2489. [Google Scholar] [CrossRef]
  30. Stanton, T.B.; Parola, E.C. Treponema bryantii sp. nov., a Rumen Spirochete that Interacts with Cellulolytic Bacteria. Arch. Microbiol. 1980, 127, 145–156. [Google Scholar] [CrossRef]
  31. Ma, J.Y.; Chen, F.F.; Xue, S.X.; Pan, J.T.; Khoshnevisan, B.; Yang, Y.D.; Liu, H.B.; Qiu, L. Improving anaerobic digestion of chicken manure under optimized biochar supplementation strategies. Bioresour. Technol. 2021, 325, 124697. [Google Scholar] [CrossRef]
  32. Huang, R.; Tang, C.Y.; Zhao, Y.M.; Liu, L.N.; Chen, J.Z.; Shi, Z.R.; Yan, Z. Unveiling the biochar-respiratory growth of methanosarcina acetivorans Involving extracellular polymeric substances. Microb. Ecol. 2023, 86, 2970–2980. [Google Scholar] [CrossRef]
  33. Prakash, D.; Chauhan, S.S.; Ferry, J.G. Life on the thermodynamic edge: Respiratory growth of an acetotrophic methanogen. Sci. Adv. 2019, 5, 9059. [Google Scholar] [CrossRef]
  34. Chen, S.S.; Rotaru, A.E.; Shrestha, P.M.; Malvankar, N.S.; Fan, W.; Nevin, K.P.; Lovley, D.R. Promoting Interspecies Electron Transfer with Biochar. Sci. Rep. 2014, 4, 5019. [Google Scholar] [CrossRef]
  35. Rotaru, A.E.; Shrestha, P.M.; Liu, F.H.; Shrestha, M.; Shrestha, D.; Embree, M.; Zengler, K.; Wardman, C.; Nevin, K.P.; Lovley, D.R. A new model for electron flow during anaerobic digestion: Direct interspecies electron transfer to Methanosaeta for the reduction of carbon dioxide to methane. Energy Environ. Sci. 2013, 7, 408–415. [Google Scholar] [CrossRef]
  36. Vijay, V.; Chandra, R.; Vivekanand, V.; Chandel, A.K. Editorial: The role of biochar in enhancing biogas productivity and bio-fertilizer quality. Front. Energy. Res. 2024, 12, 1357466. [Google Scholar] [CrossRef]
  37. Zhou, H.Q.; Brown, R.C.; Wen, Z.Y. Anaerobic digestion of aqueous phase from pyrolysis of biomass: Reducing toxicity and improving microbial tolerance. Bioresour. Technol. 2019, 292, 121976. [Google Scholar] [CrossRef]
  38. Torri, C.; Fabbri, D. Biochar enables anaerobic digestion of aqueous phase from intermediate pyrolysis of biomass. Bioresour. Technol. 2014, 172, 335–341. [Google Scholar] [CrossRef]
  39. Li, Y.Z.; Chen, Z.; Peng, Y.Y.; Huang, W.Z.; Liu, J.X.; Mironov, V.; Zhang, S.H. Deeper insights into the effects of substrate to inoculum ratio selection on the relationship of kinetic parameters, microbial communities, and key metabolic pathways during the anaerobic digestion of food waste. Water Res. 2022, 217, 118440. [Google Scholar] [CrossRef]
  40. Jing, Y.H.; Wan, J.J.; Angelidaki, I.; Zhang, S.C.; Luo, G. iTRAQ quantitative proteomic analysis reveals the pathways for methanation of propionate facilitated by magnetite. Water Res. 2017, 108, 212–221. [Google Scholar] [CrossRef]
  41. Zhou, M.M.; Yan, B.H.; Wong, J.W.C.; Zhang, Y. Enhanced volatile fatty acids production from anaerobic fermentation of food waste: A mini-review focusing on acidogenic metabolic pathways. Bioresour. Technol. 2018, 248, 68–78. [Google Scholar] [CrossRef]
  42. Zhang, W.Q.; Lang, Q.Q.; Fang, M.; Li, X.; Bah, H.; Dong, H.M.; Dong, R.J. Combined effect of crude fat content and initial substrate concentration on batch anaerobic digestion characteristics of food waste. Bioresour. Technol. 2017, 232, 304–312. [Google Scholar] [CrossRef]
  43. Wang, R.M.; Li, C.X.; Lv, N.; Pan, X.F.; Cai, G.J.; Ning, J.; Zhu, G.F. Deeper insights into effect of activated carbon and nano-zero-valent iron addition on acidogenesis and whole anaerobic digestion. Bioresour. Technol. 2021, 324, 124671. [Google Scholar] [CrossRef]
  44. Zhang, Q.; Chen, Y.; Davis, R. Anaerobic Digestion of Agricultural Organic Wastes for Biogas Production in China: Current Status, Policy Framework, and Future Perspectives. J. Clean. Prod. 2023, 392, 136325. [Google Scholar] [CrossRef]
  45. Liu, H.; Liang, Y.B.; Zhang, G.S.; Tang, H.J.; Li, Y. Challenge and path to integrated development of natural gas and renewable gas. Nat. Gas Ind. 2022, 9, 1–9. [Google Scholar] [CrossRef]
  46. Zeng, J.; Yin, F.; Zhang, W.D.; Wu, K.; Wang, C.M.; Liu, J.; Zhao, X.L.; Yang, H. Effects of adding vermiculite on anaerobic dry fermentation of cow manure. China Biogas 2021, 39, 33–38. [Google Scholar] [CrossRef]
  47. Qin, Y.; Wang, H.S.; Li, X.R.; Chen, J.Y.; Wu, W.X. Improving methane yield from organic fraction of municipal solid waste (OFMSW) with magnetic rice-straw biochar. Bioresour. Technol. 2017, 254, 1058–1066. [Google Scholar] [CrossRef]
  48. Di, L.; Wang, F.; Wang, H.; Zhang, D.; Yi, W.M.; Shen, X.L. Influence of nano-Fe3O4 biochar on the methanation pathway during anaerobic digestion of chicken manure. Bioresour. Technol. 2023, 377, 128979. [Google Scholar] [CrossRef]
  49. Bu, J.; Hu, B.B.; Wu, H.Z.; Zhu, M.J. Improved methane production with redox-active/conductive biochar amendment by establishing spatial ecological niche and mediating electron transfer. Bioresour. Technol. 2022, 351, 127072. [Google Scholar] [CrossRef]
  50. Oh, S.Y.; Seo, Y.D. Polymer/biomass-derived biochar for use as a sorbent and electron transfer mediator in environmental applications. Bioresour. Technol. 2016, 218, 77–83. [Google Scholar] [CrossRef]
  51. Yang, G.; Wang, J.L. Synergistic enhancement of biohydrogen production from grass fermentation using biochar combined with zero-valent iron nanoparticles. Fuel 2019, 251, 420–427. [Google Scholar] [CrossRef]
  52. Wang, Q.F.; Peng, L.Y.; Su, H.J. The effect of a buffer function on the semi-continuous anaerobic digestion. Bioresour. Technol. 2013, 139, 43–49. [Google Scholar] [CrossRef] [PubMed]
  53. Sunyoto, N.M.S.; Zhu, M.M.; Zhang, Z.Z.; Zhang, D.K. Effect of biochar addition on hydrogen and methane production in two-phase anaerobic digestion of aqueous carbohydrates food waste. Bioresour. Technol. 2016, 219, 29–36. [Google Scholar] [CrossRef]
  54. Liu, L.L.; Zhang, T.; Wan, H.W.; Chen, Y.L.; Wang, X.J.; Yang, G.H.; Ren, G.X. Anaerobic co-digestion of animal manure and wheat straw for optimized biogas production by the addition of magnetite and zeolite. Energy Convers. Manage. 2015, 97, 132–139. [Google Scholar] [CrossRef]
Figure 1. SEM images of biochar at different pyrolysis temperatures. (a,b), biochar prepared by pyrolysis for 1 h, A3O; (c,d), biochar prepared by pyrolysis for 2 h, A3T.
Energies 19 01614 g001
Figure 2. FTIR images of biochar at different pyrolysis temperatures. A1, 1 h and A2, 2 h.
Energies 19 01614 g002
Figure 3. Effects of biochar on daily methane production.
Energies 19 01614 g003
Figure 4. The changes of (a) pH; (b) F420; (c) ammonia nitrogen; (d) chemical oxygen demand (COD) during AD.
Energies 19 01614 g004
Figure 5. The changes of (a) acetic acid; (b) propionic acid; (c) isobutyric acid; (d) n-butyric acid; (e) isovaleric acid; (f) n-valeric acid during AD.
Energies 19 01614 g005
Figure 6. Microbial community composition under different treatments at (a) the phylum level and (b) the genus level; α-diversity indices (ce); and (f) β-diversity analysis.
Energies 19 01614 g006aEnergies 19 01614 g006b
Figure 7. The community composition of archaea under different treatments at (a) the phylum level and (b) the genus level; α-diversity indices (ce); and (f) β-diversity analysis.
Energies 19 01614 g007aEnergies 19 01614 g007b
Figure 8. (a) Functional notes of archaea KEGG at level 1; (b) functional notes of archaea KEGG at level 2; (c) FAPROTAX diagram of archaea.
Energies 19 01614 g008
Figure 9. (a) Functional notes of bacteria KEGG at level 1; (b) functional notes of bacteria KEGG at level 2; (c) FAPROTAX diagram of bacteria.
Energies 19 01614 g009
Table 1. The basic properties of raw materials.
Raw MaterialsTotal Solids (TS, %)Volatile Solids Content (VS, %)pH
Cattle manure24.596.17.7
Inoculum slurry3.61.48.4
Table 2. Design of each treatment experiment.
TreatmentDosage of Dairy Manure
(g)
Dosage of Biochar
(g)
Inoculum
(mL)
TS in Fermentation System
(%)
Fermentation Temperature
(°C)
CK13001008.940.0 ± 0.5
A3O1302.841009.540.0 ± 0.5
A3T1302.841009.540.0 ± 0.5
Table 3. The basic properties of biochar under different pyrolysis time.
BiocharpHTS (%)VS (%)SSA (m2/g)TPV (cm3/g)
A3O8.693.481.62.000.001175
A3T8.791.384.16.320.005366
Note: A3O was biochar prepared by pyrolysis for 1 h and A3T biochar prepared by pyrolysis for 2 h. Total solids (TS), volatile solids content (VS), specific surface area (SSA), total pore volume (TPV).
Table 4. The conductivity and elemental composition of biochar under different pyrolysis time.
BiocharVoltage Difference (V)C (%)H (%)O (%)N (%)Fe (%)Ni (%)
A3O−0.1570.142.4511.561.550.3710.018
A3T−0.1365.192.0510.771.650.5470.025
Disclaimer/Publisher’s Note: The statements, opinions and data contained in all publications are solely those of the individual author(s) and contributor(s) and not of MDPI and/or the editor(s). MDPI and/or the editor(s) disclaim responsibility for any injury to people or property resulting from any ideas, methods, instructions or products referred to in the content.