1. Introduction
Growing attention is being directed toward minimizing municipal solid waste (MSW) generation, enhancing recycling practices, and recovering valuable materials [
1]. Consequently, the decision-making process in modern waste management increasingly relies on coupled environmental–economic assessments (e.g., integrated Life Cycle Assessment (LCA)–Life Cycle Costing (LCC)), as emphasized by recent frameworks [
2]. The complexity of MSW management (MSWM), as well as its profound ecological and economic implications, necessitates continuous assessment of regional practices, as increasingly highlighted in the recent international literature [
3,
4]. Separate collection systems and source segregation are implemented to facilitate these objectives. Nevertheless, the persistently high proportion of residual waste—waste that remains unsegregated at the household level—suggests that these systems are not yet fully effective [
5]. Residual MSW is typically composed of approximately 46% unstable organic matter (including food waste, yard trimmings, and food residues), followed by miscellaneous materials (18%), paper (17%), plastics (10%), glass (5%), and metals (4%) [
1]. The organic fraction of MSW (OFMSW) is particularly challenging to manage due to its heterogeneous chemical nature, which is influenced by diverse socio-economic conditions and seasonal variations [
6].
Mechanical–biological treatment (MBT) has become a widely adopted approach for processing mixed residual MSW globally [
7,
8,
9]. This process typically begins with a screening, which aims to screen the OFMSW, often referred to as the undersize fraction [
10,
11]. The mechanically sorted OFMWS (ms-OFMSW) is characterized by a high moisture content and a highly variable composition [
10], consisting of a mixture of organic materials (e.g., food waste, paper, cardboard, wood) along with contaminants such as plastics, metals, glass, and inert substances. This fraction is usually directed to aerobic stabilization, aimed at reducing both the mass and biological reactivity of the material [
10,
11]. However, no viable product arises from the process, but rather waste that ends up in a landfill.
On the other hand, source segregation of waste may ensure effective recycling [
12]. Unlike packaging waste recovery, biowaste management allows for the production of soil conditioners. Due to its significant volume within the MSW stream, managing the OFMSW remains a priority for waste treatment systems.
For the OFMSW treatment, two biological methods, composting and anaerobic digestion (AD), dominate [
13]. Both processes result in the production of bioproducts (compost or digestate) suitable for use as soil amendments [
14,
15].
AD involves the biological conversion of organic substrates into biogas (a combination of methane and carbon dioxide) and digestate under anaerobic conditions [
16,
17]. Conversely, composting is an aerobic process that leads to the partial mineralization of biomass and the formation of humic substances [
18].
Biogas production from MSW, particularly from the organic fraction, represents a cornerstone of the Circular Economy (CE) strategy [
19]. The economic feasibility of AD might be influenced by the following factors: labor costs, energy prices, land prices, and demand for biogas and biofertilizers [
20]. Although AD is gaining popularity, composting remains a widely used alternative, especially for biowaste recovery in the European Union (EU). Despite the advantages of AD, challenges such as high operational costs and logistical complexity hinder its large-scale implementation. AD offers environmental, energy, and economic benefits, including reducing greenhouse gas emissions and producing high-quality renewable energy [
21].
If biowaste is not collected at source, MBT processes are utilized for the recovery of the organic fraction from MSW. However, previous studies indicate that there are significant constraints on the agricultural use of bioproducts obtained via MBT [
22]. Therefore, AD of source-segregated biowaste (ss-biowaste) is a highly suitable approach to fulfill the rigorous requirements of a CE.
Source segregation ensures a higher-quality final product and improves the overall efficiency of the handling process. It was confirmed that biofertilizer derived from biowaste is appropriate for agricultural usage, while the ms-OFMSW suitability is limited. In compost obtained from ms-OFMSW, metal contents were too high; the biggest exceedances were reported in the case of lead (above 80 mg/kg) and chromium (75 mg/kg) [
22]. The heavy metal loads in fertilizers must be kept low to ensure the crops’ safety [
23]. Furthermore, the reported nitrogen and phosphorus concentrations were twice as low in compost from ms-OFMSW compared to biofertilizers from ss-biowaste [
22]. The balance of carbon, nitrogen, phosphorus, and potassium is fundamental to deciding the application of agriculture [
24].
Adequate source segregation is expected to reduce the amount of residual MSW and enhance the overall performance of waste management systems [
25]. Under current EU legislation, food and kitchen waste, major constituents of biowaste, are classified as Category 3 materials, which require pasteurization to mitigate potential health hazards [
26]. Research has shown that AD carried out under thermophilic conditions can effectively inactivate pathogenic microorganisms, serving as an alternative to conventional pasteurization [
27]. Consequently, biowaste streams destined for AD may include food waste of animal origin, while composting processes should primarily utilize green and garden waste. However, in practice, food waste is often not separately collected and ends up in the residual waste stream.
Despite existing knowledge on biological treatments, a significant research gap remains regarding how the physical presence of specific treatment infrastructure (AD vs. composting) within a regional system influences the behavior of waste generators and the resulting purity of the waste streams. Most studies focus on the efficiency of the biological processes themselves rather than on the feedback loop between available technology and the effectiveness of the preceding collection stage.
While previous studies have explored biological waste treatments, a significant gap remains in evaluating the integrated effects of different collection systems and treatment technologies on an operational, regional scale. The novelty of this study lies in its comprehensive comparative approach, directly linking local biowaste segregation rules (e.g., kitchen waste separation) with the morphological composition of the collected streams, and subsequently evaluating the cascading economic impacts, such as gate fee variations and potential energy recovery. By synthesizing composition data with economic outcomes across distinct regional management systems, this research provides actionable, real-world insights for optimizing CE strategies in MSWM.
This issue is particularly relevant in Poland, which is currently undergoing a systemic transition to meet ambitious EU recycling targets. Historically reliant on MBT facilities, Polish municipalities are now investing in specialized AD and composting plants. However, the performance of these new investments is heavily dependent on the local ‘collection-to-valorization’ chain, making the Polish MSWM system (MSWMS) a valuable case study for evaluating the transition from residual-heavy to source-segregated systems.
To address these gaps, this study analyzes distinct regional MSWMSs in Poland that are equipped with either composting or AD facilities. The research aims to evaluate how the type of available facility and the associated local collection rules impact the quantity and morphological composition of both biowaste and residual MSW. By identifying these correlations, the study provides practical insights into the benefits of regional practices in optimizing food waste valorization for energy and agricultural purposes within the CE framework.
2. Materials and Methods
2.1. The Study Area Description
Communities from three regions participated in the study into MSWMSs in Poland, which were verified: one area involved a composting facility, and the others an AD facility.
The municipalities in each region were verified in terms of the amounts of ss-biowaste and mixed/residual waste collected and delivered to the respective treatment facilities. In addition, they were divided by population and type (urban, rural, urban–rural). Furthermore, waste collection rules were verified and compared.
The study focused on waste collection system and segregation rules, considering ss-biowaste and ms-OFMSW collected from more than 60 municipalities, serving a population of more than 800,000 residents and delivered to three plants: Plant 1 (AD plant treating ms-OFMSW and ss-biowaste), Plant 2 (treating ms-OFMSW and ss-biowaste), and Plant 3 (composting plant). The municipalities were selected based on data availability, regional geographical representation, and affiliation with a given plant. It should be noted that the analyzed plants exclusively serve these designated municipalities and do not receive significant waste streams from outside this defined area.
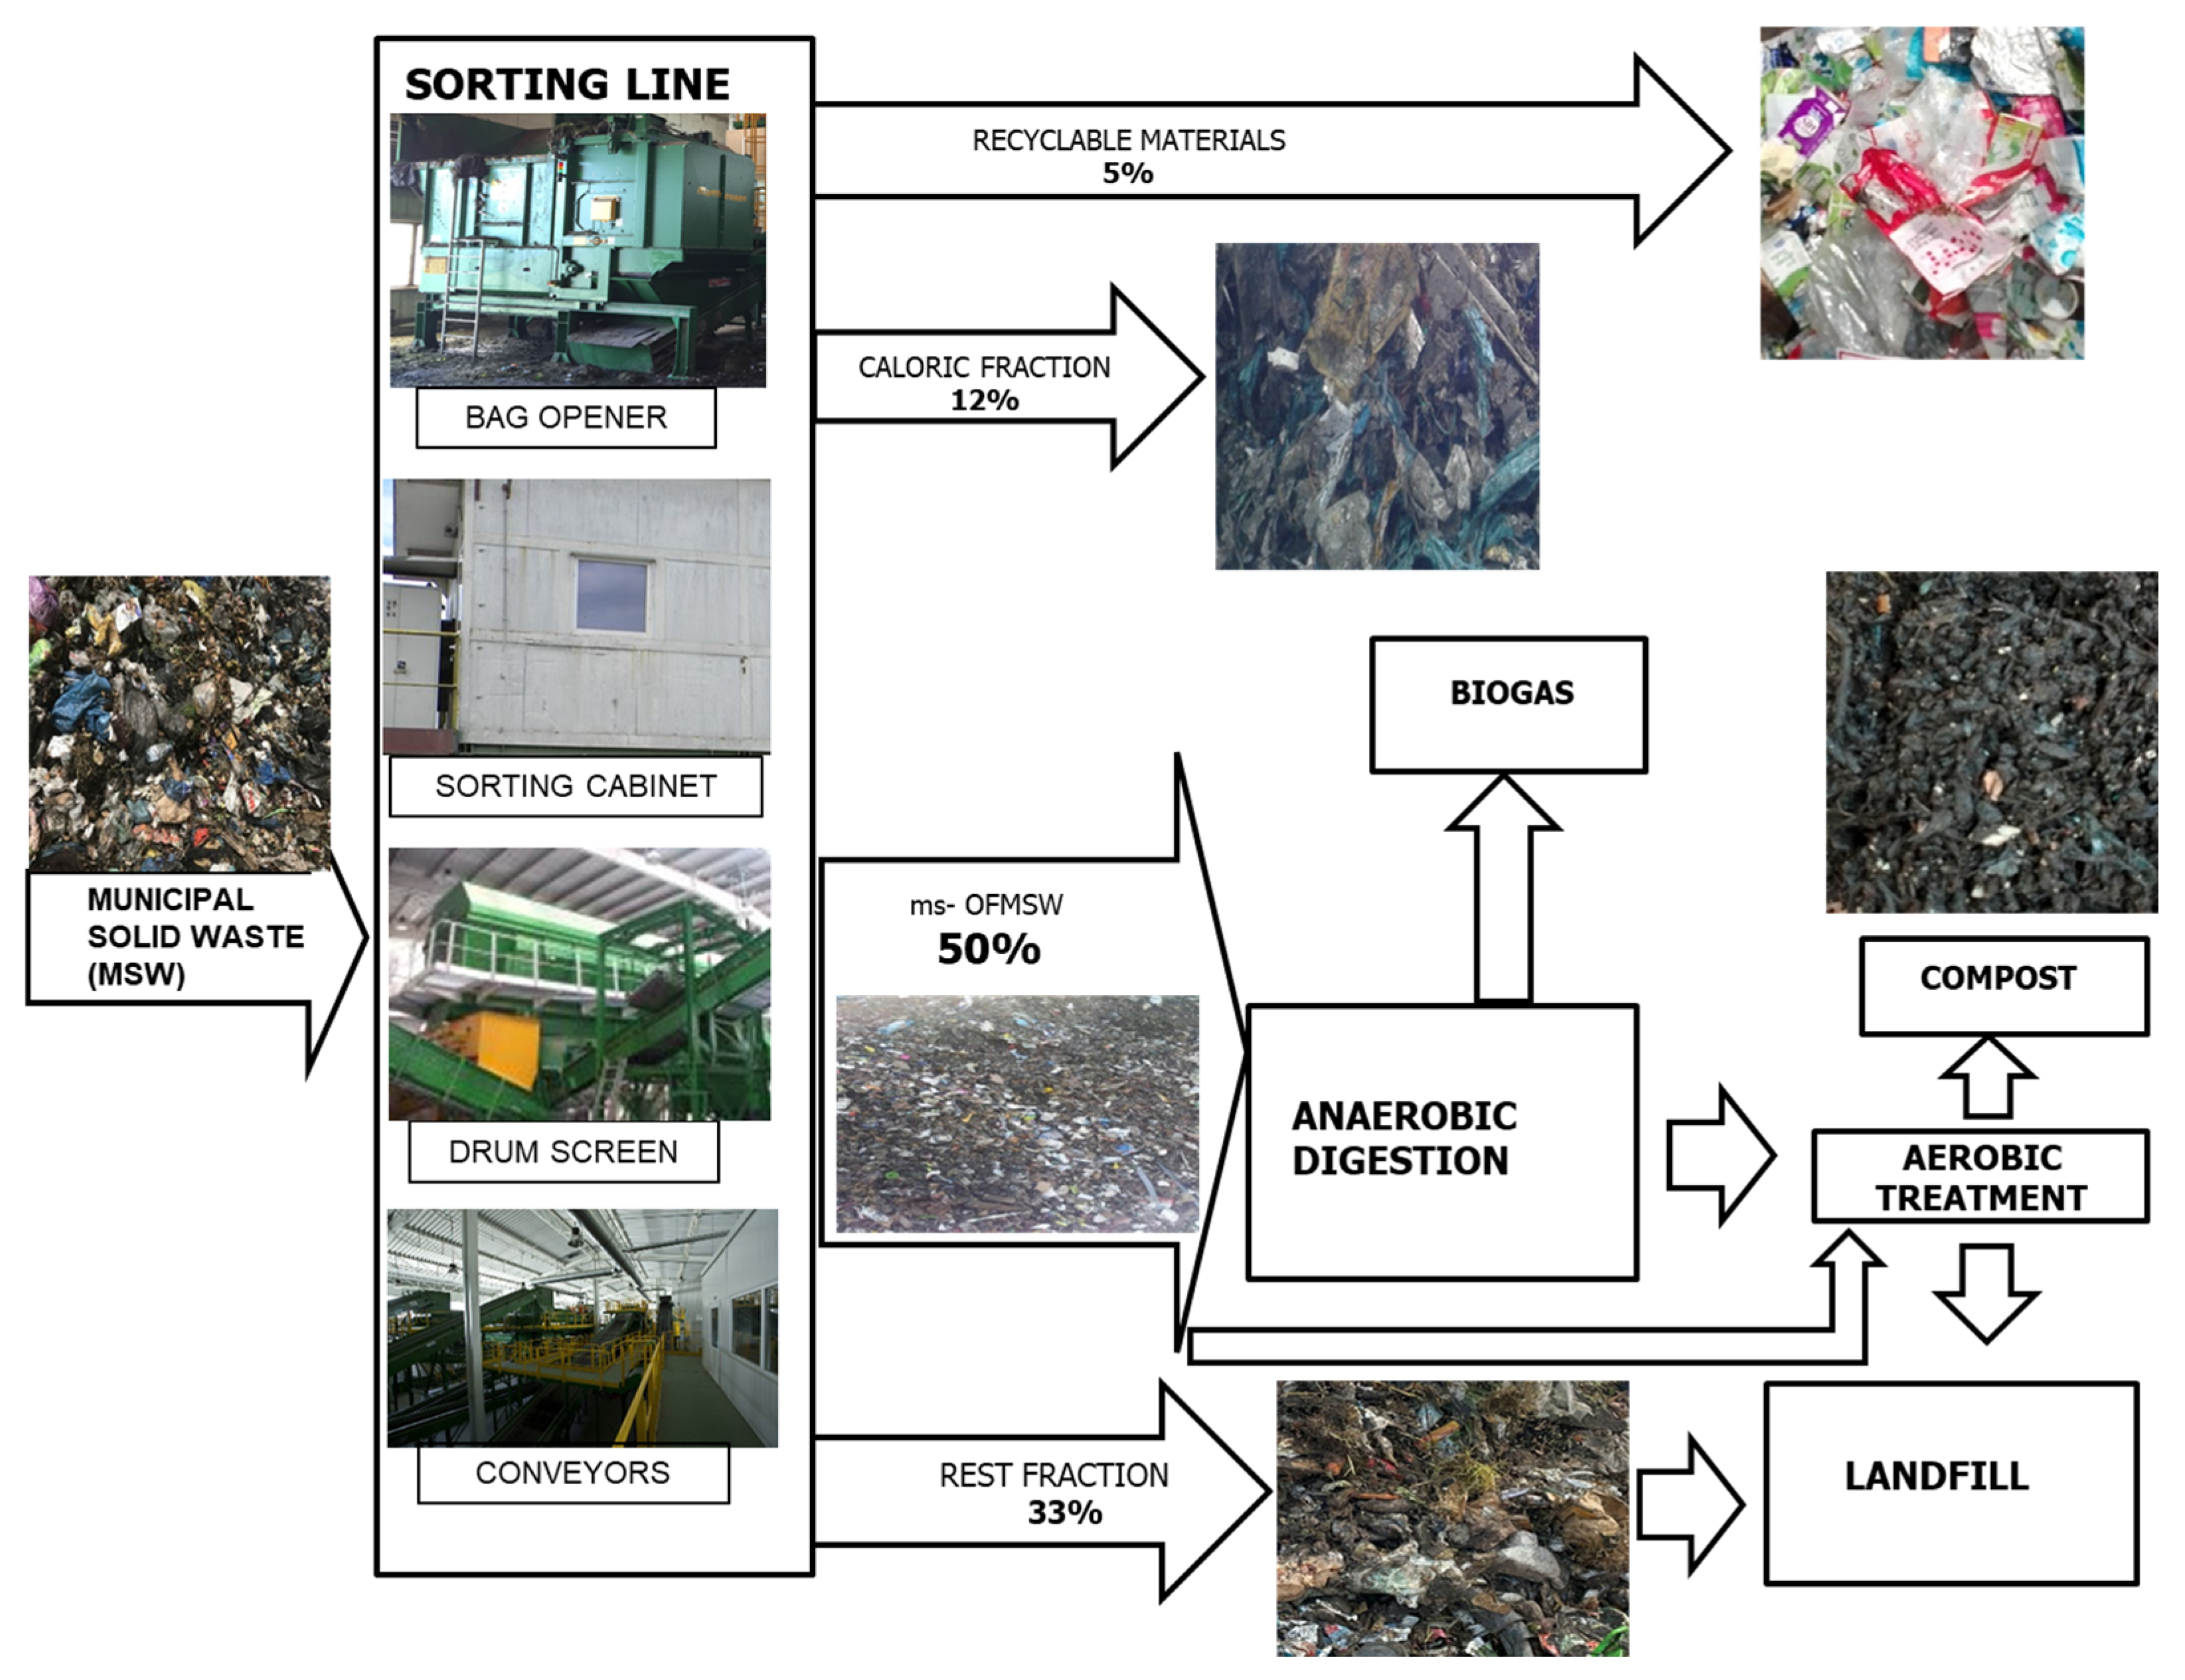
The simplified diagram of MSW treatment is presented in
Figure 1. Plant 1 provided waste treatment services to 16 municipalities in the southwestern region of Poland, serving a population of about 274,000 and handling approximately 110,000 tons of waste per year. In the mechanical sorting line dedicated to MSW treatment, upon removal of the bulky waste and bag opening, the waste was screened into three distinct fractions via a trommel (60/340 mm). The fractions >340 mm and 60–340 mm were further treated to sort out recyclable materials and caloric fractions, while the 0–60 mm fraction was defined as the ms-OFMSW (
Figure 1). The post-sorting residue (rest fraction) was landfilled (
Figure 1).
The biogas facility in Plant 1 was scaled up and designed to handle about 33,000 tons of biodegradable waste annually (including ms-OFMSW and ss-biowaste). The facility consisted of basic functional units: feedstock preparation and feeding, anaerobic chambers, digestate dewatering, biogas energy recovery, and treatment of process air.
The AD process in Plant 1 was performed in two chambers (horizontal), each with a total capacity of 1500 m3. During operation, dry matter content within the reactors was kept between 30% and 35%. The AD was carried out under thermophilic conditions at a temperature of 54 °C. Hydraulic retention time reached about 34 days. Agitation was provided by one stirrer operating at 0.45 rpm with alternating directions. Process parameters, including biogas yield and composition (CH4, CO2, O2, H2S), temperature, and chamber fill levels, were monitored and recorded by a central control system. Following digestion, a piston pump discharged the material, which was subsequently dewatered using screw presses (TSP350, Thöni, Telfs, Austria). The resulting biogas was utilized in two cogeneration (CHP) units (CG132-12, Caterpillar, Mannheim, Germany), each with an electrical power output of 600 kW.
Plant 2 served over 345,000 inhabitants from 25 municipalities, and handled approximately 180,000 tons of waste per year. Regarding the AD facility, the plant was a sister to Plant 1, as it also had two horizontal digesters. However, one chamber was dedicated to treating ms-OFMSW, while the second one treated ss-biowaste. Plant 2 also had two CHP units that generated electricity and heat.
In the mechanical sorting line dedicated to MSW treatment, upon removal of the bulky waste and passage through a bag opener, the waste stream was divided into three fractions on one of two 80/340 mm drum screens. The fractions > 340 mm and 80–340 mm were further treated to obtain the caloric fraction, while the 0–80 mm fraction was defined as the ms-OFMSW.
Plant 3 served the residents of 22 municipalities with populations of over 200,000 and handled approximately 70,000 tons of waste per year. On its mechanical sorting line, after bag opening, the waste was screened into three distinct fractions via a trommel (60/340 mm). The 80–280 and >280 mm fractions were further processed to produce a caloric fraction from waste. The 0–80 mm fraction was designated ms-OFMSW and directed to aerobic treatment (enclosed reactors with aeration and irrigation).
Ss-biowaste was delivered to the open-air composting field (made of concrete with leachate collection and a working surface of approx. 2100 m2), and it was handled in formed piles for about 8 weeks. The process was managed manually with temperature and humidity probes. Weekly watering and aeration were performed using a turning machine (Backhus A45, Eggersmann, Wardenburg, Germany).
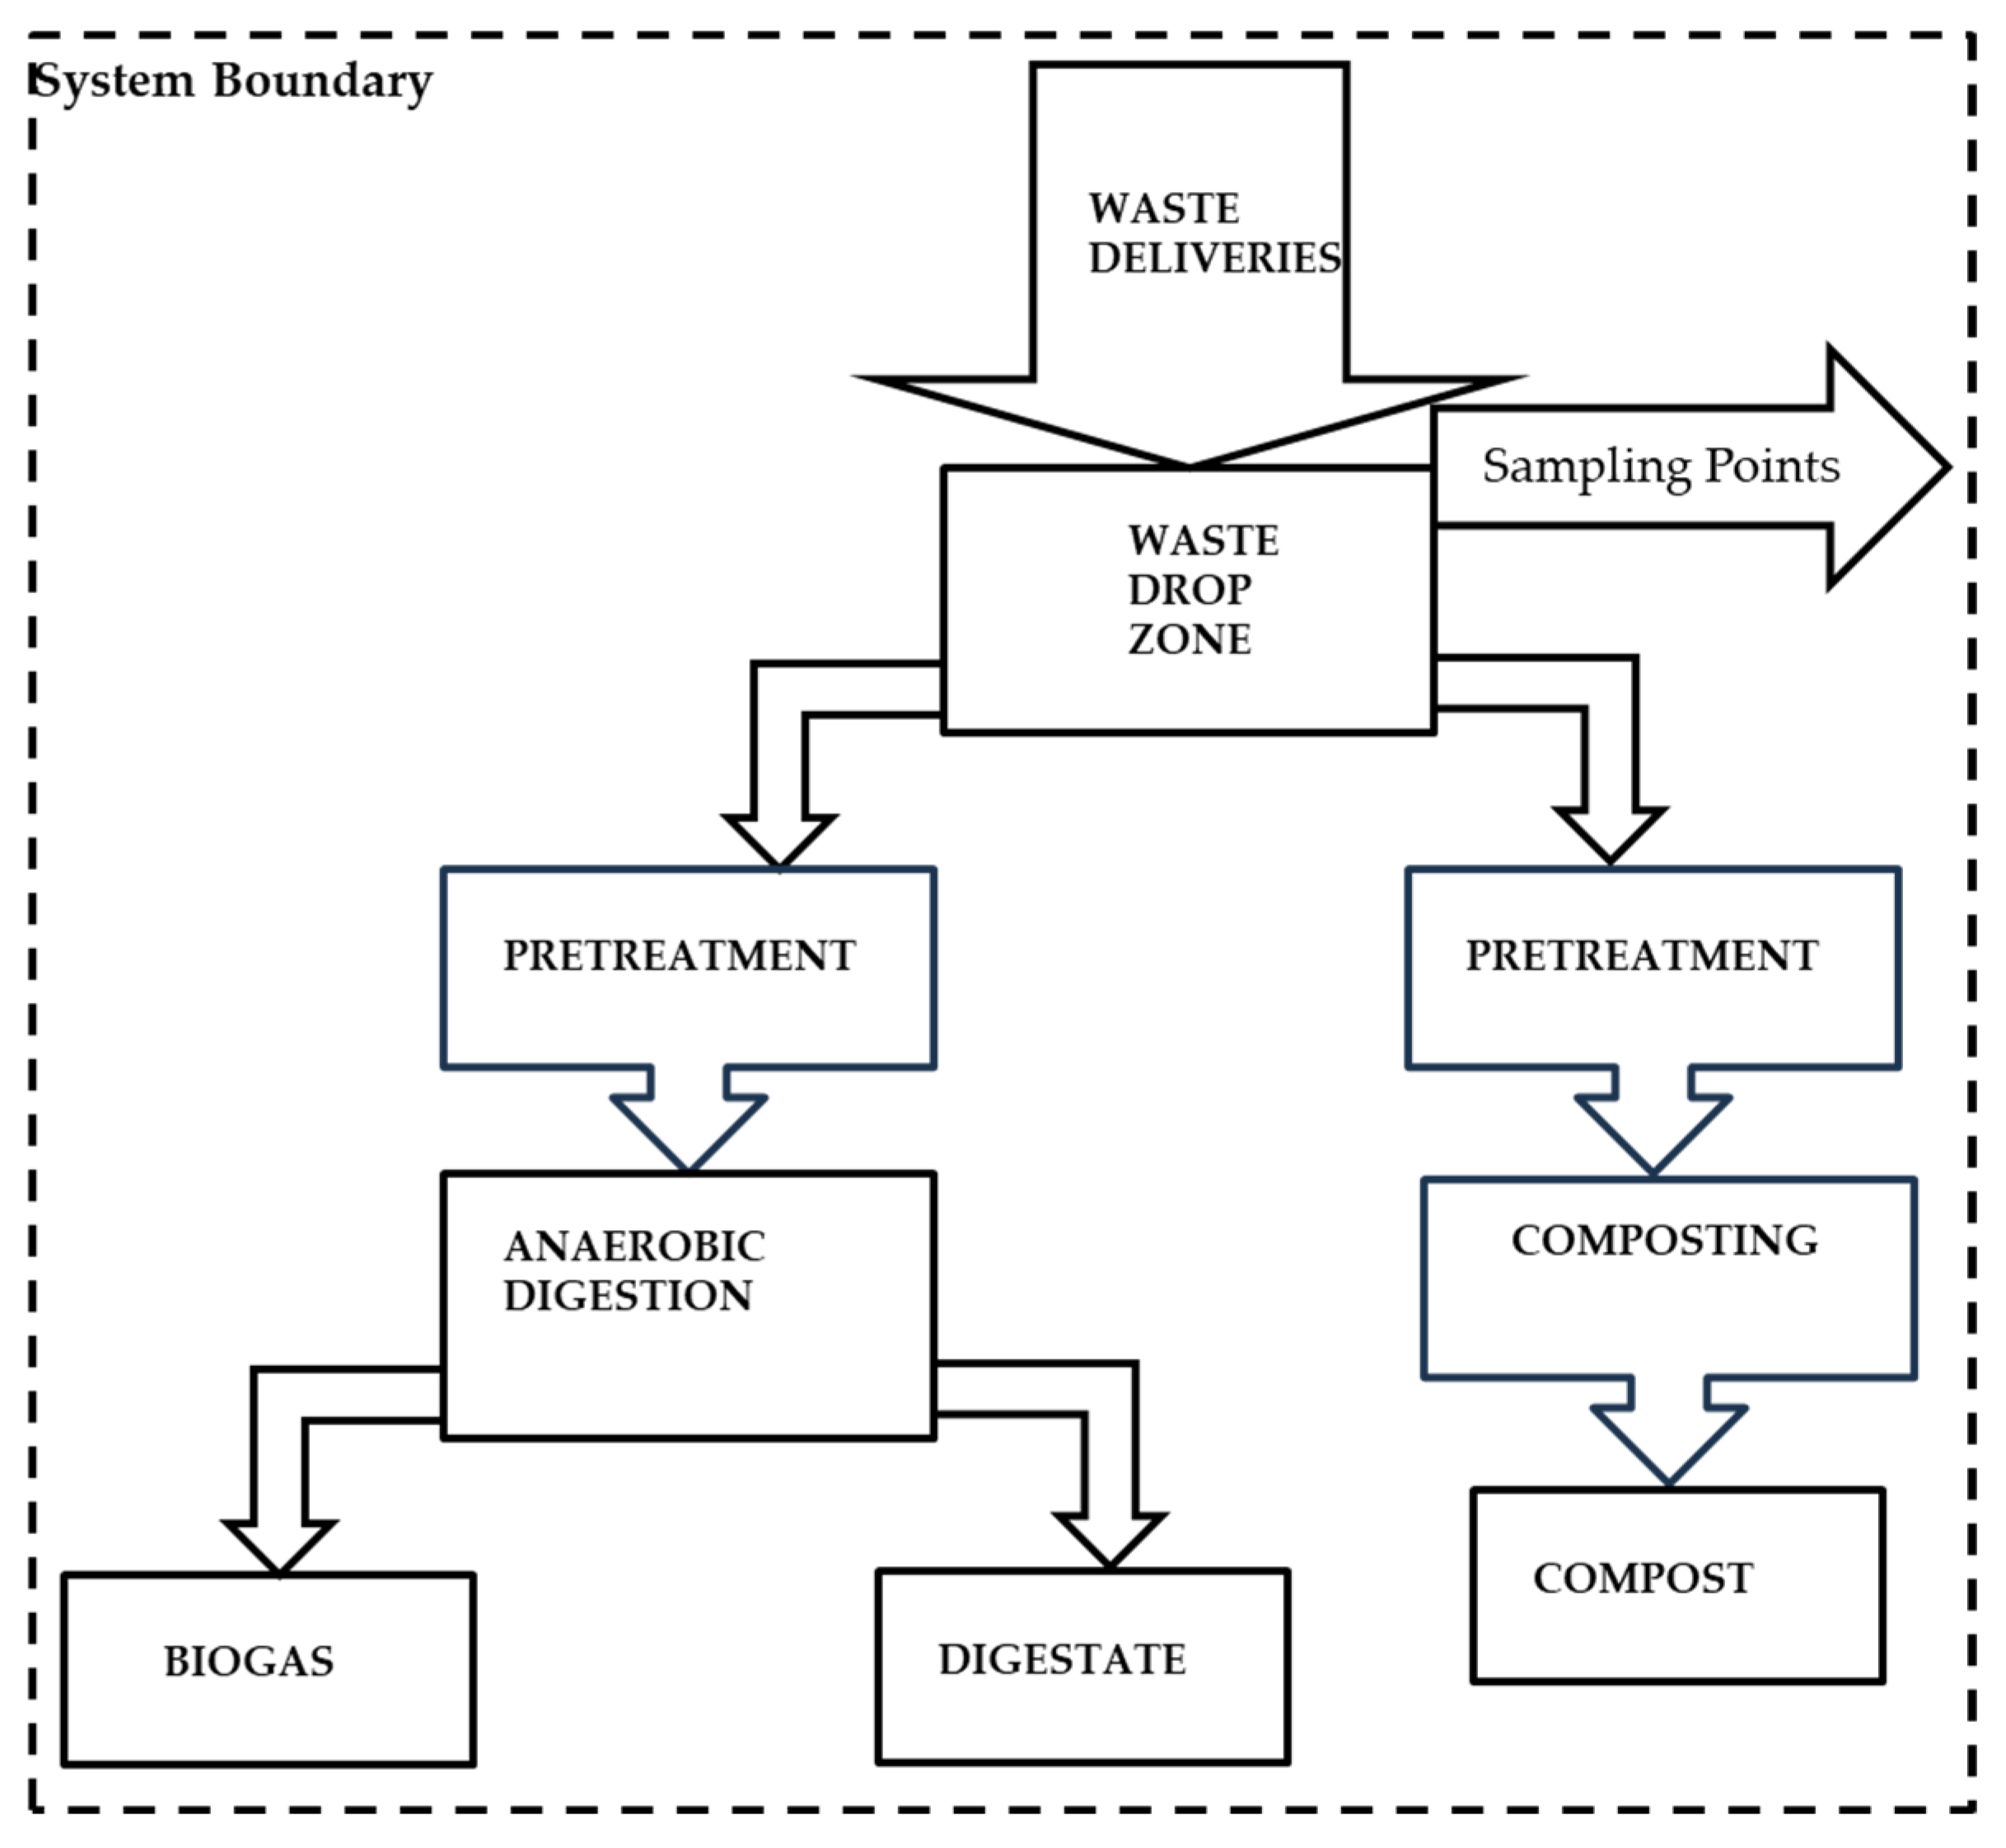
A summary of the management scenarios, comparing the AD pathways (Plants 1 and 2) against the composting pathway (Plant 3), along with system boundaries and designated sampling points, is presented in
Figure 2.
2.2. Assessment of Waste Streams
To verify changes in the waste fractions’ contributions, the study period spanned three consecutive calendar years (hereafter referred to as Year 1, Year 2, and Year 3). The municipal indicators and plant-level reporting boundaries were aligned to Year 3 to ensure analysis validity.
Quantitative trends in biowaste and residual/mixed waste were analyzed and compared based on waste volumes collected from the municipalities and delivered to the treatment plants. Data were sourced from internal facility registries and official public reports submitted by the respective local authorities.
Additionally, a month-long sampling campaign was conducted to characterize waste streams. For this study, the following streams were defined: ss-biowaste, encompassing both garden and food waste; separate collected kitchen waste (ss-kitchen), strictly containing food residues; and ms-OFMSW, representing the undersize fraction from mechanical treatment. All mass shares and composition percentages are reported on an as-received (wet mass) basis.
Samples were collected immediately upon discharge at the reception area. Sampling was conducted over four consecutive weeks to account for short-term variations. Samples were taken randomly from 15–20 delivery trucks per day on weekdays. To reduce size and shape bias, the daily collected samples (10–15 kg each) were homogenized using the coning-and-quartering method before being combined into a weekly composite sample weighing approximately 100 kg. The screen and material composition were determined on-site. The identification of 11 main fractions—organic (food waste, green waste, and wood), plastics, paper, glass, textiles, metals, multi-material, hazardous, inert, others, and a fine fraction—was performed. Weekly samples were used to calculate representative average values.
2.3. Determination of the Economic Benefits
To model the economic benefits, the electrical production potential for Plant 3 was calculated based on the performance baseline of Plants 1 and 2. Assumptions included CHP electrical efficiency of 40%. Electricity yield was calculated following the formula: biogas yield × methane content × electrical production possibility × CHP efficiency. Yearly electricity production capacity was calculated as: yearly biogas production capacity × methane content × electrical production possibility × CHP efficiency/1000. The plant’s own electricity consumption was considered based on the exploitation data for Plants 1 and 2, approximately 25% of the gross generated energy.
Gate fees evaluated in this study strictly encompass the baseline receiving costs per ton under comparable regional operational conditions.
2.4. Statistical Analysis
Data were analyzed using standard descriptive statistics. Mean values and standard deviations were calculated for waste composition over the sampling period. For plants reporting missing data points, missing values were excluded from the per capita averages rather than imputed, ensuring the metrics reflect only verified regional reports.
To validate the observed differences between the plants and regions, statistical analysis was performed. A one-way analysis of variance (ANOVA) was utilized to assess the significance of variations in biowaste share and morphological composition among the three analyzed regions. Differences were considered statistically significant at a p-value of <0.05.
3. Results and Discussion
The analyzed plants were engineered with the need for the treatment of mixed MSW taken into account. However, over the last few years, the MSWMS in Poland has faced extensive legislative restrictions. Among others, a source segregation standard has been implemented in the verified areas. Following the Minister of the Environment’s regulation of 7 October 2019 [
28], at least five fractions must be gathered: biowaste, paper, glass, metals and plastics, and mixed/residual waste. However, the rules for sorting biowaste were defined differently for the regions analyzed. Regarding the Plant 3 region, it was stated that biowaste should include fruit and vegetable residues, spoiled fruit and vegetables, eggshells, coffee and tea grounds, chopped flowers, wood sawdust, flower soil, grass, leaves, and small branches [
29]. On the other hand, meat, bones, fish, dairy products, and sausages should go in the residual waste bin.
In the region served by Plant 1, the biowaste fraction comprises green waste and all food residues, including meat, fish, and other animal-derived products [
30]. In contrast, waste management in the Plant 3 region has reached a higher level of maturity; certain municipalities have implemented separate collection for household ash, as well as a dual-stream system for biowaste (distinguishing between garden and kitchen fractions). The entire MSWMS—encompassing source segregation, containerized collection, and transport to the treatment facility—is fundamentally shaped by these segregation rules, which directly influence the quantities, compositions, and purities of the collected fractions.
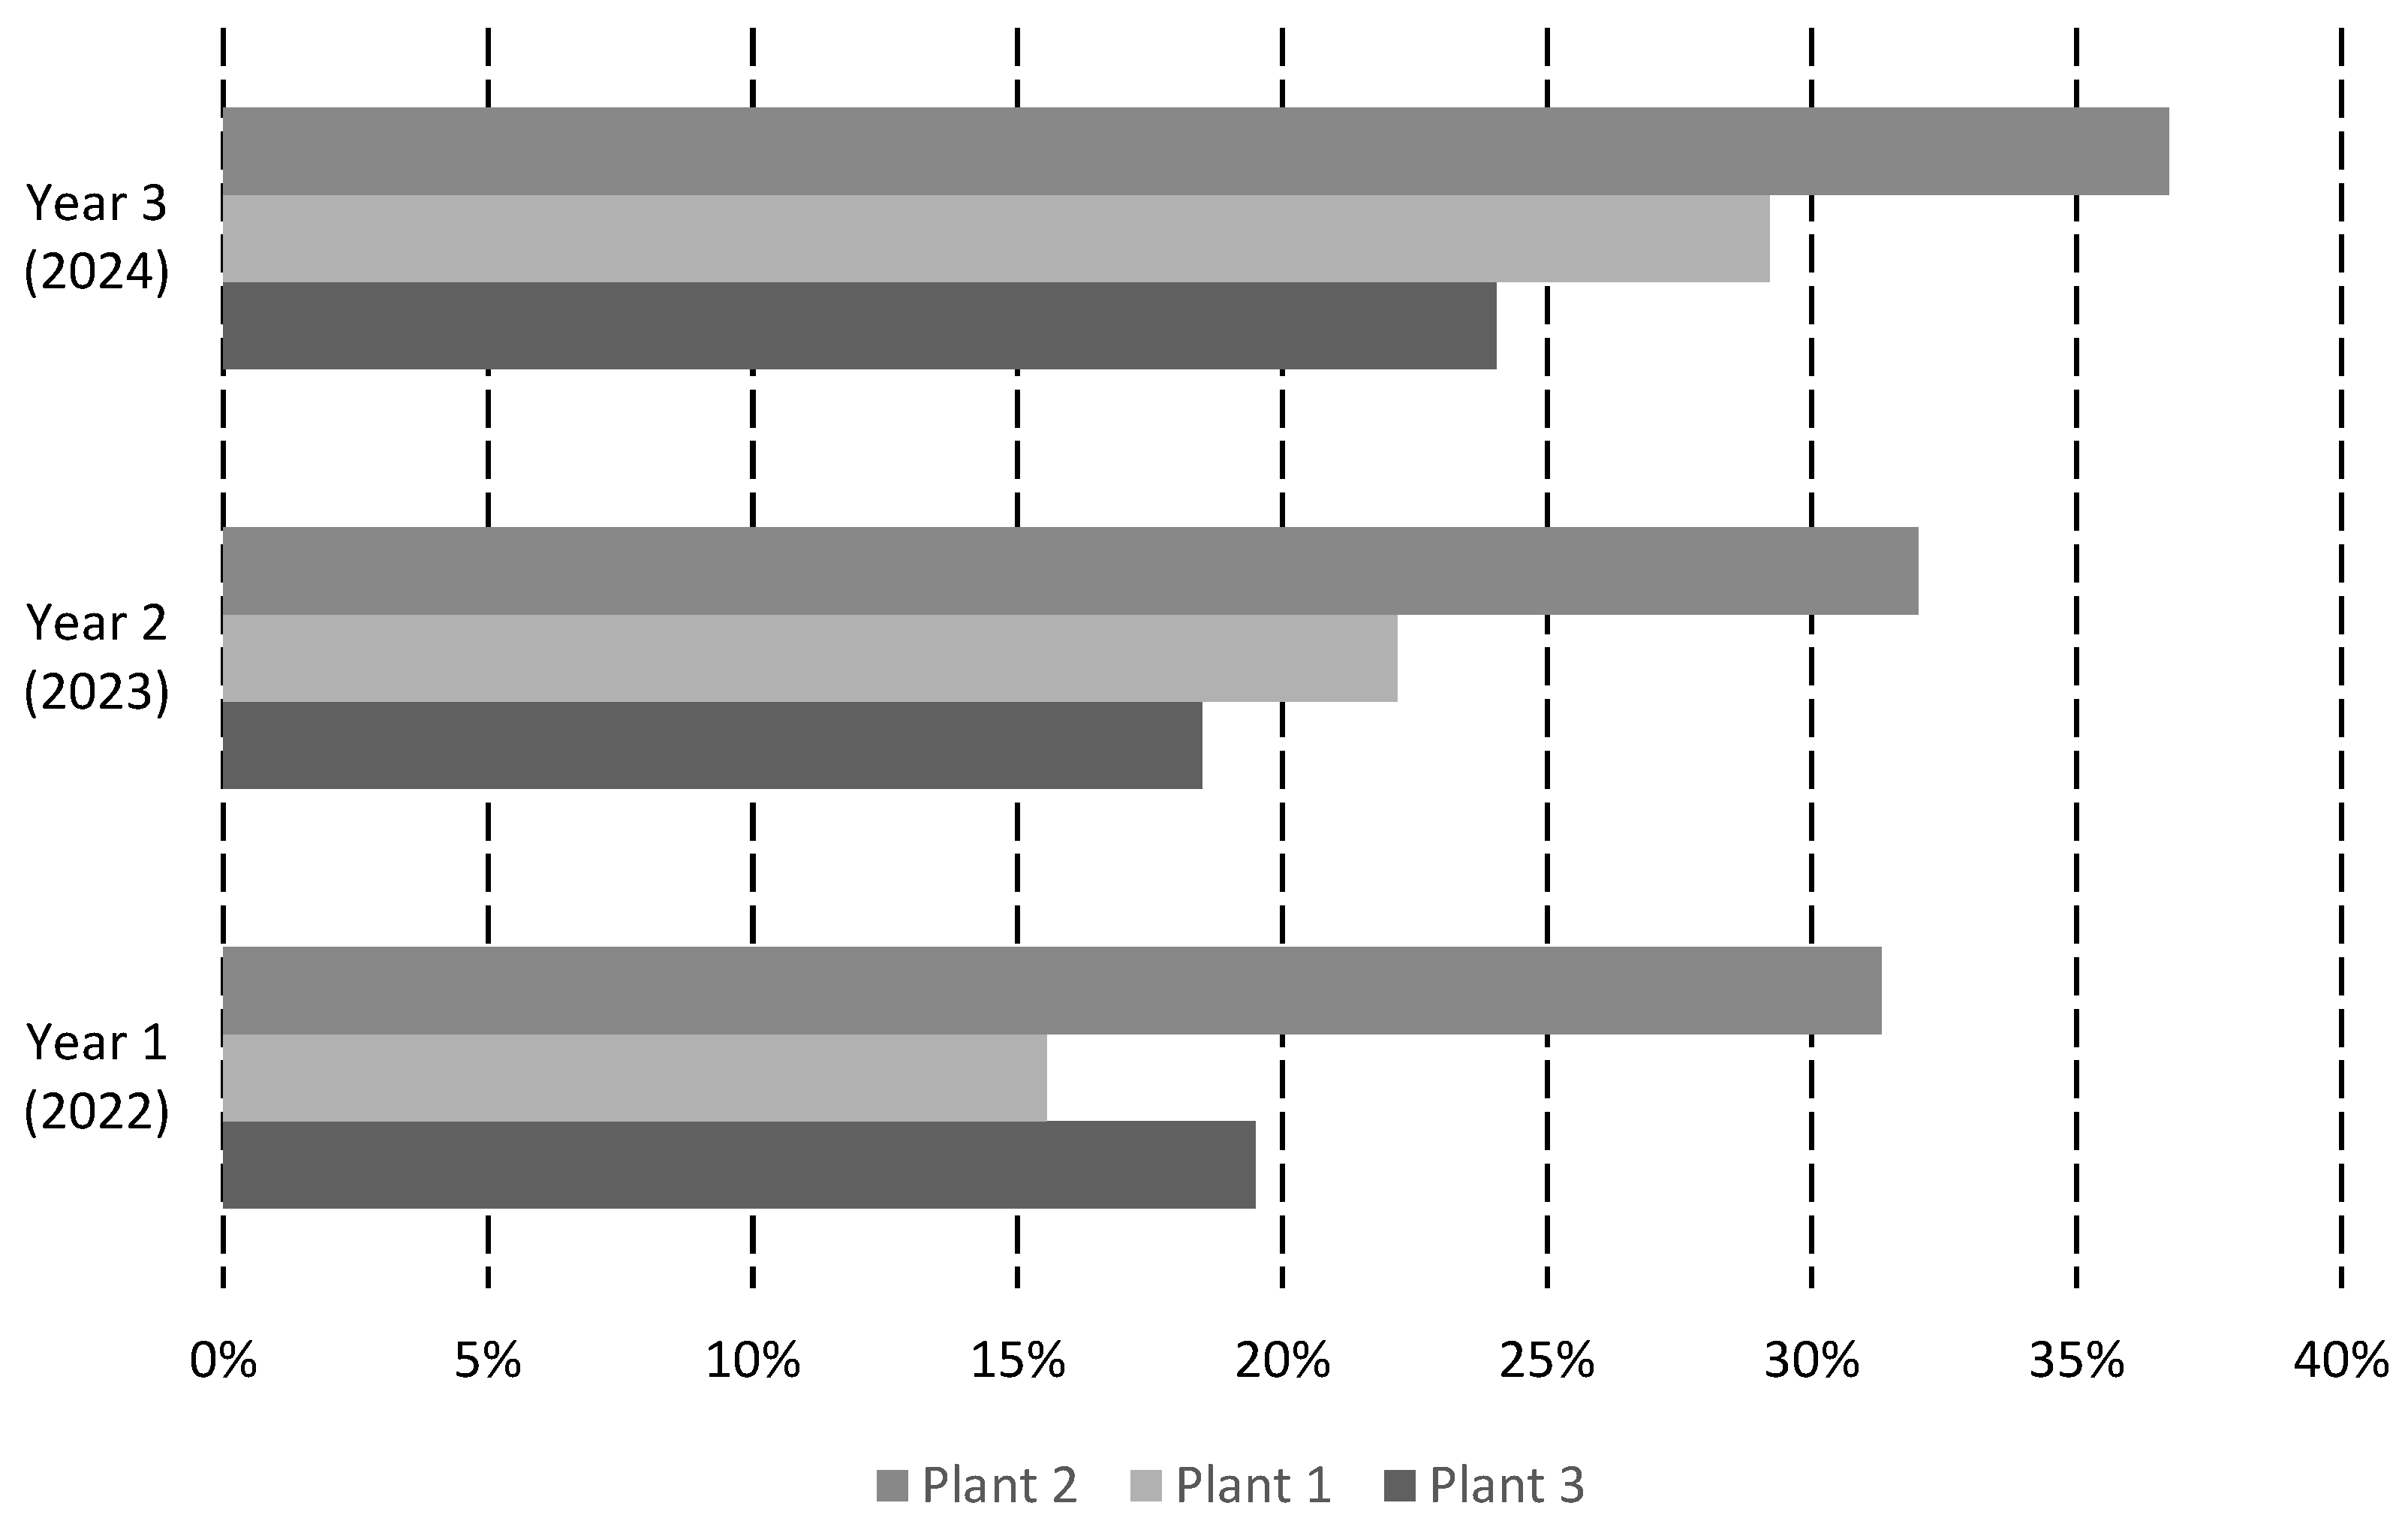
In the analyzed areas, the amount of collected residual waste showed a downward trend, with annual decreases of 3.8–10.3%, while the biowaste stream increased. In the case of Plant 3, a yield increment of about 18% was observed, accompanied by a 9.4% decrement of mixed MSW. In the case of Plant 1, biowaste volumes doubled, whereas residual MSW decreased by 10.2%. Regarding Plant 2, the 13.1% decrease in mixed MSW was followed by a 9.6% increase in the biowaste stream. The observed variations correlate with the biowaste share in the analyzed waste streams collected in the analyzed regions, as shown in
Figure 3.
It can be seen that the share of biowaste increased year-on-year (
Figure 3). In the case of Plant 1, the observed yearly yields ranged from about 15% to about 30%, while Plant 3 achieved yields from about 18% to about 25%. In the Plant 2 region, the changes were observed to be from 31% to 37%. Consequently, it can be concluded that source segregation is yielding the anticipated results, as evidenced by the growing volumes of collected biowaste.
The primary driver behind these changes was the implementation of ss-biowaste collection [
28]. This system relies on a ‘door-to-door’ model for rural and single-family housing, and communal containers for multi-family areas. These structural changes were supported by extensive national and local information campaigns, including educational activities, the impact of which was monitored by the respective waste management companies [
29,
30,
31]. Furthermore, Poland’s economic growth and changing consumption patterns should be noted, and the indicators observed in the EU should be pursued [
32].
Furthermore, the indicators related to ss-biowaste and the residual/mixed solid waste generated and collected were also verified, considering the type of municipality (
Table 1). The highest per capita ss-biowaste generation in rural areas was recorded in the Plant 1 region. However, in urban–rural and urban areas, as well as in total, the highest was in the Plant 2 region. In contrast, the lowest quantities were noted in the Plant 3 region (
Table 1). Regarding mixed-MSW generation, the lowest was observed in the Plant 2 region, which corresponds to the highest generation of biowaste, followed by Plant 3 and Plant 1 regions (
Table 1). According to the statistical analysis Environment 2023 provided by Statistics Poland [
32], variations can be observed among municipalities in the amount of generated waste. The average for Poland was 355 kg per capita in 2022; in 26% of communes, fewer than 200 kg per capita was collected (mainly rural municipalities), while in 60% of municipalities, the amount of waste generated was between 200 and 400 kg per capita. In 2022, 13,420 thousand tons of MSW was generated, with a 1.9% decrease in generation compared to 2021. Thus, Poland’s MSW generation per capita decreased from 360 kg in 2021 to 355 kg in 2022. MSW generation per person in the Voivodeship Wielkopolskie reached about 381 kg, followed by the Voivodeship Lubuskie (398 kg).
Meanwhile, in the Voivodeship of Lower Silesia, it reached 422 kg, the highest in Poland [
32]. This study confirmed this relationship, as higher amounts of biowaste and mixed waste were noticed in the Plant 1 region. For spatial context, Plant 1 operates within the Lower Silesia Voivodeship, which has higher waste generation rates than the region’s average. In contrast, Plants 2 and 3 operate closer to the dynamics of the Wielkopolskie and Lubuskie regions.
It can be seen that the MSW generation varies not only by population but also by consumption standards. In 2022, a substantial distinction existed between the country’s western provinces and eastern regions. The western provinces generated more MSW per capita than the eastern provinces. In 2021, the EU’s average MSW generated per capita reached 527 kg. Countries with high wealth generated the highest amounts (kg per capita): Austria—835, Luxembourg—793, and Denmark—769; alongside countries with a high proportion of tourists, such as Cyprus—633 and Malta—611. Thus, Poland ranks among the lowest among European countries [
33].
Regarding biowaste, in 2022, the amount of source-segregated waste reached 51 kg per capita, compared to 49 kg in 2021. It was observed that in the Plant 3 region, the biowaste collection level was lower (48.1 kg), while in Plant 1, it was much higher (67.5 kg), and in Plant 2, it reached 89.2 kg. However, it should be pointed out that in the urban areas, the situation was slightly different, i.e., in the Plant 3 region it was 73.1 kg per capita, compared to 49.9 kg per capita in the Plant 1 area and 134.6 kg per capita in the Plant 2 area (
Table 1). Generally, in urban Polish regions, 156 kg of waste per capita was separately collected in 2022, and in rural areas it was 121 kg per capita. Still, residual/mixed MSW dominates among the generated waste. In 2022, biowaste accounted for 8.1 million tons (about 60% of all the generated MSW) [
32]. Similar findings emerge from this study. In the Plant 1 region, the residual/mixed MSW share reached 70.6%, 63.6%, and 56.6% in the years analyzed, respectively (
Table 1). Plant 3’s values were 65.4%, 67.3%, and 59.5%, respectively (
Table 1). The situation differs in the Plant 2 region, where the residual/mixed MSW share decreased to 54.4%, 52.9%, and 41.9% in the analyzed years (
Table 1). As quantitatively supported by the data in
Table 2, the implementation of dedicated kitchen waste bins directly correlates with increased biowaste yields; separate ash collection policies may also indirectly contribute to reducing residual MSW mass, though this requires further targeted study.
It can be stated that the amount of segregated waste varies significantly between countries, regions, counties, and municipalities, and depends mainly on how the local authority has organized the collection system for particular types of waste.
To assess the impact of implementing separate kitchen waste collection, municipalities within the Plant 2 service area were evaluated (
Table 2).
Except for Jarocin (urban), the urban–rural municipalities have established kitchen waste source segregation and separate collection. It can be found that, besides Dobrzyca, the amount of biowaste was higher than in Plant 3 and Plant 1 regions (
Table 2). However, only Jarocin and Pleszew surpassed the average value for the area (89.2 kg/person). The share of kitchen waste in the biowaste stream varied from about 26% (Raszków) to about 60% (Dobrzyca).
Besides the amount of waste, a further significant aspect of the MSWMS is its quality. The occurrence of impurities in biowaste might be caused by residents having an insufficient understanding of the sorting collection system’s rules or not correctly implementing the collection process [
33]. Thus, in this study, the biowaste composition was determined and presented in
Table 3.
The biowaste stream still contains various impurities, including both rigid and flexible plastics, glass, stones, and occasionally paper or metals.
Table 3 illustrates the discrepancies in MSW quality among the studied regions. The organic material content in ss-biowaste was approximately 86%, 80%, and 88% for Plants 1, 2, and 3, respectively. Among these, the Plant 1 region had the highest food waste share at around 45%. Notably, in cases where kitchen waste was collected separately (ss-kitchen), the food waste content rose significantly to about 91%. This corresponds to the ss-biowaste composition verification from our previous results [
34].
This difference is primarily attributed to varying local waste segregation policies, such as the inclusion of meat waste in the biowaste stream or the prevalence of communal collection containers. Another contributing factor could be limited public understanding of proper sorting practices, highlighting the ongoing need for public education. In response, waste management companies have implemented free educational programs and site visits, particularly targeting children, although measurable results may take time to emerge.
The main contaminants identified were plastic bags, comprising roughly 5.5% of the biowaste in Plant 1 and Plant 3, and about 4% in Plant 2. In the ss-kitchen stream, paper waste (mainly kitchen towels) was observed at approximately 6%. However, this was permissible under local sorting guidelines due to the paper’s biodegradable nature. Additional impurities, specifically plastics and glass, were present at concentrations of approximately 2% and 0.2%, respectively. (
Table 3). Statistical analysis (ANOVA) confirmed that the variations in the share of food waste and organic matter between the region with separated kitchen waste collection and the other regions were statistically significant (
p < 0.05). This quantitatively validates the direct impact of local segregation policies on the morphological composition of the received waste.
Regarding ms-OFMSW, organic matter content was at the same level in the Plant 1 and Plant 3 regions (about 35.5%) and about 10% lower in the Plant 2 region. However, discrepancies might be found in the volumes of wood, green waste, and food waste. The green waste amount was the highest in the Plant 1 region (16.2%), while wood and food waste contents were the highest in the Plant 3 region (5.5% and 25.8%, respectively). The differences in these proportions may be explained by the areas’ characteristics, e.g., the share of urban and rural municipalities (
Table 2) and the waste collection rules, including the categorization of food waste as biowaste in the case of Plant 1 and Plant 2. The impurities, such as paper, plastics, and inert waste, varied by no more than 1% in the Plant 3 and Plant 1 regions and were lower than in the Plant 2 area (
Table 3). The fine fraction content was similar across the analyzed regions. In the case of Plant 1, a slightly increased amount of glass was observed (7.1% compared to 5.1% and 4.6%).
The presence of 4.0–5.6% plastics highlights the need for robust pretreatment (e.g., shredders and advanced sieves) to prevent microplastic contamination in the final digestate or compost. Furthermore, the explicit link between local sorting rules and these outcomes is evident: municipalities allowing separate kitchen fraction collection with biodegradable paper bags see a natural increase in paper content (about 6%), which is beneficial for the AD carbon-to-nitrogen ratio, whereas communal bin systems without strict enforcement exhibit higher rigid plastic contamination, directly increasing rejection rates at the plant gate.
The observed impurity levels, particularly the approximately 5.5% plastic contamination in the biowaste stream, are consistent with benchmarks reported in recent European studies. According to Okori et al. [
35] physical contaminants, particularly plastics, remain a critical challenge for organic waste processing across the EU, often exceeding 10% in countries such as Spain. Furthermore, research conducted by Dronia et al. [
36] on various housing types indicated that foreign body content in biowaste typically ranges from 7.2% in single-family areas to 16.6% in multi-family housing. Our findings of 5.5% fall within the lower end of this European spectrum, suggesting that while source segregation in the studied Polish municipalities is relatively effective, it still faces the systemic ‘lock-in’ of plastic contamination common in urban collection systems. Aligning these results with EU-wide data suggests that the operational challenges and proposed valorization pathways identified in this study are highly transferable to other European regions transitioning to strict CE mandates.
Compared to leading EU countries where separate biowaste collection frequently exceeds 100 kg per capita [
37], the levels observed in the analyzed Polish regions (48.1 to 89.2 kg per capita) indicate substantial room for improvement, although urban areas in the Plant 2 region are approaching these European benchmarks. Furthermore, the organic purity of the ss-biowaste in this study (80–88%) aligns closely with the lower threshold of European standards, which typically target a purity of >90%. Contamination levels, particularly the 4–5.5% plastic content, remain higher than the stringent standards established in countries like Germany or Austria (often <3%) [
38]. This comparison emphasizes the ongoing necessity for enhanced pretreatment technologies and more aggressive public education campaigns to reach peak European Union standards.
AD can offer greater benefits than composting, primarily due to its energy recovery potential. The inherent heterogeneity and fluctuating composition of MSW, alongside contaminants such as inert materials and plastics, negatively impact AD efficiency. While increasing source segregation rates is critical, the ongoing presence of impurities and their variable levels remain significant technical hurdles. Variation in impurity levels in ss-biowaste can be attributed to different biowaste collection systems. Biowaste may be collected on a drop-off basis in public containers or through door-to-door gatherings. Garden waste may be gathered together with kitchen (food) waste or separated from it, thereby affecting the volume and characteristics of the waste stream.
Besides the collaboration between the treatment company and the inhabitants, which is pivotal in the source segregation of biowaste, some pretreatment processes can be applied to sort contaminants. The simplest and cheapest approach might be hand-cleaning slightly contaminated biowaste. However, it is not very effective. Another solution may be a treatment line with a shredder, a sorting cabinet, a metal separator, or a sieve. The choice of equipment should take into account the type and amount of impurities.
Besides the environmental and social benefits of biowaste segregation at source and separate collection, economic gains should also be mentioned. The AD of ss-biowaste evaluated at Plant 1 achieved a biogas yield of about 110 m
3 per ton, with a methane content of approximately 56%, aligning with findings from other studies [
20,
39]. In the case of Plant 2, it was slightly higher; the biogas yield was about 120 m
3 per ton with a methane content of about 60%. AD demonstrated energy recovery benefits, consuming about 25% of the generated electricity. In comparison, Banks et al. [
39] reported a gross electrical output of 890,074 kWh from CHP units over 426 days. It is important to note that their system operated at a smaller demonstration scale; nevertheless, the parasitic load ratio (roughly 31%) provides a comparable baseline for validating the 25% parasitic assumption (277,422 kWh) used for Plant 1. Based on AD performance at Plant 1 and the waste collected in the analyzed regions, the potential electricity production was calculated and presented in
Table 4.
Based on the exploitation data obtained from AD in Plant 1 and Plant 2, the potential electricity generation from the biowaste stream handled in Plant 3 can range from 3080 to 3600 MWh per year. However, it should be noted that these estimations assume optimal, year-round feedstock utilization and do not account for potential seasonal variability in biowaste yields. The projected potential electricity generation should be interpreted as a sensitivity range. This variation is highly driven by input fluctuations, specifically the biogas yield (110–120 m3/ton), methane fraction (56–60%), and the plant’s own consumption.
It can also confirm the benefits of kitchen waste source segregation, thereby improving the quality and performance of the feedstock for the AD process. The yearly electricity production of over 3000 MWh (
Table 4) can cover the needs of Plant 3, including other facilities (sorting line, composting, etc.). In 2024, gate fees for delivered, segregated-at-source biowaste reached about 62 EUR per ton in Plant 3 and were higher than in Plant 1 (about 57 EUR). However, they were lower than in Plant 2 (about 110 EUR per ton). Considering different localizations and conditions, gate fees for biowaste and residual/mixed MSW were compared to assess the economic efficiency of biowaste source segregation. In the case of Plant 1, the difference was about 80 EUR per ton; for Plant 2, about 64 EUR; and for Plant 3, only about 14 EUR per ton. This can be explained by cost reductions across the whole plant due to electricity generated in AD and consumed in other parts of the plant (composting facility, sorting line, etc.). Specifically, this cost reduction is achieved by internalizing energy demands; utilizing the generated electricity offsets external grid purchases required for energy-intensive operations on the mechanical sorting line and aeration blowers in the composting facility. Biowaste handling also enables the use of the resulting biofertilizers. Cavagnaro [
40] demonstrated the increased effectiveness of essential nutrients in supporting plant development. However, if the biofertilizer fails to meet quality standards, disposal costs of around 25 EUR/ton can increase treatment expenses, as in the case of ms-OFMSW. Conversely, marketable biofertilizers can generate revenue, selling for 5 to 10 EUR/ton. It should be mentioned that these fees do not constitute a complete LCC analysis; they serve as a practical indicator of the direct financial impact on municipalities resulting from the implemented technology.
The assumptions utilized for the electricity yield calculations (
Table 4) are based on the standard operational efficiencies of the implemented CHP units and the stable methane potential characteristic of thermophilic AD technology. When evaluating these economic indicators, it is crucial to qualitatively consider capital and operational expenditures (CAPEX and OPEX). AD facilities (Plants 1 and 2) require significantly higher CAPEX for construction and greater OPEX for specialized maintenance compared to the composting facility (Plant 3). However, these initial and ongoing costs are largely offset by the revenues generated from energy recovery. Furthermore, the noticeably higher gate fee observed in Plant 2 (approximately 110 EUR/ton) compared to Plant 1 is likely driven by the amortization of more recent infrastructure investments and distinct local market dynamics, illustrating that local economic environments strongly influence waste management pricing structures.
AD and biowaste segregation at source offers notable advantages over single composting, including energy recovery, reduced greenhouse gas emissions, cost reduction, and the potential for organic recycling. The obtained biofertilizers can serve as a soil amendment, enhancing nutrient availability and soil structure. Moreover, AD contributes to environmental sustainability by supporting sustainability and reducing greenhouse gas (GHG) emissions. Baldasano et al. [
41] have shown that an integrated MSWMS, including AD, can significantly reduce GHG emissions compared to single-process treatments such as landfilling. For instance, combining sorting, dry AD, and landfilling reduced emissions from 1.97 to 1.42 tons of CO
2eq. per ton of MSW.




 ,
,