Article

Experimental Evaluation of an Energy Generation and Storage System Based on a Concentration Redox Flow Battery Coupled to Solar Power


by
Elier Sandoval-Sánchez
1,
Ziomara De la Cruz-Barragán
1,
David García-Bassoco
2,
Paola Roncagliolo-Barrera
2,
David Morillón
1 and
Edgar Mendoza
1,*
1
Instituto de Ingeniería, Universidad Nacional Autónoma de México, Ciudad Universitaria, Circuito Exterior S/N, Coyoacán, Mexico City 04510, Mexico
2
Facultad de Química, Universidad Nacional Autónoma de México, Ciudad Universitaria, Circuito Exterior S/N, Coyoacán, Mexico City 04510, Mexico
*
Author to whom correspondence should be addressed.
Energies 2026, 19(6), 1532; https://doi.org/10.3390/en19061532
Submission received: 6 February 2026 / Revised: 9 March 2026 / Accepted: 16 March 2026 / Published: 20 March 2026

Abstract

The increasing integration of renewable energy sources, such as solar photovoltaics, requires low-cost, scalable energy storage solutions suitable for decentralized systems. This work experimentally evaluates an iron chloride concentration redox flow battery (FeCl-CFB) coupled to a photovoltaic system. The battery, which employs the Fe2+/Fe3+ redox couple to store energy through a chemical concentration gradient, was electrochemically characterized using different carbon-based electrode materials and operated under solar charging for 25 charge–discharge cycles. A maximum power density of 6.3 W·m−2 was achieved at the cell level, with stable cycling behavior under variable solar irradiance. Coulombic and energy efficiencies remained within ranges of 63–72% and 20–28%, respectively, throughout the cycles. Despite these moderate efficiencies, the system demonstrated a consistent and functional usable capacity. The main limitation identified was a decrease in maximum power after prolonged cycling, attributable to resistance and polarization losses rather than electrolyte instability. These preliminary results characterize the initial performance of the FeCl-CFB under solar-driven conditions, highlighting significant efficiency and stability challenges that must be addressed through further optimization to determine the future potential for decentralized energy storage.

1. Introduction

The growing global energy demand, together with the urgent need to reduce dependence on fossil fuels, has driven the rapid expansion of renewable energy sources such as solar photovoltaics (PV). Solar PV has recently become one of the most cost-effective options for generating electricity worldwide and, in many regions, it represents the lowest-cost generation technology [1,2]. However, the intermittent nature of the solar source poses significant challenges to grid stability and supply reliability [3,4]. Addressing these challenges requires the development of efficient, cost-effective, and scalable energy storage systems [5]. Such systems must store the excess energy generated during periods of high solar availability and release it when generation decreases or demand increases, thereby ensuring a continuous and reliable energy supply [3]. Consequently, there is an increasing necessity to reconsider contemporary energy models by incorporating renewable microgeneration systems with storage technologies that enable efficient and localized energy utilization, particularly to improve energy access in communities with limited connection to conventional electricity grids [6,7,8].
Several energy storage technologies are available, including mechanical systems (e.g., pumped hydro storage), thermal storage, and electrochemical storage (e.g., batteries). In the context of stationary applications associated with distributed generation, electrochemical energy storage is particularly attractive due to its high efficiency, fast response, and ease of integration with existing electrical systems [9,10]. Presently, lithium-ion batteries are the dominant technology in the market owing to their high energy density and technological maturity, and they are widely deployed in electric vehicles and consumer electronics [11,12,13,14]. However, their use in stationary energy storage faces important limitations, including reliance on critical materials, high costs, degradation during cycling, and scalability constraints for long-duration storage [15,16,17,18,19]. These challenges have motivated the development of alternative electrochemical energy storage technologies that offer improved sustainability, reduced dependence on strategic materials, and suitable performance for medium- and large-scale stationary applications [20].
In this context, flow batteries (FBs) have emerged as a promising solution for large-scale and long-duration energy storage [21,22,23]. FBs decouple power and energy, thereby providing superior design flexibility, inherent scalability, and long operational lifetimes [23,24,25]. In these systems, electroactive species are dissolved in liquid electrolytes that circulate through an electrochemical reactor where energy conversion and storage occur. This architecture separates stored energy, which is primarily determined by electrolyte volume and concentration, from system power, which depends on cell and stack design [24,26,27,28,29,30,31,32,33,34,35,36,37]. This modular decoupling of power and energy constitutes one of the key advantages of flow batteries, enabling flexible adaptation to diverse application requirements. As a result, FBs offer advantages in scalability, safety, durability, and design flexibility, making them strong candidates for medium- and large-scale stationary energy storage systems.
Among the different FB configurations, redox flow batteries (RFBs) are the subject of the most extensive research, with chemistries including vanadium and iron/chromium systems [36]. The development of vanadium redox flow batteries was significantly advanced by pioneering work in the 1980s by Maria Skyllas-Kazacos and colleagues [38,39]. Another important category is that of concentration gradient flow batteries (CGFBs), which operate by exploiting concentration differences of ionic species between two electrolytes [40,41,42]. These systems are particularly attractive because of their low-cost potential, as they can employ abundant and environmentally benign materials such as iron chloride [42].
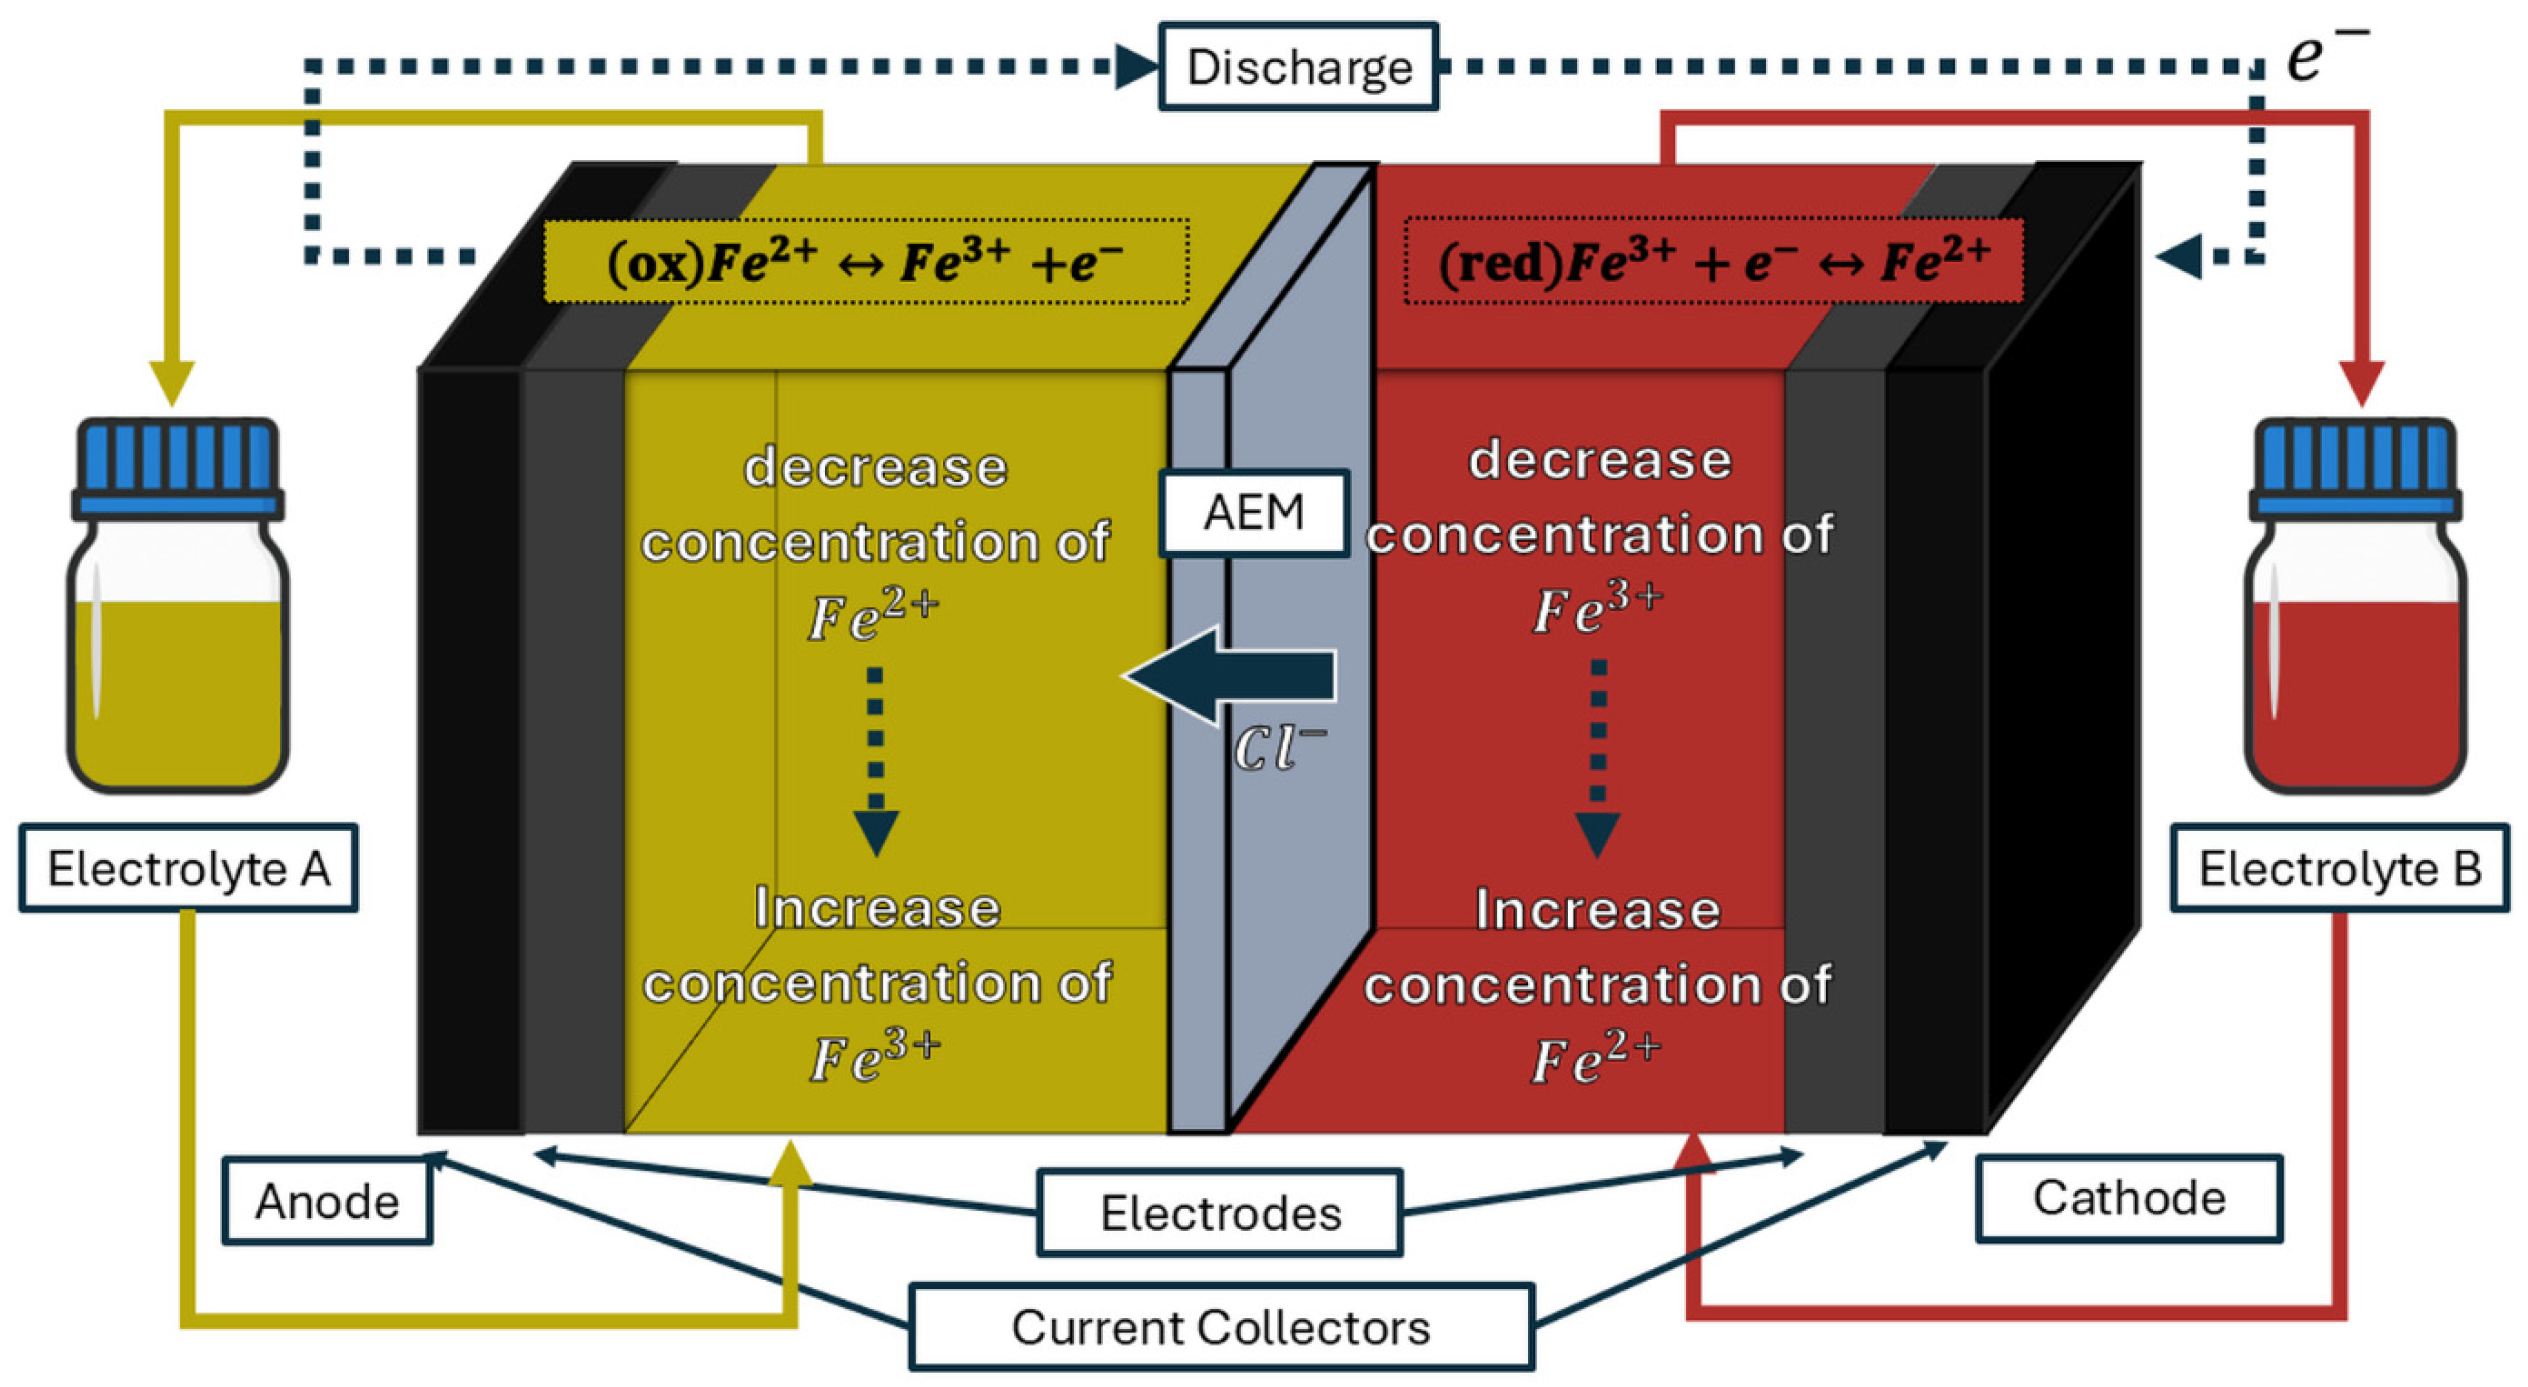
Figure 1 schematically illustrates the operating principle of an iron chloride concentration flow battery (FeCl-CFB). The system is composed of two electrochemical compartments, each containing the same Fe2+/Fe3+ redox couple at a different concentration and separated by an anion exchange membrane (AEM). This concentration difference establishes a chemical potential gradient that drives electrical energy generation. During the discharge process, electrolyte A, initially enriched in Fe2+, acts as the anode, where Fe2+ is oxidized to Fe3+, decreasing the Fe2+ concentration and increasing the Fe3+ concentration. Simultaneously, within compartment B, which initially contains a higher Fe3+ concentration, Fe3+ is reduced to Fe2+ at the cathode. Consequently, the flow of electrons through the external circuit is from the anode to the cathode, thereby generating an electrical current. Charge neutrality is maintained by the migration of chloride ions (Cl) across the AEM from the compartment with a higher chemical potential to that with a lower chemical potential. The electrodes provide the electrochemically active surface for redox reactions, while the current collectors ensure efficient electronic conduction. In this configuration, electrical energy is directly harvested from the concentration gradient of the FeCl2/FeCl3 system without the need for distinct electrolytes or different redox couples in each half-cell.
Despite the growing interest in flow batteries for renewable energy storage and the study of iron-based concentration flow batteries as a prospective low-cost technology [42], there is a clear absence of experimental research evaluating the performance and feasibility of the direct integration of an FeCl-CFB with a photovoltaic system for solar energy generation and storage. Most reported studies focus on redox chemistries, often using integrated photoelectrodes or more complex chemistries to enable coupling with solar energy [43,44,45,46]. The scientific literature has explored the integration of photovoltaic systems with energy storage through various approaches. In the field of energy storage and conversion, significant progress has been made in the development of solar flow batteries, which seek to amalgamate photovoltaic conversion and electrochemical storage into a single device. These systems typically employ redox flow batteries directly coupled to silicon devices or advanced photoelectrodes [43,44,45,47]. For instance, systems combining silicon cells [44] or GaAs photoelectrodes [47] with RFBs have been reported. In the context of iron concentration batteries, the basic concept has been demonstrated, and key cell performance parameters have been investigated [42]. Likewise, studies on concentration gradient flow batteries have analyzed their potential as electrical energy storage systems using abundant salts [41]. However, a knowledge gap remains regarding the experimental evaluation of the practical integration of an FeCl-CFB with a standard solar panel as a charging source, a configuration that could offer a low-cost and easily implementable energy storage solution.
This study has been conducted in order to address the identified gap through the design, construction, and experimental evaluation of an integrated system that combines an FeCl-CFB with a commercial photovoltaic panel. Our approach enables the investigation of the operational performance of this coupled system under real solar charging conditions, thereby providing experimental data on energy conversion efficiency, storage capacity, and cyclic stability of the FeCl-CFB when directly powered by an intermittent solar source. Through this work, we aim to demonstrate the feasibility and potential of iron-based concentration flow batteries as a sustainable and low-cost energy storage solution for solar energy. This will contribute to both the fundamental understanding and the practical advancement of these technologies. The results obtained offer a detailed perspective on the behavior of this integrated system, highlighting its strengths and identifying areas for improvement to guide future optimization efforts in the development of renewable energy storage solutions.

2. Materials and Methods

2.1. Electrolytic Solutions

Two electrolyte solutions (80 mL each) were prepared using FeCl3·6H2O (≥98%, Sigma-Aldrich, Mexico City, Mexico), FeCl2·4H2O (98%, Sigma-Aldrich, Mexico City, Mexico), ACS-grade NaCl (J.T. Baker, Mexico City, Mexico), and deionized water with a conductivity below 1 µS·cm−1. The electrolyte compositions corresponding to the diluted (A) and concentrated (B) solutions are summarized in Table 1. The selected concentrations were based on the work of Bock et al. [42], who evaluated different concentration ratios in iron chloride flow batteries, with the aim of achieving a sufficiently large chemical gradient for battery operation while maintaining the stability of the Fe2+/Fe3+ redox couple. Before starting the experiments, both solutions were prepared and stored in amber bottles to minimize Fe2+ oxidation.

2.2. Theoretical Electrochemical Model

To provide a theoretical framework for the initial electrochemical performance of the cell, the equilibrium potential was estimated from the Nernst equation using the activities of the Fe3+/Fe2+ redox couple in both electrolytes. The theoretical cell potential was determined from Equation (1).
E c e l l , t h = R T F ln a F e 3 + , b a F e 2 + , a a F e 2 + , b a F e 3 + , a ,   ( V )
where R is the universal gas constant, T is the absolute temperature, and F is Faraday’s constant. Subscripts a and b denote the two electrolytes.
To account for the non-ideal permselectivity of the anion-exchange membrane, an effective cell potential was defined as Equation (2).
E c e l l , e f f = α A E M E c e l l , t h   ,   ( V )
where αAEM is the membrane selectivity factor.
The internal cell resistance (Equation (3)) was treated as the sum of the internal resistive contributions of the membrane and both electrolytes.
R c e l l = R m e m + R A + R B ,   ( Ω )
Thus, for an external resistance Rext, the current was calculated using Ohm’s law:
I = E c e l l , e f f R c e l l + R e x t ,   ( A )
The voltages across the external load and the power output were obtained as Equations (5) and (6).
V = I R e x t ,   ( V )
P = I V ,   ( W )

2.3. Electrochemical Characterization of the Electrolyes

The pH and ionic conductivity of both electrolytes were measured using a benchtop pH/mV/conductivity meter (PC 2700, OAKTON Instruments, Mexico City, Mexico) before cycling and after completion of the cycling campaign. The electrochemical stability of the electrolytes was assessed by means of cyclic voltammetry using a PalmSense4 potentiostat/galvanostat and the PSTrace 5.11 software for signal acquisition and processing. The measurements were carried out in a conventional three-electrode configuration, comprising a glassy carbon working electrode, an Ag/AgCl reference electrode, and a platinum wire as the counter electrode. To identify possible variations in the Fe3+/Fe2+ redox couple during battery operation, electrolyte samples were analyzed at three stages of the experiment: freshly prepared solutions, solutions collected after the first charge–discharge cycle, and solutions obtained after the 25th cycle. This comparison enabled the identification of changes in the electrochemical response associated with continuous system operation.

2.4. Membranes

An anion exchange membrane (Fujifilm Type 10, Fujifilm Manufacturing Europe BV, Tilburg, The Netherlands) was used to separate the electrolyte compartments. With a thickness of 125 µm, the membrane exhibits an area resistance of 1.7 Ω·cm2 and a permselectivity of 95%. Its primary function is to selectively allow Cl ion transport from the concentrated to the diluted compartment while limiting crossover of cationic species such as Fe2+ and Fe3+, thereby preserving the concentration gradient. The membrane is stable over a pH range of 1–13 and can operate at temperatures up to 60 °C, conditions compatible with the electrolyte composition and operating environment of the system.

2.5. Electrodes

Two types of porous carbon electrodes were evaluated to compare their performance in the cell, AvCarb G200 carbon felt (Fuel Cell Store, Bryan, TX, USA) and AvCarb MGL370 carbon paper (Fuel Cell Store, Bryan, TX, USA), each with a geometric area of 2.5 × 5 cm2. These materials were selected based on their demonstrated chemical stability in Fe–Cl electrolytes and their favorable electrical conductivity, making them suitable for flow battery applications. Titanium plates coated with iridium and ruthenium (DSA Ti/Ir/Ru; Magneto Special Anodes BV, Schiedam, The Netherlands), also with a geometric area of 2.5 × 5 cm2, were used as current collectors due to their high resistance to corrosion in chloride-containing environments and their low polarization losses during charge–discharge operation.

2.6. Battery Construction and Assembly

The concentration flow cell was designed and fabricated in-house. End plates were manufactured using a Fortus® 450mc (Stratasys Ltd., Mexico City, Mexico) production system by 3D printing acrylonitrile styrene acrylate (ASA) (Stratasys Ltd., Mexico City, Mexico) thermoplastic. Gaskets with a thickness of 1 mm were printed in TPU 95A using an Ultimaker 2 Extended+ (3D Market, Mexico City, Mexico) printer and Ultimaker Cura slicing software V 5.10. Compression plates were machined by computer numerical control (CNC) from Nylamid (Mexico City, Mexico) with a thickness of 17 mm.
The battery was assembled in a unit-cell configuration consisting of two compartments separated by the anion exchange membrane. In each compartment, a carbon electrode was placed in direct contact with its corresponding iridium- and ruthenium-coated titanium current collector (DSA Ti/Ir/Ru). The final assembly was secured using screws tightened to a torque of 4 N·m to ensure mechanical integrity and leak-tight sealing. The overall electrochemical configuration of the system can be expressed as:
DSA(s)/Cfelt(s)/FeCl3, FeCl2, NaCl(aq)/AEM/FeCl3, FeCl2, NaCl(aq)/Cfelt(s)/DSA(s)
Prior to each experiment, leak tests were performed by recirculating deionized water for 10 min to ensure system watertightness under operating conditions.

2.7. Pumping System

Continuous electrolyte recirculation was achieved using generic 12 V peristaltic pumps. Each hydraulic circuit operated at a constant flow rate of 70 mL·min−1, ensuring uniform flow through both cell compartments. Silicone tubing with an internal diameter of 3.2 mm was used for fluid transport. Electrical power was supplied by a rechargeable MF-FA ICB6L-B battery, Mexico City, Mexico which provided a stable 12 V output throughout the experiments, allowing continuous pump operation independent of the electrical grid.

2.8. Solar Energy System

The primary energy supply was provided by a 200 W polycrystalline photovoltaic module with a nominal operating voltage of 16 V. The power generated by the panel was regulated using an adjustable DC–DC buck–boost converter (0.5–30 V, 4 A), configured to deliver the optimal charging voltage required by the flow battery. The same panel–converter assembly was also used to charge the auxiliary MF-FA ICB6L-B battery powering the peristaltic pumps, providing up to 14 h of autonomous operation. This regulation system stabilized the photovoltaic output under variable solar irradiance, ensuring a controlled electrical supply for both battery operation and auxiliary power requirements.

2.9. Instrumentation and Data Acquisition

Electrical parameters during charge and discharge were measured and recorded using a digital multimeter (SDM3055, SIGLENT Technologies, Mexico City, Mexico) operated with EasyDMM software V1.01.01.25, enabling automated acquisition of voltage and current data at a sampling interval of 5 s. Data were exported in CSV format for subsequent analysis. For tests requiring controlled power input, a programmable power supply (SPD3303X, SIGLENT Technologies, Mexico City, Mexico) was used. To characterize the electrical response of the cell, a variable resistor circuit ranging from 0 to 10,000 Ω was employed to apply controlled external loads and record system performance using the same data acquisition setup.

2.10. Experimental Procedure

The experiments began with the assembly of the battery, followed by the recirculation of electrolyte solutions corresponding to an initial state of charge of 99.95%. An external resistance sweep was then performed to identify the resistance that maximized power output. This was subsequently used in all discharge cycles. An initial full discharge–charge cycle was conducted using the programmable power supply to establish a baseline performance reference. The discharge process was carried out for one hour using the selected resistance, followed by charging for one hour at 1 V with a current limit of 1 A; this operating voltage was selected based on analysis of the Fe Pourbaix diagram (Appendix A.1, Figure A1).
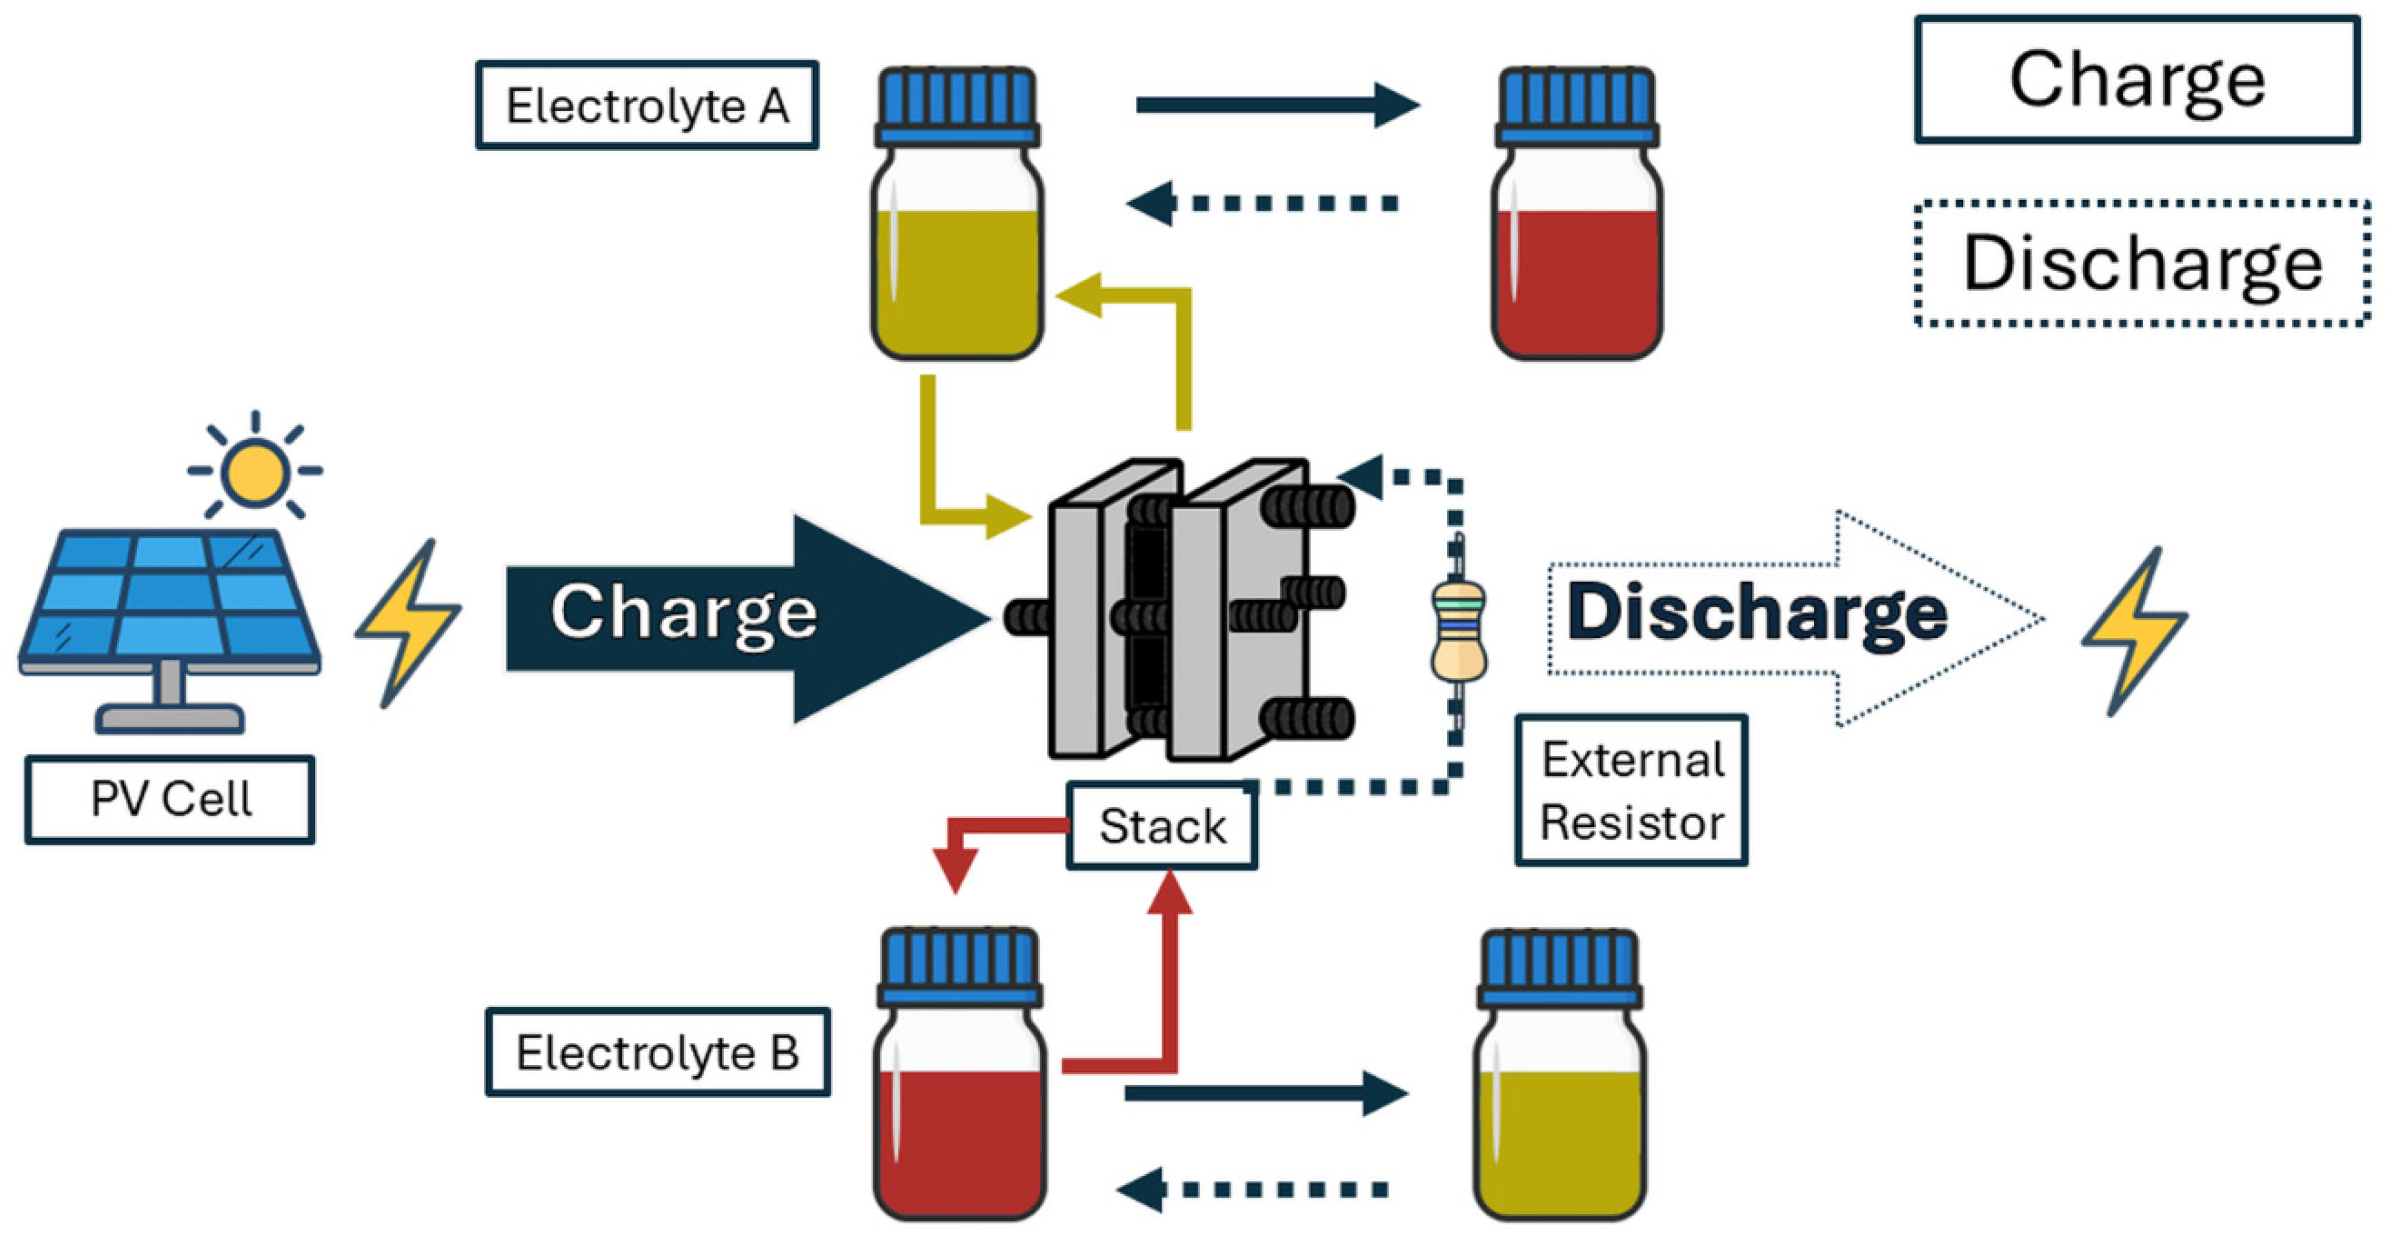
After the reference cycle, the reactor was integrated with the photovoltaic system, as illustrated in Figure 2. Under this configuration, 25 consecutive charge–discharge cycles were performed using solar energy as the sole power source. The number of cycles was selected to provide a short-term integrated-operation dataset under real solar intermittency (25 cycles, ~50 h of cycling time), which is sufficient to move beyond the initial conditioning stage and to evaluate repeatability and early-stage performance evolution within the scope of this proof-of-concept study, without implying long-term durability. Each charge and discharge step lasted 1 h to implement a controlled partial-cycling protocol under PV operation. This duration was selected because the characteristic time for a full charge–discharge excursion of the system is approximately 4 h; therefore, 1 h steps provide a practical time window that enables consecutive cycling while avoiding deep charge/discharge conditions that can increase overpotentials and accelerate degradation. In addition, hour-scale steps facilitate completing multiple cycles within the daily window of useful solar irradiance, improving the comparability of consecutive cycles under naturally varying PV input. The total cycle duration was 2 h. To monitor electrolyte evolution during operation, 3 mL samples were collected from each solution at three stages: immediately after preparation, after completion of the first full cycle, and after the 25th cycle. Finally, after completion of the solar-powered cycles, a final battery characterization was performed to assess performance degradation relative to the initial state.

2.11. Battery Performance Evaluation

To interpret the electrochemical behavior of the system during charging and discharging, several performance parameters were calculated from the current, voltage, and time data measured experimentally. These parameters were then used to quantify current density, transferred charge, power output, and delivered energy, as well as key indicators of battery performance, including state of charge (SOC), coulombic efficiency, energy efficiency, and state of health (SOH). The equations presented below were applied directly to the experimental datasets to obtain comparable metrics across different cycles and operating conditions.
The current density (Equation (7)) was used to express the magnitude of the current passing through the geometric surface area of the electrode where oxidation–reduction reactions occur:
J = I A   ( A / m 2 ) ,
where J represents the current density (A·m−2), I is the total current flowing through the cell (A), and A is the geometric electrode area (m2). Current density provides an indicator of the rate of electrochemical reactions occurring at the electrode–electrolyte interface [48], enabling comparison across different experiments and operating conditions
The transferred charge was calculated to quantify the total electrical charge passing through the cell during each stage of the cycle, as expressed in Equation (8):
Q = I t   ( C ) ,
where Q is the transferred charge in coulombs (C); I is the current measured in amperes (A); and t is the time during which the charge was applied (s). The transferred charge allows evaluation of the electron flow associated with the redox reactions and the charge and discharge capacity of the system under the experimental conditions [49].
The energy associated with each cycle was calculated to quantify the total electrical work supplied or delivered by the cell during the charge or discharge stage, as shown in Equation (9):
E = P t charge / discharge 3600 ( Wh ) ,
where P corresponds to the average power during the analyzed interval and tcharge/discharge is the duration of the charge or discharge stage in seconds. The energy calculation allows comparison of the energy performance of the system across different cycles and evaluation of the consistency of energy conversion throughout operation.
The state of charge (SOC) was determined to express the fraction of usable capacity retained by the battery at a given time, using the experimentally observed voltage extrema as reference values. This parameter was calculated using Equation (10):
S O C = 100 V OCV V m i n V m a x V m i n ( % ) ,
where VOCV is the open-circuit voltage measured at the beginning of each cycle, and Vmin and Vmax correspond to the minimum and maximum voltages defined from cell operation. This indicator allowed comparison of the progression of charge and discharge between cycles, as well as identification of variations in the availability of usable capacity throughout the experiment.
Coulombic efficiency was calculated to evaluate the fraction of charge supplied during the charging stage that can be recovered during discharge. This parameter enables identification of losses associated with parasitic reactions or undesired transport phenomena [50] and is determined using Equation (11):
η Coulombic = 100 Q discharge Q charge ( % ) ,
where Qcharge and Qdischarge represent the charges transferred during the charge and discharge stages, respectively. Coulombic efficiency is used to compare the reversibility of the process between cycles and to evaluate the operational stability of the system.
Energy efficiency was determined to evaluate the fraction of energy recovered during discharge relative to the energy supplied during charging. Its calculation was performed using Equation (12):
η Energetic = 100 E out E in ( % ) ,
where Ein and Eout correspond to the energies recorded during the charge and discharge stages, respectively. This parameter simultaneously accounts for losses due to electrochemical irreversibilities and resistive effects in the system, providing a direct measure of the overall energy conversion performance. In addition, it allows comparison of system performance between cycles and analysis of the consistency of operational efficiency throughout the experiment [49].
The state of health (SOH) was used to evaluate system degradation throughout the experiment by directly comparing the maximum power obtained at the beginning and at the end of the experimental tests [51]. The SOH was calculated using Equation (13):
S O H = 100 P max , final P max , initial ( % ) ,
where Pmax,initial and Pmax,final correspond to the maximum power values measured during the initial and final characterizations, respectively. The SOH allowed quantification of the performance loss of the system and assessment of battery stability under the applied operating conditions.

2.12. Nominal Capacity and C-Rate Definition

To properly define the operating conditions of the FeCl concentration flow battery, the amount of iron that can participate in the redox reaction (∆n) was first evaluated. Using the electrolyte volumes (80 mL per tank) and the Fe2+/Fe3+ concentrations reported in Table 1 (Section 2.1), the molar excess of Fe2+ in tank A relative to tank B is:
Δ n = V ( C F e 2 + , A C F e 2 + ,   B )
Δ n = 0.080 L ( 0.9995   M 0.0005   M )
Δ n = 0.07992   mol
Because the Fe3+/Fe2+ couple involves a one-electron transfer (n = 1), the theoretical charge that can be transferred is obtained from Faraday’s law:
Q n o m = η F Δ n
Q n o m = 96485   C mol × 0.07992   mol   7,711.0812   C
which corresponds to a nominal capacity of:
C n o m = Q n o m 3600 2.14   Ah
During the cycling tests, a constant-current limit of 1 A was applied for 1 h in each charge and discharge step (see the experimental protocol). The C-rate is therefore
C - r a t e = 1 C n o m
C - r a t e = 2.14   Ah
indicating that the cell operated at a medium C-rate (≈½ C). This definition clarifies the operating window used for all subsequent electrochemical characterizations.

3. Results

3.1. Initial System Characterization

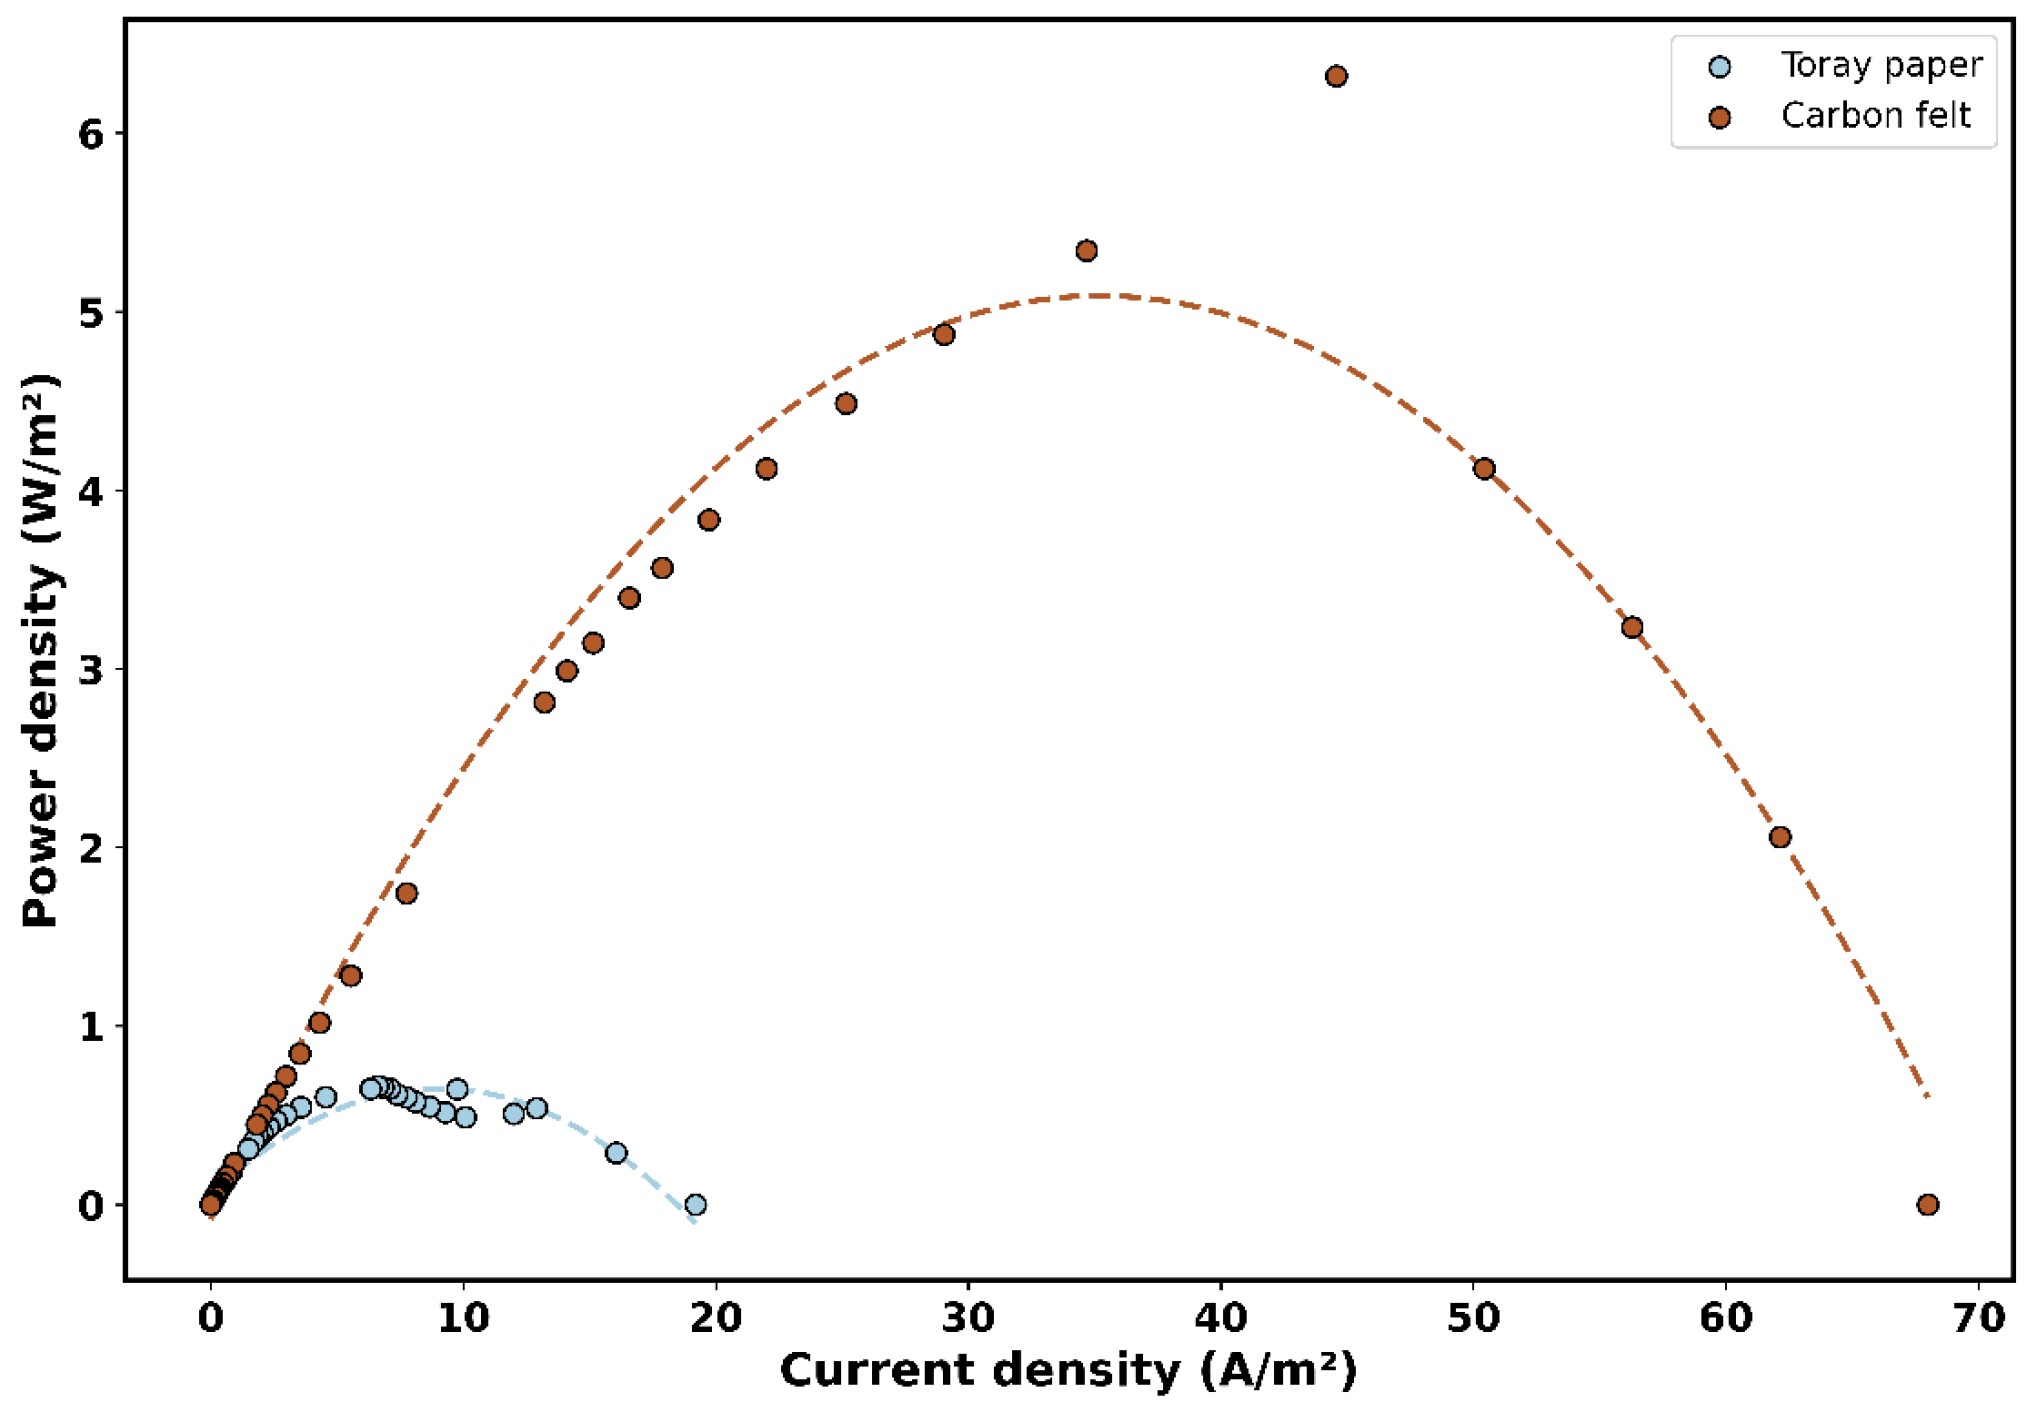
This section presents the results of the experimental evaluation of the concentration of a solar-powered flow battery. As part of the initial analysis, the electrochemical performance of the cell was compared using two electrode materials, carbon felt and Toray carbon paper, to determine which provides a more efficient environment for redox reactions, thereby enhancing energy conversion and utilization. The current density and power density values obtained during the characterization are summarized in Table 2, while the complete polarization and power curves are presented in Appendix A.2, Figure A2. The results show that carbon felt exhibits significantly superior performance compared to Toray carbon paper. This is attributed to its lower internal resistance and more porous three-dimensional structure, which provides optimal electrode–electrolyte contact and greater accessibility to active sites. Consequently, carbon felt allows operation at higher current densities without voltage drops and shifts the maximum power peak towards higher values. In contrast, Toray carbon paper, with a flatter surface and lower roughness, limits both the achievable current and the generated power, exhibiting less favorable behavior under the evaluated conditions. Although carbon felt showed the best experimental performance among the two evaluated electrodes, its response remained below the theoretical limit predicted by the Nernst-based model presented in Section 2.2. In particular, the measured voltage reached 0.27 V, compared with a theoretical value of 0.41 V, while the experimental current density and power density represented 26.2% and 23.6% of the corresponding theoretical values, respectively. This comparison shows that the cell still operates significantly below its ideal electrochemical limit.
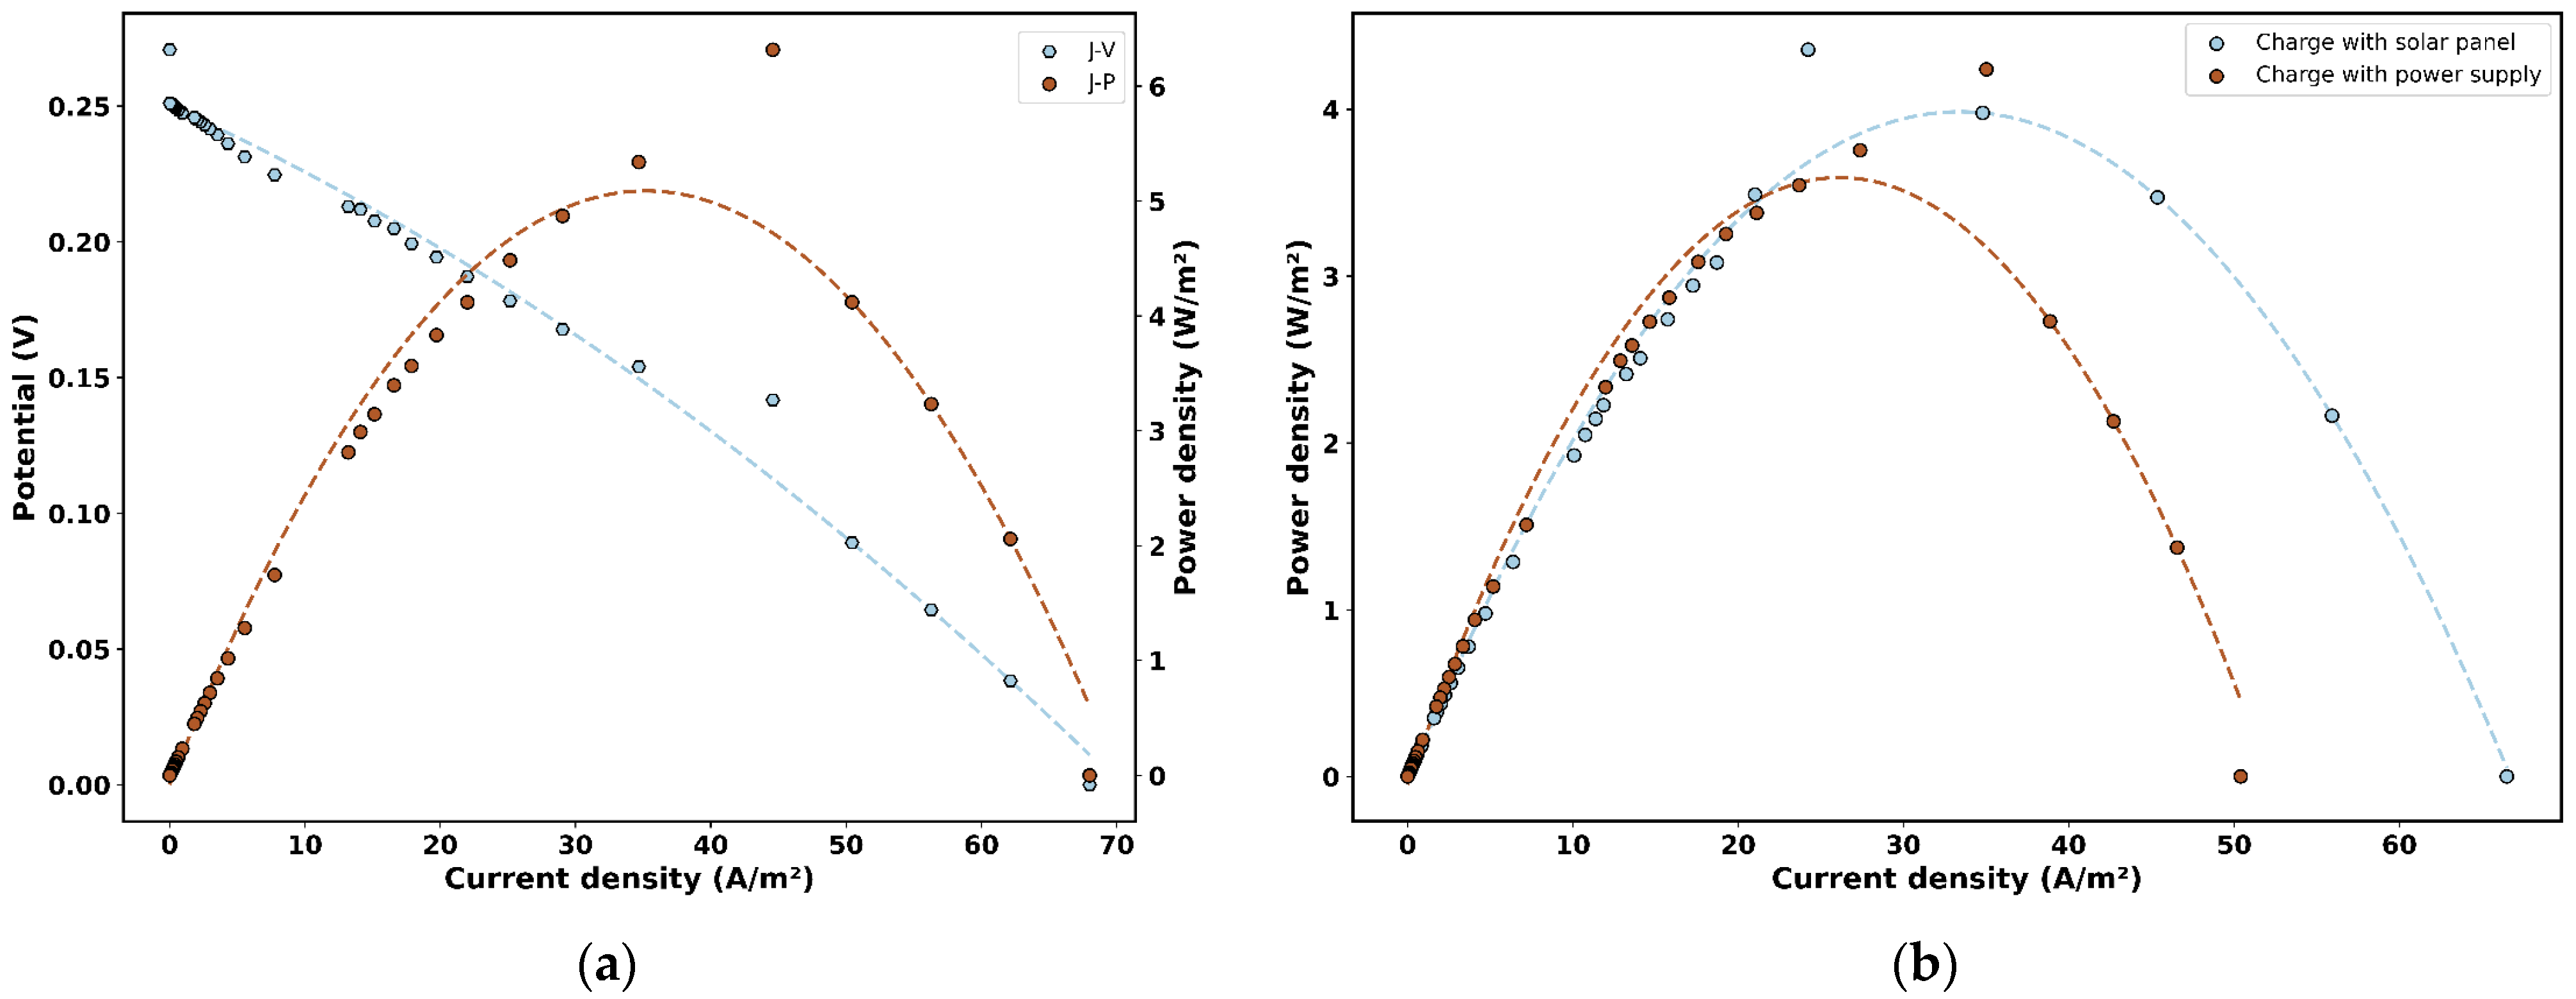
The initial characterization of the cell, performed with the electrolytes at 99.95% state of charge, allowed the establishment of the baseline performance of the system and the determination of the external resistance that maximizes power output. As illustrated in Figure 3a (J–V and J–P curves), the optimal external resistance was determined through an experimental load-sweep procedure using the resistor board described in Section 2.8. The external load was varied stepwise across the operating window, utilizing a progression with finer resolution at low resistances to accurately identify the peak power region. At each resistance setpoint, the system was allowed to stabilize for approximately 30 s before recording the voltage and current. Power was subsequently calculated according to Equation (6) and normalized to the active area to derive the power density. The resistance corresponding to the maximum power density, 2.5 Ω, was identified as the optimal load; this condition ensures maximum power delivery from the cell and establishes a consistent benchmark for evaluating discharge performance and tracking power stability throughout the cycling tests. This criterion follows the maximum power transfer theorem, which states that maximum power is obtained when the load resistance is approximately equal to the internal resistance of the electrochemical system. Consequently, this 2.5 Ω value was adopted for all subsequent discharge experiments to provide a rigorous and reproducible basis for performance comparison under peak power conditions. The battery performance was compared when charging was carried out using a power supply or the photovoltaic panel. The results, presented in Figure 3b, show that both charging modes allow recovery of similar maximum power values. However, the cell charged with solar energy exhibited slightly higher current densities. This effect is attributed to the fluctuating nature of the solar energy supply: at various moments during the charging cycle, the panel provided brief increases in voltage and current that the power supply, operating under stricter limits, could not replicate. These transient peaks favored a slight overcharging of the electrolyte during certain intervals, temporarily increasing the availability of active species and resulting in higher recovered current. This suggests that the photovoltaic system can induce a slightly more favorable electrochemical state for the discharge stage, while achieving maximum power values comparable to those obtained with the power supply.

3.2. Charge–Discharge Cycles

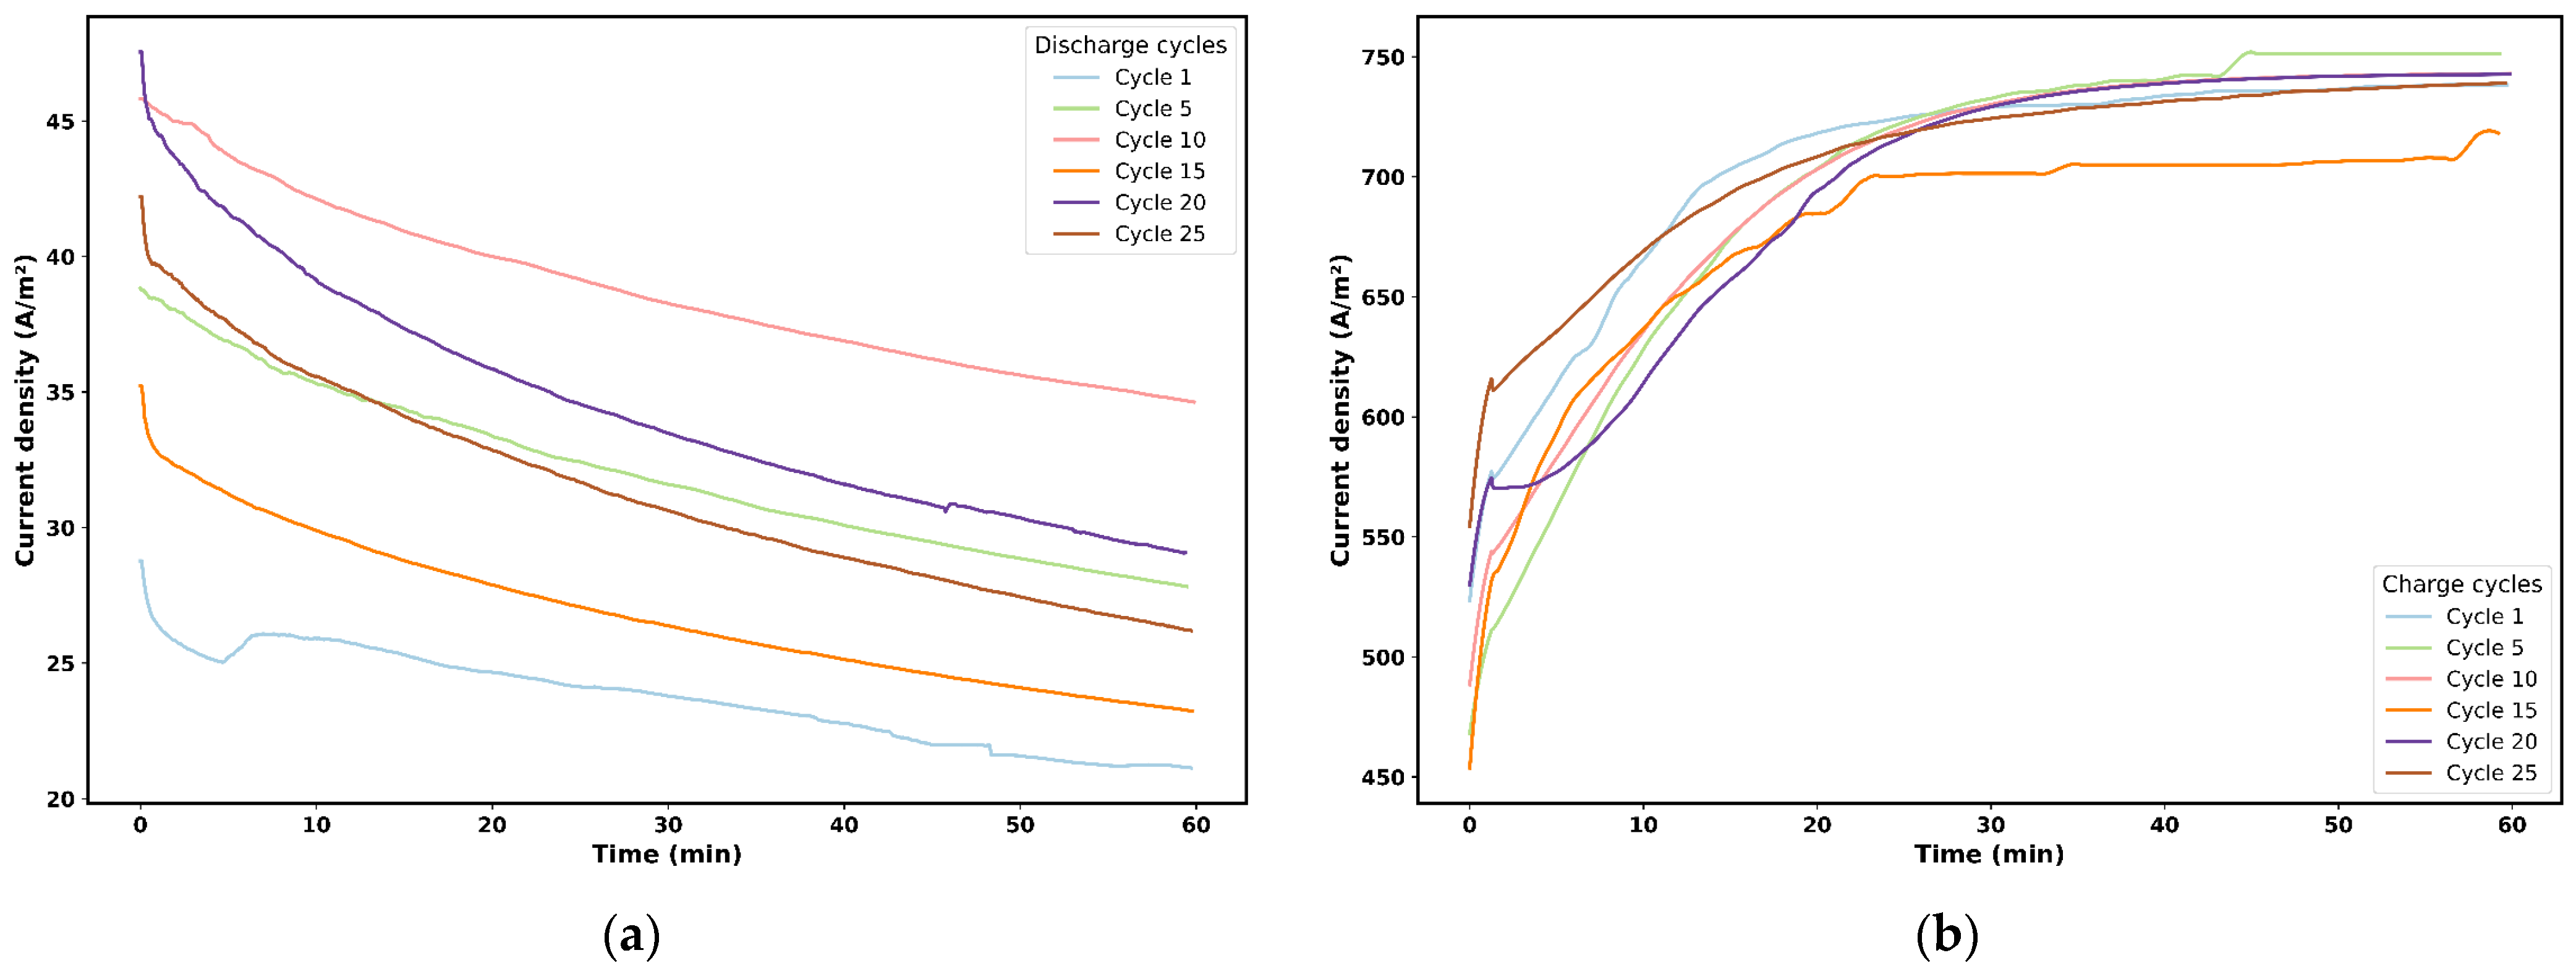
A total of 25 charge–discharge cycles were conducted and statistically analyzed to evaluate measurement repeatability and possible trends during cycling; the corresponding methodology and summary of results are presented in Appendix A.5. Figure 4a,b illustrate battery performance over 25 cycles operated under solar energy. Figure 4a shows the current density profiles during the discharge stage, while Figure 4b presents those recorded during charge. In the discharge curves (Figure 4a), a consistent pattern is observed: in each cycle, the current density starts at a high value and progressively decreases over the 60 min discharge period. Across cycles, the initial current density increases from Cycle 1 (approximately 29 A·m−2) to a maximum around Cycle 10 (close to 46 A·m−2). Although a decrease is observed in Cycle 15, subsequent cycles, such as Cycle 20, again exhibit high initial current densities comparable to those of Cycle 10. Toward the end of discharge, advanced cycles (particularly Cycles 10 and 20) maintain higher current densities than Cycle 1. This behavior suggests a progressive improvement in discharge capability as cycling proceeds, indicating that the electrolyte and electrodes reach a more stable operating state. Such stabilization is reflected in a reduction in the initial resistive drop and more uniform energy extraction over time.
In contrast, Figure 4b shows the current density behavior during charge. In each cycle, the current progressively increases from its initial value until reaching a quasi-steady-state regime at the end of the one-hour charging period. Across the sequence of cycles, it is observed that from Cycle 10 onward, the curves exhibit slightly higher maximum currents and more consistent behavior. This improvement suggests enhanced accessibility of the Fe3+/Fe2+ redox couple and a gradual reduction in charge-transfer barriers at the electrode–electrolyte interface. The progressive stabilization of the charging profiles is consistent with a system that becomes more stable with increasing cycle numbers, as internal electrolyte conditions become more homogeneous, promoting more predictable and reproducible behavior. Overall, these results indicate that the battery maintains its functional capacity over the 25 evaluated cycles and that continuous operation under solar energy contributes to stabilizing the electrochemical response of the system.

3.3. State of Charge (SOC) Analysis

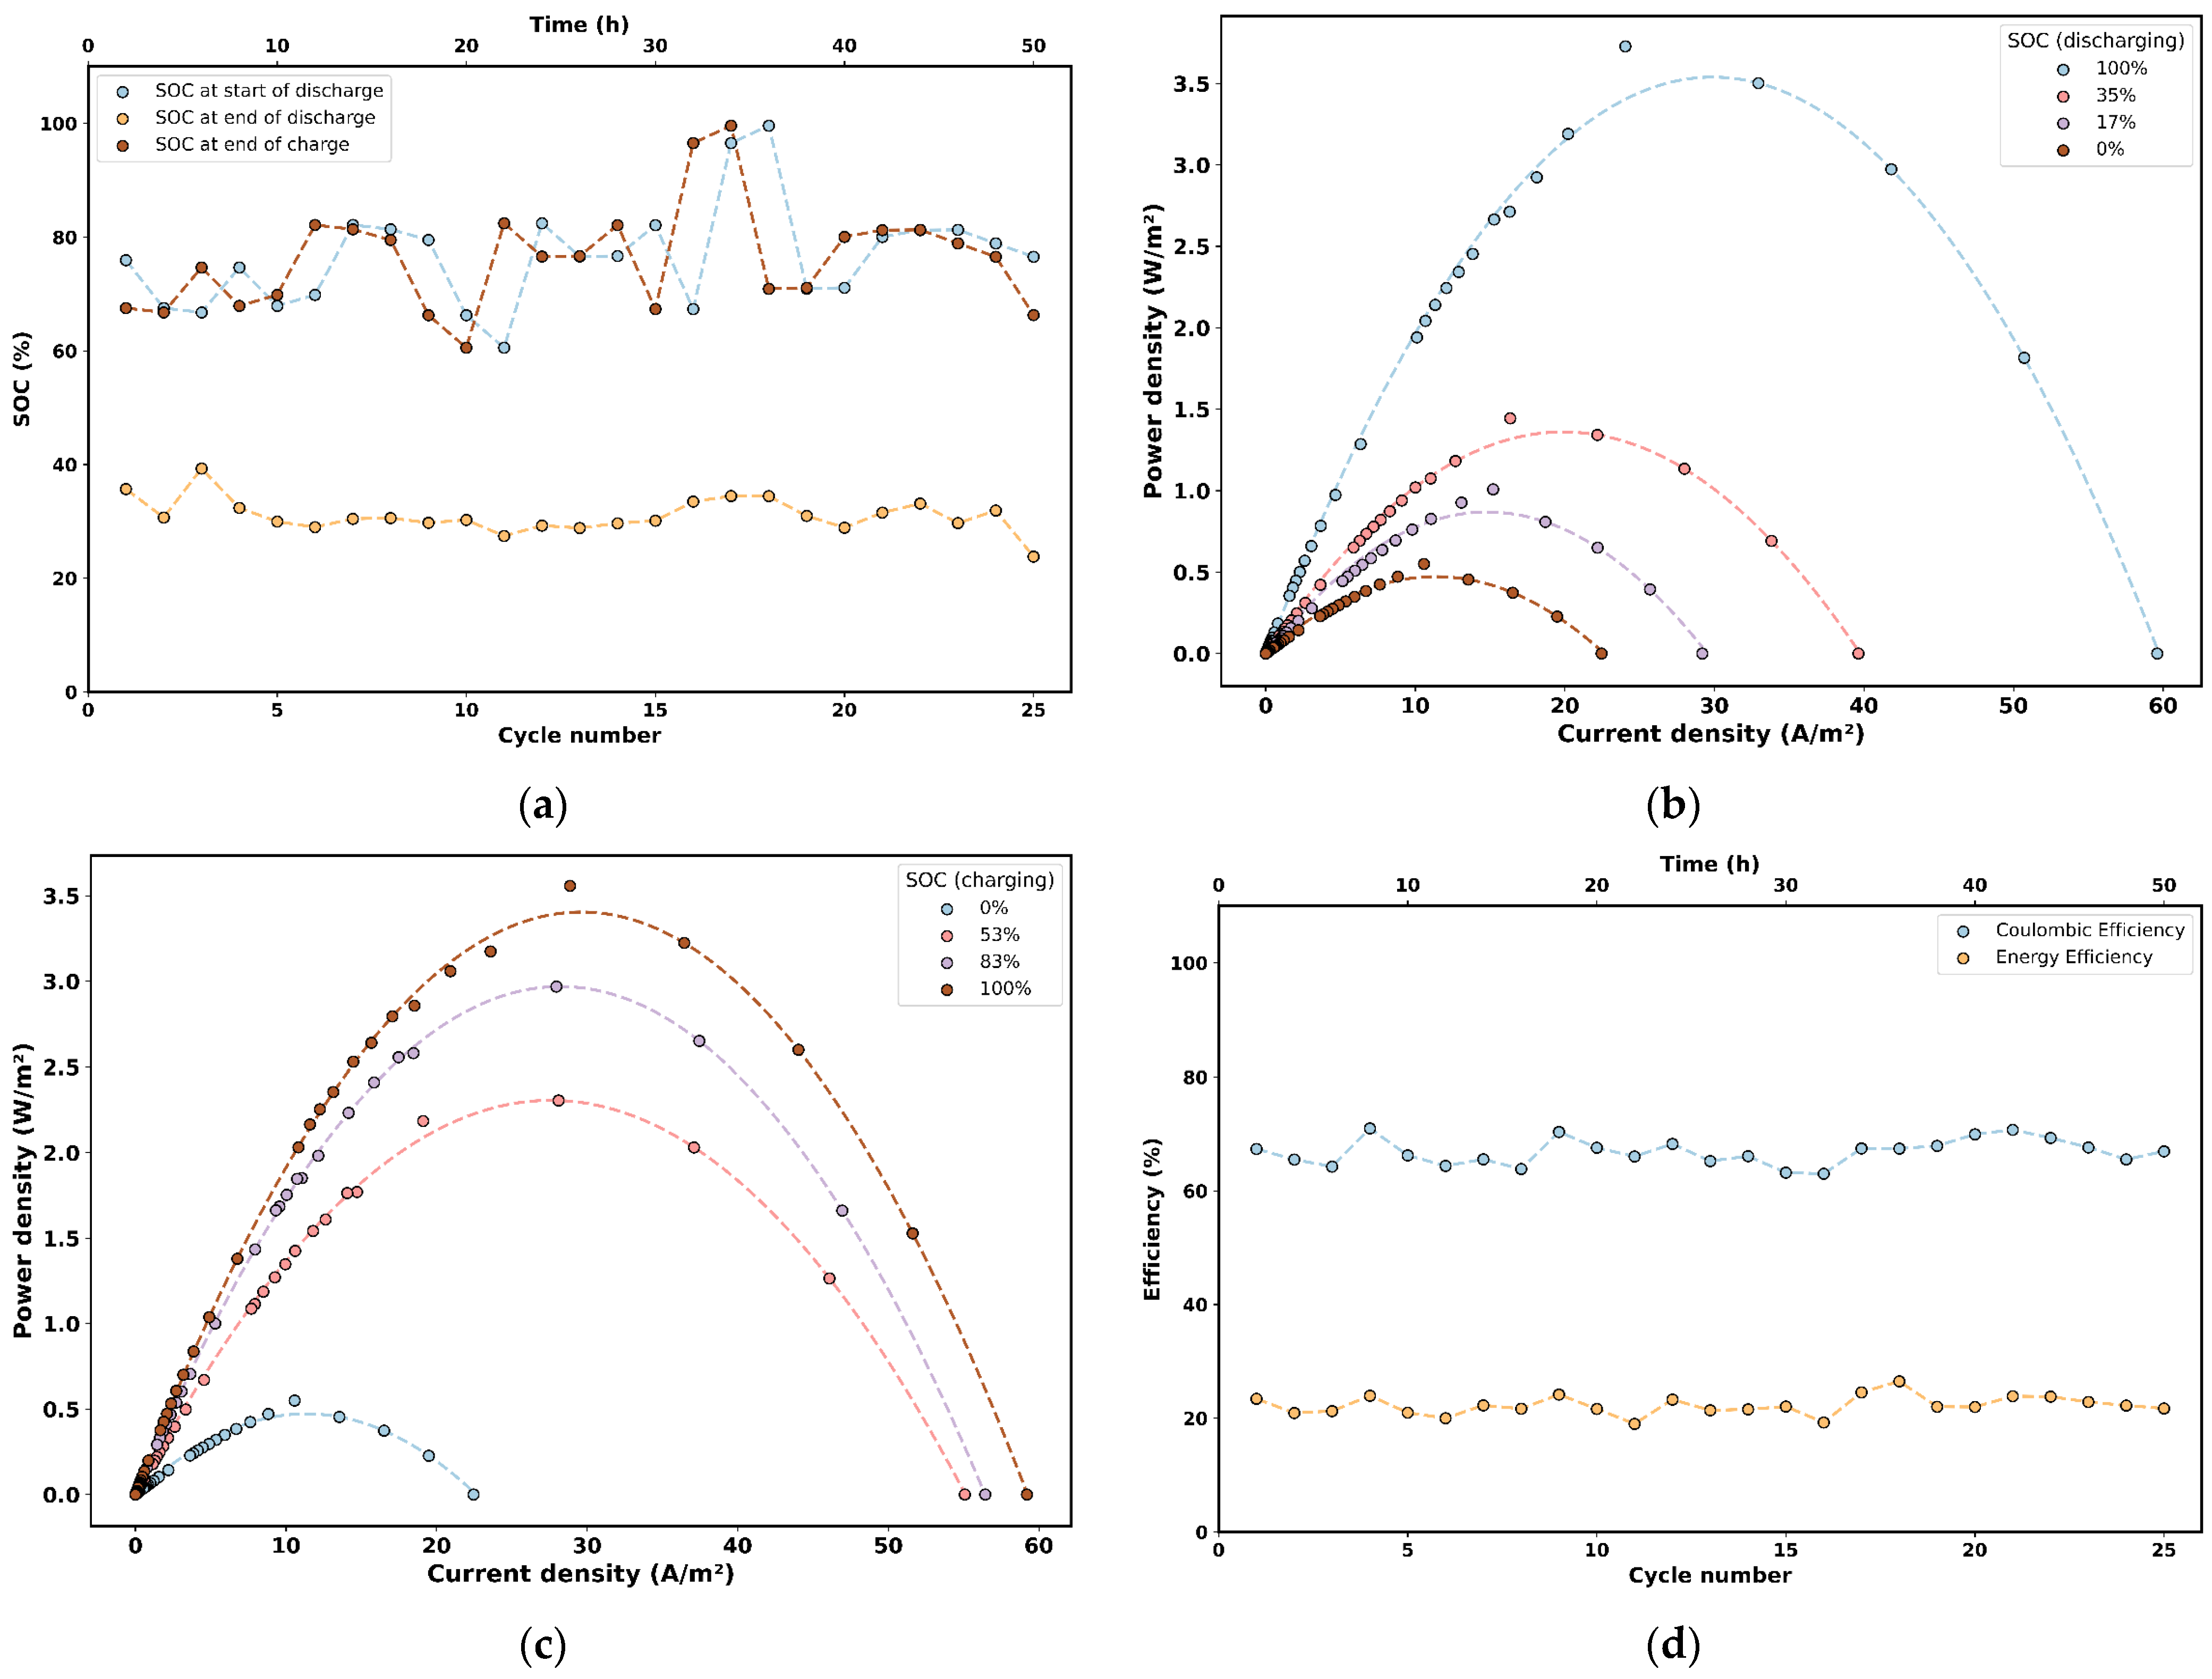
Figure 5a shows the evolution of the state of charge (SOC) over the 25 cycles operated under solar energy. The figure presents SOC values recorded at the beginning of discharge, at the end of discharge, and at the end of each charging stage. The SOC at the end of discharge (orange curve) remains within a relatively stable range, predominantly between 28% and 38% across the 25 cycles, indicating a consistent amount of extracted energy. In contrast, the SOC at the beginning of discharge (light blue) and at the end of charge (brown) exhibit a strong correlation and more pronounced variability. Although these values typically remain between 65% and 85%, notable peaks are observed, such as between Cycles 4 and 5 (around 82%) and, more prominently, between Cycles 15 and 17, where the SOC approaches 100%. These variations in maximum charge levels reflect fluctuations in solar irradiance, which directly affects the energy available for charging in each cycle. Despite these fluctuations, the system shows consistent short-term operating behavior under real solar intermittency, as evidenced by the relatively stable separation between the SOC curves at the beginning and end of discharge. The 25-cycle dataset provides a preliminary indication of operational reproducibility and usable-capacity consistency within the evaluated time window. Longer cycling campaigns (>1000 cycles) remain necessary to quantify lifetime-relevant durability and to support conclusions for long-term stationary operation.
The influence of SOC on electrochemical performance is summarized in Figure 5b,c, which present power density as a function of current density during discharge and charge, respectively, for different SOC levels. In Figure 5b (discharge), both current density and power density decrease progressively as the initial SOC decreases. When discharge begins at high SOC (~100%), the curve exhibits a higher maximum power and shifts toward higher current densities. As SOC decreases (35%, 17%, and 0%), the curves become compressed, and the maximum power point is substantially reduced. This behavior reflects the lower availability of active redox species and a relative increase in resistive losses when the electrolyte is in a more discharged state.
Figure 5c (charging) shows the opposite trend: both power density and current density increase systematically as the final SOC rises. At high SOC levels (83% and 100%), the curves exhibit a stronger response and higher maximum power points, whereas at low SOC values (0% and 53%), the recovered power is considerably lower. This trend confirms that the kinetics of the Fe3+/Fe2+ redox couple and the efficiency of charge-transfer processes improve as the electrolyte approaches its charged state, since higher concentrations of oxidized and reduced species promote more effective ionic transport and reduce reaction overpotential. Overall, Figure 5b,c demonstrate that SOC is a determining parameter of the instantaneous performance of the cell, governing both energy extraction during discharge and energy storage during charging. However, since the SOC values were derived from OCV measurements, which can be influenced by internal resistance and polarization effects, the reported SOC should be understood as an approximate yet meaningful indicator of the relative electrochemical state of the cell during cycling.

3.4. Coulombic and Energy Efficiencies

Figure 5d illustrates the coulombic and energy efficiency values over the 25 charge–discharge cycles. Coulombic efficiency (blue curve) remains predominantly within the range of 63–72% throughout the experiment. Although some fluctuations are observed, with peaks close to 72% in Cycles 4 and 10 and slight decreases at other points, its overall behavior is stable, with no clear trend of degradation or improvement. This indicates relatively consistent charge recovery, although losses associated with secondary reactions or crossover phenomena are non-negligible.
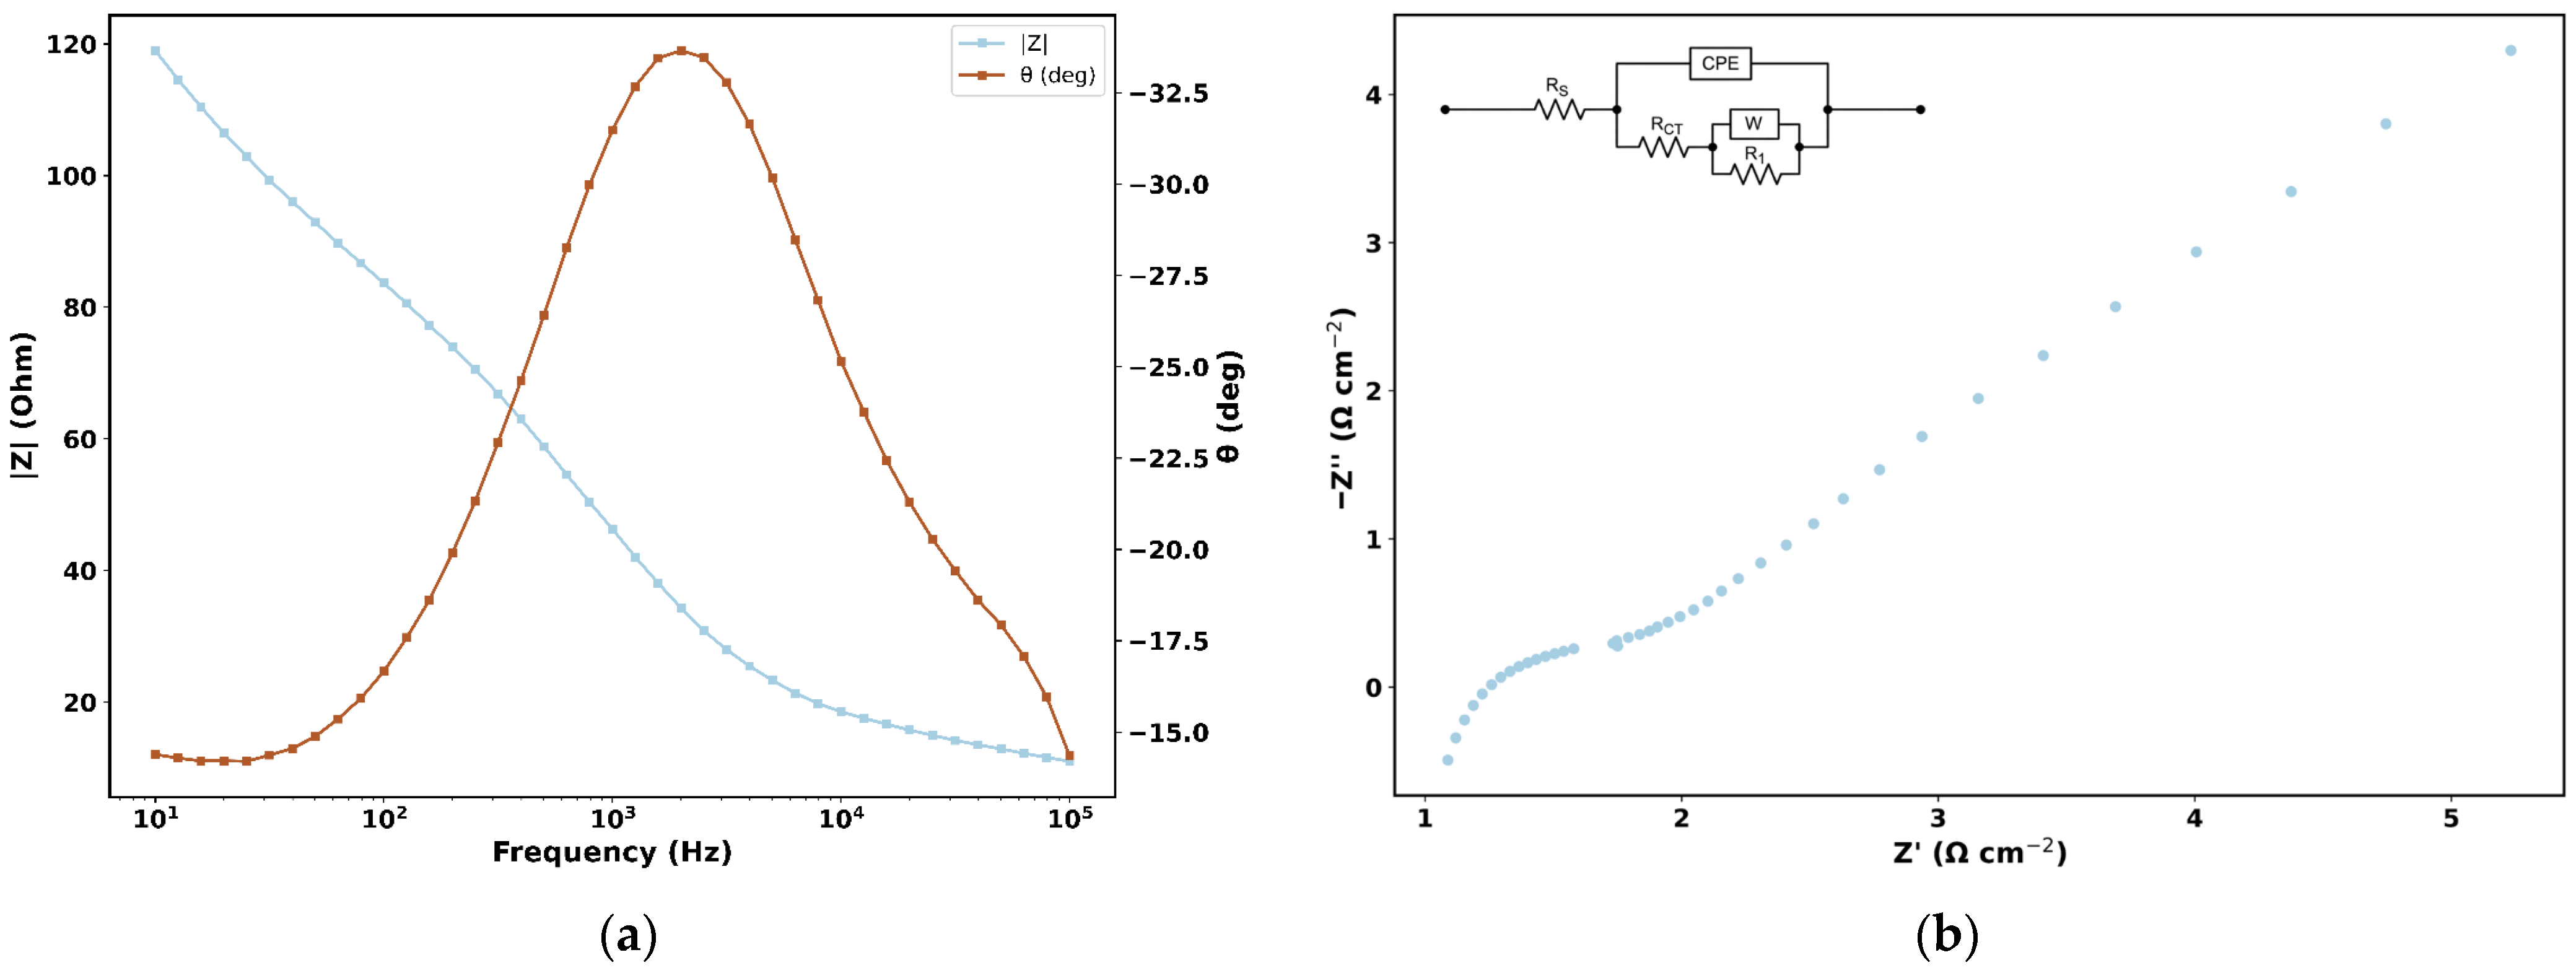
In contrast, energy efficiency (orange curve) has a narrow range of approximately 20–28%. To further investigate the mechanistic origins of this low efficiency, an Electrochemical Impedance Spectroscopy analysis was performed, with comprehensive study and equivalent circuit modeling provided in the Appendix A.3. The resulting impedance spectra are adequately described by a circuit composed of ohmic, charge-transfer, and diffusion-related elements, which is consistent with the expected electrochemical response of the porous-electrode configuration used in this concentration flow cell. This diagnostic approach allows for a precise decomposition of internal resistance into its fundamental components, providing a clearer understanding of the physical and chemical nature of the system’s operational limits beyond simple empirical observations.
The quantitative analysis of the equivalent circuit fitting reveals that the ohmic resistance (RS) is approximately 9.518 Ohms, representing the cumulative contribution of the ion-exchange membrane, electrolyte conductivity, and electrical contacts. However, the most significant bottleneck for the system’s performance is the charge-transfer resistance (RCT), which reaches 101.959 Ohms. This high value indicates that the kinetics of the redox reaction on the carbon electrode surface is the primary factor limiting the system’s voltage efficiency. Additionally, a secondary resistance (R) of approximately 104.923 Ohms was identified, which, together with the charge-transfer hurdles, explains the substantial overpotentials that reduce the overall energy efficiency. Furthermore, the presence of a Warburg-like element and the characteristic 45° slope observed in the low-frequency region of the Nyquist plot confirm that the battery’s operation is also significantly constrained by mass transport limitations and system hydrodynamics. Ultimately, this impedance study clarifies that the low energy efficiency is an intrinsic property of the cell’s physical architecture and the slow kinetics of the redox couple rather than a sign of chemical instability. The excellent fit of the equivalent circuit (x2 = 0.058) and the absence of anomalous time constants or additional dominant features in the spectra confirm that the electrolyte remained electrochemically operative throughout the cycling. These results demonstrate that the substantial overpotentials, and thus the reduced energy efficiency, are primarily driven by the cumulative impact of the charge-transfer resistance and the contact-related resistance (R ≈ 104 Ω). Therefore, while the system exhibits a stable electrochemical ‘fingerprint’, its current design is resistive and transport-limited.
In summary, the comprehensive impedance characterization reveals that the system’s low energy efficiency is a direct consequence of well-defined resistance and polarization phenomena intrinsic to its current state. The analysis definitively identifies the impact of charge-transfer resistance and internal contact impedances as the primary factors responsible for the voltage losses observed during cycling. By decomposing these losses through equivalent circuit modeling, it is evident that the battery’s energetic performance is dictated by the current electrochemical environment, where ohmic and kinetic overpotentials prevent the translation of the coulombic efficiency into a comparable energy output. Consequently, the performance metrics reported in this section represent the baseline operational limits of the iron-chloride concentration flow cell under the established concentration gradients and physical architecture.

3.5. State of Health (SOH)

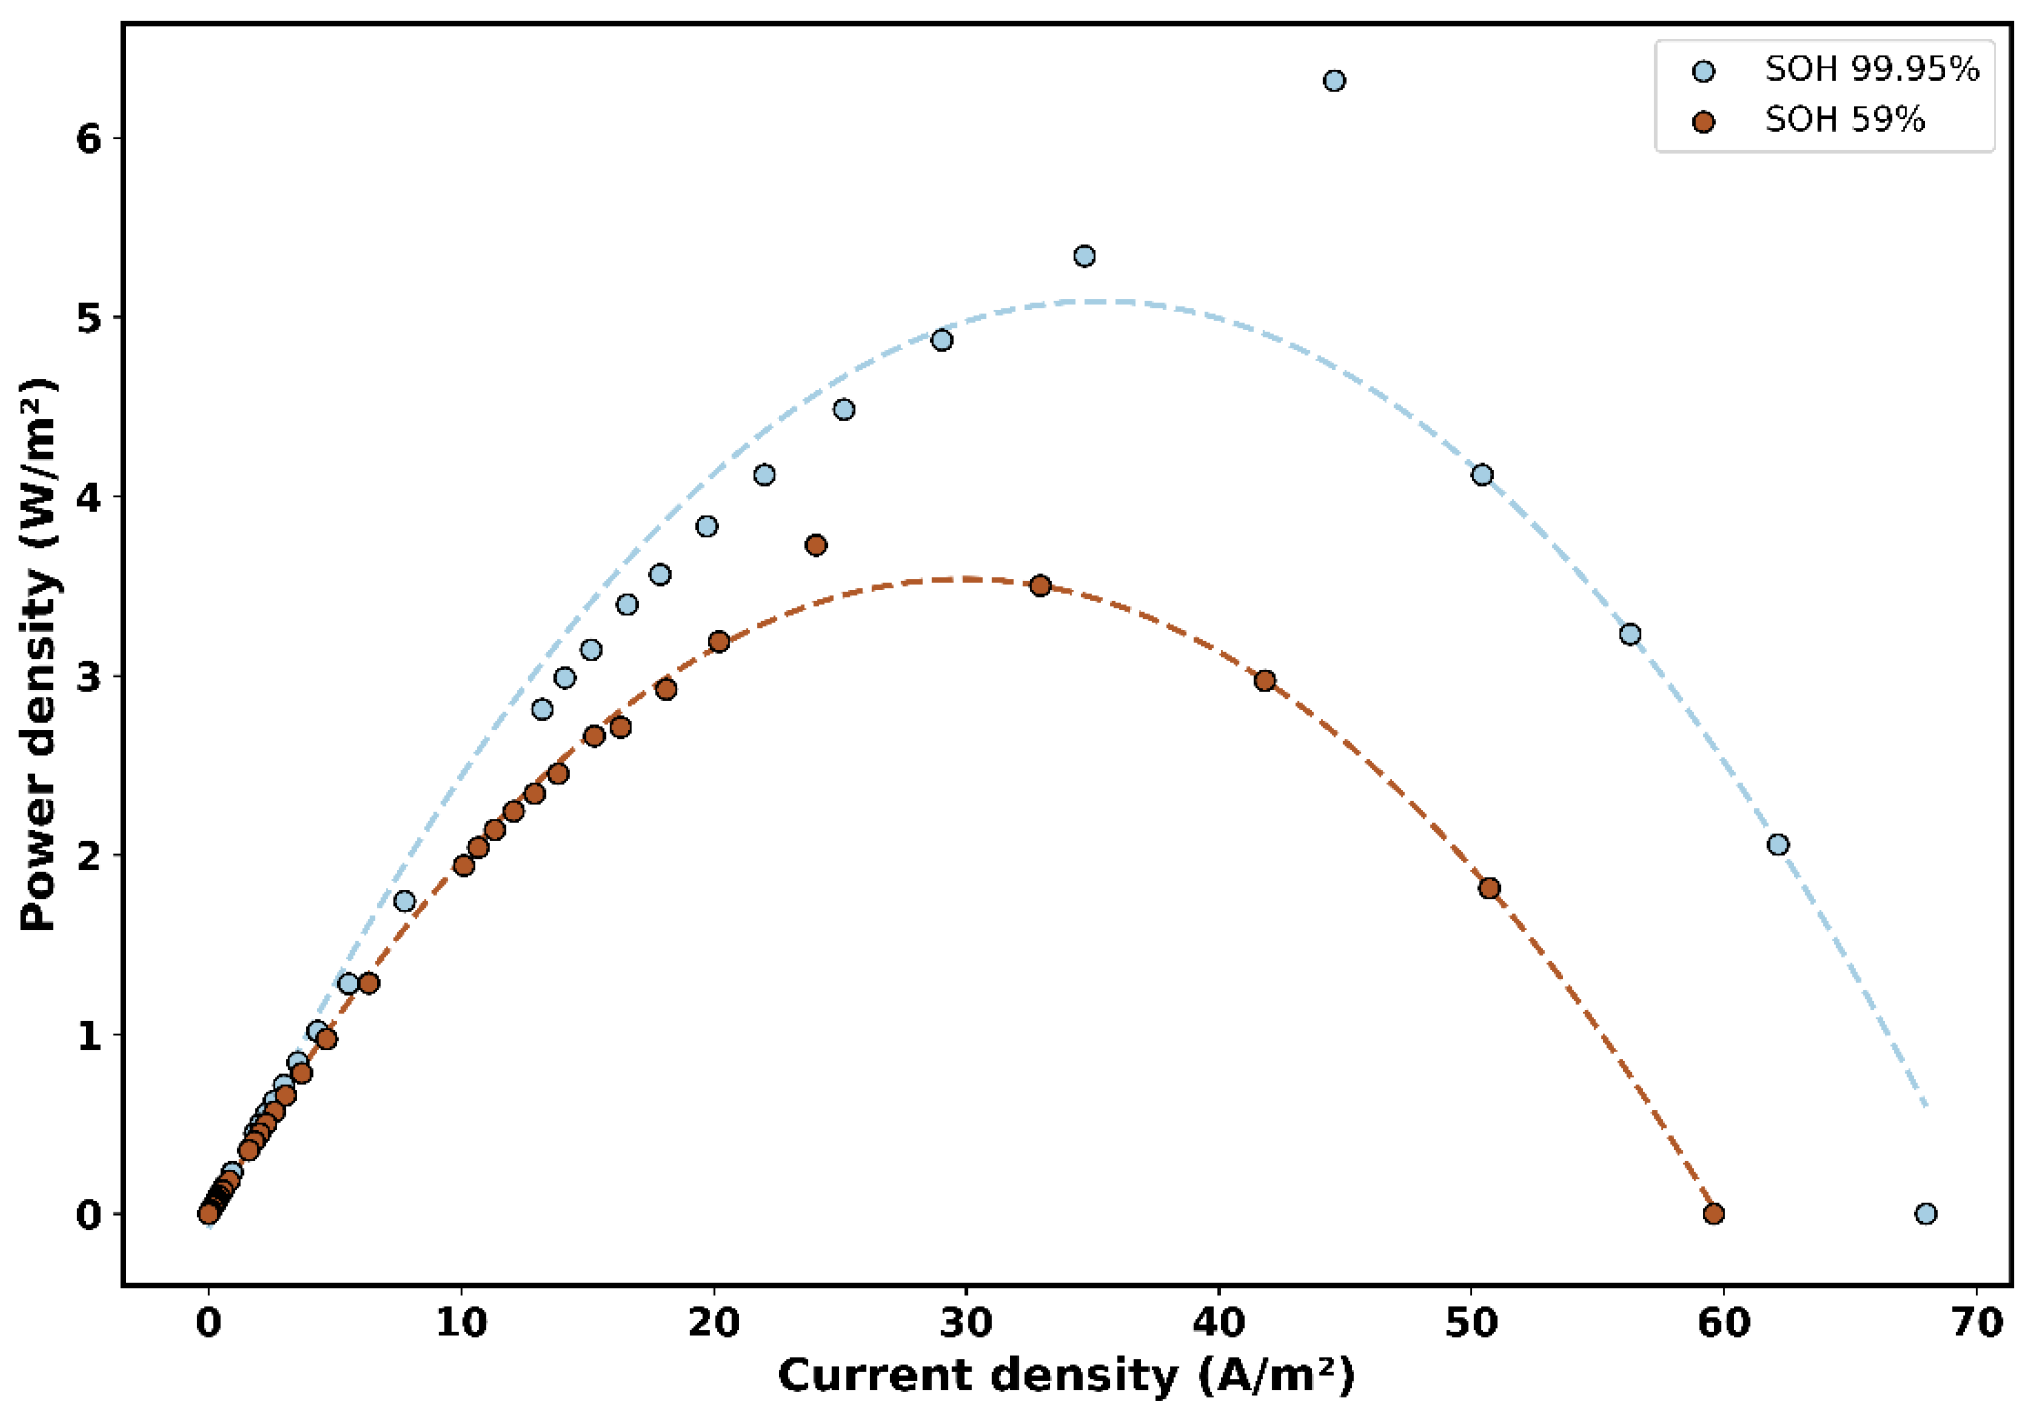
Figure 6 compares the power density obtained during the initial and final characterizations of the system, corresponding to SOH values of 100% and 59%, respectively. The initial curve exhibits significantly higher performance, with a maximum power density close to 6 W·m−2 at current densities of approximately 45 A·m−2. After 25 operating cycles, the cell shows a clear reduction in power delivery capability, with a maximum of around 3.3 W·m−2 and a shift toward lower current densities. This decrease is associated with cumulative increases in resistive and polarization losses, driven by modifications in electrode structure, reduced accessibility of electrochemically active sites, and progressive changes in cell transport properties during repeated cycling. This behavior is consistent with a higher effective internal resistance arising from the membrane/electrolyte ionic pathway and interfacial resistances (e.g., fouling in the membrane, transport properties, and electrical interfaces), together with enhanced electrode polarization as porous-electrode transport becomes less effective due to pore constriction and wettability/flow-distribution changes that increase overpotentials during operation.
Overall, these results indicate moderate system degradation under the evaluated conditions, reducing the SOH to approximately 59%, while still preserving functional and stable operation throughout the tested cycles. This loss of SOH highlights the importance of electrolyte stability for the long-term durability of iron redox flow batteries. Electrolyte degradation, which has been reported in the literature to include the formation of precipitates (iron oxides or hydroxides) or the loss of active species due to secondary reactions or crossover, directly affects the battery’s ability to store and deliver energy efficiently [42,52]. In the present work, the decrease in SOH is interpreted primarily as a reduction in power-delivery capability driven by accumulated resistive and polarization losses, rather than as evidence of an abrupt loss of electrochemically active species. Previous studies suggest that the addition of organic acids, such as sorbitol, ascorbic acid, or citric acid, as well as the use of inert gases to limit oxidation, can effectively stabilize iron electrolytes in aqueous solutions [42]. Therefore, further system optimization will be essential to improve cycling performance and mitigate SOH decline. Potential routes include membrane and electrode antifouling approaches, as well as electrolyte formulation and stabilization strategies, aiming to preserve performance closer to the initial level over extended cycling.

3.6. Electrolyte Stability Analysis

The bulk electrolyte stability was assessed by monitoring the ionic conductivity and pH of both solutions at the start and conclusion of the cycling campaign. Solution A exhibited only a minor change in conductivity, moving from an initial 153 mS·cm−2 to 148 mS·cm−2, while maintaining a constant pH of 3.5. Similarly, Solution B demonstrated high stability, with conductivity remaining virtually unchanged between 121 and 122 mS·cm−2 and a consistent pH of 2.5. These results indicate that the electrolytes preserved their macroscopic acid–base conditions and ionic strength throughout the 25 cycles, confirming the short-term bulk stability of the system under the tested operating conditions. Experimentally, no measurable changes in electrolyte volume were observed in either reservoir during operation, apart from the small aliquots periodically removed for analytical purposes. This observation suggests that significant solvent transfer or dilution effects across the membrane were negligible during the experiments. These results indicate that, within the time frame of the present study, the evolution of the concentration gradient and the impact of membrane crossover remained limited.
A Nernst-type description of the FeCl/FeCl concentration cell shows that the concentration ratios selected for solutions A and B provide a substantial logarithmic driving force for the cell voltage, as expected for a concentration cell. The present system contains the same Fe2+/Fe3+ redox couple in both compartments. As a consequence, crossover of iron ions through the anion-exchange membrane does not introduce foreign electroactive species but instead primarily causes a gradual relaxation of the concentration gradient between the reservoirs. From a thermodynamic standpoint, such mixing reduces the electrochemical driving force predicted by the Nernst relation but does not generate parasitic redox reactions or irreversible electrolyte contamination. Therefore, the main effect of crossover in this architecture is a slow reduction in the concentration gradient rather than chemical degradation of the active species. This thermodynamic interpretation is consistent with the electrochemical characterization of the electrolytes.
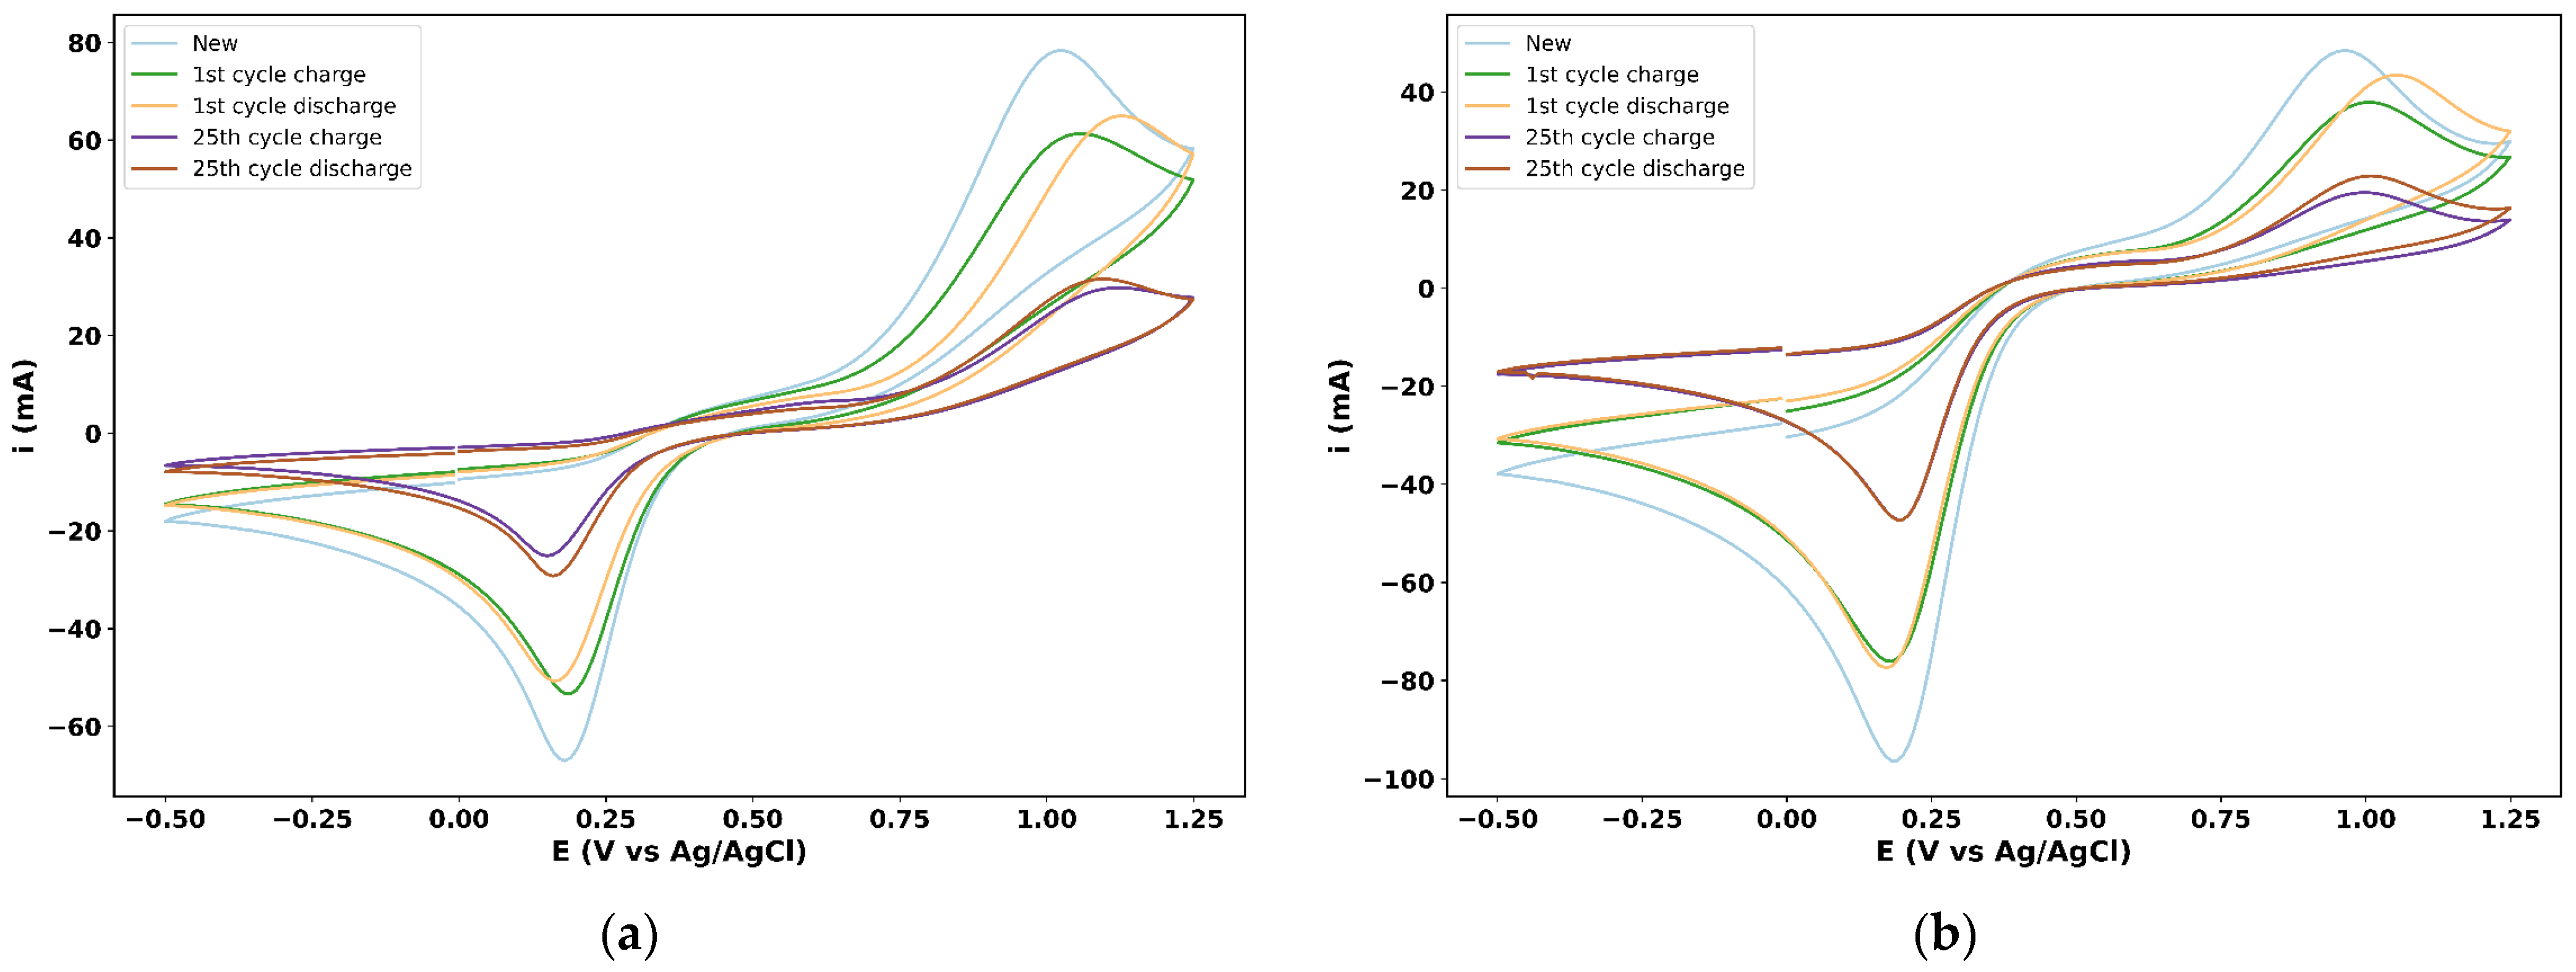
Figure 7a,b present the cyclic voltammograms obtained for solutions A and B, respectively. These plots include the curves corresponding to freshly prepared electrolytes (“New”), after the first charge–discharge cycle, and after the 25th cycle for both stages (charge and discharge). In both cases, the electrochemical response of the Fe3+/Fe2+ redox couple remains well defined throughout the cycles, confirming the chemical stability of the system during battery operation. In Figure 7a, corresponding to solution A, which contains the higher initial fraction of Fe2+, characteristic anodic and cathodic peaks are observed at approximately Ea ≈ 0.96 V vs. Ag/AgCl and Ec ≈ 0.18 V vs. Ag/AgCl. Notably, these peaks retain nearly constant potentials, with no significant shifts observed between the different electrolyte stages. A quantitative peak tracking analysis confirms that both peak potentials remain stable throughout the cycling, with changes of less than 0.1 V for Ea and less than 0.03 V for Ec, supporting the preservation of the Fe3+/Fe2+ formal potential and the absence of additional redox-active species. The most evident differences between the scans are observed in the magnitude of the peak currents. For solution A, the current associated with the oxidation process (Fe2+ → Fe3+) decreases progressively with increasing cycle number. Consistently, the anodic peak current decreases from its initial value to ~30–32 mA by the 25th cycle, while the cathodic peak magnitude decreases to a comparable range (~25–29 mA), and the current ratio |ia|/|ic| remains close to unity (~1.1). The near-unity ratio implies that the charging and discharging processes are highly balanced, with the species generated during the forward reaction being effectively recovered in the reverse scan with minimal loss to irreversible side reactions. This behavior is consistent with the conversion of Fe2+ to Fe3+ during battery charging, which reduces the Fe2+ concentration in tank A and, consequently, decreases the oxidation current observed in the voltammogram.
Similarly, in Figure 7b, corresponding to solution B, where Fe3+ initially predominates, a decrease in the reduction current associated with the Fe3+ → Fe2+ conversion is observed as the cycles progress. This behavior is consistent with the partial reduction of Fe3+ to Fe2+ during battery discharge, which reduces the concentration of Fe3+ available in tank B. As in solution A, the redox couple remains well defined, and the peak positions stay essentially unchanged across stages (Ea varies by <0.1 V and Ec by <0.03 V), supporting a stable Fe3+/Fe2+ formal potential and no emergence of additional redox-active species. The main evolution is again in peak magnitudes: the cathodic peak (reduction) decreases markedly from the fresh electrolyte to the 25th cycle (roughly halving), while the anodic peak also decreases to ~20 mA by the 25th cycle. Consistently, the current ratio |ia|/|ic| remains below unity (~0.4–0.56), indicating that the reduction peak dominates throughout cycling, as expected for an Fe3+-rich electrolyte. In both electrolytes, the general shape of the cyclic voltammetry curves remains practically unaltered, with no evidence of parasitic currents, relevant capacitive distortions, or regions suggesting the formation of non-electroactive species, precipitates, or other degradation products. This indicates that the electrochemical response is predominantly governed by the faradaic Fe3+/Fe2+ couple and suggests that iron remains dissolved and electrochemically active throughout the experiments, with no significant precipitation or irreversible chemical transformations under the tested conditions.
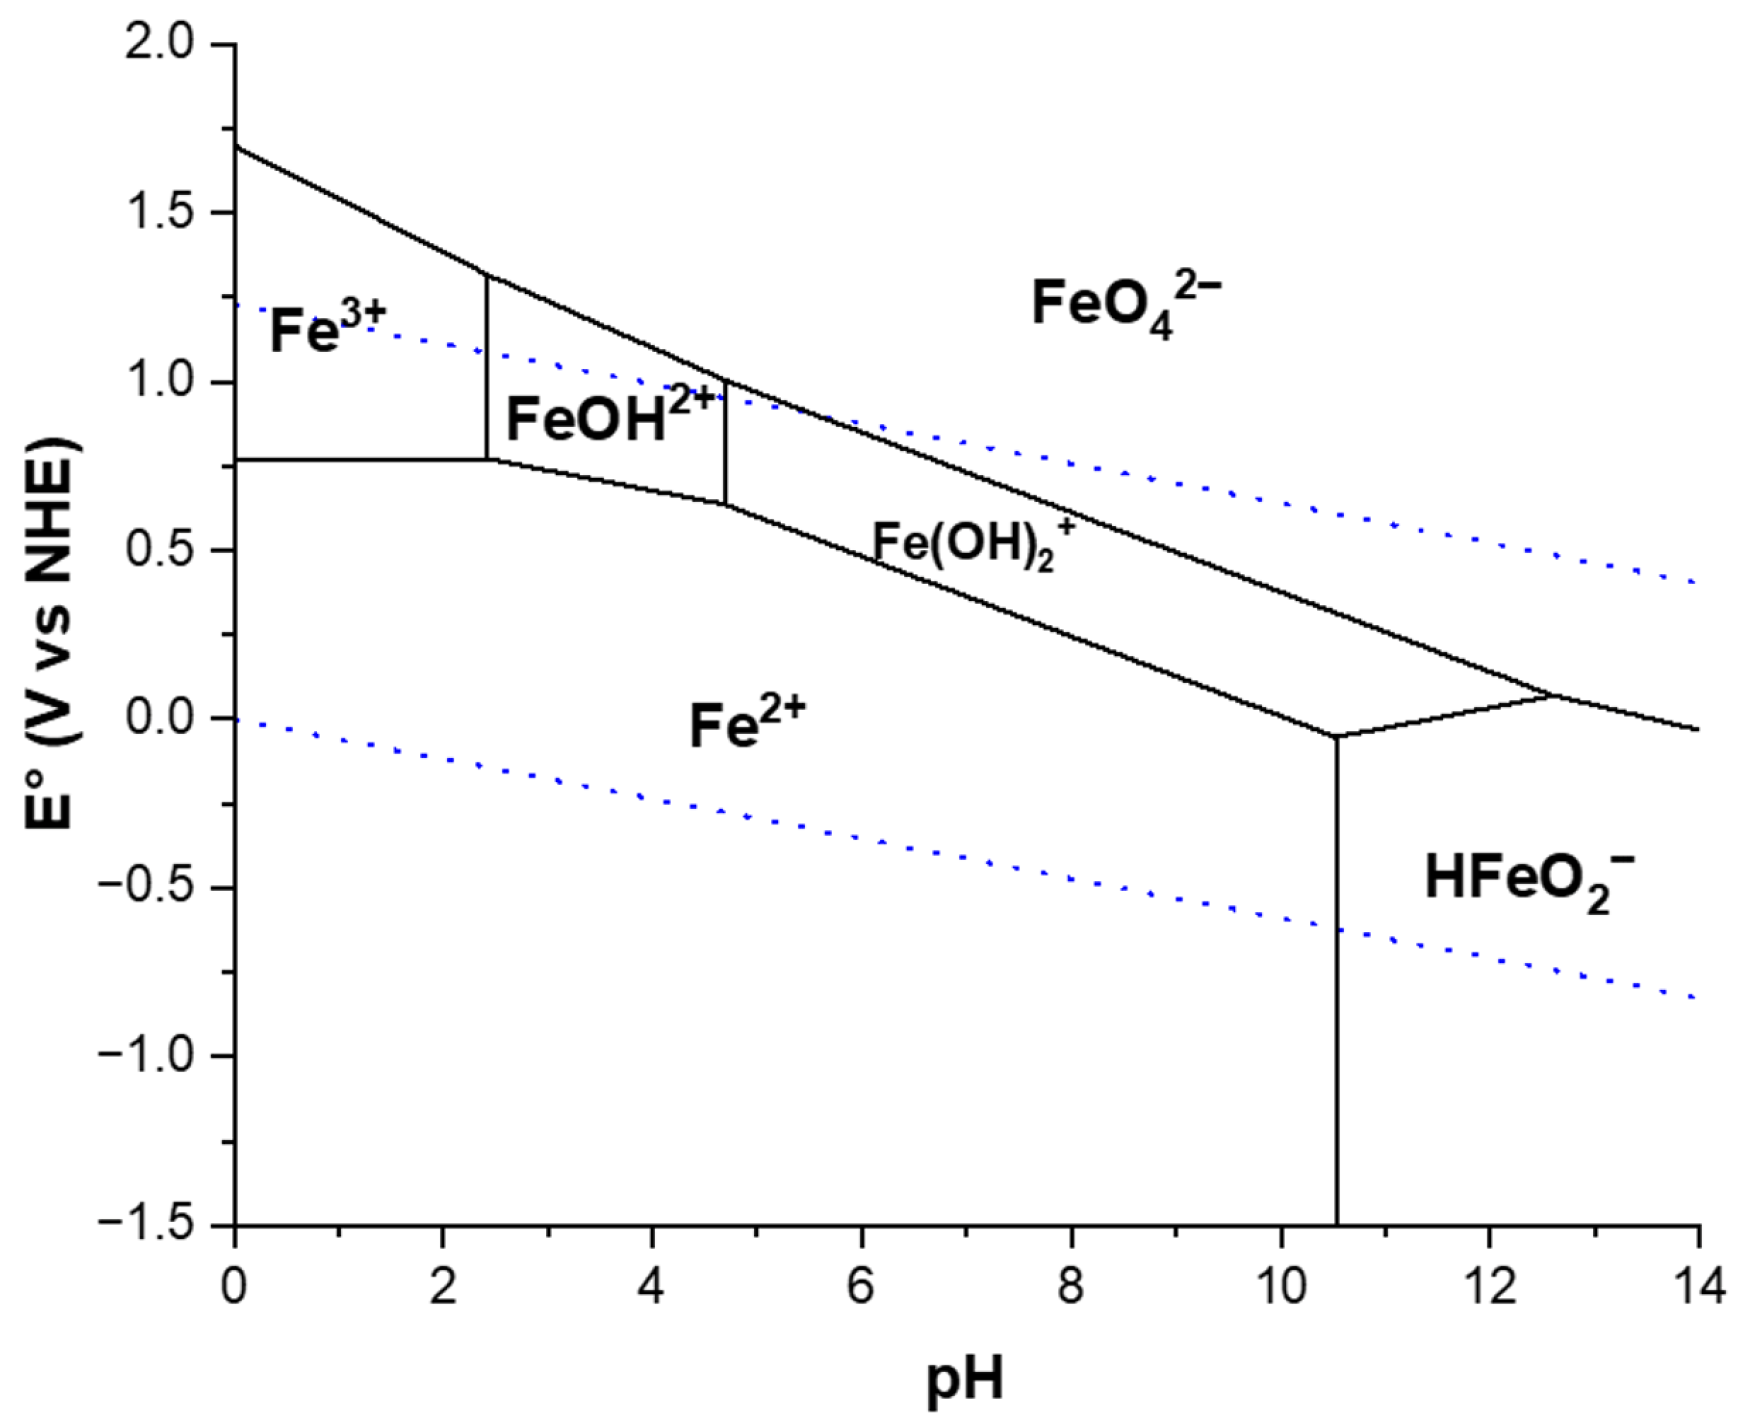
These results are consistent with stability conditions predicted by the Pourbaix diagram for iron in chlorinated media, where the formation of oxides or hydroxides is not expected within the employed pH and potential range. From a thermodynamic viewpoint, the Pourbaix diagram presented in Appendix A indicates that, under acidic conditions relevant to this work, iron is expected to remain predominantly in dissolved form, mainly as Fe2+ and Fe3+ species, whereas the formation of solid hydroxides becomes thermodynamically favorable only at higher pH values, typically above about pH 5. Therefore, within the acidic pH range employed in this study, precipitation of iron oxides or hydroxides is not thermodynamically expected for the FeCl2/FeCl3 electrolyte system.
Overall, the stability of the electrolytes is comprehensively validated through the convergence of electrochemical and theoretical analyses. Cyclic voltammetry results confirm that both species retain their electrochemical functionality throughout the 25 evaluated cycles. This is further supported by the Pourbaix diagram and the Nernst theoretical model, which confirm the thermodynamic viability and reversible behavior of the redox species under the system’s operating conditions. Additionally, data obtained through EIS provides critical insights into interface stability and the evolution of internal resistances, ruling out accelerated electrolyte degradation. Additionally, the impedance spectrum is adequately described by a circuit composed of ohmic, charge-transfer, and diffusion-related elements, consistent with the expected response of a porous-electrode Fe3+/Fe2+ flow cell. The absence of additional dominant time constants or anomalous features indicates that the electrolyte remained electrochemically operative, with observed limitations primarily resistive and transport-related rather than due to severe decomposition. Therefore, the integrated use of voltammetric characterization, chemical thermodynamics, and impedance spectroscopy ensures that the electrolytes maintain their structural and functional integrity, confirming that variations in peak currents reflect controlled concentration changes strictly associated with the battery’s charge and discharge processes.

4. Discussion and Conclusions

This work successfully demonstrates the integration of a solar energy source with a concentration-gradient iron-chloride redox flow battery, positioning it as a sustainable and scalable energy storage alternative, also foundational baseline for concentration-driven architectures. The findings validate the working hypotheses outlined in the Introduction regarding the suitability of flow batteries for renewable energy integration and the need for sustainable storage solutions. The results in this work were compared with representative flow-battery systems reported in the literature to provide a structured positioning across mature conventional RFB, an all-iron redox flow battery representing a low-cost iron-based system with high reported performance, and conceptually related concentration-driven systems, including acid–base flow batteries and a previously reported FeCl concentration flow cell (Table A2). VRFBs currently represent the technological benchmark among aqueous flow battery systems for stationary energy storage, after several decades of development. As summarized in Table A2, VRFB single-cell studies typically report coulombic efficiencies above ~95% and peak power densities in the kW·m−2 range, reflecting extensive optimization of membranes, electrodes, and cell architectures. Table A2 also shows that high-performance all-iron redox flow systems can reach similarly high coulombic efficiency and kW·m−2-level peak power density under optimized laboratory conditions. In contrast, the FeCl-CFB evaluated in this work delivers coulombic efficiencies of 63–72%, energy efficiencies of 20–28%, and a peak power density of 6.3 W·m−2 under the tested conditions. The iron-chloride concentration cell reported by Bock et al. further illustrates that this concentration-driven FeCl architecture can achieve higher cell-level power densities in small laboratory cells, while exhibiting low coulombic efficiency under the studied cycling conditions. These comparisons position the present prototype as an early-stage integrated demonstration, where the energetic performance is primarily governed by substantial contact and ohmic resistances, as quantitatively diagnosed via impedance spectroscopy. However, the objective and positioning of the FeCl-CFB differ fundamentally from those of conventional VRFB systems. Rather than competing with mature vanadium chemistries that exploit the potential difference between distinct redox couples, the present architecture explores a concentration-driven redox configuration based on the Fe2+/Fe3+ couple present in both compartments, where energy storage relies on controlled concentration gradients across an anion-exchange membrane.
This design leverages Earth-abundant and low-cost materials such as iron chlorides [27], offering a clear path toward sustainable large-scale energy storage by minimizing the environmental and economic hurdles associated with rare-metal chemistries like vanadium. This approach prioritizes material sustainability, reduced supply-chain criticality, and intrinsic safety over maximization of round-trip efficiency. Consequently, the FeCl-CFB emerges as a complementary alternative to VRFBs, particularly suited for low-cost, decentralized solar energy storage, while the resistive and polarization limitations identified here define clear directions for future optimization.
Beyond its material advantages, this prototype further demonstrates operational reproducibility, consistent charge/discharge profiles, SOC trends, useful capacity, electrical response, and theoretical consistency. The experimental performance shows good alignment with the developed SOC models, demonstrating that the concentration-driven mechanism is predictable under the tested conditions. The voltammetric analysis confirms that the electrochemical stability of the iron–chloride system is a key strength of this battery. The preservation of well-defined redox potentials, absence of parasitic currents, and invariance of voltammogram shapes demonstrate that iron ions remain in solution and that the system operates within a stable electrochemical window, in agreement with thermodynamic predictions for chloride media. Finally, this reliability is further validated by the Electrochemical Impedance Spectroscopy study, which provided a statistically rigorous fit for the internal resistance components. By confirming that the system’s performance is governed by well-defined electrochemical parameters rather than random fluctuations or chemical instability, this work establishes a reproducible baseline for the future development of decentralized, low-cost solar energy storage solutions.
Building upon this initial demonstration, future research will prioritize bridging the efficiency gap through targeted engineering and materials optimization. The primary focus should be on the mitigation of the substantial charge-transfer resistance, likely through the development of surface-modified porous electrodes or advanced carbon catalysts to accelerate the redox kinetics. Furthermore, refining the cell assembly compression and current collector interfaces is essential to minimize the parasitic contact resistances that currently constrain the system’s power output. Parallel efforts in membrane engineering, specifically aimed at increasing ionic conductivity while maintaining low crossover, offer a clear path to significantly reduce ohmic overpotentials. By integrating these technical advancements with more sophisticated hydrodynamic flow fields, the solar-coupled iron-chloride concentration cell can evolve from a proof-of-concept into a competitive, decentralized energy storage technology. This trajectory underscores the potential of earth-abundant chemistries to provide a sustainable and economically viable cornerstone for the global transition toward accessible renewable energy systems.

Author Contributions

E.S.-S.: Conceptualization, Experimental activities, Methodology, Investigation, Writing—original draft preparation. Z.D.l.C.-B.: Experimental activities, Formal analysis, Data curation, Visualization, Writing—original draft preparation. D.G.-B.: Methodology, Writing—original draft preparation. P.R.-B.: Methodology, Software, Formal analysis. D.M.: Writing—Review and Editing, Supervision. E.M.: Writing—Review and Editing, Supervision, Project administration. All authors have read and agreed to the published version of the manuscript.

Funding

This research received no external funding.

Data Availability Statement

The original contributions presented in the study are included in the article; further inquiries can be directed to the corresponding author.

Acknowledgments

E. Sandoval-Sánchez and D. García-Bassoco thank SECIHTI for the doctoral scholarships. Z. De la Cruz-Barragán thanks SECIHTI for the postdoctoral fellowship.

Conflicts of Interest

The authors declare no conflicts of interest. The funders had no role in the design of the study; in the collection, analyses, or interpretation of data; in the writing of the manuscript; or in the decision to publish the results.

Abbreviations

The following abbreviations are used in this manuscript:
AEMAnion Exchange Membrane
CFBConcentration Flow Battery
CGFBConcentration Gradient Flow Battery
CVCyclic Voltammetry
DSADimensionally Stable Anode
FBFlow Battery
FeCl-CFBIron Chloride Concentration Flow Battery
NHENormal Hydrogen Electrode
OCVOpen-Circuit Voltage
PVPhotovoltaic
RFBRedox Flow Battery
SOCState of Charge
SOHState of Health

Appendix A

Appendix A.1

To support the selection of the iron chloride redox couple and the operating conditions adopted in this work, a Pourbaix diagram of iron is presented. The diagram illustrates the thermodynamic stability domains of dissolved and solid iron species as a function of pH and electrode potential versus the normal hydrogen electrode (NHE). Within acidic to mildly acidic conditions, relevant to the FeCl concentration flow battery investigated here, iron remains predominantly in soluble Fe2+ and Fe3+ forms, which enables reversible redox reactions without precipitation of solid hydroxides or oxides. As the pH increases toward neutral and alkaline values, the diagram indicates the progressive stabilization of Fe(OH)2, Fe(OH)3, and ferrate species, which are associated with passivation and loss of electrochemical activity. Therefore, operation of the battery under acidic conditions is thermodynamically favorable to maintain iron in electrochemically active, soluble states and to avoid parasitic precipitation phenomena that could compromise performance and long-term stability.
Figure A1. Pourbaix diagram of iron showing the thermodynamic stability regions (dotted lines) of aqueous and solid iron species as a function of pH and electrode potential (E vs. NHE).
Energies 19 01532 g0a1

Appendix A.2

Figure A2 compiles the complete power density curves as a function of current density obtained during the initial electrochemical characterization of the FeCl concentration flow battery using Toray carbon paper and carbon felt electrodes. The continuous representation of the experimental data enables identification of the operating regions associated with maximum power output and highlights the different current density limits reached with each electrode material. These curves were used as the basis for electrode selection before the cycling experiments and subsequent state-of-health evaluation.
Figure A2. Power density as a function of current density for the FeCl concentration flow battery using Toray carbon paper and carbon felt electrodes during the initial characterization.
Energies 19 01532 g0a2

Appendix A.3

Electrochemical impedance spectroscopy (EIS) was performed to identify the main ohmic, charge-transfer, and mass-transport contributions governing the electrical response of the battery. Measurements were carried out over a frequency range from 100 kHz to 10 Hz using a Biologic VMP-300 potentiostat, Mexico City, Mexico. and the data were recorded and analyzed with EC-Lab software V10.12. The impedance response was examined through Bode and Nyquist representations in order to distinguish the different physicochemical processes occurring in the cell. As shown in the Bode plot (Figure A3a), the impedance magnitude decreases progressively with increasing frequency, while the phase angle reaches a maximum in the intermediate-frequency region, indicating that the dominant electrochemical processes occur in this range and are mainly associated with charge-transfer phenomena at the electrode–electrolyte interface.
The Nyquist plot of the complete battery (Figure A3b) exhibits the characteristic response of a porous electrode system. The slight curvature observed at high and intermediate frequencies indicates the presence of charge-transfer processes coupled with non-ideal capacitive behavior, while the inclined line in the low-frequency region reflects diffusion limitations within the porous electrode structure. The experimental data were fitted using the equivalent electrical circuit shown in the inset of Figure A3b. In this circuit, RS represents the ohmic resistance of the system, including the ionic resistance of the electrolyte, membrane resistance, and electronic contributions from the electrodes and current collectors, which typically appear at high frequencies. The constant phase element (CPE) accounts for the non-ideal capacitive behavior of the porous electrodes due to surface heterogeneity and distributed reaction sites. The parameter RCT corresponds to the charge-transfer resistance associated with the electrochemical reaction at the electrode–electrolyte interface, while R represents additional resistive contributions related to internal contacts and electrolyte-flow effects within the porous structure. The Warburg element (W) describes finite-mass transport effects and is manifested as the low-frequency inclined tail in the Nyquist plot. The values obtained from fitting the equivalent circuit are summarized in Table A1. These parameters provide insight into the relative contributions of ohmic, kinetic, and mass-transport limitations to the electrochemical behavior of the system.
Figure A3. Electrochemical impedance spectroscopy (EIS) characterization of the FeCl-CFB cell. (a) Bode plot of battery from 100 kHz to 10 Hz. (b) Nyquist plot of battery at the same conditions.
Energies 19 01532 g0a3
Table A1. Values corresponding to equivalent circuit fitting to EIS experiments (χ2 = 0.058).
ComponentValueStandard Deviation
Rs1 [Ohm]9.5180.162
RCT [Ohm]101.9591.076
CPE [S·sn·cm−2]91.079 × 10−63.693 × 10−6
N0.6164.222 × 10−3
W [S·s−0.5·cm−2]1.562 × 10−356.493 × 10⁻⁶
R [Ohm]104.9233.808
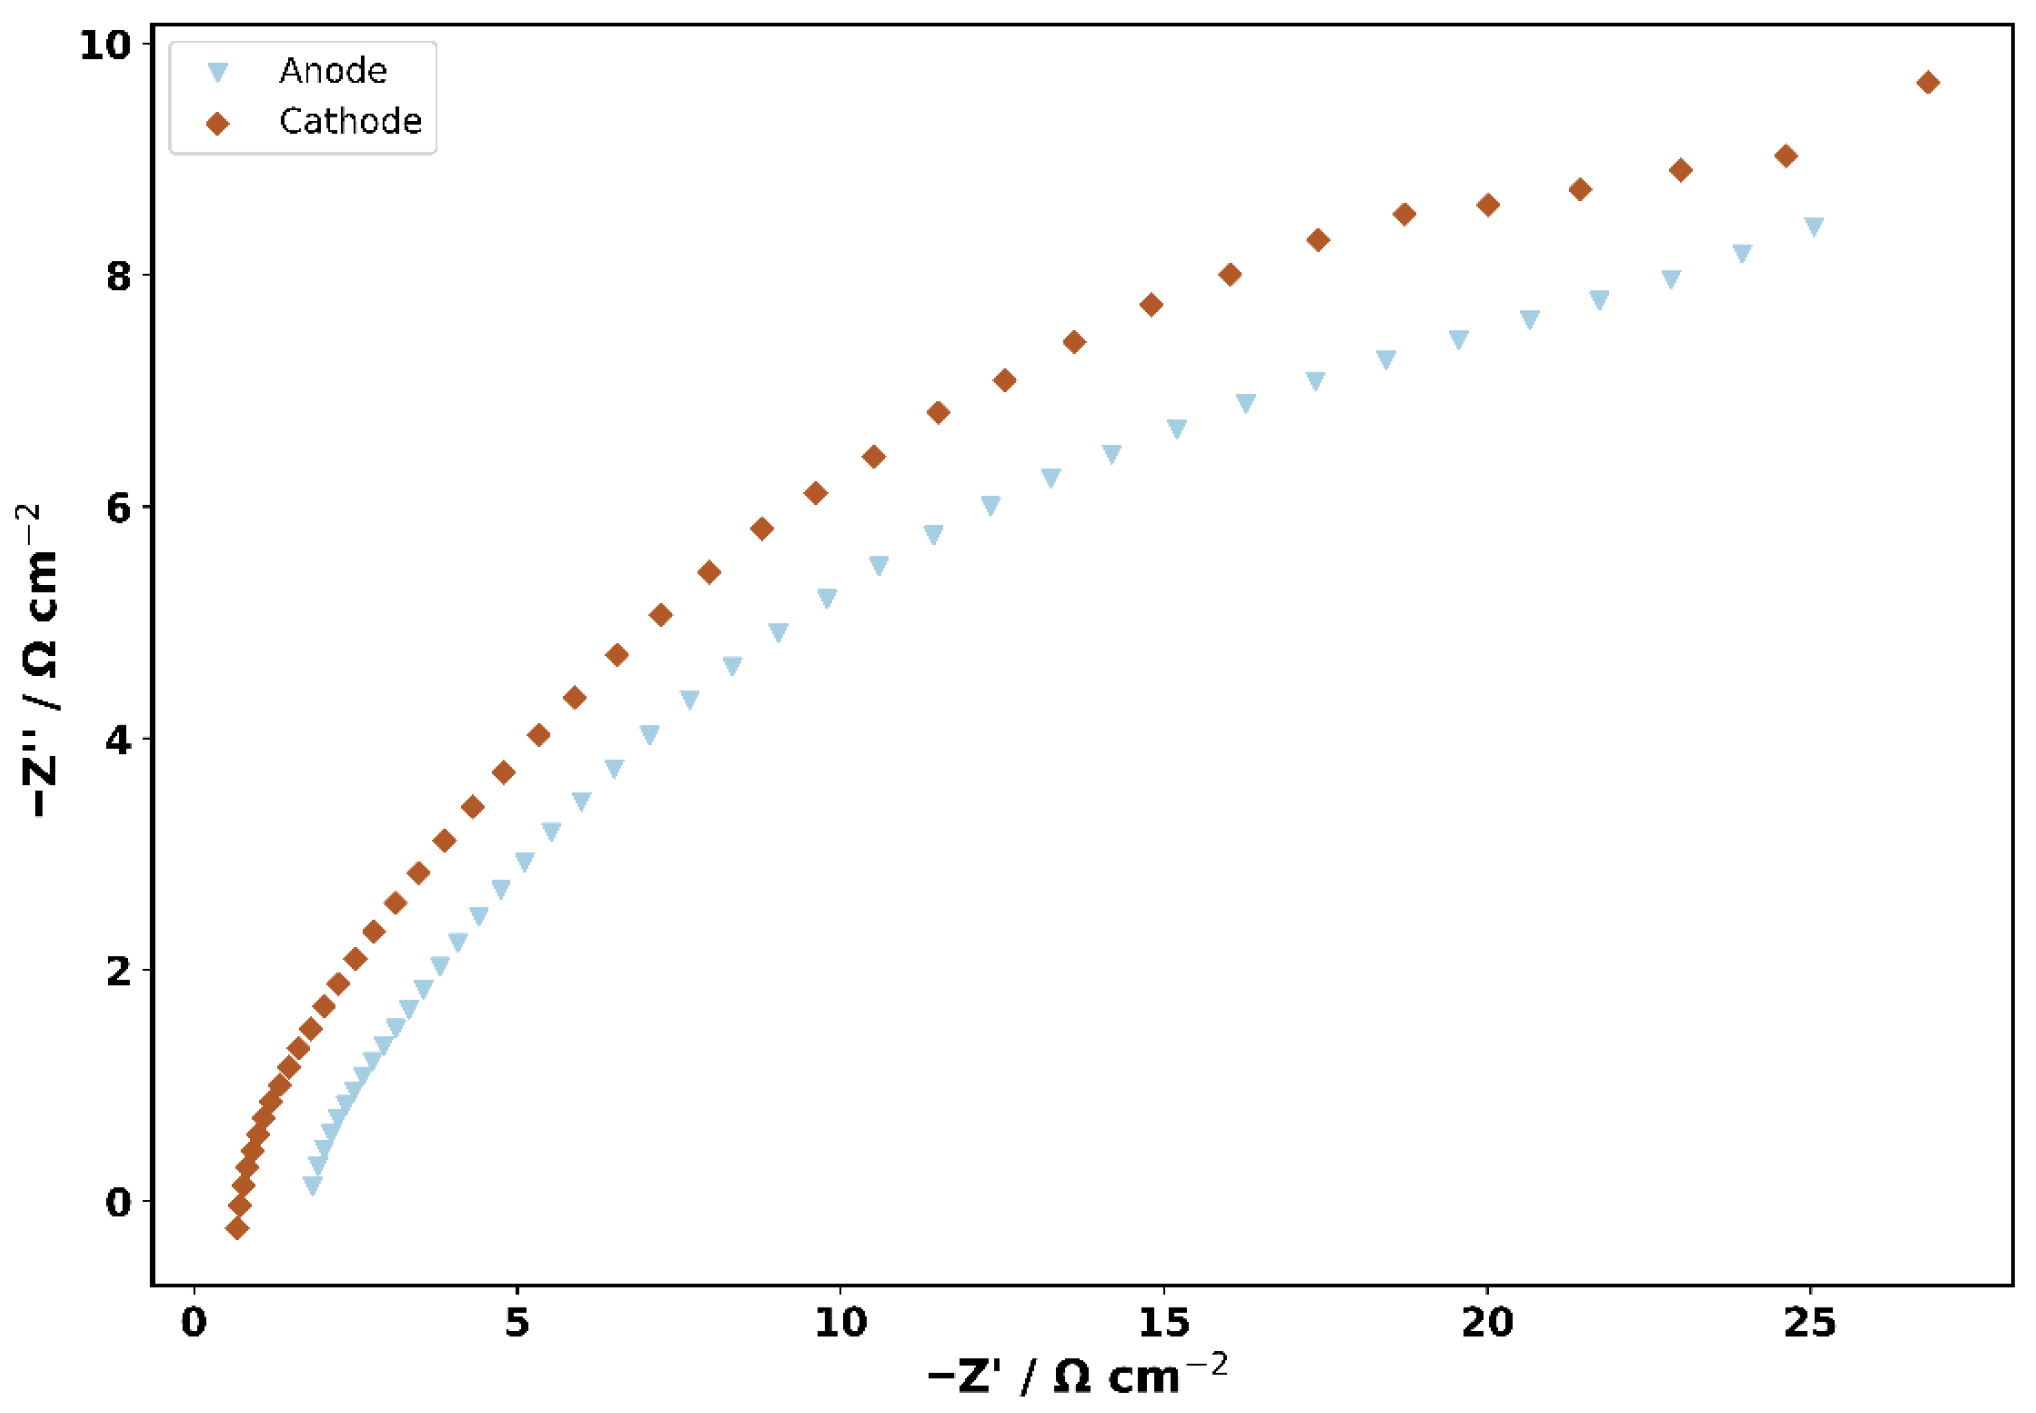
To further evaluate the contribution of each electrode to the overall impedance of the system, additional EIS measurements were performed individually on the anode and cathode connected to the current collector (Figure A4). Both electrodes exhibited the typical impedance response of porous carbon materials; however, the cathode showed higher impedance over the analyzed range than the anode. This behavior suggests that the cathodic side contributes more strongly to the total cell resistance, likely due to higher charge-transfer resistance and/or mass-transport limitations under the tested conditions. These results are consistent with the full-cell EIS analysis and indicate that the main resistive losses of the system are concentrated in the electrode region, while the membrane and electrolyte make a smaller contribution to the overall impedance.
Figure A4. EIS of the cathode and the anode connected to the charge collector.
Energies 19 01532 g0a4

Appendix A.4

To contextualize the system investigated in this work within the broader landscape of flow-battery technologies, a comparative summary of representative systems reported in the literature was compiled. Table A2 presents selected examples, including vanadium redox, all-iron, acid–base, and iron chloride concentration flow batteries, highlighting their chemistry, key performance indicators, level of technological maturity, and associated environmental considerations. As shown in the table, established technologies such as VRFBs exhibit higher power outputs and greater technological maturity, whereas alternative chemistries based on abundant elements, including iron-based systems, remain largely at the laboratory stage but offer advantages in terms of material availability and potentially lower environmental impact. In this context, the FeCl-CFB system evaluated in this work can be positioned as an emerging configuration whose performance is still below that of mature technologies but contributes to the exploration of low-cost and resource-abundant alternatives for electrochemical energy storage.
Table A2. Comparative performance of representative flow-battery systems reported in the literature.
Study (Author, Year)System Composition/ChemistryPerformanceScale/MaturityEnvironmental Risk
Davies et al., 2018 [53]Vanadium redox flow battery (VRFB); membrane: Nafion 117/Nafion 212; electrodes: graphite felt (GFD 4.6EA); electrolytes: V2+/V3+ and VO2+/VO2+ in H2SO4.CE: ~96–98%; EE: ~27–69.5%; Pmax: 6.69 kW·m−2; cycles: 3Lab/bench-scale (single cell; active area 31 cm2).Moderate; corrosive, strongly acidic electrolyte; vanadium handling/toxicity considerations.
Liu et al., 2022 [54]All-iron (all-liquid) flow battery; membrane: SPEEK (~50 μm); electrodes: Carbon felt; electrolytes: [Fe(CN)6]3−/[Fe(CN)6]4− and ferric/ferrous-gluconate complexes.CE: >99%; EE: ~83%; Pmax: 4.6 kW·m−2; cycles: >950.Lab/bench-scale (30 single cells; effective membrane area 48 cm2).Low; electrolytes are stable, non-toxic, and cost-effective.
Van Egmond et al., 2017 [55]Acid base flow battery (AB-FB); membrane: BPM (Fumasep FBM) + AEM (FAB-PK-130) + CEM (Nafion N117); electrodes: Ti coated with Ir-Ru; electrolytes: HCl, NaOH, and NaCl.CE: 13–27%; EE: up to 13.5% (round-trip efficiency); Pmax: 3.7 W·m−2; cycles: 9.Lab-scale (single cell; effective membrane area 100 cm2).Moderate; strong acid/base handling; neutralization risks.
Bock et al., 2021 [42]Iron chloride concentration flow battery (ICFB); membrane: AEM (Fumasep FAP-1); electrodes: graphite felt; electrolytes: FeCl2/FeCl3 + NaCl.CE: ≈10–40%; Pmax: 200–250 W·m−2; cycles: up to 100.Lab-scale (single cell; effective membrane area 1 cm2).Low–moderate; abundant metal; acidic/corrosive; possible chlorine evolution.
This work, 2026Iron chloride concentration flow battery (FeCl-CFB) coupled to PV; membrane: AEM (Fujifilm Type 10); electrodes: carbon felt; electrolytes: FeCl2/FeCl3 + NaCl.CE: 63–72%; EE: 20–28%; Pmax: 6.3 W·m−2; cycles: 25.Lab-scale (single cell; effective membrane area 12.5 cm2) integrated PV test.Low–moderate; abundant metal; acidic/corrosive; possible chlorine evolution.

Appendix A.5

To evaluate the reproducibility and potential evolution of the electrochemical performance during operation, a statistical analysis was performed on several metrics obtained from the charge–discharge cycling experiments. A total of 25 cycles were analyzed. For each cycle, representative values were extracted from specific stages of the process. During charge and discharge, the current density was evaluated within defined time windows of the cycle in order to characterize the behavior near steady-state conditions. In addition, after both the charge and discharge stages, the open circuit potential and short circuit current were measured to assess the electrochemical state of the system under open and short circuit conditions. For each metric, the following statistical parameters were calculated across the analyzed cycles: mean value, sample standard deviation (SD), coefficient of variation (CV), minimum and maximum values, and the slope of a linear regression of the metric as a function of cycle number. The regression analysis was used to identify possible trends during cycling. The coefficient of determination (R2), the p-value associated with the slope, and the 95% confidence interval (95% CI) of the slope were also calculated to evaluate the statistical significance of the observed trends. Table A3 summarizes the statistical results obtained for all analyzed electrochemical metrics.
The statistical analysis reveals clear differences between the behavior of the system during charge and discharge. The current density measured at the end of the charge stage shows very high reproducibility, with a coefficient of variation of only 1.1%, indicating stable operation across the 25 cycles. In addition, the regression analysis shows that the slope of this parameter with respect to cycle number is not statistically significant (p = 0.76), and the corresponding confidence interval includes zero. This indicates that no systematic trend in charge current density was observed during cycling. Similarly, the OCP and SCC measured after the charge stage do not exhibit statistically significant trends with cycle number, suggesting that the electrochemical state of the system remains stable after charging.
In contrast, the discharge stage exhibits greater variability and statistically significant trends. The current density measured at the beginning of the discharge stage (5–10 min) shows a positive slope that is statistically significant (p < 0.001), indicating that the discharge current density increases with cycle number. A similar but less pronounced trend is observed near the end of the discharge stage (50–55 min), where the slope is also positive and statistically significant (p = 0.006). These results suggest a progressive improvement in the discharge performance of the system during the first cycles. Such behavior is commonly associated with electrochemical activation phenomena, which may include improved electrode wetting, stabilization of ion transport pathways, or conditioning of the electrode–electrolyte interfaces. Finally, the OCP and SCC measured after the discharge stage show small negative slopes; however, these trends are not statistically significant, as indicated by the p-values and the confidence intervals that include zero. This suggests that, within the range of cycles analyzed, no clear evidence of electrochemical degradation of the system is observed. Overall, the statistical results indicate that the system exhibits stable charge behavior and progressive stabilization of the discharge performance during cycling.
Table A3. Statistical summary of charge and discharge parameters over 25 cycles.
ProcessMeasurementMeanSDCV (%)MinMaxSlope (Per Cycle)R2p-Value95% CI (Slope)Cycles
ChargeJ (50–55 min)738.688.271.12705.52745.300.07080.0040.7645−0.413–0.55425
ChargeOCP after charge271.3524.579.05229.66333.910.91250.0750.1861−0.472–2.29725
ChargeSCC after charge89.776.897.6865.6598.200.02040.00050.9177−0.384–0.42425
DischargeJ (5–10 min)38.316.6117.2521.5648.750.57170.4050.0006230.273–0.87025
DischargeJ (50–55 min)29.554.2914.5319.1535.670.30960.2820.0063390.096–0.52325
DischargeOCP after discharge150.848.035.32131.57172.95−0.30740.0790.1723−0.759–0.14425
DischargeSCC after discharge59.895.168.6248.9667.59−0.19580.0780.1769−0.486–0.09525
Notes: Mean: arithmetic mean across the evaluated cycles. SD: sample standard deviation. CV (%): coefficient of variation (SD/Mean) × 100 (SD/Mean) × 100 (SD/Mean) × 100. Slope (per cycle): linear regression slope of the metric as a function of cycle number. R2: coefficient of determination of the regression. p-value: statistical significance of the slope parameter. 95% CI: 95% confidence interval for the slope. Cycles: number of cycles included in the analysis (n = 25).

References

  1. Mandys, F.; Chitnis, M.; Silva, S.R.P. Levelized cost estimates of solar photovoltaic electricity in the United Kingdom until 2035. Patterns 2023, 4, 100735. [Google Scholar] [CrossRef] [Scilit]
  2. Nasirov, S.; Ciarreta, A.; Agostini, C.A.; Gutiérrez-Hita, C. Editorial: Distributed solar PV applications. Front. Energy Res. 2024, 12, 1367587. [Google Scholar] [CrossRef] [Scilit]
  3. Asri, L.I.M.; Ariffin, W.; Zain, A.S.M.; Nordin, J.M.; Saad, N.S. Comparative Study of Energy Storage Systems (ESSs). J. Phys. Conf. Ser. 2021, 1962, 12035. [Google Scholar] [CrossRef] [Scilit]
  4. Topalović, Z.; Haas, R.; Ajanović, A.; Sayer, M. Prospects of electricity storage. Renew. Energy Environ. Sustain. 2023, 8, 2. [Google Scholar] [CrossRef] [Scilit]
  5. Stritih, U.; Mlakar, U. Technologies for seasonal solar energy storage in buildings. In Advancements in Energy Storage Technologies; IntechOpen: London, UK, 2018. [Google Scholar] [CrossRef] [Scilit]
  6. Yamegueu, D.; Nelson, H.T.; Boly, A.S. Improving the performance of PV/diesel microgrids via integration of a battery energy storage system: The case of Bilgo village in Burkina Faso. Energy Sustain. Soc. 2024, 14, 48. [Google Scholar] [CrossRef] [Scilit]
  7. Richard, L. DC Solar Microgrids with Decentralized Production and Storage for the Lateral Electrification of Rural Africa. 2023. Available online: https://theses.hal.science/tel-04465319 (accessed on 22 August 2025).
  8. Abbas, A.H.R.; Rajeswari, M.; Sharma, D.; Singh, R.B.; Jeyakani, P.; Dhabliya, D. Optimization of Nanogrids for Remote Off-Grid Communities. E3S Web Conf. 2024, 540, 1014. [Google Scholar] [CrossRef] [Scilit]
  9. Junior, P.R.; Rocha, L.C.S.; Morioka, S.N.; Bolis, I.; Chicco, G.; Mazza, A.; Janda, K. Economic Analysis of the Investments in Battery Energy Storage Systems: Review and Current Perspectives. Energies 2021, 14, 2503. [Google Scholar] [CrossRef] [Scilit]
  10. Zhang, Q.; Jia, Q.; Zhang, T.; Zeng, H.; Wang, C.; Liu, W.; Li, H.; Song, Y. An Artificial Intelligence Frequency Regulation Strategy for Renewable Energy Grids Based on Hybrid Energy Storage. Energies 2025, 18, 2629. [Google Scholar] [CrossRef] [Scilit]
  11. Putsche, V.L.; Pattany, J.; Ghosh, T.; Atnoorkar, S.; Zuboy, J.; Carpenter, A.; Takeuchi, E.S.; Marschilok, A.C.; Takeuchi, K.J.; Burrell, A.; et al. A framework for integrating supply chain, environmental, and social justice factors during early stationary battery research. Front. Sustain. 2023, 4, 1287423. [Google Scholar] [CrossRef] [Scilit]
  12. Zhao, C. Condition Monitoring of Lithium-ion Batteries Providing Grid Services. Research Portal Denmark. Ph.D. Thesis, Technical University of Denmark, Kongens Lyngby, Denmark, January 2023; p. 212. Available online: https://local.forskningsportal.dk/local/dki-cgi/ws/cris-link?src=dtu&id=dtu-ecc15ceb-317e-4921-8278-f6f6a921e18e&ti=Condition%20Monitoring%20of%20Lithium-ion%20Batteries%20Providing%20Grid%20Services (accessed on 23 August 2025).
  13. Barman, P.; Dutta, L.; Azzopardi, B. Electric vehicle battery supply chain and critical materials: A brief survey of state of the art. IET Conf. Proc. 2023, 2022, 470–477. [Google Scholar] [CrossRef] [Scilit]
  14. Kim, S.H.; Yoon, H.; Min, T.; Han, B.; Lim, S.; Park, J. Carbon dioxide utilization in lithium carbonate precipitation: A short review. Environ. Eng. Res. 2023, 29, 230553. [Google Scholar] [CrossRef] [Scilit]
  15. Tian, Y.; Zeng, G.; Rutt, A.; Shi, T.; Kim, H.; Wang, J.; Koettgen, J.; Sun, Y.; Ouyang, B.; Chen, T.; et al. Promises and Challenges of Next-Generation ‘Beyond Li-ion’ Batteries for Electric Vehicles and Grid Decarbonization. Chem. Rev. 2020, 121, 1623–1669. [Google Scholar] [CrossRef] [Scilit]
  16. Kebir, N.; Leonard, A.; Downey, M.; Jones, B.; Rabie, K.; Bhagavathy, S.M.; Hirmer, S.A. Second-life battery systems for affordable energy access in Kenyan primary schools. Sci. Rep. 2023, 13, 1374. [Google Scholar] [CrossRef] [Scilit]
  17. Hasan, M.; Haque, R.; Jahirul, M.; Rasul, M.; Fattah, I.; Hassan, N.; Mofijur, M. Advancing energy storage: The future trajectory of lithium-ion battery technologies. J. Energy Storage 2025, 120, 116511. [Google Scholar] [CrossRef] [Scilit]
  18. Sepulveda, N.A.; Jenkins, J.; Edington, A.; Mallapragada, D.S.; Lester, R.K. The design space for long-duration energy storage in decarbonized power systems. Nat. Energy 2021, 6, 506–516. [Google Scholar] [CrossRef] [Scilit]
  19. Nedjalkov, A.; Meyer, J.C.; Göken, H.; Reimer, M.V.; Schade, W. Blueprint and Implementation of Rural Stand-Alone Power Grids with Second-Life Lithium Ion Vehicle Traction Battery Systems for Resilient Energy Supply of Tropical or Remote Regions. Materials 2019, 12, 2642. [Google Scholar] [CrossRef] [Scilit]
  20. Pokhriyal, A.; Rueda-García, D.; Gómez-Romero, P. To flow or not to flow. A perspective on large-scale stationary electrochemical energy storage. Sustain. Energy Fuels 2023, 7, 5473–5482. [Google Scholar] [CrossRef] [Scilit]
  21. Lota, G.; Graś-Ligocka, M.; Kolanowski, Ł.; Lota, K. Flow Batteries: Recent Advancement and Challenges. In Handbook of Energy Materials; Springer: Singapore, 2022; pp. 343–363. [Google Scholar] [CrossRef] [Scilit]
  22. Arévalo-Cid, P.; Dias, P.; Mendes, A.; Azevedo, J. Redox flow batteries: A new frontier on energy storage. Sustain. Energy Fuels 2021, 5, 5366–5419. [Google Scholar] [CrossRef] [Scilit]
  23. Zhou, X.; Zhao, T.; An, L.; Zeng, Y.K.; Wei, L. Critical transport issues for improving the performance of aqueous redox flow batteries. J. Power Sources 2016, 339, 1–12. [Google Scholar] [CrossRef] [Scilit]
  24. Weber, A.Z.; Mench, M.M.; Meyers, J.P.; Ross, P.N.; Gostick, J.T.; Liu, Q. Redox flow batteries: A review. J. Appl. Electrochem. 2011, 41, 1137–1164. [Google Scholar] [CrossRef] [Scilit]
  25. Shoaib, M.; Vallayil, P.; Jaiswal, N.; Suba, P.I.V.; Sankararaman, S.; Ramanujam, K.; Thangadurai, V. Advances in Redox Flow Batteries—A Comprehensive Review on Inorganic and Organic Electrolytes and Engineering Perspectives. Adv. Energy Mater. 2024, 14, 2400721. [Google Scholar] [CrossRef] [Scilit]
  26. Muñoz-Perales, V.; Berling, S.; García-Quismondo, E.; García-Salaberri, P.A.; Palma, J.; Vera, M.; Ibáñez, S.E. Investigating the Effects of Operation Variables on All-Vanadium Redox Flow Batteries Through an Advanced Unit-Cell Model. J. Electrochem. Soc. 2022, 169, 100522. [Google Scholar] [CrossRef] [Scilit]
  27. Luo, J.; Hu, B.; Hu, M.; Zhao, Y.; Liu, T. Status and Prospects of Organic Redox Flow Batteries toward Sustainable Energy Storage. ACS Energy Lett. 2019, 4, 2220–2240. [Google Scholar] [CrossRef] [Scilit]
  28. Holland-Cunz, M.V.; Cording, F.; Friedl, J.; Stimming, U. Redox flow batteries—Concepts and chemistries for cost-effective energy storage. Front. Energy 2018, 12, 198–224. [Google Scholar] [CrossRef] [Scilit]
  29. Hoffmeyer, D. Organic Redox Flow Batteries: Active Materials and Reactor Performance. Research Portal Denmark. Ph.D. Thesis, Technical University of Denmark, Kongens Lyngby, Denmark, January 2021; p. 175. Available online: https://local.forskningsportal.dk/local/dki-cgi/ws/cris-link?src=dtu&id=dtu-6f1718ce-3d77-4b62-98c6-dd27d4af4448&ti=Organic%20Redox%20Flow%20Batteries%20%3A%20Active%20Materials%20and%20Reactor%20Performance (accessed on 15 July 2025).
  30. Tang, L.; Leung, P.; Xu, Q.; Mohamed, M.R.; Dai, S.; Zhu, X.; Flox, C.; Shah, A.A. Future perspective on redox flow batteries: Aqueous versus nonaqueous electrolytes. Curr. Opin. Chem. Eng. 2022, 37, 100833. [Google Scholar] [CrossRef] [Scilit]
  31. Leung, P.; Li, X.; de León, C.P.; Berlouis, L.E.A.; Low, C.T.J.; Walsh, F.C. Progress in redox flow batteries, remaining challenges and their applications in energy storage. RSC Adv. 2012, 2, 10125–10156. [Google Scholar] [CrossRef] [Scilit]
  32. Jett, B. Organic Redox Flow Batteries: Investigation and Mitigation of Crossover in Non-Aqueous Systems and Adaptation of Cyclopropenium Catholytes for Aqueous Media. Ph.D. Thesis, University of Michigan, Ann Arbor, MI, USA, 2024. [Google Scholar] [CrossRef]
  33. Chen, R.; Kim, S.; Chang, Z. Redox Flow Batteries: Fundamentals and Applications. In InTech eBooks; InTechOpen: London, UK, 2017. [Google Scholar] [CrossRef] [Scilit]
  34. Sánchez-Díez, E.; Ventosa, E.; Guarnieri, M.; Trovò, A.; Flox, C.; Marcilla, R.; Soavi, F.; Mazur, P.; Aranzabe, E.; Ferret, R. Redox flow batteries: Status and perspective towards sustainable stationary energy storage. J. Power Sources 2020, 481, 228804. [Google Scholar] [CrossRef] [Scilit]
  35. Sharmoukh, W. Redox flow batteries as energy storage systems: Materials, viability, and industrial applications. RSC Adv. 2025, 15, 10106–10143. [Google Scholar] [CrossRef] [Scilit]
  36. Pan, F.; Wang, Q. Redox Species of Redox Flow Batteries: A Review. Molecules 2015, 20, 20499–20517. [Google Scholar] [CrossRef] [Scilit]
  37. Buchanan, C. Characterizing the Ce3+/Ce4+ Chemistry for Use in Redox Flow Battery Applications. Ph.D. Thesis, University of Michigan, Ann Arbor, MI, USA, 2022. [Google Scholar] [CrossRef]
  38. Skyllas-Kazacos, M. Review—Highlights of UNSW All-Vanadium Redox Battery Development: 1983 to Present. J. Electrochem. Soc. 2022, 169, 70513. [Google Scholar] [CrossRef] [Scilit]
  39. Skyllas-Kazacos, M.; Kazacos, G.; Poon, G.; Verseema, H. Recent advances with UNSW vanadium-based redox flow batteries. Int. J. Energy Res. 2009, 34, 182. [Google Scholar] [CrossRef] [Scilit]
  40. Culcasi, A.; Zaffora, A.; Gurreri, L.; Cipollina, A.; Tamburini, A.; Micale, G. On the Modelling of an Acid/Base Flow Battery: An Innovative Electrical Energy Storage Device Based on pH and Salinity Gradients. Appl. Energy 2020, 277, 115576. [Google Scholar] [CrossRef] [Scilit]
  41. van Egmond, W.J.; Saakes, M.; Porada, S.; Meuwissen, T.; Buisman, C.J.N.; Hamelers, H.V.M. The concentration gradient flow battery as electricity storage system: Technology potential and energy dissipation. J. Power Sources 2016, 325, 129–139. [Google Scholar] [CrossRef] [Scilit]
  42. Bock, R.; Kleinsteinberg, B.; Selnes-Volseth, B.; Burheim, O.S. A Novel Iron Chloride Red-Ox Concentration Flow Cell Battery (ICFB) Concept; Power and Electrode Optimization. Energies 2021, 14, 1109. [Google Scholar] [CrossRef] [Scilit]
  43. Li, W.; Zheng, J.; Hu, B.; Fu, H.-C.; Hu, M.; Veyssal, A.; Zhao, Y.; He, J.-H.; Liu, T.L.; Ho-Baillie, A.; et al. High-performance solar flow battery powered by a perovskite/silicon tandem solar cell. Nat. Mater. 2020, 19, 1326–1331. [Google Scholar] [CrossRef] [Scilit]
  44. Kim, J.; Akhtar, T.; Liu, Y.; Smirnov, V.; Kim, H.; In, S.-I.; Han, D.-H.; Bae, D. A 25 cm2 single Si-based solar redox flow battery with aqueous iodine-bromine redox couples. J. Power Sources 2025, 644, 237045. [Google Scholar] [CrossRef] [Scilit]
  45. Zhang, Z.; Lü, P.; Zhao, T.; Su, H.; Xu, Q. Improving Performance of an Integrated Solar Flow Battery by Cr- and Cu-Doped TiO2 Photoelectrodes. Molecules 2022, 28, 171. [Google Scholar] [CrossRef] [Scilit]
  46. Lü, P.; Leung, P.; Su, H.; Yang, W.; Xu, Q. Materials, performance, and system design for integrated solar flow batteries—A mini review. Appl. Energy 2020, 282, 116210. [Google Scholar] [CrossRef] [Scilit]
  47. Fu, H.-C.; Li, W.; Yang, Y.; Lin, C.-H.; Veyssal, A.; He, J.-H.; Jin, S. An efficient and stable solar flow battery enabled by a single-junction GaAs photoelectrode. Nat. Commun. 2021, 12, 156. [Google Scholar] [CrossRef] [Scilit]
  48. Sekretaryova, A.N.; Vagin, M.; Volkov, A.V.; Zozoulenko, I.; Eriksson, M. Evaluation of the Electrochemically Active Surface Area of Microelectrodes by Capacitive and Faradaic Currents. ChemElectroChem 2019, 6, 4411–4417. [Google Scholar] [CrossRef] [Scilit]
  49. Kumar, C.S.V.A.; Tübke, J.; Pinkwart, K.; Noack, J. A Multi-Parameter Analysis of Iron/Iron Redox Flow Batteries: Effects of Operating Conditions on Electrochemical Performance. Energy Adv. 2025, 4, 1179–1200. [Google Scholar] [CrossRef] [Scilit]
  50. Jiménez, F.; González, J.R.; García-Torres, F.; Caballero, Á.; Lara-Raya, F.R. A novel testing equipment based on Arduino and LabVIEW for electrochemical performance studies on experimental cells: Evaluation in lithium-sulfur technology. Measurement 2023, 224, 113922. [Google Scholar] [CrossRef] [Scilit]
  51. He, R.; Xie, W.; Wu, B.; Brandon, N.P.; Liu, X.; Li, X.; Yang, S. Towards interactional management for power batteries of electric vehicles. RSC Adv. 2023, 13, 2036–2056. [Google Scholar] [CrossRef] [Scilit] [PubMed]
  52. Kwabi, D.G.; Ji, Y.; Aziz, M.J. Electrolyte Lifetime in Aqueous Organic Redox Flow Batteries: A Critical Review. Chem. Rev. 2020, 120, 6467–6489. [Google Scholar] [CrossRef] [Scilit] [PubMed]
  53. Davies, T.J.; Tummino, J.J. High-performance vanadium redox flow batteries with graphite felt electrodes. C 2018, 4, 8. [Google Scholar] [CrossRef] [Scilit]
  54. Liu, X.; Li, T.; Yuan, Z.; Li, X. Low-cost all-iron flow battery with high performance towards long-duration energy storage. J. Energy Chem. 2022, 73, 445–451. [Google Scholar] [CrossRef] [Scilit]
  55. Van Egmond, W.J.; Saakes, M.; Noor, I.; Porada, S.; Buisman, C.J.N.; Hamelers, H.V.M. Performance of an environmentally benign acid base flow battery at high energy density. Int. J. Energy Res. 2018, 42, 1524–1535. [Google Scholar] [CrossRef] [Scilit]
Figure 1. Schematic representation of the FeCl-CFB unit cell.
Energies 19 01532 g001
Figure 2. Schematic diagram of the FeCl-CFB integrated with the photovoltaic system.
Energies 19 01532 g002
Figure 3. Polarization and power density curves of the FeCl-CFB under different charging conditions: (a) J–V and J–P curves used to determine the optimal external resistance; (b) comparison of power density as a function of current density for cells charged using a solar panel and a power supply.
Energies 19 01532 g003
Figure 4. Current density profiles of the FeCl-CFB during solar-driven operation: (a) discharge current density over 25 consecutive cycles; (b) charge current density over 25 consecutive cycles.
Energies 19 01532 g004
Figure 5. Electrochemical performance and state-of-charge analysis of the FeCl-CFB during solar-driven operation: (a) evolution of the state of charge (SOC) over 25 cycles, showing SOC at the start of discharge, at the end of discharge, and at the end of charge; (b) power density as a function of current density during discharge at different initial SOC levels; (c) power density as a function of current density during charge at different final SOC levels; (d) coulombic and energy efficiencies over 25 consecutive charge–discharge cycles.
Energies 19 01532 g005
Figure 6. State of health (SOH) assessment of the FeCl-CFB based on power density curves: comparison of power density as a function of current density obtained during the initial characterization (SOH ≈ 100%) and after 25 solar-driven charge–discharge cycles (SOH ≈ 59%).
Energies 19 01532 g006
Figure 7. Cyclic voltammograms of the FeCl-CFB electrolytes at different stages of operation: (a) solution A and (b) solution B, showing freshly prepared electrolytes and samples taken after the first and 25th charge–discharge cycles.
Energies 19 01532 g007
Table 1. Composition of the solutions used in the battery charged to 99.95%.
SolutionVolume (mL)FeCl3 (M)FeCl2 (M)NaCl (M)
A800.00050.99951.0
B800.99950.00051.0
Table 2. Initial electrochemical performance of the cell with two types of electrodes.
ElectrodeV (V)J (A/m2)Pd (W/m2)
Carbon felt0.2768.006.31
Toray paper0.3019.200.66
Disclaimer/Publisher’s Note: The statements, opinions and data contained in all publications are solely those of the individual author(s) and contributor(s) and not of MDPI and/or the editor(s). MDPI and/or the editor(s) disclaim responsibility for any injury to people or property resulting from any ideas, methods, instructions or products referred to in the content.