Article

Establishment and Optimization of Stator Bar End Model Based on SHO-RBF

Key Laboratory of Engineering Dielectrics and Its Application, Ministry of Education, College of Electrical and Electronic Engineering, Harbin University of Science and Technology, Harbin 150080, China
*
Author to whom correspondence should be addressed.
Energies 2026, 19(6), 1476; https://doi.org/10.3390/en19061476
Submission received: 23 January 2026 / Revised: 7 March 2026 / Accepted: 13 March 2026 / Published: 15 March 2026

Abstract

To establish the complex functional relationship between the stator bar end structure and the maximum electric field strength, and to optimize the anti-corona structure, an optimization model for the stator bar end based on the Seahorse Optimization algorithm—Radial Basis Function (SHO-RBF) neural network is proposed in this paper. The RBF neural network is employed to establish the complex relationship between the maximum electric field strength at the stator bar end and the anti-corona structure parameters. The SHO is introduced to find the optimal anti-corona structure at the stator bar end structure. A simulation model of the stator bar end is developed, and 30 sets of simulation data are collected for training and optimization purposes. The relationship between the stator bar end structure and the maximum electric field strength is established, and an optimized scheme comprising six groups of anti-corona structures is developed. The feasibility of the proposed design is validated through simulation calculations. Compared to manually adjusting parameters individually within the simulation model, this approach offers a significant advantage in terms of computational efficiency and speed.

1. Introduction

During the operation of a generator, its stability largely depends on the performance of the insulation. In most cases, motor failures are caused by insulation breakdown [1]. The electric field of large hydro-generators is mainly concentrated at the end of the stator bar, where partial discharge is highly likely to occur, resulting in insulation damage. Therefore, rational optimization of the insulation system at the stator bar end and homogenization of electric field intensity are top priorities for ensuring the stable operation of hydro-generators [2].
To establish the relationship between the end structure of stator bars and the maximum field strength, scholars at home and abroad have conducted extensive research. Chen Yihong from the Huazhong University of Science and Technology built a discharge withstand voltage test platform for generator stator winding ends based on the IEC 60270 system, and fabricated four typical discharge defect models for generator stator bar ends [3]. Yu Guang and Cheng Yujia established a stator bar model using the finite element analysis method and studied the calculation method of the electric field at the stator bar end [4]. However, although traditional finite element simulation is accurate, it requires refined modeling of complex insulation structures, with a single sample calculation taking up several hours, making it difficult to support joint optimization of more than ten-dimensional parameters. This contradiction was noted in a study published in IEEE Transactions on Industrial Electronics in 2022 [5]. Meanwhile, existing research has obvious limitations in simulating the electric field response of nonlinear and inhomogeneous anti-corona materials. A 2023 study in Energies pointed out that current models mostly assume uniform material parameters, which deviate significantly from the gradient conductivity characteristics of anti-corona layers in actual operation [6].
After clarifying the relationship between the end structure and the maximum field strength, the end insulation structure can be designed to homogenize the field strength and reduce partial discharge. Cheng et al. analyzed the characteristics and causes of corona at the stator winding end of a certain unit in the Xi luodu Hydropower Station, and proposed a corona treatment process for the stator end [7]. Li Minjie and Liu Xuandong established a multi-physics coupling model of electromagnetic force for the stator winding body based on the COMSOL Multiphysics finite element analysis software [8], and they proposed two stator end structure optimization schemes to adapt to deep peak shaving operation. However, these schemes are only applicable to specific unit structures and have not formed a general optimization framework that can be widely promoted.
The emergence of neural networks provides a new method for insulation structure optimization. Liu Liangwen and Hu Chunxuan used a Back Propagation (BP) neural network to train error samples of measured electric fields under different temperature and humidity environments. The results showed that compensating the measured values with the BP neural network can effectively reduce the electric field measurement error caused by the influence of temperature and humidity on wooden supports [9]. However, a 2024 study in Proceedings of the Institution of Mechanical Engineers pointed out that BP neural networks are prone to falling into local optima and have insufficient generalization ability for small sample datasets, resulting in a significant decline in prediction accuracy when dealing with the nonlinear characteristics of insulation materials [10]. Liu Fengshuo and Ji Shengchang proposed optimizing insulation structure parameters using the C-MOEA/D genetic algorithm based on non-dominated sorting and reference vectors [11], but this algorithm has a slow convergence speed in high-dimensional parameter spaces, and its optimization efficiency does not meet engineering requirements. At present, there is still a lack of research on using intelligent methods to establish the mapping relationship between the end structure of stator bars and the maximum field strength to realize efficient optimization of bar anti-corona structures [12].
To address the above research bottlenecks, this paper uses an RBF neural network to establish a complex nonlinear mapping relationship between the end structure of stator bars and the maximum field strength. Its global approximation characteristics can effectively avoid the problem of local optima. Meanwhile, the SHO algorithm is introduced to expand the dataset and perform global optimization, solving the problems of slow convergence and difficulty in high-dimensional optimization of traditional algorithms. Finally, an optimization model for the stator bar end of hydro-generators based on the SHO-RBF neural network is established to realize rapid and precise optimization of the anti-corona structure.

2. RBF Neural Network and SHO Optimization Algorithm

2.1. Radial Basis Function Neural Network

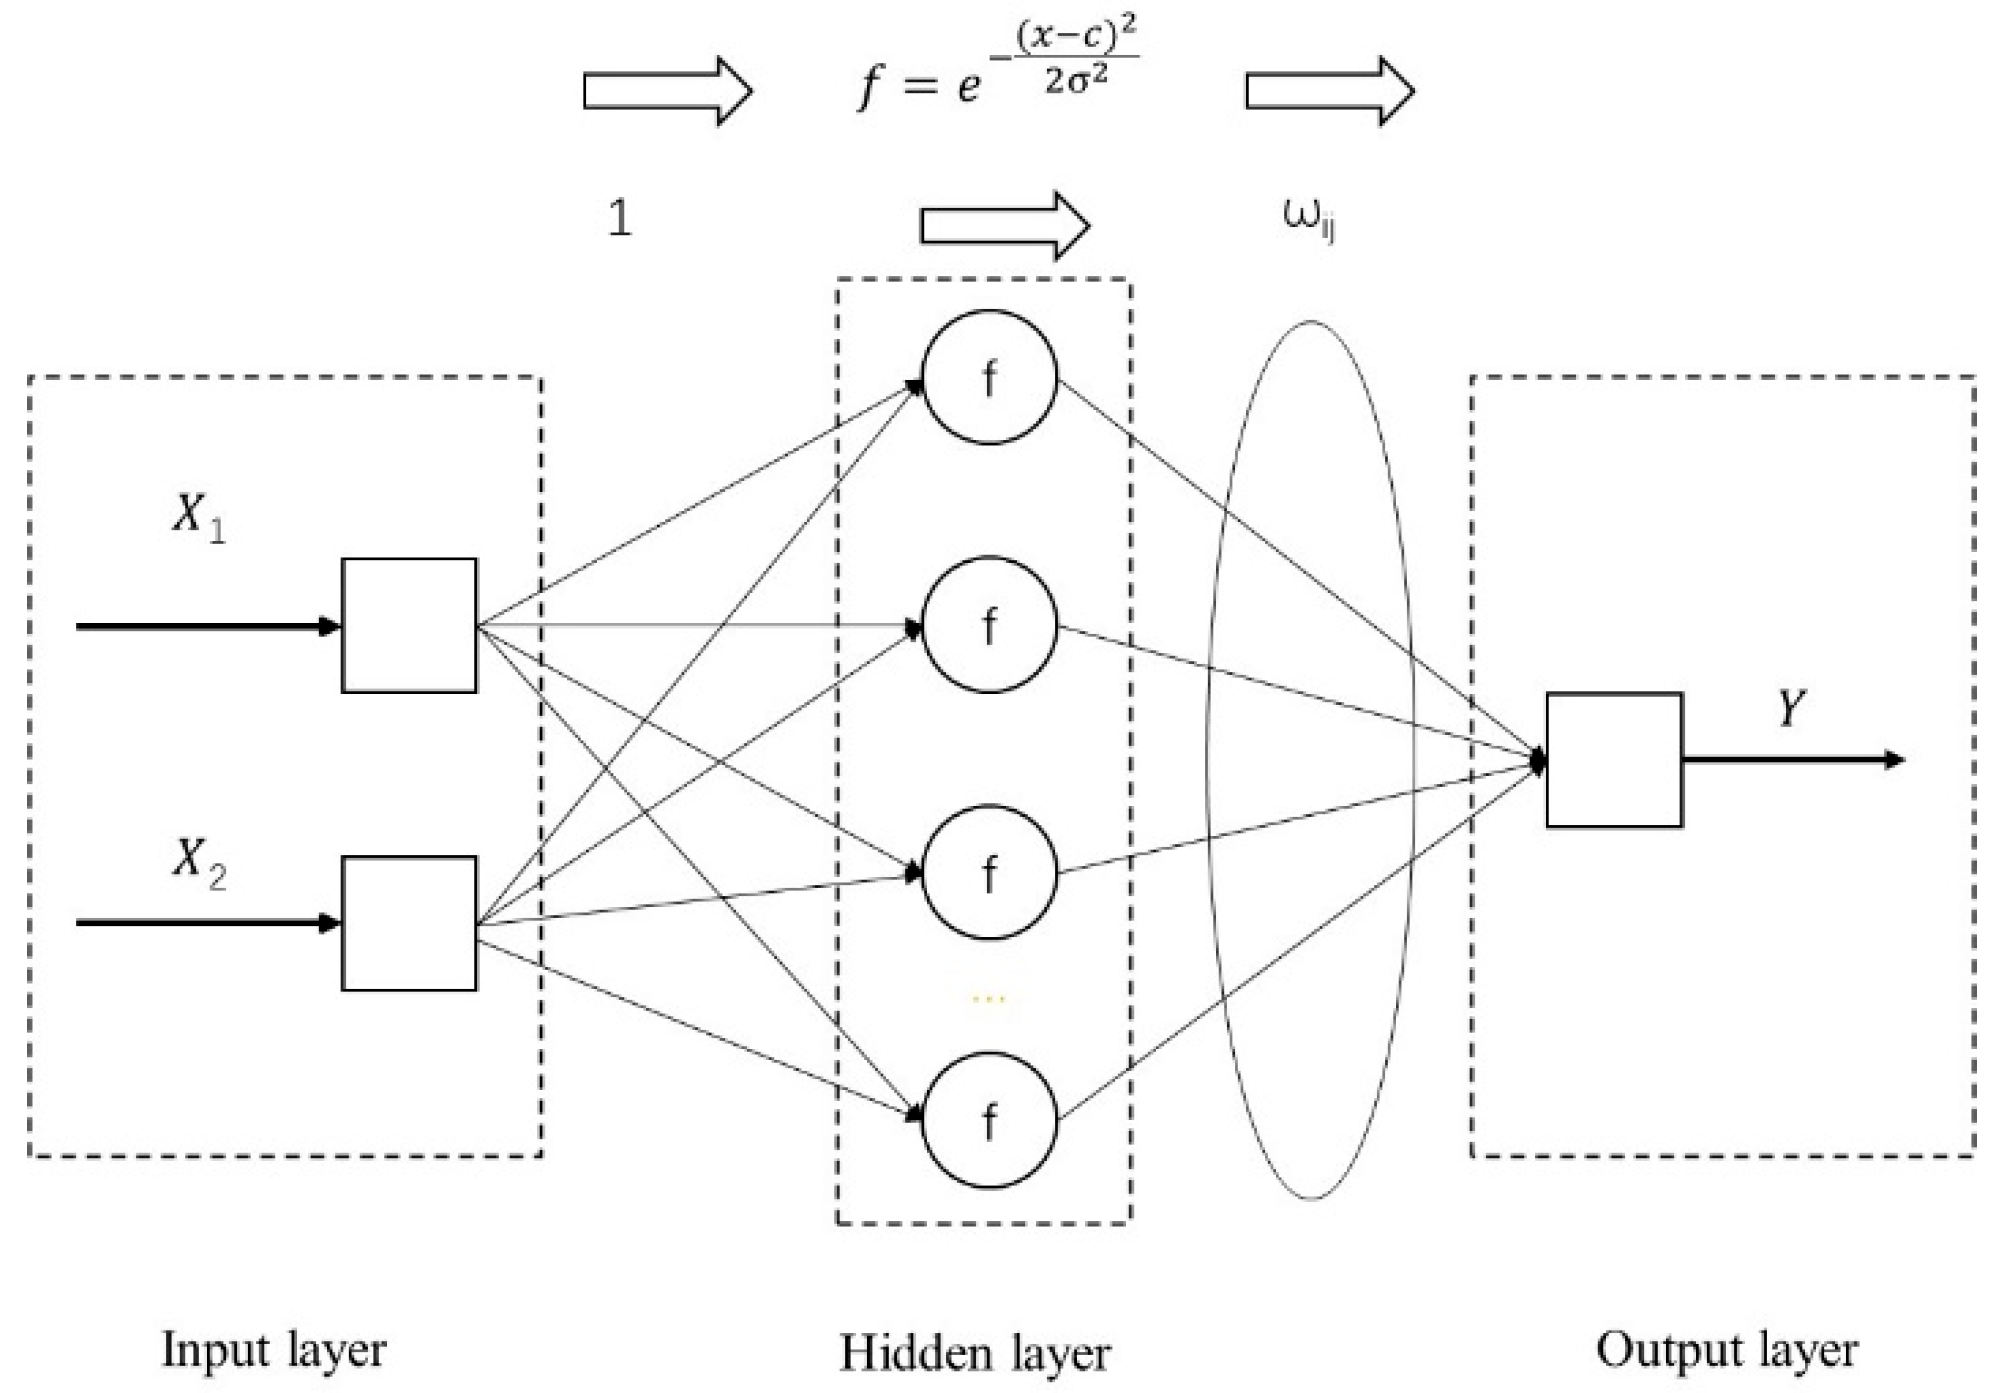
The RBF neural network is a type of feedforward neural network with unique performance characteristics. While the classic BP neural network attempts to “fit” a curve through continuous weight adjustments [13], the RBF neural network covers the entire space through the superposition of a series of “local responses” [14].
Its core idea originates from the interpolation theory in numerical analysis: mapping linearly inseparable data in a low-dimensional space to a high-dimensional space, thereby making it linearly separable [15].
The RBF neural network typically adopts a three-layer architecture, with each layer undertaking different linear and nonlinear transformation functions:
Input Layer: Composed of signal source nodes, it does not perform any operations and only transmits signals to the hidden layer.
Hidden Layer: The hidden layer is the core of the RBF spatial transformation. Nodes in the hidden layer perform nonlinear transformation on input signals through radial basis functions. They map the input space from a low-dimensional, linearly inseparable state to a high-dimensional feature space, thereby transforming a non-linearly separable problem in the original space into a linearly separable one in the high-dimensional space. It is characterized by a gradual increase in response when the signal approaches the center, and an exponential decay in response when the signal moves away from the center. The output of the hidden layer is the superposition of these response intensities [16].
Output Layer: Performs a linear weighted summation of the outputs of the hidden layer neurons to obtain the final result.
The working principle of the Radial Basis Function neural network is shown in Figure 1.
In the figure, f is a radial basis function, and its function value changes rapidly with the increase in the distance from the center point, which makes it able to capture the local characteristics of the data [17]. The most commonly used function is the Gaussian function, which is shown in Equation (1):
f ( x ) = exp x c 2 2 σ 2

2.2. Seahorse Optimization Algorithm

The Seahorse Optimization algorithm is an optimal solution method that simulates the behavior of the hippocampus in nature. According to the movement, predation, and reproduction behavior of the hippocampus, mathematical modeling is carried out to form the Seahorse Optimization algorithm [18]. Like most optimization algorithms, the Seahorse Optimization algorithm first needs to initialize the population: determine the number of hippocampus populations, the number of iterations, the element dimensions contained in the individual, and the fitness function.
The Seahorse Optimization algorithm simulates two kinds of movement behaviors of the hippocampus, which are accompanied by the movement of the ocean vortex and the Brownian motion accompanied by waves, representing global search and local development. According to the value of the parameter r 1 , the motion mode is selected [19]: taking r 1 = 0 as the critical point, when the random value rand (0, 1) of the normal distribution of hippocampal motion is on the right side of the critical point, the motion of the accompanying ocean vortex is carried out. When the random value is on the left side of the critical point, the Brownian motion of the accompanying ocean wave is carried out. The model is as follows (2):
X n e w 1 ( t + 1 ) = X i ( t ) + L e v y ( λ ) ( ( X e l i t e ( t ) X i ( t ) ) × x × y × z + X e l i t e ) , r 1 > 0 , X i ( t ) + r a n d × l × β t × ( X i ( t ) β t × X e l i t e ) , r 1 0 ,
Among them, X represents the hippocampus individual, X e l i t e represents the elite individual, and x = ρ × cos ( θ ) , y = ρ × sin ( θ ) , z = ρ × θ , ρ = u × e θ v , u = v = 0.05 , θ is a random value in [0, 2π]; levy (λ) denotes the Levy flight function [20], which is computed by Formula (3):
L e v y ( λ ) = s × ω × σ k 1 / λ
λ is a random number in [0, 2], s is a fixed constant 0.01, ω and k are random numbers in [0, 1],
σ = ( Γ ( 1 + λ ) × sin ( π λ / 2 ) Γ ( 1   +   λ 2 ) × λ × 2 ( λ 1 ) / 2 )
l is a constant coefficient; β t is the random walk coefficient of Brownian motion, and the calculation formula is Formula (5):
β t = 1 2 π exp { x 2 2 }
The mathematical formula for the predation behavior of the seahorse [21] is as follows (6):
X n e w 2 ( t + 1 ) = α × ( X e l i t e r a n d × X n e w 1 ( t ) ) + ( 1 α ) × X e l i t e , r 2 > 0.1 , ( 1 α ) × ( X n e w 1 ( t ) r a n d × X e l i t e ) + α × X n e w 1 ( t ) , r 2 0.1 ,
where r 2 is a random number in [0, 1].
Hippocampal reproductive behavior is divided into male and female, and the mathematical formula is as follows (7):
S e a h o r s e s F = X s o r t 2 ( 1 : N 2 ) S e a h o r s e s M = X s o r t 2 ( N 2 + 1 : N )
where X n e w 2 represents that X n e w 2 is arranged in ascending order of fitness. The Seahorse Optimization algorithm assumes that each pair of hippocampi only reproduces one offspring, and the calculation formula of the i-th offspring is Equation (8).
X i o f f s p r i n g = r 3 X i S e a h o r s e s F + ( 1 r 3 ) X i S e a h o r s e s F
where r 3 is a random number in [0, 1] and i is a positive integer in [1, N/2].

3. Optimization Model of Stator Bar End Structure Based on SHO-RBF Neural Network

3.1. Stator Bar End Model Based on RBF Neural Network

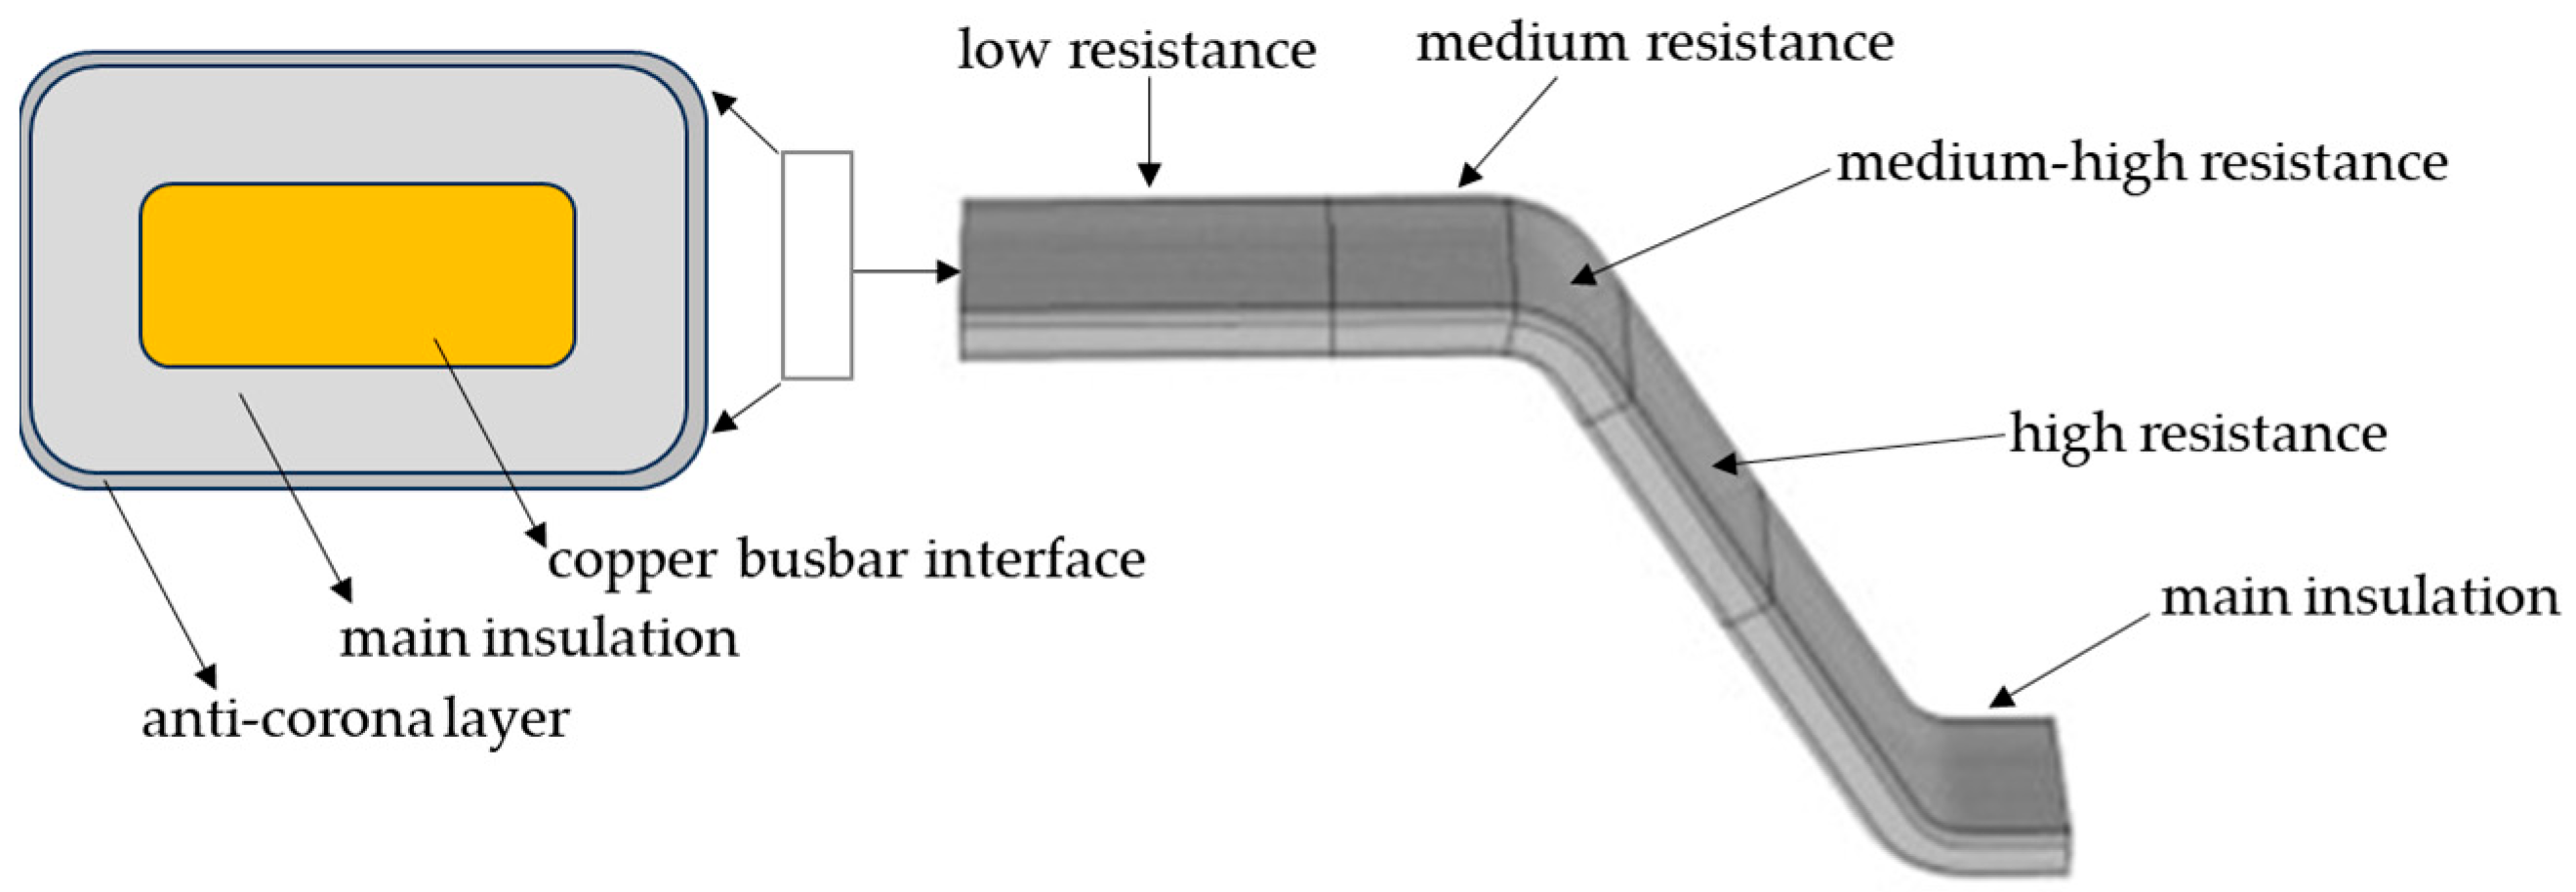
In order to obtain the electric field distribution data at the stator bar end, the COMSOL software is used to establish the geometric model of the stator end. The model of the end of the bar is shown in Figure 2. In the simulation model, the stator bar is completely enclosed by a cuboid air domain. To eliminate the influence of boundary truncation effects on the calculation results, an infinite element domain with a thickness of 10 mm is applied to the outer layer of the air domain, and the outermost boundary condition is defined as ground.
The main structural parameters are shown in Table 1 [22].
According to the actual properties of the material, manually input the basic parameter values such as electrical conductivity and nonlinear coefficient. The resistivity of the anti-corona material at the stator bar end exhibits nonlinear characteristics, i.e., the resistivity decreases with the increase in the electric field, and the expression of resistivity is shown in Equation (9):
ρ = ρ 0 exp ( β E )
The nonlinear resistance characteristics of Equation (9) are assigned to the anti-corona material, and the basic parameters of each material are listed in Table 2.
In the simulation model, the stator core is neglected, and the outer surface of the low-resistance anti-corona layer is set to ground. To calculate the electric field distribution at the stator bar end under maximum voltage, the rated voltage of the copper busbar is set to 24 / 3 2 kV with a frequency of 50 Hz. To better approximate the actual operating conditions, a certain volume of air domain is wrapped around the entire bar [23].
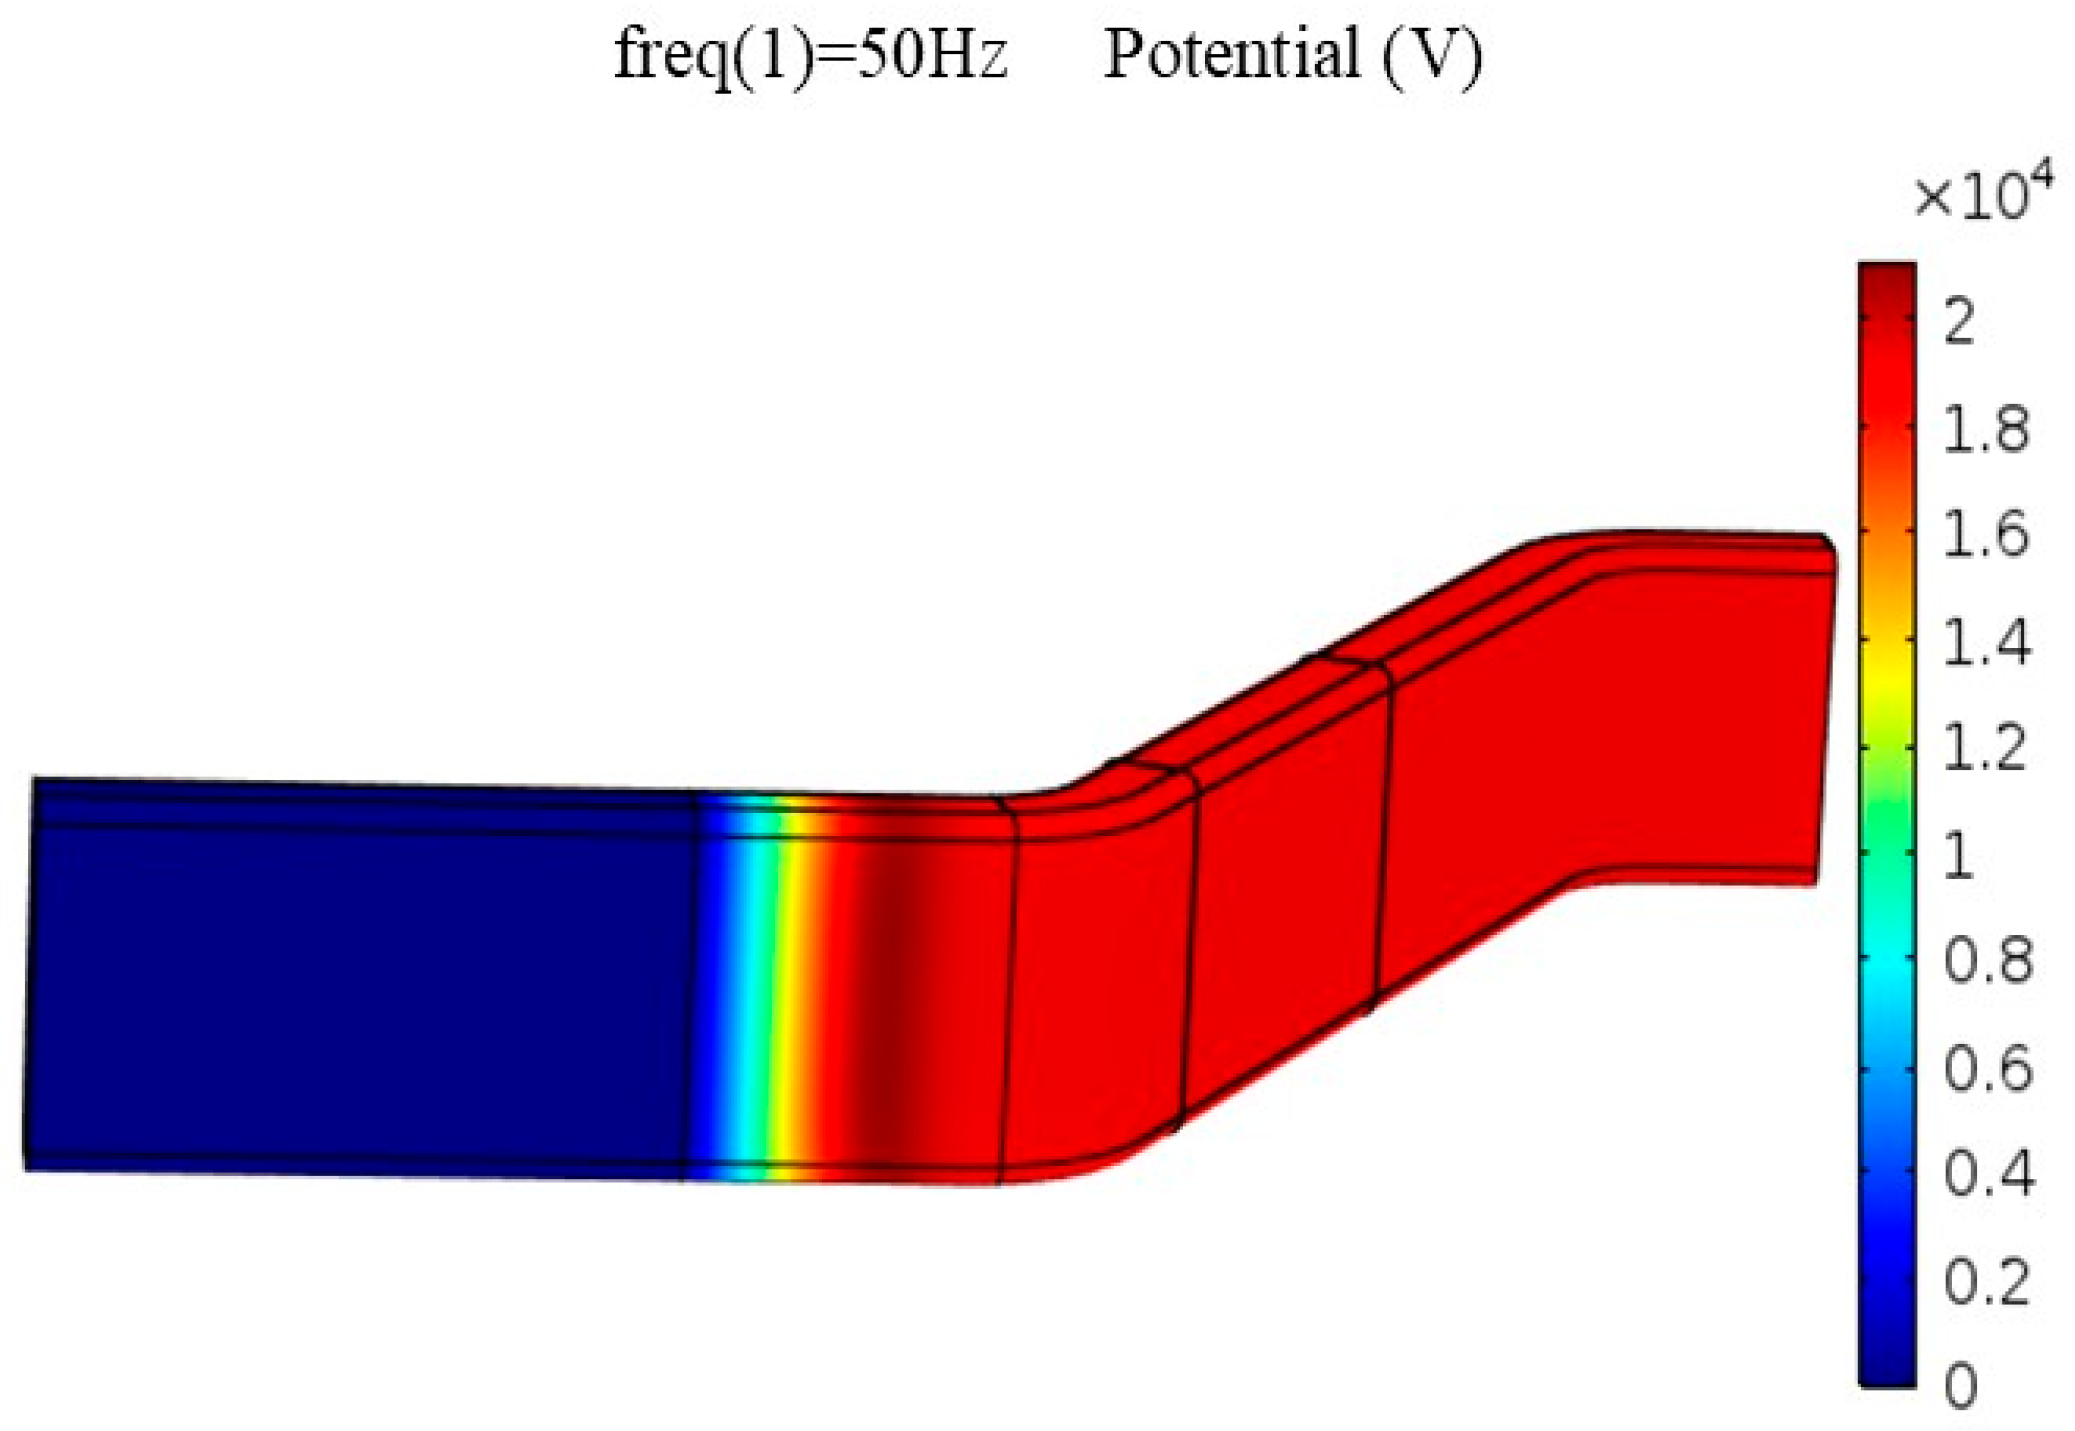
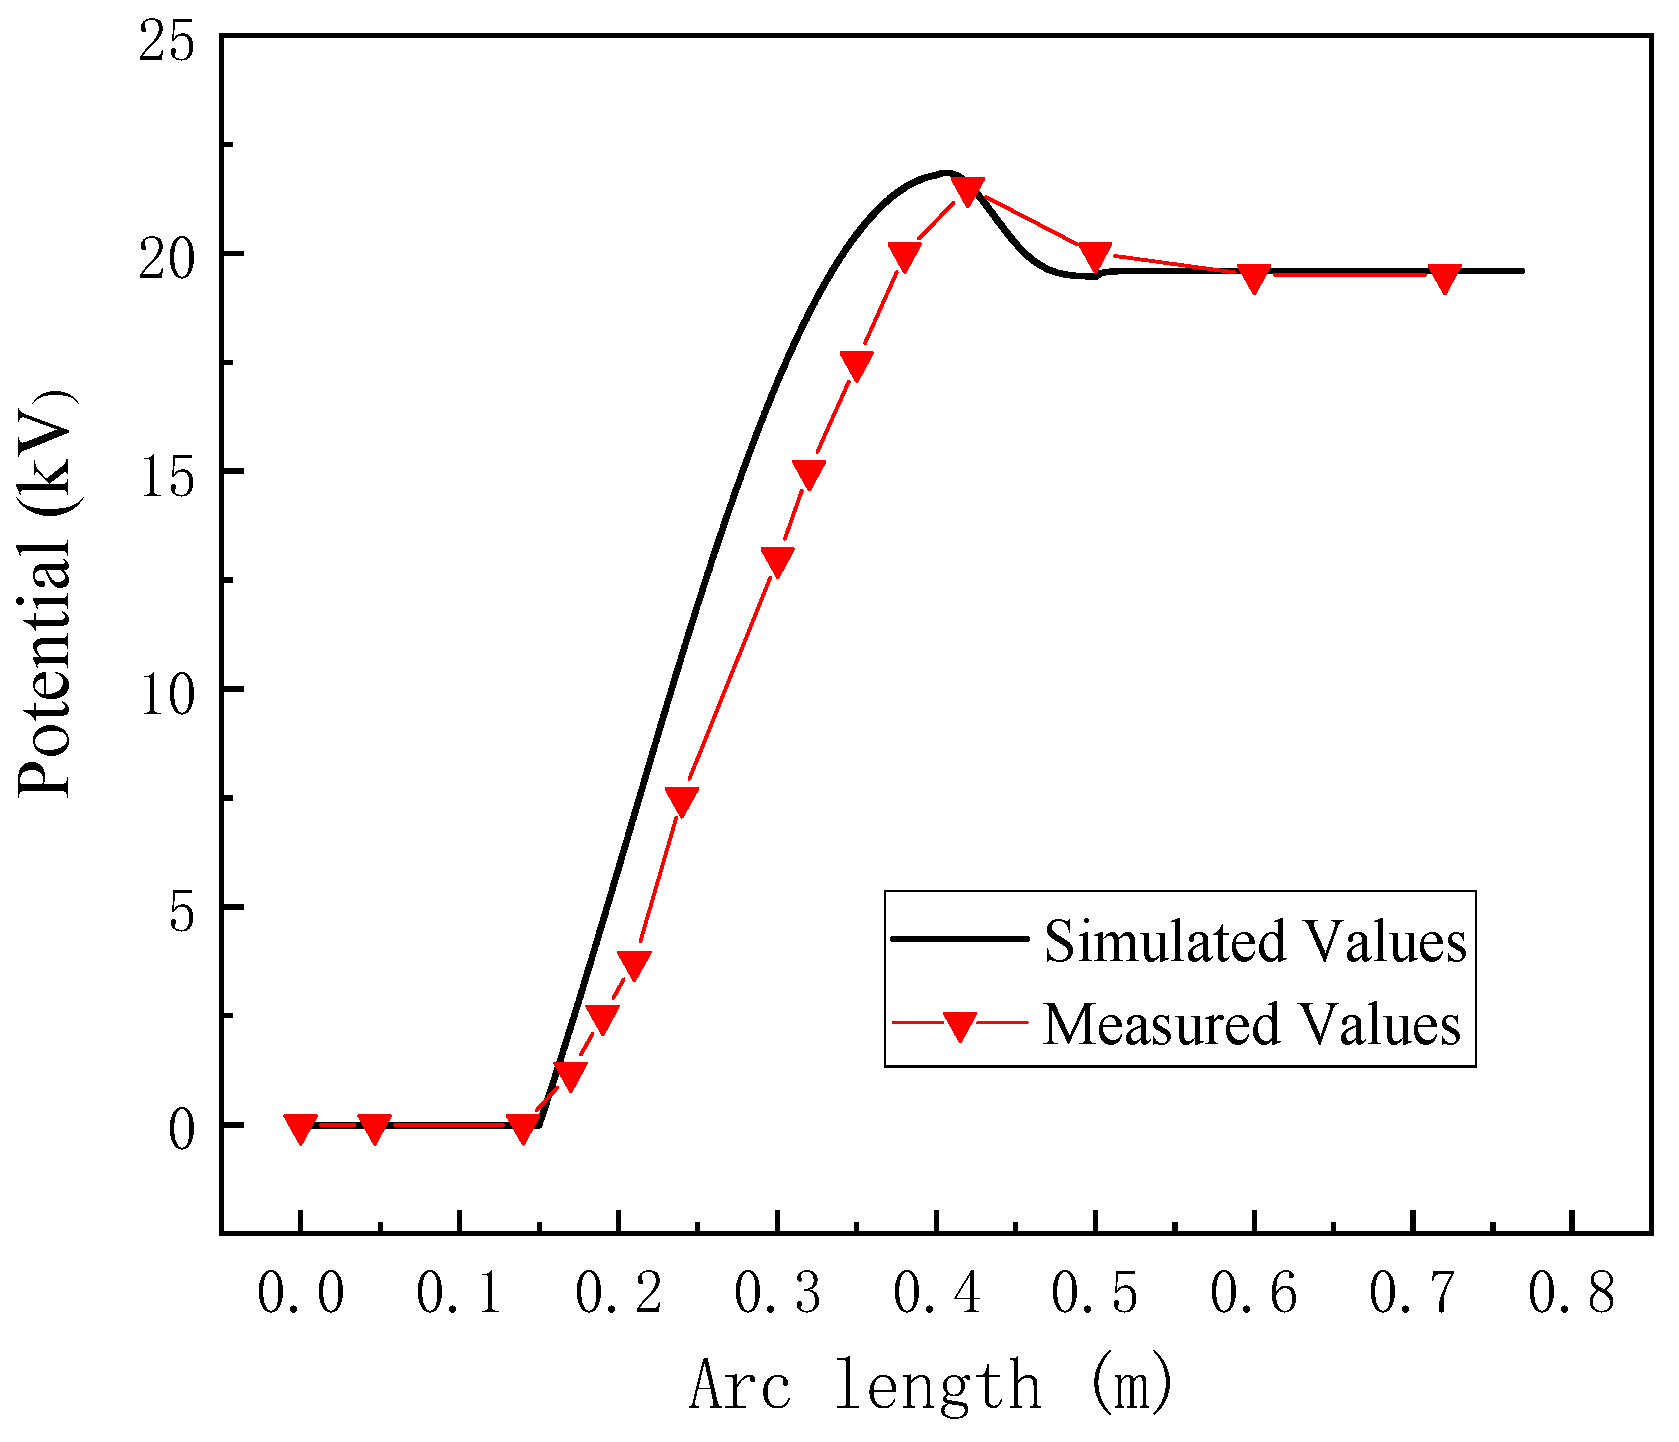
The potential distribution cloud diagram of the end model under rated voltage is plotted (Figure 3). To verify the accuracy of the simulation model, several potential test points are wound with copper wires on the surface of a bar with the same structural dimensions and insulation parameters. The test copper wire is in close contact with the surface of the stator bar, and the potential at each test point is measured sequentially by a high-voltage test probe. The test results are compared with the simulation results, as shown in Figure 4. It can be concluded from Figure 4 that the simulation results are basically consistent with the measured results, indicating that the results calculated by the simulation model are reliable.
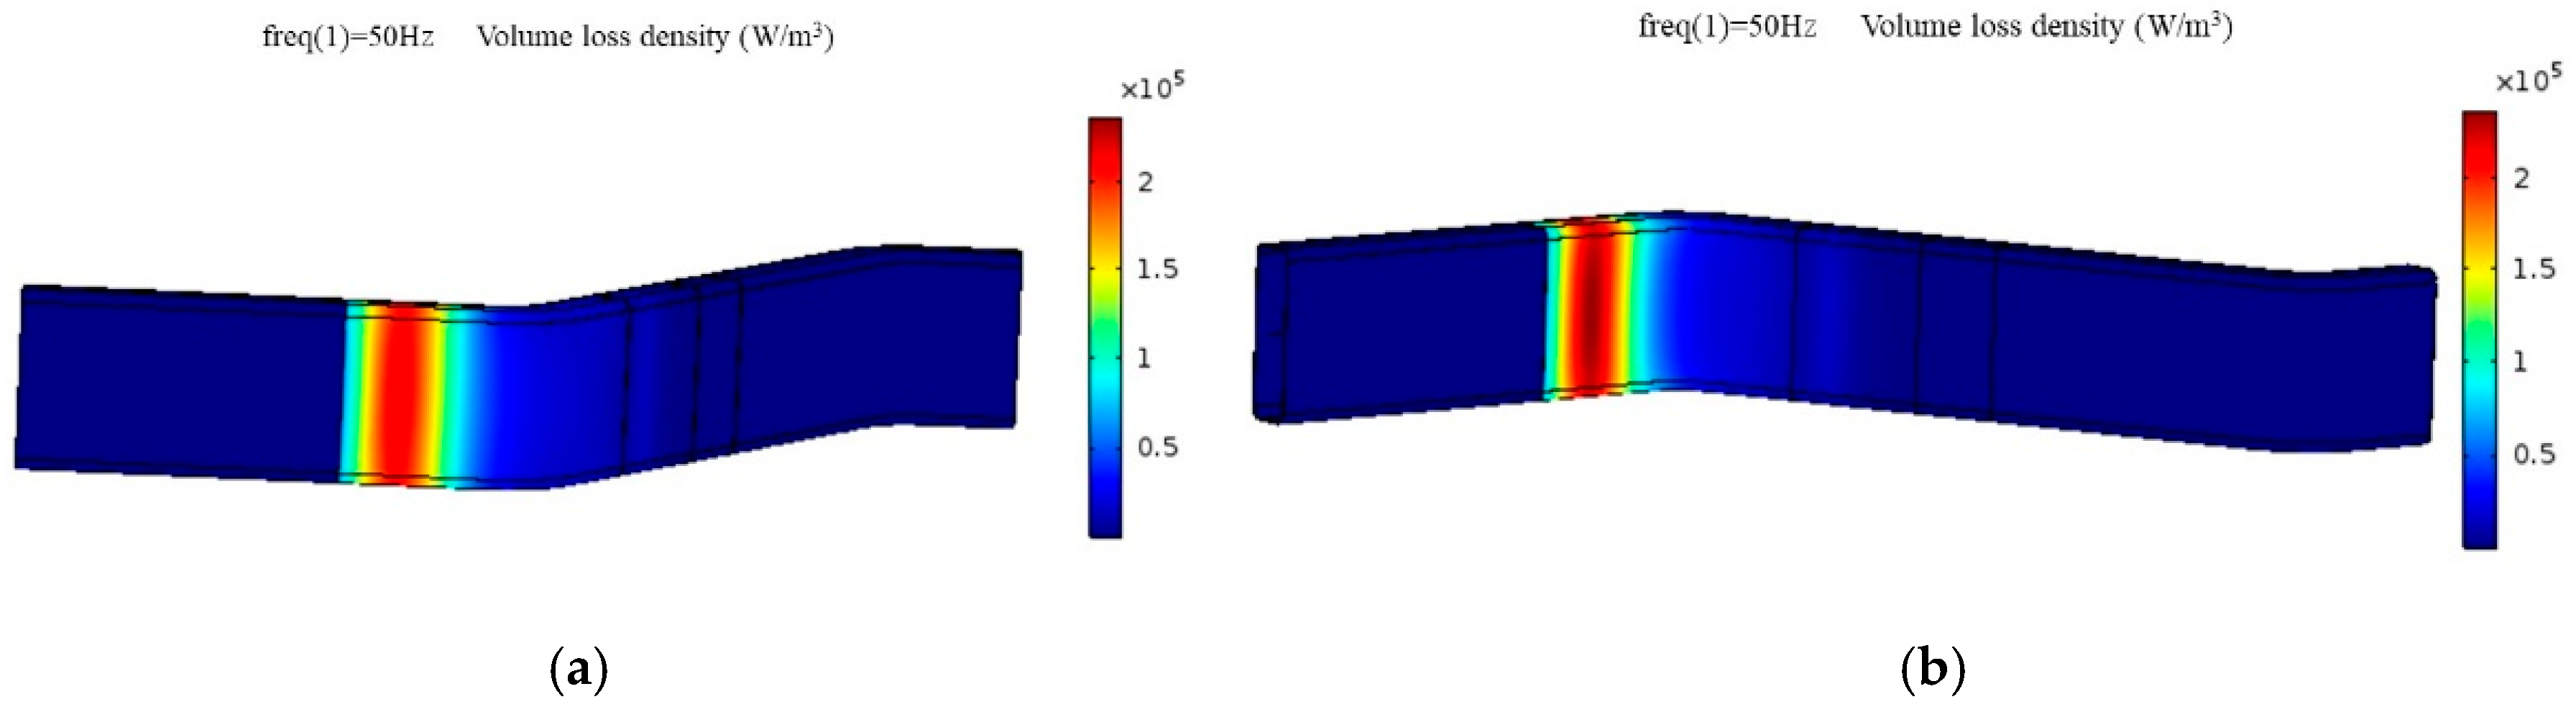
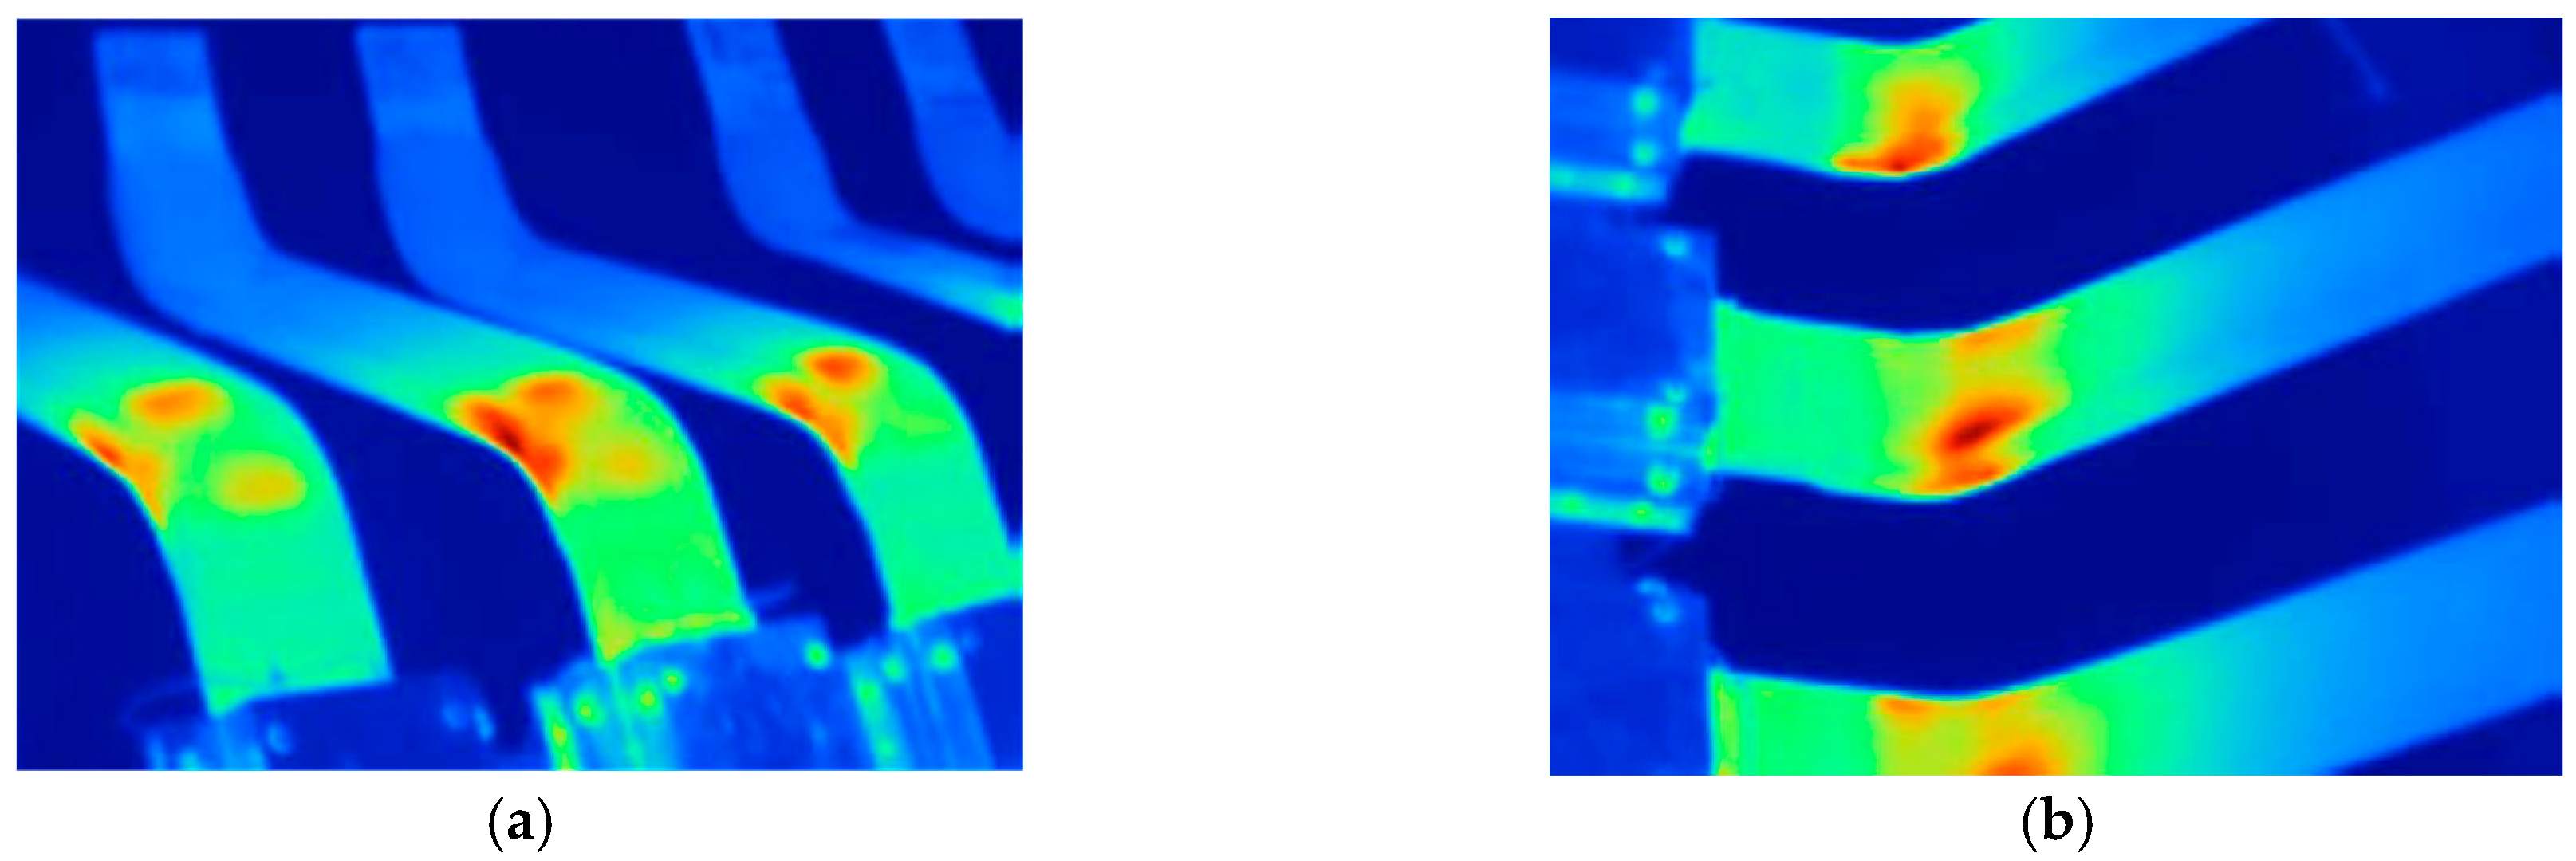
The simulation cloud diagram of side losses under rated voltage is shown in Figure 5, and the measured temperature distribution diagram of the motor bar is shown in Figure 6. Although Figure 6 only displays the qualitative characteristics of the hotspot distribution, it can be clearly observed that the areas of actual temperature rise align perfectly with the locations of concentrated loss calculated in the simulation. These results further verify the correctness of the end simulation model, and also provide a direct basis for using the loss density of the anti-corona layer as a structural optimization metric.
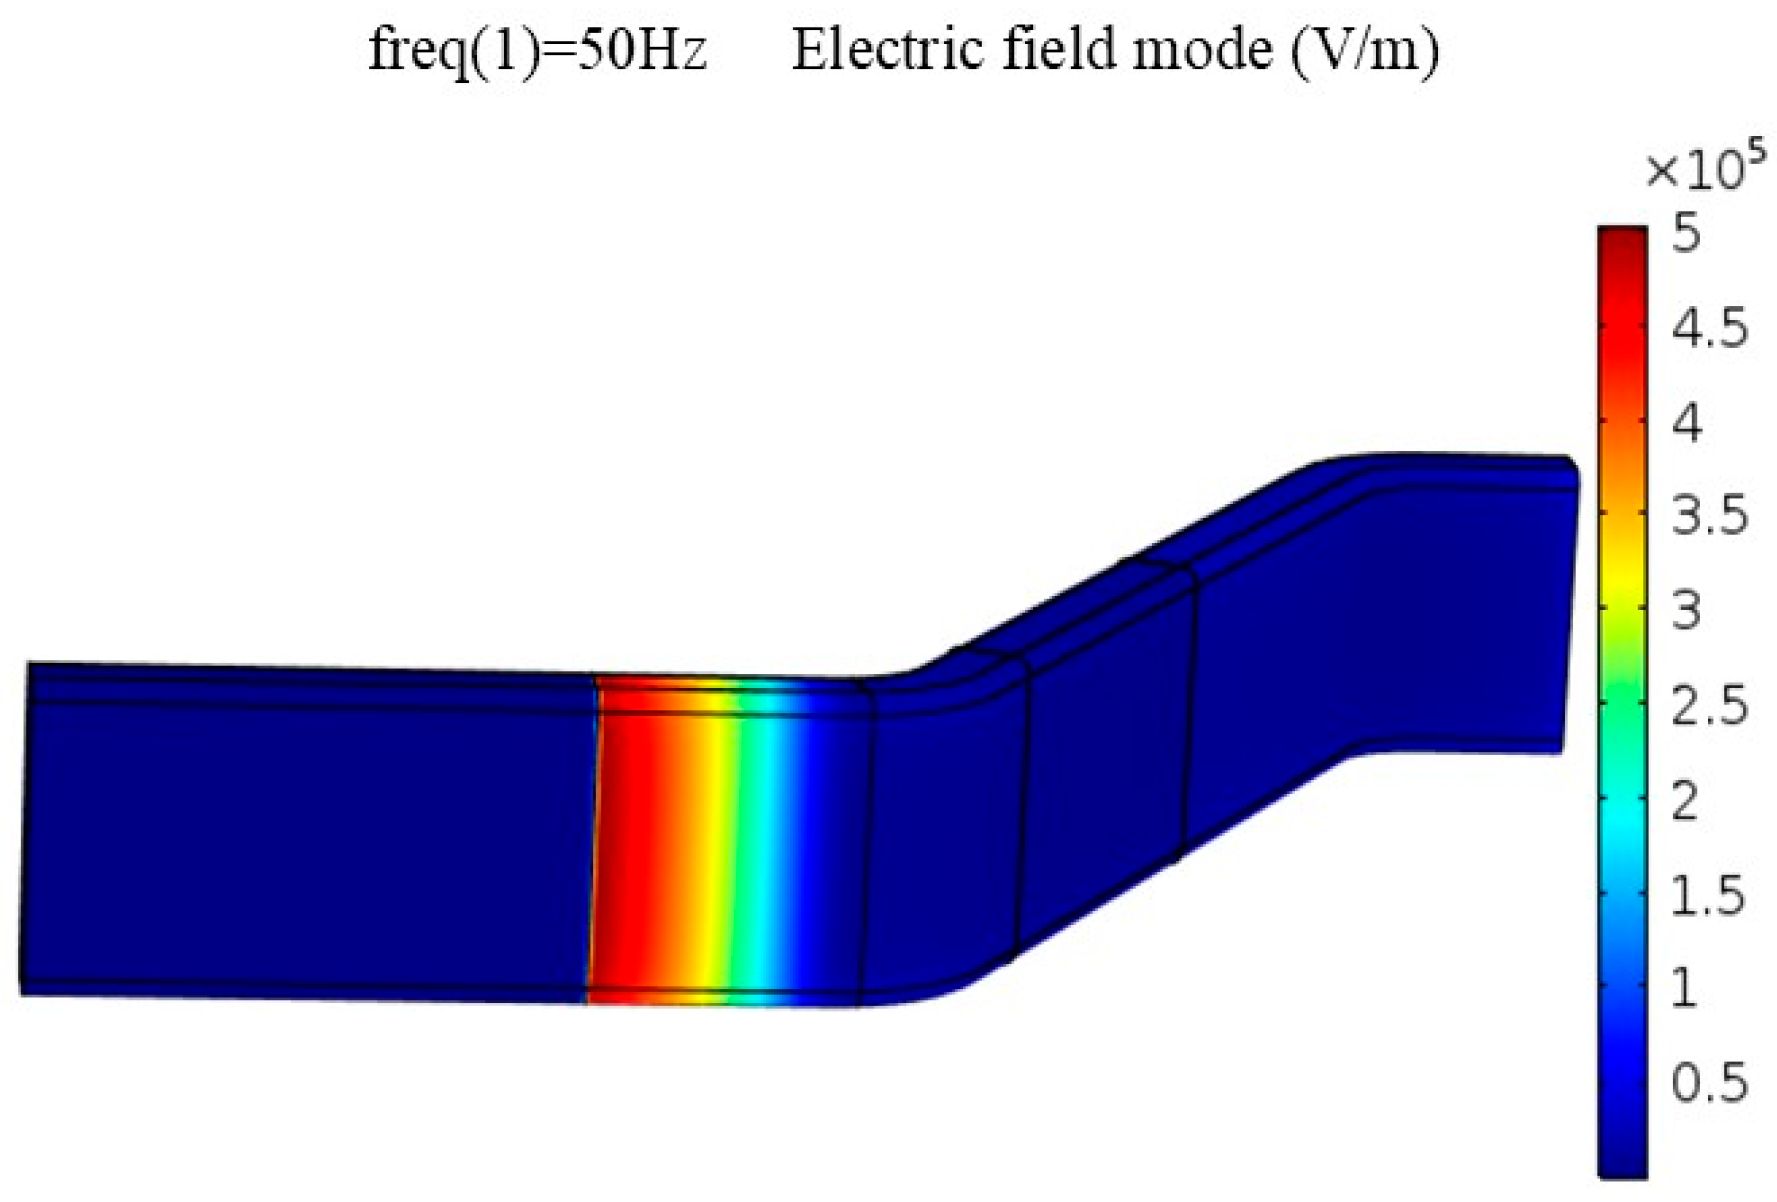
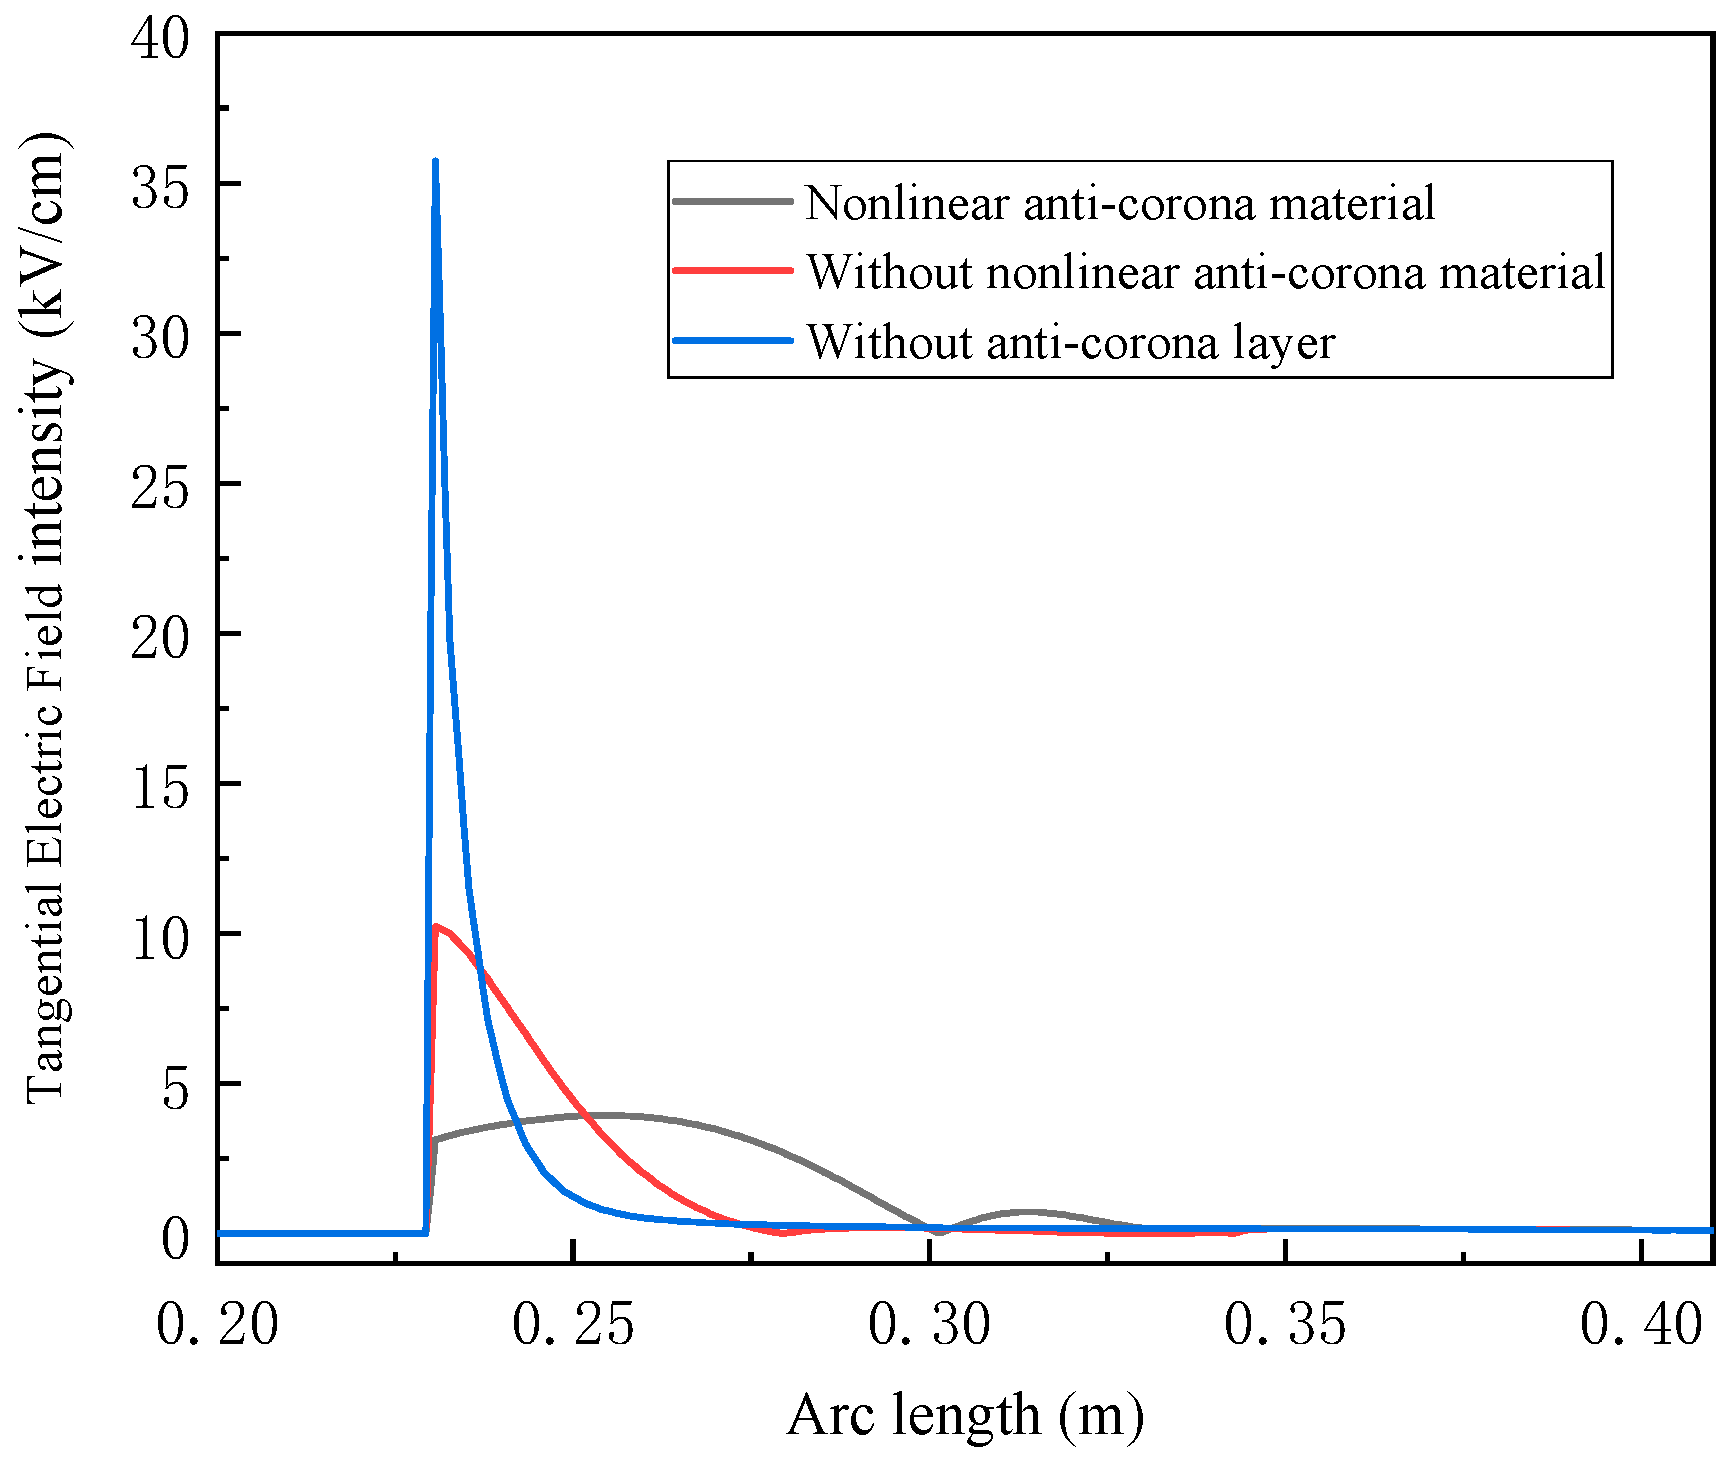
The cloud diagram of the electric field intensity distribution under rated voltage is shown in Figure 7. A curve graph of the electric field distribution along the bar direction was plotted and compared with the cases of non-anti-corona and linear anti-corona structures; the comparison results are shown in Figure 8. When nonlinear anti-corona materials are used, the maximum electric field is only 3.5 kV/cm. Compared with the non-anti-corona structure and linear anti-corona structure, the maximum tangential electric field intensity is reduced by 90% and 65%, respectively. This significantly improves the electric field distribution at the stator bar end and meets the anti-corona requirements.
It is verified that the simulation results are basically the same as the measurement results, indicating that the results calculated by the simulation model are reliable.
In this paper, the mathematical model of the anti-corona structure at the stator bar end is regarded as a multi-input single-output mapping relationship:
Y = f ( X )
In the formula, Y is the maximum tangential electric field intensity on the end surface of the stator bar, and X is the five factors that respond to the maximum tangential electric field intensity on the end surface of the stator bar, namely, medium resistance length ( L c p 2 ), medium and high resistance length ( L c p 3 ), medium group resistivity ( ρ 2 ), medium and high resistance resistivity ( ρ 3 ), and high resistance resistivity ( ρ 4 ).
  • Data preparation
Under the above conditions, the model simulation of the stator bar end was carried out. Among the various factors of the stator bar, there are five main factors affecting the maximum tangential electric field intensity on the end surface of the stator bar, namely, medium resistance length, medium and high resistance length, medium resistance resistivity, medium and high resistance resistivity, and high resistance resistivity [24]. Therefore, 30 sets of data in the simulation results are selected. Among them, 20 groups are training samples and 10 groups are test samples. The data are shown in Table 3.
2.
Data normalization.
In order to eliminate the dimensional effect and improve the prediction effect of the neural network, the data are normalized. In this paper, the Max–Min normalization method is used to process the data, and the data is processed in the range of [0, 1]. The principle of the normalization method is as follows (10):
X s t d = x x min x max x min
3.
Determination of network parameters
The error threshold of the RBF neural network is set to 0.2, and the maximum number of iterations is set to 200.
According to the characteristics of the input and output data, the number of neurons in the input layer of the RBF neural network is set to 5, and the number of neurons in the output layer is set to 1. Based on the empirical formula for determining the number of hidden layer neurons [25], the number of hidden layer neurons is set to three times that of the input layer, namely 15. The hidden layer adopts the Gaussian function as the basis function, which has three core parameters: center point ( c ), width (σ), and weight (ω). The center point determines the position of the basis function, and the k-mean method is used to select the layer [15]. The smoothness of the width control function is determined by Equation (11). The hidden layer is output to the output layer through weight combination and selected by the gradient descent method,
σ = d max 2 k
where d max is the farthest center distance and k is the number of centers.
4.
Network training
The normalized data is input to train the RBF neural network, so that the RBF neural network can correctly map the relationship between the end structure of the bar and the maximum field strength.

3.2. Optimization Method of Stator Bar End Structure Based on SHO-RBF Neural Network

The optimization of the anti-corona structure at the stator bar end optimizes the length of the anti-corona layer and the material resistivity parameters under the given constraints, and then obtains the optimal anti-corona performance of the end of the large hydro-generator. In the previous section, the RBF neural network is used to establish the mapping relationship between the anti-corona factors at the stator bar end and the maximum electric field strength. During optimization of the structure, an optimization problem occurs related to the identification of the length of each anti-corona layer and the material resistivity parameters corresponding to the minimum output tangential electric field strength through the neural network [26].
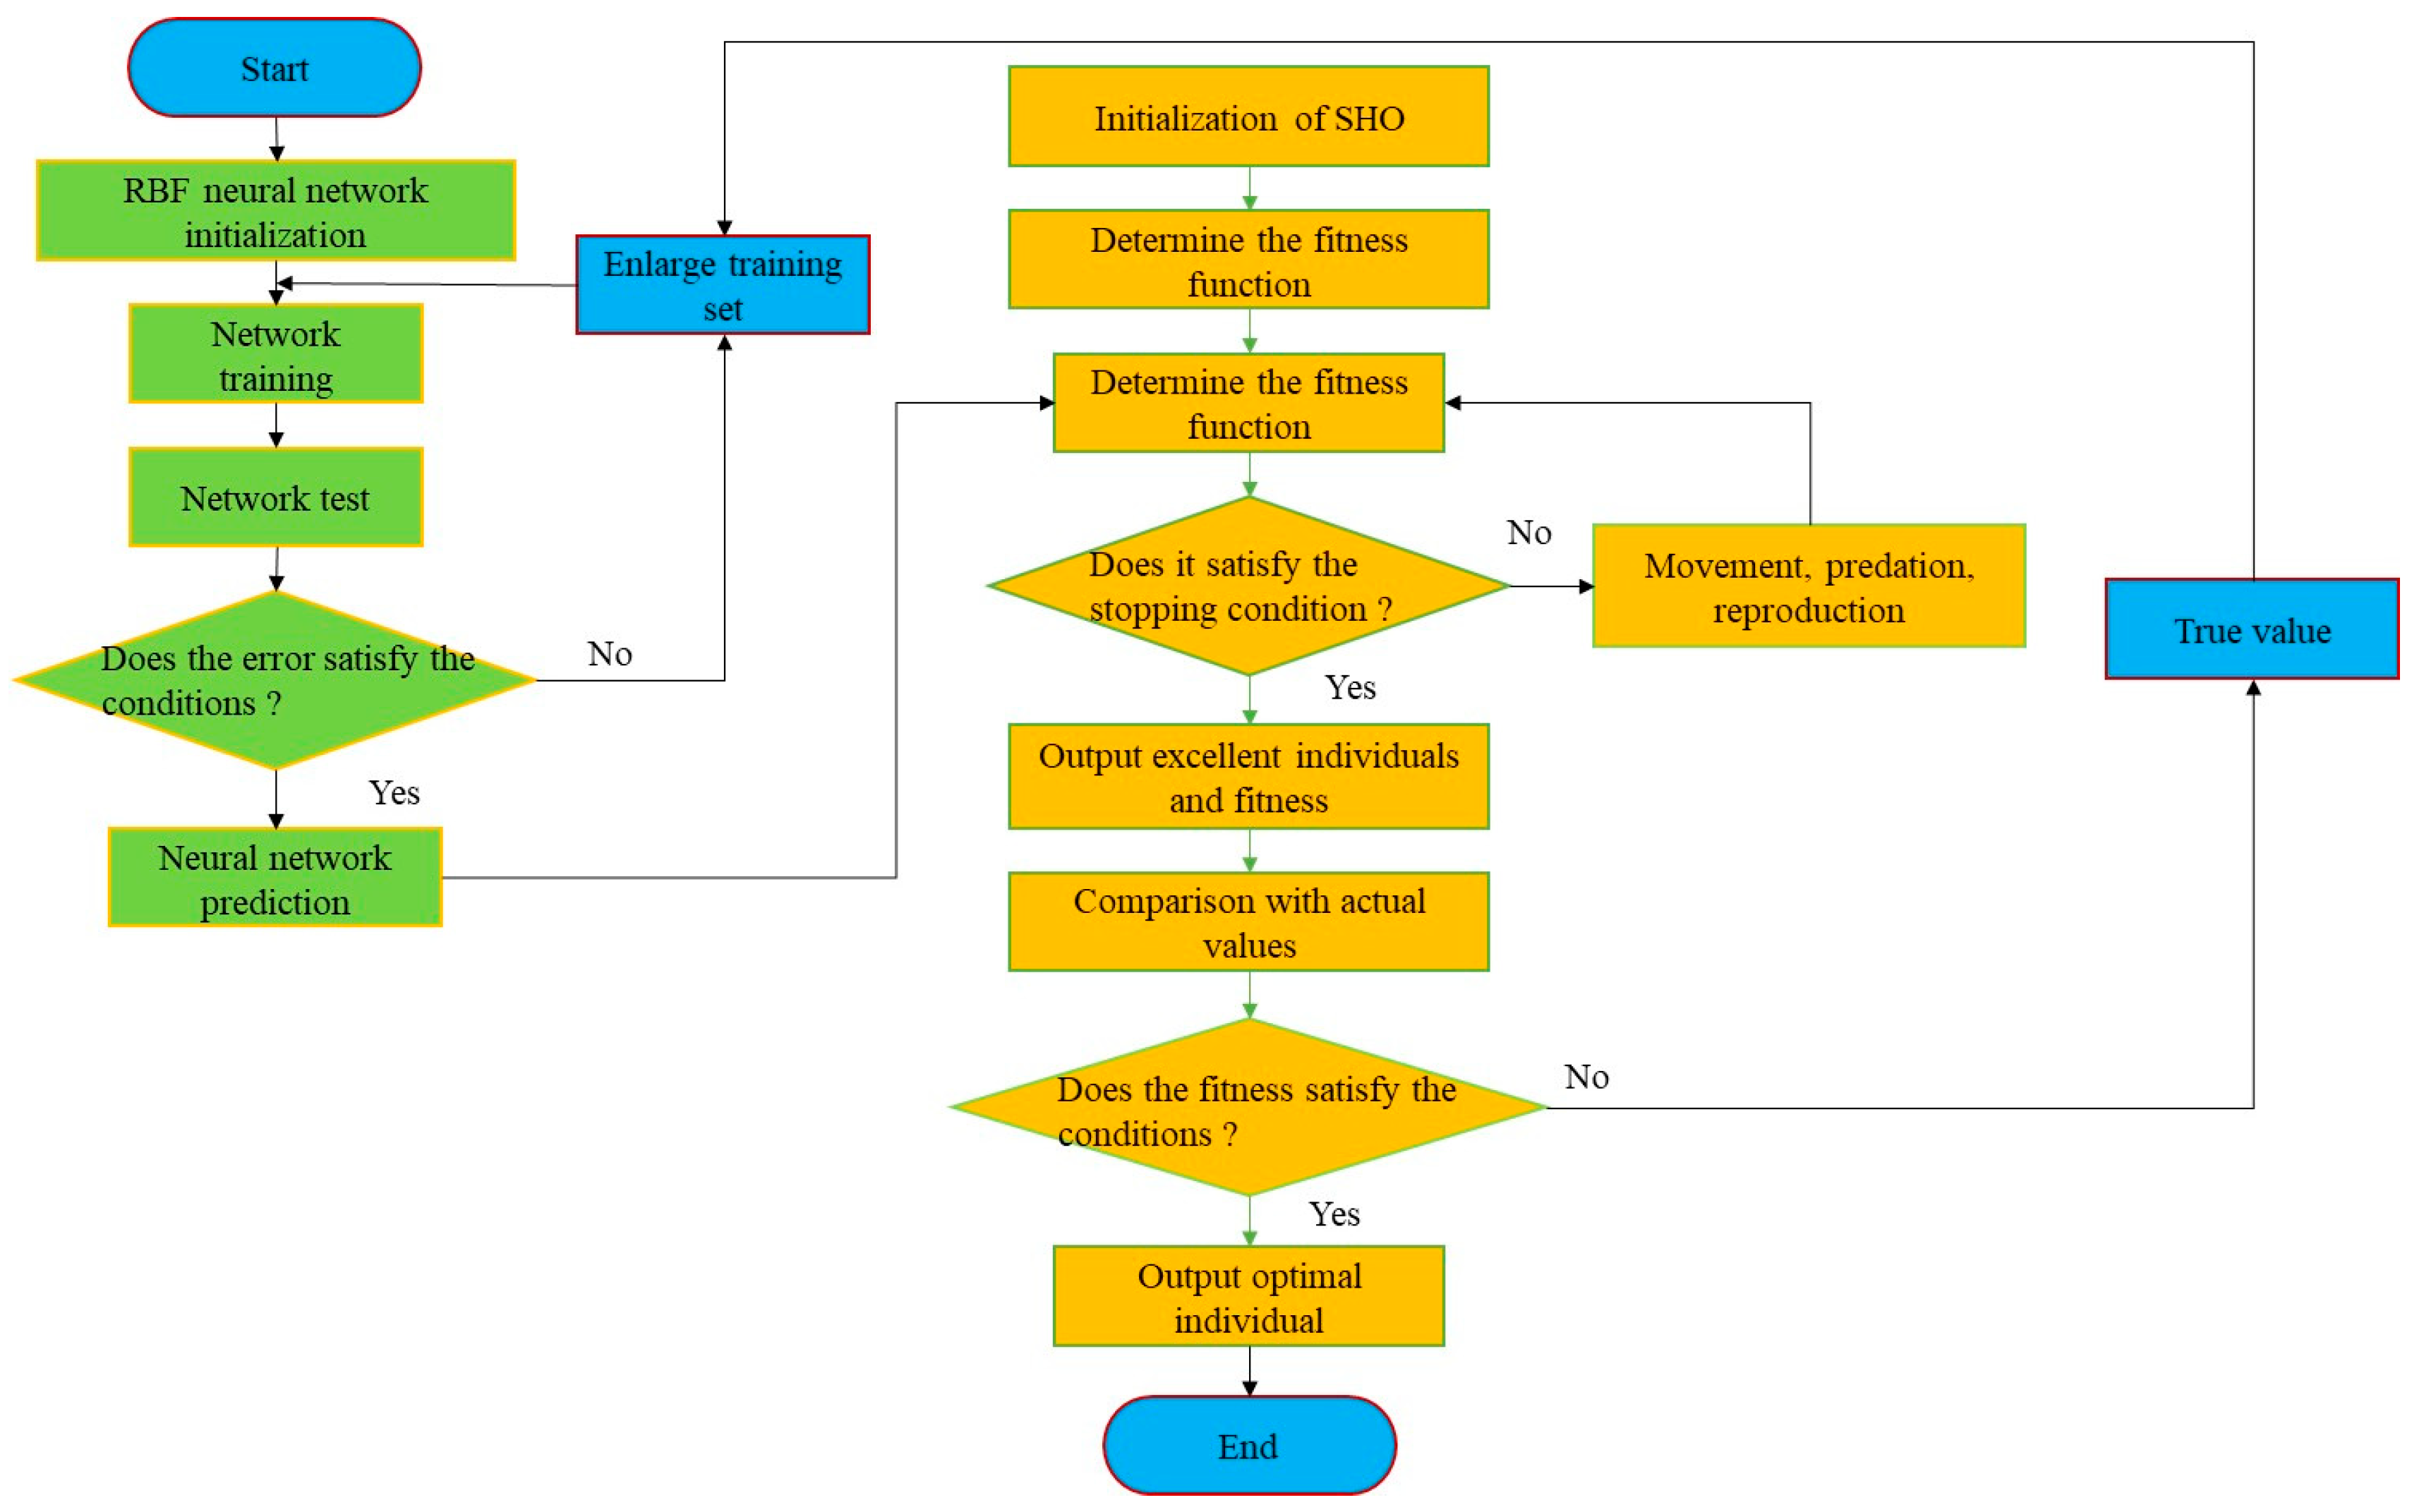
In this paper, the Seahorse Optimization algorithm is used to solve the optimization problem of the stator bar end defense structure. Combined with the relationship between the anti-corona factor and the electric field strength established by the RBF neural network, the stator bar end structure optimization method of the SHO-RBF neural network is constructed. The specific steps are as follows:
  • Initialize the Radial Basis Function neural network to determine the core parameters.
  • Using the training data to train the neural network, the relationship between the structural parameters of the bar anti-corona and the maximum field strength is established.
  • The trained neural network is tested, and then the error conditions are set. If the conditions are not met, the predicted data is added to the training data, and the extended data is used for network training again. If the conditions are met, the Seahorse Optimization operation is performed.
  • Initialize the Seahorse Optimization algorithm to determine the hippocampus population, the number of iterations, the element dimension contained in the individual, and the fitness function [27].
  • The hippocampus population is determined. Each group of neural network output data corresponds to a hippocampus individual, and the fitness of the hippocampus individual is calculated according to the fitness function [28].
  • Determine whether the algorithm reaches the number of iterations. If this is not achieved, the seahorse population moves, preys, reproduces, and returns to step 5.
  • Find the optimal hippocampus individual and output the data of the individual.
  • Validation data are then compared with the most individual data in the hippocampus. Calculate the error between the predicted value and the actual value. If the error condition is not satisfied, the data of the optimal hippocampus individual is added to the training data as the real value, and step 2 is repeated. If the error condition is satisfied, the optimal individual is output as the final result.
The flow chart of the optimization model is shown in Figure 9.

4. Results and Analysis

4.1. RBF Neural Network Mapping

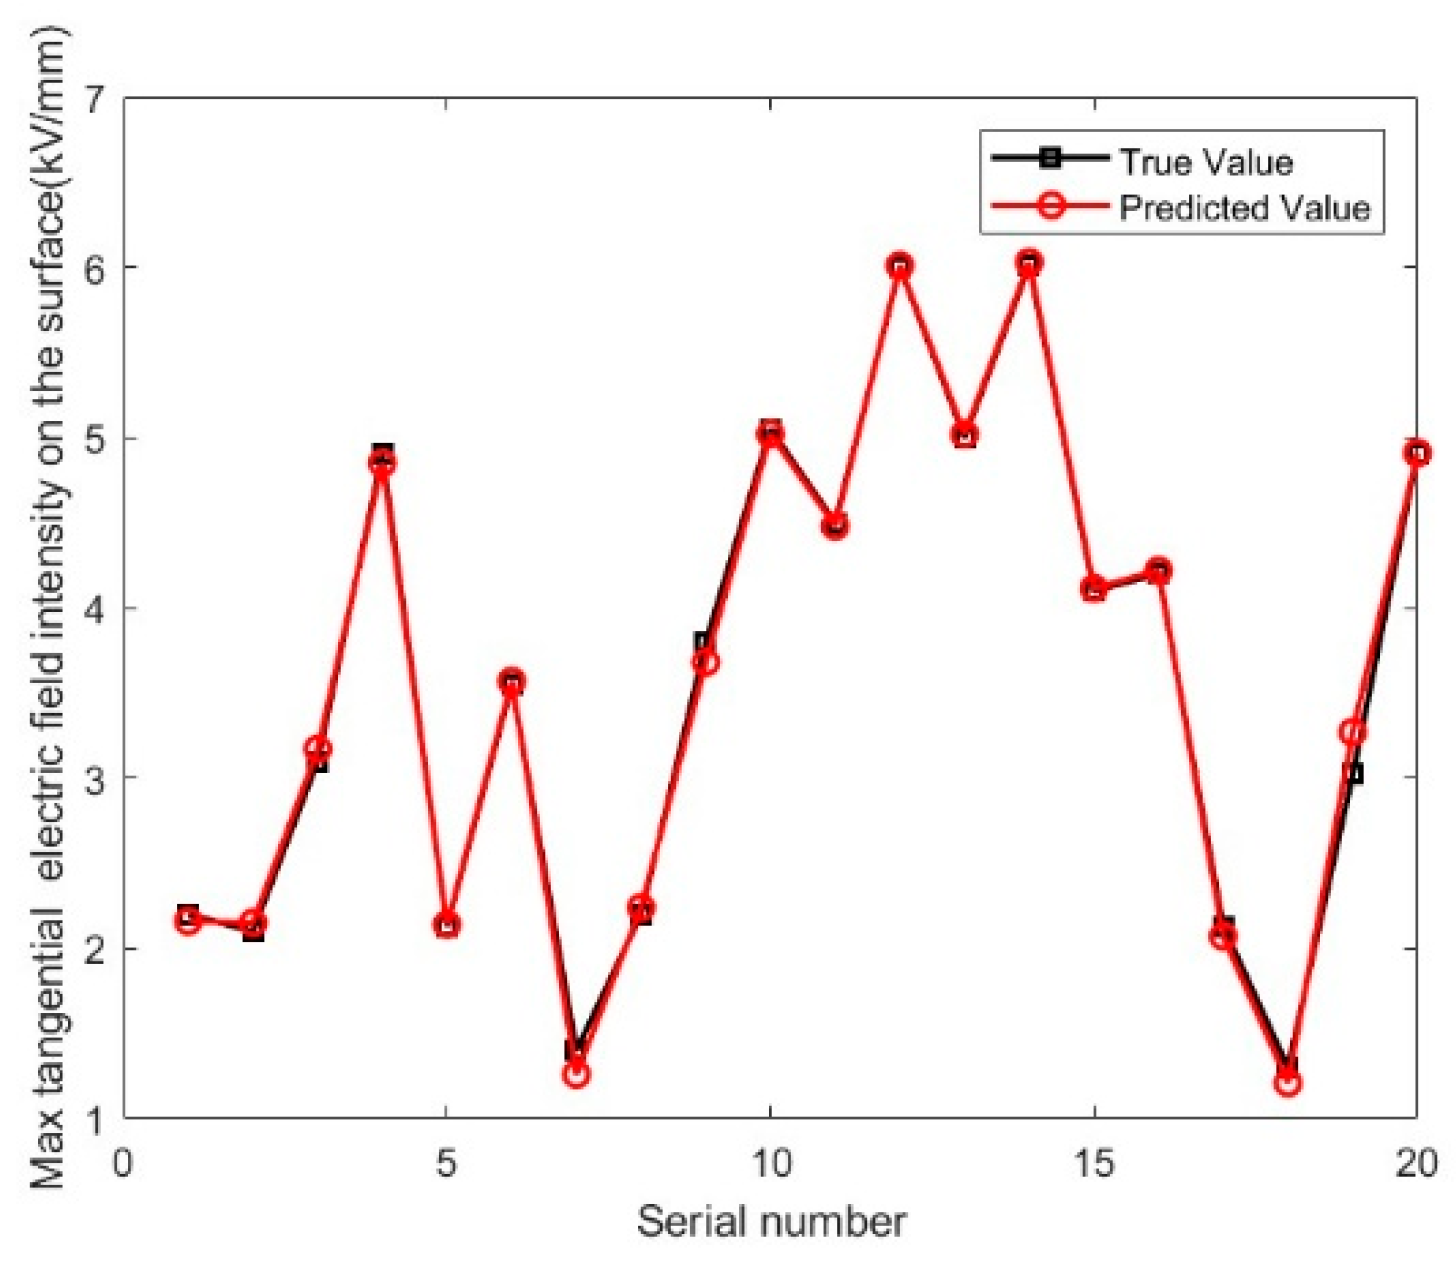
The first 20 sets of data of the stator bar end anti-corona simulation results are used as the training set. The trained Radial Basis Function neural network is used to predict the 20 training samples. The training error of one sample reaches 0.25, and the training error of two samples exceeds 0.1. The training error of the remaining samples is about 0.05, and the root mean square error of the overall prediction is 0.0062. It is proved that the fitting accuracy of the neural network is good. The actual value and the predicted value of the neural network are shown in Figure 10. The error between the two is shown in Figure 11.
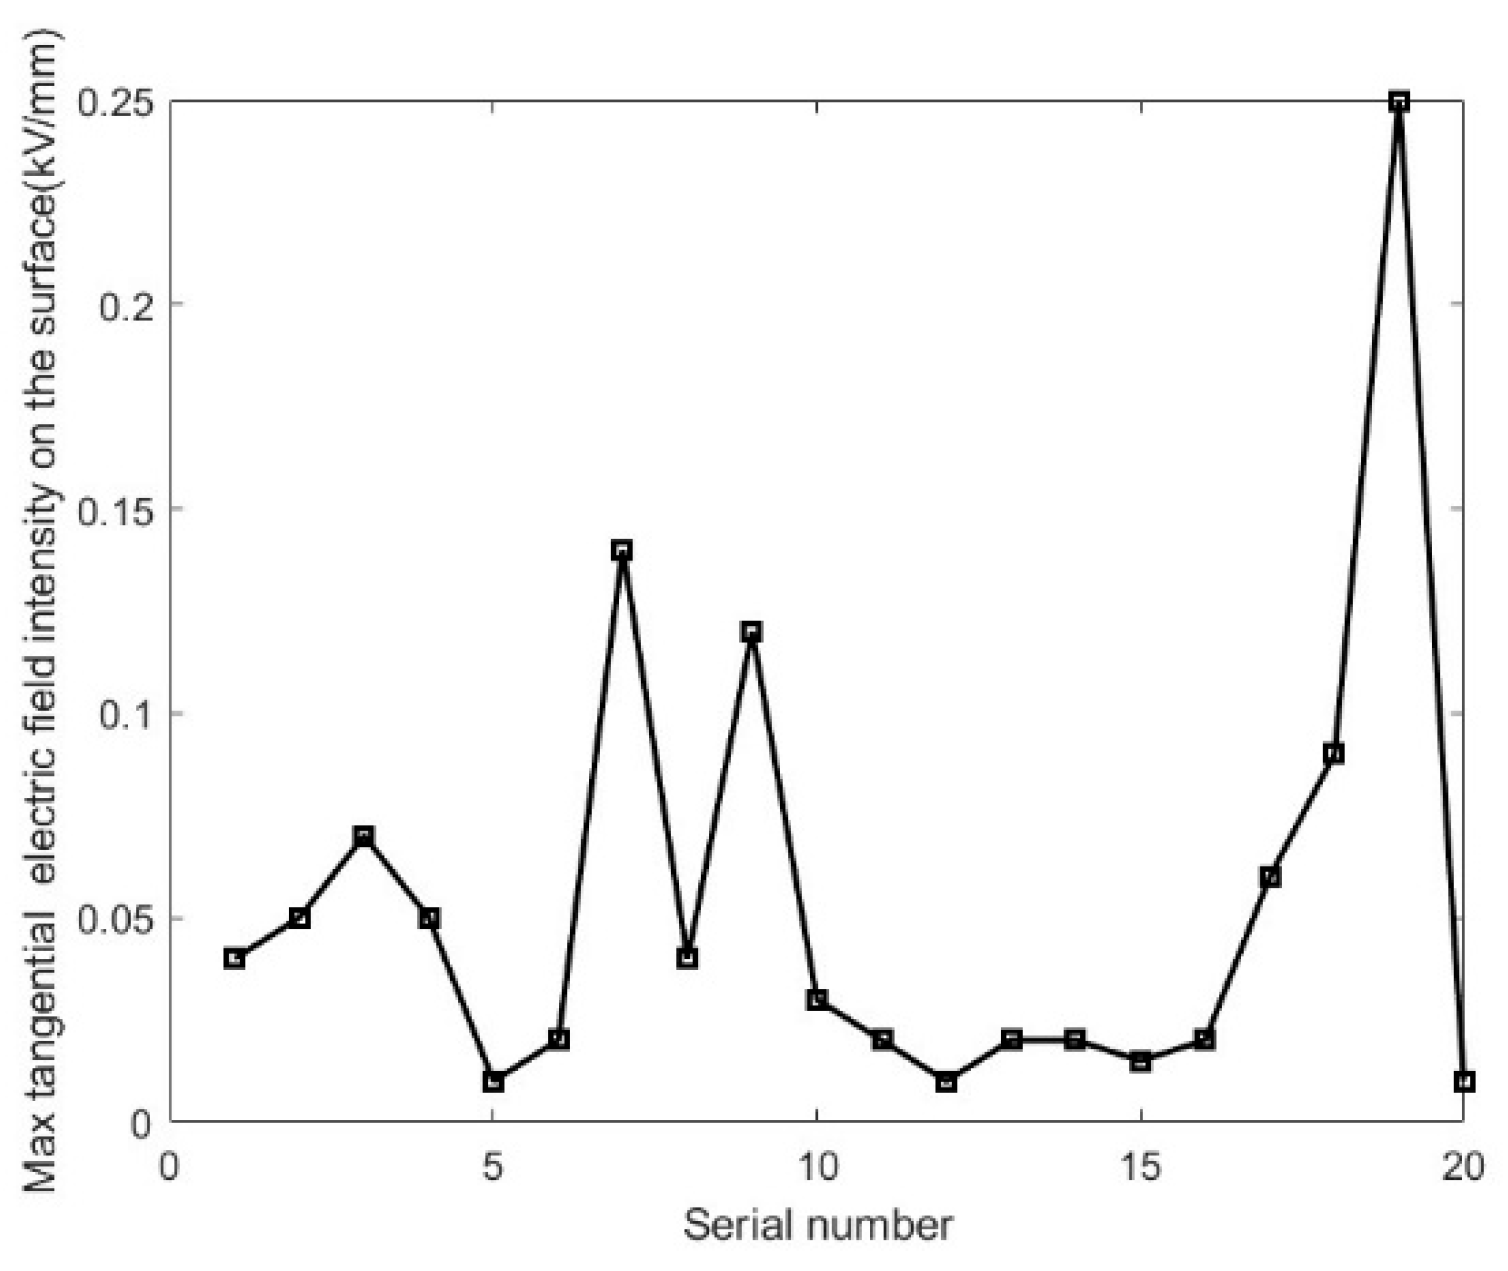
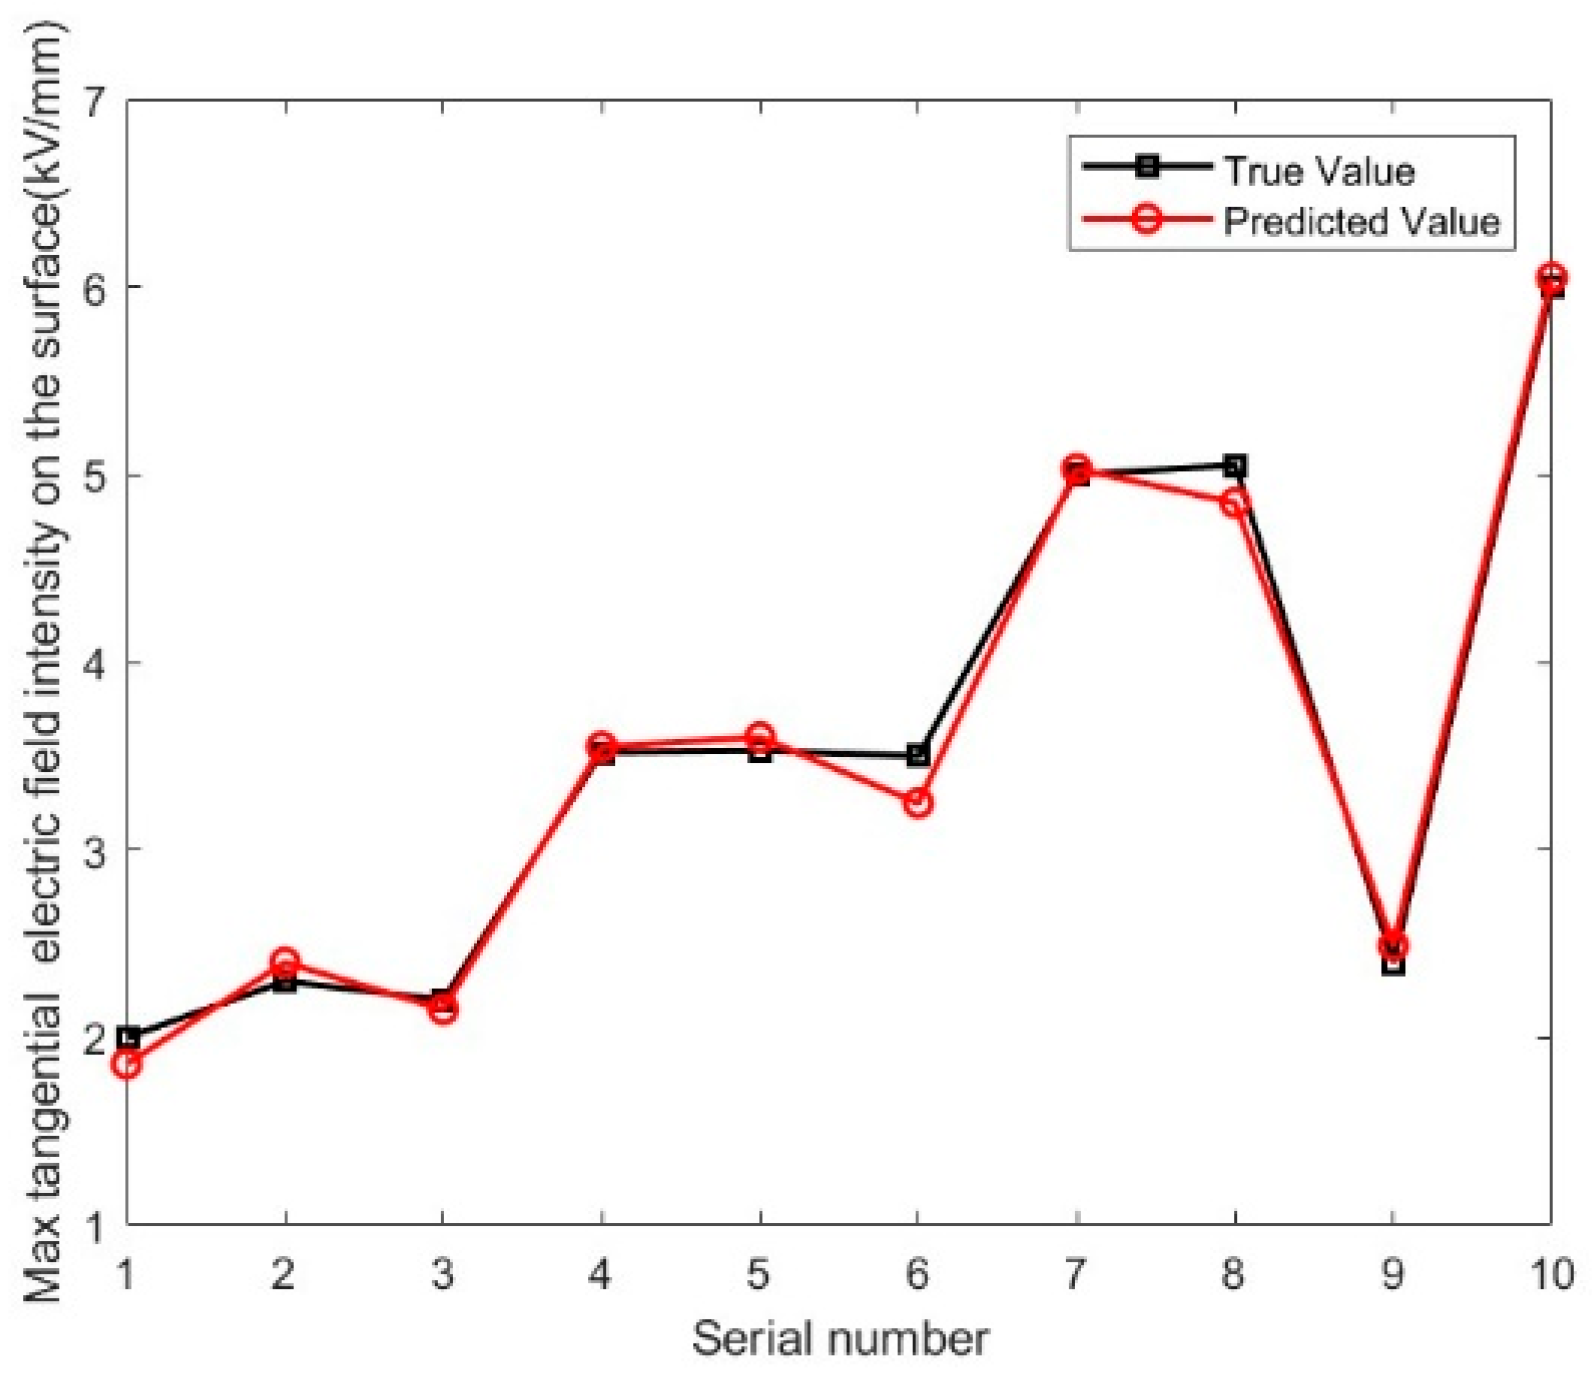
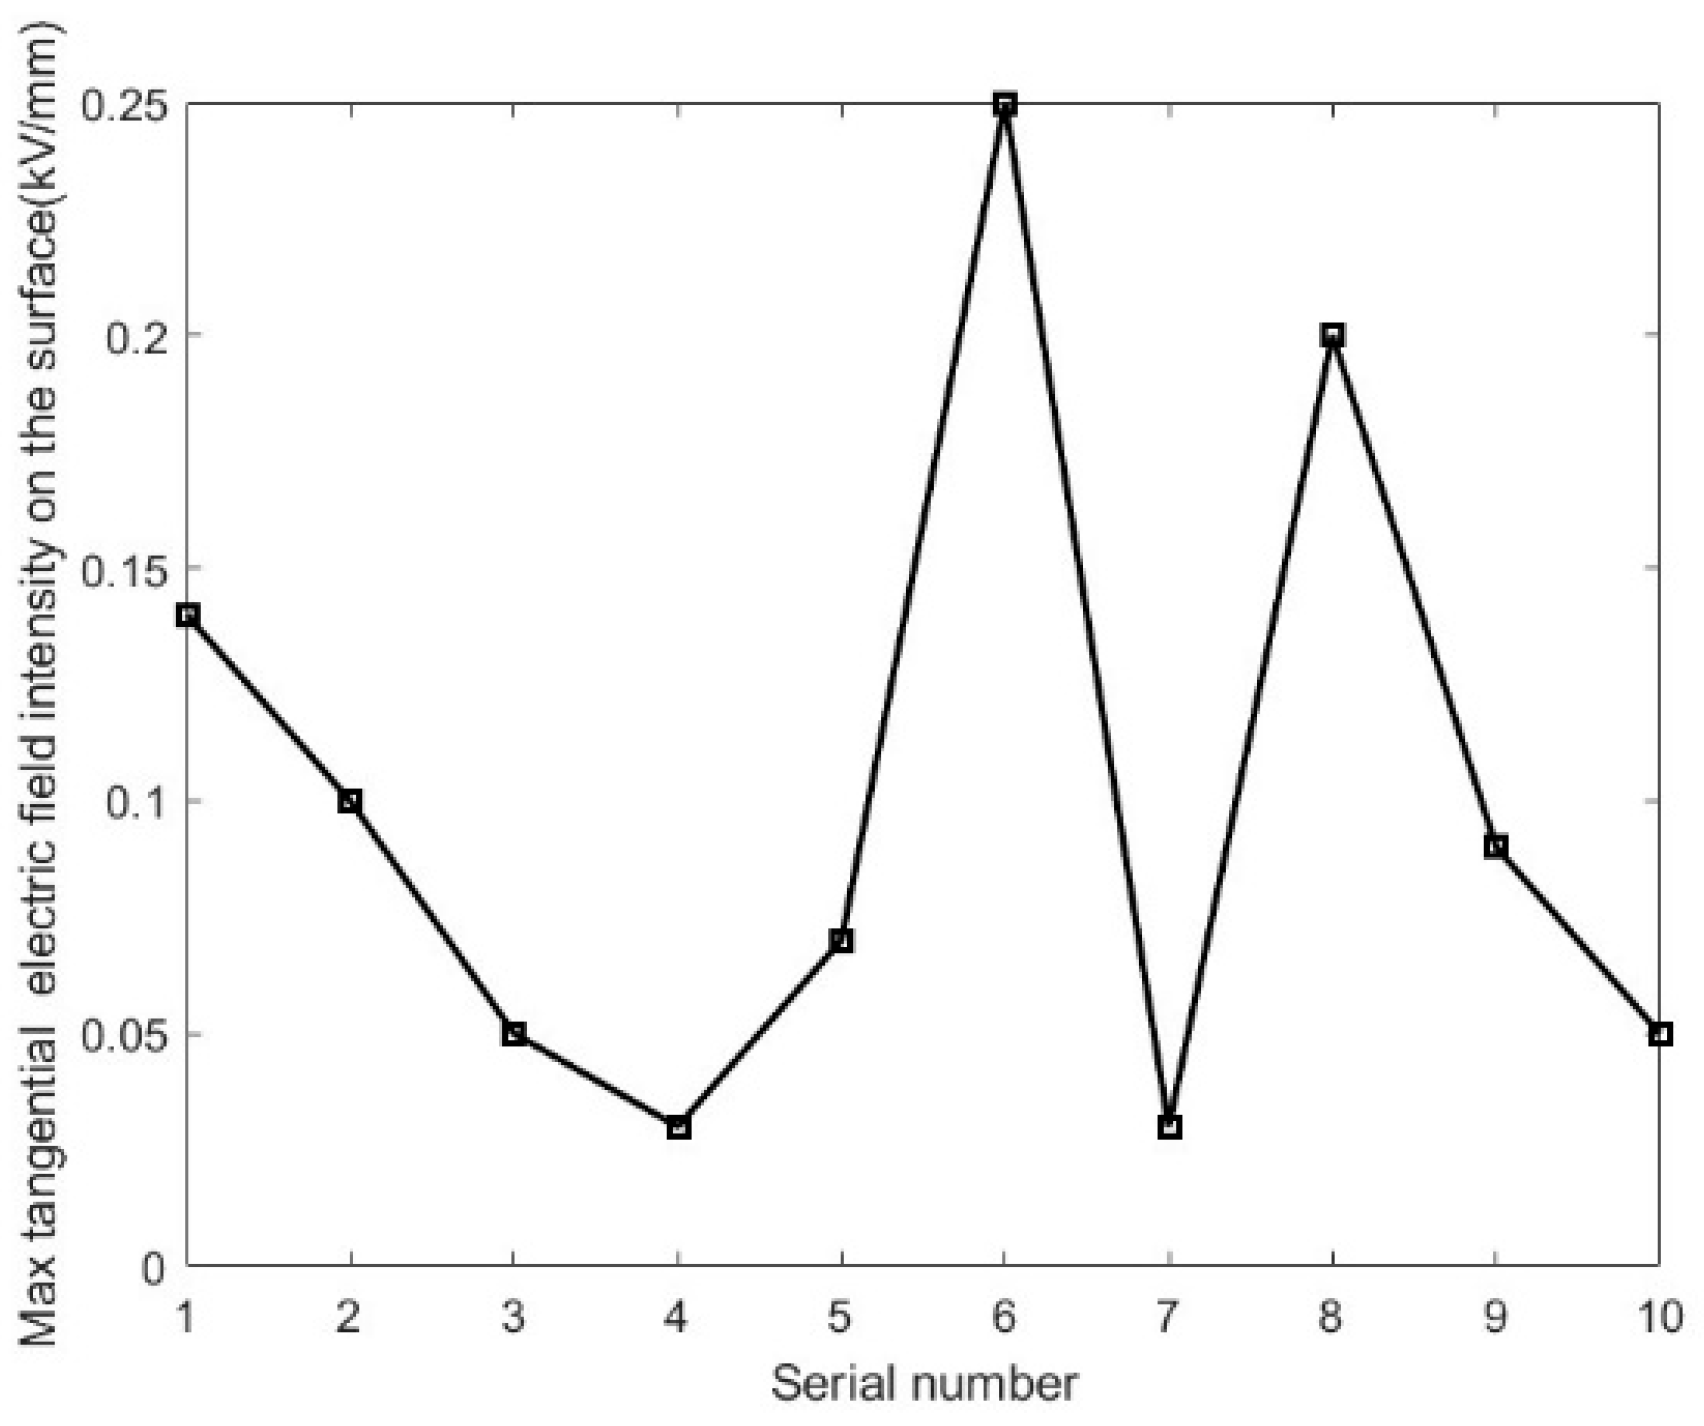
The last 10 groups of the stator bar end anti-corona simulation results are used as the verification set, and the actual value and the final predicted value are shown in Figure 12. The error between the two is shown in Figure 13. Among the 10 validation samples, the prediction error of two samples exceeded 0.20, the prediction error of one sample reached 0.14, the prediction error of the remaining samples was about 0.05, and the root mean square error of the overall prediction was 0.0147. It is proved that the neural network has high prediction accuracy and can represent the mapping relationship between the anti-corona factors at the stator bar end and the maximum electric field strength.

4.2. SHO-RBF End Structure Optimization

In this paper, the computer is equipped with an Intel Core i7-12700H CPU, an RTX 3060 graphics card, and 16 GB of memory. The model simulation software is COMSOL Multiphysics 6.1, and the neural network computing tool is MATLAB R2024a.
Using the optimization method of the stator bar end structure based on the SHO-RBF neural network, the anti-corona structure of the hydro-generator end is designed and optimized. When the medium resistance rate is 105 Ω m, 106 Ω m, and 107 Ω·m, two optimal schemes are output respectively. Through 5 min of calculation, six groups of optimization schemes are obtained as shown in Table 4.

4.3. Verification of Anti-Corona Optimization Scheme

According to the recommendations of the Large Generator Research Institute, when the altitude does not exceed 1000 m and the ambient air temperature is between −15 °C and 40 °C, in order to ensure that the generator does not produce corona discharge during operation, the following requirements should be met when operating at rated voltage [29]:
  • The maximum field strength of the stator bar surface is less than the air corona discharge intensity. The maximum flashover field strength of the air is 8.1 kV/cm. In the actual design, the electric field strength is preferably not higher than 3.1 kV/cm.
  • The loss density of the anti-corona layer should be less than 0.6 W/cm3.
  • The terminal voltage of the anti-corona layer should be 0 to prevent flashover discharge caused by excessive terminal voltage.
  • The length of the anti-corona layer should be as short as possible under actual operating conditions.
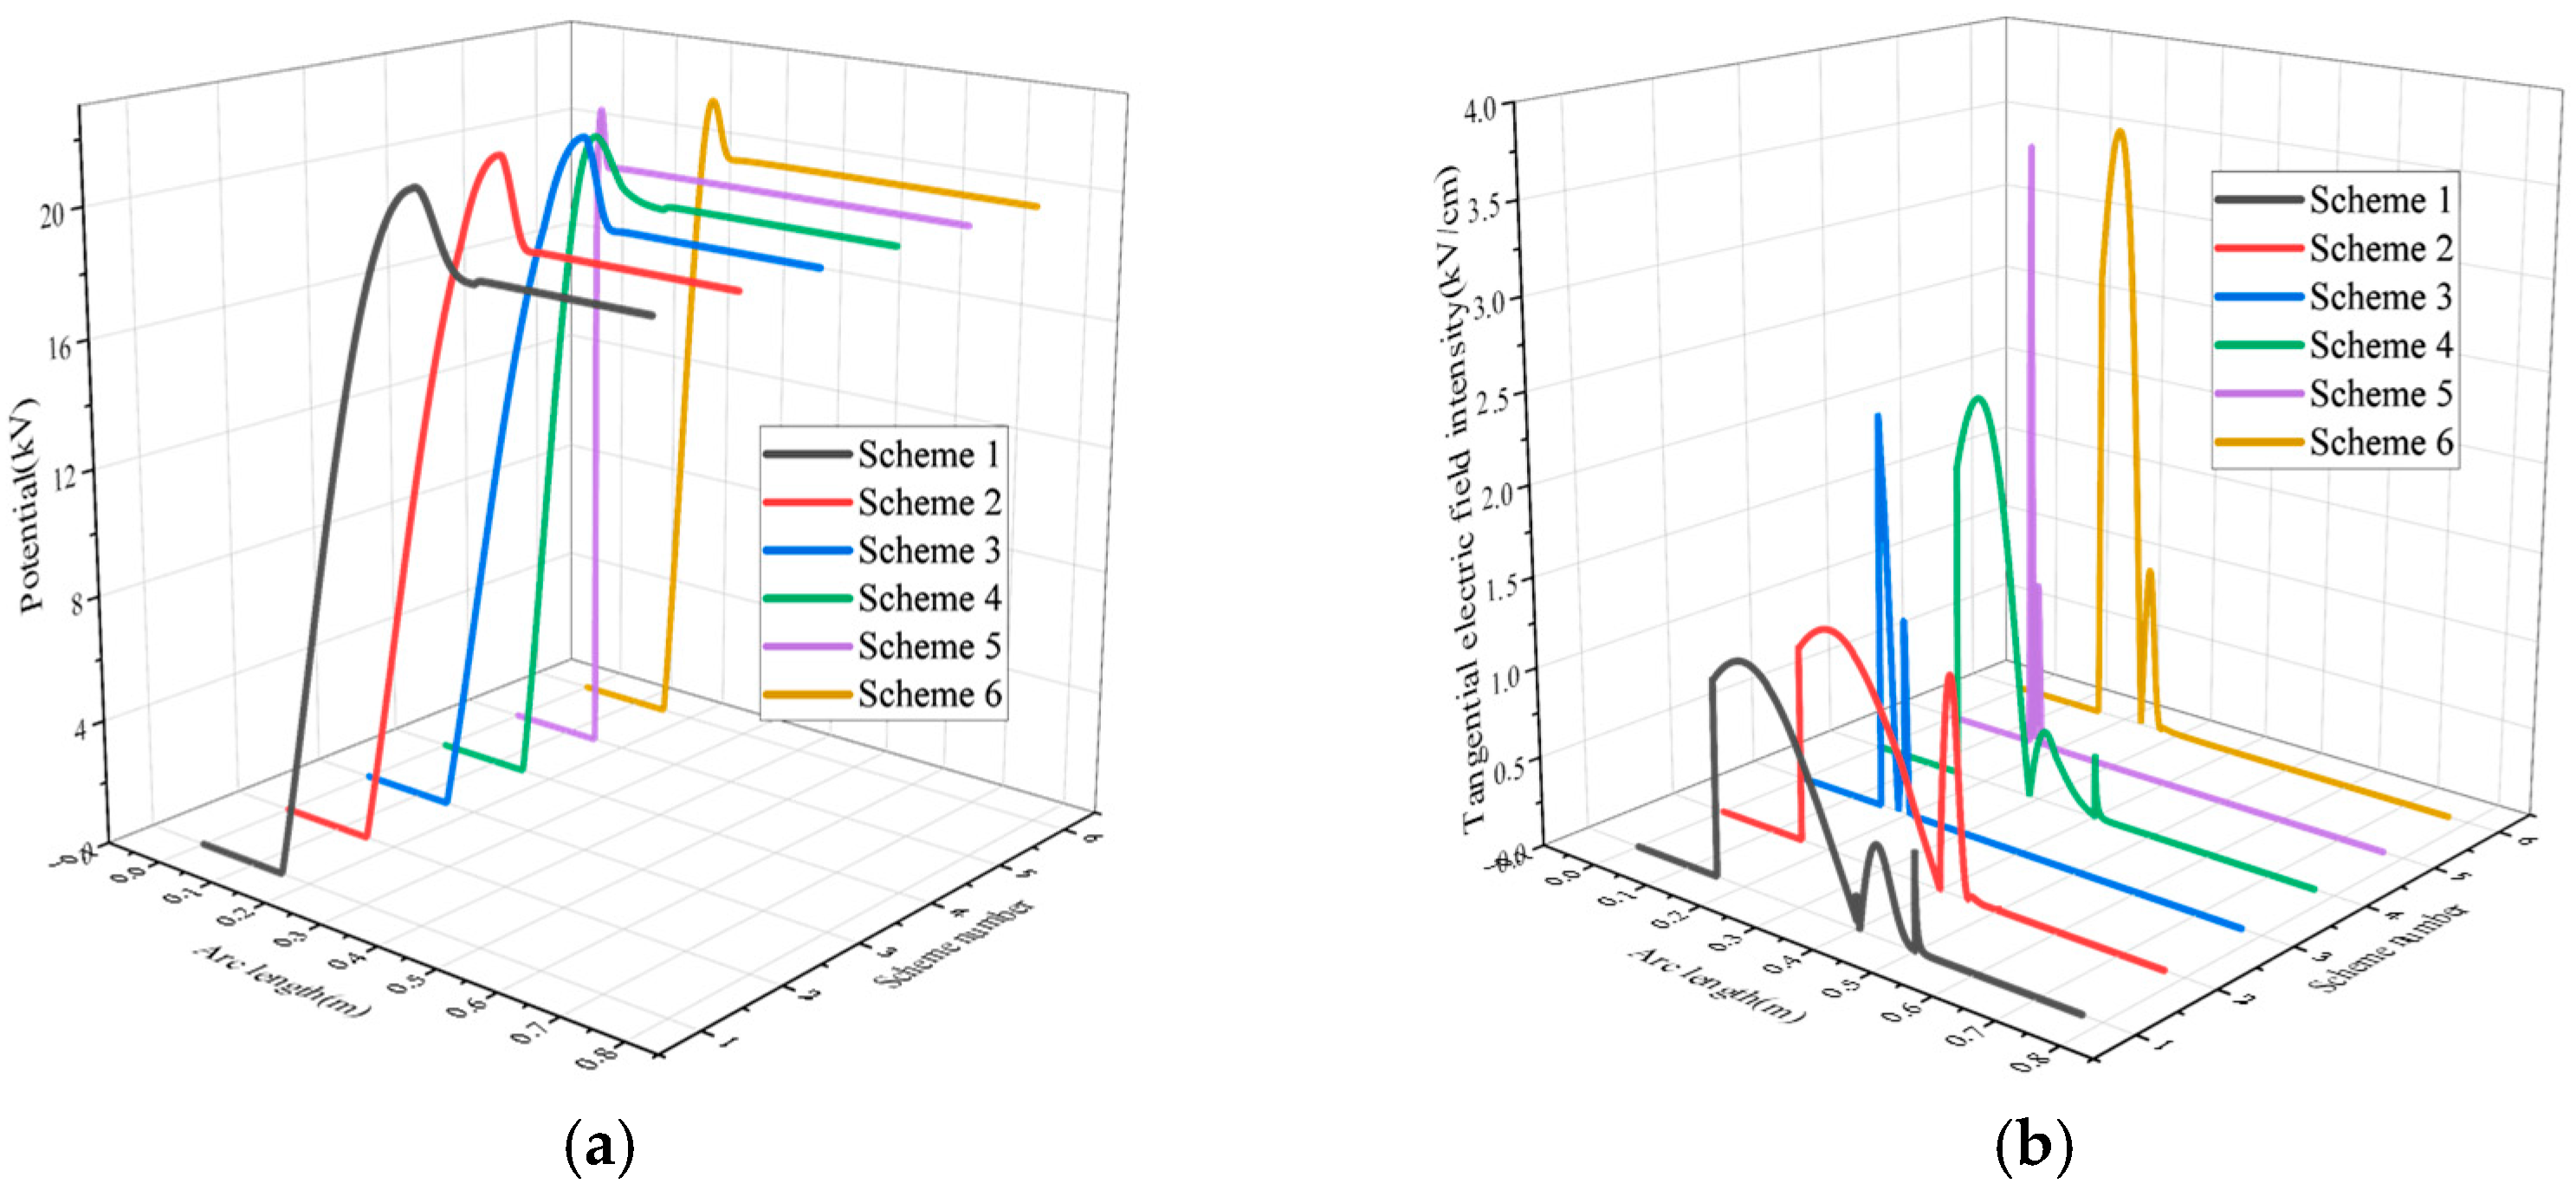
Using the established simulation model, the optimization scheme is verified, and the electric field distribution at the stator bar end of scheme 1 is calculated as shown in Figure 14. Figure 14a is a comparison of the potential distribution of the six optimization schemes. The potential change trends of the six optimization schemes are basically the same. Figure 14b is a comparison of the electric field intensity distribution of the six optimization schemes. It can be seen from the figure that no matter how the resistivity of the anti-corona layer at all levels is selected, the maximum electric field intensity of the best optimization scheme will appear in the middle resistance layer. The resistivity of the middle resistance layer of the No.1 and No.2 optimization schemes is 105 Ω m, and the maximum electric field intensity is 1.3 kV/cm. The resistivity of the middle resistance layer of the No.3 and No.4 optimization schemes is 106 Ω m, and the maximum electric field strength is 2.3 kV/cm. The resistivity of the middle resistance layer of the No.5 and No.6 optimization schemes is 107 Ω m, and the maximum electric field strength is 3.6 kV/cm. Based on the effect of homogenizing the electric field distribution under the rated voltage, scheme 1 and scheme 2 are the best, scheme 3 and scheme 4 are the second best, and scheme 5 and scheme 6 are the worst.
It is important to specifically clarify that, as per the soft engineering constraints established earlier (the electric field strength is preferably not higher than 3.1 kV/cm), scheme 5 (3.60 kV/cm) and scheme 6 (3.55 kV/cm) in Table 4 explicitly exceed this design requirement. In fact, these two schemes represent the global optimal solutions found by the algorithm when the medium resistance resistivity is strictly constrained to 10 7   Ω m . This result indicates that even with the optimal length matching of the anti-corona layers by the SHO-RBF algorithm, the maximum electric field strength cannot break through the physical bottleneck to drop below 3.1 kV/cm. This further demonstrates from a counter-perspective that in practical engineering design, optimizing the geometric lengths of the anti-corona layers alone is far from sufficient; if the resistivity parameters of the base materials are chosen inappropriately (e.g., the medium resistivity is too high), it will directly lead to anti-corona failure. Therefore, schemes 5 and 6 serve as vital comparative benchmarks here, proving the necessity and superiority of the joint optimization of material selection and geometric dimensions in schemes 1 through 4.
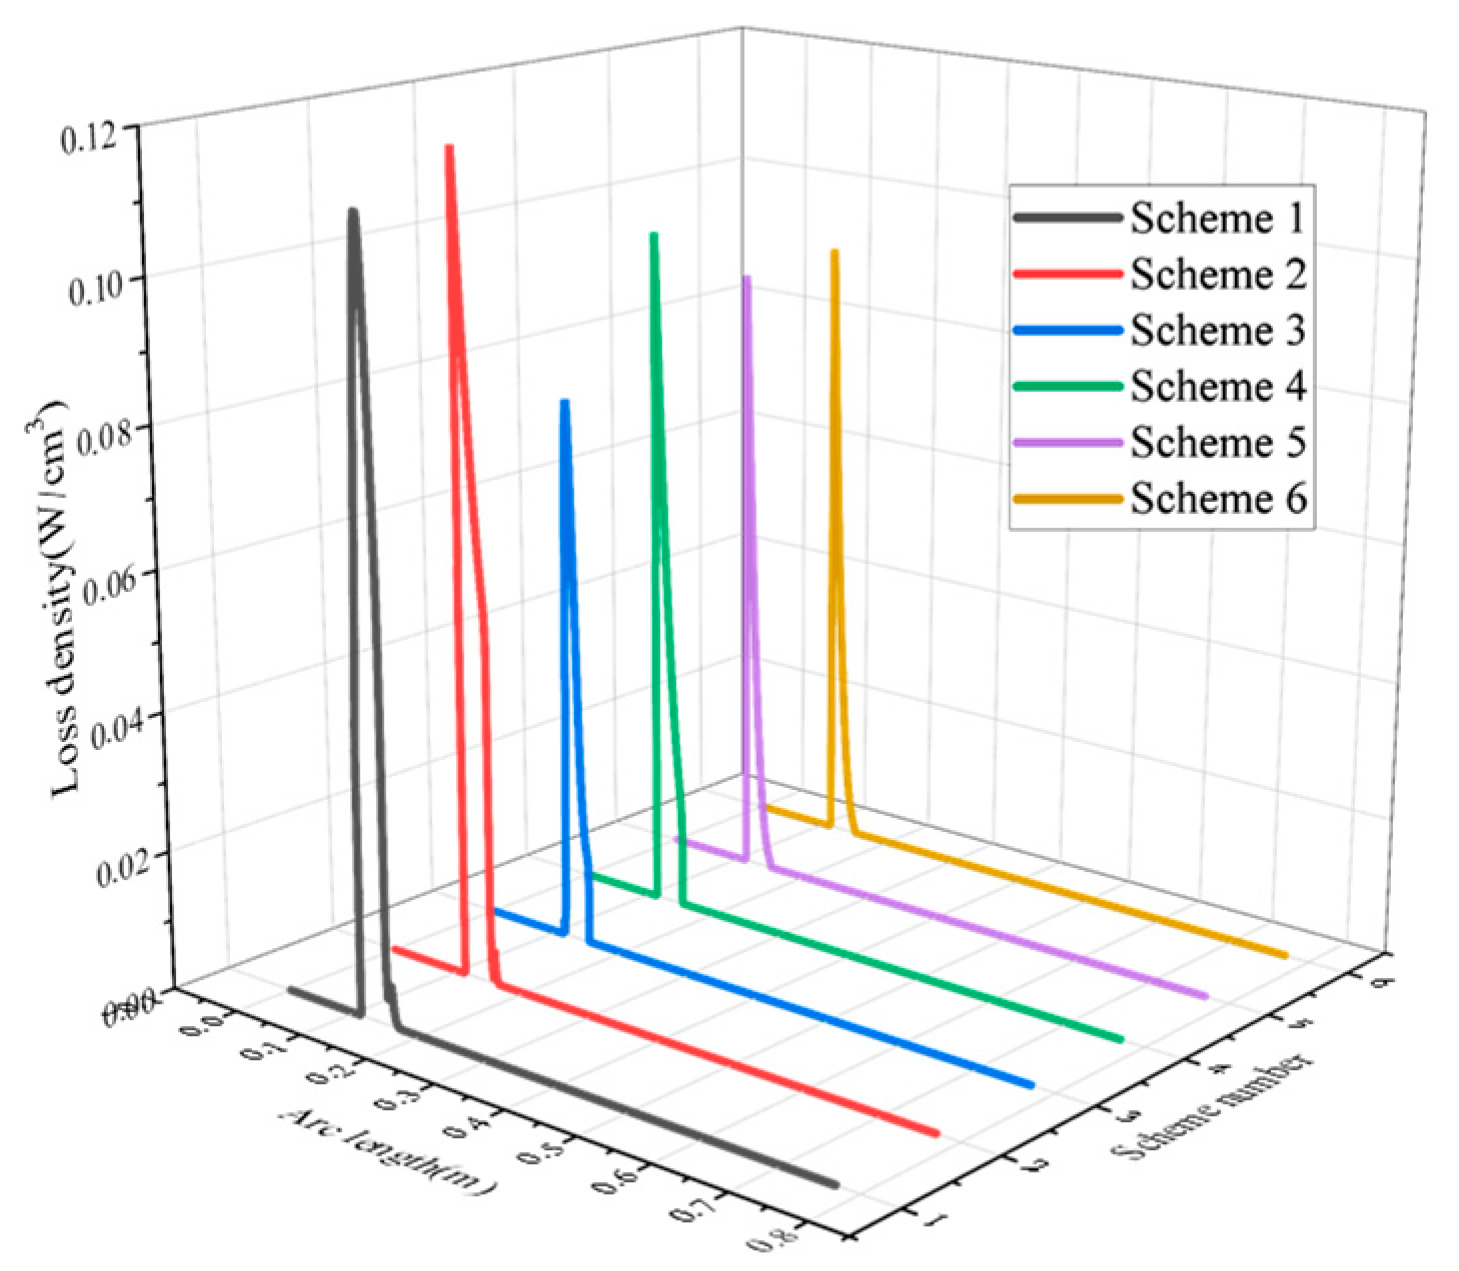
Figure 15 is a comparison of the loss density distribution of the six groups of optimization schemes. It can be seen from the figure that in the anti-corona structure at the stator bar end, the loss mainly appears in the middle resistance layer. The maximum loss density of the six groups of optimization schemes is 0.12 W/cm3, so all of them meet the design requirements of the anti-corona end structure.

5. Conclusions

This paper proposes and validates an intelligent optimization model based on the SHO-RBF neural network to address the issue of corona discharge caused by uneven electric field distribution at the stator bar ends of large hydro-generators. The key conclusions and implications are as follows:
  • By constructing the SHO-RBF surrogate model, the complex nonlinear electric field distribution at the stator ends was accurately fitted. The results demonstrate that this model can effectively replace the traditional, cumbersome finite element trial-and-error method, achieving efficient global optimization of multi-variable anti-corona parameters while maintaining high computational accuracy.
  • The optimization results reveal the intrinsic correlation between anti-corona layer parameters and electric field intensity. Notably, the resistivity and coating length of the medium-resistance layer play a decisive role in determining the maximum electric field strength. This finding directly addresses ongoing debates regarding anti-corona structure selection in engineering practice and provides a scientific basis for material parameter matching in actual production.
  • Compared with traditional iterative simulations, the proposed model significantly reduces computational resource consumption and shortens the design cycle. The six optimized anti-corona configurations obtained satisfy the stringent electric field design thresholds, proving the reliability of this intelligent approach in handling complex insulation optimization for high-voltage electrical equipment.
The “surrogate model + swarm intelligence algorithm” framework presented in this study offers high universality. It not only provides an intelligent tool for the insulation design of hydro-generator stator ends but also establishes a new methodological paradigm for the anti-corona structure design and performance optimization of other large-capacity, high-voltage power equipment.

Author Contributions

All authors contributed to the study conception and design. The first draft of the manuscript was written by Y.L. Material preparation, data collection, and analysis were performed by Y.L. Conceptualization, methodology, project administration, and supervision were performed by J.G. Funding acquisition and formal analysis were performed by H.H. Software and validation were performed by P.L. All authors commented on previous versions of the manuscript. All authors have read and agreed to the published version of the manuscript.

Funding

Supported by Program for Young Talents of Basic Research in Universities of Heilongjiang Province, grant number YQJH2025066.

Data Availability Statement

The datasets generated during and/or analyzed during the current study are available from the corresponding author upon reasonable request.

Conflicts of Interest

The authors have no relevant financial or non-financial conflicts of interest to disclose.

References

  1. Zheng, D.Y.; Zhang, P.J. A Review of Fault Diagnosis and Online Condition Monitoring of Stator Insulation in AC Electrical Machine. J. Chin. Soc. Electr. Eng. 2019, 39, 395–406+637. [Google Scholar] [CrossRef]
  2. Sun, Y.J. Research and Development of Online Monitoring System for Safe Operation of High Voltage Motor. Master’s Thesis, Lanzhou University of Technology, Lanzhou, China, 2022. [Google Scholar] [CrossRef]
  3. Chen, Y.H. Partial Discharge Characteristics and Pattern Recognition of Typical Defects at Generator Stator End-winding. Master’s Thesis, Huazhong University of Science and Technology, Wuhan, China, 2023. [Google Scholar] [CrossRef]
  4. Yu, G.; Cheng, Y. Hydro Generator Stator Bar Modeling and Simulation Based on Finite Element Simulation. Coatings 2024, 14, 1499. [Google Scholar] [CrossRef]
  5. He, Y.L.; Sun, K.; Wu, Y.; Zhao, H.S.; Wang, X.L.; Gerada, C.; Gerada, D. Impact of Static Air-Gap Eccentricity on Thermal Responses of Stator Winding Insulation in Synchronous Generators. IEEE Trans. Ind. Electron. 2022, 69, 13544–13554. [Google Scholar] [CrossRef]
  6. Lu, X.; Hu, R.; Guo, K.; Lan, R.; Tian, J.; Wei, Y.; Li, G. Effect of Interface Defects on the Electric–Thermal–Stress Coupling Field Distribution of Cable Accessory Insulation. Energies 2024, 17, 4498. [Google Scholar] [CrossRef]
  7. Cheng, J.; Ao, B.J.; Deng, H.G. Analysis and Treatment of Corona at the End of Stator Windings in a Certain Type of Hydroelectric Unit in Xiluodu Hydropower Station. Hydropower New Energy 2025, 39, 62–65+85. [Google Scholar] [CrossRef]
  8. Li, M.J.; Liu, X.D.; Bai, X.Y.; Shang, G.Y.; Mei, Z.J.; Li, Z.J.; Ma, D.G. Simulation Study on Optimization of Stator End Structure for Large Steam Turbine Generators under Deep Peak Shaving Conditions. Electr. Mach. Control Appl. 2024, 51, 1499–1501. [Google Scholar] [CrossRef]
  9. Liu, L.W.; Hu, C.X.; Li, G.R.; Jiang, Q.; Dou, J.H.; Guo, J.L.; Wang, J.Y. Research on Error Compensation of Electric Field Measurement Based on BP Neural Network. Electr. Eng. 2024, 24, 151–154. [Google Scholar] [CrossRef]
  10. Li, Y.; Zhang, Y.; Wang, R.; Tang, Z. Artificial neural network-based sound insulation optimization design of composite floor of high-speed train. Proc. Inst. Mech. Eng. Part C J. Mech. Eng. Sci. 2024, 238, 10964–10977. [Google Scholar] [CrossRef]
  11. Liu, F.S.; Ji, S.C.; Dang, Y.L.; Zhu, L.Y. Global Optimal Design Method for Insulation Structure of Medium Frequency Transformer Based on Constrained Multiobjective Optimization Algorithm C-MOEA/D. High Volt. Eng. 2025, 51, 956–966. [Google Scholar] [CrossRef]
  12. Zhang, J.; Liu, P.; Teng, W.T.; Li, Y.Q.; Xie, L.; Peng, Z.R.; Liu, C. Design and Optimization of Corona-proof Structure for Wire Connection Hardware at 1000kV Substations in Ultra-high-altitude Areas. Power Syst. Technol. 2024, 48, 1788–1798. [Google Scholar] [CrossRef]
  13. Yan, X.F. Hybrid artificial neural network based on BP-PLSR and its application in development of soft sensors. Chemom. Intell. Lab. Syst. 2010, 103, 152–159. [Google Scholar] [CrossRef]
  14. Ruan, S.; An, S.; Dong, Z.; Jin, Z.; Liu, K. Integrated Control Method for STOVL UAV Based on RBF Neural Network and Nonlinear Dynamic Allocation. Drones 2025, 9, 167. [Google Scholar] [CrossRef]
  15. Li, J. Study on Fault Prediction of Handling Robot Based on Grey RBF Neural Network. Master’s Thesis, North University of China, Taiyuan, China, 2024; pp. 17–21. [Google Scholar] [CrossRef]
  16. Olabanjo, O.A.; Wusu, A.S.; Manuel, M. A machine learning prediction of academic performance of secondary school students using radial basis function neural network. Trends Neurosci. Educ. 2022, 29, 100–190. [Google Scholar] [CrossRef]
  17. Qiao, Y.N.; Jia, Y.C.; Gao, L.A.; Wen, P. Photovoltaic power prediction model based on VMD-IDBO-LSTM. Mod. Electron. Tech. 2025, 48, 168–174. [Google Scholar] [CrossRef]
  18. Özbay, F.A. A modified seahorse optimization algorithm based on chaotic maps for solving global optimization and engineering problems. Eng. Sci. Technol. Int. J. 2023, 41, 101408–101409. [Google Scholar] [CrossRef]
  19. Liu, Y.P.; Zheng, R.Y.; Song, F.H.; Liao, B. Multi-strategy Improved Seahorse Optimization Algorithm and Its Application. Sci. Technol. Eng. 2025, 25, 4216–4228. [Google Scholar] [CrossRef]
  20. Bei, J.; Wang, J.; Zhang, H. An optimization method for corn planting parameters based on mutation breeding sea horse optimization algorithm. Comput. Electron. Agric. 2025, 236, 1568–1602. [Google Scholar] [CrossRef]
  21. Zheng, S. Improvement strategies for heuristic algorithms based on machine learning and information concepts: A review of the seahorse optimization algorithm. Peer J. Comput. Sci. 2025, 11, e2805. [Google Scholar] [CrossRef]
  22. Wang, X.J.; Shi, J.; Xu, J.Y.; He, T.L.; Chen, C.; Hu, L. Life Evaluation of F-grade Insulation for Stator Bar in Turbine Generator. Insul. Mater. 2019, 52, 43–49. [Google Scholar] [CrossRef]
  23. Li, D.Y. Quenching Characteristics Analysis of Superconducting Excitation Coil of Double-Stator High Temperature Superconducting Motor. Master’s Thesis, Qing Dao University, Qingdao, China, 2024. [Google Scholar] [CrossRef]
  24. Hu, H.; Zhang, X.; Liu, Y.; Guo, L.; Gao, J. Optimization of the Electric Field Distribution at the End of the Stator in a Large Generator. Energies 2018, 11, 2510. [Google Scholar] [CrossRef]
  25. Marmouch, S.; Aroui, T. A Neural Networks and Rejection Options Approach for Intelligent Novelty Motor Anomaly Detection. Russ. Electr. Eng. 2025, 96, 1084–1093. [Google Scholar] [CrossRef]
  26. Nie, L.L.; Tao, S.D.; Li, T.W.; Liu, L.; Li, B.; Wu, Q. Research on Stator Bar End Electromagnetic Shielding for Pumped Storage Generator. Hunan Electr. Power 2023, 43, 110–115. [Google Scholar] [CrossRef]
  27. Che, Y.; Wang, J.; Hussien, A.G.; Wang, S.; Zheng, R. ESHO: Improved seahorse optimization using restart and adaptive mutation strategies. Clust. Comput. 2025, 28, 1–44. [Google Scholar] [CrossRef]
  28. Yacoubi, S.; Manita, G.; Chhabra, A.; Oliva, D.; Korbaa, O. Quantum-inspired multi-objective seahorse optimizer for predictive maintenance analysis using numerical association rule mining. Cogn. Comput. 2025, 17, 1–45. [Google Scholar] [CrossRef]
  29. Liu, G.Y.; Cui, Y.K.; Zhao, Y.M.; Zhang, Y.F.; Huang, Z.; Zhou, J.; Wu, M.; Gao, J.H.; Zhong, L.S. Analysis of Ultrasonic Signal Characteristics of Generator Stator Wire Bar Discharge Based on Wideband Ultrasonic Sensor. High Volt. Appar. 2025, 6, 62–70. [Google Scholar] [CrossRef]
Figure 1. Radial neural network working principle diagram.
Energies 19 01476 g001
Figure 2. Model of the end.
Energies 19 01476 g002
Figure 3. Potential distribution cloud diagram.
Energies 19 01476 g003
Figure 4. Comparison between the simulation results and the measured values.
Energies 19 01476 g004
Figure 5. Loss simulation cloud diagram. (a) Convex side (b) Concave side.
Energies 19 01476 g005
Figure 6. Measured temperature values of the stator bar. (a) Convex side (b) Concave side.
Energies 19 01476 g006
Figure 7. Electric field intensity distribution cloud.
Energies 19 01476 g007
Figure 8. Diagram of tangential electric field distribution.
Energies 19 01476 g008
Figure 9. SHO-RBF neural network stator bar end structure optimization method flow chart.
Energies 19 01476 g009
Figure 10. RBF neural network training results.
Energies 19 01476 g010
Figure 11. RBF neural network training errors.
Energies 19 01476 g011
Figure 12. RBF neural network verification results.
Energies 19 01476 g012
Figure 13. RBF neural network verification errors.
Energies 19 01476 g013
Figure 14. The electric field distribution of 6 groups of optimization schemes. (a) Potential distribution diagram. (b) Electric field distribution diagram.
Energies 19 01476 g014
Figure 15. The loss density distribution of 6 groups of optimization schemes.
Energies 19 01476 g015
Table 1. Structural parameters of the stator bar end model.
Parameter NameValue (mm)Parameter NameValue (mm)
Length of copper busbar interface (Lc1)117Copper busbar cross-sectional width (Lcw)27
Stator bar length (L)800Bending angle radius of bar (rb)60
Main insulation thickness (d1)5.25Anti-corona layer thickness (d2)0.5
Low resistance length (Lcp1)150Medium resistance length (Lcp2)100
Medium-high resistance length (Lcp3)100High resistance length (Lcp4)190
Table 2. Material parameters of the stator bar end model.
MaterialIntrinsic Resistivity (Ω·m)Nonlinear Coefficient (cm/kV)
Air1 × 1015-
Main insulation1 × 1014-
Low resistance anti-corona layer2 × 102-
Medium resistance anti-corona layer1 × 1071.1
Medium-high resistance anti-corona layer1 × 1091
High resistance anti-corona layer1 × 10101
Table 3. Stator bar end anti-corona simulation results.
Serial NumberMiddle Resistance Length (mm)Medium-High Resistance Length (mm)Medium Resistance Resistivity (Ω∙m)Medium-High Resistance Resistivity (Ω∙m)High Resistance Resistivity (Ω∙m)Maximum Field Strength (kV/cm)
1802001051061072.38
21701001061071082.22
3801201061071083.23
480601061081094.8
5170100106101010122.24
61901001071081093.57
71901001041051061.39
8110301061071082.23
9601201071081093.59
10401301071081095.06
11501201071081094.57
1280110107101110126.02
13170100108101110125.04
148090107101110126.03
151103010610910124.2
161105010610910104.33
171701001051071082.34
18170101051061071.58
1980401061071083.29
20806010610810124.8
211301001051061071.97
2270901051061072.28
23110401061071082.23
2460801061071083.58
25601501071081093.59
26110501071081093.47
27200100108101110125.04
281105010810910105.05
291701301051071082.34
3080240107101110126.06
Table 4. Optimization scheme.
Serial
Number
Middle
Resistance Length (mm)
Medium-High Resistance Length (mm)Medium
Resistance Resistivity (Ω∙m)
Medium-High
Resistance
Resistivity (Ω∙m)
High Resistance Resistivity (Ω∙m)Maximum Field Strength (kV/cm)
12301001051061091.19
2250801051071091.30
31501001061071082.21
420010010610810102.30
512015010710810103.60
620010010710910113.55
Disclaimer/Publisher’s Note: The statements, opinions and data contained in all publications are solely those of the individual author(s) and contributor(s) and not of MDPI and/or the editor(s). MDPI and/or the editor(s) disclaim responsibility for any injury to people or property resulting from any ideas, methods, instructions or products referred to in the content.