1. Introduction
The European Union’s (EU’s) energy demand for transport continues to rise as commuting activities increase. Among the various transport modes, such as private vehicles (e.g., passenger cars and vans), buses, trams, and bicycles [
1], private modes remain the predominant choice [
2]. The EU vehicle market is constantly evolving, demonstrating sustained growth with no clear signs of deceleration. In the EU, the number of new vehicles for personal use surpassed 259 million in 2024, indicating a 5.7% expansion compared to 2019 [
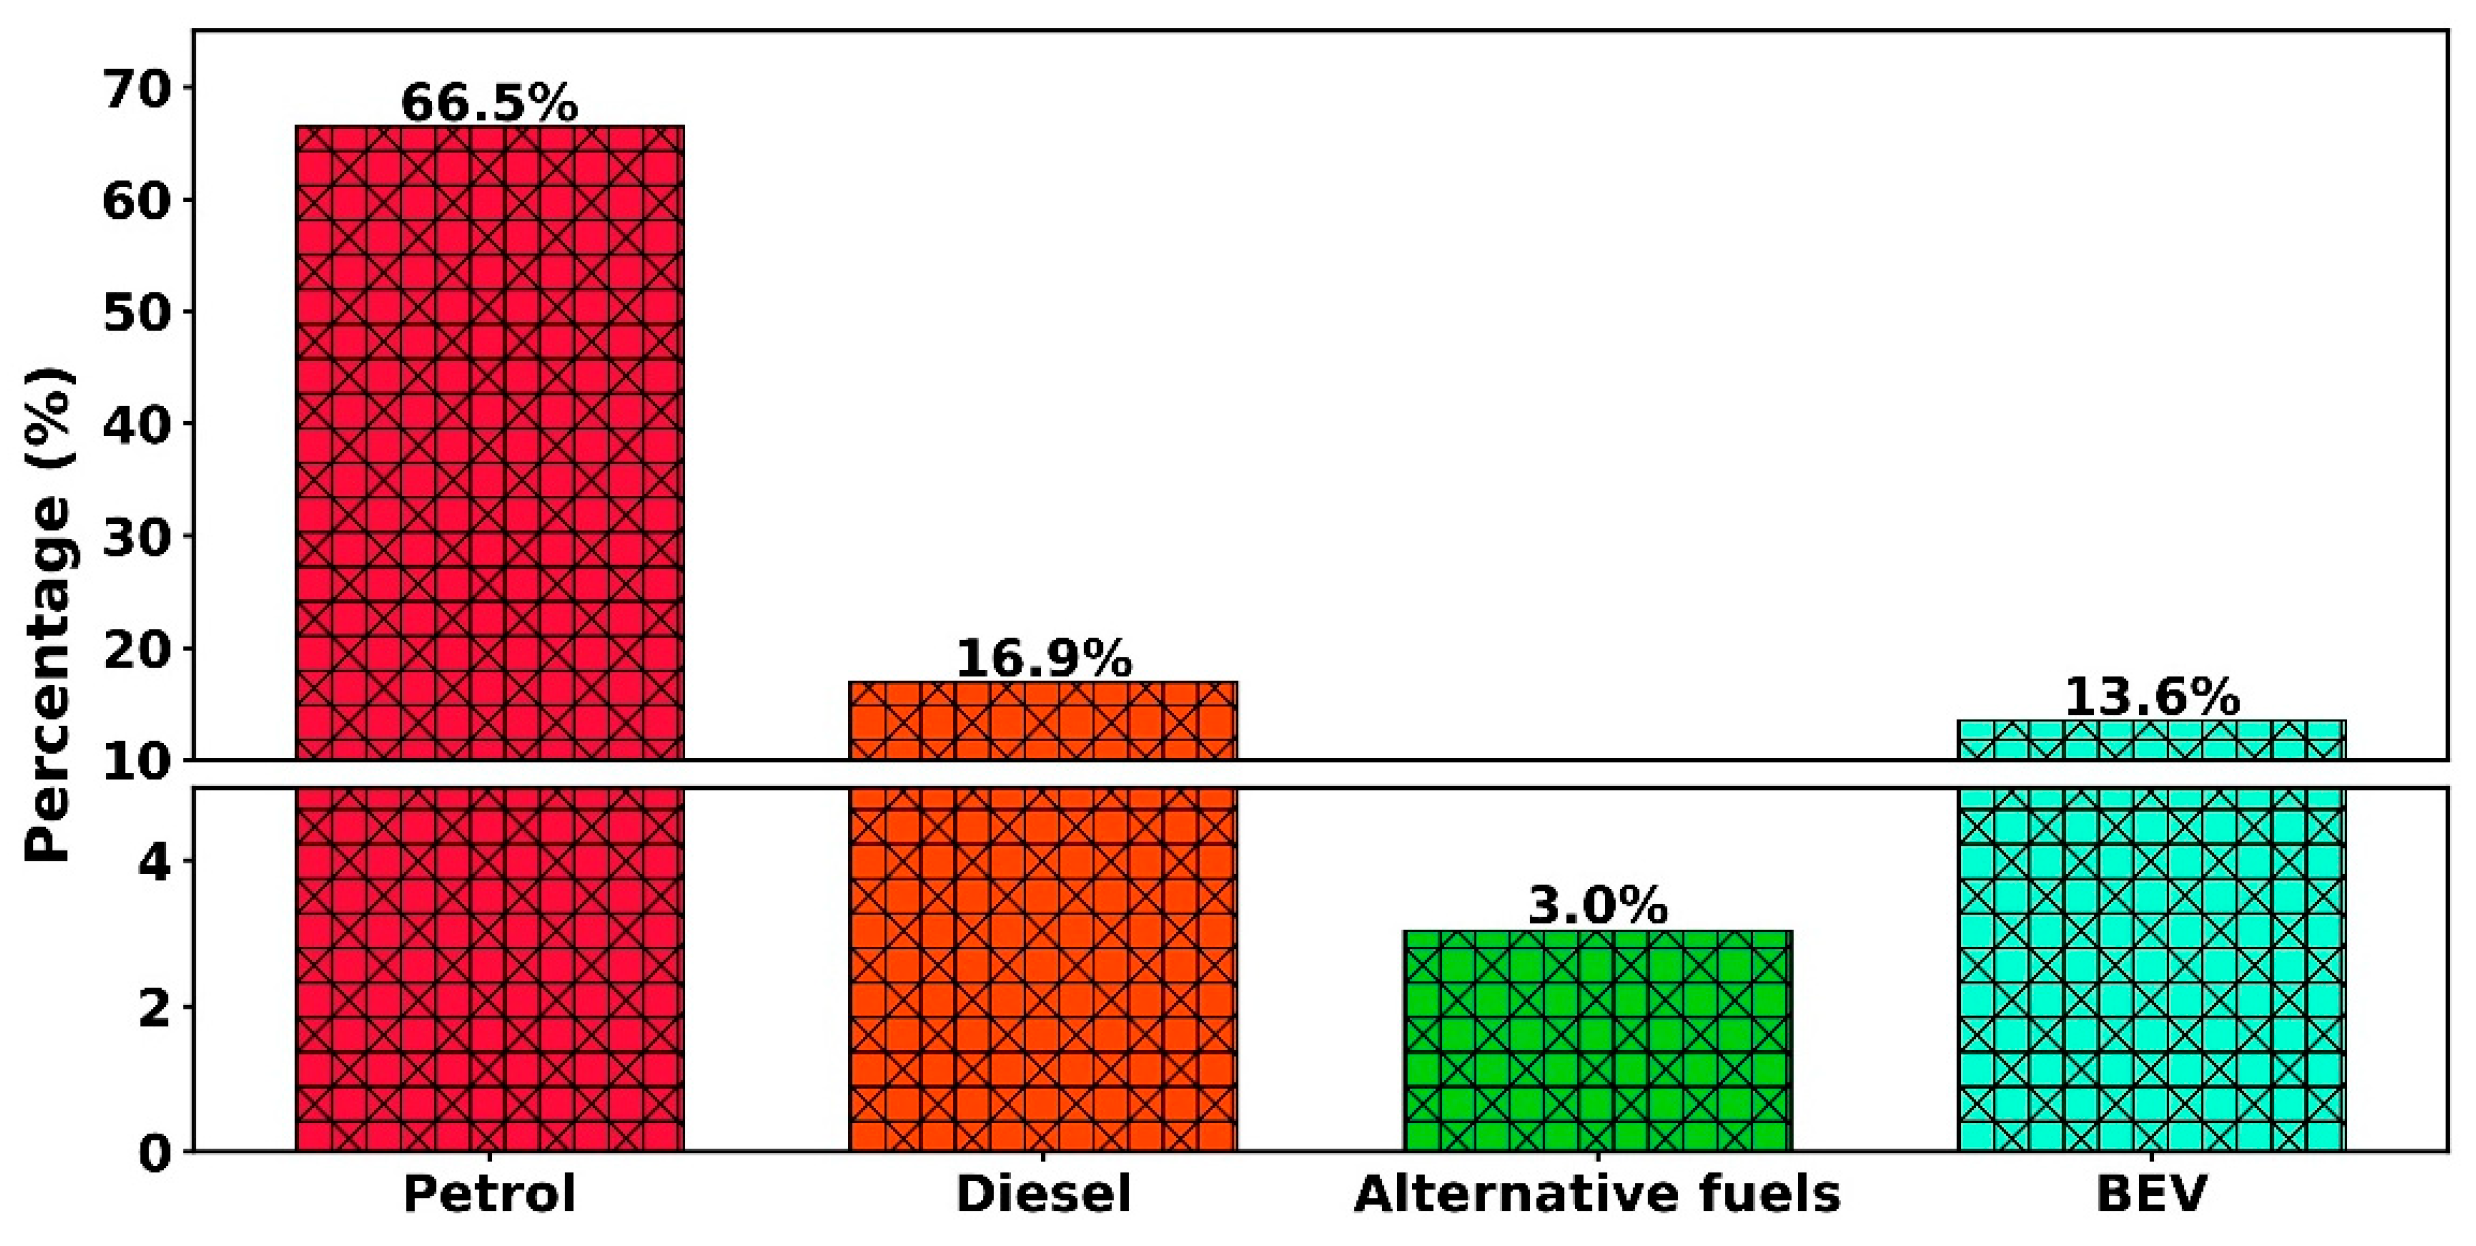
3]. However, approximately 83.41% of these vehicles (66.48% petrol and 16.93% diesel) still have internal combustion engines (ICEs), which primarily depend on fossil fuels [
3].
Figure 1 illustrates the passenger car fleet in the EU by fuel type in 2024 [
3].
In the EU, passenger cars and vans together account for 19% of total CO
2 emissions [
4]. To decrease emissions, the EU has set a fleet-wide objective of 0 g CO
2/km for both vehicle (e.g., cars and vans) categories from 2035 onward, corresponding to a 100% reduction from newly registered vehicles defined in Regulation (EU) 2019/631 [
5], as revised by Regulation (EU) 2023/851 [
6]. Achieving this target requires accommodating a rising number of electric vehicle (EV) users, as EVs are considered one of the key solutions to decreasing greenhouse gas (GHG) emissions and phasing out ICEs. Nonetheless, consumers encounter numerous barriers to adopting EVs, including limited knowledge [
7], high purchase costs [
8], restricted driving range, and primarily the inadequate availability of EV charging stations (EVCSs combine several chargers with varying power outputs; to effectively meet peak demand, this charging infrastructure must be properly sized to avoid high CAPEX for energy and charging infrastructure) [
9], which strongly discourage consumers from buying EVs [
10,
11]. Conversely, the associated GHG emissions may remain substantial when EVCSs are supplied by carbon-intensive electrical grids. In power systems still characterised by a high share of fossil fuels, the net emissions reduction potential of EVs is consequently diminished. This highlights the importance of boosting EV charging infrastructure with increasing penetration of renewable energy sources (RESs) to effectively reduce dependence on fossil fuels and improve the overall environmental performance of the transport sector. Although RES-powered EVCSs are widely assumed to offer techno-economic (techno-economic analysis (TEA) is a technique for assessing a technology’s financial performance, according to the US Department of Energy (DOE); TEA evaluates a technology’s total worth, enabling analysts to appropriately balance costs and benefits [
12]) and environmental advantages, systematic evidence quantifying these benefits relative to conventional grid-connected EVCSs remains limited. Addressing this gap, this study develops an incorporated energy-economic-environmental (3E) optimisation for a RES-powered EVCS in Portugal, assessing its feasibility (a feasibility study is an initial investigation conducted to assess the merits and viability of a proposed project or effort) and comparative performance.
Existing research has investigated EVCS design and operation from 3E perspectives, highlighting the importance of simultaneously assessing investment requirements, operational (technical) performance, and prospective economic profitability. Previous research varies considerably in terms of location, modelling techniques, charger types and numbers, system configurations, and economic parameters employed. To contextualise the contribution of the present work, the relevant literature is synthesised with respect to these dimensions, and the resulting comparative literature matrix is reported in
Table 1.
Hussen et al. performed research at the University Putra Malaysia campus using NSGA-II and conducted Operating Expenses (OPEX assists in the evaluation of the long-term running/ongoing/day-to-day expenses of a project) based economic analysis. However, it lacks environmental and State of Charge (SoC) estimation analysis [
13]. Moreover, Colombo et al. conducted research on public transportation systems while considering an energy system comprising a Photovoltaic (PV)-Battery Energy Storage System (BESS)-grid. Also, they calculated the economic parameters, including Cost of Energy (COE offers insights into future energy cost saving) and NPC, utilising HOMER software in Egypt, although it lacks SoC estimation [
14]. Ahmed et al. developed a two-layer optimisation framework for an EVCS located at a Portuguese university campus while considering the surrounding residential areas. The study considered a PV-BESS-grid configured energy system by employing HOMER and a mathematical optimisation approach based on a Genetic Algorithm (GA). The results indicate that a capital expenditure (CAPEX (CAPEX assists in the evaluation of initial capital investment requirements)) of €0.454 million is required to achieve a COE of €0.114/kWh [
15], indicating relatively competitive performance under the adopted assumptions. However, the study did not include a detailed SoC estimation.
In addition, Li et al. conducted research on public charging posts and only calculated COE in the economic analysis employing TBODWA in the USA, but they did not perform environmental and SoC estimation analyses [
16]. Costa et al. developed an energy system for EVCS that integrates a PV system, an Energy Storage System (ESS), and the grid, using HOMER grid software in Portugal [
17]. The energy system is designed for two levels of EV chargers (L-2 is semi-fast-charging, and L-3 is fast-charging) [
17]. To develop the energy system, €30,324 is required as CAPEX, and a COE of €0.156/kWh is achieved. This value can be considered moderate for small-scale systems integrating ESS technologies, although there is a lack of information regarding the design of the load profile (a load profile is a graph representing power consumption over time [
18]) of the proposed EVCS. Moreover, Osorio et al. proposed a model for EVCS with solar rooftops in Portugal [
19]. The model is developed in the General Algebraic Modelling System (GAMS) using the Mixed Integer Linear Programming (MILP) solver. A PV-grid energy system is considered for the EVCS, supplying electricity to 110 EVs. The charging infrastructure is limited to L-2 chargers. Hence, SoC and load profile estimation are not clearly mentioned in their research.
Table 1.
Summarised literature matrix of the selected paper.
Table 1.
Summarised literature matrix of the selected paper.
| Reference | Location | Year (yr) | Simulation Tool/Method | Application | Charger Levels | Energy System Configuration | Charger Number | Economic Parameters | Limitations
(Analysis) |
|---|
| Lack of Economic | Lack of Environmental | Lack of SoC Estimation |
|---|
| [13] | Malaysia | 2025 | NSGA-II | University | NS | NS | NS | OPEX | No | Yes | Yes |
| [14] | Egypt | 2025 | HOMER | Public Transportation | NS | PV-BESS-grid | NS | COE, NPC | No | No | Yes |
| [15] | Portugal | 2025 | HOMER, GA | University
and Residential | L-3 | PV-BESS-grid | NS | COE, NPC, CAPEX, OPEX | No | No | Yes |
| [16] | USA | 2024 | TBODWA | Public Charging Post | NS | NS | NS | COE | No | Yes | Yes |
| [17] | Portugal | 2022 | HOMER Grid (version 1.8) | NS | L-2, L-3 | PV-ESS-grid | 2 | COE, NPC, CAPEX, OPEX | No | Yes | Yes |
| [20] | Romania | 2019 | HOMER Pro | Residential | L-2 | PV-grid-WT-BESS | 2 | COE | No | Yes | Yes |
| [19] | Portugal | 2021 | GAMS, MILP | University | L-2 | PV-grid | 110 | COE | No | Yes | Yes |
| [21] | Bangladesh | 2023 | FLC, RNN, LSTM, HOMER | Airport | L-3 | PV-WT-grid | 25 | COE, NPC, CAPEX, OPEX | No | No | Yes |
| [22] | Qatar | 2022 | HOMER Pro | NS | L-3 | PV-WT-Biomass-ESS | 50 | COE, NPC | No | No | Yes |
| [23] | Türkiye | 2019 | ETAP | NS | L-2 | PV-grid | 100 | NS | Yes | Yes | No |
| [24] | NS | 2020 | MILP, GAMS | NS | L-1, L-2, L-3 | BESS-WT-grid | 14 | CAPEX | No | Yes | Yes |
| [25] | Spain | 2022 | GA | Technology Park | L-1 | PV-WT-grid | NS | COE | No | Yes | Yes |
| [26] | Italy | 2025 | AnyLogic (version 8.8.0) | Highway | NS | NS | NS | NS | Yes | Yes | No |
| [27] | Australia | 2020 | MATLAB (version 2018b) | NS | NS | WT-PV-CSP-grid | NS | COE, CAPEX | No | Yes | No |
| This work | Portugal | - | Python (version 3.10), HOMER (version 3.18.4) | University | L-3 | PV-WT-grid | 25 | COE, CAPEX, OPEX, NPC | No | No | No |
Turan et al. investigated the effect of EVCS equipped with roof-mounted PV panels in Türkiye [
23]. They utilised the Electrical Transient Analyzer Program (ETAP) environment to conduct the simulation, where they utilised a combined PV-grid system for EVCS. Conversely, they randomly selected the parking duration, and they kept the load profile the same for one calendar year every day, which could be considered a limitation of the study. Furthermore, Hasan et al. proposed an EVCS for an international airport in Bangladesh [
21]. They utilised Fuzzy Logic Control (FLC), Recurrent Neural Network (RNN), and Long Short-Term Memory (LSTM) to develop the load profile, and they conducted an energy-economic assessment using HOMER software. Also, to achieve the optimised results, €3.1 million (
$3.6 million) is required as CAPEX for setting up the EVCS [
21]. Although SoC estimations or assumptions are not explained in the research. Also, Li et al. conducted research on EV charging facilities in Australia, considering the possibility of a 100% RES-powered energy system [
27]. They conducted the simulation in MATLAB 2018b, and the best possible outcomes are obtained by utilising a combination of WT-PV-CSP-grid energy systems. Moreover, Australia needs 205 GW of installed capacity to fulfil the demand for passenger vehicles at an energy rate of €0.087/kWh (0.147 AUD
$/kWh). However, they developed the load profile only considering typical summer and winter weeks, which did not explain how they estimated the load profile for the entire year.
The literature reviewed in this work discloses a range of methodologies for developing EVCS and EVCS-related energy systems. Nonetheless, despite substantial research efforts, existing studies do not yet comprehensively address all relevant aspects. Most studies do not offer an integrated assessment approach that combines technical, economic, and environmental dimensions within a unified framework. In addition, SoC-based EV charging load modelling is primarily absent or only partially addressed. Finally, EV load profiles are frequently assumed rather than derived from real-world data, and the literature lacks a methodological approach. Building on gaps, this study develops an energy-economic-environmental (3E) optimisation framework to assess the feasibility and performance of a RES-powered EVCS at NOVA University Lisbon (UNL). Several steps are taken into consideration to achieve the main objective of this work. First, a data-driven EVCS load profile is developed using real parking data, to address one of the most persistent limitations in prior research, where EV charging demand is often assumed. Second, the framework integrates energy, economic, and environmental aspects within a unified assessment, simultaneously analysing Net Present Cost (NPC allows the assessment of different system configurations), COE, CAPEX, OPEX, and emissions. Third, SoC-based charging behaviour is integrated to enable a more accurate representation of EV-EVCS interactions. Finally, bidirectional grid exchanges, including energy purchases and sales, are modelled to provide a thorough evaluation of long-term financial sustainability.
This paper is divided into five parts: the second part is dedicated to the methodology of the work; in the third part, the results of the work are reported and analysed. Afterwards, the fourth section is dedicated to discussion, where the results of this work are compared with the literature. The last section is devoted to the conclusion of the work.
2. Materials and Methods
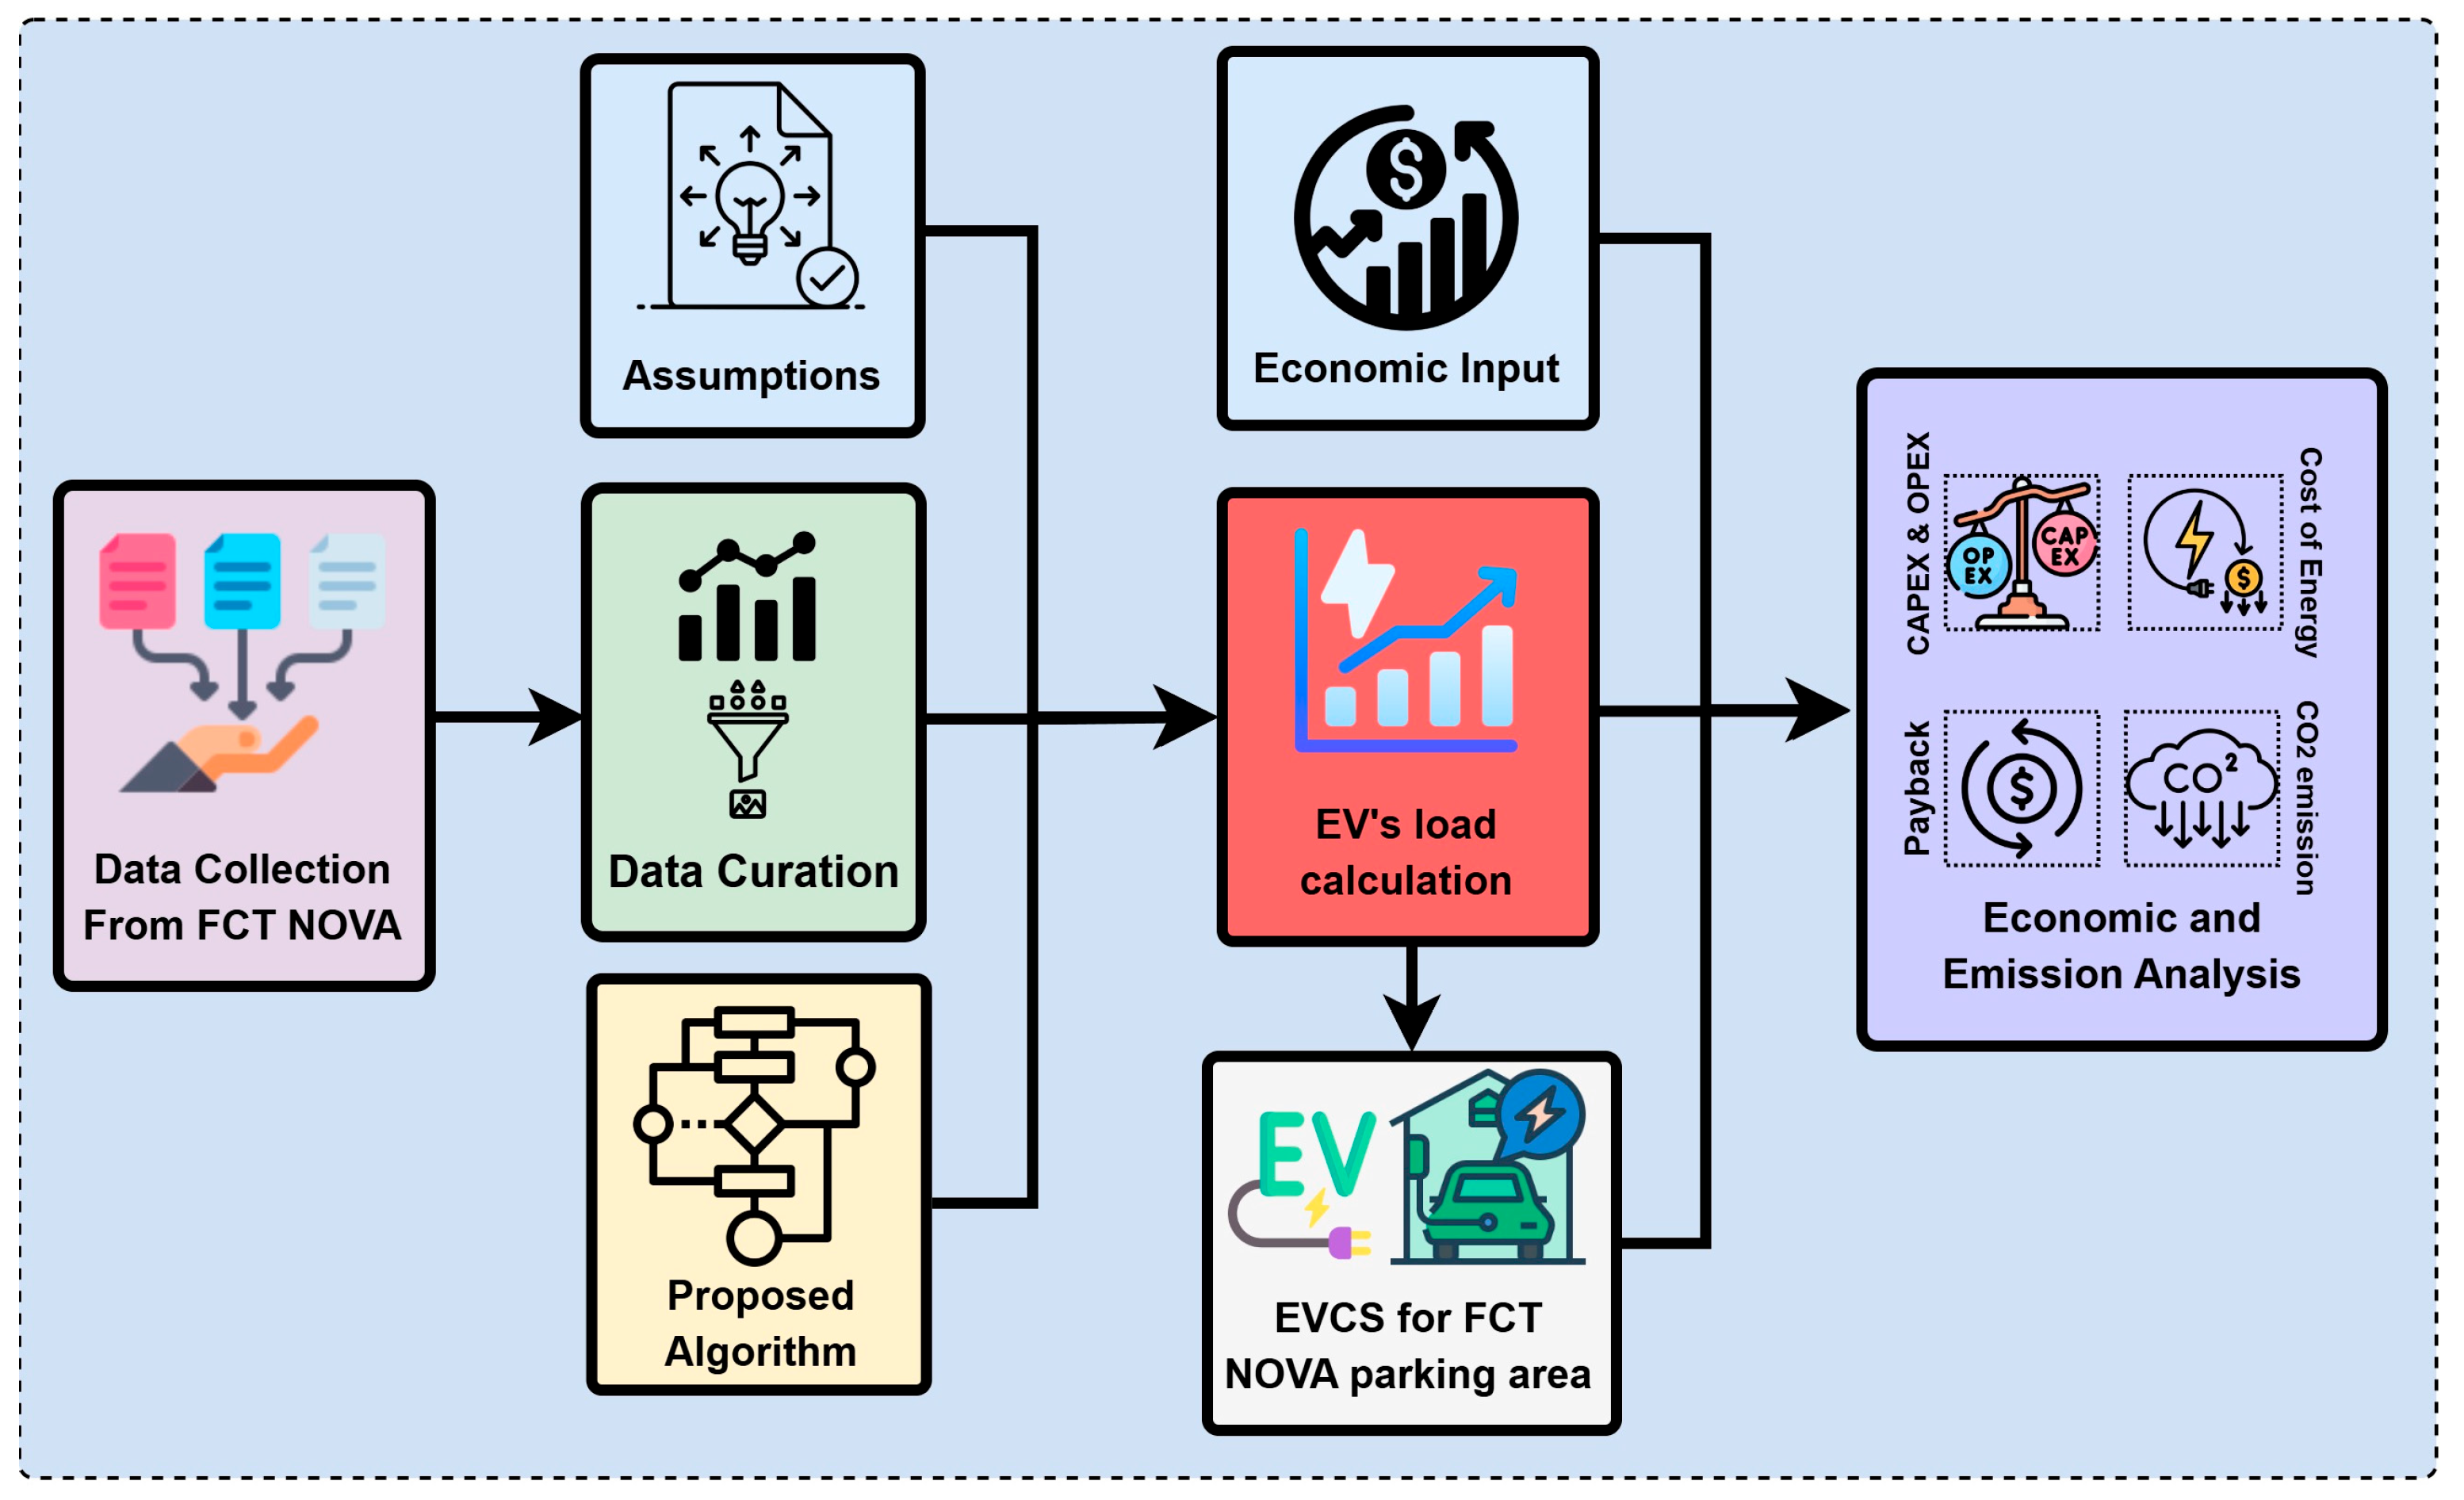
This paper develops a seven-step methodological framework. The first step involves analysing the EVCS case study and its contextual characteristics. The aim of this phase is to define the physical and socio-spatial conditions that influence the EVCS’s design. To this end, detailed information on the geographical location, surrounding urban context, and accessibility was collected to understand the potential user types and identify how many people are expected to benefit from the EVCS. The second step is an assessment of local energy resources. Its objective is to determine which RES can be integrated into the system. Meteorological data relevant to the site, such as solar irradiation, wind speed, and other parameters depending on the technologies considered, were gathered and analysed to assess the RES’s potential that can later assist system sizing for the EVCS. The third step comprises the algorithm design and data preparation. The objective is to create a reliable, internally consistent dataset that describes patterns of vehicle parking in the EVCS. For parked vehicles, the NOVA School of Science and Technology (FCT NOVA) provided data on the Time of Arrival (ToA) and Time of Departure (ToD). A dedicated rule-based algorithm was then constructed to clean, filter, and structure these data, solving inconsistencies, addressing missing values, and organising the dataset into a suitable form for energy system modelling. A rule-based algorithm follows predefined logic to achieve the desired output; rule-based algorithms provide many advantageous characteristics; rule sets are generally comprehensible for individuals [
28]. The fourth step focuses on the technical assumptions required to estimate the load profile and determine EV consumption. Assumptions were made regarding vehicle characteristics and operational constraints, as well as EV users’ behaviours. These assumptions provided the foundation for estimating EV charging patterns.
Furthermore, the fifth step focuses on the estimation of the EVCS load profile for this study. The crucial goal of this step is to determine the temporal distribution of energy demand. To determine the estimated load profile over time, a set of equations was developed to curate the ToA and ToD datasets and assumptions (see
Section 2.4). The resulting load profile illustrates how much energy the EVCS is expected to consume under different usage scenarios. The sixth step is dedicated to determining the system size and defining the scenario for this study. The system sizing process includes determining the appropriate capacity of generating units and other system components, as well as matching the EVCS demand profile to the assessed RES potential. Collectively, these steps provide the required foundation for the final step of the methodology, which evaluates the 3E analysis’s performance of the proposed system configurations. Furthermore, the gathering of technical, economic, and environmental inputs is the main aim of the seventh part. Technical, economic, and environmental inputs, gathered from research papers and reports, were combined and later fed into HOMER (the HOMER program is created to conduct techno-economic optimisation to choose the most practical hybrid energy system for a given area based on NPC and Levelized Cost of Electricity (LCOE) [
29]) software. Moreover, 3E optimisation was performed, utilising the simulation tool HOMER for the considered scenarios to calculate economic and emission parameters, including CAPEX, OPEX, COE, payback, and reduced CO
2 emissions.
Figure 2 illustrates the methodology of this work.
2.1. Location of the EVCS
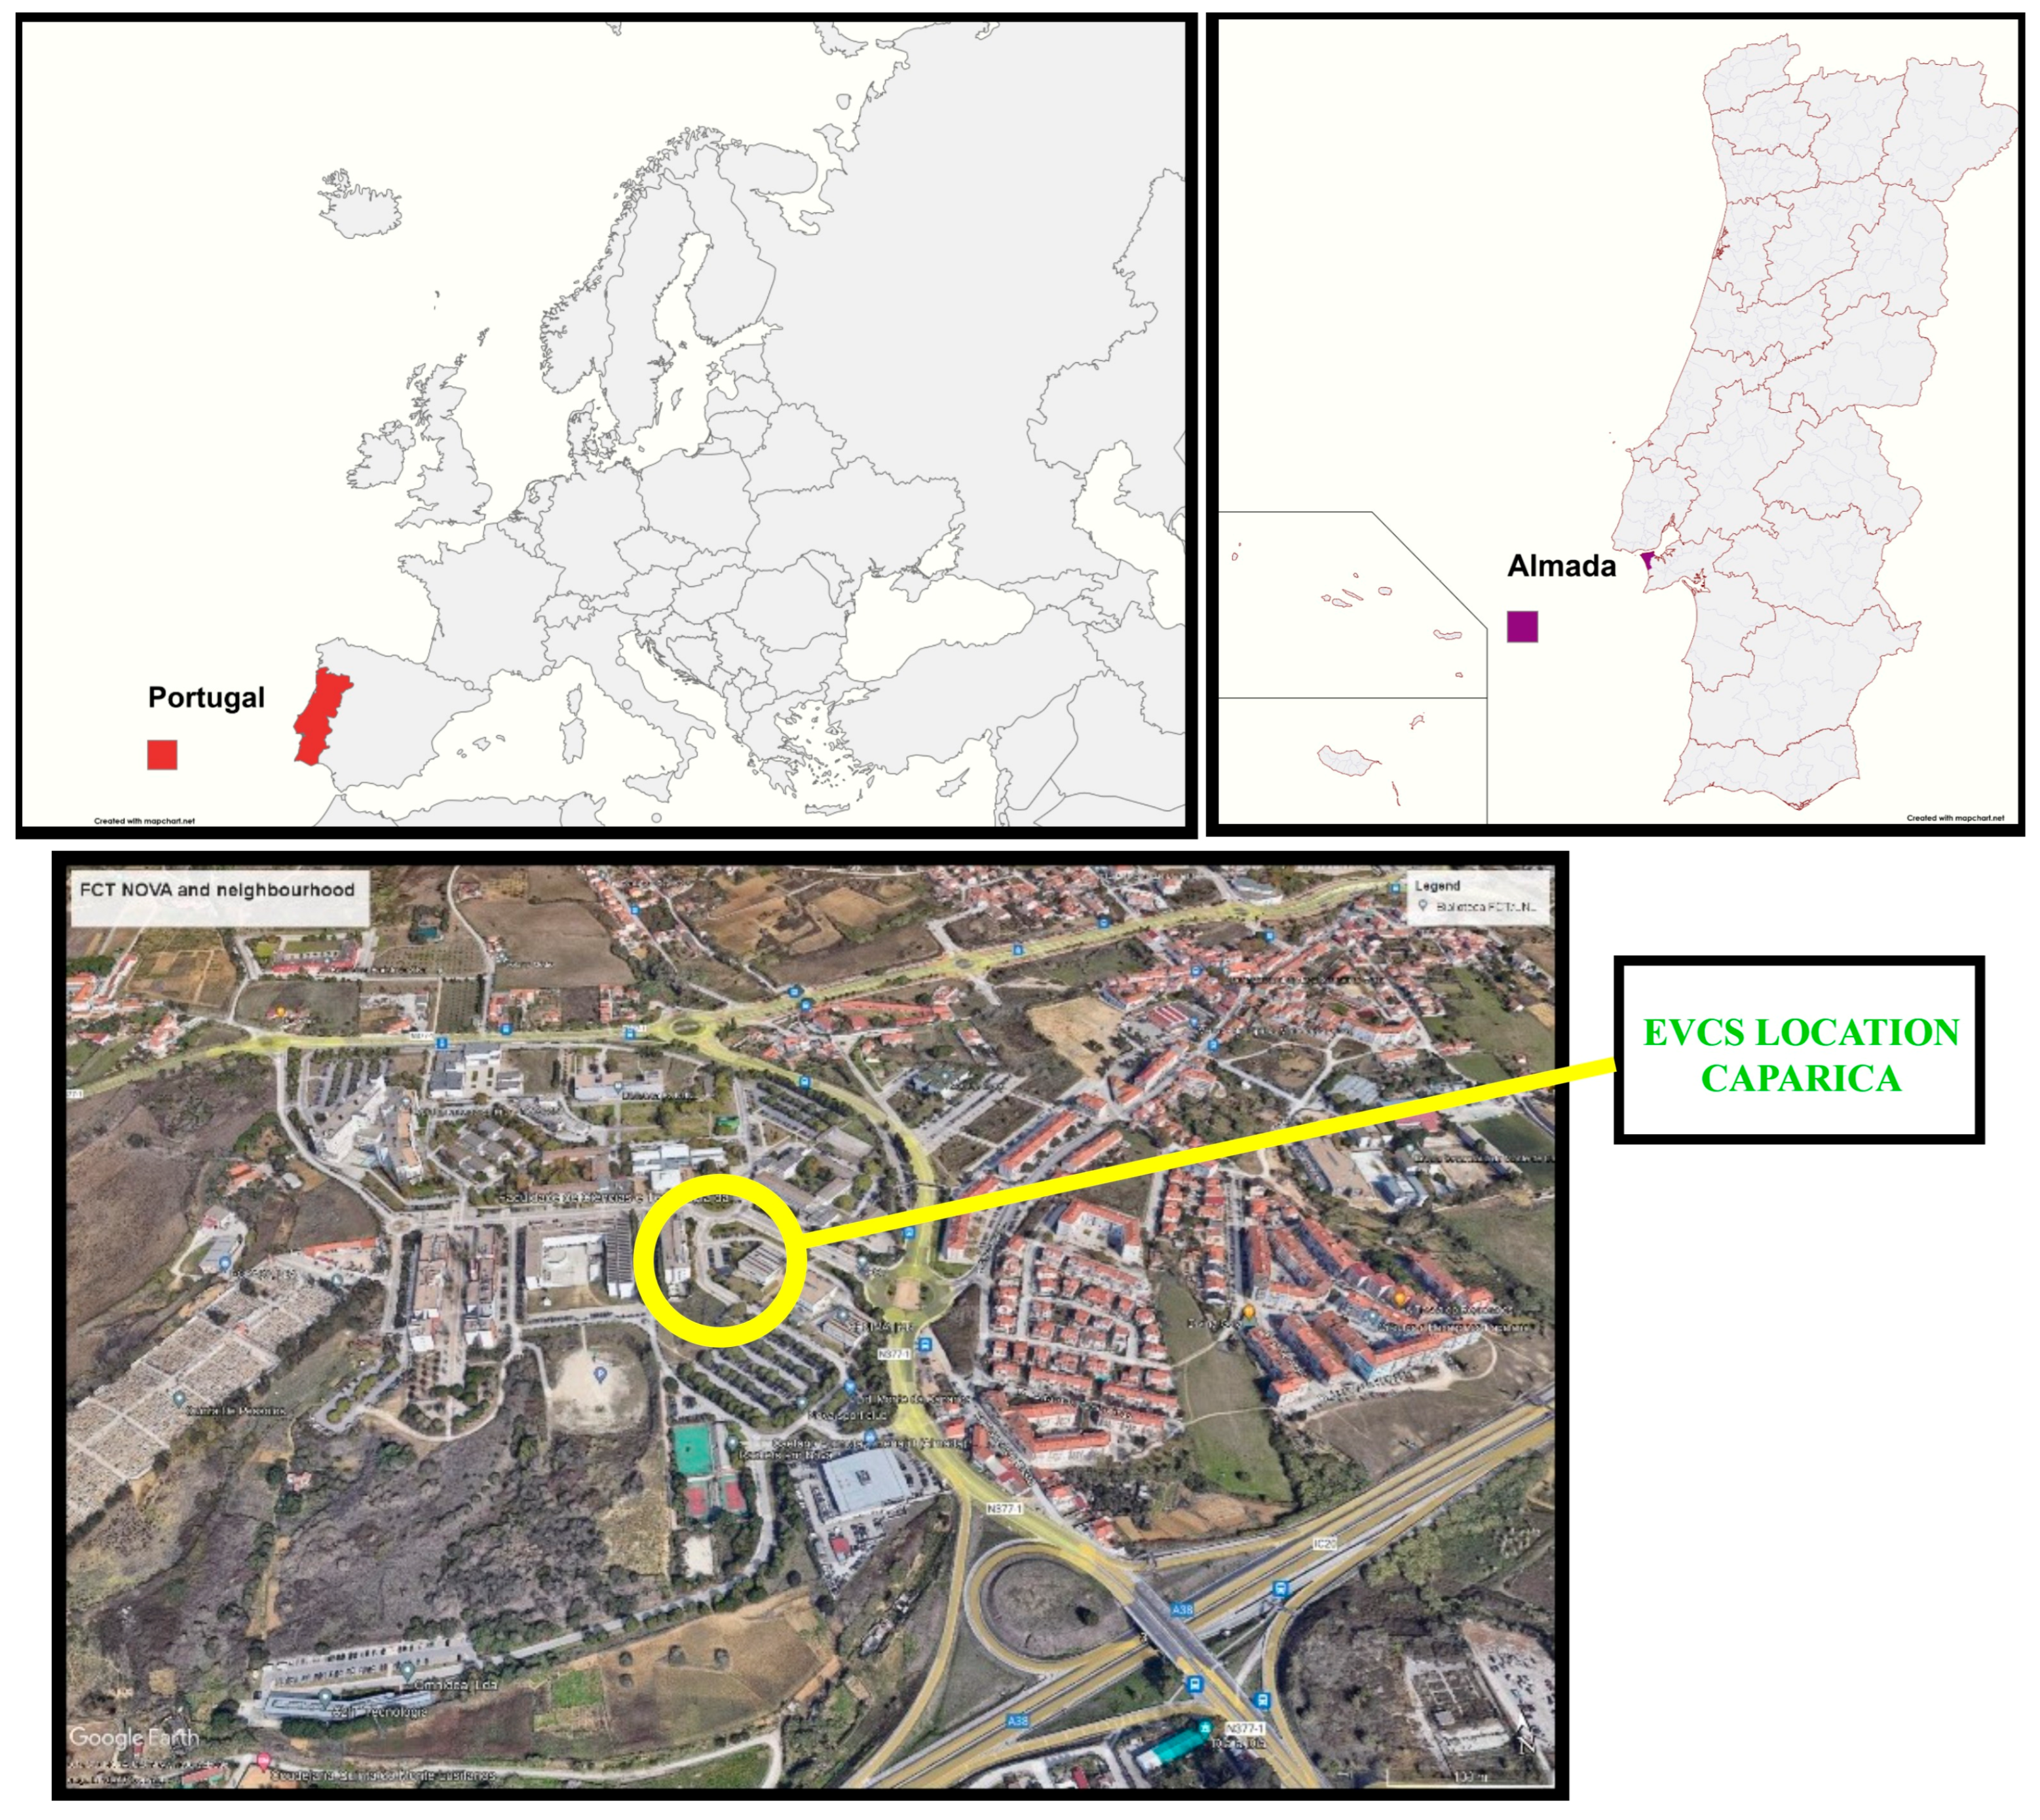
Caparica is located within the municipality of Almada in the Lisbon metropolitan area, Portugal [
30]. The proposed EVCS site is located on the campus of FCT NOVA, which hosts 8500 students [
31]. This makes the location particularly suitable for EVCS development, as the university (as a pilot case, many people arrive every week at the university, including teachers, researchers, staff, students, and visitors; as many people come to the university by utilising different transportation systems (including cars), this was considered a living lab for our analysis) serves a large and diverse population. Furthermore, the surrounding area includes residential buildings whose occupants could also benefit from the EVCS. The site also offers favourable renewable energy conditions, as its coastal location ensures high solar irradiance levels and substantial wind resources.
Figure 3 displays the location of the EVCS.
2.2. Energy Resources Assessment
Following the identification of the study location in the last subsection (see
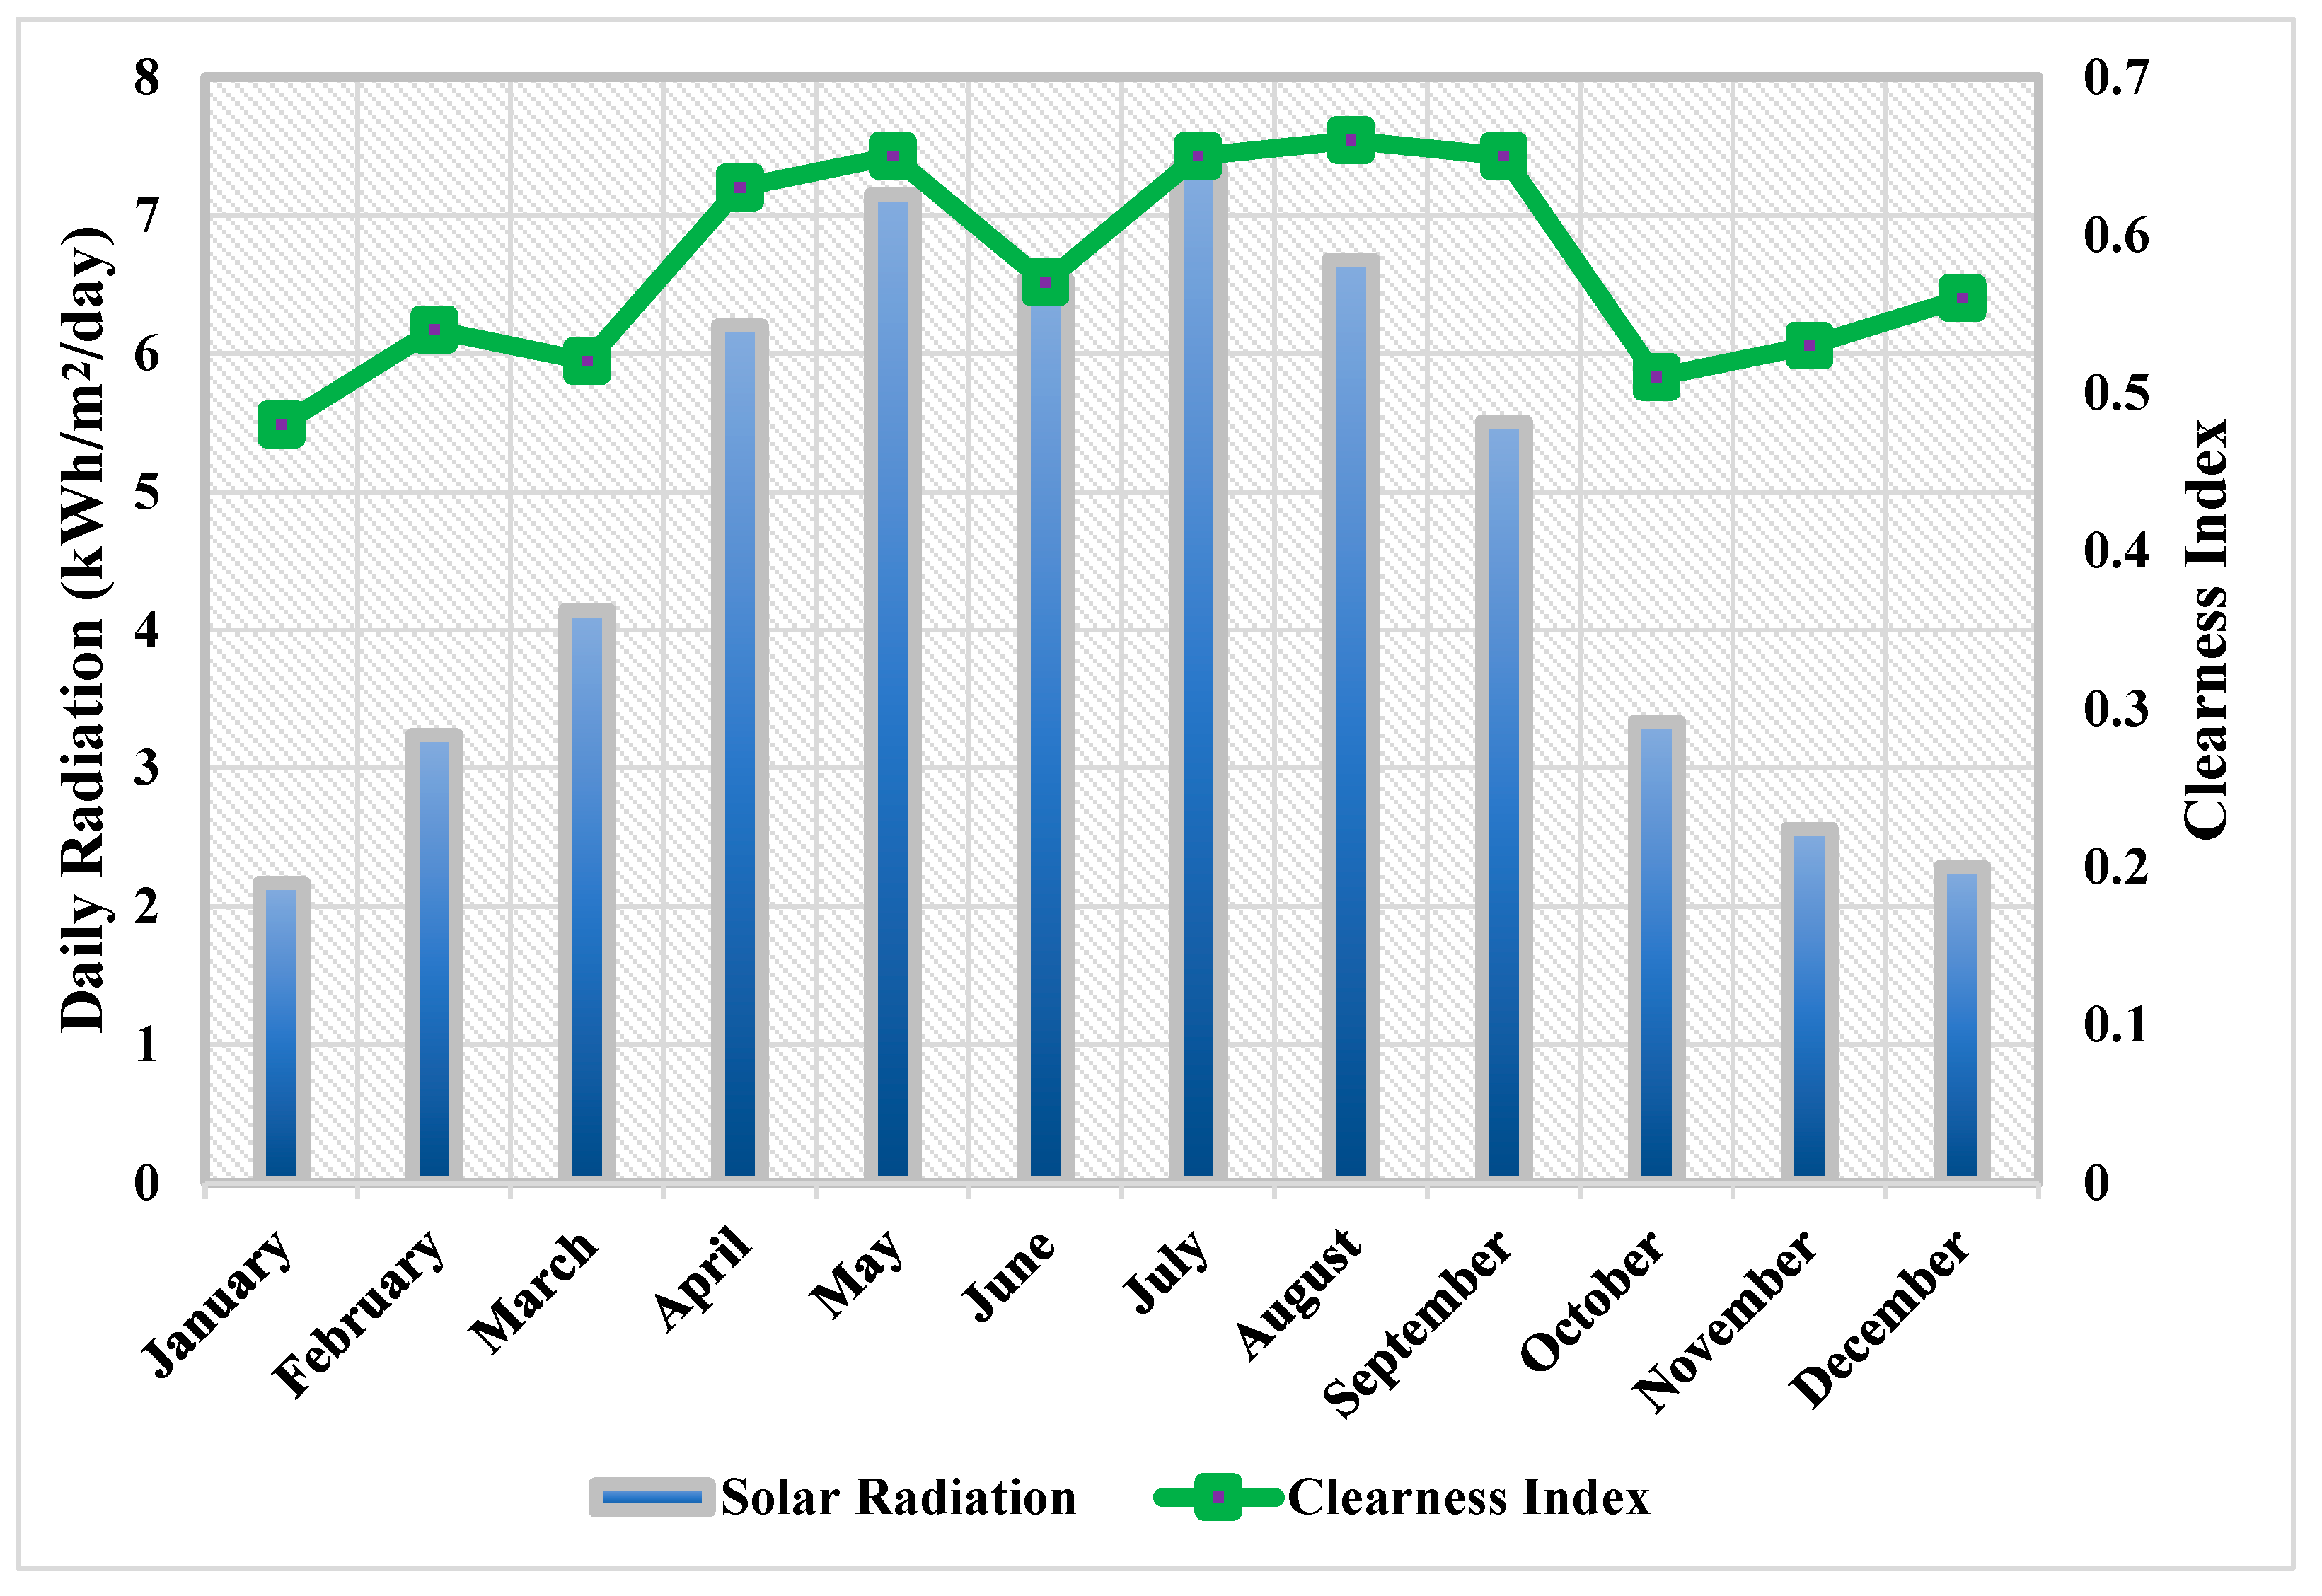
Section 2.1), an energy resource assessment is performed to determine which RES can be incorporated into the EVCS. The analysis focused on two essential factors, including (i) wind speed and (ii) solar radiation. This assessment led to the selection of solar and wind energy as potential sources of energy for the system. The high solar potential of this location enables the installation of PV panels, while its coastal location and consistently favourable wind conditions enable the installation of small wind turbines (WTs). The site’s average daily solar irradiance is 4.77 kWh/m
2/day, and the mean wind speed is 5.74 m/s [
32], confirming the suitability of these resources for integration into the EVCS energy system.
Figure 4 illustrates the monthly solar radiation to understand the potential of the selected location with a clearness index.
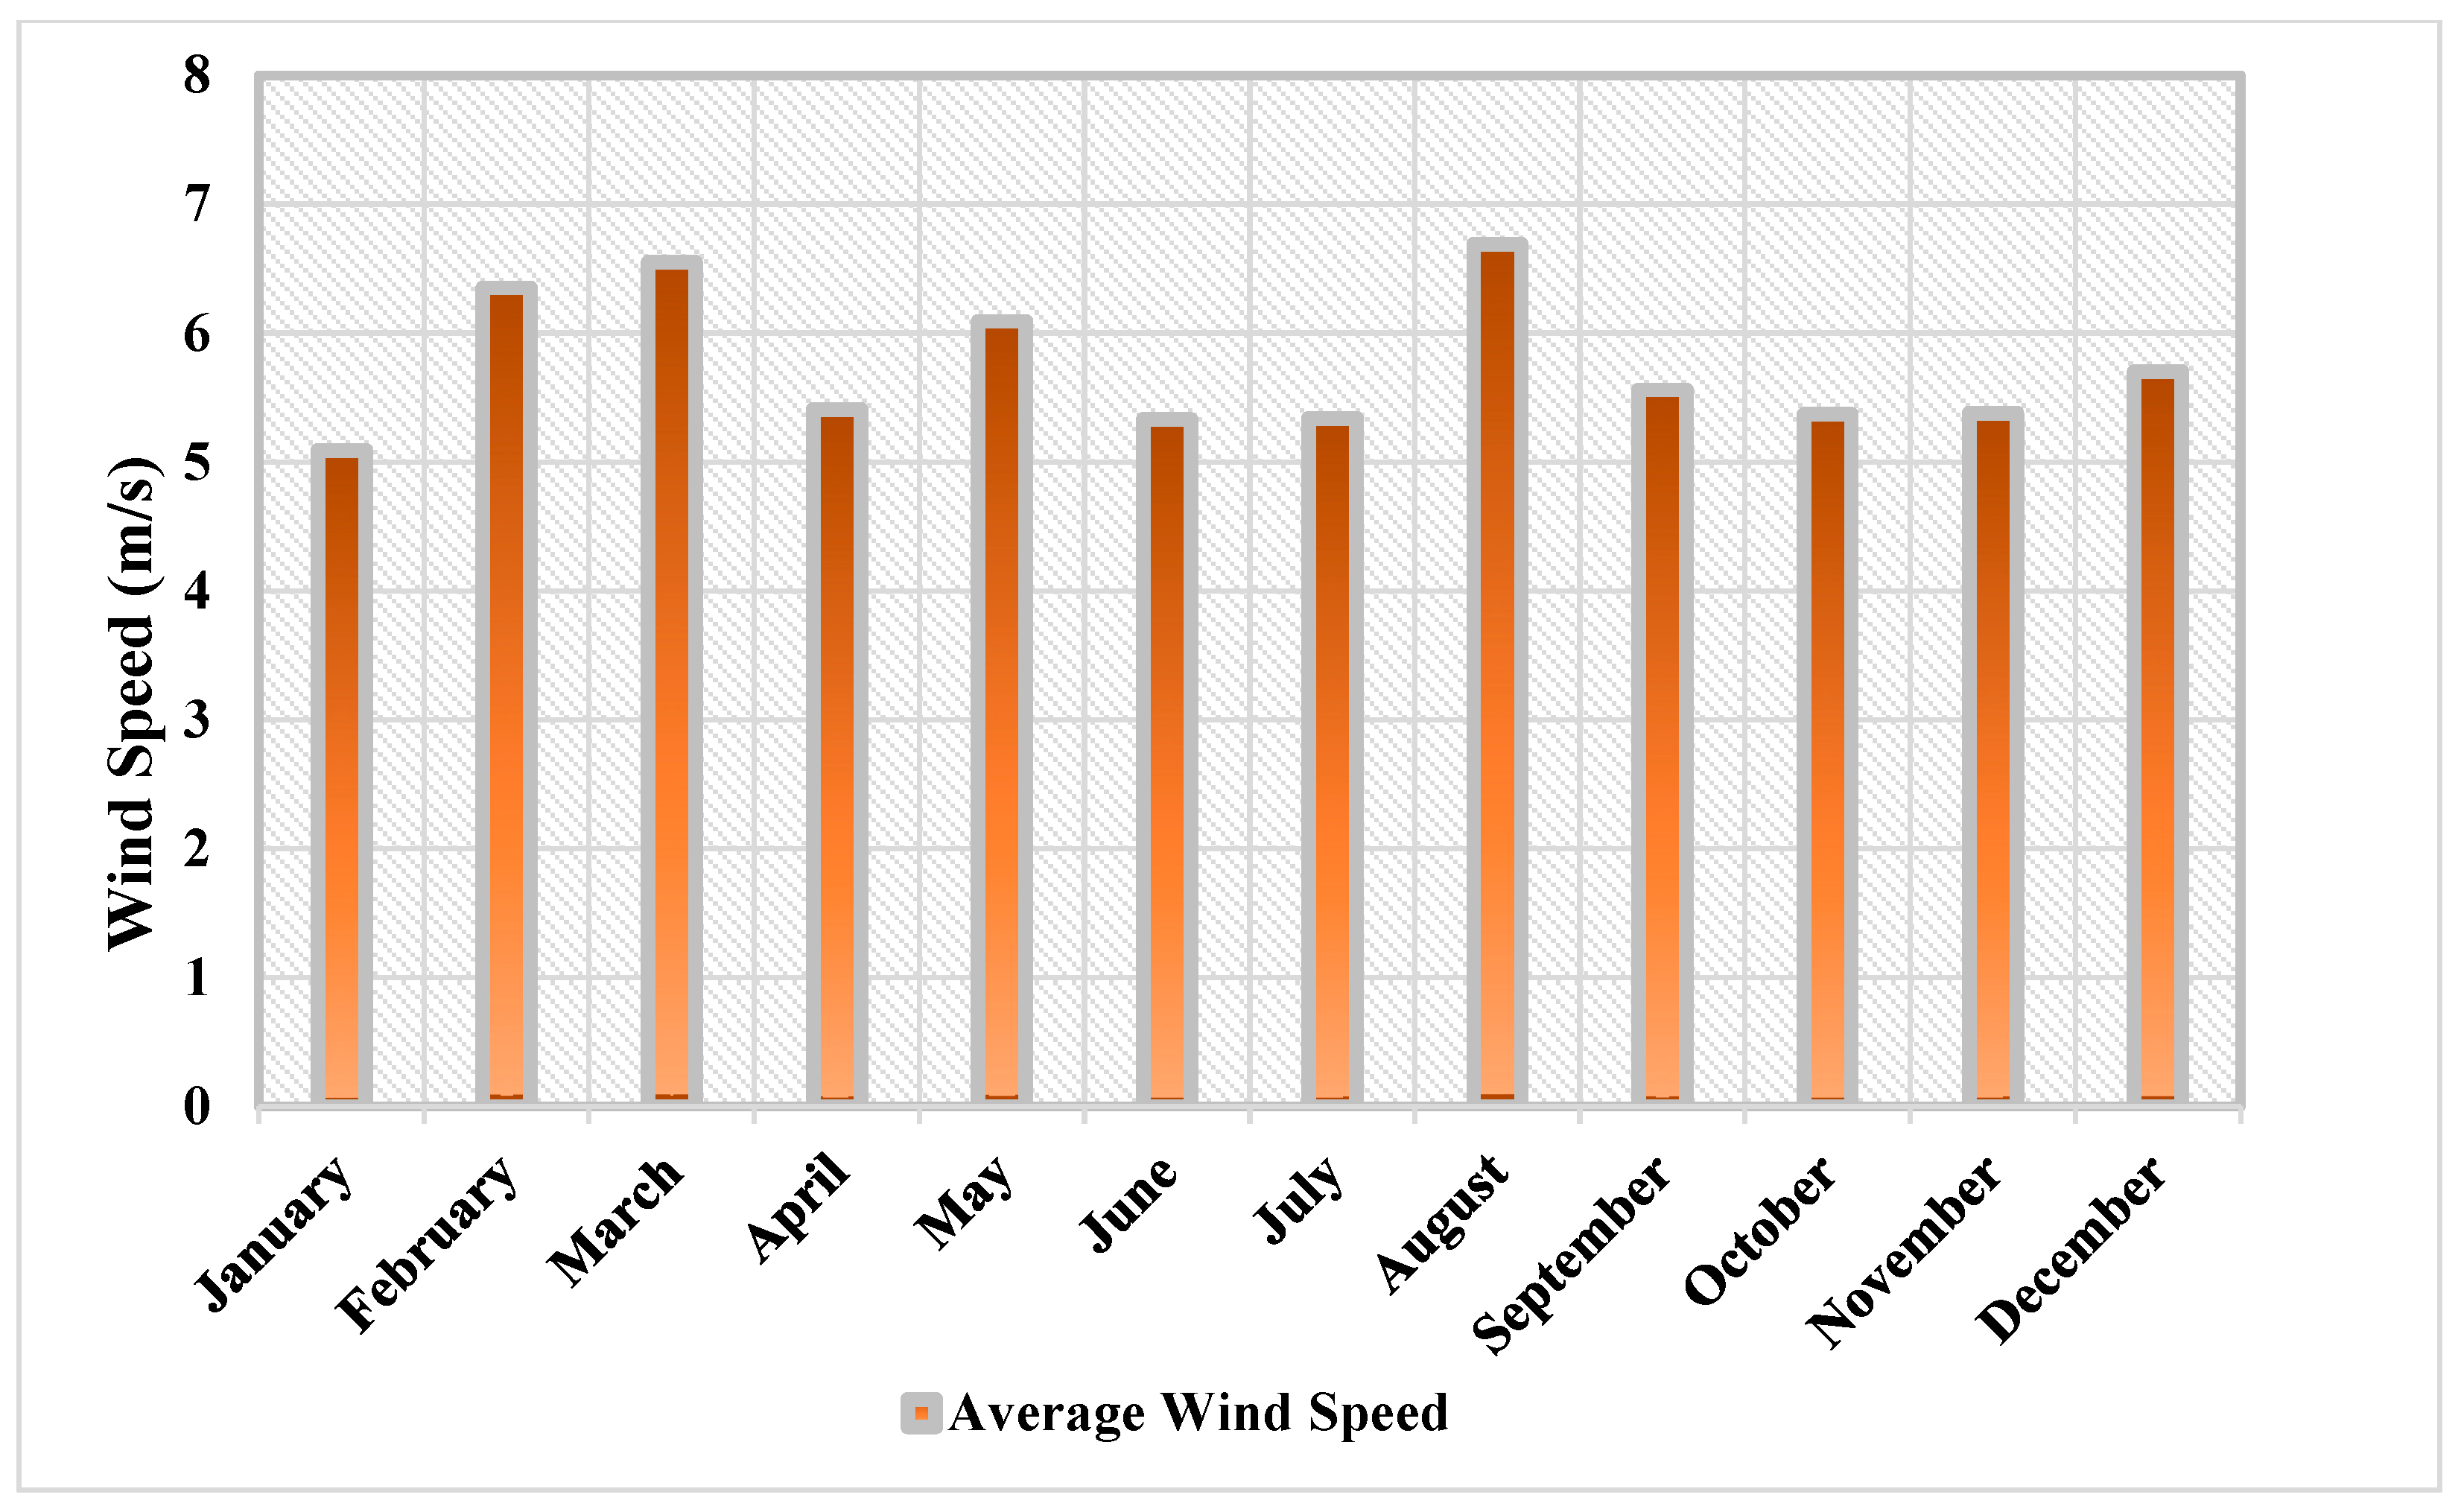
Figure 5 displays the wind speed to understand the potential of the selected location.
2.3. Data Collection, Data Curation and Algorithm Design
At first, data on the ToA and ToD of parked cars on the FCT NOVA campus were collected to analyse parking occupancy patterns and estimate the average duration of stay. During the data examination phase, a significant challenge emerged: due to General Data Protection Regulation (GDPR) restrictions, vehicles cannot be individually identified, making it impossible to determine precisely which vehicle arrives or departs at a given time. Consequently, no vehicle-specific tracking information is available. Nevertheless, ToA and ToD records are provided, allowing for the construction of aggregated parking behaviour profiles. A Python (version 3.10) script was prepared with the developed rule-based algorithm by utilising the First In-First Out (FIFO which means “First In, First Out”, and is an asset management and valuation method in which older inventory is moved out before new inventory comes in; the first goods to be sold are the first goods purchased [
33]) method [
34]. Several researchers employed the FIFO method for EVCS parking lot scheduling in the literature [
34,
35,
36,
37].
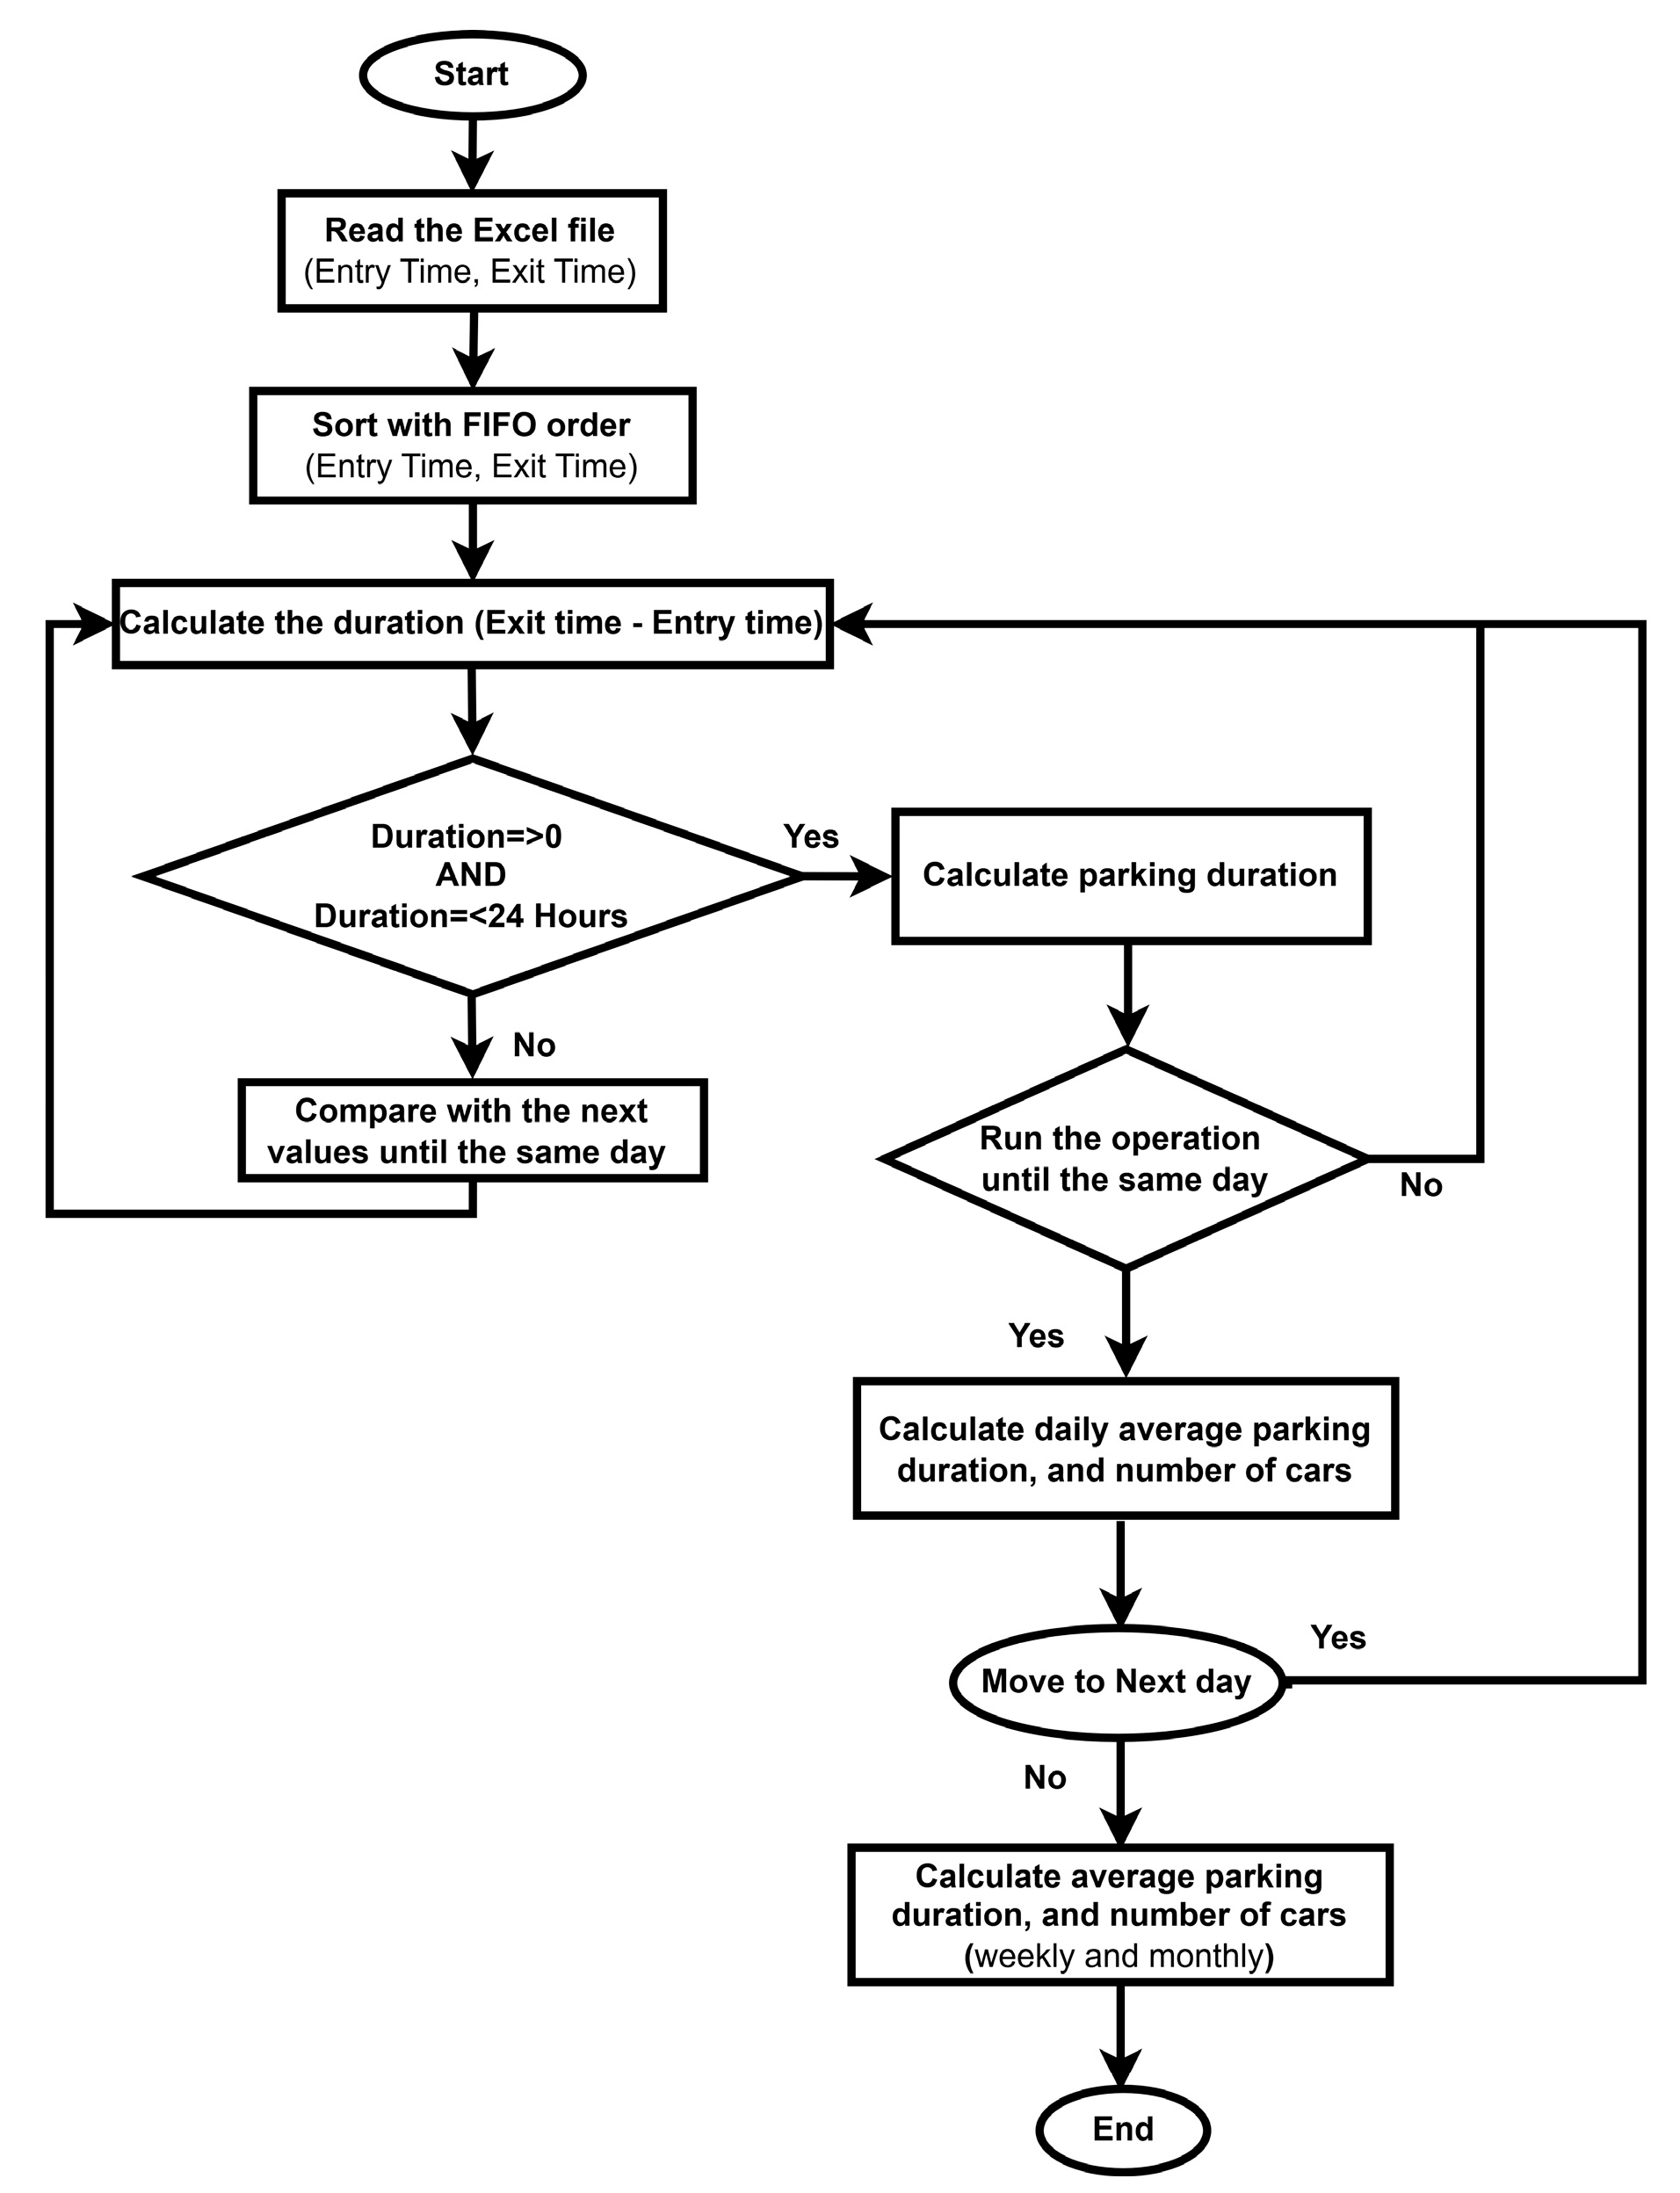
Because the dataset was fully anonymised, data curation was required. An algorithm was therefore developed, consisting of five steps to process. In the first step, the dataset was imported, and the records were sorted using FIFO order to ensure chronological consistency between arrival and departure times. In the second step, the duration was calculated (the arrival (entry) time was subtracted from the departure (exit) time to calculate the duration of staying time in the University): if duration was ≥0 AND duration was ≤24 h, then went to the next operation; otherwise, it continued running the loop again (if arrival time was greater than the departure time, the algorithm removed it from the dataset). The third step calculated the average hours in the parking area by each vehicle in each week, excluding the vehicles that remained on campus for more than 24 h. The fourth step calculated the average number of cars arriving each day, each week, and each month. Finally, the fifth and last step concluded the loop (see
Figure A1).
2.4. Assumptions
A few key assumptions are used to design the EVCS load profile, since several types of vehicles enter the parking lot and no information is available on vehicle type (e.g., ICE, hybrid EV, or full EV). According to [
38,
39,
40], EVs represent around 4% of the total passenger car fleet in Portugal. However, in 2024, 34.1% of newly registered vehicles are EVs [
41], although this still represented a relatively small share of the overall vehicle stock. Since the EVCS is designed with a planning horizon of 25 years, it is assumed that the market share of EVs will increase over this period. For modelling purposes, a projected total EV penetration rate of 15% is adopted [
38,
39,
40]. For sensitivity analysis purposes, penetration rates of 30% and 45% are also considered. These values exceed current EV fleet penetration (4% in 2024), but are considered to capture a wider range of possible long-term market developments. The operational time of the EVCS is from 10:00 to 17:00, while from 17:00 to 10:00, the EVCS is not operational. In total, 8 h of operation are considered, corresponding to the university’s peak activity period. The top-selling EVs are checked in Portugal for the year 2024. It was found that the Tesla Y model was the most sold one [
41]. Moreover, 8 EV models are considered in this study, including Tesla, BMW, Volvo, Mercedes-Benz, Citroën, Peugeot, BYD, and MG [
42]. The charging curve of the 8 models is also checked and utilised in this study [
43,
44]. The load profile consisted of 6 different pattern assumptions (in the absence of sufficiently detailed datasets for analytical modelling, several data patterns must be inferred, hereafter referred to as pattern assumptions; these assumptions approximate user charging behaviour when empirical evidence is lacking; a user’s charging pattern reflects the relationship between individual charging practices and the spatial distribution of charging infrastructure, which jointly influence charging efficiency [
45]), including Pattern 0 (Day 1-Day 60), Pattern 1 (Day 61-Day 120), Pattern 2 (Day 121-Day 180), Pattern 3 (Day 181-Day 240), Pattern 4 (Day 241-Day 300), and Pattern 5 (Day 301-Day 365). The pattern percentage distributed by utilising Generalised Gaussian Distribution (GGD has frequently been used for statistical fitting in order to formulate the marginal distribution of the wavelet outcome) from [
46]. Accurate distribution modelling is essential in EVCS planning because charging demand is inherently stochastic and influenced by heterogeneous user behaviour. Variables such as arrival time, departure time, and SoC at arrival do not follow deterministic patterns, but exhibit variability that significantly affects peak load estimation, charger utilisation, renewable integration, and storage sizing. Conventional models often assume a standard Gaussian distribution; however, real-world charging behaviour frequently exhibits skewness characteristics that cannot be adequately captured by symmetric Gaussian distributions [
47]. For example, the battery capacity in kWh and the range in km showed a skewed distribution [
48]. The GGD enables a more accurate representation of charging clustering and extreme simultaneity events [
46,
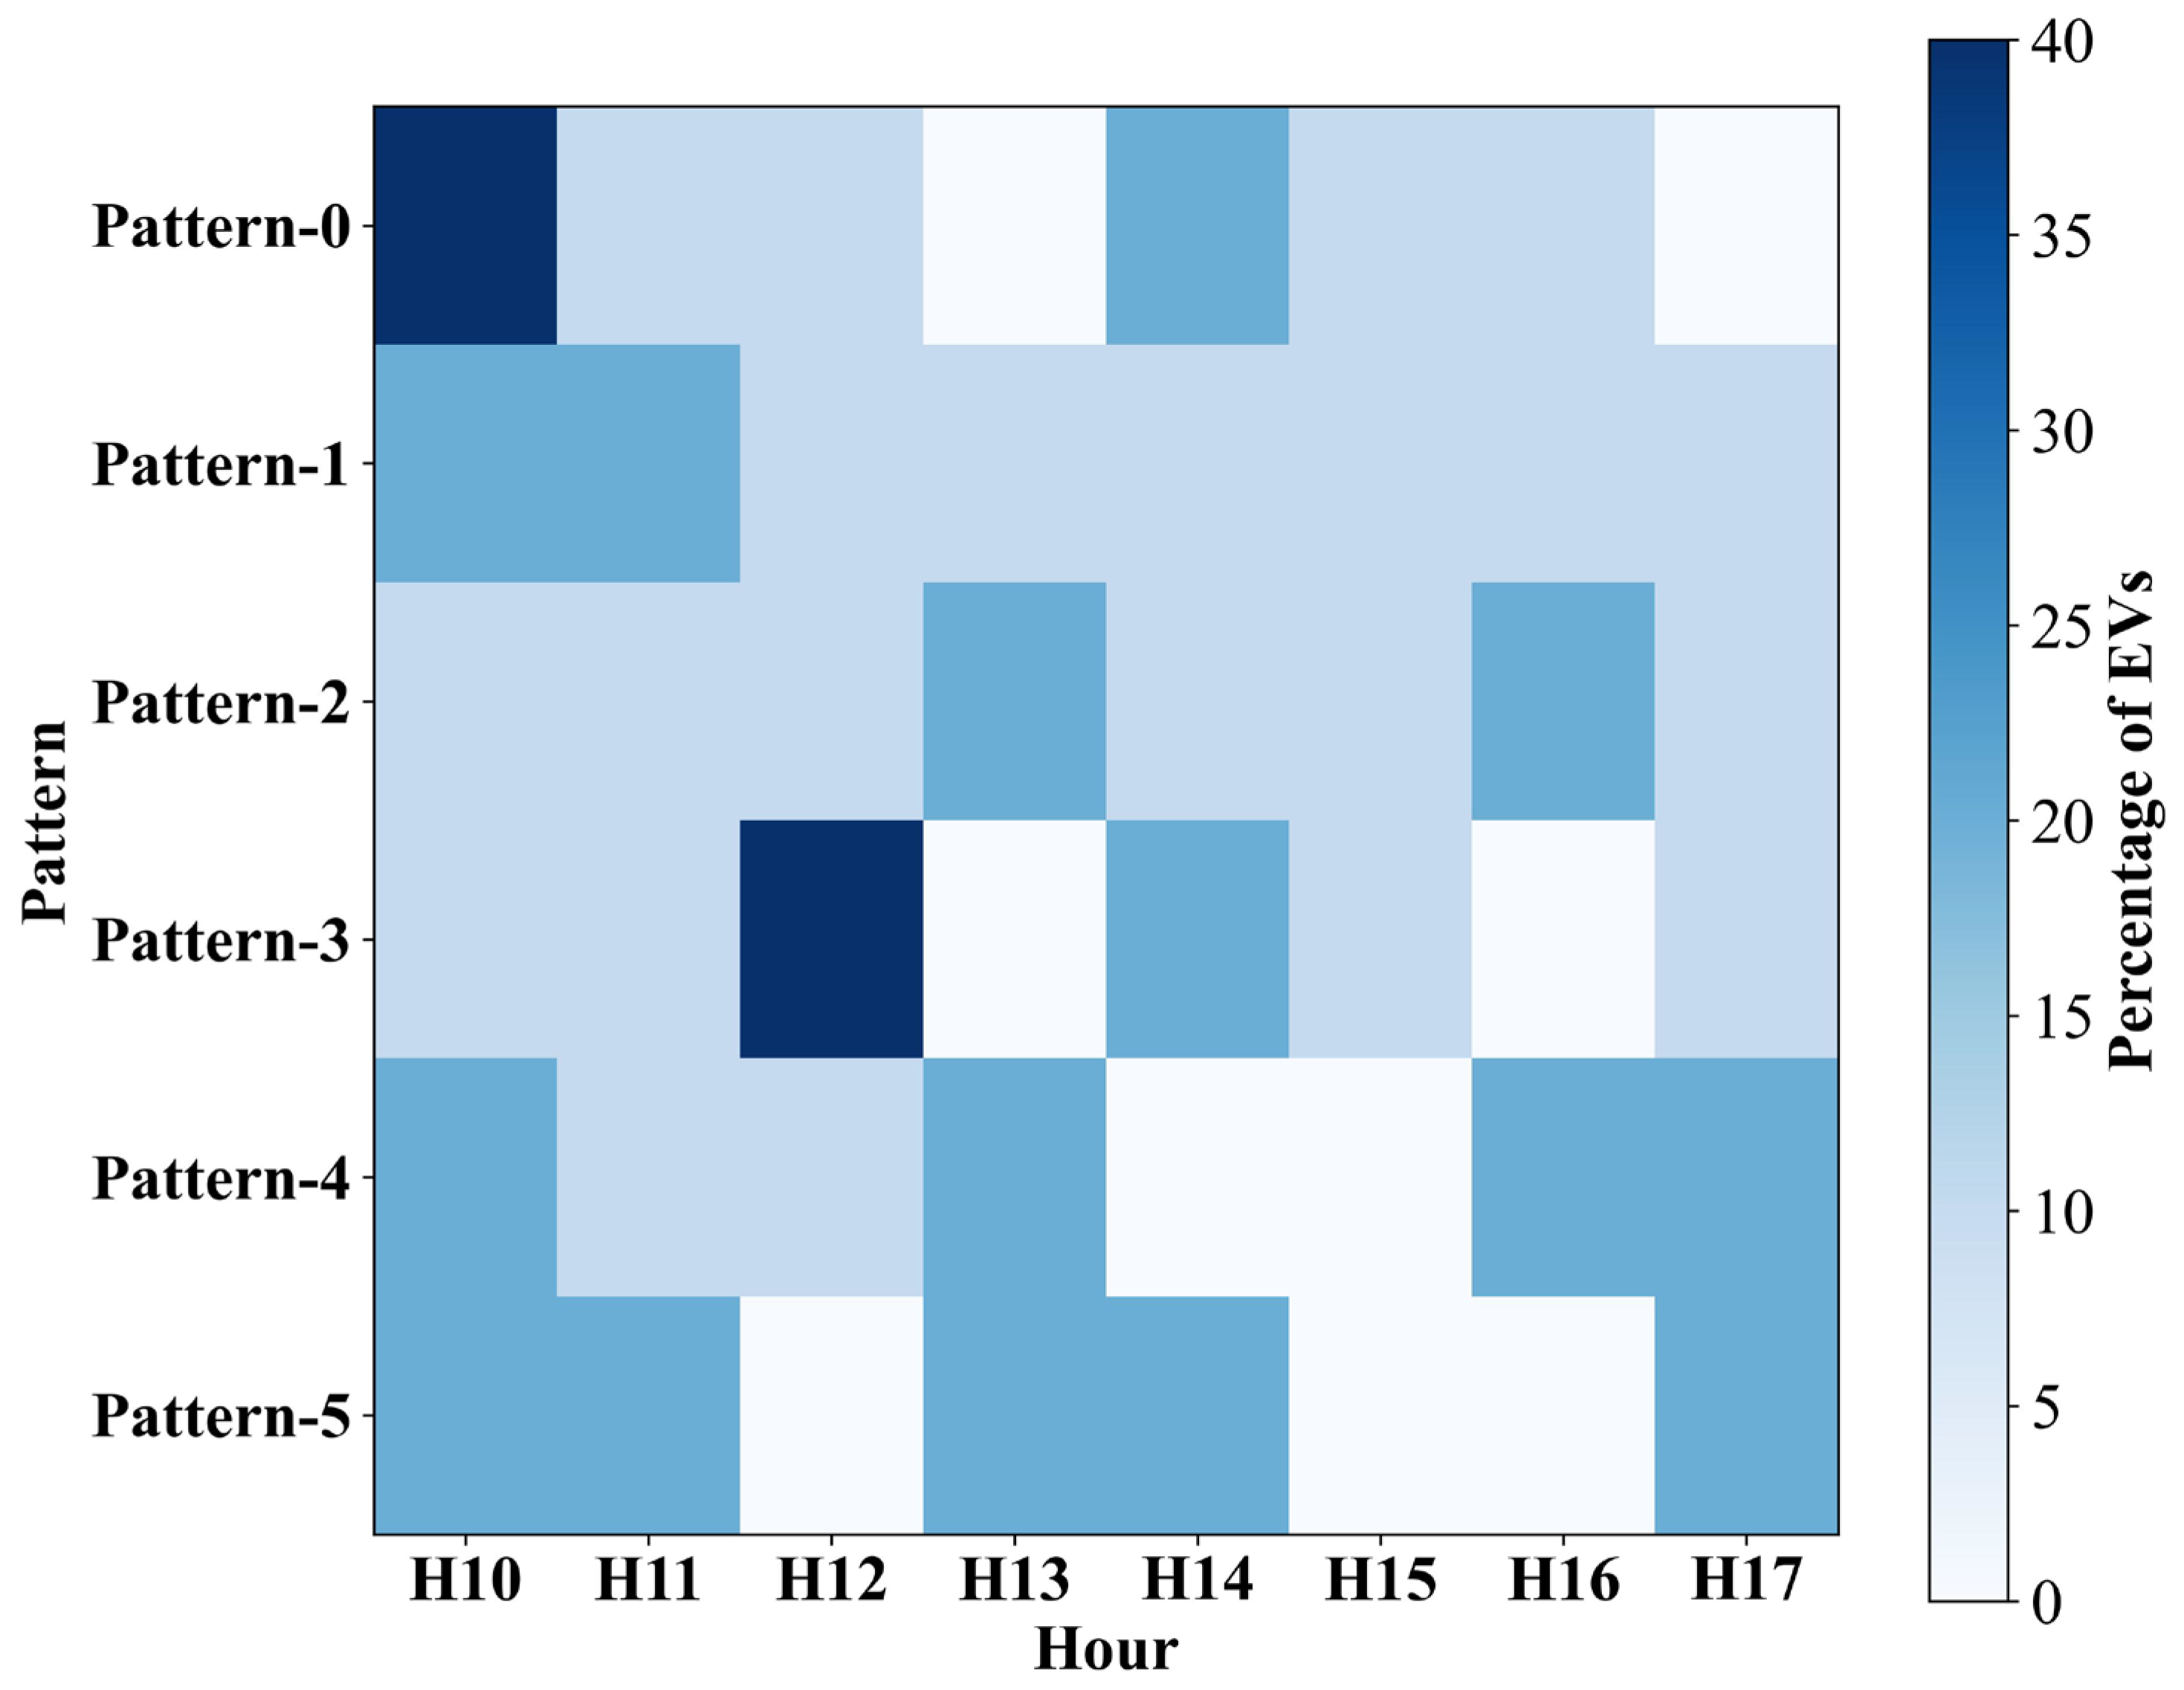
49]. Therefore, integrating GGD into the EVCS optimisation framework strengthens the realistic modelling approach. The total number of EVs coming every day is divided into 8 h with different percentages (GGD’s output), which are shown in
Figure 6. Moreover, the fast charger is utilised for this proposed EVCS. To be precise, L-3 EV chargers have been selected for the proposed EVCS.
2.5. Load Profile Estimation
To calculate the load of the EVCS, equations are required. Therefore, two equations were developed to estimate the load profile. Using the first equation, the daily number of EVs arriving at the parking lot can be estimated (1):
is the number of EVs (unitless),
, is the number of cars arriving every day denotes (unitless), and
is the assumed percentage of EVs (unitless). Also, the load estimation can be derived by using the curated dataset, specifically, the number of cars arriving per day, and multiplying this value by the pattern assumptions, the dedicated charging hours, and the required SoC level, as expressed in the corresponding Equation (2):
is the estimated consumed load (in kWh),
is the assumed pattern percentage (unitless),
is the hour (in h) and
is the power of the charger (in kW) at different SoC levels. After generating the load profile by using Equation (2), the profile is combined with the relevant energy, economic, and environmental parameters and entered into the HOMER optimisation tool to model the integration of a decentralised microgrid with the EVCS.
2.6. System Sizing and Scenarios Selection
System sizing was performed using HOMER’s built-in optimiser. First, the auto optimiser option was utilised, and later, the several component capacities were calibrated manually by setting the upper and lower limits of the system as constraints. HOMER then performed multiple iterations to identify the optimal configuration for different configured systems. The selection of energy system components, namely PV, WTs, and the grid connection, follows directly from the resource assessment presented in
Section 2.2, which establishes the suitability of these technologies for the study location.
In the 3E feasibility studies, a small number of scenarios were considered when analysing the developed energy system. Overall, four scenarios were considered to conduct the analysis: (i) Scenario-1 (S1), which included PV, WT, and grid; (ii) Scenario-2 (S2), which included PV and grid; (iii) Scenario-3 (S3), which included WT and grid; and (iv) Scenario-4 (S4), which only included grid (Base Scenario-BS). In the S1, energy was supplied through the grid and on-site RES combined with PV and WT, reducing reliance on the conventional grid. S2 incorporated a PV and grid facility as backup energy. On the other hand, the main source of energy was WT and utilised the grid as a backup system for purchasing energy from the grid. S3 was dedicated to WT instead of PV, but, similarly, grid connections were available like S1 and S2. Furthermore, S4 served as the baseline, where EVs were charged solely from the grid without any direct integration of RES. This scenario (S4-BS) provided a reference point for assessing the performance of the other three scenarios.
Table A1 summarises the scenarios and the system sizing of the proposed energy system.
2.7. Energy-Economic-Environmental Inputs
In this subsection, 3E inputs are gathered from various sources to conduct the feasibility study. Various inputs are taken into consideration to conduct 3E analysis, including the technical specifications of PV panels, WTs, converters, the grid, electric load, and economic parameters such as PV panel cost, WT cost, converter cost, and the grid’s energy price (the price of purchasing energy from the grid and selling it to the grid; see
Table A2 and
Table A3). Therefore, several economic parameters can be considered for the proposed EVCS, including CAPEX, OPEX, replacement cost, discount rate, and inflation rate. The technical component specification is shown in
Table A4 [
22,
50]. Also, the economic assessment’s input parameters are shown in
Table A5 [
21,
22,
50,
51,
52,
53]. Specifically, the data in
Table A4 and
Table A5 are collected from earlier research papers, published reports, and websites, as these data of different parameters are required to perform energy-economic-environment optimisation.
According to [
54], Portugal’s total electricity consumption is 49.5 TWh, and 62% of the total electricity is generated from RESs. Moreover, grid emissions are 228.00 gCO
2/kWh. This coefficient is important for the emissions analysis of the proposed EVCS [
54]. For HOMER optimisation software, two rates, including (i) discount rate, and (ii) inflation rate, are required to conduct the economic analysis. In 2024, Portugal’s inflation rate was 2.70% [
55] and Portugal’s discount rate was 4.50% [
56]. Furthermore, the tariff values established by the Portuguese Energy Services Regulatory Authority were used to define the costs of purchasing electricity from the grid and the revenues from exporting electricity sellback to the grid [
57]. The NPC represents the present value of all expenses and investments associated with the EVCS and the proposed integrated energy system over the project lifetime. The NPC, denoted as
and expressed in €, is calculated using the following Equation (3):
where
is the total annualised cost in €,
is the number of years, and
i is the real interest rate. Moreover, COE is considered one of the crucial aspects of the EVCS energy system, and COE can be calculated with Equation (4) [
22]. In Equation (4),
denotes the total energy generation.
The renewable energy fraction is important to understand the ratio of the energy supplied to the EVCS from RESs. Renewable energy fraction can be calculated with Equation (5), where
denotes as RES’s fraction,
denotes the total energy served from non-RESs, and
is the total load served for the EVCS.
3. Results
The objective of this study is to assess the feasibility of a RES-powered EVCS at FCT NOVA, UNL campus, Caparica (Portugal), using a comprehensive 3E optimisation. This section presents the results of this analysis and consists of four sections: (a) algorithm output and resulting load profile; (b) economic performance of the energy system; (c) integrated economic evaluation of the EVCS; and, (d) finally, an evaluation of the associated energy and emissions.
3.1. Algorithm Output and Resulting Load Profile
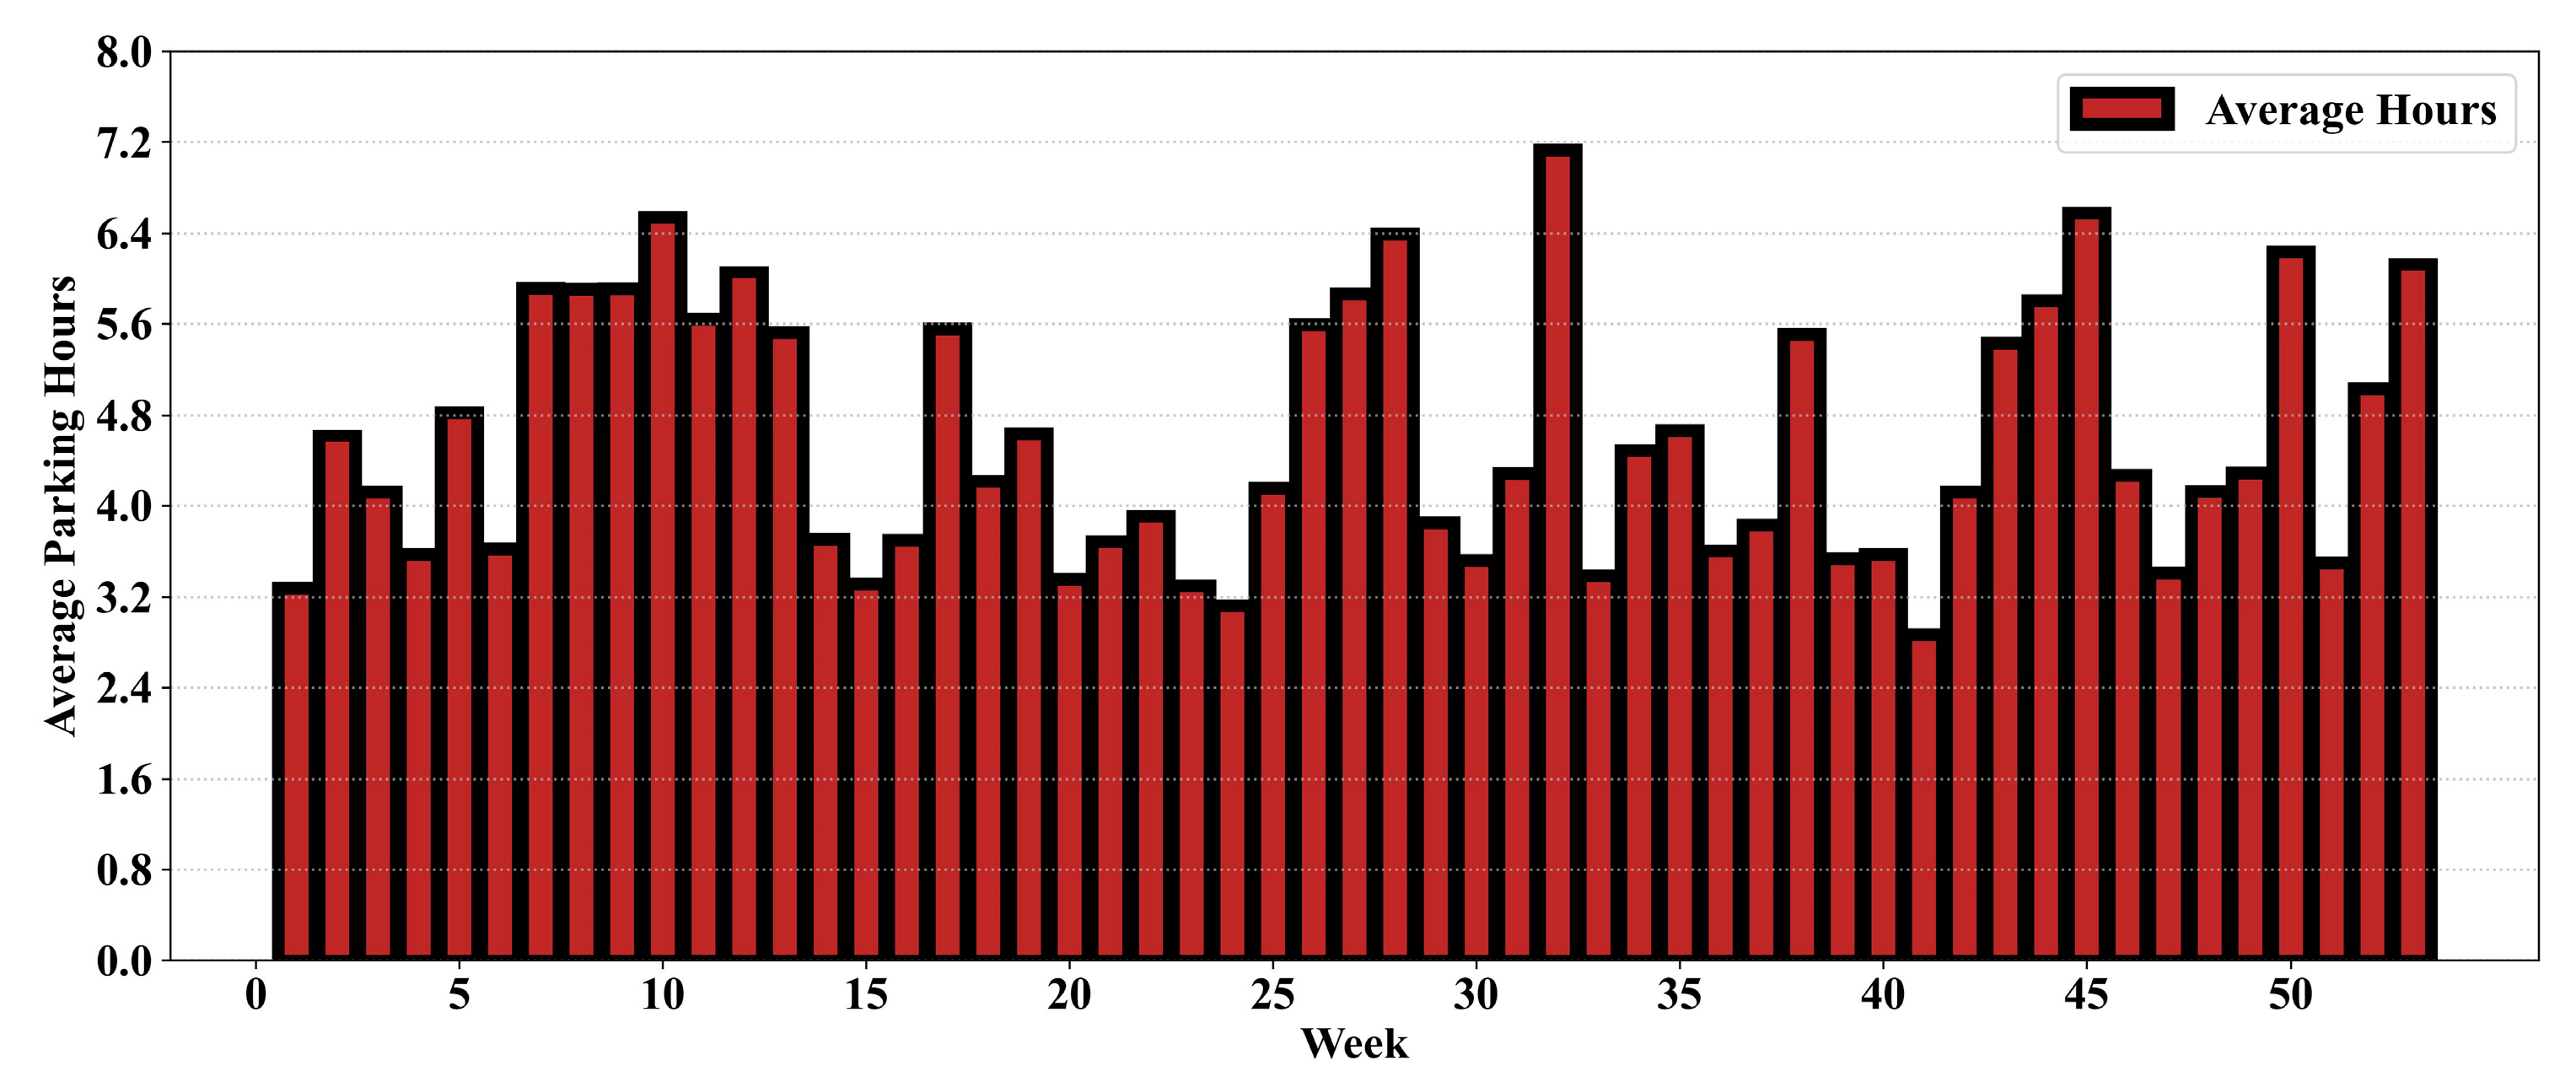
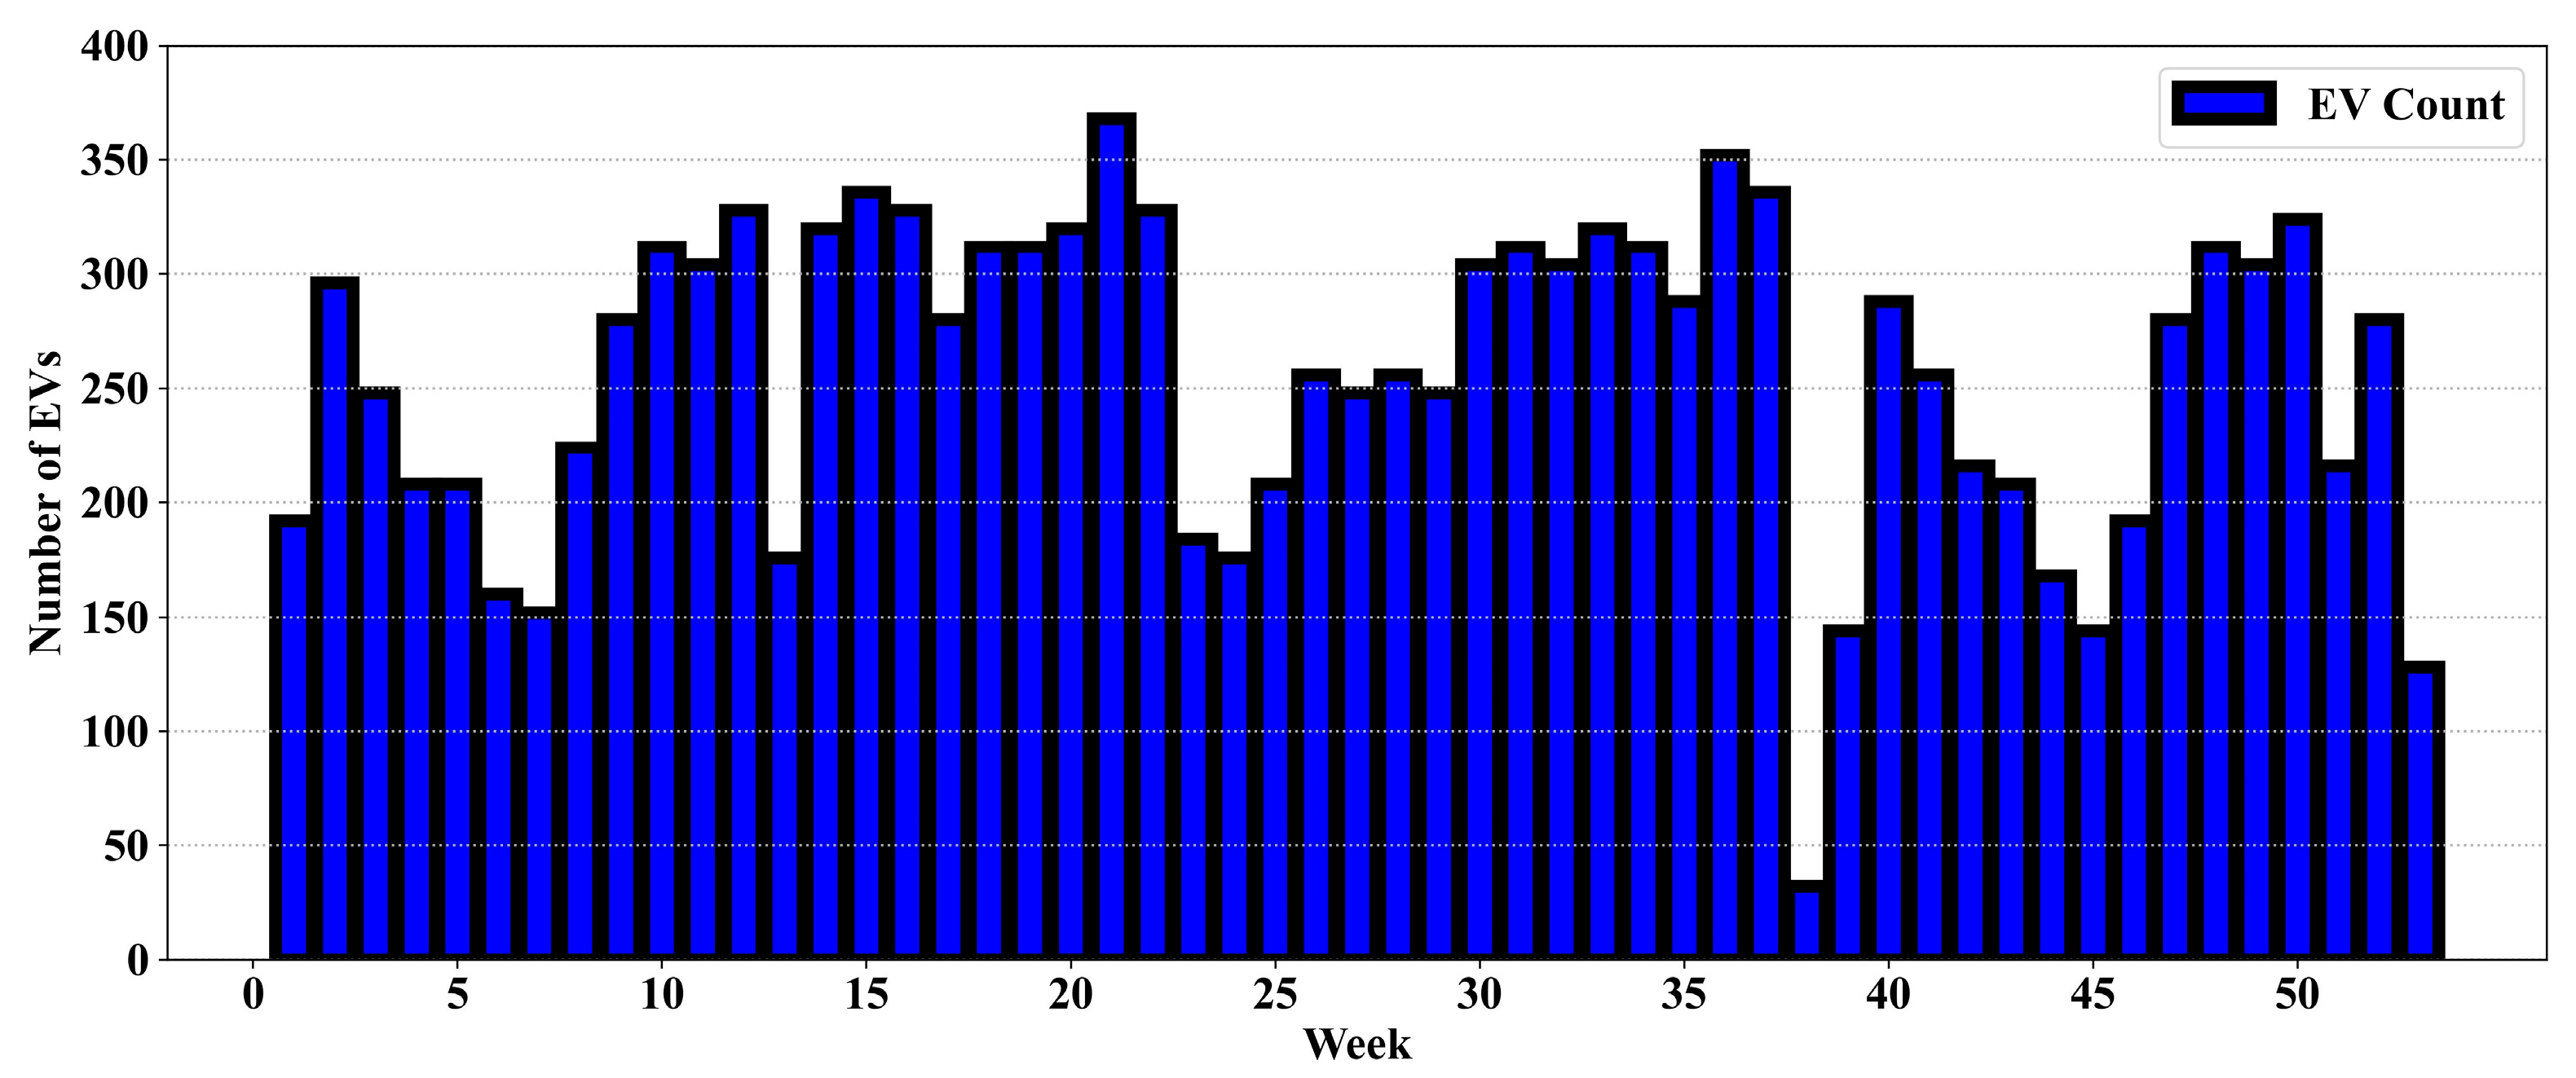
Figure 7 illustrates the average parking hours per car (the proposed algorithm’s output). The results show that the average duration of stay ranges from 2.86 to 7.13 h across different weeks. The number of total EVs is estimated by utilising Equation (1). In one week, the minimum EV arrival is 32 and the maximum EV arrival is 368. These numbers are crucial to determining the number of chargers required for the proposed EVCS.
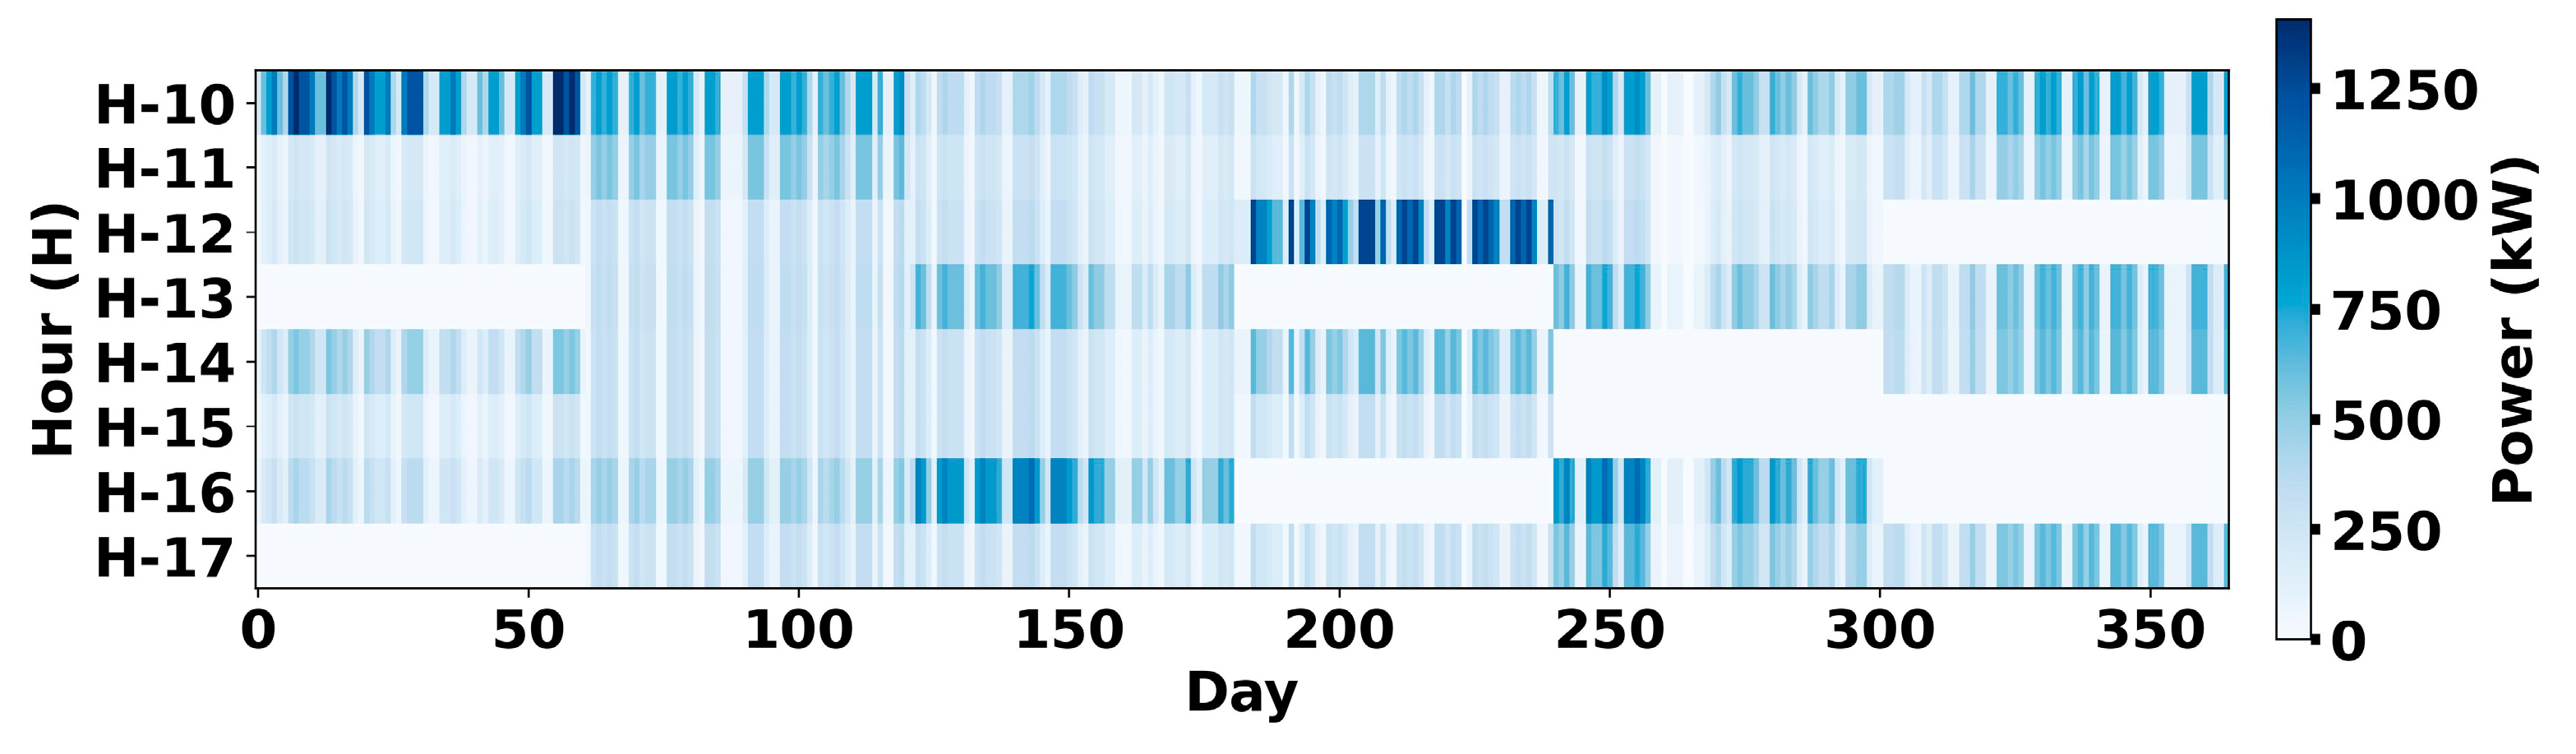
Figure 8 shows the estimated EVs that arrived in the parking lot. The estimated load (the estimated load is a metric used by the system to determine the utilised capacity, hence facilitating the assessment of available capacity) profile is displayed as a heatmap in
Figure 9. After estimating the EVCS load profile, the daily average load is 2014.4 kWh and the peak demand is 1406.7 kW.
3.2. Economic Analysis of Energy System
After performing 3E optimisation by employing the HOMER tool, the results from the four scenarios, including S1 (PV, WT, and grid), S2 (PV and grid), S3 (WT and grid), and S4 (only grid), are analysed in this section, which are shown in
Table 2. S1 has the lowest NPC among the four scenarios, €2.13 million, as S1 is the most optimised result. S1 is considered the most optimised result when taking into consideration several factors, including the lowest COE, the highest renewable energy fraction, and the lowest emissions. S2′s NPC is €2.51 million, which is slightly more than S1’s. However, S4 has the highest NPC among the four scenarios at €3.86 million, since the system is not coupled to any RES, so energy flows directly from the grid to the EV. Furthermore, S3 has an NPC of €2.8 million, which is less than S4 but more than S1 and S2.
Among the four scenarios, S4 has the highest COE at €0.141/kWh. On the other hand, S2 and S3 both have a lower COE than S4, as, in both scenarios, (S2 and S3) are connected to onsite-RES. Also, S1 has the lowest €0.0234/kWh COE among the four scenarios. Moreover, the CAPEX of the S4 is €0, which is the lowest, as this scenario is only considered for the grid. This is obvious because no RES system is integrated with this scenario. Also, S3 has a CAPEX of €0.75 million. Although S2 has a CAPEX of €1.08 million, which is comparatively lower than S3, as this scenario does not have any WT in the energy system. In contrast, the highest CAPEX, €1.67 million, is found in S1. S1 is considered the most optimised scenario among the four scenarios, regardless of high CAPEX.
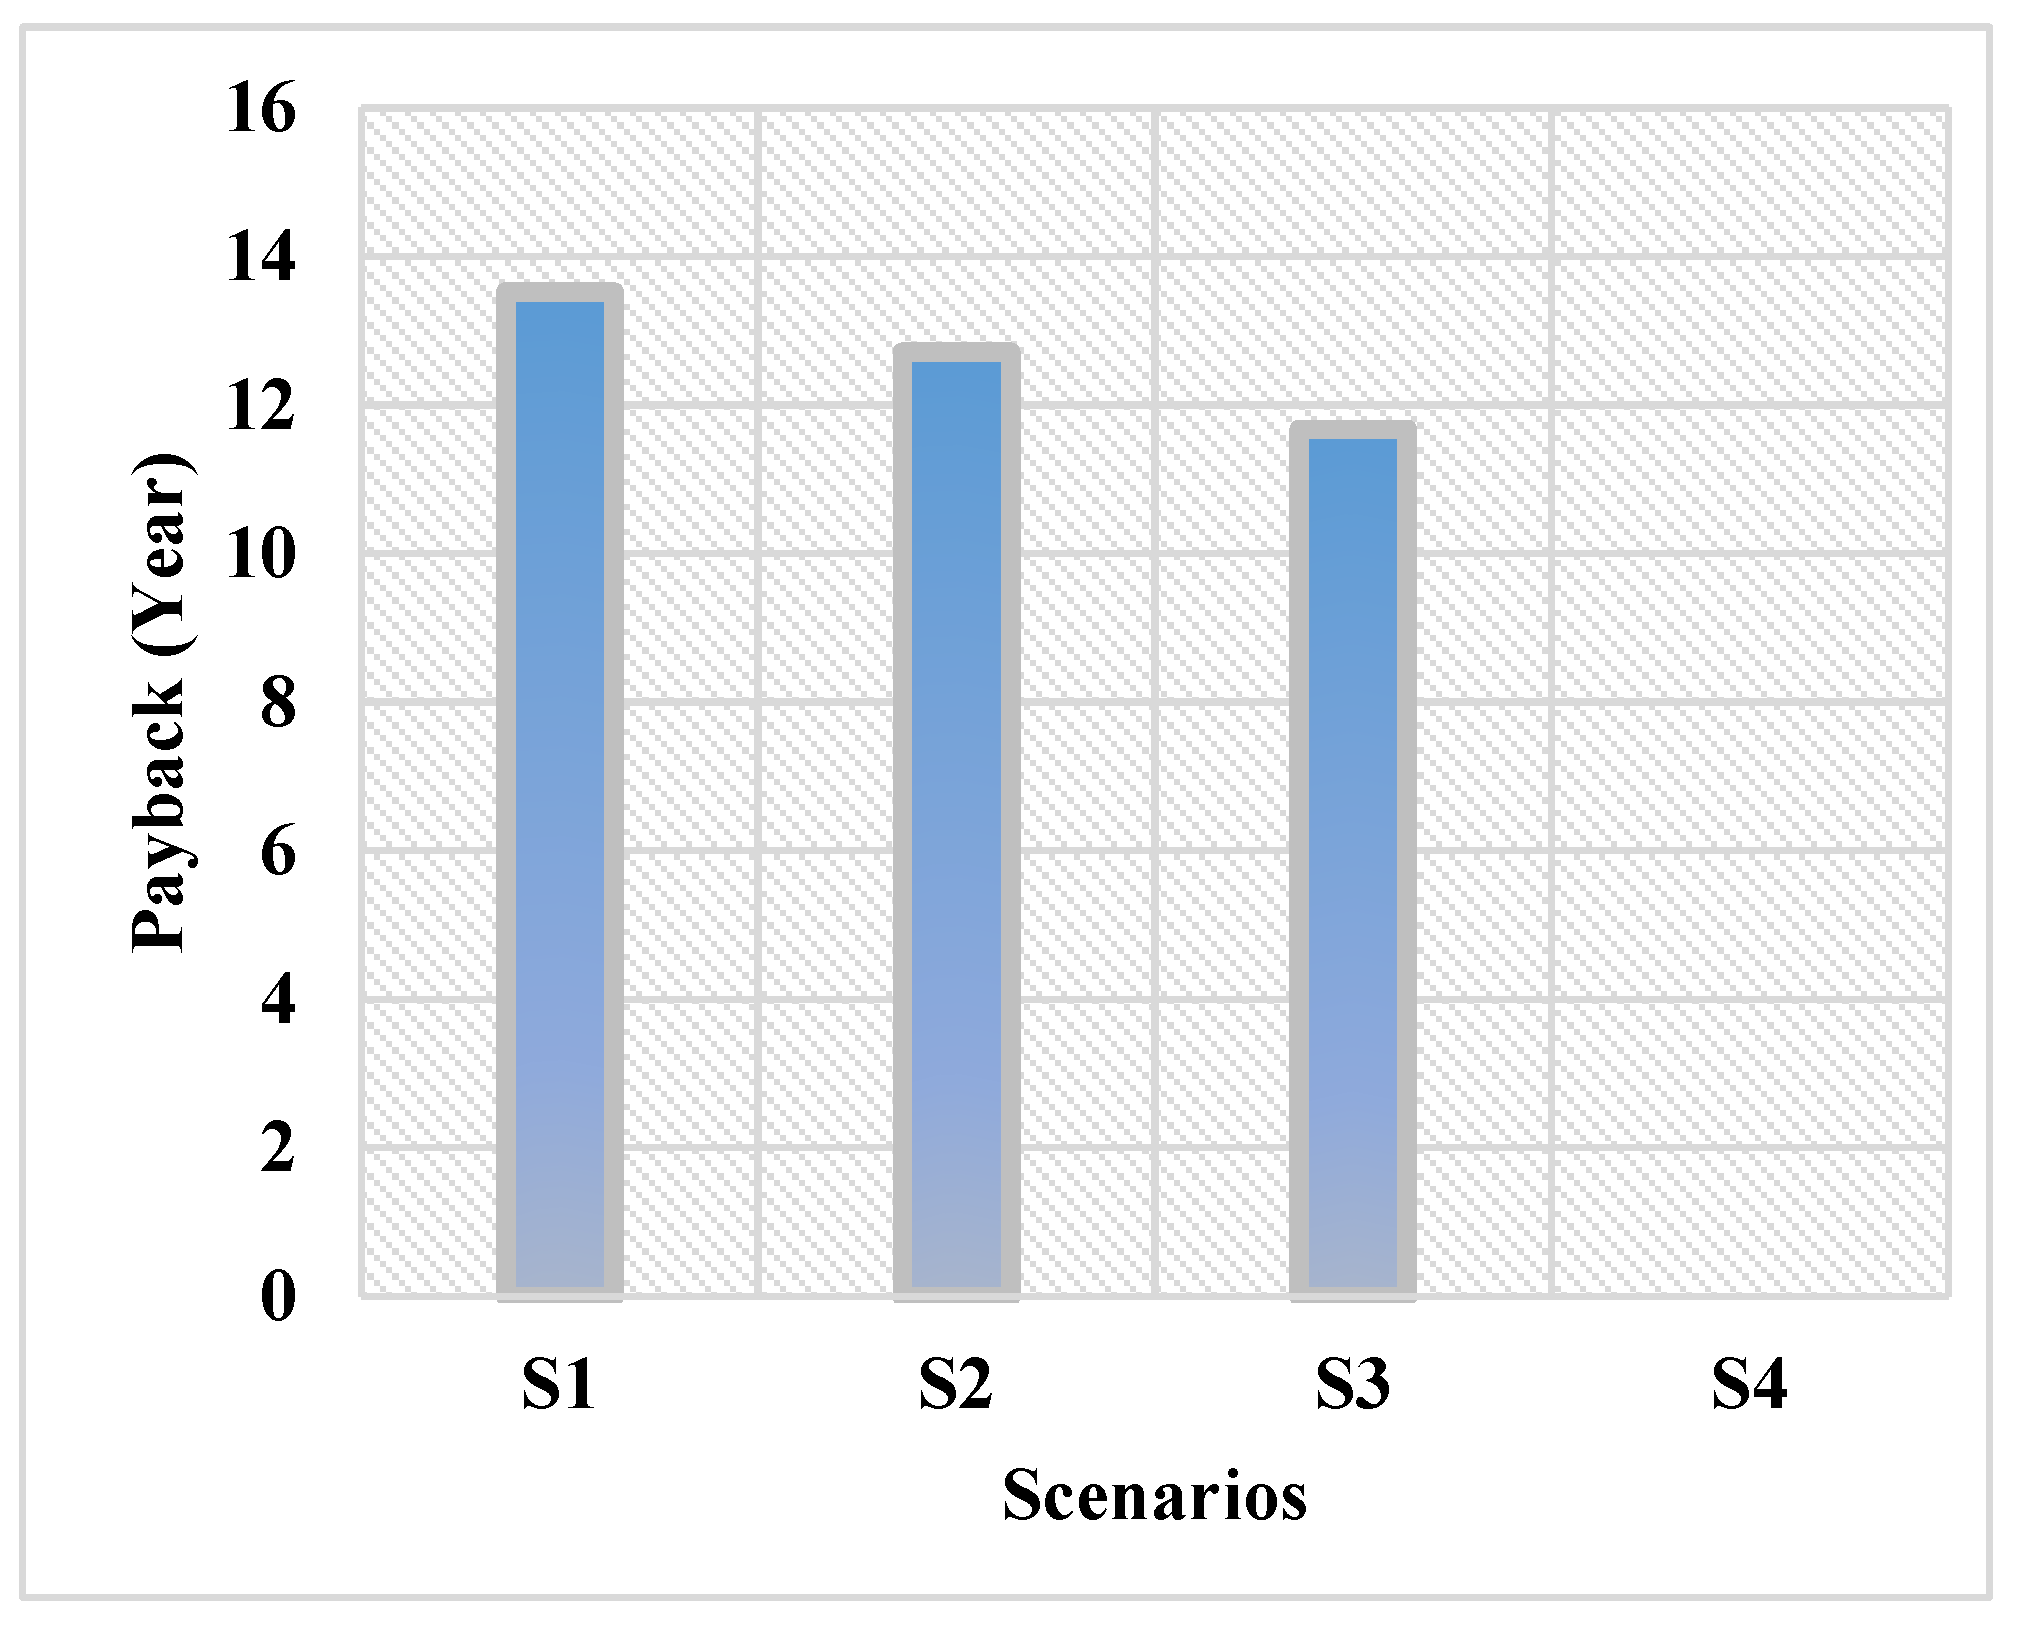
Among the four scenarios, S4 has the highest OPEX, €0.1034 million/yr; this is the BS, which considers only the grid in this scenario. The OPEX of S3 is €0.055 million/yr. However, S2′s OPEX is €0.0385 million/yr, which is comparatively lower than S3′s. Because S2 has more RES than S3, it significantly reduces the OPEX. Additionally, S1 has the lowest OPEX of €0.0123 million/yr among the four scenarios, as well as the highest renewable energy fraction. Furthermore, the payback period for the four scenarios is illustrated in
Figure 10.
3.3. Integrated Economic Assessment of the EVCS (Energy System Cost and EVCS Infrastructure Cost)
This subsection is devoted to the integrated economic analysis that considered the combined costs of EVCS infrastructure and the energy system. In this work, twenty-five L-3 chargers are required for the proposed EVCS; therefore, €0.6875 million is required for twenty-five chargers, but the lifetime of the charger is expected to be 20 years; therefore, the total replacement cost is €0.6875 million for the infrastructure of EVCS. Moreover, the infrastructure cost of twenty-five EV chargers is €0.1145 million. Therefore, the total investment (CAPEX) cost of EVCS infrastructure is €1.490 million, and the OPEX of EVCS is €0.115 million/yr. Furthermore, the total CAPEX of EVCS, including the energy system, charger investment, and setup cost, is €3.16 million for S1, €2.57 million for S2, €2.27 million for S3, and €1.49 million for S4. Also, the total OPEX of EVCS is €0.1273 million/yr for S1, €0.1535 million/yr for S2, €0.17 million/yr for S3, and €0.2184 million/yr for S4.
Table 3 summarises the total CAPEX and total OPEX for EVCS across four scenarios.
3.4. Energy and Emission Analysis
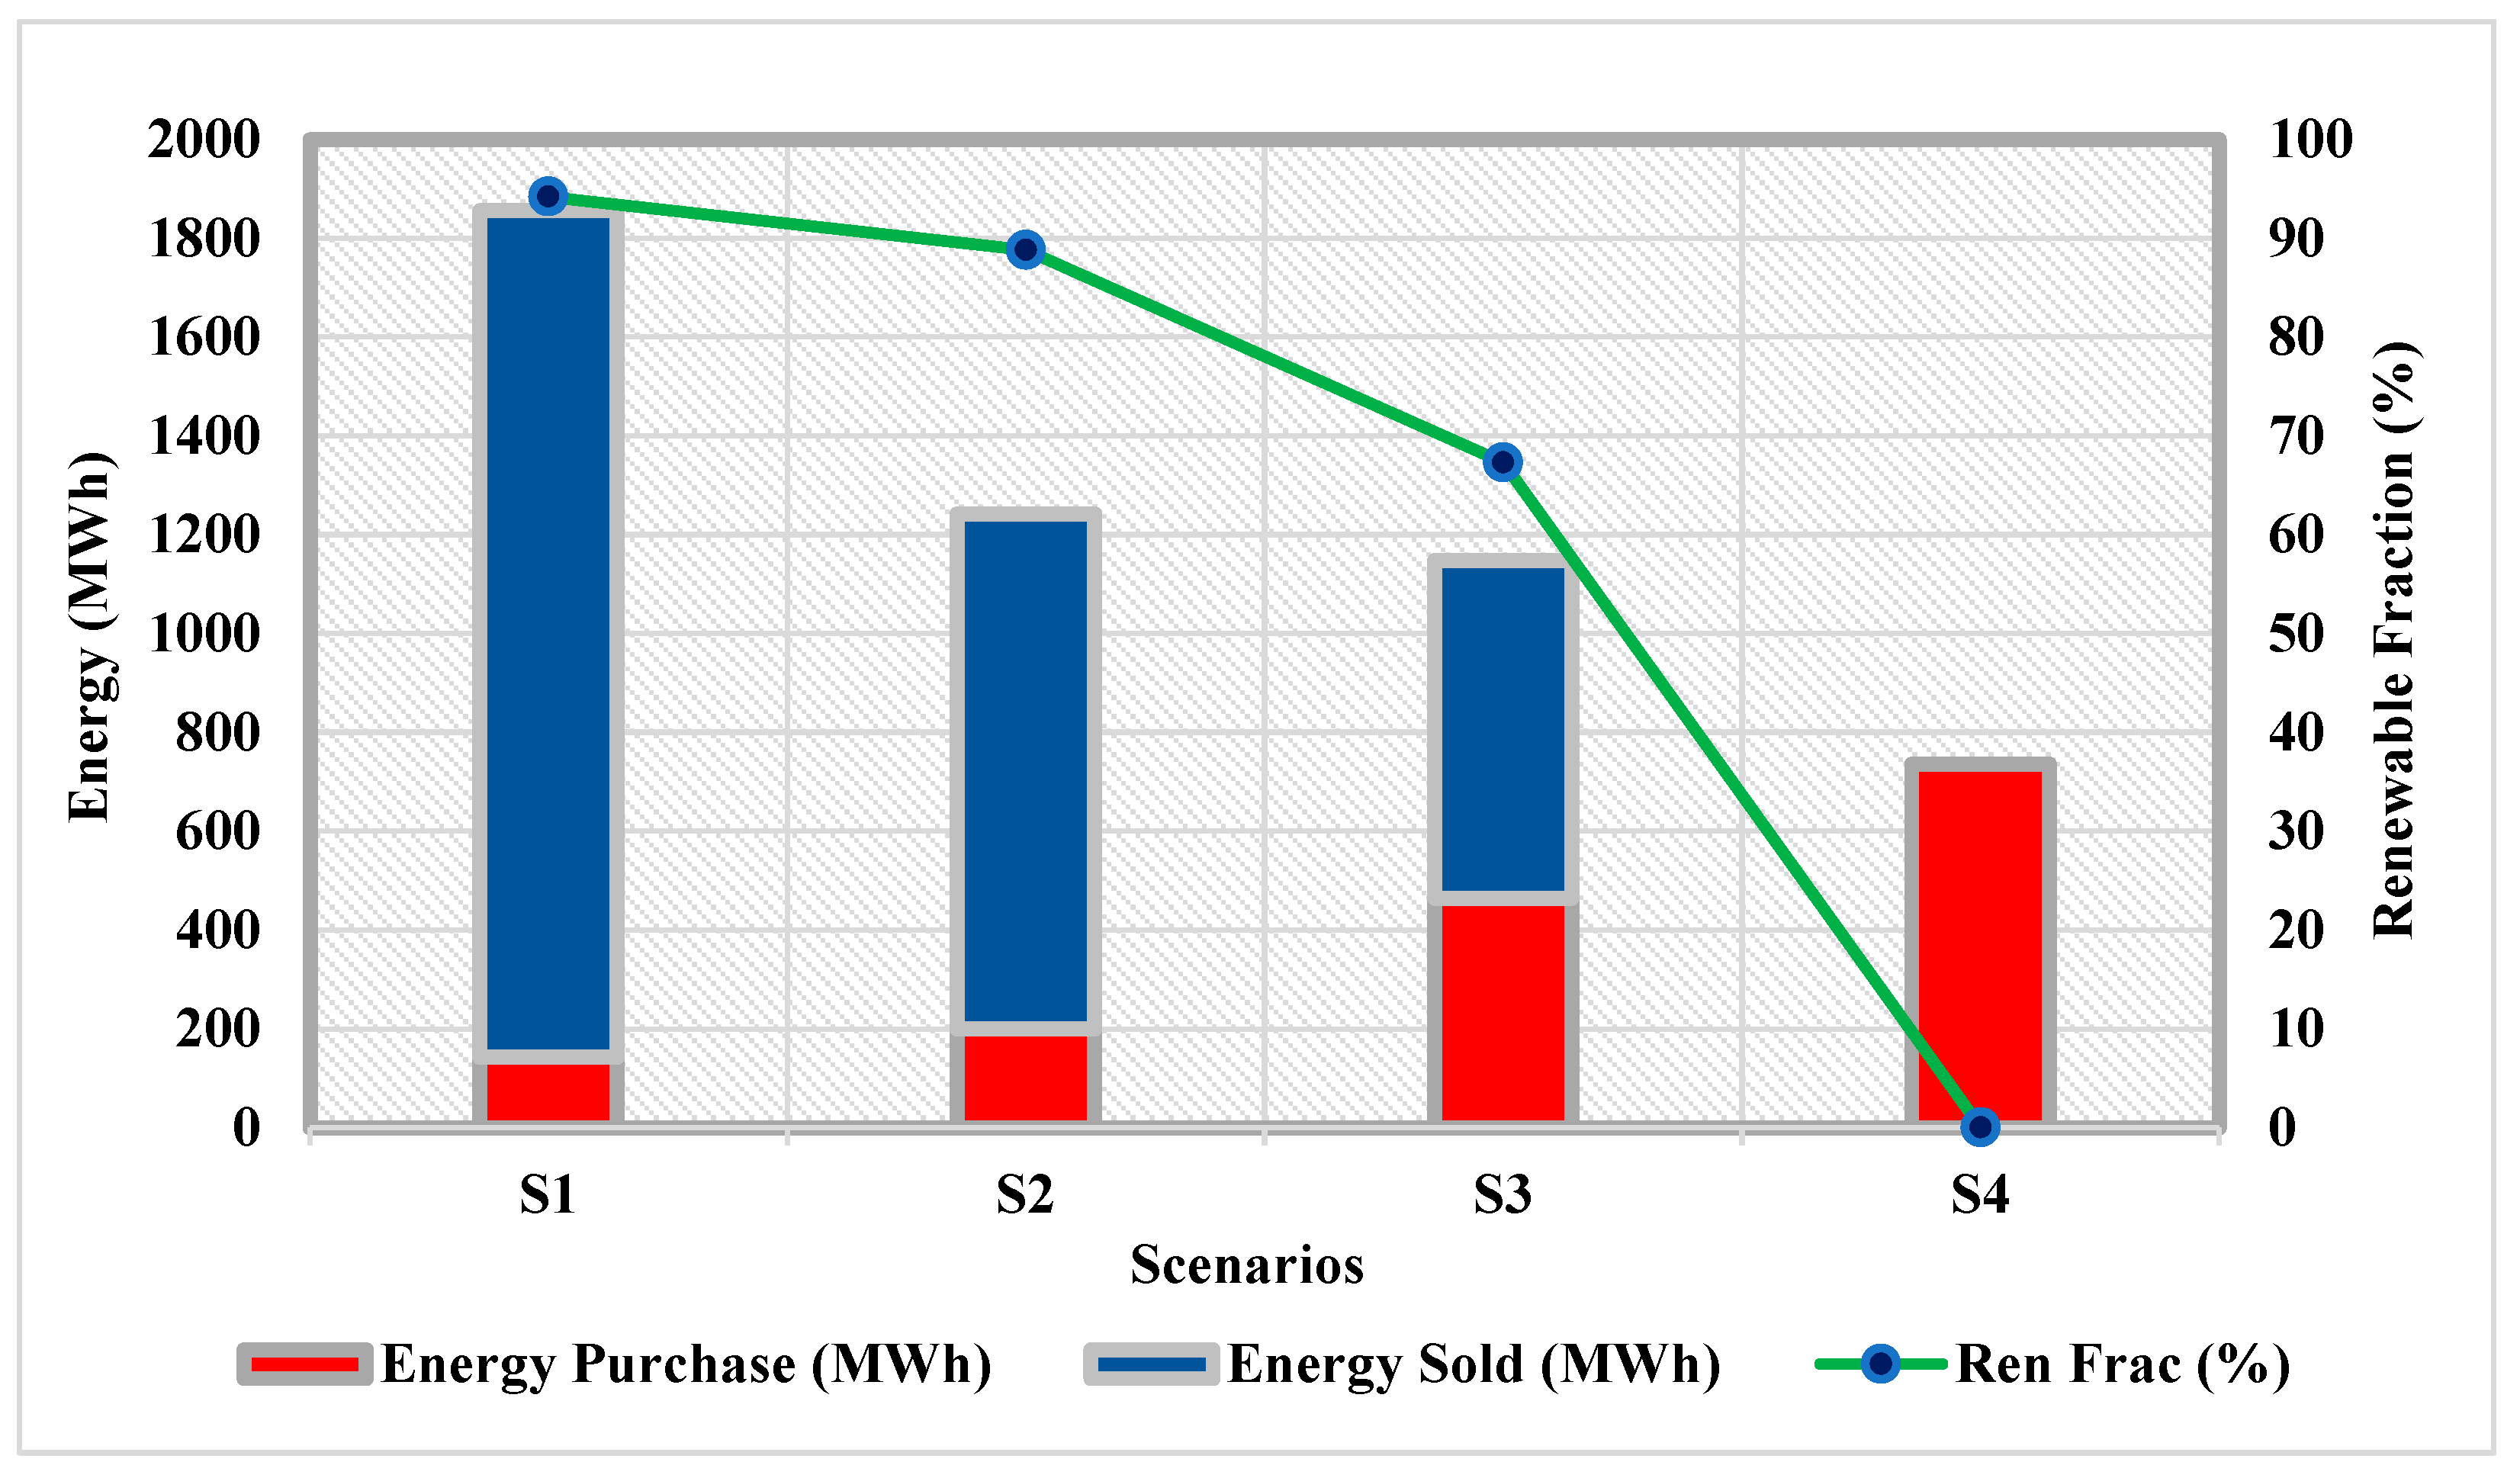
S4 does not involve selling energy back to the grid, as no RES technologies are integrated in this scenario (i.e., the renewable fraction is zero, as this is the BS). Consequently, S4 relies entirely on grid energy, purchasing the largest amount among all scenarios (735.255 MWh). In contrast, S3 achieves a renewable fraction of 67.3%, reducing grid purchases to 464.376 MWh, which is lower than in S4. The integration of RES in S3 also enables energy exports, resulting in 683.635 MWh sold to the grid. In S2, energy exports increased markedly to 1043.005 MWh, driven by a higher renewable fraction of 88.8%. This substantial increase in renewable penetration correspondingly reduces grid imports to 199.268 MWh in S2. S1 exhibits the highest renewable fraction of all optimised cases (94.2%), leading to the largest amount of energy sold to the grid (1713.371 MWh) and the lowest grid purchases (142.583 MWh). Therefore, S1 not only increases the amount of energy sold back to the grid, but also substantially reduces the energy purchased from it.
Figure 11 summarises the energy purchased from the grid, sold back to the grid, and the renewable energy fraction of these different scenarios.
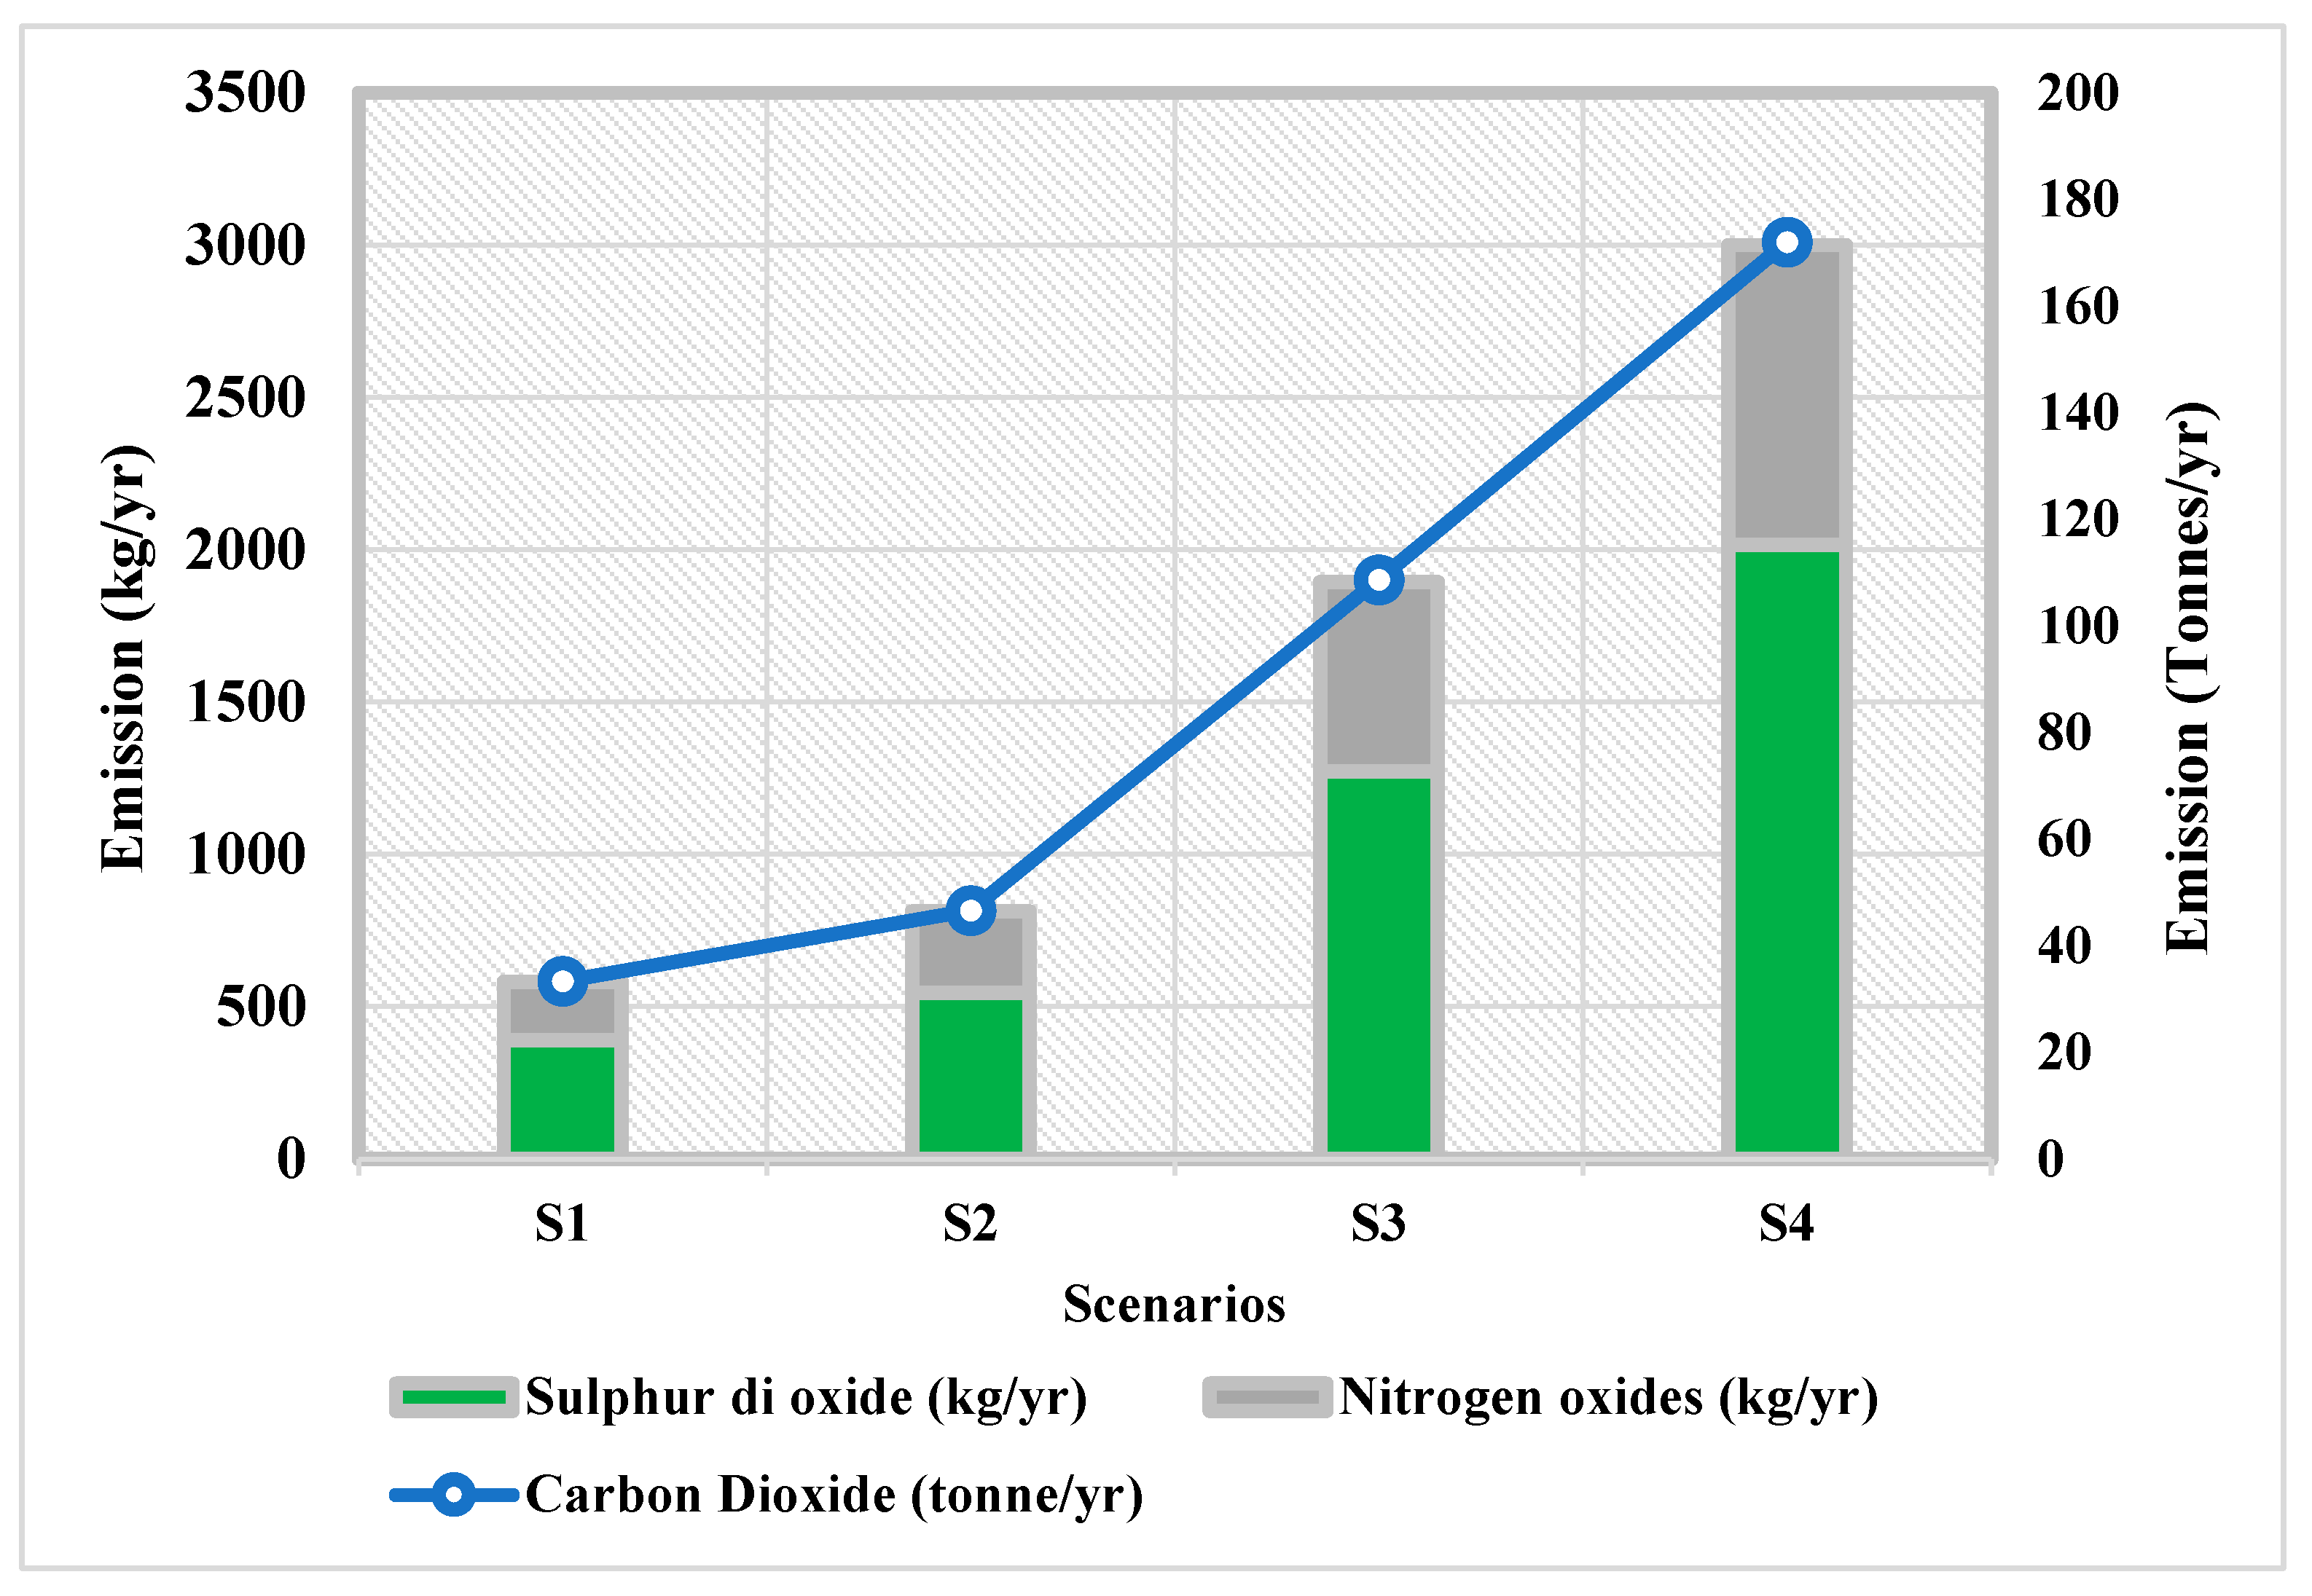
After analysing the results of HOMER, it is observed that S1 emits CO
2 of 33.364 tonnes/yr, SO
2 of 391 kg/yr, and NO
x of 191 kg/yr. This scenario has the highest portion of renewables, and, as a result, it has the lowest emissions compared to other scenarios. Moreover, S2 emits 46.629 tonnes/yr, which is comparatively higher than S1, as S2 has a comparatively lower renewable fraction rate than S1 (see
Figure 11). Furthermore, S3 has a CO
2 emission of 108.664 tonnes/yr, which is two times higher than S2, where the renewable fraction is reduced by 21%. However, the highest amount of emissions, 172.05 tonnes/yr, is emitted in the S4 scenario (BS).
Figure 12 shows the emission analysis of the four considered scenarios.
3.5. Sensitivity Analysis
A technical sensitivity analysis was carried out by varying EV penetration levels to 15%, 30%, and 45% of total annual vehicle arrivals at the charging facilities. Furthermore, financial sensitivity analyses were performed using discount rates of 4.5%, 7.5%, 10%, and 12.5%. The impacts of these variations were assessed in terms of grid energy purchases and sales, NPC, COE, CAPEX, OPEX, and renewable energy fraction. Additionally, the macroeconomic impacts on the long-term performance of the EVCS were examined considering inflation rates of 4%, 6%, 8%, and 10%.
The results show that the NPC increases with the EV penetration rate. The COE also varies significantly across the first three scenarios (S1, S2, and S3), suggesting that load growth significantly affects the lifecycle of energy economics. CAPEX remains broadly unchanged, as the core infrastructure is maintained across scenarios. In contrast, OPEX increases with rising EV penetration, reflecting the higher energy demand of the EVCS (see
Table 4,
Table 5 and
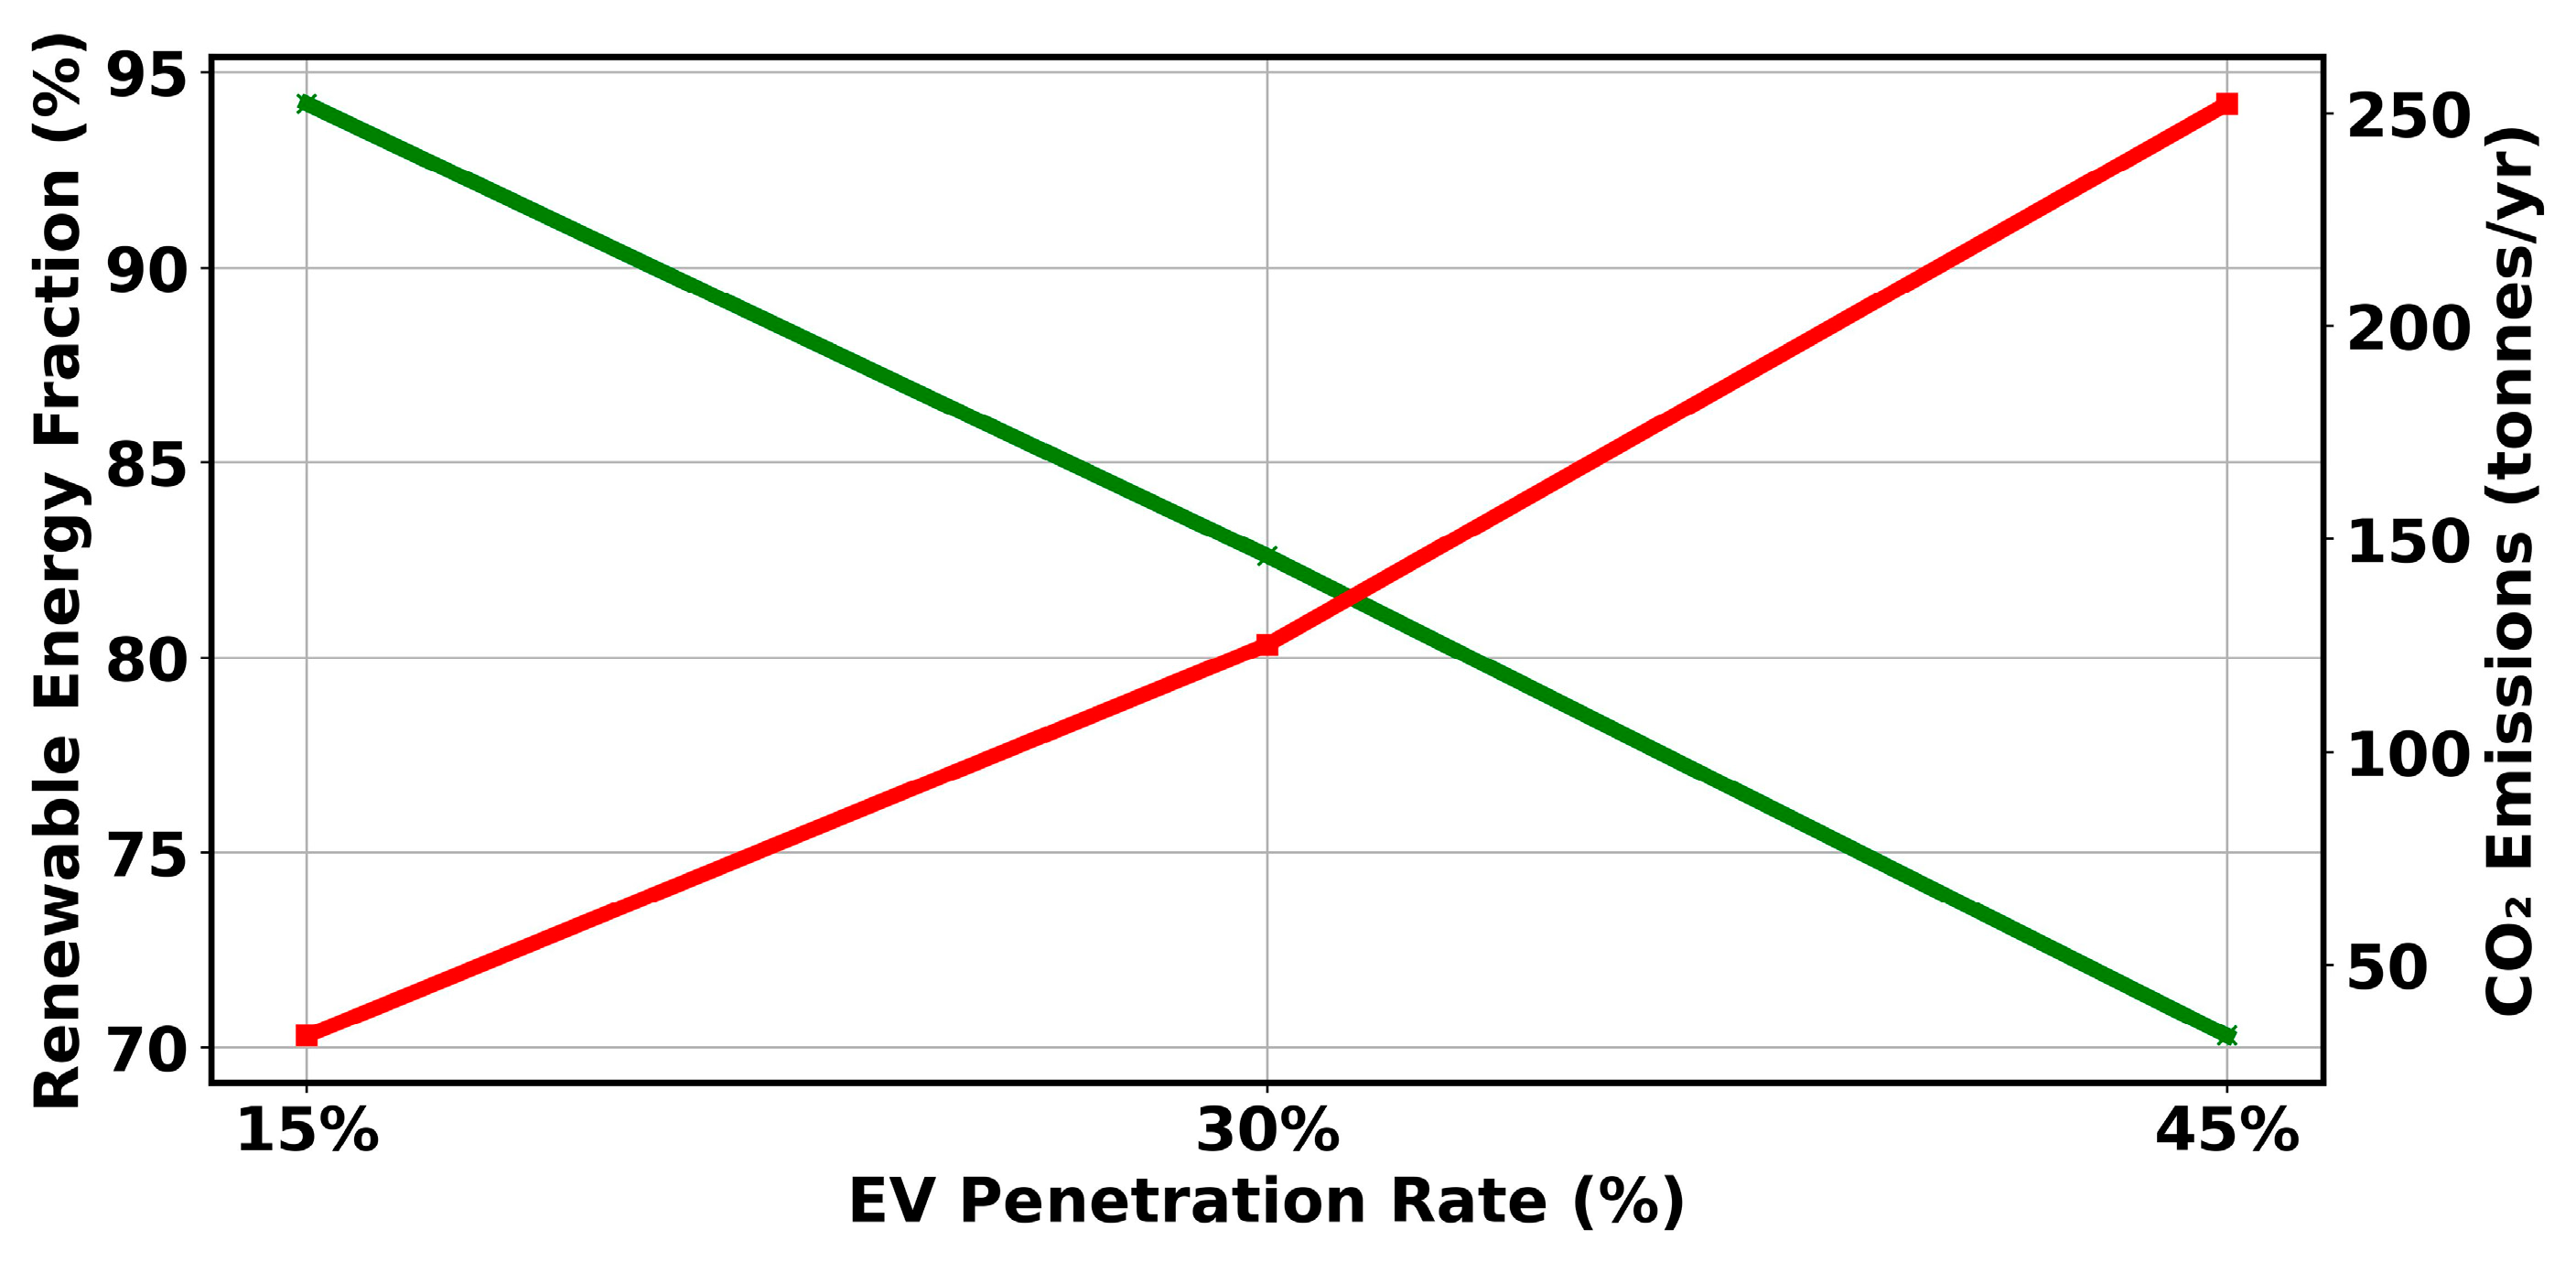
Table 6). Furthermore, grid energy purchases increase as EV penetration grows, indicating greater reliance on external supply from the grid to meet demand. On the other hand, since more EV charging is needed in the 30% and 45% EV penetration scenarios than in the 15% scenario, the amount of energy sold to the grid decreases as EV penetration increases. A notable effect is observed in the renewable fraction, which declines from 94.2% (at 15% EV penetration) to 82.6% (at 30% EV penetration) and further lowers to 70.3% (at 45% EV penetration) in S1 while charging more EVs than the earlier EV penetration rate. The increasing EV penetration rate tends to reduce the relative renewable energy fraction, as the energy system remains similar across all three penetration levels (15%, 30%, 45%). At the same time, it substantially increases the overall grid stress due to the additional energy demand associated with EV charging. Despite this effect, higher EV penetration can facilitate reductions in total CO
2 emissions, supported by an optimally designed energy management framework for EVCS that enhances energy efficiency and system operation.
Figure 13 illustrates the sensitivity analysis of renewable energy fractions and CO
2 emissions by year versus EV penetration at 15%, 30%, and 45%.
A comparative sensitivity analysis was conducted to assess the influence of the discount rate on the economic and technical performance of the proposed system. As the discount rate increases from 4.5% to 12.5%, the NPC increases, reflecting the greater financial weight assigned to upfront capital investments (see
Table 7). At a 12.5% discount rate, the NPC reaches €1.44 million, with a corresponding COE of €0.0933/kWh. The COE increases considerably with the increase in the discount rate, which can have a negative economic impact on EVCS users because of increased EV charging costs. CAPEX remained constant, as intended, to maintain the same energy infrastructure and isolate the impact of financial assumptions. Higher discount rates reduce the economic attractiveness of capital-intensive RES installations. The RES fraction declines from 94.2% at a 4.5% discount rate to 59.7% at 12.5%. Furthermore, compared to scenarios with lower discount rates, higher discount rates result in greater grid energy purchases and lower grid energy sold (see
Table 7), reflecting their impact on NPC, COE, and OPEX and indicating a shift toward less capital-intensive solutions. Overall, the results show that while the system’s technical energy system remains stable, the economic indicators are highly sensitive to financing assumptions, emphasising the importance of carefully selecting an appropriate discount rate in the long-term planning of EVCS infrastructure.
A sensitivity analysis was also conducted to examine the impact of the inflation rate on the EVCS’s economic and operational performance in S1. Variations in the inflation rate directly influence operational expenditures and grid energy transactions, thereby affecting overall project economics. Under a 4% inflation rate, the NPC reaches €1.93 million, with a COE of €0.0430/kWh. CAPEX increases with higher inflation rates (see
Table 8). OPEX ranges from €0.0044 million/yr to €0.0281 million/yr, reflecting the increasing maintenance and energy costs over the project lifetime. Despite these economic variations, the renewable fraction remains between 88.9% and 95.4%, indicating that the technical configuration remains relatively stable across inflation scenarios. However, higher inflation slightly affects grid energy exchanges and annual energy purchases, as it increases CAPEX and influences the renewable fraction, reflecting adjustments in long-term cost optimisation. Overall, the results indicate that inflation assumptions primarily influence economic indicators rather than system design parameters, highlighting the importance of incorporating realistic macroeconomic projections in long-term EV charging infrastructure planning.
4. Discussion
A 3E feasibility analysis was conducted to evaluate the deployment of a RES-powered EVCS in a university campus context. By moving beyond partial and parameter-specific evaluations commonly reported in the literature, the results enable a joint interpretation of economic performance, environmental impacts, and technical analysis under realistic charging conditions. The explicit consideration of SoC-based charging dynamics and data-driven load profile estimation allows for EVCS performance to be assessed consistently across alternative energy system configurations. Unlike most previous studies (see
Table A6), which examine energy, economic, and environmental dimensions separately, the analysis integrates these parameters within a unified assessment framework, enabling a more coherent evaluation of EVCS system performance, including the cost of EV charging. In this context, the load profile estimation algorithm developed in this work plays a vital role in supporting the integrated assessment. After defining four scenarios, each representing a different energy system configuration with varying combinations of RESs and grid dependence, including (i) PV, WT and grid, (ii) PV and grid, (iii) WT and grid, and (iv) only grid (BS)-a comparative analysis was conducted to evaluate their impact on EVCS performance and viability. The analysis shows that S1 is the most feasible option. Specifically, S1 exhibits the lowest NPC at €2.13 million, the highest renewable energy fraction at 94.2%, the lowest COE at €0.0234/kWh, the highest CAPEX at €1.67 million, and the lowest OPEX at €0.0123 million/yr. Furthermore, S1 exhibits the highest amount of energy sold back to the grid (1713.371 MWh) and the lowest energy purchased from it (142.583 MWh) among the four optimised scenarios. Hence, the payback period for the EVCS energy system of S1 is 13.52 years. Furthermore, S1 emits 33.364 tonnes/yr of CO
2, which is comparatively five times less than S4 (only considering the grid and no RES integration). The developed EVCS, in all scenarios, requires a CAPEX of €1.49 million, while OPEX is set at €0.115 million/yr as fixed cost for the EV chargers and maintenance costs. Twenty-five fast chargers with 50 kW are required to be installed to accommodate EVCS charging demand. One WT and 1000 kW of PV capacity are also part of the EVCS energy system. A rooftop PV installation of 1000 kW would require approximately 5000–6000 m
2. Medium-sized university campuses usually have much larger total rooftop and parking lot areas. Therefore, the proposed PV capacity is considered spatially feasible. The model also accounts for variability through hourly resolution profiles. Grid import and export options help ensure supply-demand balance.
The optimisation results provide important practical insights beyond the numerical differences observed across scenarios. While lower-cost configurations minimise immediate CAPEX, scenarios incorporating higher renewable penetration and EVCS management demonstrate meaningful reductions in emissions with only moderate cost increases. This suggests that a purely cost-driven strategy may overlook long-term environmental and resilience benefits. In particular, configurations with integrated renewable generation and controlled charging reduce peak grid dependency, thereby enhancing energy autonomy and mitigating exposure to future electricity price volatility. A hybrid approach combining moderate renewable integration, optimised charger allocation, and intelligent charging control appears to offer the most practical and scalable solution for real-world EVCS deployment as EV adoption increases.
From a policy perspective, the results are directly relevant to the implementation of the EU’s transport decarbonisation targets. The EU has committed to a 100% reduction in tailpipe CO
2 emissions from new vehicles (cars and vans) by 2035 under the CO
2 emission performance standards. The results indicate that, when EVCSs are integrated with RESs, the transition to EVs can contribute to this goal by reducing indirect emissions which earlier produced by ICE vehicles and improving the overall sustainability of EV deployment in urban, suburban, and rural areas. RES-powered EVCS configurations reduce CO
2 emissions to approximately one-fifth of those observed in the grid-only scenario (BS-S4), emphasising the importance of supporting EV adoption with RES-based charging infrastructures for EV users. These results highlight that EVCS deployment is not just a supporting infrastructure measure for charging EVs, but also a key enabling element for achieving the EU’s long-term decarbonisation goals, both at the regional and member-state levels. However, the lack of EV charging infrastructure remains a major barrier to EV adoption in the EU [
11]. To overcome this challenge, the 3E aspects of EVCS deployment need to be systematically assessed in different geographical contexts, including grid capacity constraints, cost structures, user demand patterns, and regulatory situations. This study provides an integrated framework for the design of EVCS infrastructure, including RES-based energy systems, which supports the EU’s primary goals of phasing out ICE vehicles and increasing zero-emission mobility.
The advanced optimisation framework is applicable to both developed (EU member states) and developing economies, where EV integration is driven not only by climate and energy goals, but also by strategic industrial ambitions. Emerging economies such as China are investing heavily in EV and BESS technology to strengthen their position in the global automotive value chain, especially while entry into the conventional ICE vehicle market remains dominated by established manufacturers from Europe, the United States, and Japan. At the same time, the transition to net-zero transport raises important equity considerations. The distribution of responsibility between developed and developing countries needs to reflect historical emissions and financial capacity, consistent with the principle of common but differentiated responsibility. While equity considerations are increasingly central to decentralised (domestic) EV adoption, particularly in supporting disadvantaged communities in developed countries, the issue is becoming more difficult at the international level. A stronger recognition of equity in domestic policies should be extended to the global climate finance and investment framework, which reinforces the responsibility of developed countries to provide more support to developing economies in achieving the transition to low-carbon mobility [
58]. The development of infrastructure for the world’s largest EV market in China remains the most important and influential policy objective in all major industrial regions [
59]. The results of this study suggest that EVCS is effective for end-users and beneficial to various stakeholders, so this work helps developing countries, including China, to attract investors and improve EVCS infrastructure.
For policymakers and public-sector stakeholders, including (i) legislators, (ii) grid operators, (iii) universities, and (iv) municipalities, the proposed 3E feasibility framework provides structured, evidence-based support to plan and implement EVCS infrastructure. By jointly assessing economic feasibility, grid integration, and the potential for emissions reductions, the framework informs spatial planning, incentive design, service design, and regulatory actions to promote RES-powered EVCS solutions at the local and regional levels. The findings also demonstrate how EVCSs can be incorporated into local energy networks on university campuses, public EVCS infrastructure, energy communities, and efforts to increase grid resilience, thereby supporting the EU’s decarbonisation objectives.
From an investment perspective, this study enhances transparency around the financial performance of EVCS placement. By providing valid estimates of CAPEX, OPEX, NPC, COE, grid energy purchases and sales, and payback periods, this research analysis enables investors to better assess the risks and returns of investment in EVCS projects. A realistic evaluation of long-term financial sustainability allows for the development of viable business models for EVCS services, accomplished through explicit energy exchange with the grid. These observations are specifically relevant as customer-driven, decentralised investment schemes emerge alongside the growth of EVCS infrastructure. In this work, the major contribution to the academic community is to develop a multi-step, reproducible framework for feasibility assessment that incorporates technical performance, economic viability, and environmental impacts. The transparent and effective representation of charging demand provided by the introduced rule-based algorithm for EVCS load profile estimation will facilitate future research and comparative studies. By explicitly incorporating real-time SoC of EVs (real-time user behaviour) and improving methodological rigour in EVCS modelling by avoiding simplified load assumptions.
Nevertheless, this study acknowledges some limitations. First, mathematical optimisation methods are not employed to complement HOMER’s capabilities, as HOMER is unable to schedule the loads to minimise the user’s COE. Future work can use techniques such as GA [
15], NSGA-II [
60], TBODWA [
16], or particle swarm optimisation [
61] to improve scheduling performance in the optimisation phase. Second, predictive methods have not been used for EV load estimation, including SoC prediction; therefore, future research can incorporate machine learning algorithms to improve the accuracy of EV load forecasting. Furthermore, the analysis relies on a single case study; its wider applicability could be increased by applying it to multiple locations. Furthermore, energy pricing is modelled by static tariffs for both grid purchases and grid exports. Further research can extend this approach by including dynamic pricing structures informed by economic evaluations, thereby facilitating a more precise representation of market conditions.
Overall, the findings demonstrate that RES-powered EVCSs can accelerate EV deployment while lowering GHG emissions and fossil fuel consumption through decentralised RES-based energy systems. By linking EV adoption with RES-based charging infrastructure, the results illustrate how EVCS implementation can assist in reducing dependence on fossil fuels and, indirectly, on oil-based energy imports. By offering a thorough, investment-focused, and policy-relevant evaluation, this study strengthens the empirical basis for EVCS deployment and planning. The analysis demonstrates that RES-powered EVCSs can reduce environmental impacts, expand access to charging infrastructure, and have economic benefits for end-users (both for consumers and prosumers). The study provides reliable estimates of the investment needed to implement RES-powered EVCSs, which helps policymakers, investors, and others make better decisions to move towards sustainable transportation systems for users. Collectively, these findings clarify how EVCS implementation can facilitate a more comprehensive transition to sustainable, zero-emission (completely emission-free) mobility by providing empirical evidence for the development of public and private sector policies, investment plans, and stakeholder engagement across sectors.
5. Conclusions
In this article, a 3E optimisation was conducted by performing a feasibility study of an EVCS for a university campus in Portugal. An algorithm (rule-based) was developed to calculate the total number of cars arriving in a day and the average duration of their stay in the parking lot. The algorithm calculates the average parking time and the daily number of EV arrivals. The load profile of the EVCS was estimated by utilising the collected data and assumptions in a mixed-method approach with the developed algorithm. Assumptions regarding charging time distributions were included to account for future operating conditions, with a 25-year planning horizon. Later, HOMER software was utilised to conduct a 3E feasibility analysis. After conducting the simulation, four scenarios, (i) S1 using the PV-WT-grid, (ii) S2 using the PV-grid, (iii) S3 using the WT-grid, and (iv) S4 using the grid (BS), were developed and considered, and, after analysing them, the most feasible scenario was S1 for the proposed EVCS.
In S1, several economic parameters were found, including the lowest NPC of the energy system of €2.13 million, the maximum renewable energy fraction of 94.2%, the lowest COE of €0.0234, the CAPEX of the energy system at €1.67 million, the CAPEX of the EVCS at €1.49 million, the combined CAPEX of the energy system and EVCS at €3.16 million, the lowest OPEX of the energy system at €0.0123 million/yr, the O&M of EVCS at €0.115 million/yr, and the total OPEX of the energy system and EVCS at €0.1273 million. Additionally, out of the four scenarios considered, S1 has the lowest energy purchasing from the grid, which is 142.583 MW, and the highest energy sellback to the grid is 1713.371 MWh. Also, CO2 emissions are reduced drastically, five times lower than the S4 (only considered grid, no RES integration). The high penetration of RES in the proposed energy system, which significantly reduces grid dependence and associated emissions, is the primary driver of this substantial decrease. According to these findings, on-site integration of RES into EVCS energy systems is one of the most effective approaches for reducing the environmental impacts produced by ICE vehicles. Therefore, this should be considered a top priority in the development and implementation of EVCS in Portugal and the entire EU in the future.
This study’s results demonstrate that the implementation of EVCS is both technically and economically viable (specifically S1). This substantiates the feasibility of extensive infrastructure development as an essential facilitator of the EU’s shift to electric transportation. However, there are several limitations of this study. First of all, the percentage of EVs among cars arriving in the parking lot was estimated. Assumptions were made to estimate the load profile, as this EVCS is proposed for the next 25 years. The second constraint is that this work only uses software-based optimisation without load scheduling. In our future work, more operational hours will be considered to improve the operation flexibility of the EVCS. Machine learning techniques will be integrated to improve the prediction of the EVCS load profiles. In addition, a sustainable service model for the university population will be planned. The categories of actors that may cooperate in financing and delivering such a service will also be examined. Finally, further studies should be conducted in different countries and contexts to assess the broader applicability and feasibility of the proposed approach.




 ,
,