Article

Valorisation of Orange Peel into Biochar Using Pyrolysis for Phenolic Contaminant Removal from Water: Experimental and Quantum Chemical Insights


by
Lalit Kumar
1,2,3,
Kalpit Shah
1,
V. Ezhilselvi
1,2,3,
Adhithiya Venkatachalapati Thulasiraman
1 and
Ibrahim Gbolahan Hakeem
1,*
1
Chemical and Environmental Engineering Department, School of Engineering, RMIT University, Melbourne, VIC 3000, Australia
2
Indian Reference Materials (BND) Division, CSIR-National Physical Laboratory, Dr. K.S. Krishnan Marg, New Delhi 110012, India
3
Academy of Scientific and Innovative Research (AcSIR), Ghaziabad 201002, India
*
Author to whom correspondence should be addressed.
Energies 2026, 19(6), 1407; https://doi.org/10.3390/en19061407
Submission received: 16 January 2026 / Revised: 1 March 2026 / Accepted: 6 March 2026 / Published: 11 March 2026

Abstract

This study investigates orange peel valorisation through KOH pre-treatment and high-temperature pyrolysis (800 °C) to develop a highly porous activated char for the efficient removal of phenolic compounds, specifically 2,4-dinitrophenol (DNP) and aminophenol (AP), from water. The main objective of the study is to synthesise high-surface area activated char from orange peel and investigate its performance for the adsorption of DNP and AP from water. The synthesised adsorbent exhibited a Brunauer–Emmett–Teller (BET) specific surface area of 965 m2/g, contributing to its excellent phenol adsorption efficiency. Batch adsorption experiments were performed, and a maximum removal efficiency of 99% and 92% was observed at pH 4 and 7 with initial concentration 50 mg/L, contact time 60 min, and adsorbent dosage 0.6 g/L, for DNP and AP, respectively. The adsorption process was described by the Langmuir isotherm model (R2 = 0.99), indicating monolayer adsorption and followed pseudo-second-order kinetics, achieving a maximum adsorption capacity of 366 mg/g for DNP and 341 mg/g for AP. Furthermore, DFT analysis revealed that DNP possesses a lower HOMO-LUMO energy gap (−0.54 eV), favouring a stronger adsorption interaction, whereas AP exhibited a relatively higher energy gap (−0.27 eV), corresponding to its comparatively lower adsorption capacity. Overall, the findings demonstrates that a single step chemical-thermal conversion of orange peel into biochar-based adsorbent offers a sustainable pathway for the removal of phenolic compounds from water.

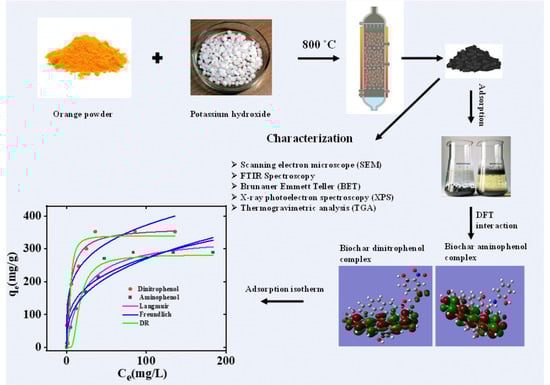
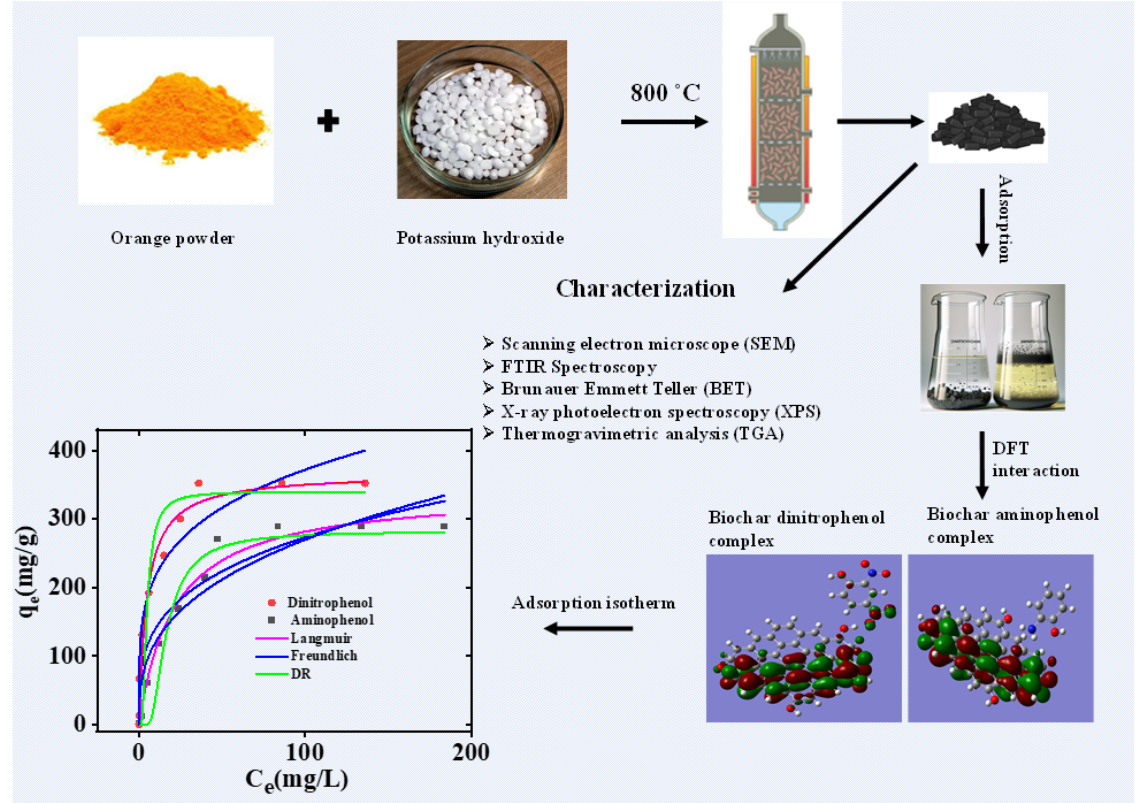
Graphical Abstract

1. Introduction

The rapid growth in world population and industrialisation has led to an increase in water pollution levels [1]. Phenol and its derivatives such as chlorophenol, aminophenol (AP), and dinitrophenol (DNP) are discharged by industries, such as coal, paper and pulp, plastics, pesticides, metals, and pharmaceuticals [2]. The concentration of phenolics in wastewater ranges from 1 to 7000 mg/L [3]; hence, removing phenolic compounds is not merely a compliance requirement but a crucial environmental safeguard.
The direct use of biomass is not effective for removing phenol from aqueous media due to the leaching of water-soluble organics from the biomass sorbents into the aqueous phenolic waste [4]. Hence, it is necessary to convert biomass into a stable carbon-based adsorbent such as biochar and activated carbon [5,6]. However, the performance of biomass-derived biochar in phenolic adsorption largely depends on the biochar properties. In general, there are two ways to modify biochar properties for adsorption purposes. The first one is by adjusting the biochar production conditions, usually the pyrolysis process parameters, such as temperature, residence time, inert gas environment, and biomass feedstock. The other is by modifying the biochar properties after the pyrolysis process through some physical, chemical and thermal functionalisation [7]. However, a third approach which is considered more efficient focuses on the functionalisation of the biomass feedstock before its pyrolysis conversion into biochar adsorbent. This approach can be cost-effective as it eliminates the traditional two-step process and reduces the processing time as both biochar production and properties modification occur simultaneously in a single process [8,9]. Nevertheless, limited studies have been focused on the pre-treatment of biomass to produce active adsorbent biochar materials, particularly for enhanced removal of phenolics.
The commonly used feedstocks for the production of biochar are woody biomass and agricultural residues. Orange peel is one such abundant and underutilised agricultural residues with an annual orange production estimated at 60 million tonnes per year with 50–60 wt% ending up as waste in the form of skin, seeds and membrane residue [10,11]. According to Satara and Karimi, approximately 30% of the global citrus production is processed by food industries which utilise only 40–50% of the total biomass as the edible fraction [12]. The orange peel waste has a low pH (3–4), high water content (70–85%) and is rich in polysaccharides such as hemicellulose, cellulose, pectin, protein, lignin, polyphenols, and essential oil [13,14,15]. All these characteristics not only impact the formation of porous structure during pyrolysis but also aid in the synthesis of adsorbents with specific surface area, porous structure, and chemical behaviour that are integral in removing phenolic pollutants from wastewater [16].
Since orange peel has a lignin-based composition and has many oxygen-containing functionalities such as carboxyl and hydroxyl moiety (C-O, O-C-O, -COOH, and -OH), which could be important active sites for the adsorption of pollutants from wastewater [17,18]. In addition, orange peel usually comprises of higher quantities of pectin, which, alongside balanced short-chain organic acids, contribute to the distinctive properties of the generated biochar. In this context, it would be best to use the orange peel as a precursor for the production of pretreated biochar [19].
The activation technique can be divided into physical and chemical activation. Chemical activation uses acids such as nitric acid, phosphoric acid and alkalis such as sodium hydroxide, and potassium hydroxide, as well as salt such as zinc chloride, to improve the surface properties of the biochar-based adsorbents [20]. Generally, potassium hydroxide (KOH) is widely used to activate the organic precursor, since KOH reacts with the carbon precursor at high temperatures (>600 °C) and generates potassium oxide (K2O), which can be reduced into potassium by carbon, which results in the subsequent emission of volatile components such as CO2 and CO and formation of micro- and mesopores in the carbon matrix [21,22]. Chemical activation can be carried out through either a one-step or two-step process. One-step activation of biomass via direct KOH impregnation followed by high-temperature pyrolysis (~800 °C) integrates carbonisation and chemical activation into a single thermal process, significantly reducing processing time, energy consumption, and operational complexity. This approach promotes simultaneous devolatilization and pore development, often leading to more efficient activation, higher surface area, and improved pore accessibility due to intimate contact between KOH and the evolving carbon matrix. In contrast, the traditional two-step method (separate carbonisation, chemical activation, and re-carbonisation) requires additional heating cycles, material handling, and processing time, increasing energy demand, cost, and potential structural collapse or pore blockage during intermediate stages [23,24].
In our previous study, we have synthesized one-step activated biochar from orange peel pyrolysis at a temperature of 400 °C for the adsorption of AP from water and observed a BET-specific surface area of 403 m2/g and an adsorption capacity of 59.4 mg/g [25]. Hence, to further enhance the adsorption performance, we have increased the activation temperature to 800 °C and employed orange peel-derived activated char to remove DNP and AP from an aqueous solution. An increase in temperature to 800 °C enhances the adsorption performance by promoting the formation of a more stable C=C bond, increasing the surface area from 403 to 965 m2/g, leading to more accessible sites for phenolic pollutants to bond with the activated carbon. For example, Keiluweit et al. [26] reported that increasing pyrolysis temperature promotes aromatic cluster formation and structuring ordering of biochar. Similarly, Ahmad et al. [27] showed that higher pyrolysis temperatures enhance pore development and surface area by facilitating volatilisation and structural condensation. The novelty of this study lies in the integration of experimental adsorption studies with quantum chemical Density Functional Theory (DFT) modelling and surface chemistry insights, which collectively unravel the adsorption behaviour of phenolic pollutants. Unlike conventional studies that rely solely on batch adsorption experiments, this work uniquely correlates adsorption capacity with electronic properties of adsorbates (DNP and AP), derived from HOMO-LUMO energy gap calculations and hardness values based on DFT. The present study shows a comparative analysis of the adsorption of DNP and AP using KOH-pretreated orange peel biochar produced at 800 °C. The main objective of this study is to (i) synthesise and characterise biochar produced from the pyrolysis of KOH-pretreated orange peel, (ii) investigate the effect of adsorption conditions such as contact time, adsorbent dosage, and initial concentration, (iii) derive non-linear kinetic parameters and adsorption isotherms. In addition, DFT is employed to study the chemical reactivity of the two phenolic compounds on the biochar surface, involving theoretical parameter calculations.

2. Materials and Methods

Orange peels were sourced from Preston Market, Melbourne, Australia. The orange peels were washed with water to remove any surface impurities, such as sand, then dried and milled with a grinder and passed through a sieve to achieve a particle size of 0.210 mm (70 ASTM). All chemicals were purchased from Sigma-Aldrich (Merck), Melbourne, Australia, which included HCl (32%), KOH (99%), NaOH (98%), acetone (99.5%), AP (99%), and DNP (98%). Whatman filter paper of grade 1, 40 and 41 was used for all solid–liquid filtration processes.

2.1. Biomass Pre-Treatment and Biochar-Based Adsorbent Production

The as-prepared orange peel powder was pretreated with KOH before high-temperature carbonisation. The KOH pre-treatment was employed as a chemical activation strategy because alkali activation is well known to enhance the microporosity and surface area during high-temperature carbonisation. The impregnation ratio of 1:1 (biomass: KOH, dry basis) was chosen based on our previous study and literature reports indicating that moderate KOH loading effectively develops porosity while avoiding excessive structural collapse [3]. For the KOH pre-treatment of the orange peel, 15 g of the as-prepared orange peel powder was mixed with 15 g of 50% (w/v) KOH solution to maintain a biomass-to-KOH impregnation ratio of 1:1 (on a dry basis). The mixture was stirred at room temperature for 15 min to allow all biomass to be mixed thoroughly with the KOH solution. After impregnation, the mixture was dried in an oven at 105 °C and then kept in a tubular quartz pyrolysis reactor at 800 °C for 1 h under constant nitrogen flow. Carbonization at 800 °C for 1 h under a continuous nitrogen atmosphere was selected to ensure complete thermal decomposition of volatile components, promotes aromatization of the carbon framework, and maximize pore development through KOH activation reactions. The obtained char was washed with 0.1 M HCl to remove the inorganic components or unreacted KOH until the neutral pH = 7 was achieved. Finally, the biochar was dried in an oven at 105 °C. The schematic diagram for biochar synthesis process is represented in Figure S1.

2.2. Characterisation of Adsorbent

A combination of complementary physiochemical characterization techniques was employed to systematically investigate the structural, thermal, surface and chemical properties of the prepared biochar, which are critical parameters governing adsorption performance. The surface morphology of the biochar was carried out using FEI Nova Nano SEM 200 (Thermo Fisher Scientific, Waltham, MA, USA) to evaluate surface texture and pore structure. Thermal stability and decomposition behaviour of orange peel biomass and biochar were analysed using a Trios SDT650 thermogravimetric analyser (TA Instruments, New Castle, DE, USA) over 30–960 °C with a heating rate 10 °C/min using under a nitrogen atmosphere. Surface functional group were identified by FTIR spectroscopy (Nicolet iS20, Thermo Scientific, Waltham, MA, USA) in attenuated total reflection (ATR) mode within the range 4000–400 cm−1. Surface elemental composition and chemical states were determined using XPS with a monochromatic Al Kα source (1486.7 eV) to assess surface chemistry and adsorption related changes. The specific surface area was measured by the BET method using a Micromeritics TriStar II (Micromeritics Instrument Corporation, Norcross, GA, USA) analyser after degassing the samples at 960 °C overnight. These techniques were selected to correlate morphology, thermal stability, surface chemistry, and porosity with the adsorption performance of the biochar.

2.3. Computational Analysis

All geometry optimisation and total energy prediction was carried out within the framework of Density Functional Theory (DFT) using the Gaussian 6.1 software. The quantum chemical descriptors, such as chemical potential μ (µ, electrophilicity ω ( ω ), chemical hardness η , and dipole moment were computed using DFT–Koopmans theorem [28,29,30,31,32] using Equations (1)–(3); their values are reported in Table S1. The total energy reported in Table S1 is expressed in Hartree units. The adsorption energies were first calculated as the difference between respective Hartree values and subsequently converted into electron volts (eV) using the conversion factor of 1 Hartree = 27.21 eV. The structural geometry of biochar was simulated using a B3LYP hybrid functional and a 3–21 G split valence Gaussian basic set for H, C, N and O atoms [33,34]. The molecular level adsorption of DNP and AP was estimated using Equation (4) [35,36].
C h e m i c a l   h a r d n e s s   η = E H O M O E L U M O 2
C h e m i c a l   p o t e n t i a l   μ = E H O M O + E L U M O 2  
E l e c t r o p h i l i c i t y   ω = μ 2 2 η
E a d s o r p t i o n = E c o m p l e x ( E a d s o r b e n t + E a d s o r b a t e ) + E B S S E
where E c o m p l e x , represents the Gibbs free energy for the biochar–DNP/AP complex while E a d s o r b e n t and E a d s o r b a t e represent the Gibbs free energy for biochar (adsorbent) and DNP/AP adsorbate molecules, respectively. E B S S E represents basic set superposition energy for the adsorption energy calculated by the counter-poise method.

2.4. Adsorption Experiments

The stock solution (1000 mg/L) of DNP and AP was prepared by mixing 1 g of each compound with deionised water and making up to a 1000 mL solution. The adsorption parameters such as pH (2–13), contact time (0–70 min), adsorbent dosage (0.2–1.0 g/L), and phenol concentration (50–300 mg/L) were varied. Initially, the effect of pH was examined by conducting batch adsorption experiment as follows: 25 mL of 50 mg/L DNP or AP solution was taken into a beaker and 15 mg of adsorbent was added, then the mixture was agitated on a mechanical orbital shaker for a contact time of 60 min. During the adsorption process, all other parameters were kept constant while varying only one parameter at a time. After the adsorption process, the biochar was separated from the solution using filter paper, and the filtrate was analysed for residual concentration of DNP and AP using a UV-VIS spectrophotometer (Shimadzu UV 1800, Kyoto, Japan); the spectra of the molecules are shown in Figure S2. The adsorption efficiency (%) and adsorption capacity at equilibrium (qe) were calculated using Equations (5) and (6), respectively.
Adsorption   efficiency   ( % )   =   C i C f × 100 C i
Adsorption   capacity   ( q e ) =   C i C f × V W
where ci and cf are the initial and equilibrium concentration (mg/L) of each phenolic compound, V is the volume (L) of solution used, and W is the amount (mg) of adsorbent added.

3. Results and Discussion

3.1. Surface Properties of the Biochar Adsorbent

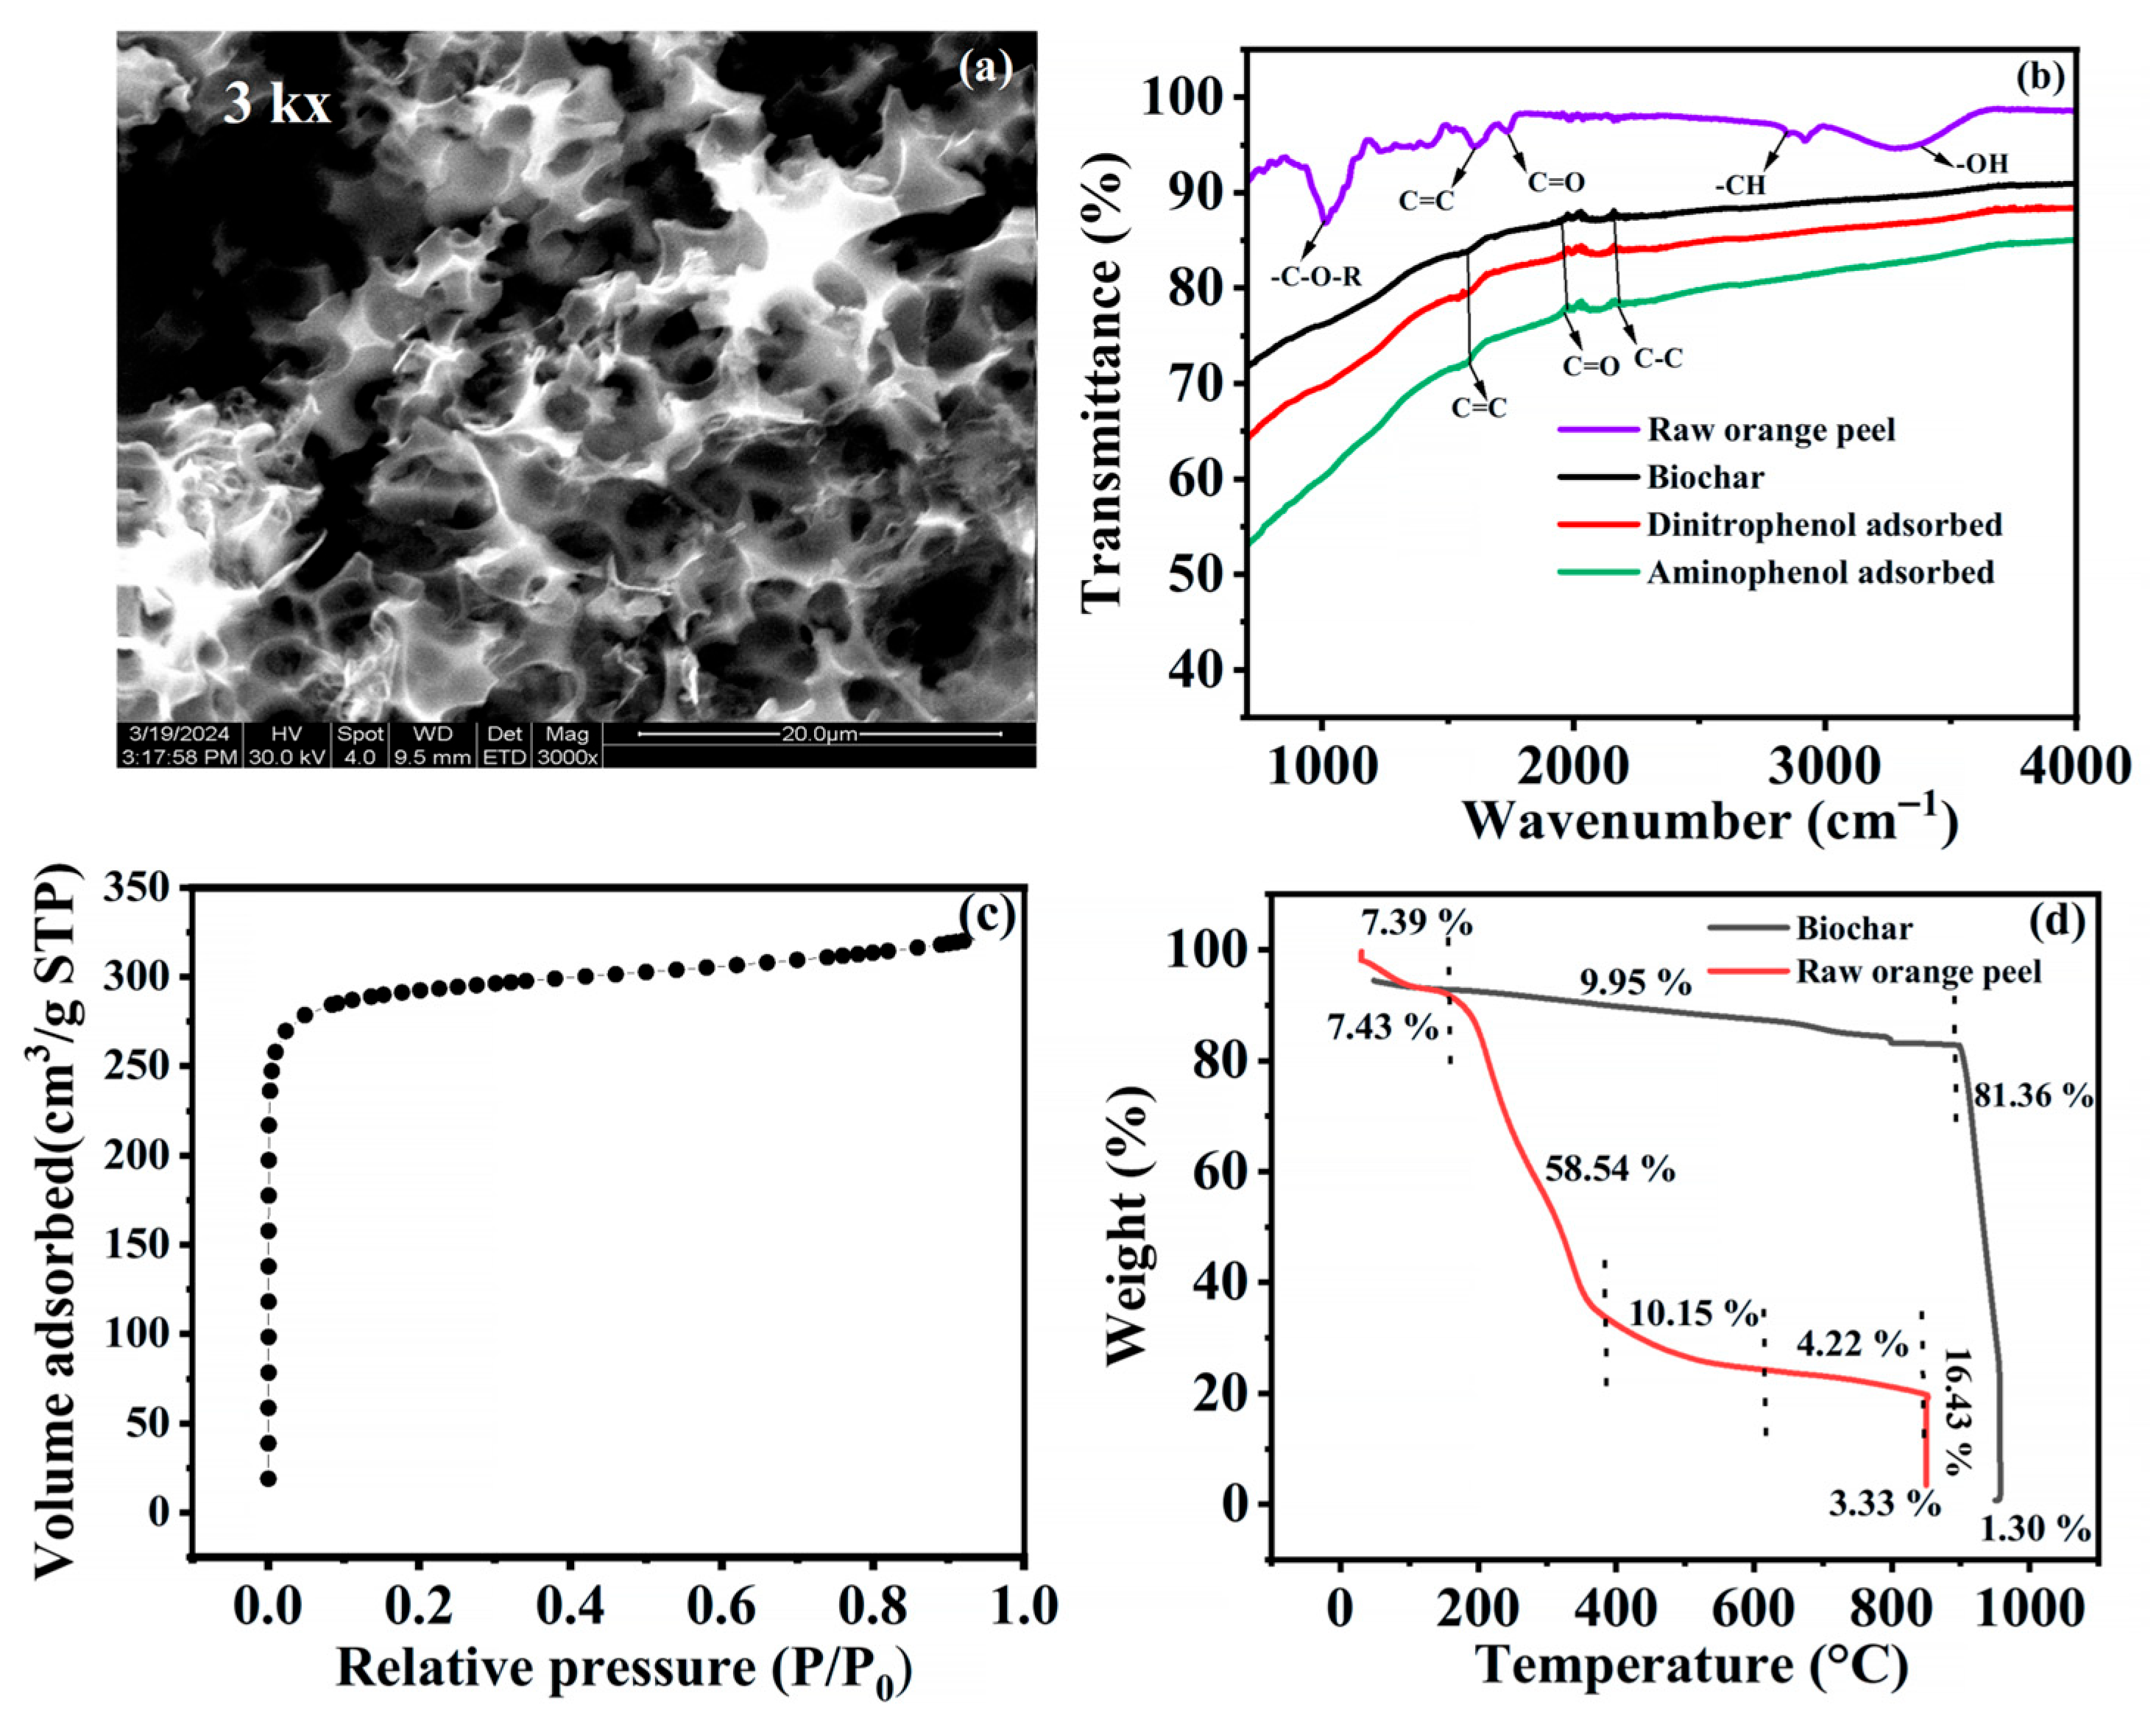
The surface properties of biochar were studied using scanning electron microscopy. It was observed that the surface has a porous structure and irregular cavities, as shown in Figure 1a. The BET analysis of the biochar sample performed with N2 desorption/adsorption isotherms is depicted in Figure 1c. The obtained isotherm corresponds to a Type 1 isotherm according to IUPAC classification, which is characteristics of predominantly microporous materials. Type 1 isotherms are identified by a sharp uptake of nitrogen at relatively low pressure (P/P0 < 0.1), indicating strong adsorbent–adsorbate interactions and the presence of micropores. The biochar exhibited a high specific surface area of 966 m2/g with an average pore width of 1.45 nm and total pore volume of 0.071 cm3/g, confirming its well-developed microporous structure.
The FTIR spectra of the orange peel biomass and biochar adsorbent are shown in Figure 1b. From the FTIR spectra, it is obvious that after pyrolysis, most of the peaks have disappeared due to the removal of hemicellulose and cellulose material. The prepared biochar at higher temperatures had a lower (H/C) and (O/C) ratio, which corresponds to the limiting existence or absence of surface functional groups [37,38]. However, after adsorption, there is no change in the surface functional groups, indicating that the biochar is stable in the aqueous solution.
The thermogravimetric analysis (TGA) curve for raw biomass and biochar is shown in Figure 1d. From the graph, it can be seen that the first stage was observed up to 140 °C and shows a weight loss (about 7.4%) attributed to the removal of moisture content. The raw orange peel then undergoes a significant weight decrease between 140 and 386 °C which corresponds to the release of volatile matter, primarily due to the degradation of hemicellulose and some celluloses. This volatile matter accounts for about 58.5% weight loss in the raw peel, which is typical for lignocellulosic materials. Beyond this, 350–600 °C, the mass loss slows down and is associated primarily with the breakdown of cellulose and lignin as well as the transformation of organic fractions into fixed carbon (biochar). The residual weight after this stage represents the fixed carbon content about 16.4% for raw peel, reflecting the carbon-rich char that remains after pyrolysis [38,39,40]. Above 800 °C, only a minimum weight loss is observed, as well as the remaining mass (approximately 3.3%) as ash content. For the biochar synthesized at 800 °C, the TGA curve reveals significantly improved thermal stability. The biochar retains over 80% of the residual mass up to 800 °C, with very minor losses corresponding mainly to residual moisture and a small fraction of volatile matter. The substantial weight retention and reduced volatile content are evidence of the high fixed carbon content in the biochar. The higher carbon content in the biochar favours the adsorption of DNP and AP as compared to biomass.

3.2. X-Ray Photoelectron Spectroscopy (XPS)

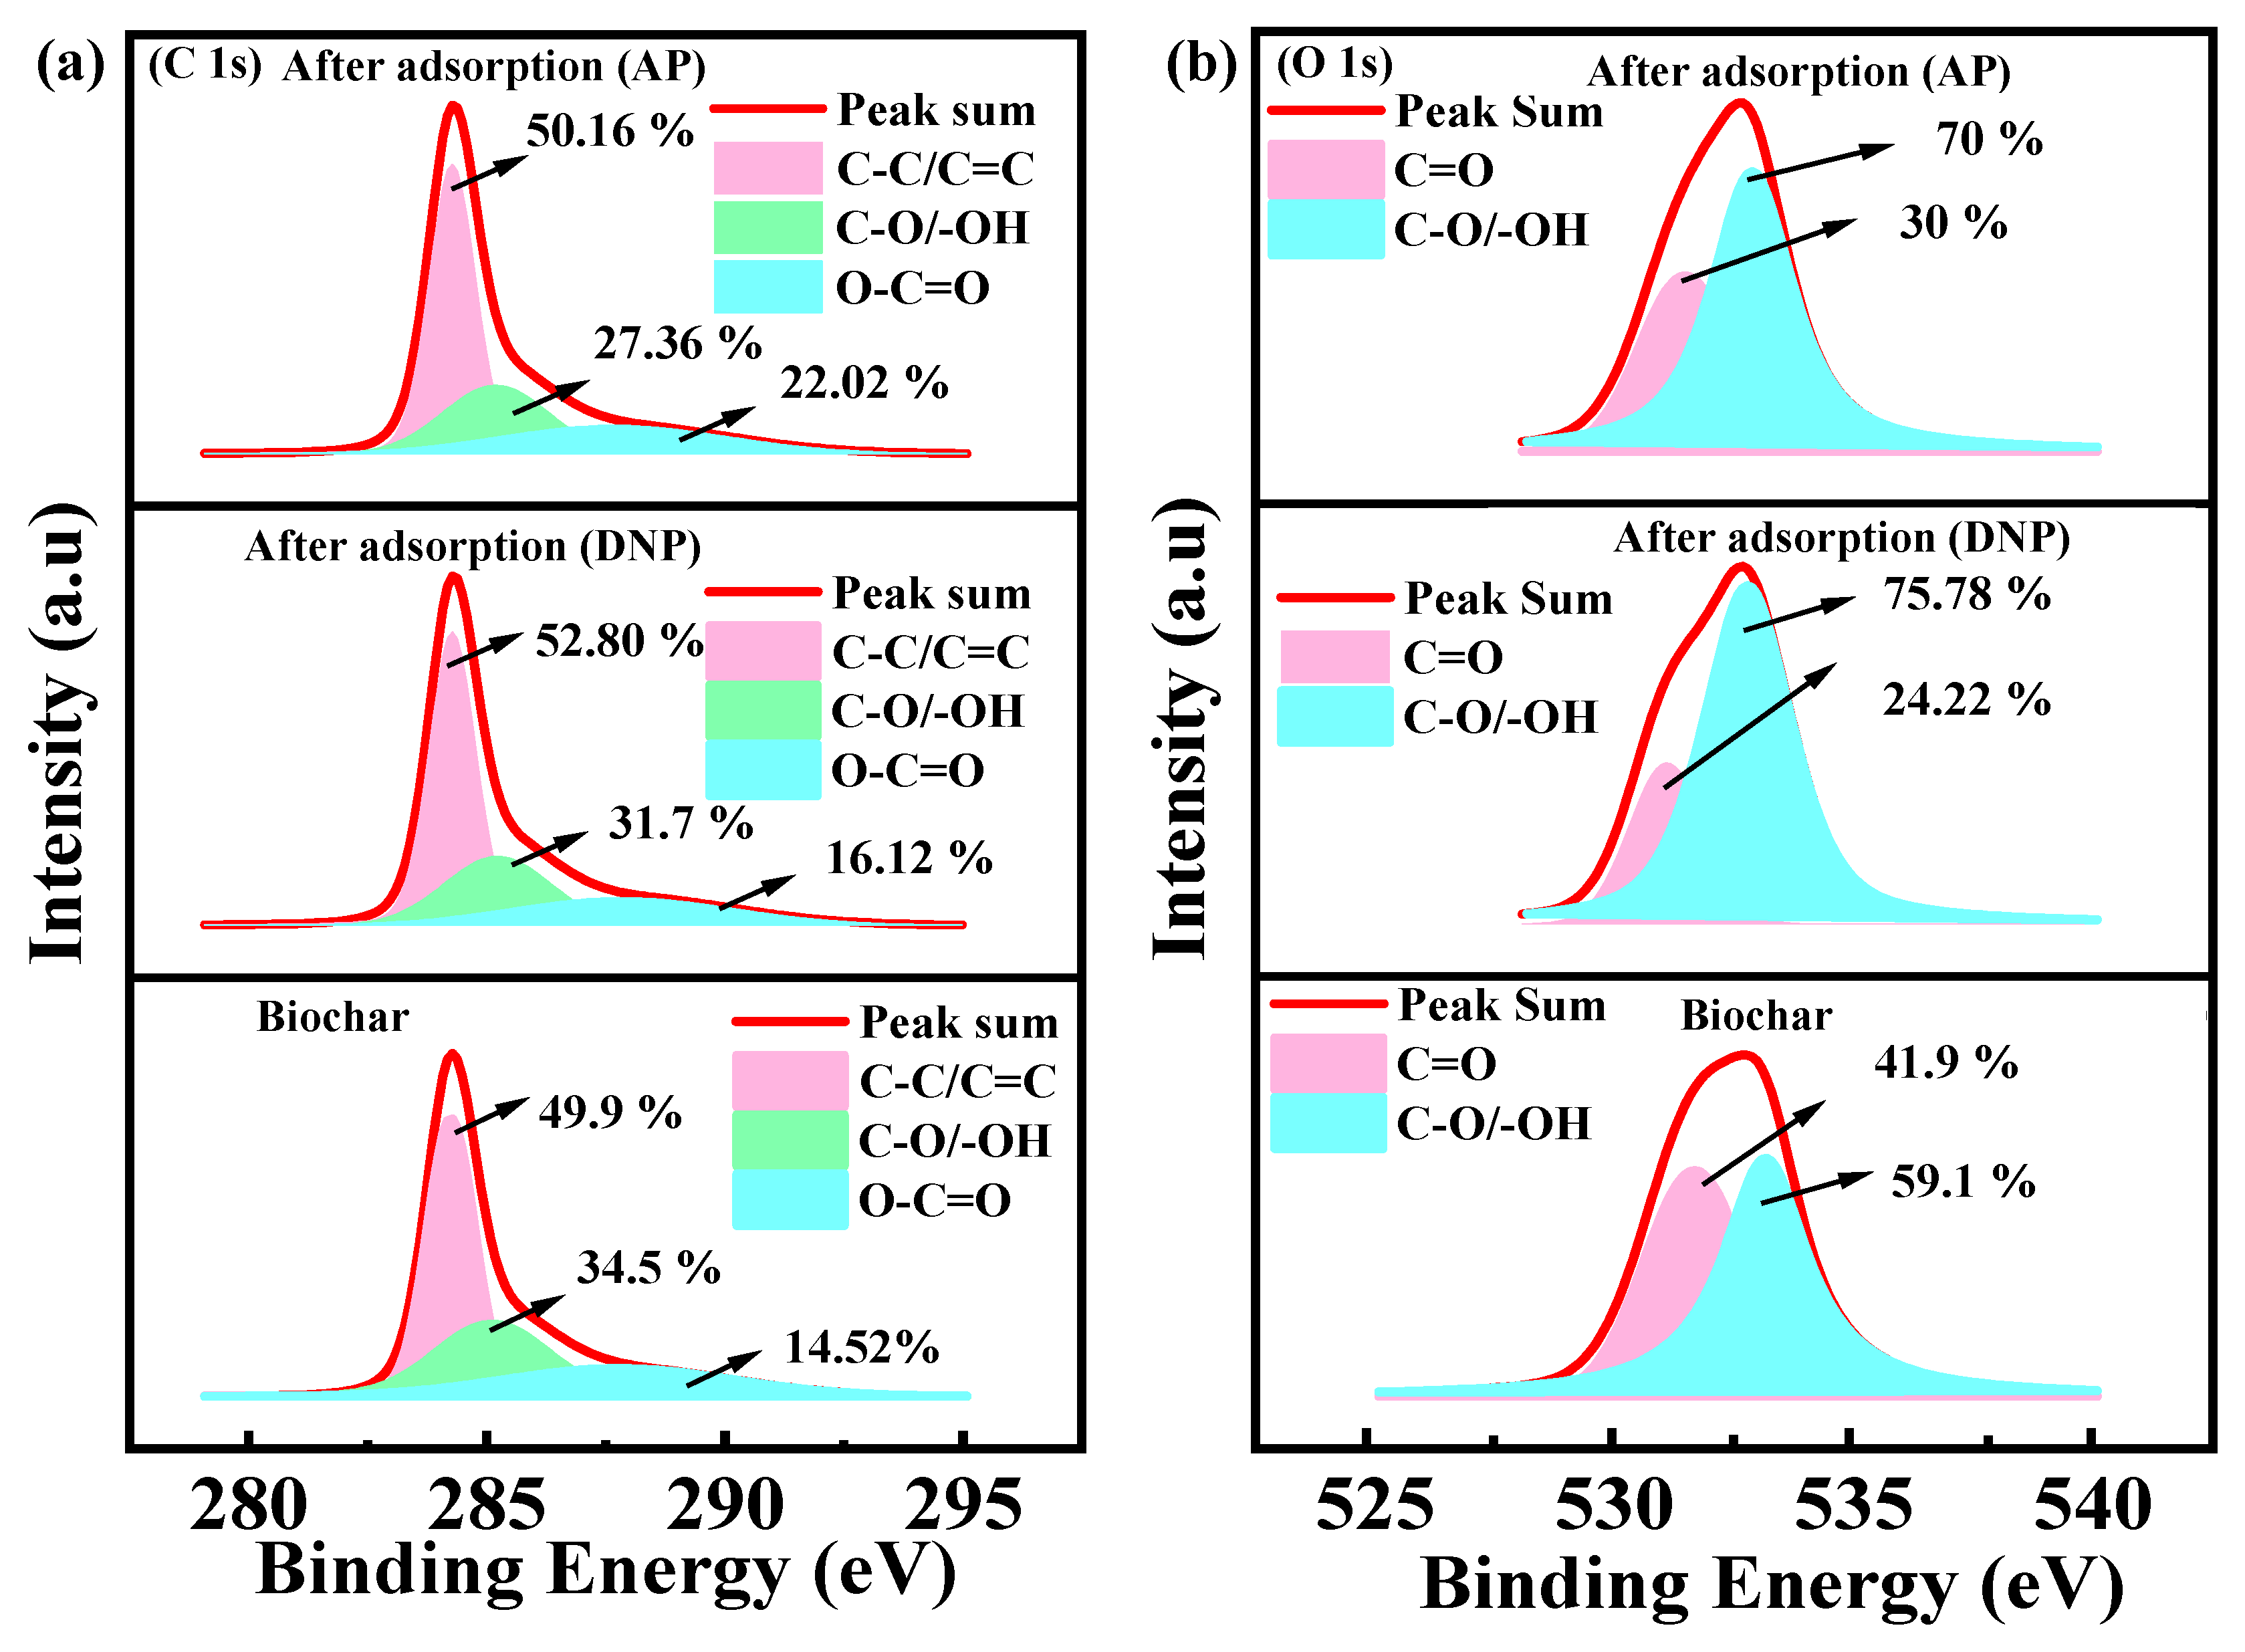
XPS spectra of KOH-pretreated biochar were obtained before and after the adsorption process. The survey scan spectra show mainly C (86.82%), O (12.45%), and N (0.73%) as shown in Figure S3a. The high-resolution C1s XPS spectra (Figure 2a) of biochar before and after adsorption of DNP and AP were deconvoluted into three characteristics components centred at 284.5 eV (C-C/C=C, graphitic or aromatic carbon), 286.0 eV (C-O, C-OH), and 288.5 eV (O-C=O). The biochar exhibits a dominant C-C/C=C contribution (49.9%), confirming its aromatic carbon framework, along with appreciable oxygen-containing functionalities. After DNP adsorption, the relative contribution of aromatic carbon increases (52.80%), and a slight shift of binding energy is also evident. The presence of strong electron withdrawing -NO2 in DNP likely induces partial electron transfer from the biochar surface, resulting in a mild increase in binding energy. However, no new distinct C1s components are formed, and the binding energy changes remain small (<1 eV), indicating that adsorption predominantly proceeds through non-covalent mechanism such as Π-Π electron donor acceptor interactions and hydrogen bonding rather than chemisorption [17,41]. After AP adsorption, a slight redistribution is seen with an increase in the O-C=O (22.02%) fraction and a decrease in O/C-OH content, accompanied by a subtle shift in the overall C1s envelop toward higher binding energy. This positive shift indicates a decrease in electron density around surface carbon atoms, suggesting interaction between AP functional group (-NH2, and -OH) and oxygenated surface sites via hydrogen bonding π-π interactions. The O1s spectra further support this interpretation by showing redistribution between C=O and C-O peaks after adsorption, confirming the involvement of an oxygen-containing functional group in the adsorption process. Similarly, the nitrogen (C-N) peak shifted from 399 eV to 403 eV, and an increase in the intensity was observed in the case of DNP (Figure S3b), which could be due to two nitrogen (nitro)-containing functional groups [42].

3.3. Density Functional Theory (DFT) Analysis

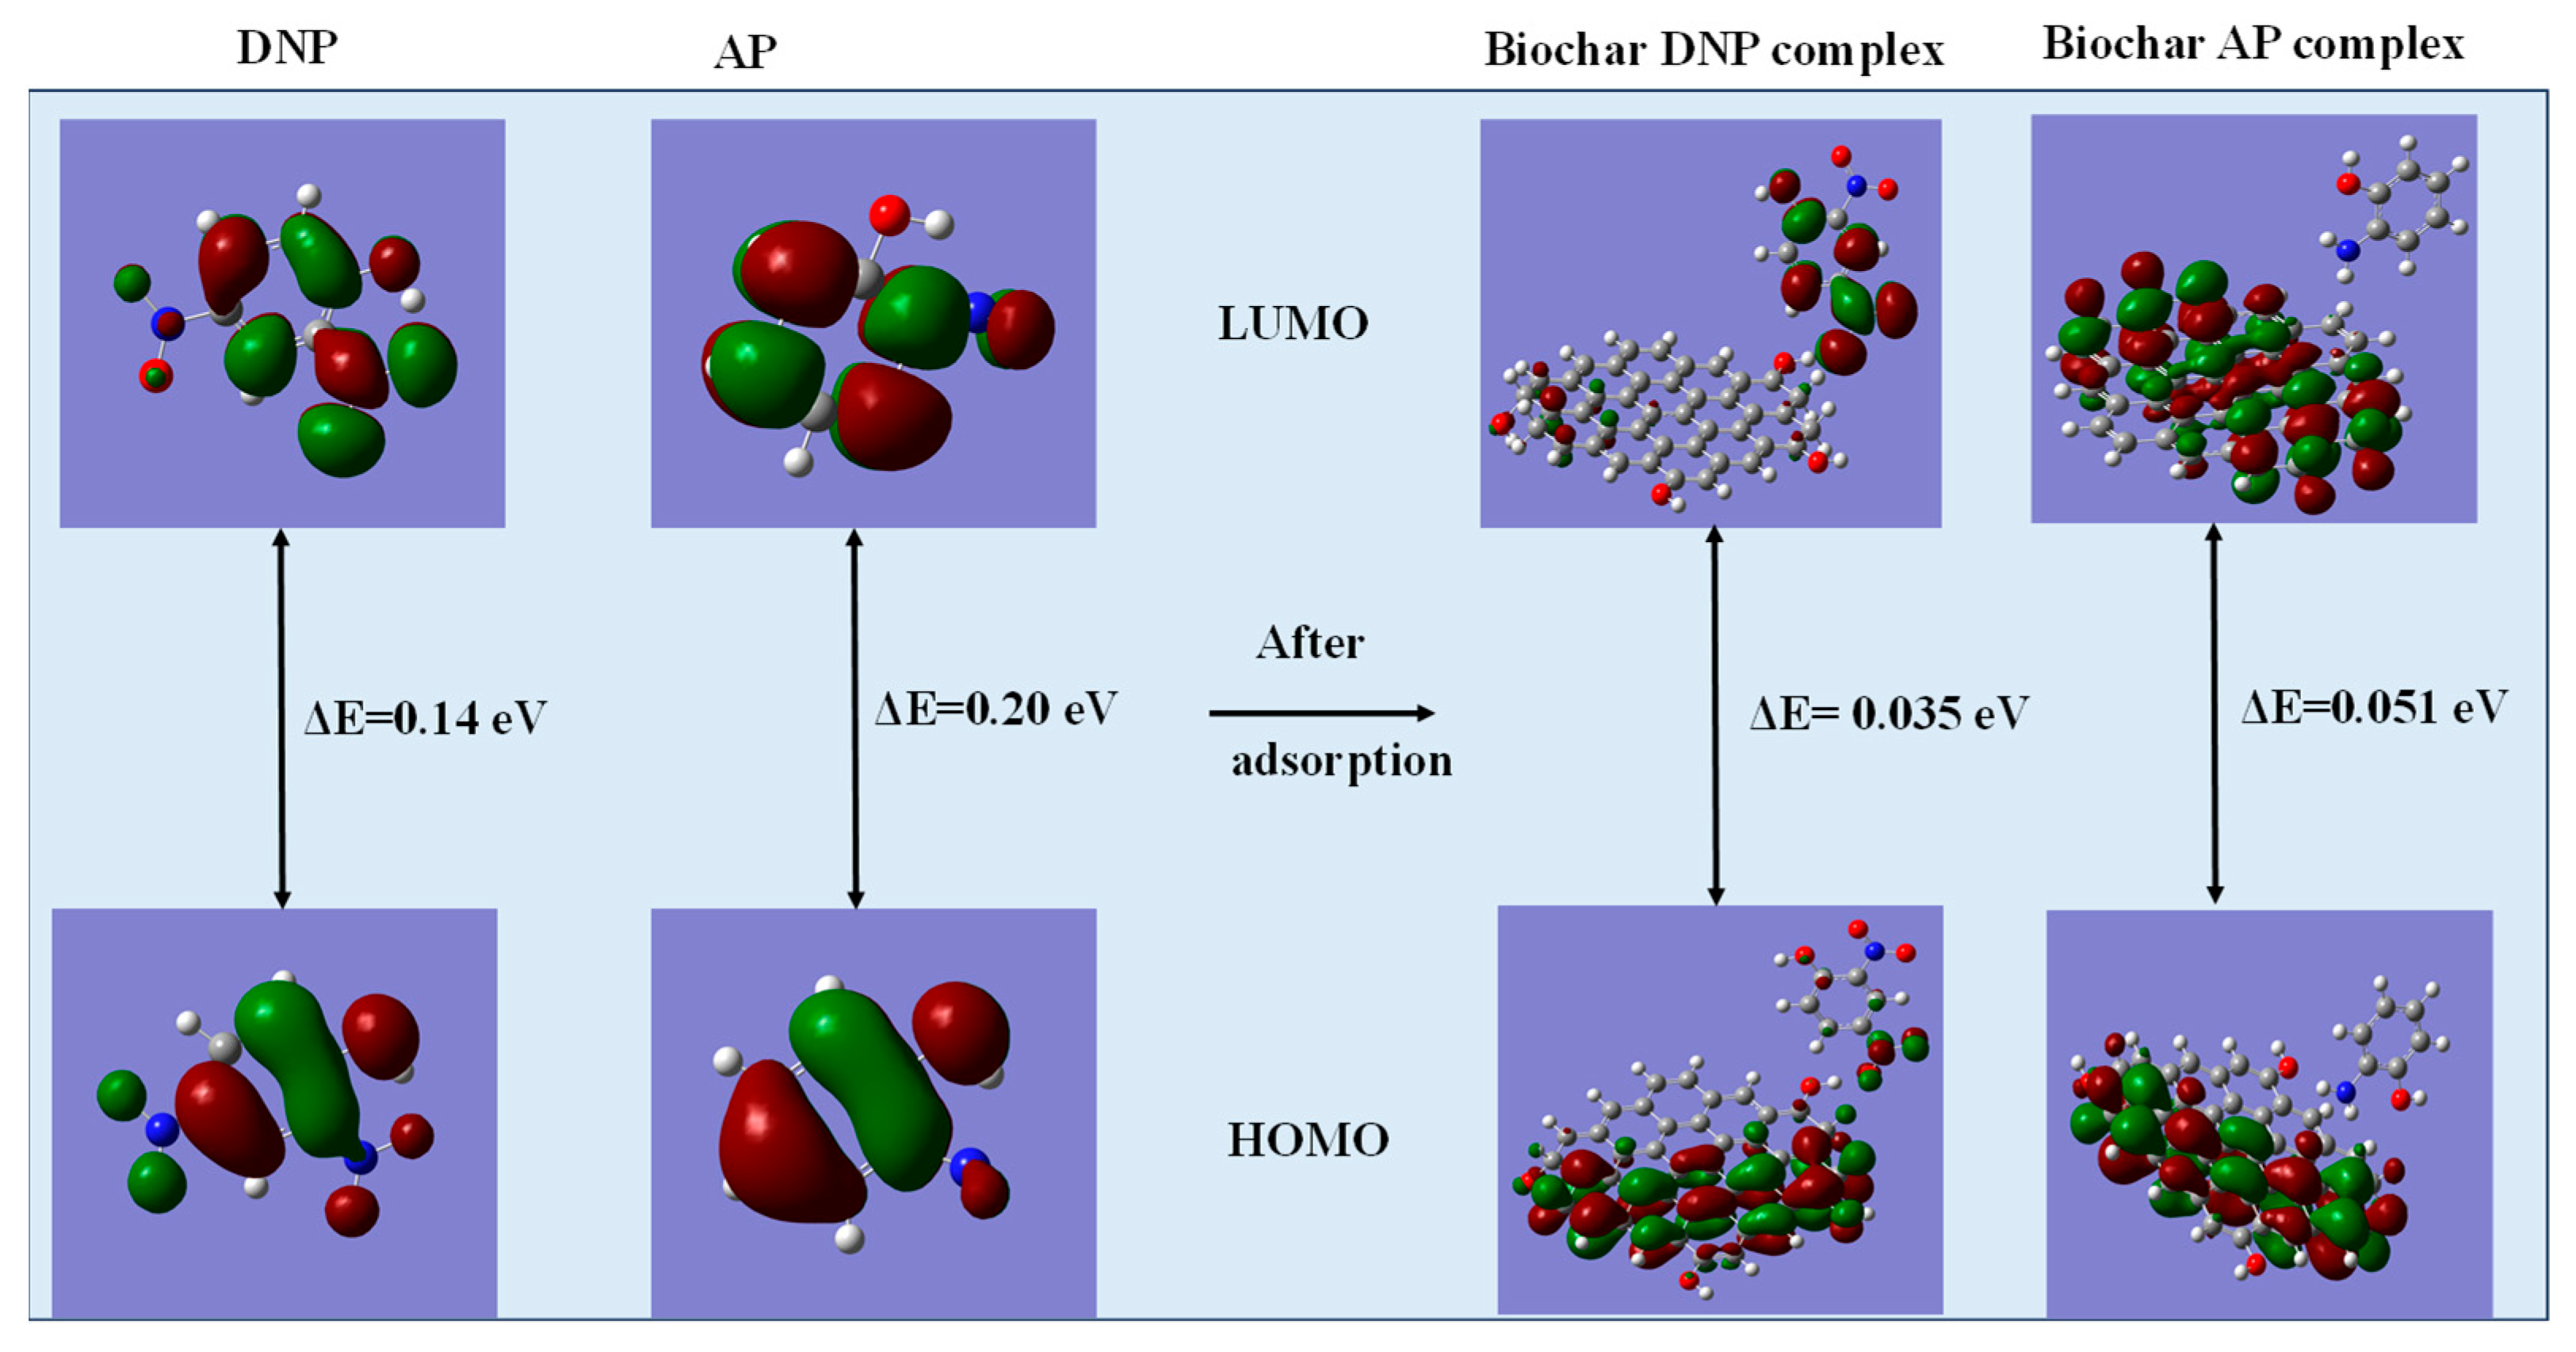
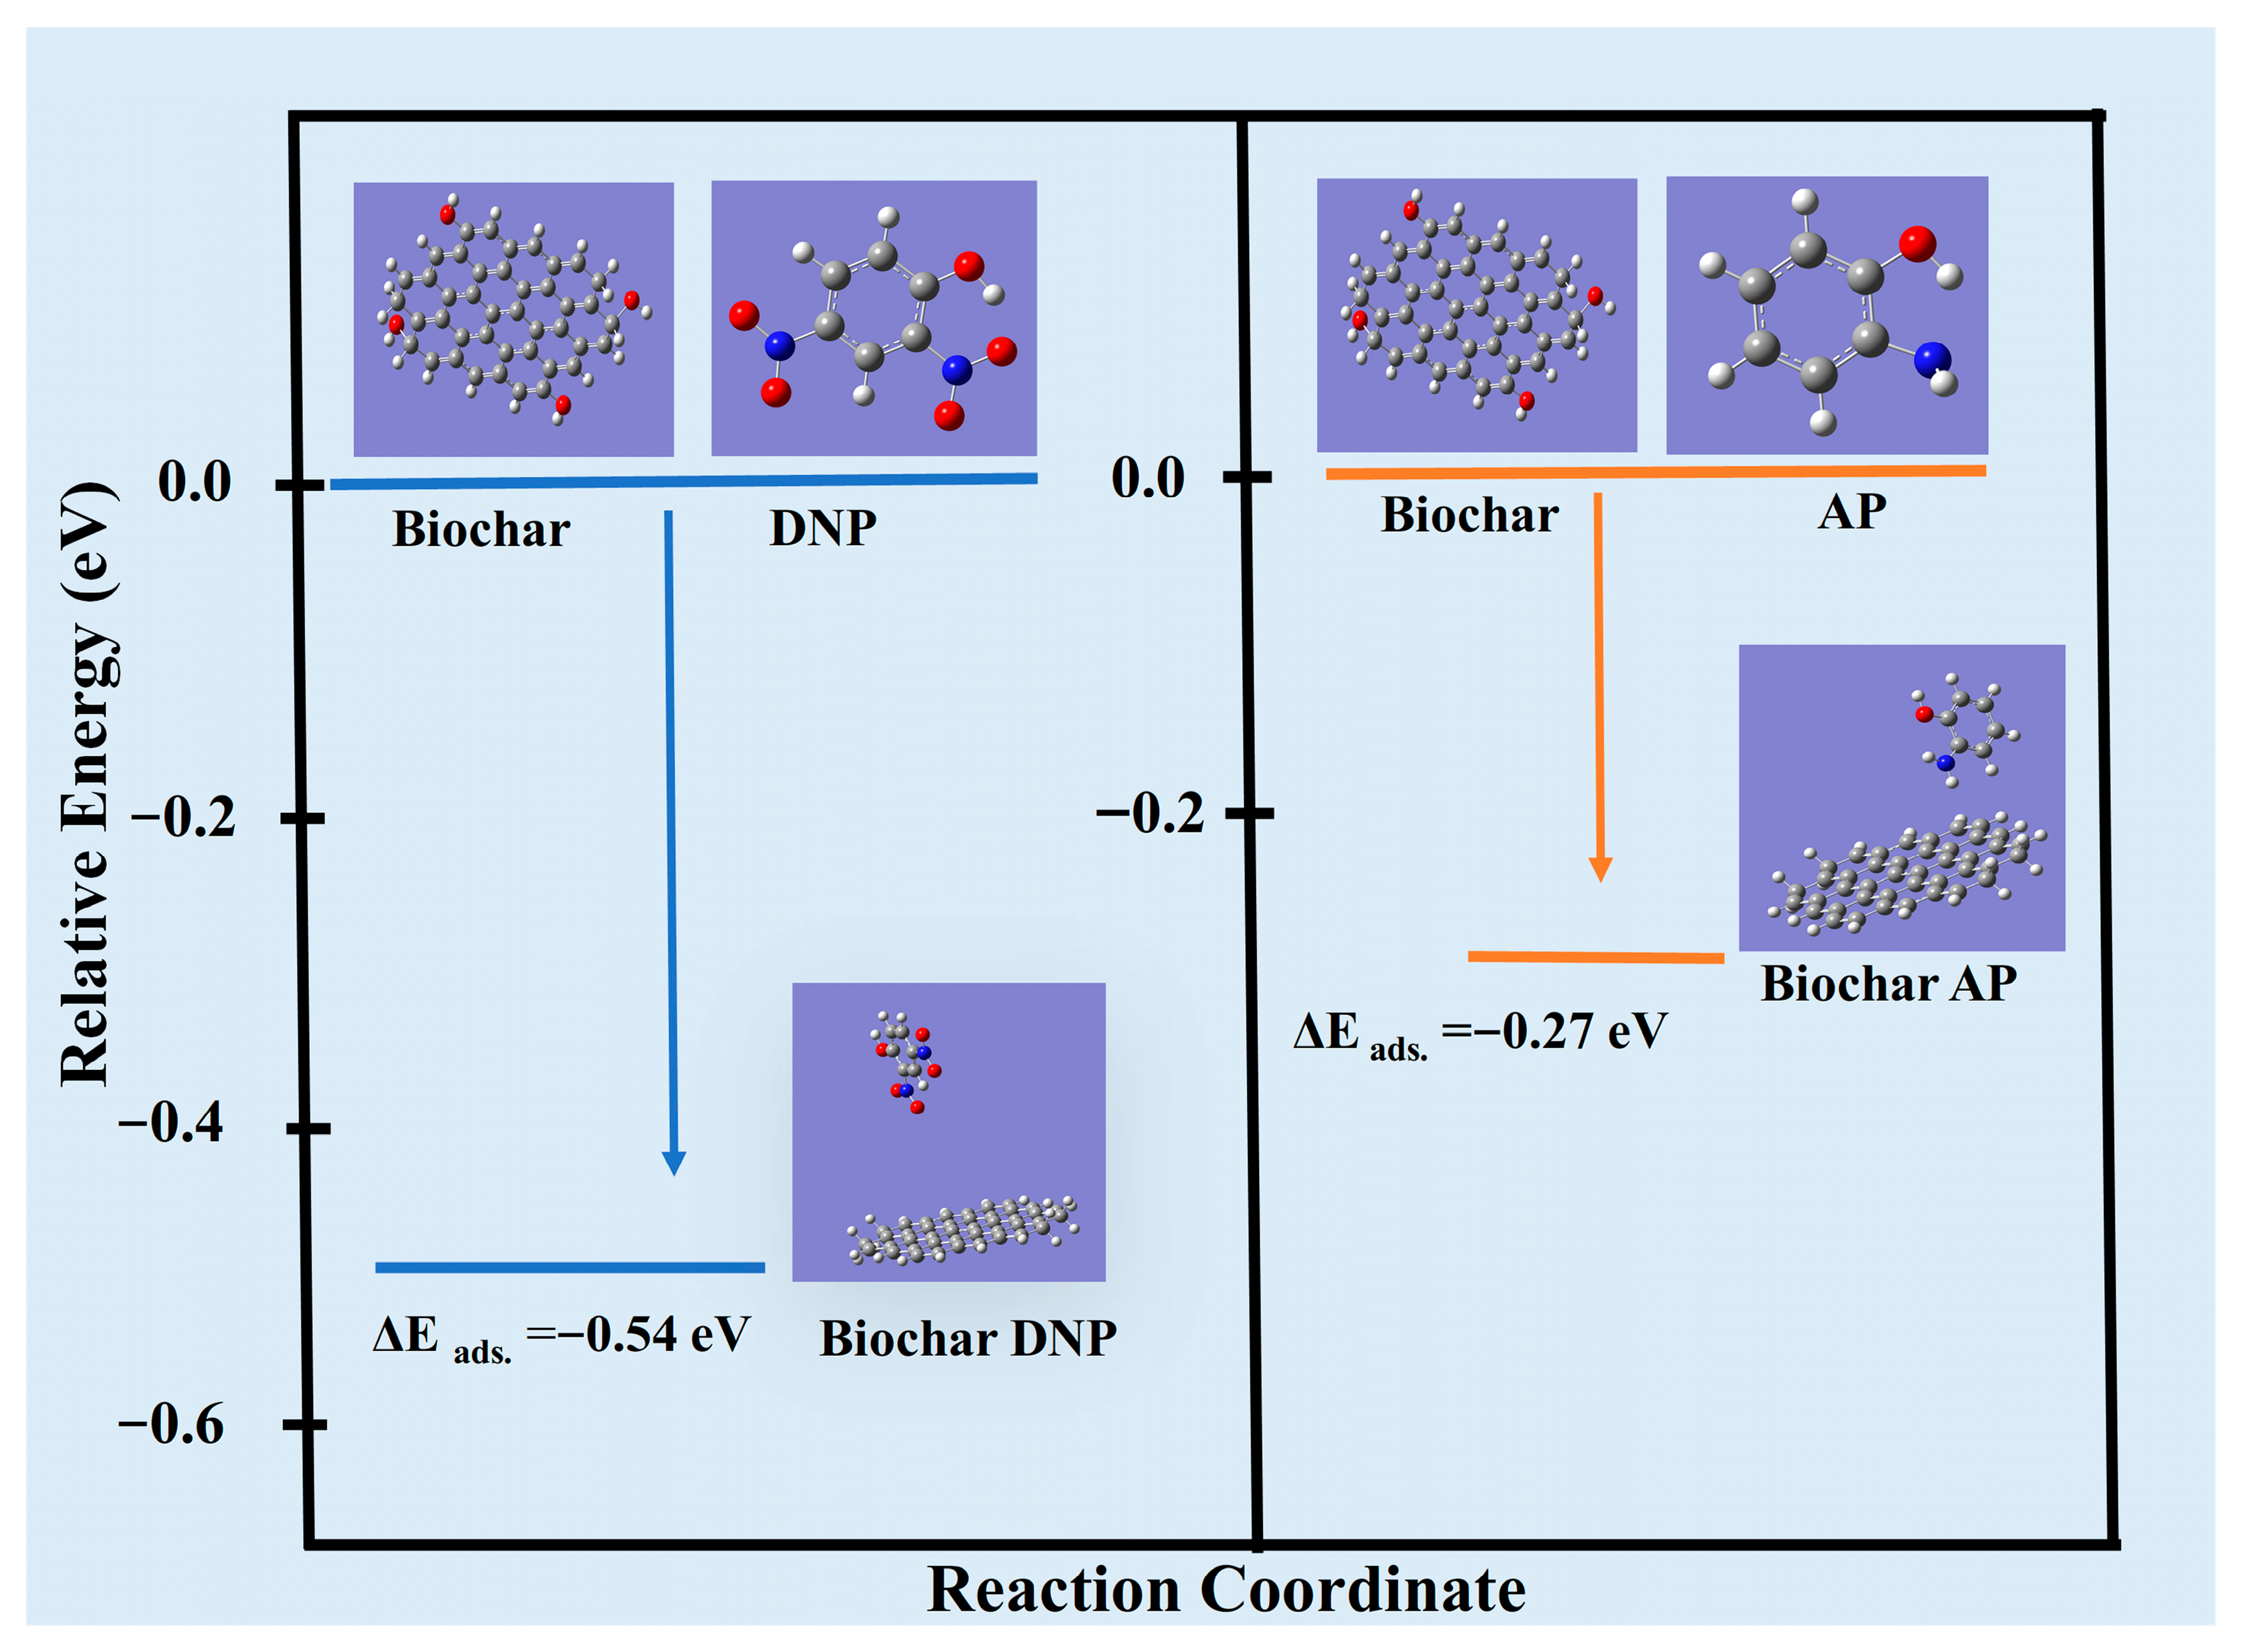
Figure 3 shows the energy value (ΔE) for HOMO and LUMO levels for DNP (0.14 eV) is lower than AP (0.20 eV), suggesting higher reactivity of DNP for biochar surface. These results agreed with the experimental finding obtained from adsorption process. According to the hard soft acid–base (HSAB) principle, the hard molecules exhibit low polarizability and poor reactivity. In contrast, the soft molecules are readily distorted and possess high polarizability and readily undergo charge transfer processes [36,43]. The hardness of DNP (0.071) is lower than AP (0.1052). Hence, it can easily adsorb or transfer electron over biochar surface. Apart from that, it can be seen from Figure 4 that after adsorption, the relative energy was observed to be less for DNP (−0.54 eV) as compared to AP (−0.27 eV). Therefore, DNP exhibits stronger adsorption affinity compared to AP. Furthermore, the calculated adsorption energies (−0.54 eV for DNP and −0.27 for AP) suggest that adsorption process is predominantly governed by physisorption with DNP showing relatively stronger surface interactions, positioning its adsorption behaviour in the borderline region between strong physisorption and week chemisorption.

3.4. Batch Adsorption Study

The experiments were performed in a batch mode, and parameters such as pH, initial concentration, contact time, and adsorbent dosage were studied; the effect of one parameter at a time was studied while keeping the other constant.
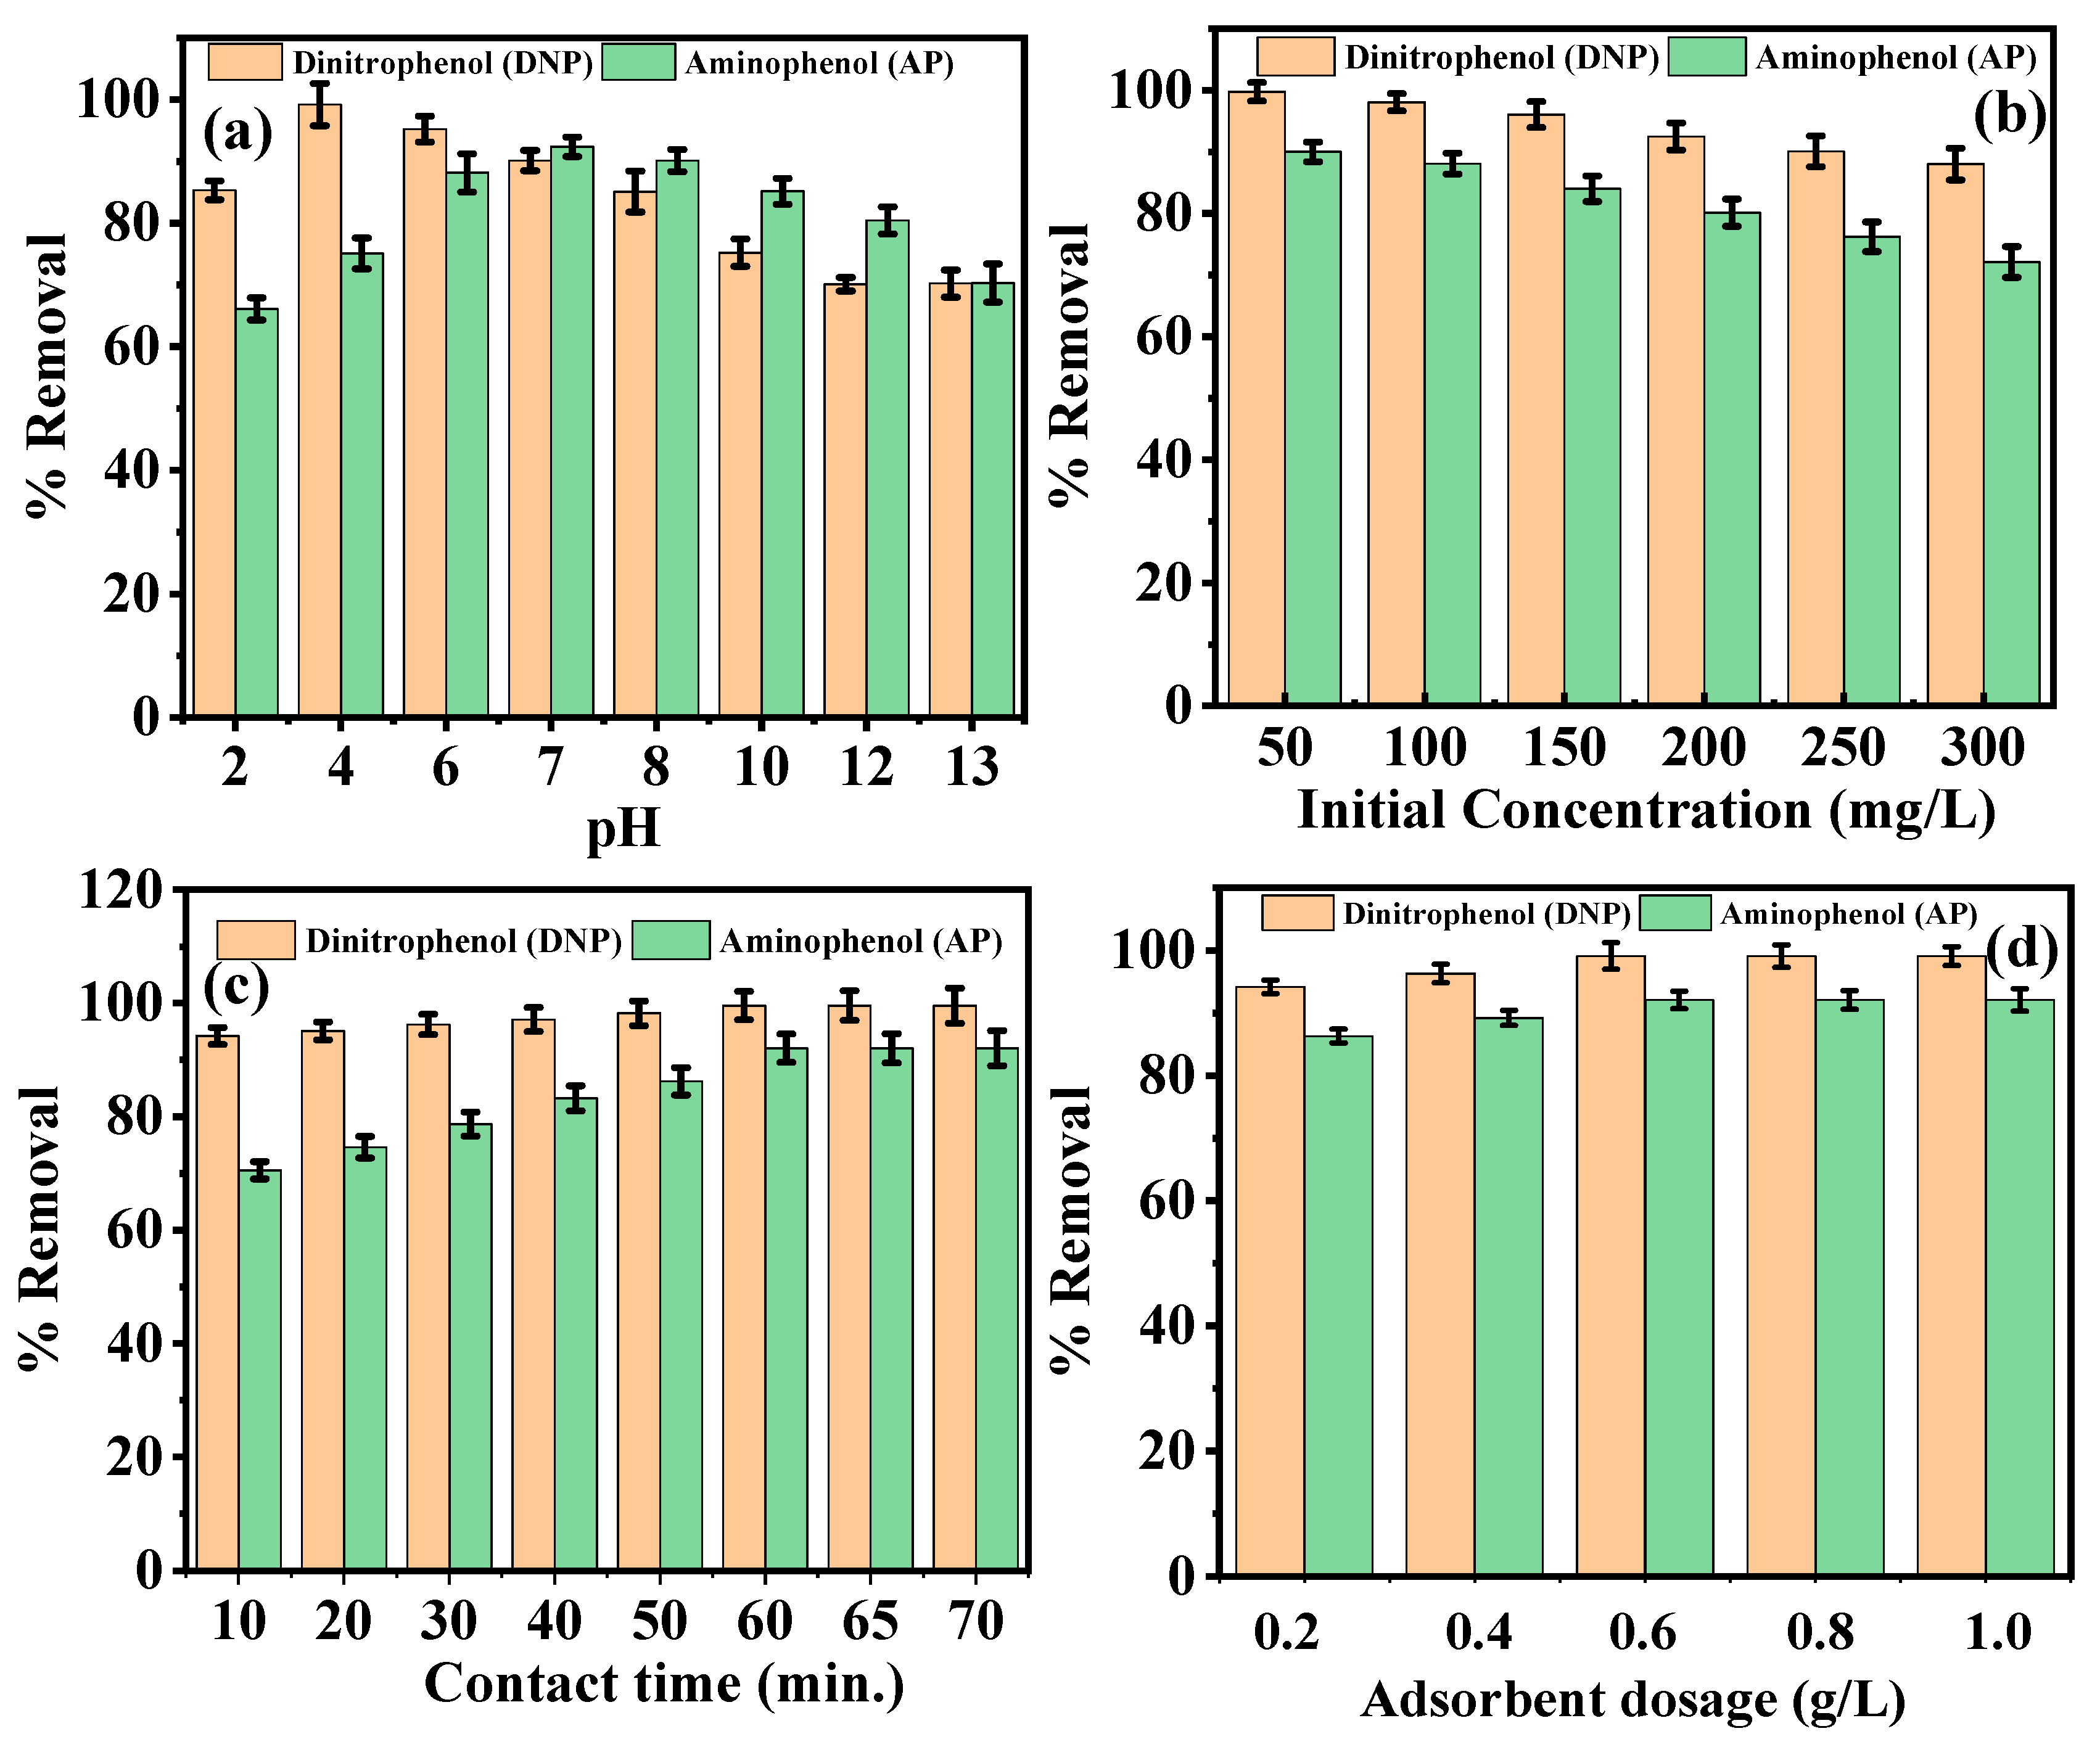
Figure 5a illustrates the effect of solution pH on the adsorption of phenolic compounds. The maximum removal of DNP (99%) is observed at pH 4, whereas AP shows its highest removal efficiency of 92% at pH 7.
This behaviour can be rationalised using the acid–base properties of each molecule. Dinitrophenol (pKa = 4.1) remains predominantly in its neutral molecular form at pH values below 4 [44]. In this state, adsorption is highly favourable due to strong π-π stacking interactions between the aromatic ring of DNP and the graphitic domains of the carbon adsorbent. The presence of electron-withdrawing -NO2 groups further enhances these interactions by rendering the aromatic ring electron-deficient, which facilitates electron donor–acceptor interactions with the carbon surface. When the solution pH exceeds 4.1, DNP undergoes deprotonation, forming the phenolate anion (Ar-O) [45]. Because the carbon surface also develops a negative charge at higher pH, electrostatic repulsion occurs, leading to a marked decrease in adsorption. In contrast, AP achieves maximum adsorption at pH 7. At this pH, AP molecules are largely in their neutral form (-OH and -NH2 groups uncharged), which minimises electrostatic interactions and allows adsorption to be governed by π-π stacking and hydrogen bonding with the carbon surface. However, at pH values above 7, AP gradually deprotonates, forming negatively charged species. These are electrostatically repelled by the negatively charged adsorbent surface, resulting in reduced adsorption efficiency [25,46].
Figure 5b shows the effect of initial concentration on the percentage removal of phenolics. The results indicate that adsorption efficiency decreases as the initial concentration increases. This trend arises because, for a fixed amount of adsorbent, the available active sites remain constant. At lower concentrations, a greater fraction of phenolic molecules can be accommodated on these sites, leading to higher removal efficiency. However, as the initial concentration increases, more phenolic molecules compete for the same limited adsorption sites, leaving a higher residual concentration in solution and thus lowering the overall percentage removal.
The effect of contact time is shown in Figure 5c. The adsorption efficiency increases with an increase in contact time. For DNP, the % removal varies from 80% to 99% while for AP, it ranges from 65% to 92% and the maximum adsorption occurs at 60 min contact time, beyond which the adsorbent becomes saturated. Hence, 60 min can be considered as equilibrium time for the experiments.
Figure 5d shows the effect of adsorbent dosage vs. adsorption efficiency (%). The effect of adsorbent dosage on adsorption performance was investigated from 0.2 to 1 mg/L at an initial concentration of 100 mg/L and 60 min contact time and solution pH 7. As shown in Figure 5d, it is observed that from 0.2 to 0.6 g/L, the removal of phenolic pollutants sharply increases for both DNP and AP and then attains equilibrium; further, the maximum % removal is obtained for DNP is 99%, while it is 92% for AP. As the adsorbent dosage increases, the number of active sites increases, resulting in more phenolic adsorption on the surface of biochar. However, the increase in adsorbent dosage beyond 0.6 g/L does not allow any additional performance in the adsorption process. This could be due to the agglomeration of phenolics (DNP and AP) on the surface of biochar. Therefore, 0.6 g/L is considered the optimum adsorbent dosage to obtain higher adsorption efficiency.

3.5. Adsorption Isotherms and Kinetics

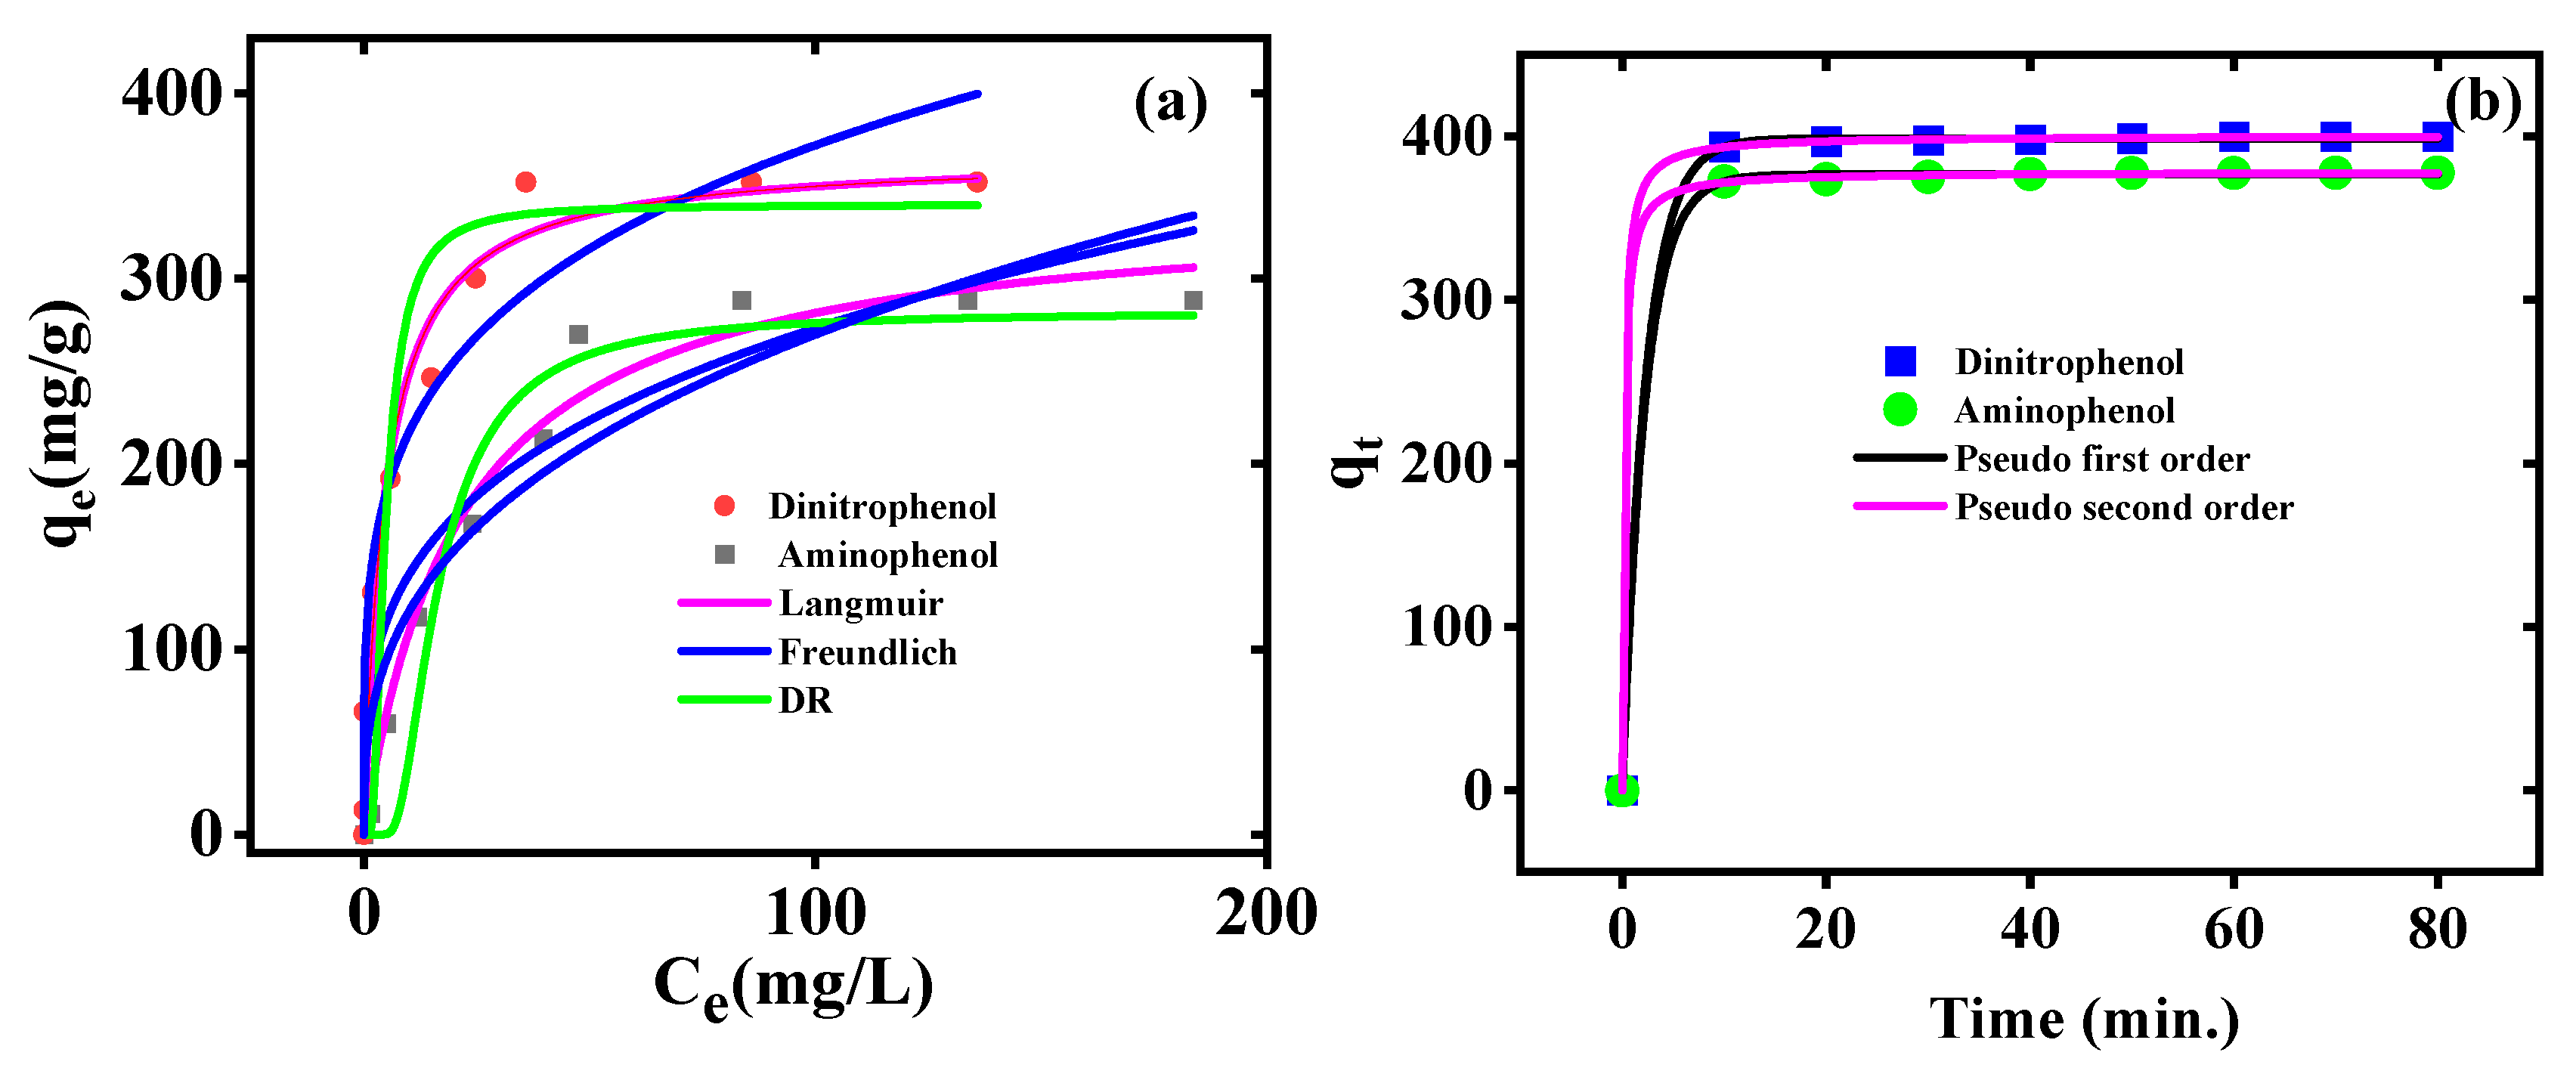
Adsorption isotherms such as Langmuir, Freundlich, and DR were fitted for both the phenolics (DNP, AP) and their isotherm curve and fitting parameters on the surface of pretreated biochar are shown in Figure 6 and Table 1, respectively. The non-linear Langmuir, Freundlich, and Dubinin–Radushkevich (DR) isotherms can be written as follows [47]:
q e = q m K L C e 1 + K L C e  
q e = K F C e 1 n
q e = q m exp B ε 2
where
ε = R T ln 1 + C o C e
The mean free energy E (kJ/mol) for the transfer of one molecule from infinity to the solution may be stated using the following relationship shown in Equation (11):
E =   1 2 B
The adsorption isotherm curve for DNP and AP was better fitted using the Langmuir model, suggesting that the adsorption of phenolics on the biochar surface was homogenous and monolayer surface adsorption. We calculated the correlation coefficient for DNP (R2 = 0.97, ꭓ2 = 748.16) and AP (R2 = 0.98, ꭓ2 = 276.23) for both models. The maximum adsorption capacity for DNP and AP was found to be 366 and 341 mg/g, respectively. The mean free energy (E) was estimated from the DR isotherm as depicted in Table 1; the physical adsorption was favourable when E was <8 kJ/mol and chemical adsorption when E was >8 kJ/mol. The obtained E (1.03 kJ/mol for DNP, 0.80 kJ/mol for AP) suggests physical adsorption.
The non-linear form of pseudo-first-order and second-order kinetic can be written as Equations (12) and (13), respectively [48].
q = q e 1 e k 1 t
q t = K 2 q e     2 t 1 + t   K 2   q e
The kinetic data for both pollutants (DNP and AP) fit the pseudo-second-order (PSO) model much better, as indicated by consistently higher R2 values (0.99 for both pollutants) and substantially lower Chi-square (ꭓ2) statistics (DNP: 0.13 vs. 1.18; AP: 0.47 vs. 1.97) when compared to the pseudo-first-order model as depicted in Table 2. This suggest that the adsorption kinetics are better described by the pseudo-second-order model.

3.6. Comparative Study

Table 3 compares the adsorption capacity of DNP and AP using various biochar and non-biochar-based adsorbents. The data summarized in Table 3 were collected from published literature under similar experimental conditions to this current study (initial concentration, pH, temperature and isotherm models). The maximum adsorption capacity data was extracted from Langmuir or Freundlich isotherm fitting, as reported in the respective studies. This comparative evaluation was performed to benchmark the performance of our synthesized biochar against conventional and advanced adsorbents. In this study, we have synthesized high-temperature (800 °C) KOH pretreated biochar, the result demonstrates that the adsorption performance of the synthesized adsorbent is comparable to range of alternatives previously reported in the literature.

3.7. Regeneration Study and Effect of Co-Existing Ions

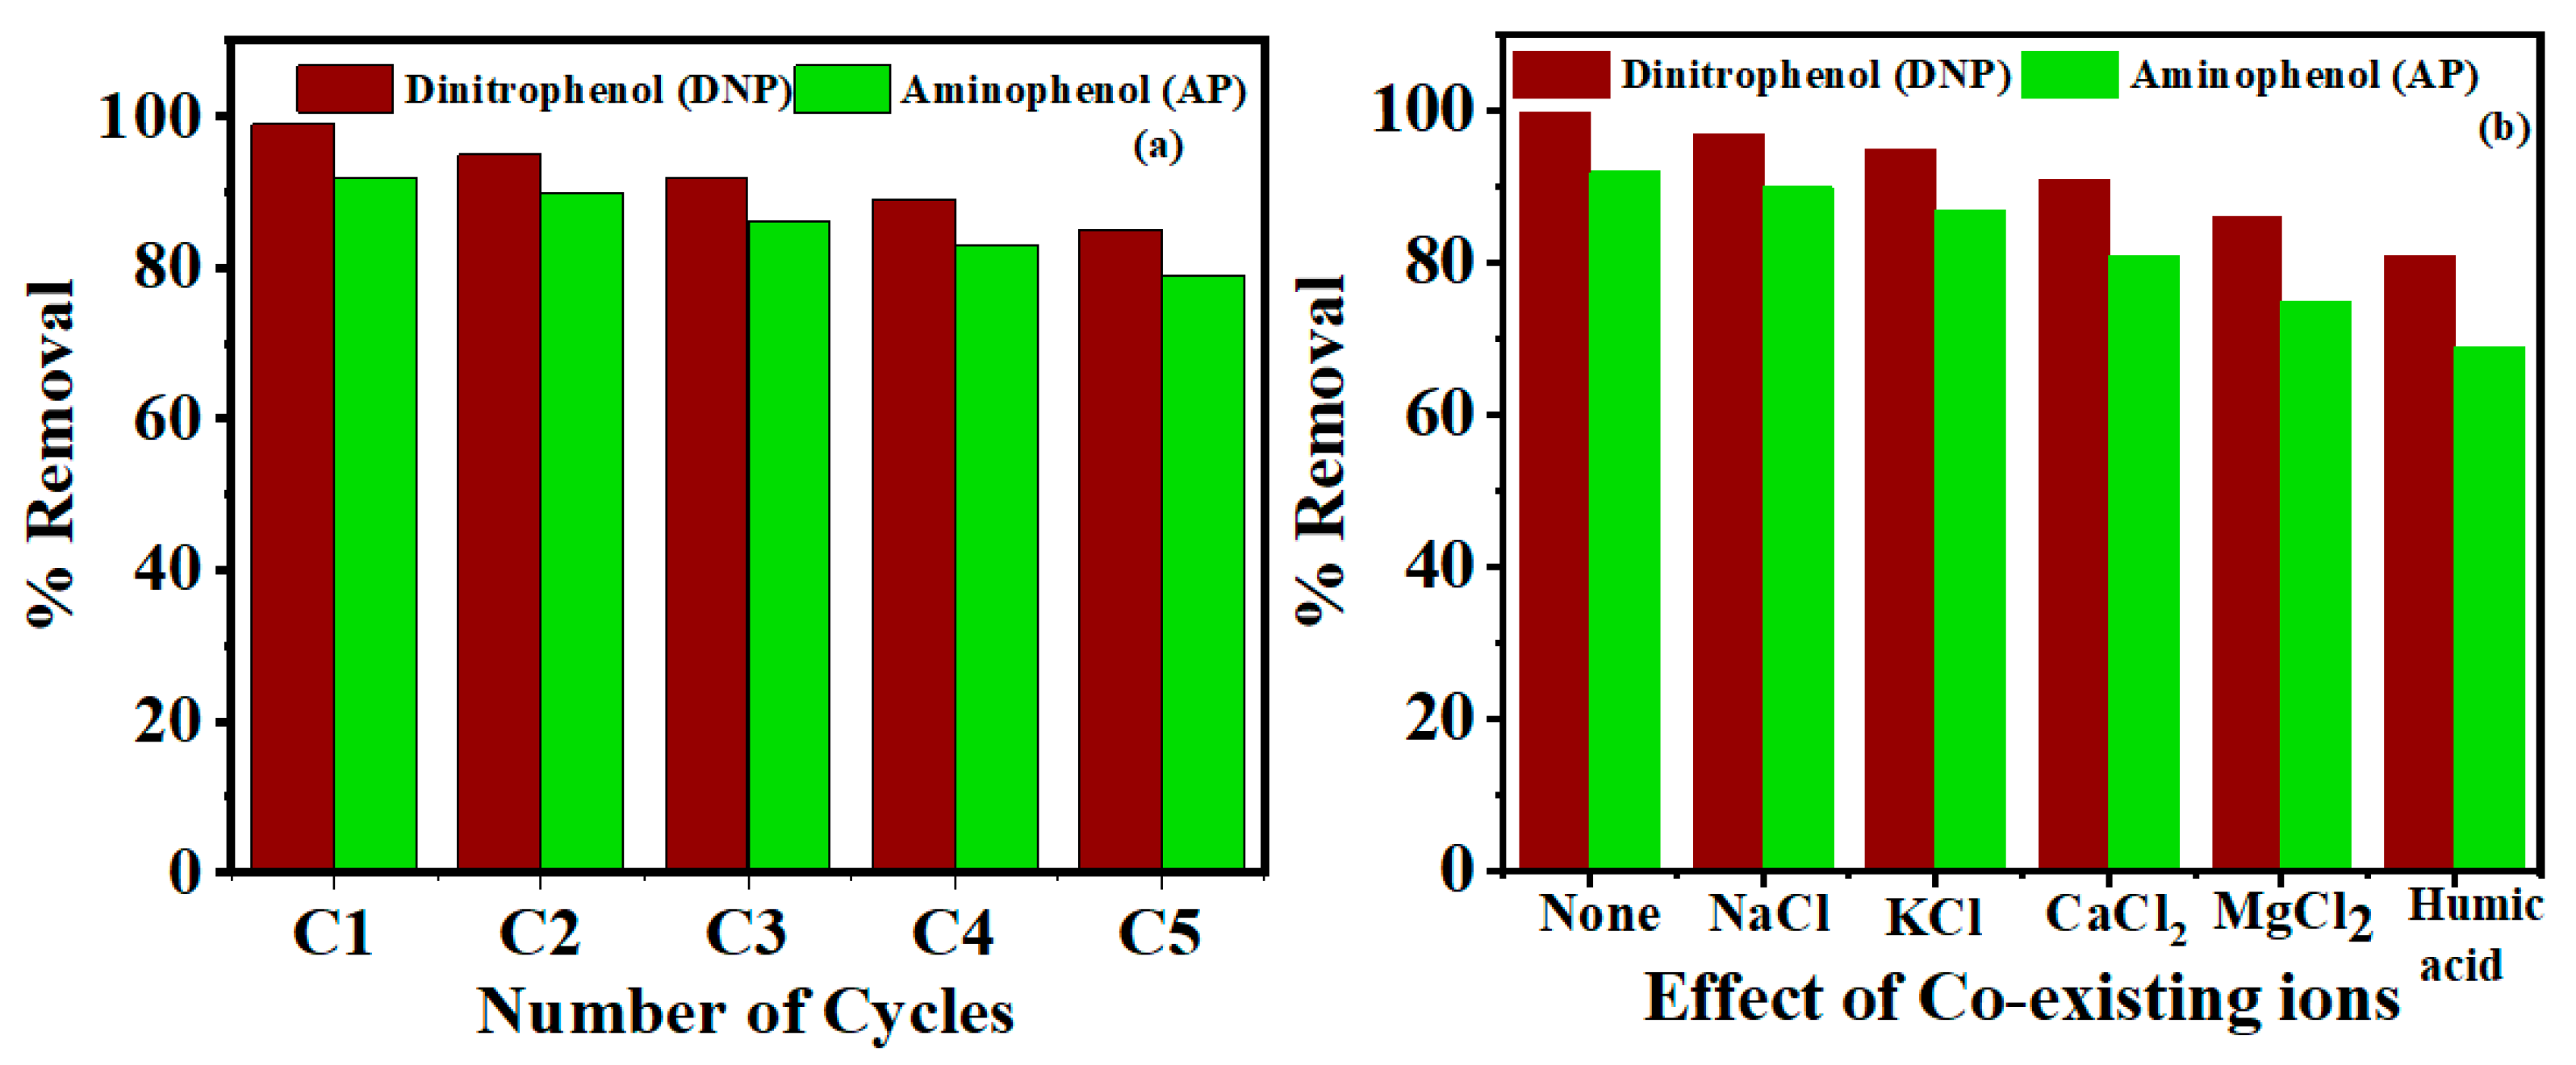
The regeneration of the biochar adsorbent was performed by desorbing the phenol molecules using 0.1 M NaOH since phenolic compounds react with NaOH and form sodium phenoxide. The formed sodium phenoxide is highly soluble in water and goes with the filtrate while phenolic-free biochar is recovered as the filter residue. The phenolic-free biochar is then dried and reused for another DNP or AP adsorption. The adsorption-desorption process was repeated for five cycles. From Figure 7a, the adsorption efficiency of the regenerated biochar following five adsorption cycles is 85% for DNP and 81% for AP. After five cycles, all the adsorbent sites are occupied by phenolic molecules.
Figure 7b shows the effect of co-existing ions on the adsorption of phenolic molecules from water. Organic and inorganic molecules commonly existed in wastewater alongside phenolic compounds. From Figure 7b, divalent cations have more pronounced effects in decreasing the phenolic efficiency, since their hydrated molecules are bigger than monovalent cations. However, the humic acid has a greater inhibition effect then inorganic salt because humic acid contains multiple aromatic rings, phenolic -OH, and a carboxylic -COOH group. These functionals bind strongly to adsorbents through π-π interaction, hydrogen bonding and electrostatic attraction and can block multiple adsorption sites, unlike small inorganic ions.

4. Conclusions

In this work, high-temperature KOH-pretreated biochar was synthesised from orange peel at a carbonisation temperature of 800 °C. The synthesised adsorbents were used for the adsorption of 2,4-dinitrophenol (DNP) and aminophenol (AP) from aqueous solution. The effect of adsorption parameters such as initial concentration, contact time and adsorbent dosage were studied at an optimised pH of 4 for DNP and pH of 7 for AP. The biochar adsorbent reported a maximum removal efficiency of 99% for DNP and 92% for AP at an initial concentration of 50 ppm, an adsorbent dosage of 0.6 g/L, and a contact time of 60 min. The biochar shows a porous morphology and a BET specific surface area of 965 m2/g. The Langmuir isotherm shows the best fit, with a correlation coefficient of 0.99 and the adsorption capacity observed to be 366 mg/g for DNP and 341 mg/g for AP.
Importantly, DFT calculations prove to be highly useful in elucidating the adsorption mechanism at molecular level. The calculated relative adsorption energy (−0.54 eV for DNP and −0.27 eV for AP) confirmed the stronger interaction of DNP with the biochar surface, which is consistent with the experimental adsorption capacities.
The prospects of this study include scaling up the synthesis process, regeneration and reusability investigations, real wastewater application studies, and further computational modelling to tailor surface functionalities to selective adsorption.

Supplementary Materials

The following supporting information can be downloaded at: https://www.mdpi.com/article/10.3390/en19061407/s1, Figure S1: Synthesis process of orange peel biochar for the adsorption of 2,4-dinitrophenol and aminophenol; Figure S2: UV-visible spectra for the adsorption of 2,4-dinitrophenol and aminophenol from water; Figure S3: X-ray photoelectron spectra (a) survey scan (b) N1s before and after adsorption of dinitrophenol and aminophenol from water; Table S1: Electronic properties of biochar, 2,4-dinitrophenol and aminophenol molecules before and after adsorption process.

Author Contributions

Conceptualisation, L.K., I.G.H. and K.S.; Methodology, L.K. and I.G.H.; Validation, I.G.H. and K.S.; Formal analysis, A.V.T. and V.E.; Resources, K.S.; Writing—original draft preparation; L.K.; Writing—review and editing, L.K. and I.G.H.; Visualisation, I.G.H. and K.S.; Supervision, I.G.H. and K.S.; Project administration, K.S. All authors have read and agreed to the published version of the manuscript.

Funding

This research received no external funding.

Data Availability Statement

The original data generated in this study have been included in the article and accompanying Supplementary Materials; further inquiries can be directed to the corresponding author.

Acknowledgments

The first author acknowledges the research support received from RMIT University, Australia. The first author extends thanks to Sachin Yadav for DFT analysis. Appreciation is also expressed to the RMIT Microscopy and Microanalysis Facility team at RMIT University, Australia for their assistance with scanning electron microscopy and X-ray photoelectron spectroscopy analysis of the biochar samples.

Conflicts of Interest

The authors declare no conflicts of interest.

References

  1. Huang, T.; Zhou, R.; Cui, J.; Zhang, J.; Tang, X.; Chen, S.; Feng, J.; Liu, H. Fast and Cost-Effective Preparation of Antimicrobial Zinc Oxide Embedded in Activated Carbon Composite for Water Purification Applications. Mater. Chem. Phys. 2018, 206, 124–129. [Google Scholar] [CrossRef] [Scilit]
  2. Walia, S.; Kaur, M.; Kansal, S.K. Adsorptive Removal of 2,4-Dinitrophenol from Aqueous Phase Using Amine Functionalized Metal Organic Framework (NH2-MIL-101(Cr)). Mater. Chem. Phys. 2022, 289, 126493. [Google Scholar] [CrossRef] [Scilit]
  3. Kumar, L.; Hakeem, I.G.; Varathan, E.; Shah, K. Adsorption of Phenol from Aqueous Solution Using Activated Char Synthesized by One-Step and Two-Step KOH Activation and Pyrolysis of Orange Peel. Water Air Soil Pollut. 2025, 236, 803. [Google Scholar] [CrossRef]
  4. Patil, P.; Jeppu, G.; Vallabha, M.S.; Girish, C.R. Enhanced Adsorption of Phenolic Compounds Using Biomass-Derived High Surface Area Activated Carbon: Isotherms, Kinetics and Thermodynamics. Environ. Sci. Pollut. Res. 2024, 31, 67442–67460. [Google Scholar] [CrossRef] [Scilit]
  5. Heidarinejad, Z.; Dehghani, M.H.; Heidari, M.; Javedan, G.; Ali, I.; Sillanpää, M. Methods for Preparation and Activation of Activated Carbon: A Review. Environ. Chem. Lett. 2020, 18, 393–415. [Google Scholar] [CrossRef] [Scilit]
  6. Liu, L.; Feng, B.; Rao, Y.Z.; Tian, C.S.; Gu, Q.X.; Huang, T. Development of Efficient Biochar Produced from Orange Peel for Effective La(III) and Y(III) Adsorption. Adsorpt. Sci. Technol. 2023, 2023, 5519783. [Google Scholar] [CrossRef] [Scilit]
  7. Darla, U.R.; Lataye, D.H.; Kumar, A.; Pandit, B.; Ubaidullah, M. Adsorption of Phenol Using Adsorbent Derived from Saccharum officinarum Biomass: Optimization, Isotherms, Kinetics, and Thermodynamic Study. Sci. Rep. 2023, 13, 18356. [Google Scholar] [CrossRef] [Scilit]
  8. Zhang, R.; Zhou, D.; Yi, K.; Xu, S.; Su, L.; Liu, J.; Li, L.; Yu, F. One-Step Carbonization-Activation Synthesis of Pomelo Peel Derived N, O-Doped Porous Carbon for Enhanced Supercapacitve Performance. Diam. Relat. Mater. 2025, 155, 112276. [Google Scholar] [CrossRef] [Scilit]
  9. Zhao, Y.; Mu, J.; Wang, Y.; Liu, Y.; Wang, H.; Song, H. Preparation of Hierarchical Porous Carbon through One-Step KOH Activation of Coconut Shell Biomass for High-Performance Supercapacitor. J. Mater. Sci. Mater. Electron. 2023, 34, 527. [Google Scholar] [CrossRef] [Scilit]
  10. Lv, X.; Zhao, S.; Ning, Z.; Zeng, H.; Shu, Y.; Tao, O.; Xiao, C.; Lu, C.; Liu, Y. Citrus Fruits as a Treasure Trove of Active Natural Metabolites That Potentially Provide Benefits for Human Health. Chem. Cent. J. 2015, 9, 68. [Google Scholar] [CrossRef] [Scilit] [PubMed]
  11. Kukowska, S.; Nowicki, P.; Szewczuk-Karpisz, K. Valorization of Orange Peels through the Production of Eco-Friendly, Highly Effective Adsorbents for Herbicides Based on One-Step CO2-Activation under Conventional/Microwave Heating. Food Bioprod. Process. 2025, 153, 145–160. [Google Scholar] [CrossRef] [Scilit]
  12. Marín, F.R.; Soler-Rivas, C.; Benavente-García, O.; Castillo, J.; Pérez-Alvarez, J.A. By-Products from Different Citrus Processes as a Source of Customized Functional Fibres. Food Chem. 2007, 100, 736–741. [Google Scholar] [CrossRef] [Scilit]
  13. Zema, D.A.; Calabrò, P.S.; Folino, A.; Tamburino, V.; Zappia, G.; Zimbone, S.M. Valorisation of Citrus Processing Waste: A Review. Waste Manag. 2018, 80, 252–273. [Google Scholar] [CrossRef] [Scilit]
  14. de la Torre, I.; Ladero, M.; Santos, V.E. Production of D-Lactic Acid by Lactobacillus delbrueckii ssp. delbrueckii from Orange Peel Waste: Techno-Economical Assessment of Nitrogen Sources. Appl. Microbiol. Biotechnol. 2018, 102, 10511–10521. [Google Scholar] [CrossRef] [Scilit]
  15. Ioannidou, S.M.; Pateraki, C.; Ladakis, D.; Papapostolou, H.; Tsakona, M.; Vlysidis, A.; Kookos, I.K.; Koutinas, A. Sustainable Production of Bio-Based Chemicals and Polymers via Integrated Biomass Refining and Bioprocessing in a Circular Bioeconomy Context. Bioresour. Technol. 2020, 307, 123093. [Google Scholar] [CrossRef] [Scilit] [PubMed]
  16. Kalengyo, R.B.; Ibrahim, M.G.; Fujii, M.; Nasr, M. Utilizing Orange Peel Waste Biomass in Textile Wastewater Treatment and Its Recyclability for Dual Biogas and Biochar Production: A Techno-Economic Sustainable Approach. Biomass Convers. Biorefin. 2024, 14, 19875–19888. [Google Scholar] [CrossRef] [Scilit]
  17. Lingamdinne, L.P.; Angaru, G.K.R.; Pal, C.A.; Koduru, J.R.; Karri, R.R.; Mubarak, N.M.; Chang, Y.Y. Insights into Kinetics, Thermodynamics, and Mechanisms of Chemically Activated Sunflower Stem Biochar for Removal of Phenol and Bisphenol-A from Wastewater. Sci. Rep. 2024, 14, 4267. [Google Scholar] [CrossRef] [Scilit] [PubMed]
  18. Kumar, L.; Yadav, V.; Yadav, M.; Saini, N.; Jagannathan, K.; Murugesan, V.; Ezhilselvi, V. Systematic Studies on the Effect of Structural Modification of Orange Peel for Remediation of Phenol Contaminated Water. Water Environ. Res. 2023, 95, e10872. [Google Scholar] [CrossRef] [Scilit] [PubMed]
  19. Duwiejuah, A.B.; Payne, J.; Yahaya, D. Adsorption of Toxic Metals from Landfill Leachate Using Orange and Banana Peel Powders as Adsorbents. Sustain. Environ. 2024, 10, 2405295. [Google Scholar] [CrossRef] [Scilit]
  20. Yu, H.; Zhang, Y.; Wang, L.; Tuo, Y.; Yan, S.; Ma, J.; Zhang, X.; Shen, Y.; Guo, H.; Han, L. Experimental and DFT Insights into the Adsorption Mechanism of Methylene Blue by Alkali-Modified Corn Straw Biochar. RSC Adv. 2024, 14, 1854–1865. [Google Scholar] [CrossRef] [Scilit]
  21. Liu, Z.; Sun, Y.; Xu, X.; Meng, X.; Qu, J.; Wang, Z.; Liu, C.; Qu, B. Preparation, Characterization and Application of Activated Carbon from Corn Cob by KOH Activation for Removal of Hg(II) from Aqueous Solution. Bioresour. Technol. 2020, 306, 123154. [Google Scholar] [CrossRef] [Scilit]
  22. Shen, Y. Rice Husk-Derived Activated Carbons for Adsorption of Phenolic Compounds in Water. Glob. Chall. 2018, 2, 1800043. [Google Scholar] [CrossRef] [Scilit]
  23. Sevilla, M.; Ferrero, G.A.; Fuertes, A.B. One-Pot Synthesis of Biomass-Based Hierarchical Porous Carbons with a Large Porosity Development. Chem. Mater. 2017, 29, 6900–6907. [Google Scholar] [CrossRef] [Scilit]
  24. Yang, F.; Sun, L.; Zhang, W.; Zhang, Y. One-Pot Synthesis of Porous Carbon Foam Derived from Corn Straw: Atrazine Adsorption Equilibrium and Kinetics. Environ. Sci. Nano 2017, 4, 625–635. [Google Scholar] [CrossRef] [Scilit]
  25. Kumar, L.; Hakeem, I.G.; Yadav, M.; Shah, K.; Ezhilselvi, V. Adsorption of Aminophenol from Aqueous Solution Using KOH Pretreated Biochar Derived from Orange Peel Pyrolysis: Optimization, Kinetics, and Isotherm Study. Environ. Process. 2025, 12, 36. [Google Scholar] [CrossRef] [Scilit]
  26. Keiluweit, M.; Nico, P.S.; Johnson, M.; Kleber, M. Dynamic Molecular Structure of Plant Biomass-Derived Black Carbon (Biochar). Environ. Sci. Technol. 2010, 44, 1247–1253. [Google Scholar] [CrossRef] [Scilit] [PubMed]
  27. Ahmad, M.; Rajapaksha, A.U.; Lim, J.E.; Zhang, M.; Bolan, N.; Mohan, D.; Vithanage, M.; Lee, S.S.; Ok, Y.S. Biochar as a Sorbent for Contaminant Management in Soil and Water: A Review. Chemosphere 2014, 99, 19–33. [Google Scholar] [CrossRef] [Scilit] [PubMed]
  28. Uddin, M.N.; Uzzaman, M.; Das, S.; Al-Amin, M.; Haque Mijan, M.N. Stress Degradation, Structural Optimization, Molecular Docking, ADMET Analysis of Tiemonium Methylsulphate and Its Degradation Products. J. Taibah Univ. Sci. 2020, 14, 1134–1146. [Google Scholar] [CrossRef] [Scilit]
  29. Laporte, J.; Garcia Vidal, C.; Belayet Hossain, F.J.; Moniruzzaman, B.A.; Mohammed Jabedul Hoque, T.D.; Mancho, N.; Jordi Carratalà, A.A. Molecular Docking, Pharmacokinetic, and DFT Calculation of Naproxen and Its Degradants. Biomed. J. Sci. Tech. Res. 2018, 9, 7360–7365. [Google Scholar] [CrossRef] [Scilit]
  30. Grich, A.; Bouzid, T.; Naboulsi, A.; Regti, A.; El Himri, M.; El Haddad, M. Synthesis and Optimization of Activated Carbon from Doum (Chamaerops humilis) Fiber via Pyrolysis-Assisted H3PO4 Activation for Removal of Bisphenol A and α-Naphthol. Diam. Relat. Mater. 2024, 145, 111061. [Google Scholar] [CrossRef] [Scilit]
  31. Liu, S.; Wang, J.; Huang, W.; Tan, X.; Dong, H.; Goodman, B.A.; Du, H.; Lei, F.; Diao, K. Adsorption of Phenolic Compounds from Water by a Novel Ethylenediamine Rosin-Based Resin: Interaction Models and Adsorption Mechanisms. Chemosphere 2019, 214, 821–829. [Google Scholar] [CrossRef] [Scilit] [PubMed]
  32. Khachay, A.; Yous, R.; Khalladi, R.; Cherifi, H.; Belaid, B.; Alharthi, M.N.; Salvestrini, S.; Mouni, L. Understanding the Adsorption Mechanism of Phenol and Para-Chlorophenol onto Sepiolite Clay: A Combined DFT Calculations, Molecular Dynamics Simulations, and Isotherm Analysis. Water 2025, 17, 1335. [Google Scholar] [CrossRef] [Scilit]
  33. Alshabib, M.; Oluwadamilare, M.A.; Tanimu, A.; Abdulazeez, I.; Alhooshani, K.; Ganiyu, S.A. Experimental and DFT Investigation of Ceria-Nanocomposite Decorated AC Derived from Groundnut Shell for Efficient Removal of Methylene-Blue from Wastewater Effluent. Appl. Surf. Sci. 2021, 536, 147749. [Google Scholar] [CrossRef] [Scilit]
  34. Hou, Z.; Lin, X.; Wu, K.; Chi, H.; Zhang, W.; Ma, L.; Xi, Y. A Density Functional Theory Study on the Adsorption of Different Organic Sulfides on Boron Nitride Nanosheet. RSC Adv. 2023, 13, 31622–31631. [Google Scholar] [CrossRef] [Scilit] [PubMed]
  35. Oyehan, T.A.; Azeez, M.O.; Abdulazeez, I.; Yusuf, B.O.; Ganiyu, S.A.; Jamiu, Z.A.; Usman, M. Experimental and DFT Investigation of Phenol Adsorption onto Cobalt Nanoparticles-Modified Porous Carbon. Arab. J. Sci. Eng. 2024, 49, 547–563. [Google Scholar] [CrossRef] [Scilit]
  36. Rabichi, I.; Sekkouri, C.; Yaacoubi, F.E.; Ennaciri, K.; Izghri, Z.; Bouzid, T.; El Fels, L.; Baçaoui, A.; Yaacoubi, A. Experimental and Theoretical Investigation of Olive Mill Solid Waste Biochar for Vanillic Acid Adsorption Using DFT/B3LYP Analysis. Water Air Soil Pollut. 2024, 235, 369. [Google Scholar] [CrossRef] [Scilit]
  37. Kumar, N.S.; Shaikh, H.M.; Asif, M.; Al-Ghurabi, E.H. Engineered Biochar from Wood Apple Shell Waste for High-Efficient Removal of Toxic Phenolic Compounds in Wastewater. Sci. Rep. 2021, 11, 2586. [Google Scholar] [CrossRef] [Scilit]
  38. Unpinit, T.; Poblarp, T.; Sailoon, N.; Wongwicha, P.; Thabuot, M. Fuel Properties of Bio-Pellets Produced from Selected Materials under Various Compacting Pressure. Energy Procedia 2015, 79, 657–662. [Google Scholar] [CrossRef] [Scilit]
  39. Chilla, V.; Suranani, S. Thermogravimetric and Kinetic Analysis of Orange Peel Using Isoconversional Methods. Mater. Today Proc. 2023, 72, 104–109. [Google Scholar] [CrossRef] [Scilit]
  40. Haldar, D.; Purkait, M.K. Thermochemical Pretreatment Enhanced Bioconversion of Elephant Grass (Pennisetum purpureum): Insight on the Production of Sugars and Lignin. Biomass Convers. Biorefin. 2022, 12, 1125–1138. [Google Scholar] [CrossRef] [Scilit]
  41. Su, X.; Wang, X.; Ge, Z.; Bao, Z.; Lin, L.; Chen, Y.; Dai, W.; Sun, Y.; Yuan, H.; Yang, W.; et al. Koh-Activated Biochar and Chitosan Composites for Efficient Adsorption of Industrial Dye Pollutants. Chem. Eng. J. 2024, 486, 150387. [Google Scholar] [CrossRef] [Scilit]
  42. Hua, B.Y.; Wei, H.L.; Hu, C.W.; Zhang, Y.Q.; Yang, S.; Wang, G.; Shen, Y.M.; Li, J.J. Preparation of PH/Temperature-Sensitive Semi-Interpenetrating Network Hydrogel Adsorbents from Sodium Alginate via Photopolymerization for Removing Methylene Blue. Int. J. Environ. Sci. Technol. 2024, 21, 227–244. [Google Scholar] [CrossRef] [Scilit]
  43. Yazid, H.; Bouzid, T.; El Himri, M.; Regti, A.; El Haddad, M. Bisphenol A (BPA) Remediation Using Walnut Shell as Activated Carbon Employing Experimental Design for Parameter Optimization and Theoretical Study to Establish the Adsorption Mechanism. Inorg. Chem. Commun. 2024, 161, 112064. [Google Scholar] [CrossRef] [Scilit]
  44. Biswas, K.; Mandal, S.K. Sustainable Adsorptive Removal of 2,4-Dinitrophenol from Aqueous Media via a Reusable Chitosan-Based Bionanocomposite Sheet Embedded with Silver Nanoparticles. J. Environ. Manag. 2026, 399, 128605. [Google Scholar] [CrossRef] [Scilit]
  45. Gubitosa, J.; Rizzi, V.; Fini, P.; Nuzzo, S.; Cosma, P. The Adsorption Efficiency of Regenerable Chitosan-TiO2 Composite Films in Removing 2,4-Dinitrophenol from Water. Int. J. Mol. Sci. 2023, 24, 8552. [Google Scholar] [CrossRef] [Scilit]
  46. Mishra, P.; Singh, K.; Dixit, U.; Agarwal, A.; Ahmad Bhat, R. Effective Removal of 4-Aminophenol from Aqueous Environment by Pea (Pisum sativum) Shells Activated with Sulfuric Acid: Characterization, Isotherm, Kinetics and Thermodynamics. J. Indian Chem. Soc. 2022, 99, 100528. [Google Scholar] [CrossRef] [Scilit]
  47. El-Shafie, A.S.; Ahsan, I.; Radhwani, M.; Al-Khangi, M.A.; El-Azazy, M. Synthesis and Application of Cobalt Oxide (Co3O4)-Impregnated Olive Stones Biochar for the Removal of Rifampicin and Tigecycline: Multivariate Controlled Performance. Nanomaterials 2022, 12, 379. [Google Scholar] [CrossRef] [Scilit]
  48. Mercurio, M.; Olusegun, S.J.; Malińska, K.; Wystalska, K.; Sobik-Szołtysek, J.; Dąbrowska, A.; Krysiński, P.; Osial, M. Removal of Tetracycline and Rhodamine from Aqueous Systems by Pristine Biochar Derived from Poultry Manure. Desalination Water Treat. 2023, 288, 72–86. [Google Scholar] [CrossRef] [Scilit]
  49. Carvajal-Bernal, A.M.; Gómez, F.; Giraldo, L.; Moreno-Piraján, J.C. Adsorption of Phenol and 2,4-Dinitrophenol on Activated Carbons with Surface Modifications. Microporous Mesoporous Mater. 2015, 209, 150–156. [Google Scholar] [CrossRef] [Scilit]
  50. Supong, A.; Bhomick, P.C.; Karmaker, R.; Ezung, S.L.; Jamir, L.; Sinha, U.B.; Sinha, D. Experimental and Theoretical Insight into the Adsorption of Phenol and 2,4-Dinitrophenol onto Tithonia Diversifolia Activated Carbon. Appl. Surf. Sci. 2020, 529, 147046. [Google Scholar] [CrossRef] [Scilit]
  51. Anoop Krishnan, K.; Sini Suresh, S.; Arya, S.; Sreejalekshmi, K.G. Adsorptive Removal of 2,4-Dinitrophenol Using Active Carbon: Kinetic and Equilibrium Modeling at Solid–Liquid Interface. Desalination Water Treat. 2015, 54, 1850–1861. [Google Scholar] [CrossRef] [Scilit]
  52. Azari, A.; Yeganeh, M.; Gholami, M.; Salari, M. The Superior Adsorption Capacity of 2,4-Dinitrophenol under Ultrasound-Assisted Magnetic Adsorption System: Modeling and Process Optimization by Central Composite Design. J. Hazard. Mater. 2021, 418, 126348. [Google Scholar] [CrossRef] [Scilit] [PubMed]
  53. Mafo, S.G.M.; Tchuifon, D.R.T.; Djioko, F.H.K.; Kouteu, P.A.N.; Fotsop, C.G.; Dongmo, S.D.M.; Doungmo, G.; Ndifor-Angwafor, N.G. Unravelling the Efficiency Removal of 2,4-Dinitrophenol on Coconut Shell Biomass-Derived Activated Carbons Theoretical and Experimental Investigation. Biomass Convers. Biorefin. 2025, 15, 8821–8841. [Google Scholar] [CrossRef] [Scilit]
  54. Gopal, K.; Mohd, N.I.; Raoov, M.; Suah, F.B.M.; Yahaya, N.; Zain, N.N.M. Development of a New Efficient and Economical Magnetic Sorbent Silicone Surfactant-Based Activated Carbon for the Removal of Chloro-and Nitro-Group Phenolic Compounds from Contaminated Water Samples. RSC Adv. 2019, 9, 36915–36930. [Google Scholar] [CrossRef] [Scilit] [PubMed]
  55. Gupta, V.K.; Dinesh Mohan, S.; Suhas; Singh, K.P. Removal of 2-Aminophenol Using Novel Adsorbents. Ind. Eng. Chem. Res. 2006, 45, 1113–1122. [Google Scholar] [CrossRef] [Scilit]
Figure 1. (a) SEM image of biochar, (b) FTIR spectra before and after adsorption, (c) N2 adsorption–desorption isotherm, (d) TGA biochar raw biomass and biochar.
Energies 19 01407 g001
Figure 2. XPS spectra: (a) deconvoluted C1s, (b) O1s before and after adsorption of dinitrophenol and aminophenol over biochar surface.
Energies 19 01407 g002
Figure 3. Molecular orbital distributions of dinitrophenol and aminophenol and their adsorption with biochar.
Energies 19 01407 g003
Figure 4. Energy profile diagram for biochar dinitrophenol (DNP) and aminophenol (AP) complex showing a reduction in energy level of biochar and DNP/AP component after adsorption interaction.
Energies 19 01407 g004
Figure 5. Batch adsorption study on the effect of (a) phenol solution pH (concentration = 50 mg/L, contact time = 60 min, adsorbent dosage = 0.6 mg/L), (b) initial phenol concentration (pH = 4 and 7, contact time = 60 min, adsorbent dosage = 0.6 mg/L) (c) contact time (pH = 7, concentration = 50 mg/L, adsorbent dosage = 0.6 mg/L) (d) adsorbent dosage (pH = 7, concentration = 50 mg/L, contact time = 60 min) for the adsorption of DNP and AP). The optimised adsorption conditions were found to be pH 4 (DNP), pH 7 (AP), adsorbent dosage 0.6 g/L, contact time 60 min, and initial concentration 50 mg/L.
Energies 19 01407 g005
Figure 6. (a) Isotherm and (b) kinetic study for DNP and AP adsorption over biochar surface (conditions: pH = 4 for DNP), pH = 7 for AP, initial concentration = 50 mg/L, contact time = 60 min, adsorbent dosage = 0.6 g/L).
Energies 19 01407 g006
Figure 7. (a) Regeneration of biochar adsorbent and adsorption cyclic studies, (b) Effect of co-existing ions on the adsorption of dinitrophenol and aminophenol from water (conditions: pH = 4 for dinitrophenol, pH = 7 for aminophenol, initial concentration = 50 mg/L, contact time = 60 min, adsorbent dosage = 0.6 g/L).
Energies 19 01407 g007
Table 1. Isotherm model parameters for dinitrophenol and aminophenol adsorption over KOH-pretreated biochar.
IsothermsParameterDinitrophenolAminophenol
LangmuirR20.970.98
Chi-square (ꭓ2)748.16276.23
q (mg/g)366.43341.64
K (L/mg)0.210.04
FreundlichR20.950.90
Chi-square (ꭓ2)1223.09246.09
K (mg/g) (mg/L)1/n126.461443
DRq339282.04
R20.830.61
Chi-square (ꭓ2)3641353
E (kJ/mol)1.030.80
Table 2. Kinetic model parameters for dinitrophenol and aminophenol adsorption over biochar surface.
Kinetic ModelParametersDinitrophenol (DNP)Aminophenol (AP)
Pseudo-first-orderq (mg/g)398376.58
K1 (min)−10.430.44
Radj20.990.99
Chi-square (ꭓ2)1.181.97
Pseudo-second-orderq (mg/g)400378.30
K2 (g/mg min)0.0130.01
Radj20.990.99
Chi-square (ꭓ2)0.130.47
Table 3. Comparative assessment of various adsorbents for the adsorption of dinitrophenol and aminophenol from aqueous solution.
ContaminantsAdsorbentMaximum Adsorption Capacity (mg/g)pHIsothermRegeneration CyclesRef.
DinitrophenolGranular activated carbon299.93Langmuir [49]
Pelletized activated carbon203
Tithonia diverse folia-activated carbon42.66Langmuir5[50]
Rubber wood-activated carbon96.94.0Langmuir4[51]
Graphene oxide-Fe3O4 425.64.45Freundlich10[52]
Coconut shell14.92–3 [53]
Chitosan-based TiO2 film9004.5 10[45]
Fe3O4-activated carbon434Freundlich5[54]
KOH-pretreated biochar3634Langmuir5This study
AminophenolPea shell-activated carbon1067Langmuir [46]
Activated carbon 80.76.8Langmuir6[55]
Activated slag28.4
KOH-pretreated biochar3597Langmuir5This study
Disclaimer/Publisher’s Note: The statements, opinions and data contained in all publications are solely those of the individual author(s) and contributor(s) and not of MDPI and/or the editor(s). MDPI and/or the editor(s) disclaim responsibility for any injury to people or property resulting from any ideas, methods, instructions or products referred to in the content.