Article

Short-Term and Annual Variability of Continuously Monitored Biogas Yield from Sewage Sludge at a Wastewater Treatment Plant


1
Institute of Technology and Life Sciences—National Research Institute, Hrabska 3, Falenty, 05-090 Raszyn, Poland
2
Department of Water Supply, Sewerage and Environmental Monitoring, Faculty of Environmental Engineering and Energy, Cracow University of Technology, Warszawska 24, 31-155 Cracow, Poland
3
Department of Soil Science and Agrophysics, University of Agriculture in Krakow, Al. Mickiewicza 21, 31-120 Kraków, Poland
4
Department of Space Management and Social-Economic Geography, Krakow University of Economics, Rakowicka 27, 31-510 Cracow, Poland
5
Department of Natural Gas Engineering, Faculty of Drilling, Oil and Gas, AGH University of Science and Technology, Mickiewicza 30, 30-059 Cracow, Poland
*
Author to whom correspondence should be addressed.
Energies 2026, 19(5), 1377; https://doi.org/10.3390/en19051377
Submission received: 29 January 2026 / Revised: 23 February 2026 / Accepted: 6 March 2026 / Published: 9 March 2026

Abstract

Wastewater treatment plants increasingly rely on anaerobic digestion and biogas utilization to reduce operational costs, enhance energy self-sufficiency, and support circular-economy objectives. This study provides a comprehensive, year-round assessment of sludge production, sludge characteristics relevant to digestion, biogas generation, and energy performance at a municipal wastewater treatment plant. The plant generated on average 68.0 m3/d of thickened primary sludge and 24.0 m3/d of excessive sludge (total 92 m3/d), with low daily variability throughout the year. Biogas production remained highly stable, with an annual average of approximately 1300 m3/d and limited daily variation. Although monthly averages ranged from 1004 to 1728 m3/d, within-month variability was low to moderate, indicating that digestion processes responded consistently to changes in sludge quantity and composition. The weak correlation between sludge volume and biogas output (r = 0.29) showed that, besides sludge quantity, factors such as organic content and digester operating conditions also influence biogas yield. Energy performance indicators demonstrated strong self-sufficiency potential: the facility produced 1,095,047 kWh of electricity, covering 56.72% of its annual demand. The high coefficient of determination for self-sufficiency (R2 = 0.871) confirmed a strong linear relationship between biogas-derived energy production and reduced grid dependence. Operational correlations further highlighted system coherence, with cogenerator and boiler usage strongly inversely related (r = −0.85) and biogas production positively associated with heat output (r = 0.66). Overall, the results demonstrate a stable and efficient sludge-to-energy system and provide a detailed dataset supporting future optimization of anaerobic digestion processes.

1. Introduction

Biomethane is an alternative to natural gas, offering environmental and economic benefits. Its market in the EU is growing, but its current share is still small. To expand, a supportive legal framework and clear incentives are needed to improve energy security and meet climate goals [1]. Biogas is a competitive, viable, and sustainable energy resource with a wide range of applications in heating, power generation, fuel production, and the creation of sustainable chemicals. The global biogas-based electricity generation capacity grew from 65 GW in 2010 to 120 GW in 2019, marking a 90% increase [2]. Biogas consists primarily of methane and carbon dioxide, with trace amounts of other gases, such as hydrogen sulfide, nitrogen, oxygen, ammonia, and water vapor. The exact composition of biogas can vary depending on the feedstock used, the anaerobic digestion (AD) process conditions, and the microbial communities involved [3]. Biogas from sewage sludge plays a crucial role in sewage treatment and renewable energy production. Pretreatment methods improve anaerobic digestion by enhancing sludge breakdown and methane production [4]. Sewage sludge, processed through co-digestion, comes from a well-controlled wastewater treatment process, ensuring the stability and predictability of the feedstock quality, compared to waste from landfills or agricultural sources, which may contain varying amounts of contaminants [5]. Heavy metals in sewage sludge pose environmental concerns, but energy recovery methods such as pyrolysis, gasification, and incineration help reduce sludge volume and generate valuable energy. Pyrolysis is particularly notable for producing low emissions, minimal waste, and bio-residues that can be used as CO2 adsorbents. Proper management of heavy metals is crucial to prevent further environmental impact during energy recovery processes [6].
Anaerobic digestion of beverage sewage sludge can produce biogas and methane for electricity generation. The highest biogas production (15.4 m3/g VS) and methane production (6.3 m3/g VS) occurred at 35 °C, a pH of 8.5, and a 1:3 organic ratio. At room temperature, biogas production increased to 67.3 m3/g vs. after 48 days. The energy potential was 22.1 kWh at room temperature and 18.9 kWh at 35 °C [7]. Biogas recovery from wastewater treatment plants (WWTPs) offers a valuable method for improving energy self-sufficiency and reducing costs, with co-digestion and pre-treatment techniques being the most effective strategies. However, these methods require careful management of operational costs and waste disposal to be cost-effective in the long term. Electricity generation from anaerobic digestion (AD) of sewage sludge traditionally operates as baseload power, but increasing flexibility in this process presents an opportunity to enhance its value [8]. Biogas production from sewage sludge involves costs for constructing anaerobic digesters, energy for processing, and system maintenance. A study at WWTPs in Brazil showed that despite generation of 1014.46 kWh/year of electricity, the economic feasibility was negative, with a Net Present Value (NPV) of −USD 226,255.28 and a Levelized Cost of Electricity (LCOE) of USD 1.40/kWh, indicating that it is currently not economically viable without subsidies or cost-reduction improvements [9]. Having pre-fermented sludge allows us to utilize its potential for energy production. When evaluating the energy potential of WWTPs, it is often necessary to conduct a monthly energy balance [10,11,12]. Additionally, the sludge’s quality composition should be assessed [13,14].
Different studies report the amount of sewage sludge in raw materials and after treatment [15]. It is important to perform not only a quantitative analysis, but also a qualitative one, as this can affect the energy potential of the biogas [16,17,18]. Raw sewage sludge from Zakho city was effectively stabilized through anaerobic digestion, significantly reducing the sludge volume and producing biogas. After stabilization, the sludge showed improved quality, with reduced COD, suspended solids, and volatile solids, while nutrient levels increased, making it suitable for use as organic fertilizer [19]. Despite the extensive scientific literature on wastewater treatment plant performance, there is a clear lack of integrated, year-round datasets linking sludge production dynamics with biogas generation, energy self-sufficiency, and operational correlations. This study addresses that gap by providing a full-year, high-resolution analysis of sludge volumes, biogas output, energy utilization, and system-level interactions within a functioning municipal WWTP.
Although numerous studies have investigated sludge production, anaerobic digestion performance, or biogas-to-energy conversion, most of them analyze these components separately, focus on short-term datasets, or rely on controlled experimental conditions. What remains largely unexplored is a fully integrated, year-round evaluation of how sludge variability, digestion dynamics, biogas yield, heat generation, and energy self-sufficiency interact within a single operational framework. The present study addresses this gap by providing a comprehensive, system-level assessment of a full-scale WWTP, enabling the identification of cross-dependencies between operational subsystems that are not captured in studies examining only isolated process elements. The aim of this study was to provide an integrated, year-round assessment of sewage-to-energy performance by addressing four complementary research goals: first, to characterize the daily and monthly variability of primary and excessive sludge production and determine the stability of sludge loading conditions; second, to evaluate biogas production patterns and digestion performance across the same period, identifying both short-term fluctuations and seasonal trends; third, to quantify the WWTP’s energy recovery, self-consumption, and self-sufficiency levels through detailed analysis of electricity generation and on-site utilization; and finally, to identify system-level interactions by examining correlations between sludge volume, biogas output, heat production, cogenerator and boiler usage, and specific energy yield, thereby revealing how operational subsystems collectively influence overall efficiency.

2. Materials and Methods

2.1. Description of the Object

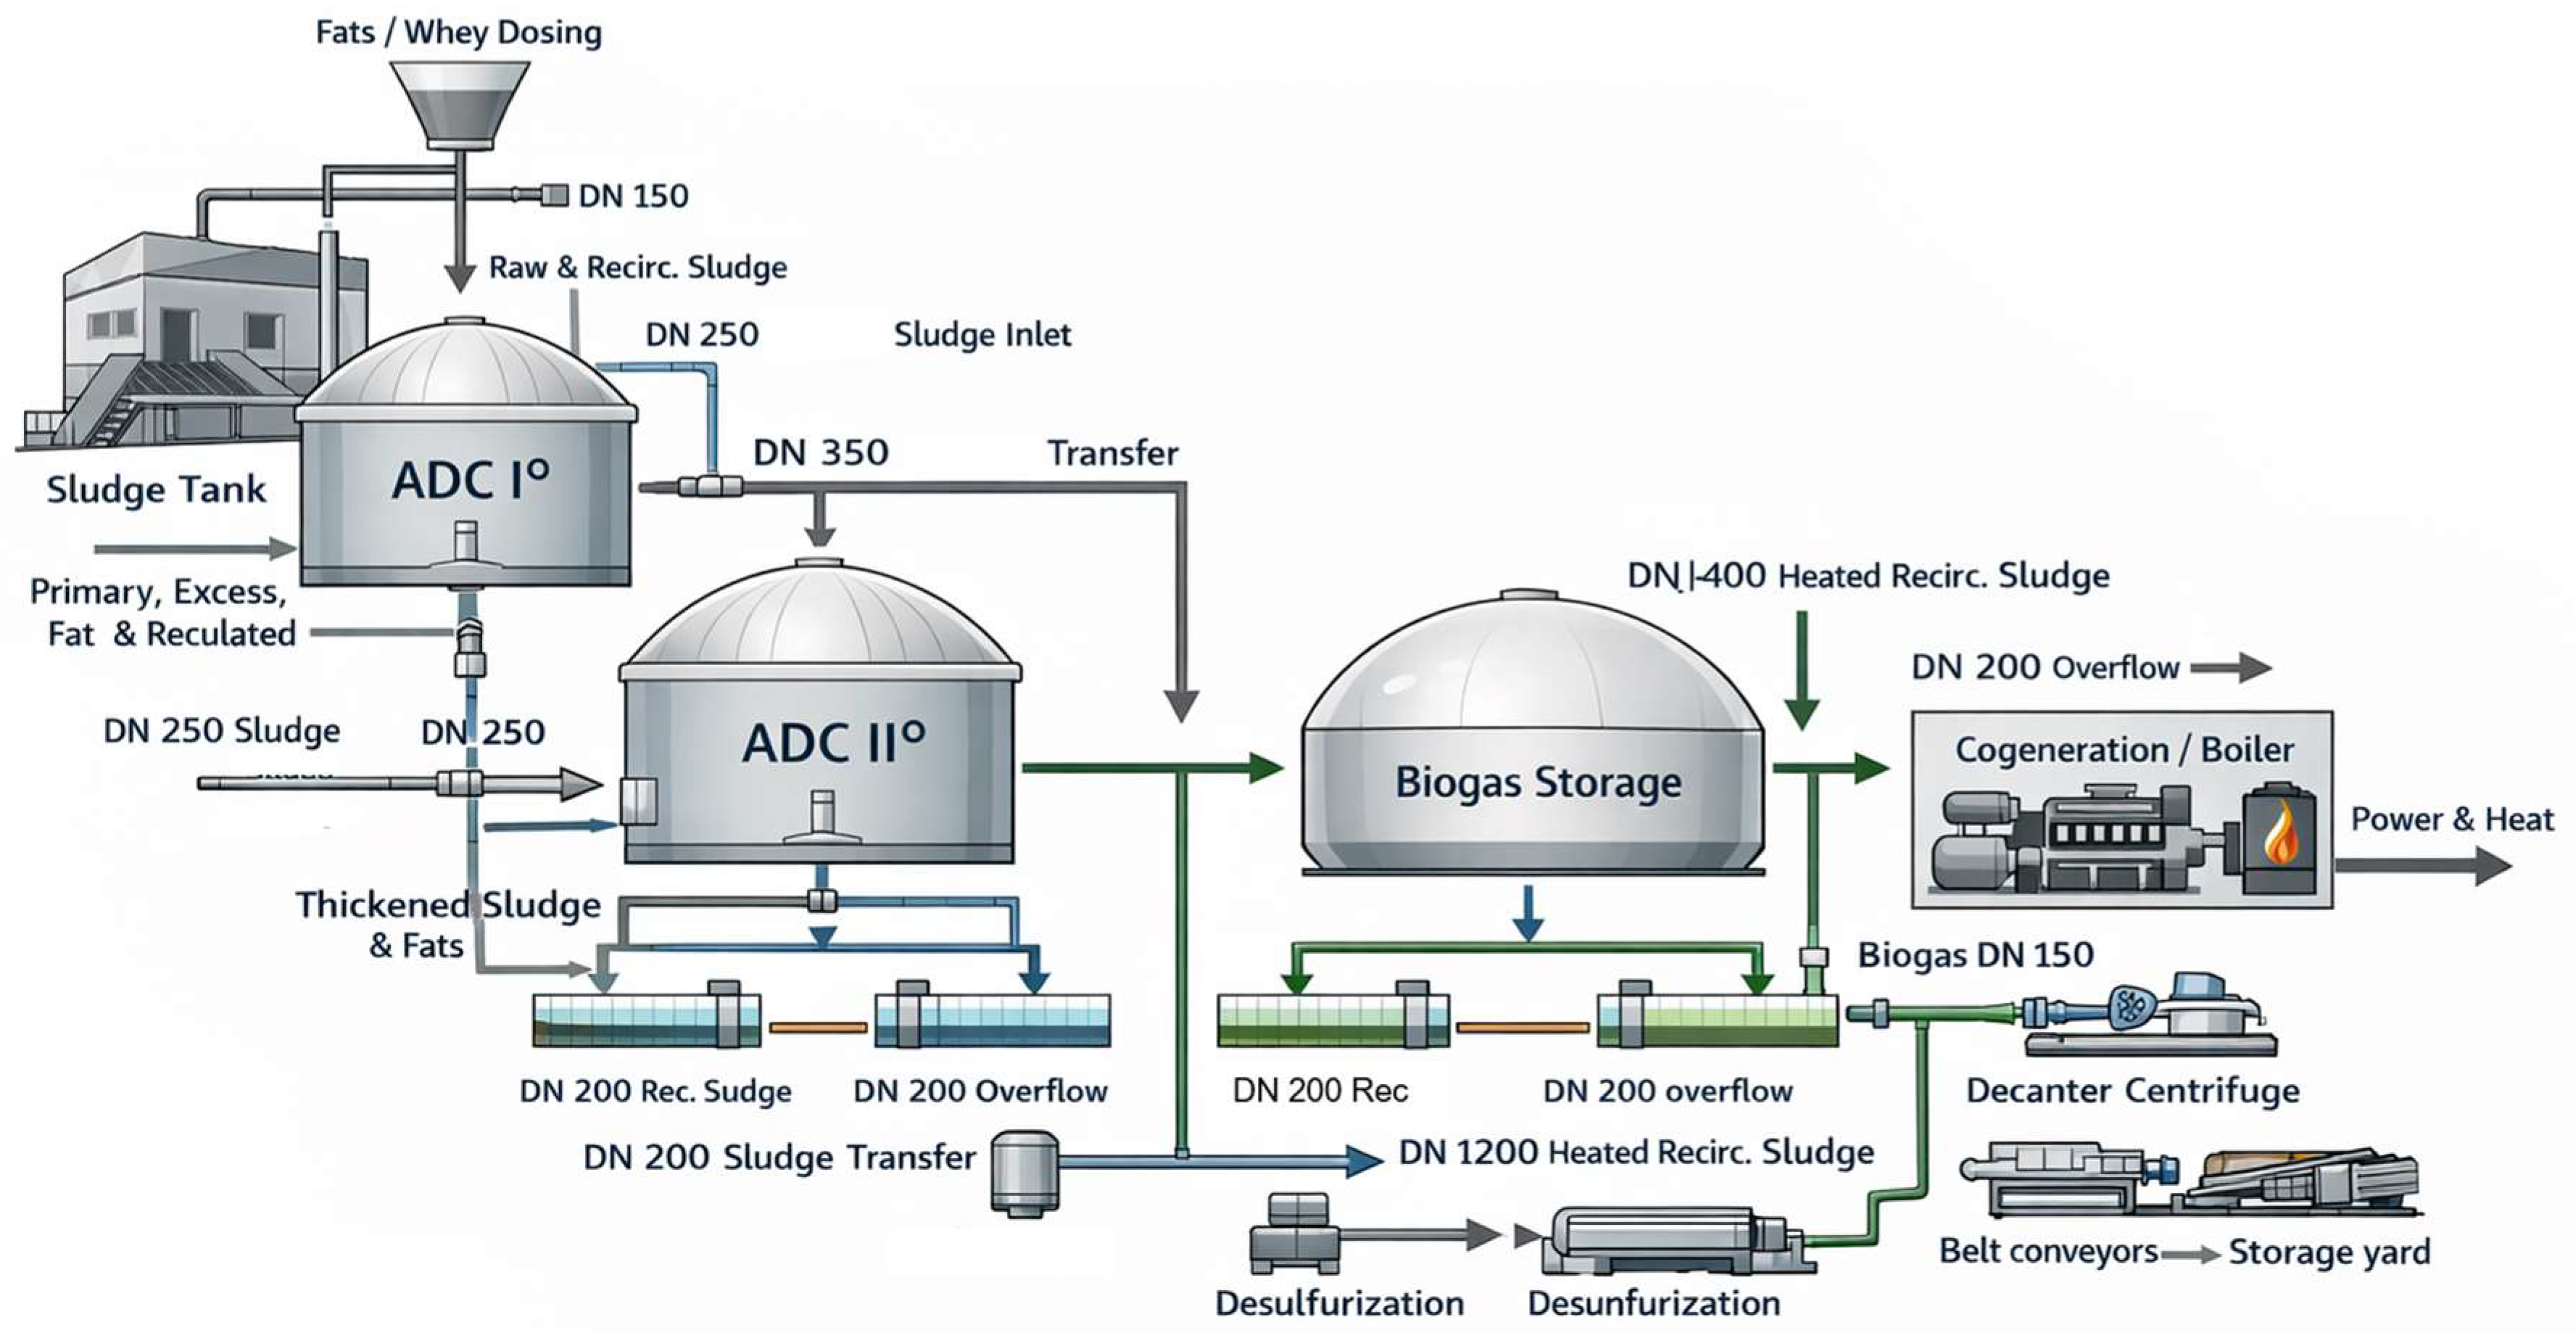
A sludge-to-energy process flow diagram of the studied WWTP is shown in Figure 1 and the detailed description of this process is presented in the next subsections. The closed anaerobic digestion chambers (ADCs) are facilities where the anaerobic stabilization of primary and excess sludge takes place, along with fats and other floatable materials extracted in preliminary clarifiers. An additional function of these chambers is the capture of biogas produced during sludge mineralization. This gas, composed of approximately 60% methane, is used to generate heat and electricity for the wastewater treatment plant and the administrative building of Wodociągi Dębickie Sp. z o.o. in south Poland.
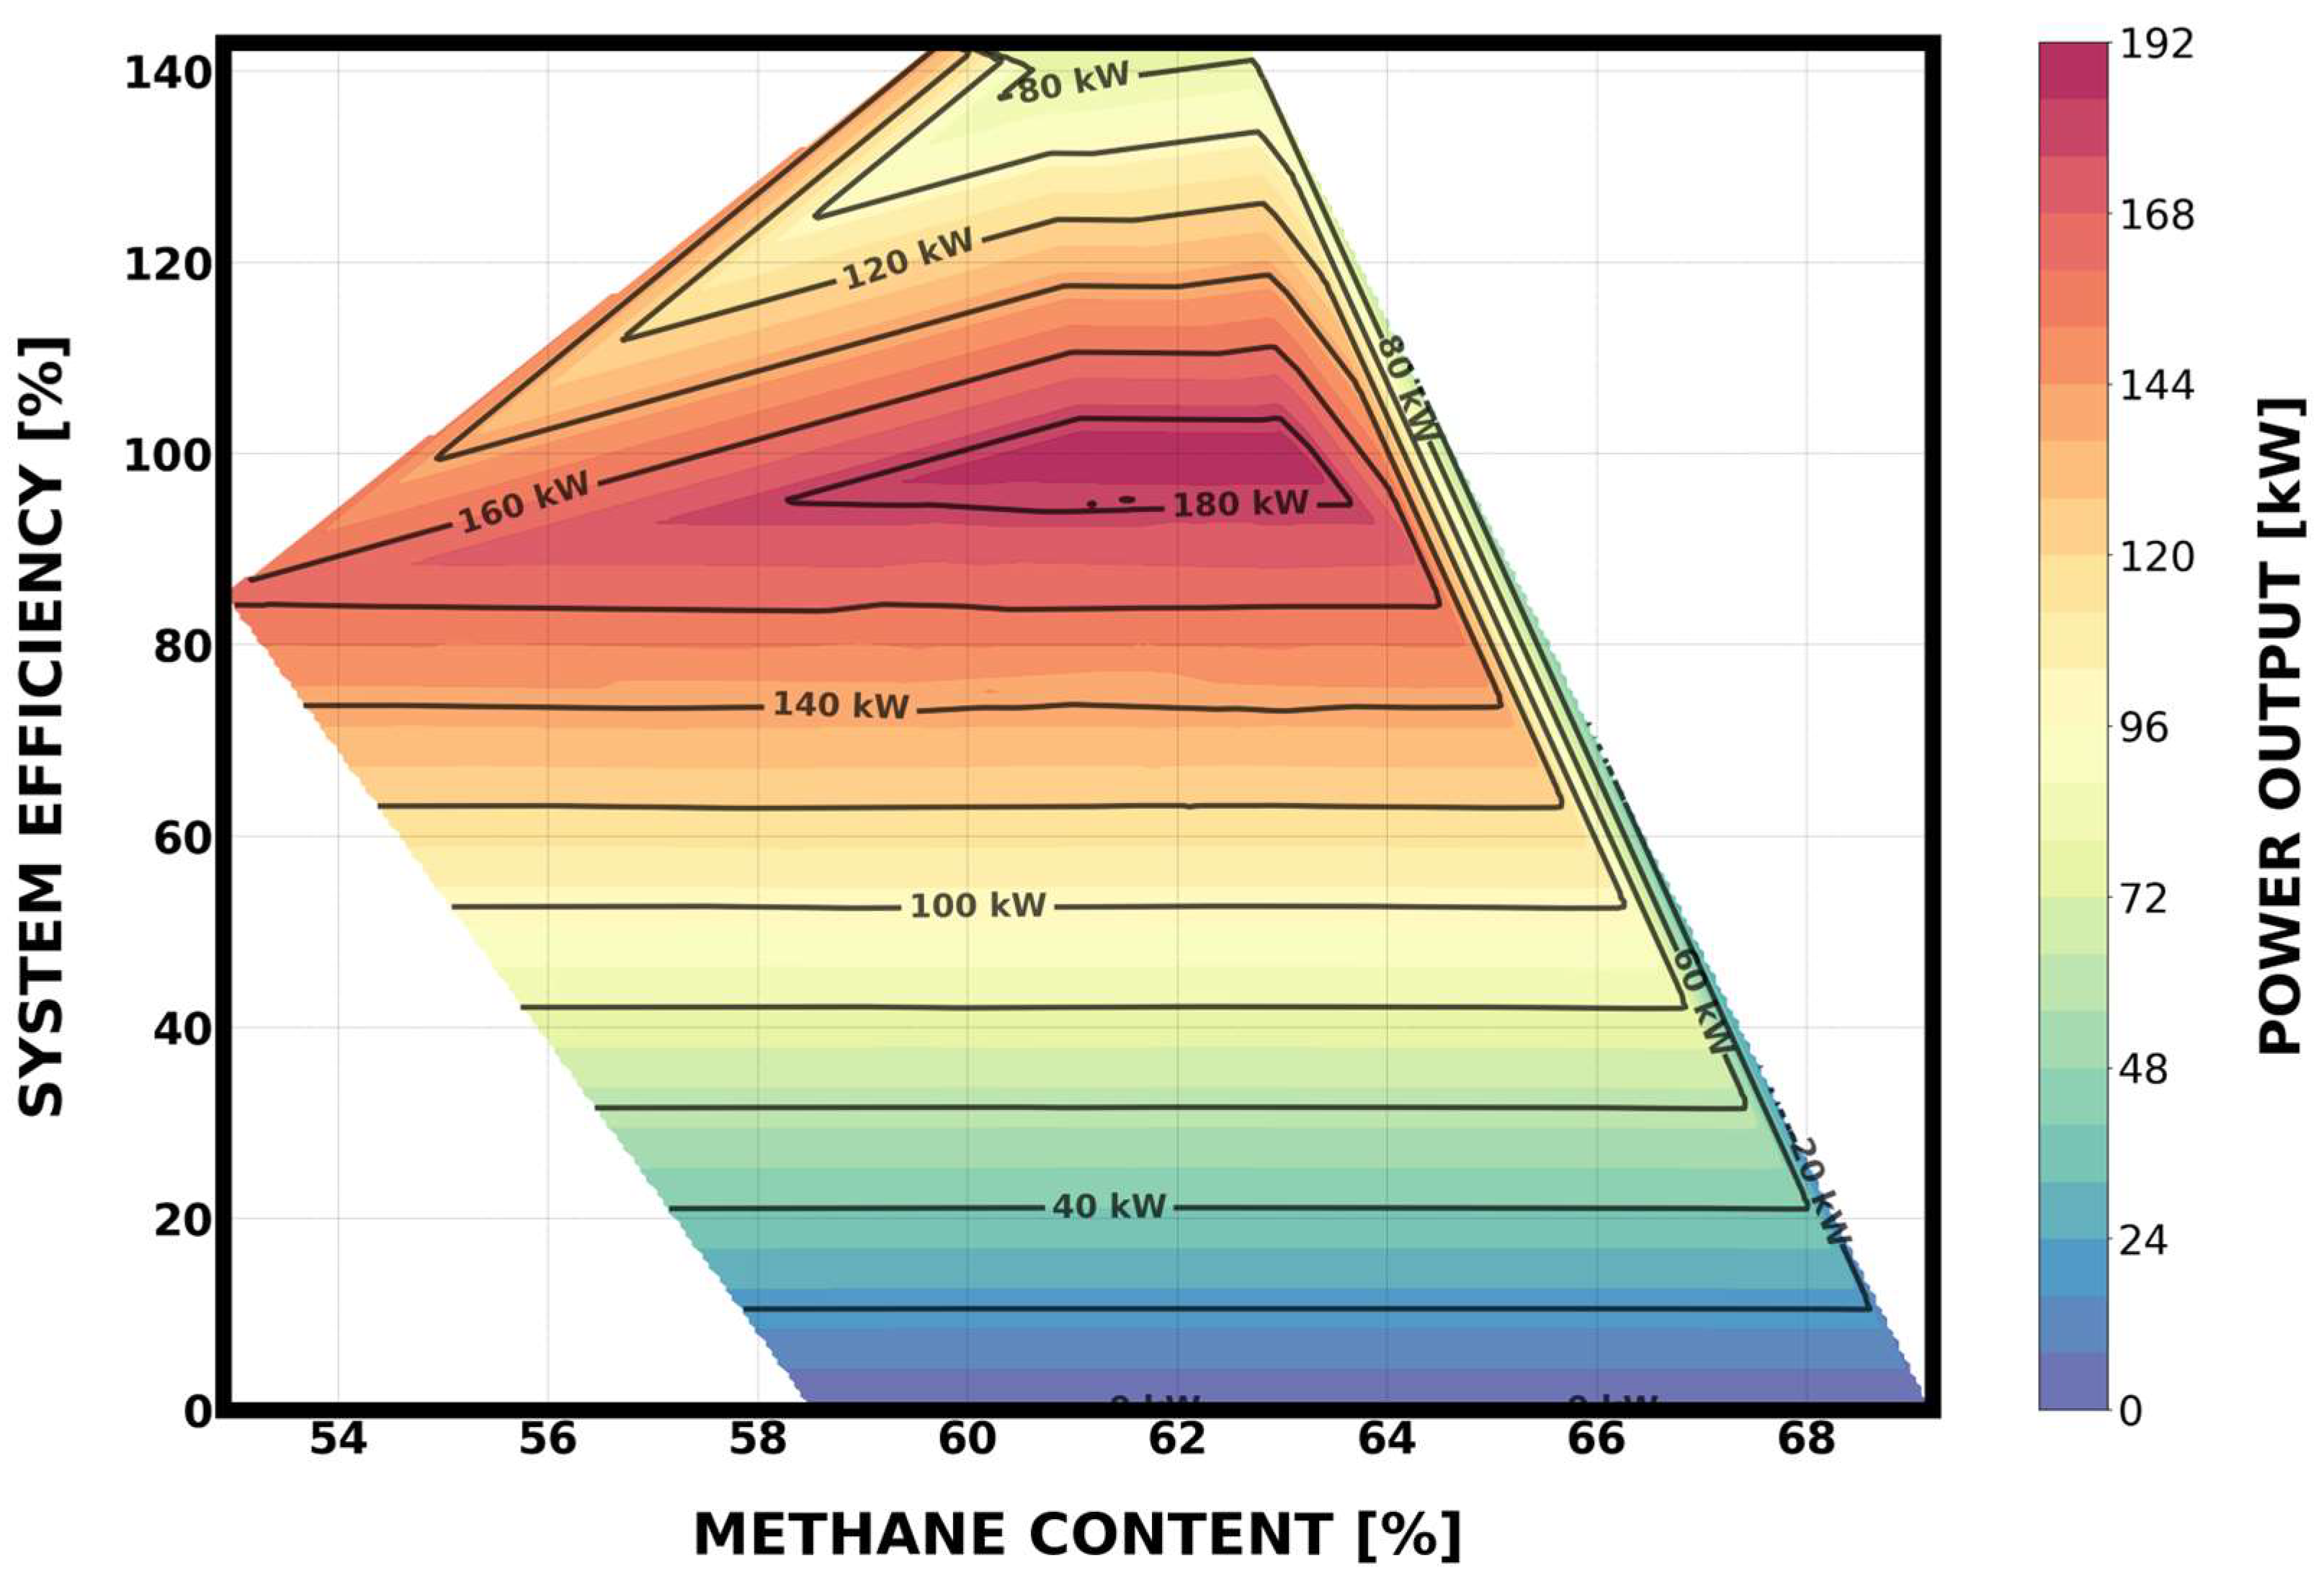
The performance analysis revealed that the system achieved its peak power output when methane concentration was within a specific range. The data demonstrated that the maximum output, exceeding 180 kW, was reached when the methane content was maintained between 60% and 63%, with a system efficiency of approximately 95%. During this period, the correlation between fuel quality and efficiency was optimized, allowing the system to operate in its most productive “sweet spot” (Appendix A, Figure A1). The optimal methane content range of 60–63% corresponds to typical operating conditions in biogas plants, where this concentration indicates stable anaerobic digestion and efficient conversion of organic matter. Methane levels within this range ensure reliable Combined Heat and Power (CHP) engine performance and reflect a balanced microbial process. Lower methane concentrations may signal process disturbances or insufficient substrate degradation. In routine operation, the digesters receive primary and excess sludge with VS/TS ratios typical for municipal wastewater treatment, ensuring sufficient biodegradable organic content for methane production. The system operates under a controlled mesophilic regime, with temperature maintained at approximately 36 °C through automated heat-exchange regulation. Mixing in both digestion chambers is performed by dual-level propeller mixers operating at fixed set-points to ensure homogeneous conditions and prevent sedimentation. The organic loading rate (OLR) remains within the standard range for full-scale mesophilic digestion, consistent with the stable biogas yields observed during the multi-year period (annual biogas production: 537,443–733,738 m3; CV = 0.10). The digesters operate with hydraulic and solid retention times (HRTs/SRTs) typical for municipal two-stage mesophilic systems, supporting stable biological performance and enabling the low variability in biogas output. These operational parameters form the basis for evaluating digestion efficiency, biogas yield, and system-level interactions throughout the study.

2.1.1. Characteristics of the Designated Digestion Chambers

Sludge stabilization is carried out as a two-stage mesophilic fermentation process in two closed chambers. Partially digested sludge from the first chamber flows into the second, where the final breakdown of organic matter occurs. The pipeline system also allows for fermentation in a single chamber during maintenance of the other. During normal operation, raw and recirculated sludge is fed into ADC I° via a DN 250 pipeline laid in the ceiling of the chamber, supplied from a sludge tank located on the top floor of the operations building. This tank receives sludge from primary, excess, fat, and recirculated sources and includes an emergency overflow to the sewer system. It serves both mixing and pipeline monitoring functions.
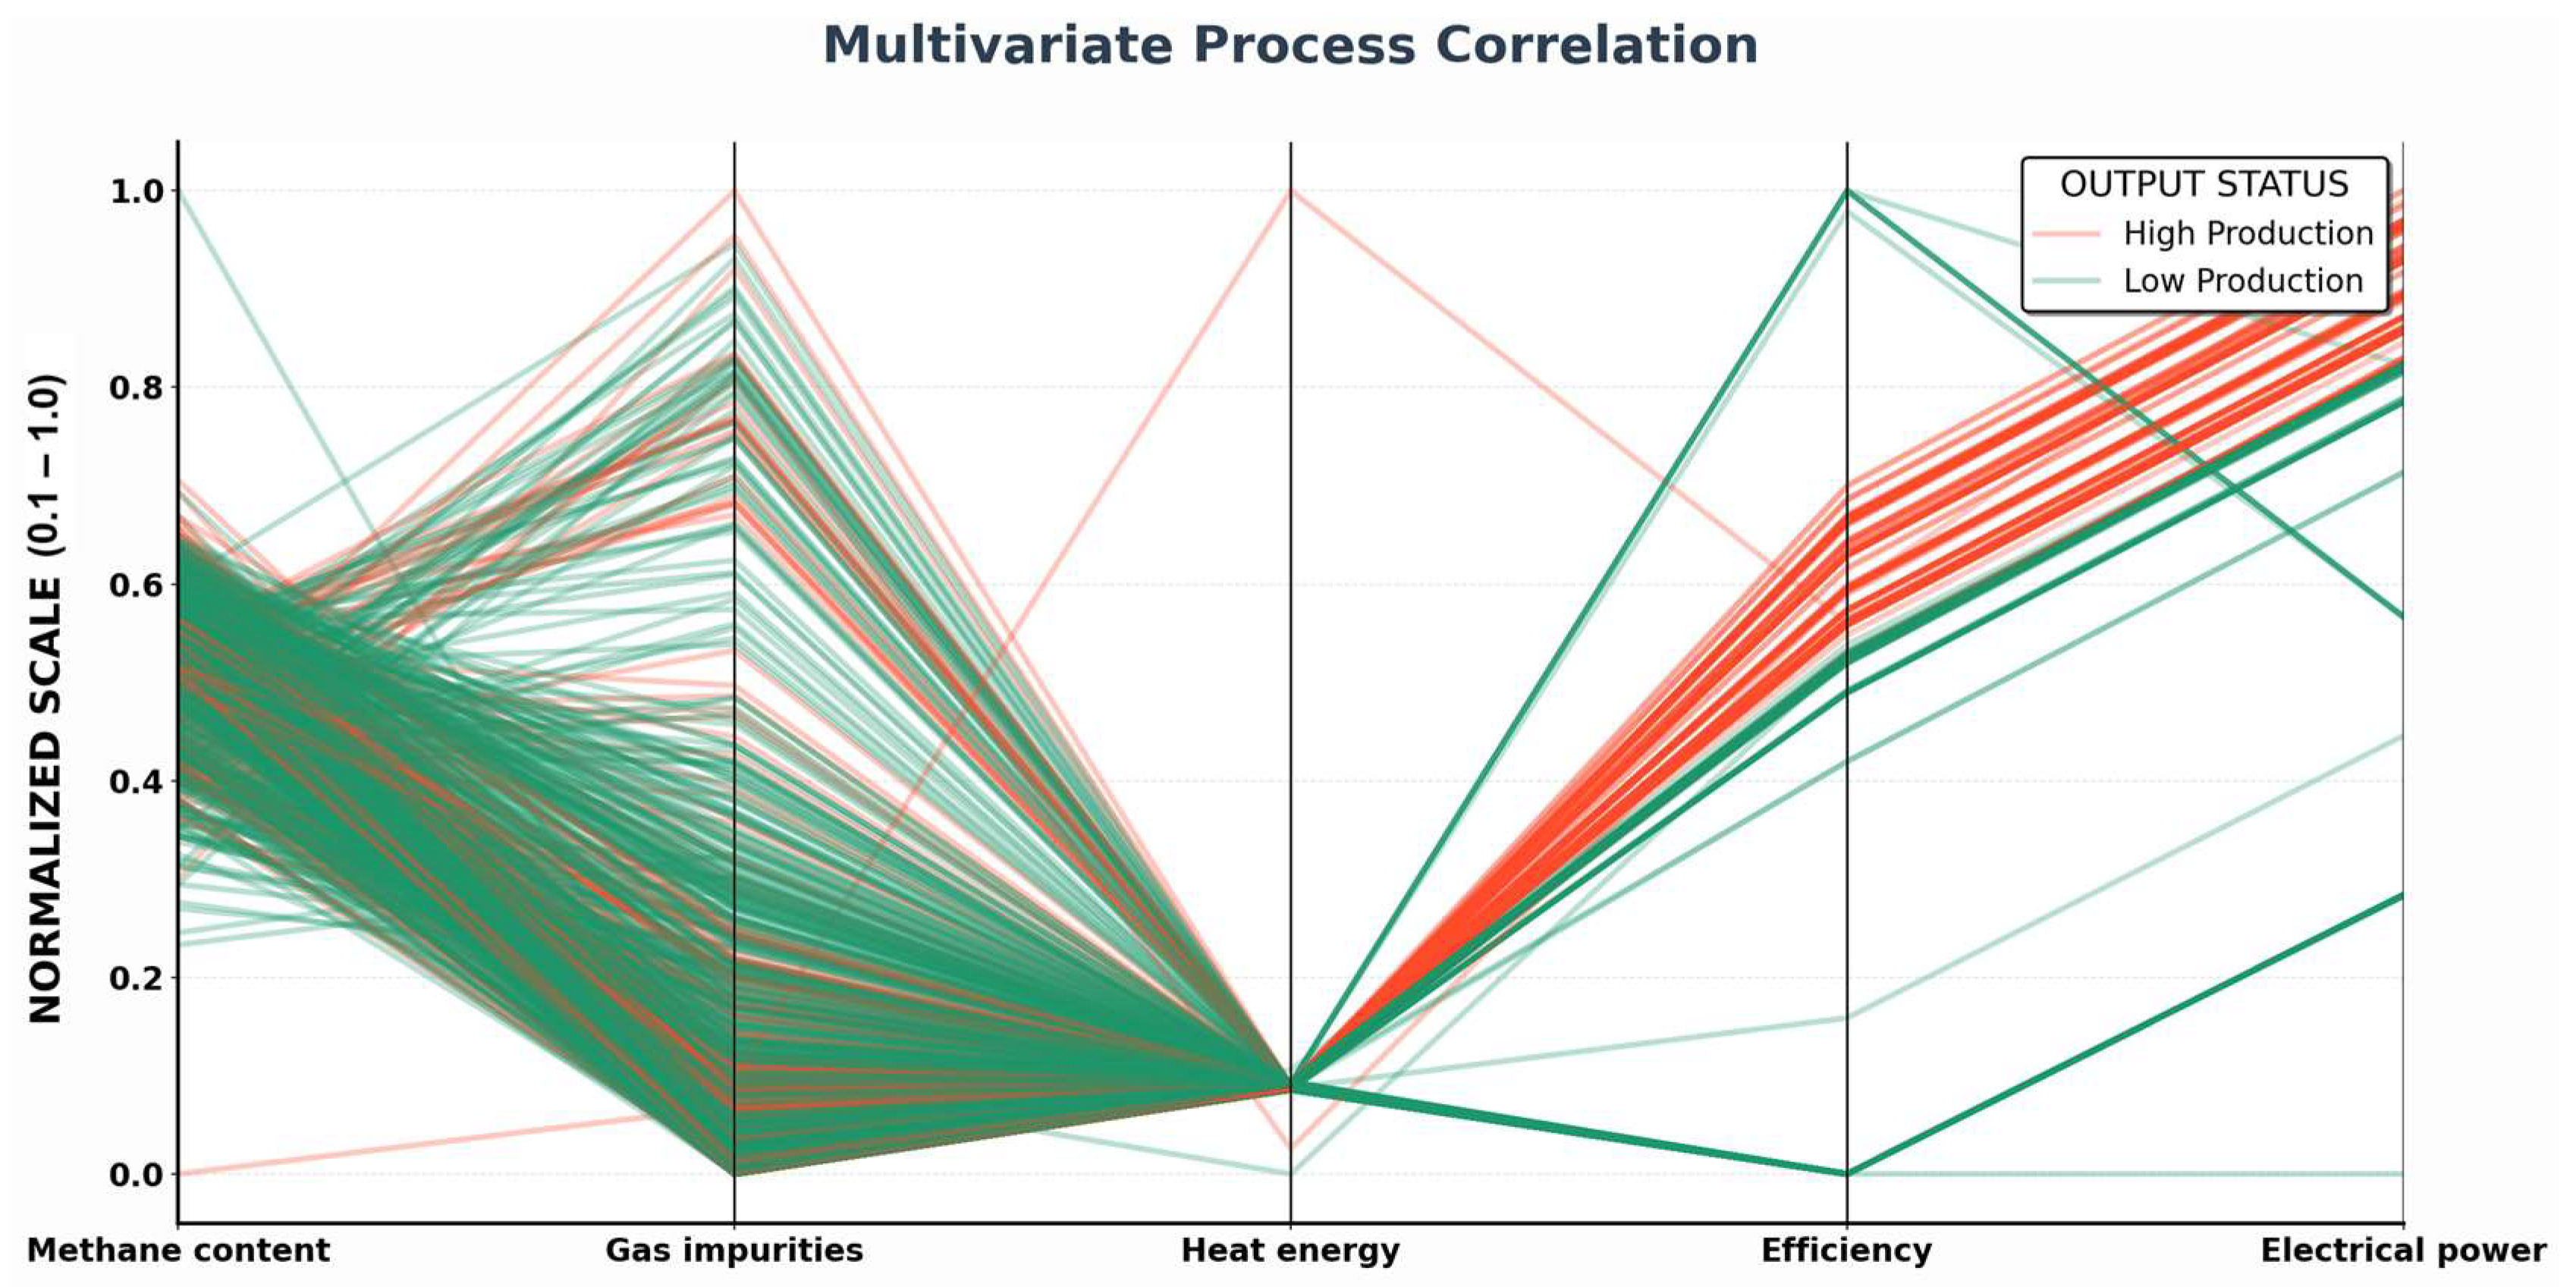
The analysis revealed that methane content, heat energy, and electrical power were the most influential processes driving high production outcomes. In high-performing scenarios, these variables consistently reached normalized values close to 1.0, indicating strong contributions to system output. Efficiency also showed a positive correlation, though with slightly more variability. In contrast, gas impurities displayed less consistent behavior and had a weaker direct impact on production levels (Figure A2).
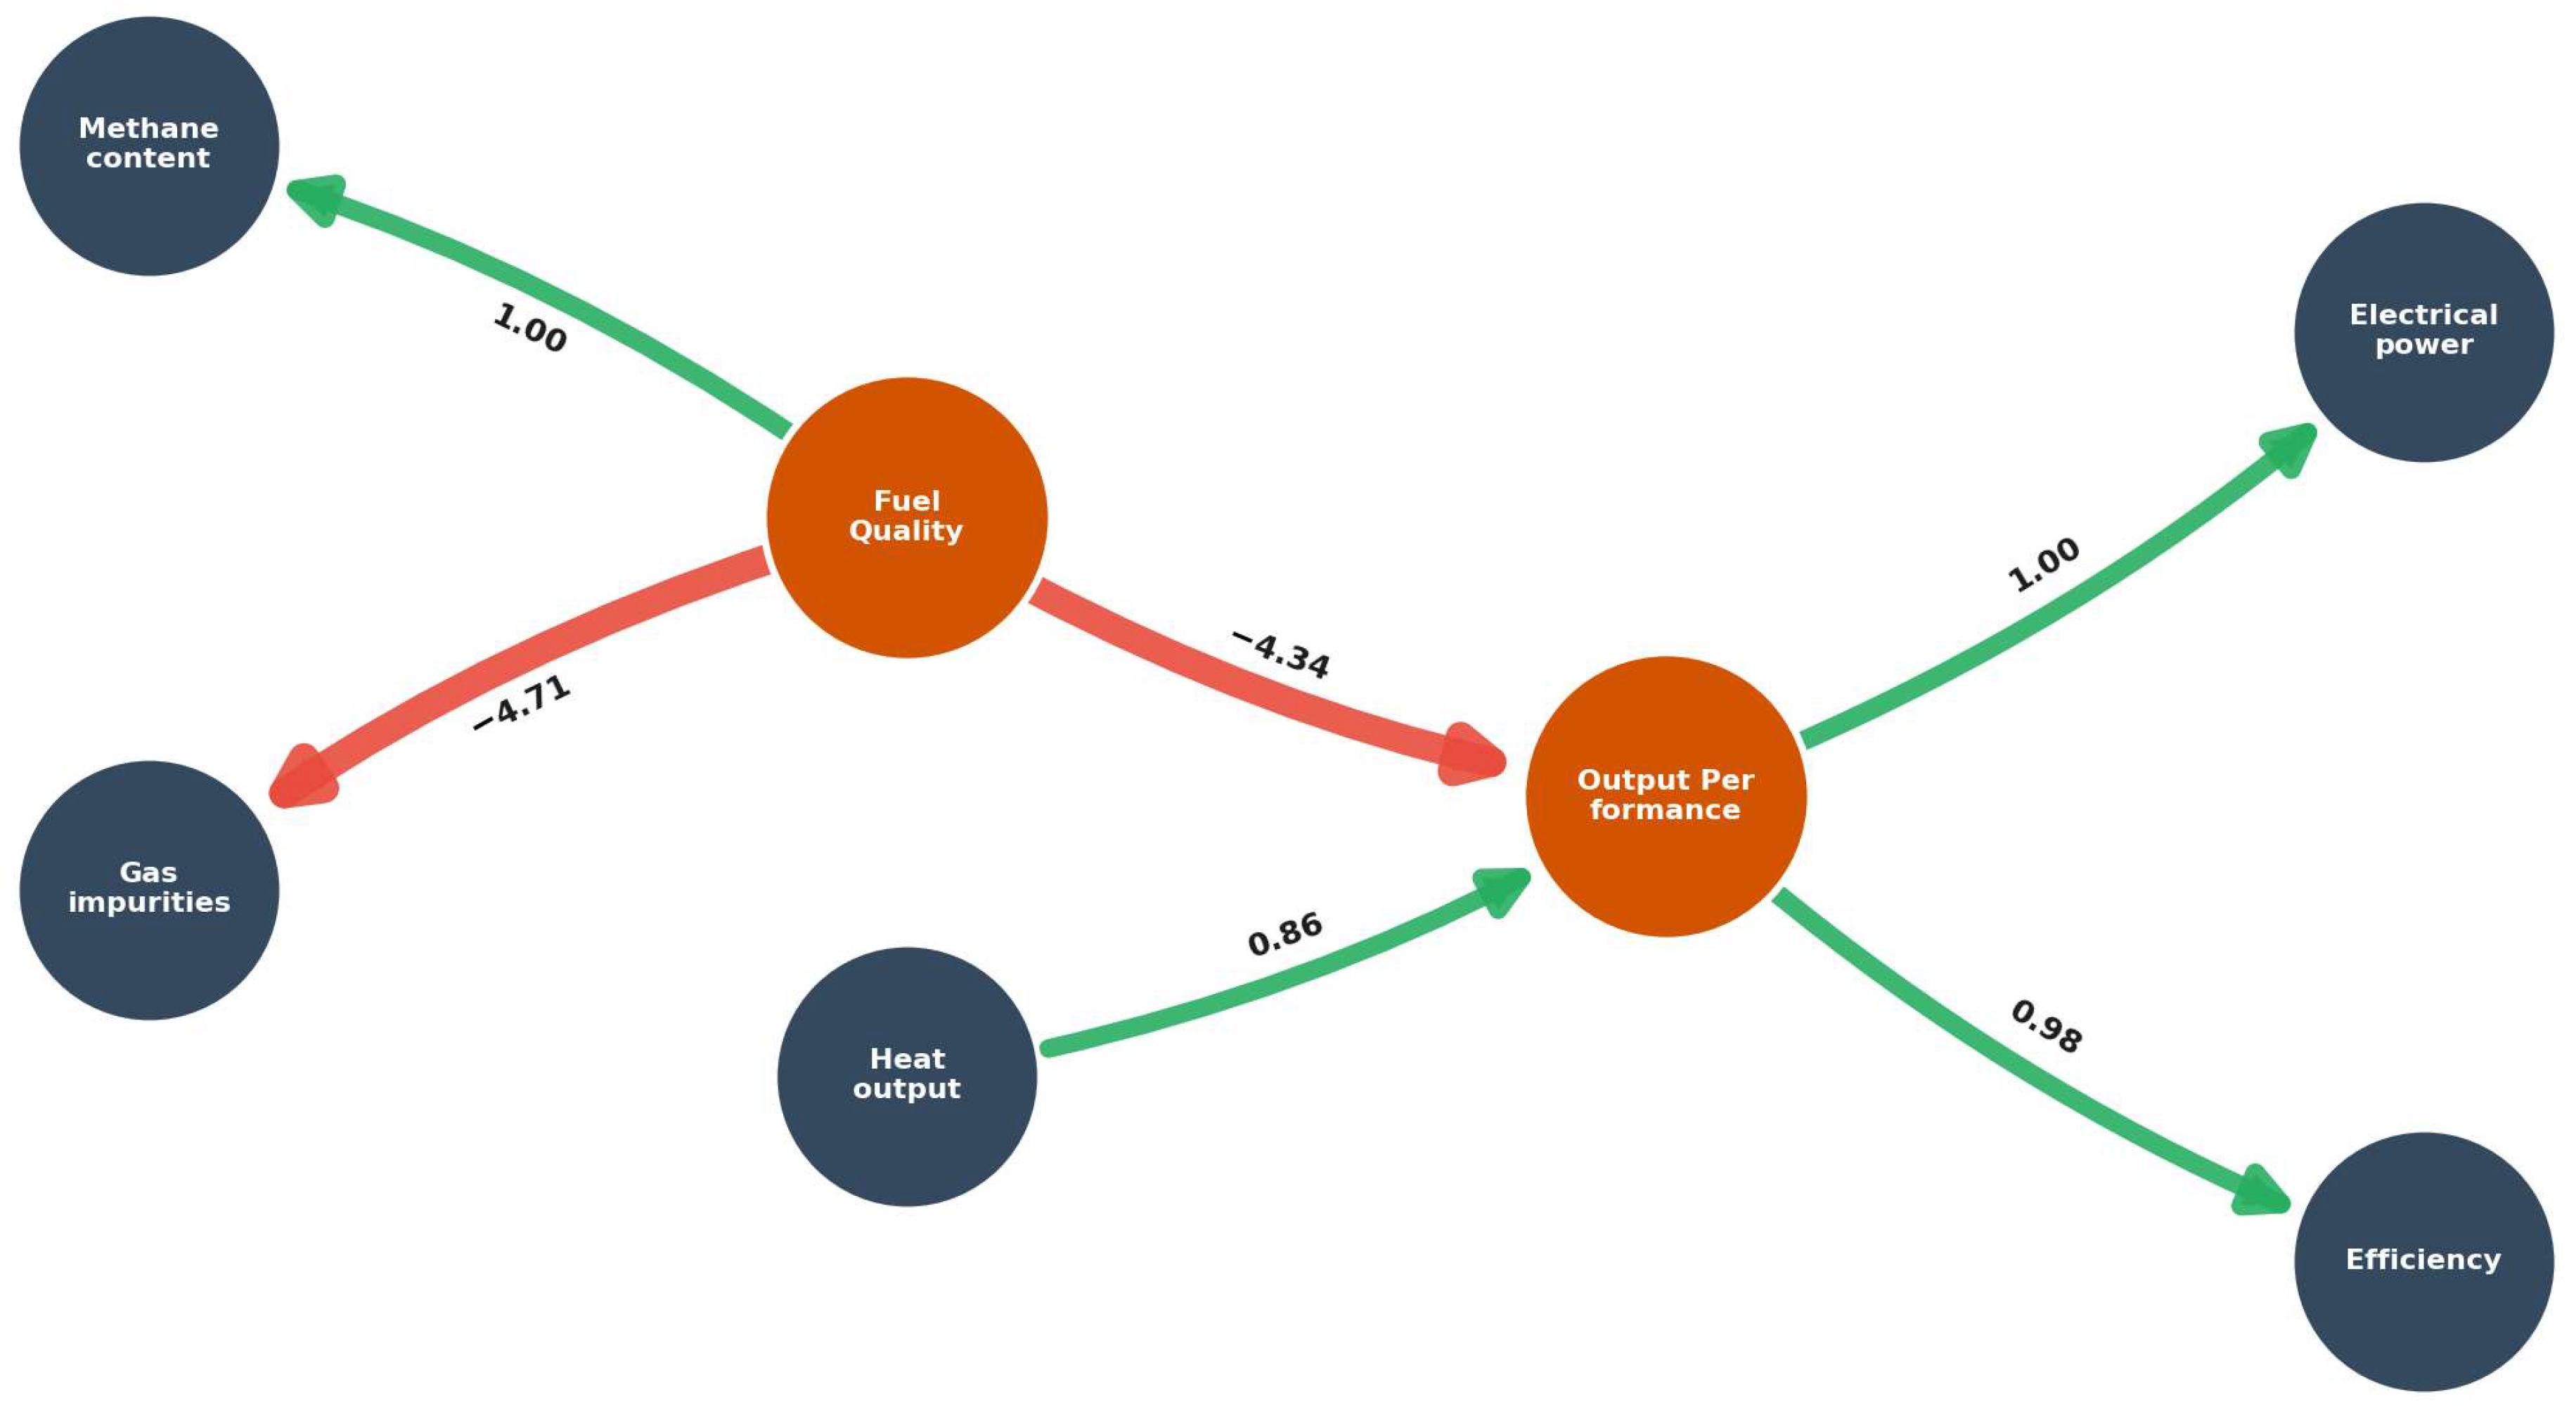
The diagram of SEM illustrated how key process variables influenced fuel quality and output performance in the energy system. methane content had a strong positive effect on fuel quality (coefficient: +1.00), while gas impurities exerted a significant negative impact (−4.71). Surprisingly, fuel quality itself negatively affected overall output performance (−4.34), suggesting that purity alone did not guarantee optimal results. In contrast, heat output contributed positively (+0.86) to performance, which in turn strongly enhanced both electrical power (+1.00) and efficiency (+0.98) The entire structure formed a flow-like chain of relationships, visually mapping how different operational factors interacted within the system (Figure A3).

2.1.2. Technological Process of Sewage Treatment

Recirculated sludge is drawn from the bottom of ADC II°, heated in heat exchangers located in the operations building, and reintroduced above the sludge surface to help break the scum layer. Fats are introduced via a DN 150 pipeline just below the ceiling, descending along the wall, with the outlet positioned 5.8 m above the chamber floor. Sludge flows from ADC I° to ADC II° through a DN 350 gravity pipeline connecting the chambers centrally. Recirculated sludge is extracted via a DN 200 pipeline with an inlet 2.5 m above the chamber floor, routed upward inside the chamber and exiting at 5.15 m above the conical bottom into the operations building. For emergency operation of a single chamber, identical suction pipelines are installed in both chambers.
Recirculated sludge is heated in four heat exchangers, operating in pairs—two active and two on standby. Digested sludge exits ADC II° through a DN 400 overflow pipeline, which also serves as an emergency overflow to a sump on the chamber ceiling. From the sump, sludge flows via a DN 200 gravity pipeline along the chamber wall to the digested sludge storage tank. The same setup is used in ADC I° for emergency overflow and operational flexibility during chamber maintenance or stage switching. Each chamber is equipped with mechanical mixers, each featuring two paddle impellers (upper and lower) mounted on the mixer shaft to ensure thorough sludge mixing. A 60 × 60 cm gas-tight hatch in the chamber ceiling allows for periodic removal of non-degradable scum, which is essential for maintaining anaerobic conditions. Gas collection bells are installed on each chamber ceiling to capture fermentation gas, with a DN 400 inspection port in the metal dome covering the chamber chimney. Each chamber also includes a DN 700 access hatch located 1.10 m above ground level on the side wall.

2.1.3. Sludge Treatment Technology

The primary sludge generated in the preliminary sedimentation tanks is pumped into the sludge distribution chamber, from where it is directed to two gravity thickeners. A portion of the biological sludge—known as excess sludge—from the secondary clarifiers is routed to a belt thickener. It is then combined with the thickened primary sludge and fats for joint processing in two closed fermentation chambers operating in a two-stage system. Within the anaerobic digestion chambers, the sludge undergoes biological stabilization under anaerobic conditions, i.e., methane fermentation. The chambers operate at a constant sludge level and are equipped with dual-level propeller mixers. Temperature control for the fermentation process is maintained via two sets of spiral heat exchangers, located in the operations building. After digestion, the sludge is transferred via a digested sludge storage tank to decanter centrifuges for final dewatering. The dewatered sludge is then subjected to hygienization (disinfection) using quicklime. The treated sludge is conveyed via belt conveyors to the sludge storage yard. To support fermentation processes in the anaerobic digestion chambers, an external carbon source (whey) is introduced and dosed through an auxiliary installation that delivers the substrate to the fat pumping station.

2.1.4. Biogas Production

As a result of anaerobic sludge fermentation in the anaerobic digestion chambers at approximately 36 °C, biogas is produced, with methane as its main component. The biogas is conveyed through pipelines and desulfurization units (devices for removing sulfur from biogas) to a biogas storage tank. The stored biogas is utilized as fuel:
  • In the boiler room (supplying three gas boilers)—for generating process heat, heating office spaces, and preparing domestic hot water;
  • In the cogeneration building (supplying the cogeneration module)—for combined production of electricity and heat.
Biogas volume was expressed in normal cubic meters (Nm3), corresponding to gas volume recalculated to standard conditions (0 °C and 101.325 kPa). This normalization allows direct comparison of biogas production across different operational periods and temperature–pressure conditions. Gas composition parameters, including hydrogen sulfide (H2S), were reported in parts per million (ppm), which is the standard unit for expressing trace-gas concentrations in biogas systems.

2.2. Statistical Analysis

Operational data were collected at a high temporal resolution of three measurements per day (08:00, 16:00, 00:00), resulting in 1095 observations for each monitored variable over the full year. This frequency allowed us to capture intra-day, daily, and seasonal variability while maintaining a consistent and complete dataset for 2024.
The research material consists of data obtained from the WWTP operator, based on daily measurements of the volume of discharged primary thickened sludge, the volume of excessive thickened sludge, and the amount of biogas produced for the period from January to December 2024. As part of the initial data elaboration, a statistical analysis was performed for each of the parameters (also for total thickened sludge, i.e., the sum of primary thickened sludge and excessive thickened sludge), by determining basic descriptive statistics for the entire dataset; these included minimum (Min), average (Avg), maximum (Max), standard deviation (STD), coefficient of variation (CV), kurtosis (Kurt) and skewness (Sk). The calculated coefficient of variation (CV) values were interpreted using the following rules: below 0.25—low variability; between 0.25 and 0.45—moderate variability; between 0.45 and 1.00—strong variability; and greater than 1.00—very strong variability [20]. The same statistical analysis was then performed separately for each month of 2024. Next, the relationship between the total amount of sludge produced and the amount of biogas produced was examined. The determined correlation coefficient values (r) for this purpose allowed defining the strength of the relationship between these variables. Their interpretation was conducted according to the classification by Guilford [21]: r = 0.0—no correlation; 0.0 < r ≤ 0.1—slight correlation; 0.1 < r ≤ 0.3—weak correlation; 0.3 < r ≤ 0.5—moderate correlation; 0.5 < r ≤ 0.7—high correlation; 0.7 < r ≤ 0.9—very high correlation; 0.9 < r < 1.0—almost complete correlation; r = 1.0—complete correlation.
To evaluate the energy performance of the WWTP, twelve months of operational data covering energy production, grid purchases, and total consumption were processed. The two primary energy performance indicators (EnPIs) were calculated: the self-sufficiency ratio (SSR) and the self-consumption ratio (SCR). To move beyond simple averages, we applied ordinary least squares (OLS) linear regression and calculated the effect size (f2). Specifically, a quantitative regression to determine the exact efficiency of production utilization, eliminating scaling errors between large energy volumes and percentage ratios was performed.
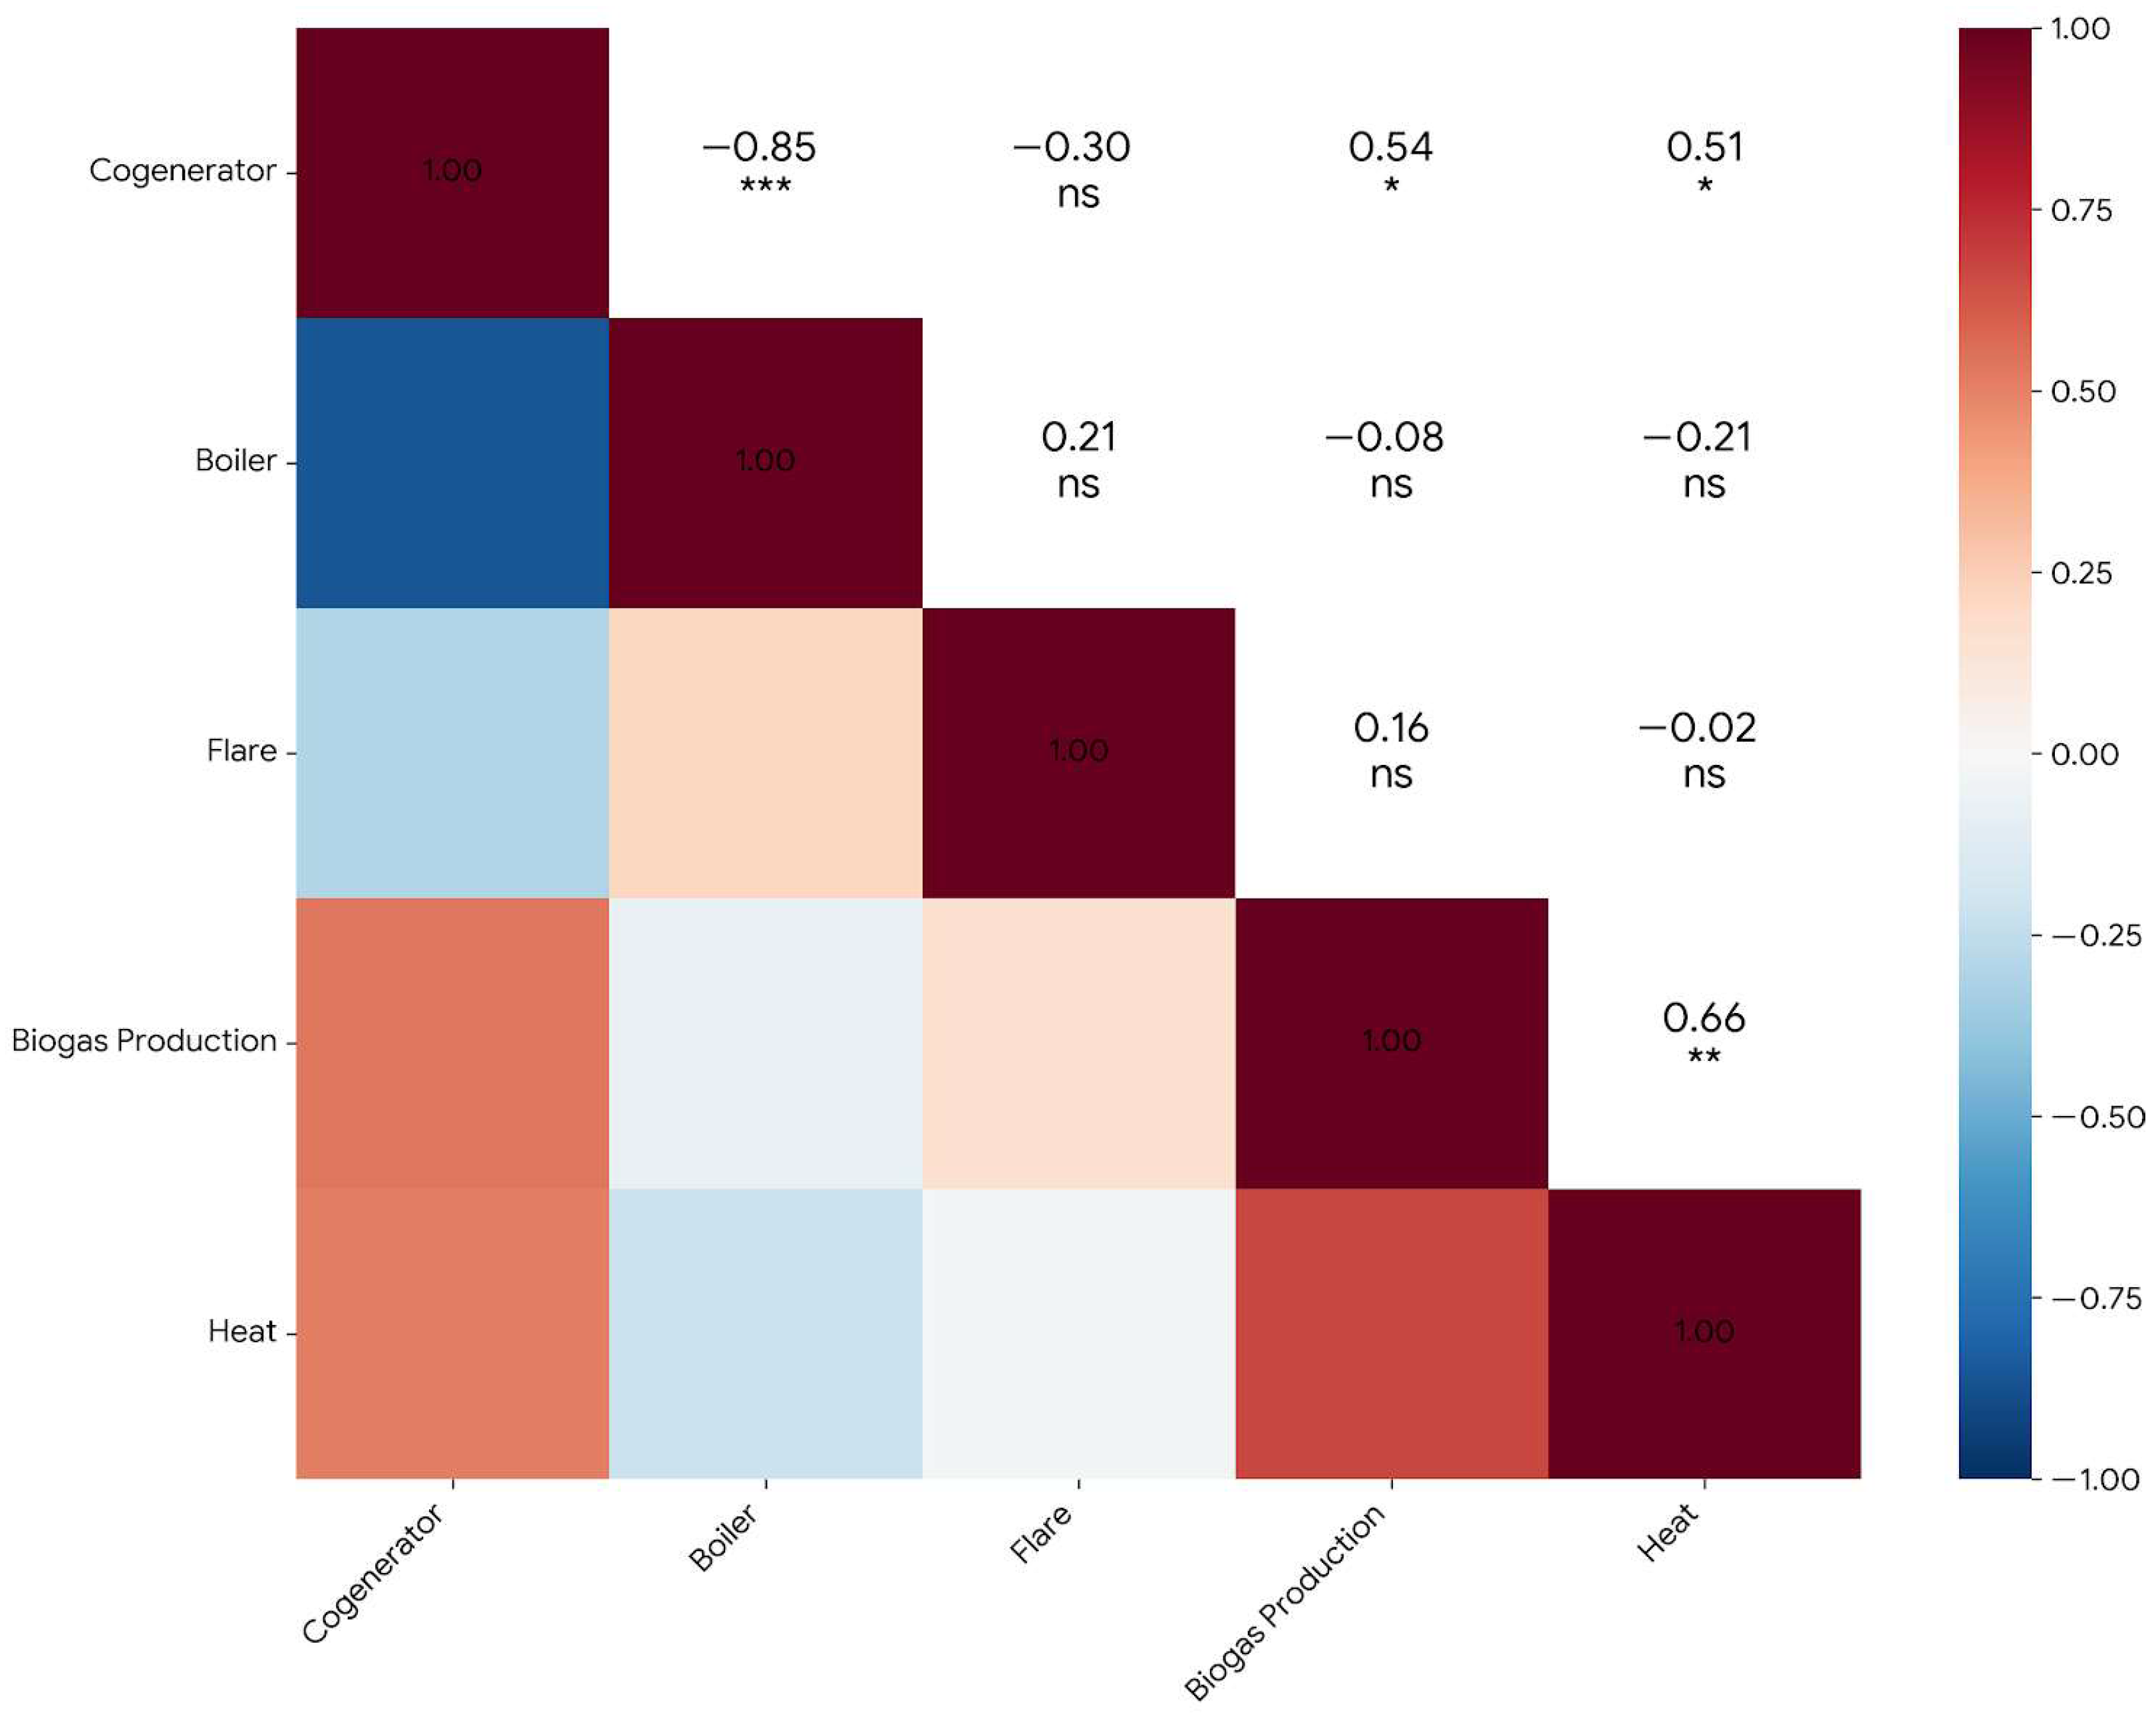
Using the Pearson correlation coefficient, the linear relationship between five variables—cogeneration, boiler, flare, biogas production, and heat level—was calculated. The statistical significance was determined for each pair to ensure that the results were not due to random chance. For the specific yield indicator, the total gas consumption was calculated by summing the volumes from the cogenerator and the boiler. The specific yield was then derived using Formula (1):
S p e c i f i c   y i e l d   =   H e a t   o u t p u t T o t a l   b i o g a s   c o n s u m p t i o n   ×   1000
where:
Specific yield is calculated as GJ per 1000 Nm3;
Heat output is measured in GJ—representing the total thermal energy produced from the biogas;
Total biogas consumption is reported in Nm3 (normal cubic meters), quantifying the volume of gas used under standard conditions.
This normalized the data into a performance metric of GJ per 1000 Nm3, allowing for a fair efficiency comparison across months with different production volumes. Specific yield represents this performance metric—the ratio of heat to gas—providing a standardized measurement that helps compare monthly data regardless of total output.
The analysis considered a comprehensive set of operational parameters, including methane content, gas impurities, fuel quality, heat output, electrical power, efficiency, and overall performance. These variables, representing the core physical and chemical processes of the biogas plant, were selected to capture both fuel characteristics and system-level performance. To examine these complex relationships, several advanced analytical methods were applied. Structural Equation Modeling (SEM) was employed to represent directional dependencies between processes, while a daily hierarchical model captured day-to-day variability in operational behavior. Canonical Correlation Analysis (CCA) was specifically integrated to identify how combinations of fuel-related predictors jointly correspond to performance outcomes, detecting multivariate patterns invisible to single-variable methods.
The entire computational workflow was executed using Python 3.11 within the Google Colab environment, ensuring a reproducible framework for data import, modeling, and figure exportation. Data handling, cleaning, and preprocessing were performed using the pandas and numpy libraries. The SEM analysis was implemented via the semopy package, while hierarchical modeling and CCA were carried out using statsmodels and scikit-learn. Driver analysis and multivariate correlations were further supported by specialized statistical modules. All variables were normalized and aligned to their temporal structure prior to modeling. Finally, visualizations, including parallel coordinate plots and influence diagrams, were generated using matplotlib and seaborn to ensure high-fidelity representation of the joint behavior of all monitored sensors.

3. Results

3.1. Analysis of Sewage Sludge Produced

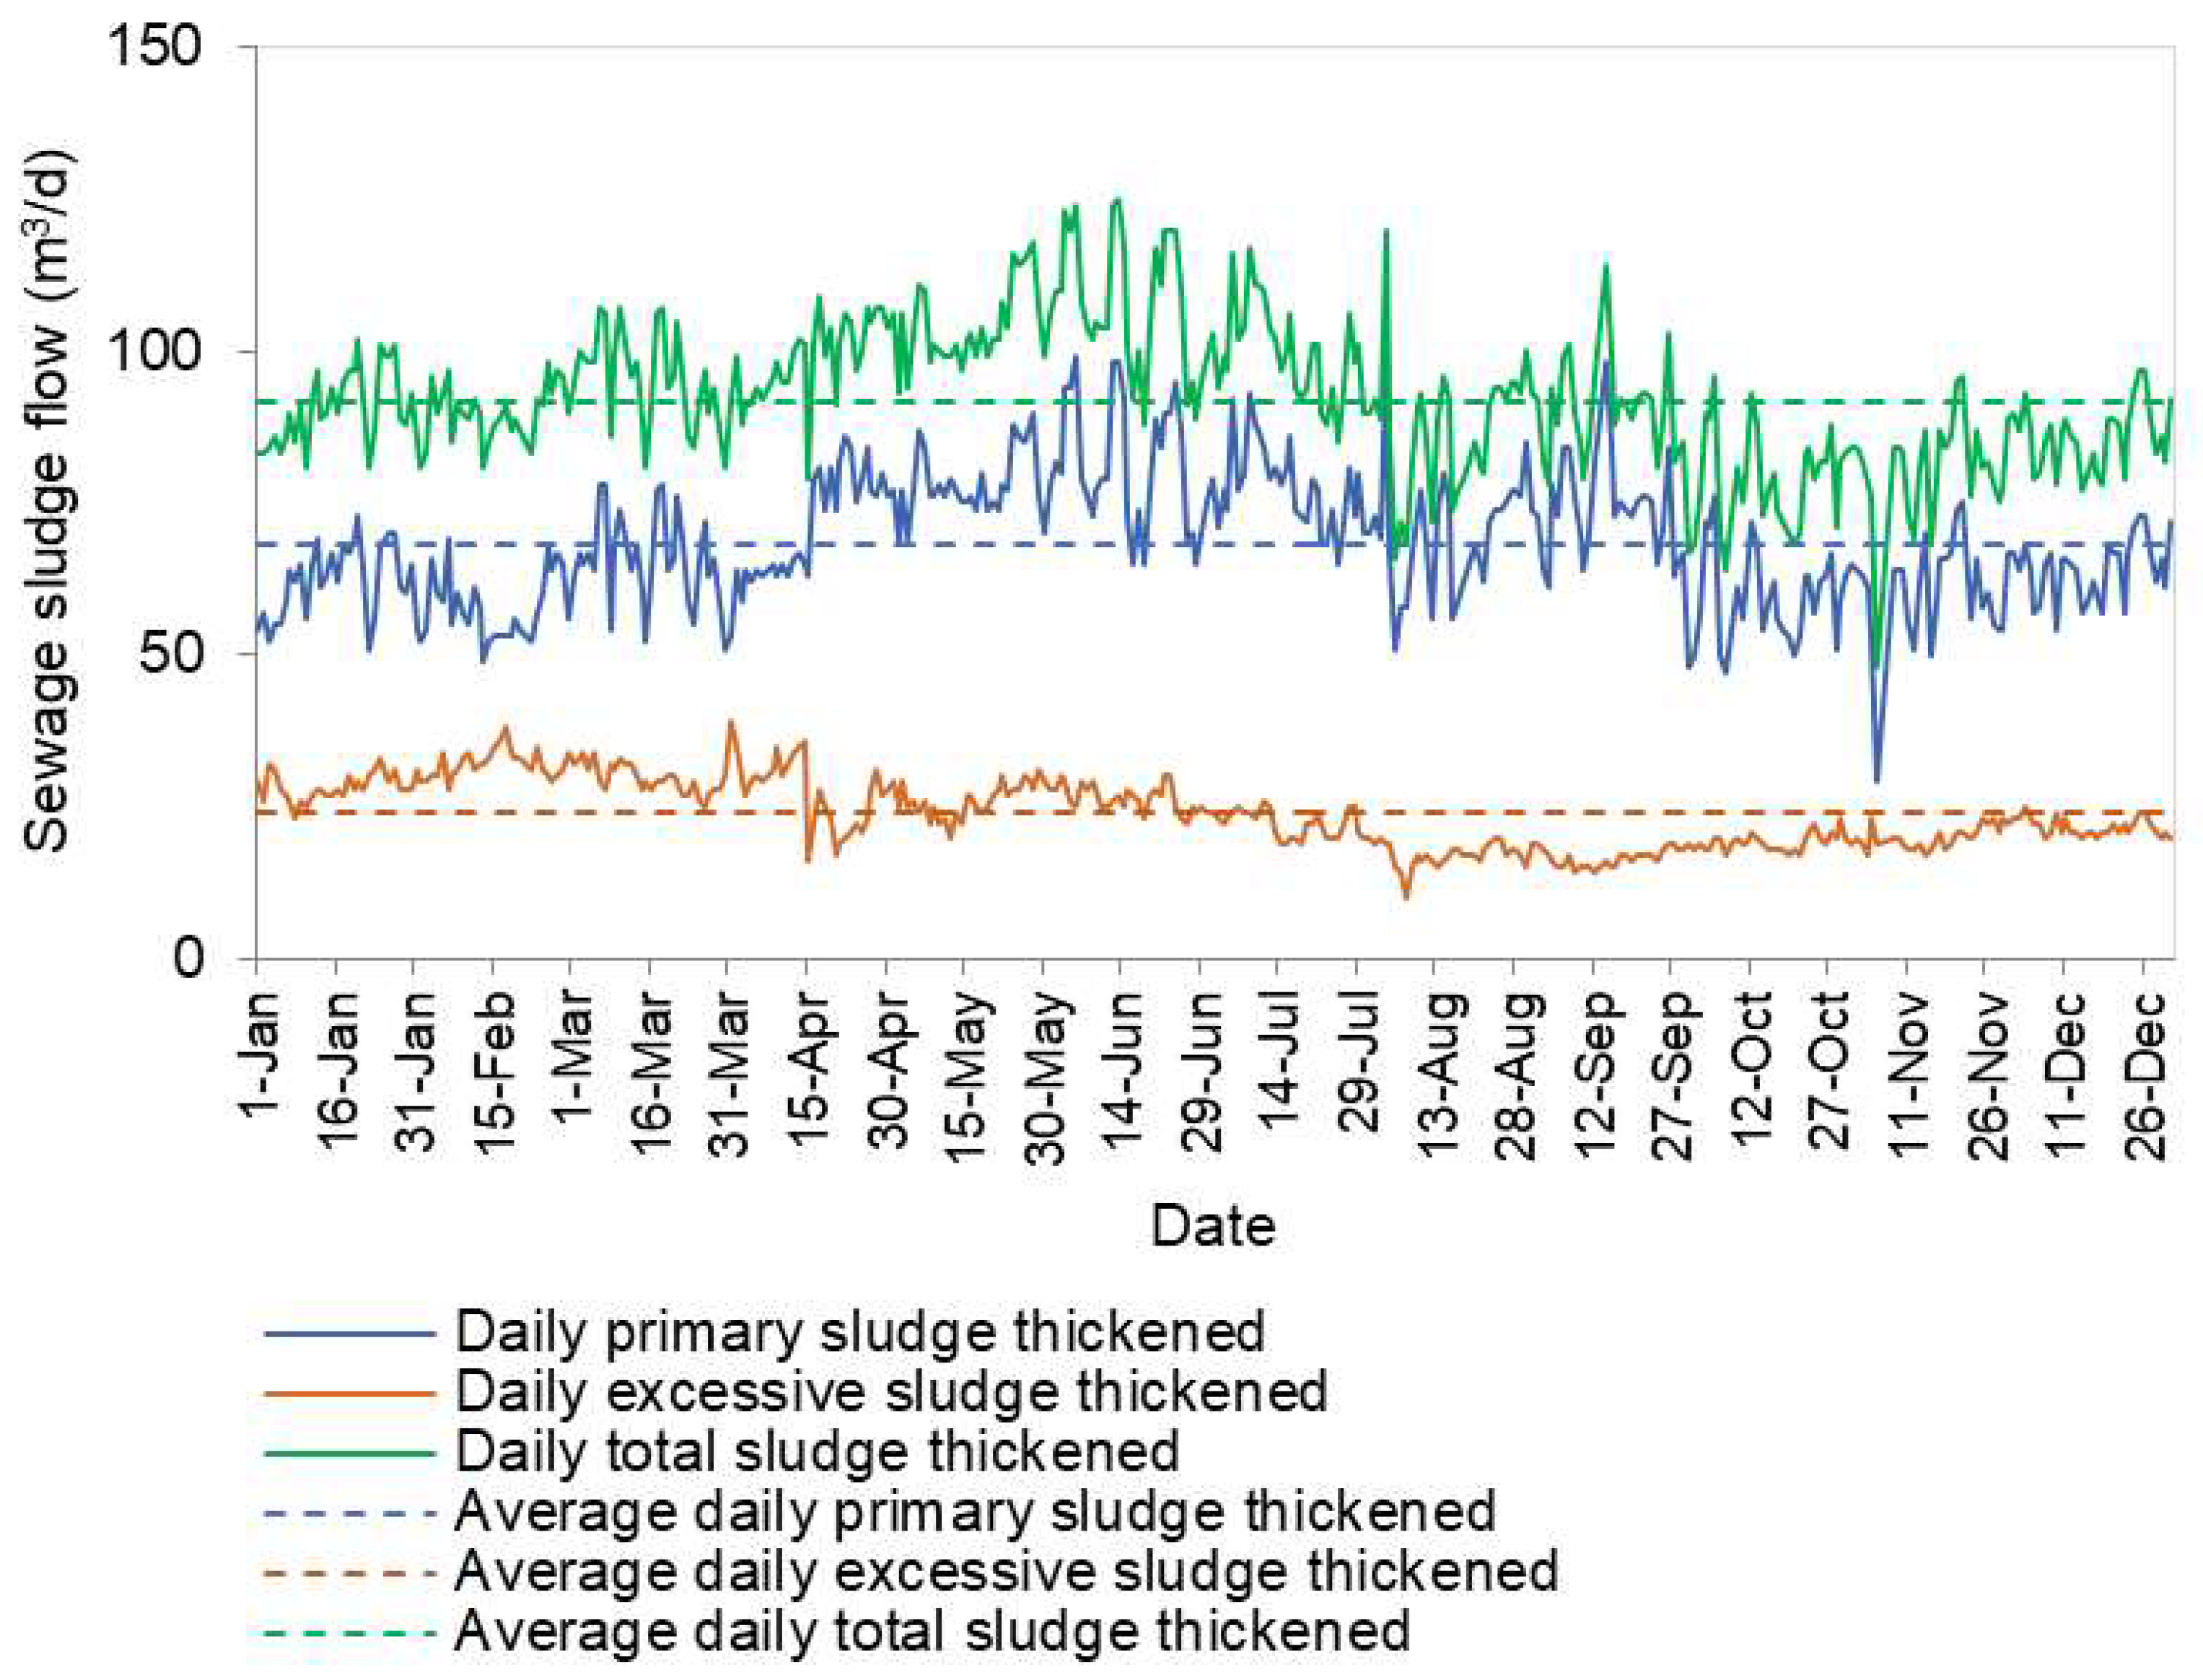
The daily volumes of thickened sewage sludge discharged in 2024, including primary sludge and excessive sludge, along with the average values, are shown in Figure 2. The volume of primary sludge was approximately three times greater than that of excessive sludge (Figure 2, Table 1). It was noted that in 2024, the volume of primary thickened sludge varied from 29.0 m3/d to 101.0 m3/d, reaching an average value of 68.0 m3/d, while the minimum volume of excessive sludge was 10.0 m3/d and the maximum was 39.0 m3/d, with an average value of 24.0 m3/d. The performed statistical analysis allowed us to state that both primary sludge and excessive sludge were discharged in relatively uniform daily amounts throughout the year (low variability), as evidenced by the calculated CV values of 0.16 for primary sludge, 0.23 for excessive sludge and 0.13 for the total amount of discharged sludge (Table 1). Additionally, the calculated values of kurtosis (Kurt) and skewness (Sk) summarized in Table 1 allow us to characterize the shape and symmetry of the variable distribution: the higher the kurtosis, the greater the concentration of results around the average value; with skewness above zero, values below the average predominate, while with skewness below zero, values above the average predominate.
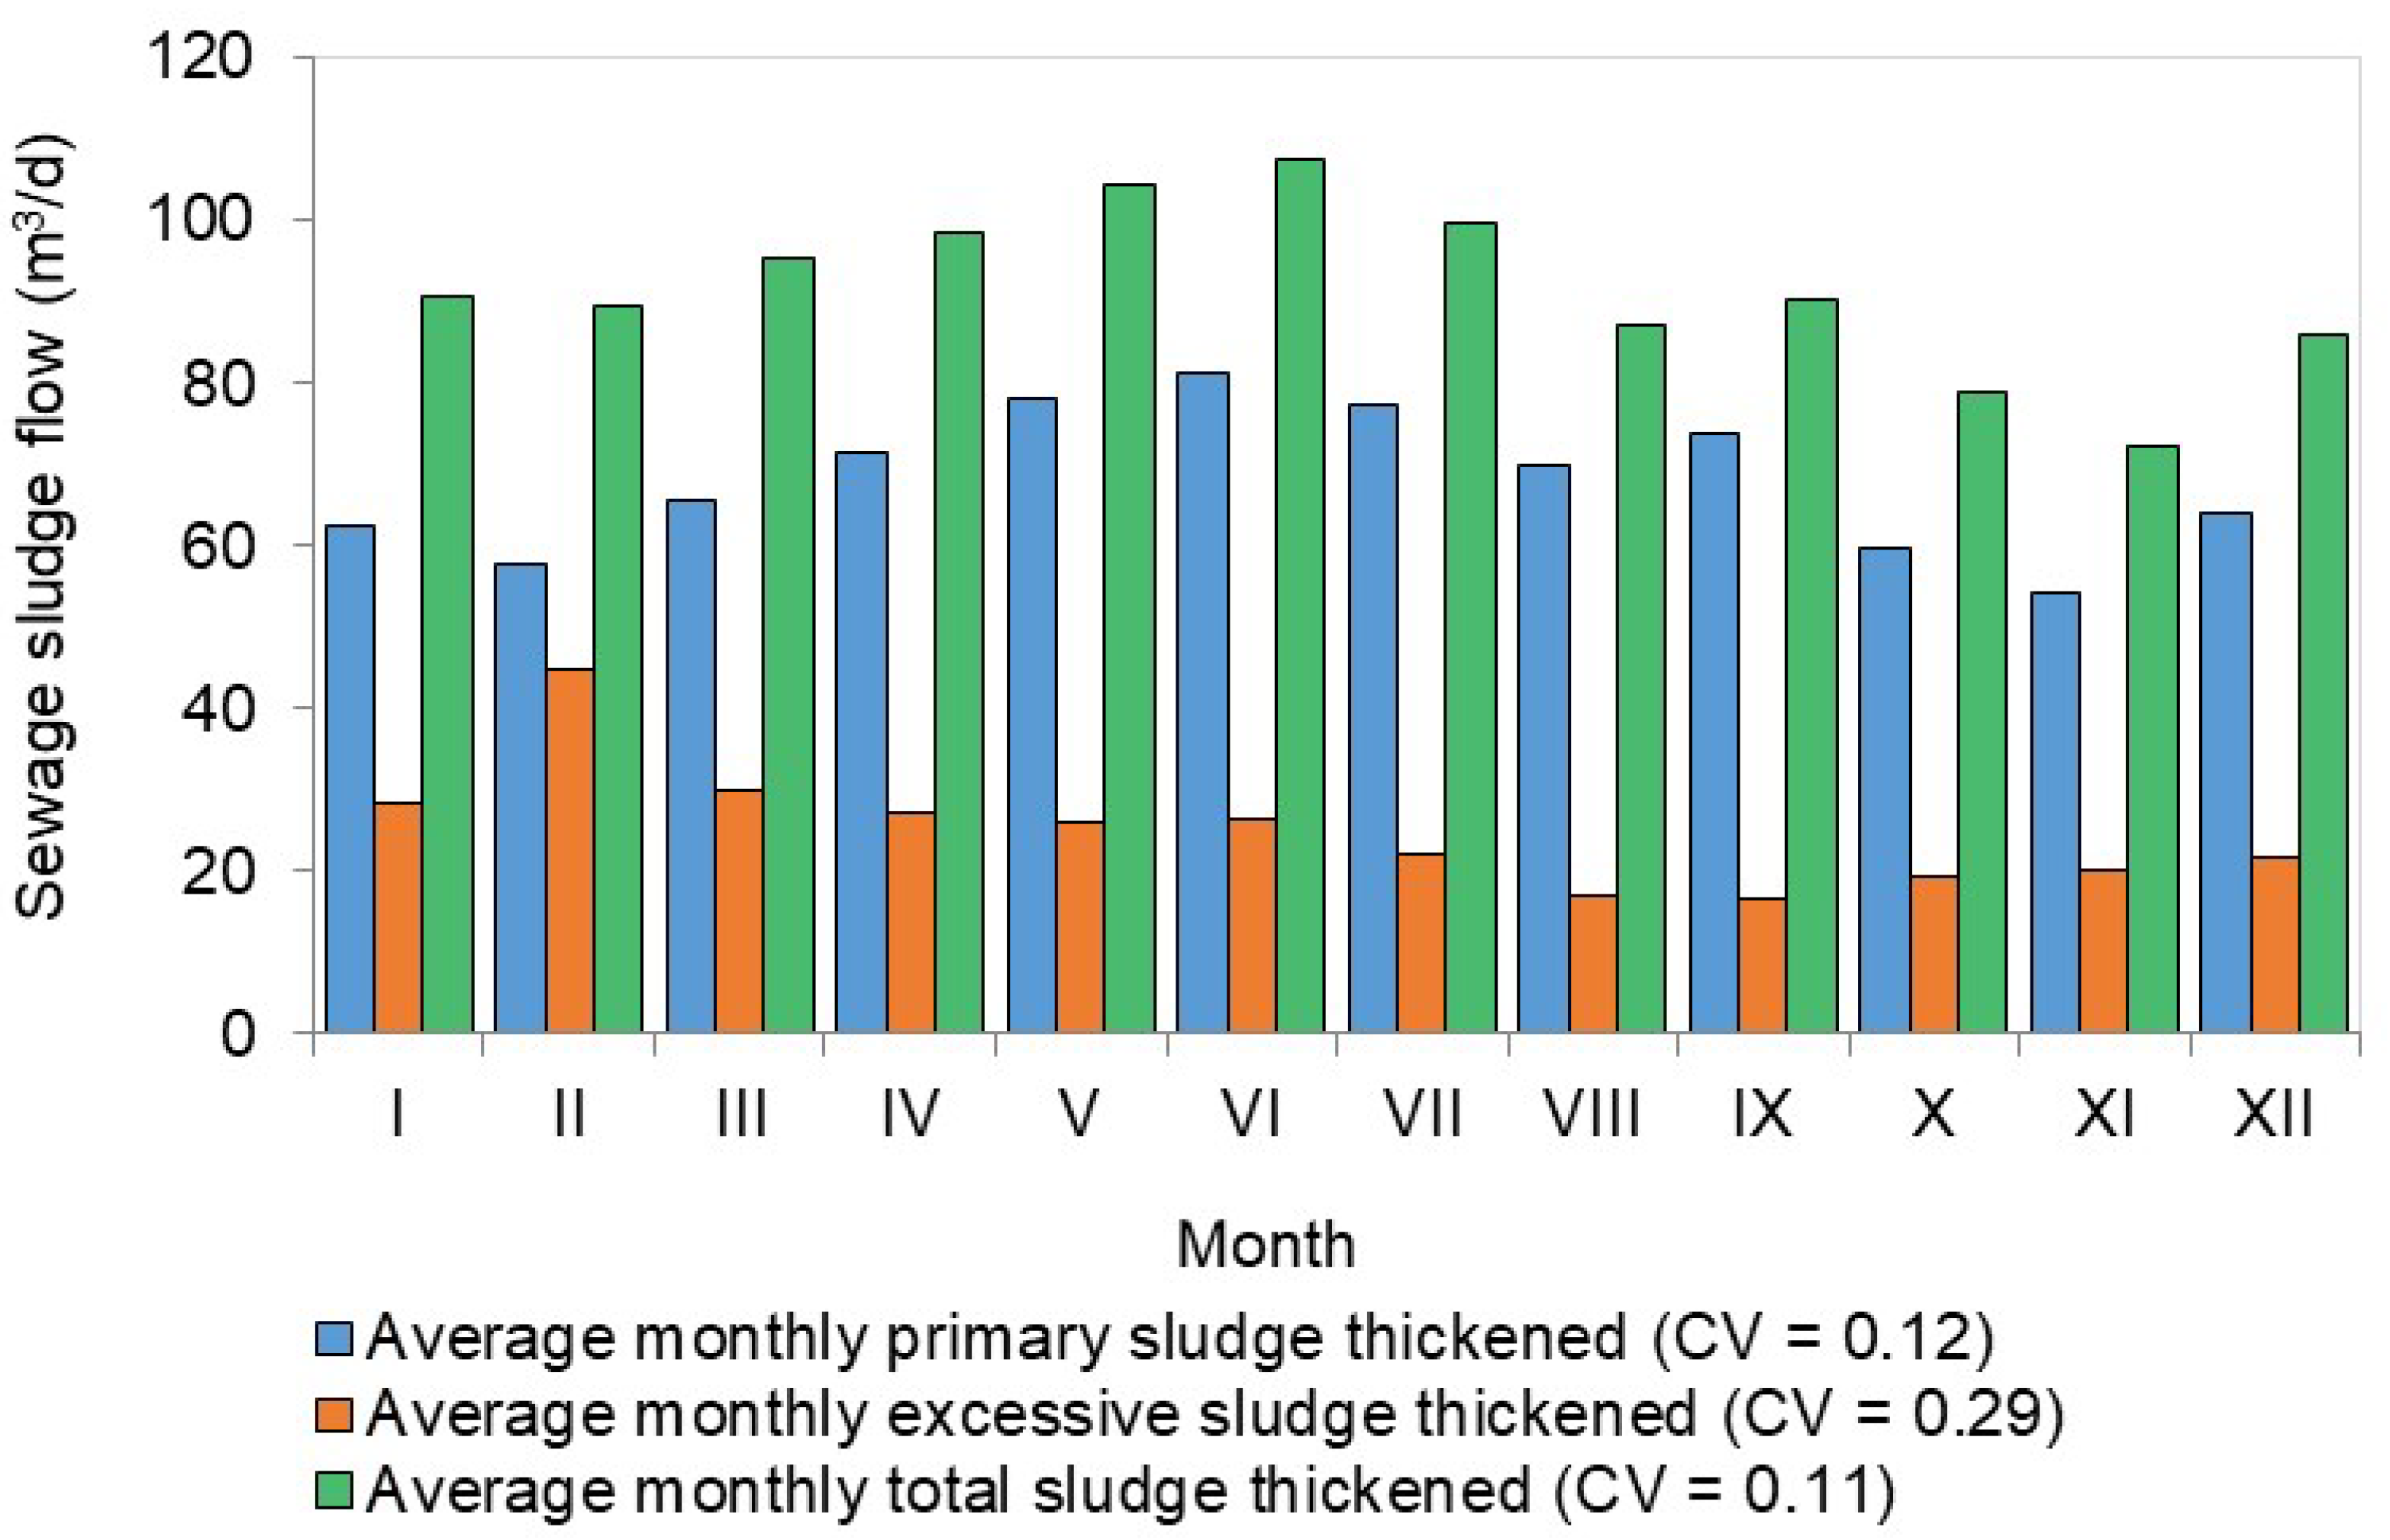
The study also analyzed the amount of sludge discharged in different months (Figure 3). For thickened primary sludge, the lowest monthly average value was 57.6 m3/d (February) and the highest monthly average value was 81.3 m3/d (June). For excessive thickened sludge, the lowest average value was 16.5 m3/d in September and the highest was 44.8 m3/d in February. In turn, the lowest average monthly volume of jointly discharged primary sludge and excessive sludge (i.e., total thickened sludge) was 78.9 m3/d (October) and the highest was 107.7 m3/d (June). The analysis shows that individual months differed slightly in the volume of discharged sludge, as indicated by the calculated CV values, ranging from 0.11 to 0.29 (Figure 3). Additionally, Table 2 provides a detailed summary of basic descriptive statistics for daily amounts of discharged sludge in individual months of 2024. In Table 2, it can be seen, among other information, that within the individual months, the daily volumes of discharged sludge were characterized by low variability: for primary thickened sludge, the CV values ranged from 0.07 (May) to 0.16 (November), for excessive thickened sludge, the CV values ranged from 0.05 (February) to 0.20 (April), and for the total amount of discharged sludge, the CV values ranged from 0.05 (February) to 0.12 (August).

3.2. Analysis of Biogas Produced

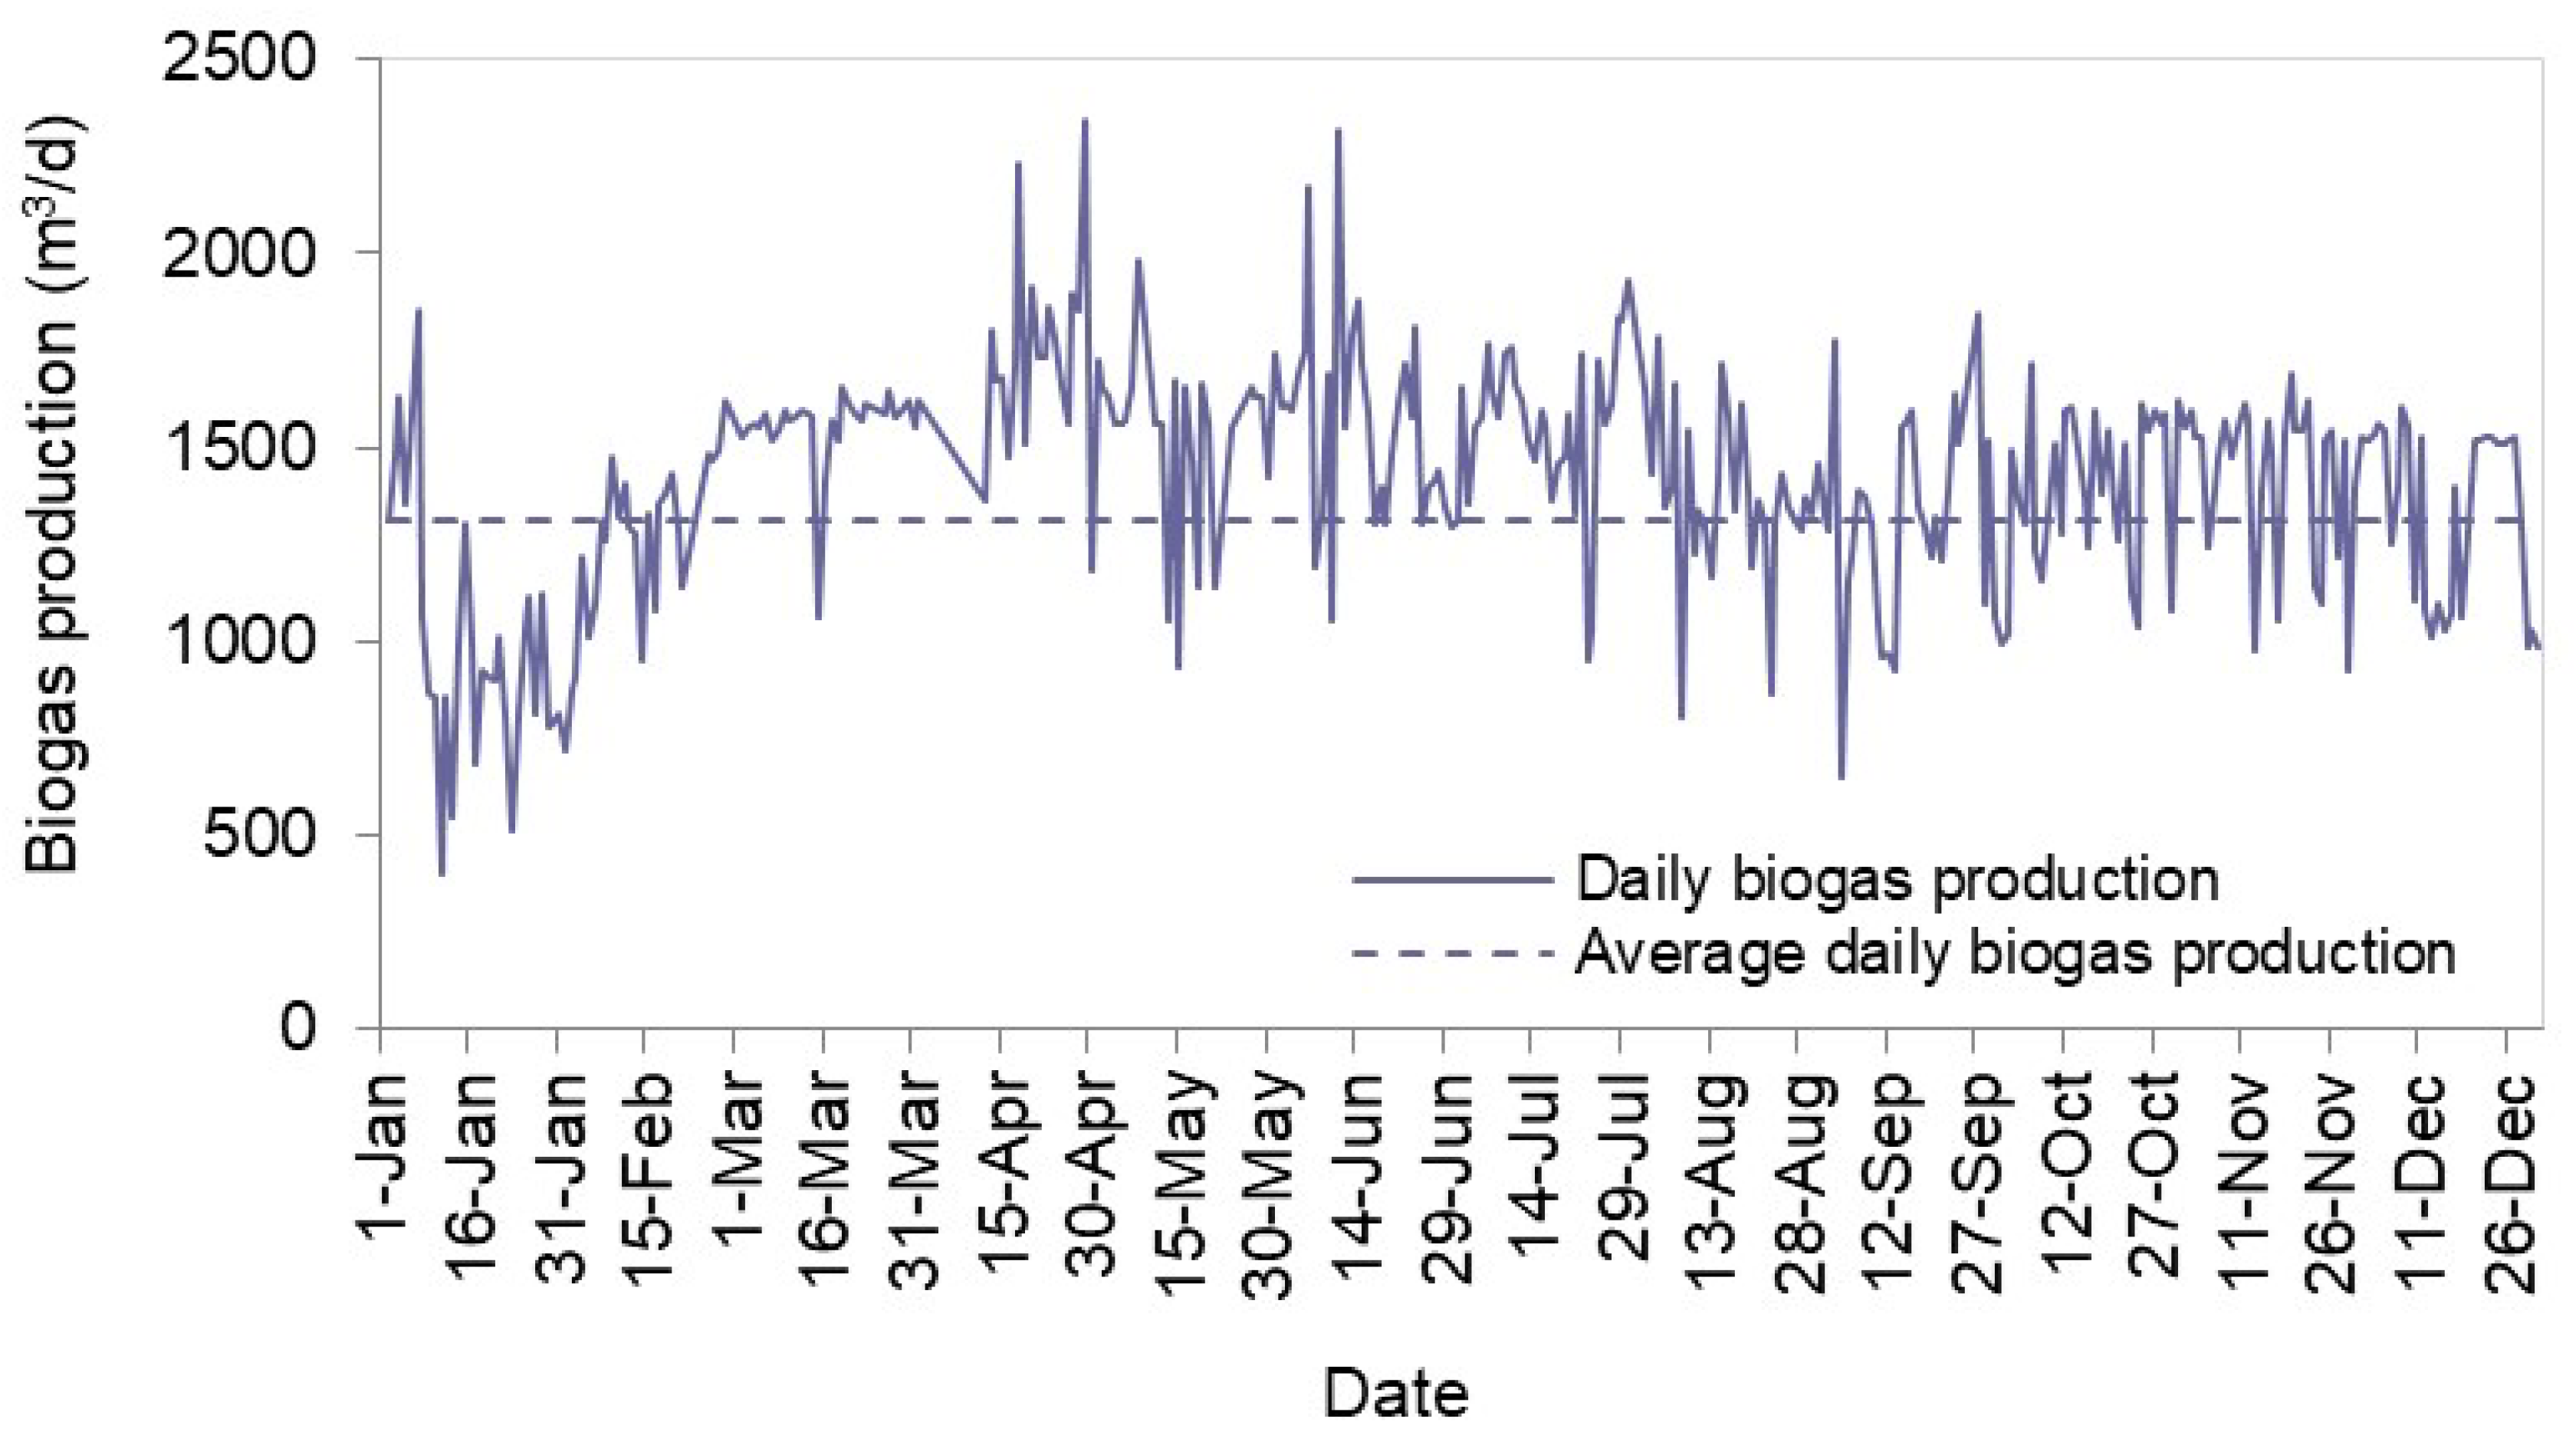
At the studied WWTP, average daily biogas production in 2024 was approximately 1300.00 m3/d (Figure 4, Table 3). The graph in Figure 4 shows that the recorded daily biogas production values were most often higher than the average value but did not exceed 2500 m3/d. According to the rules for the CV interpretation, the value of 0.22 for daily biogas production in 2024 (Table 3) indicates low variability but tends towards moderate variability.
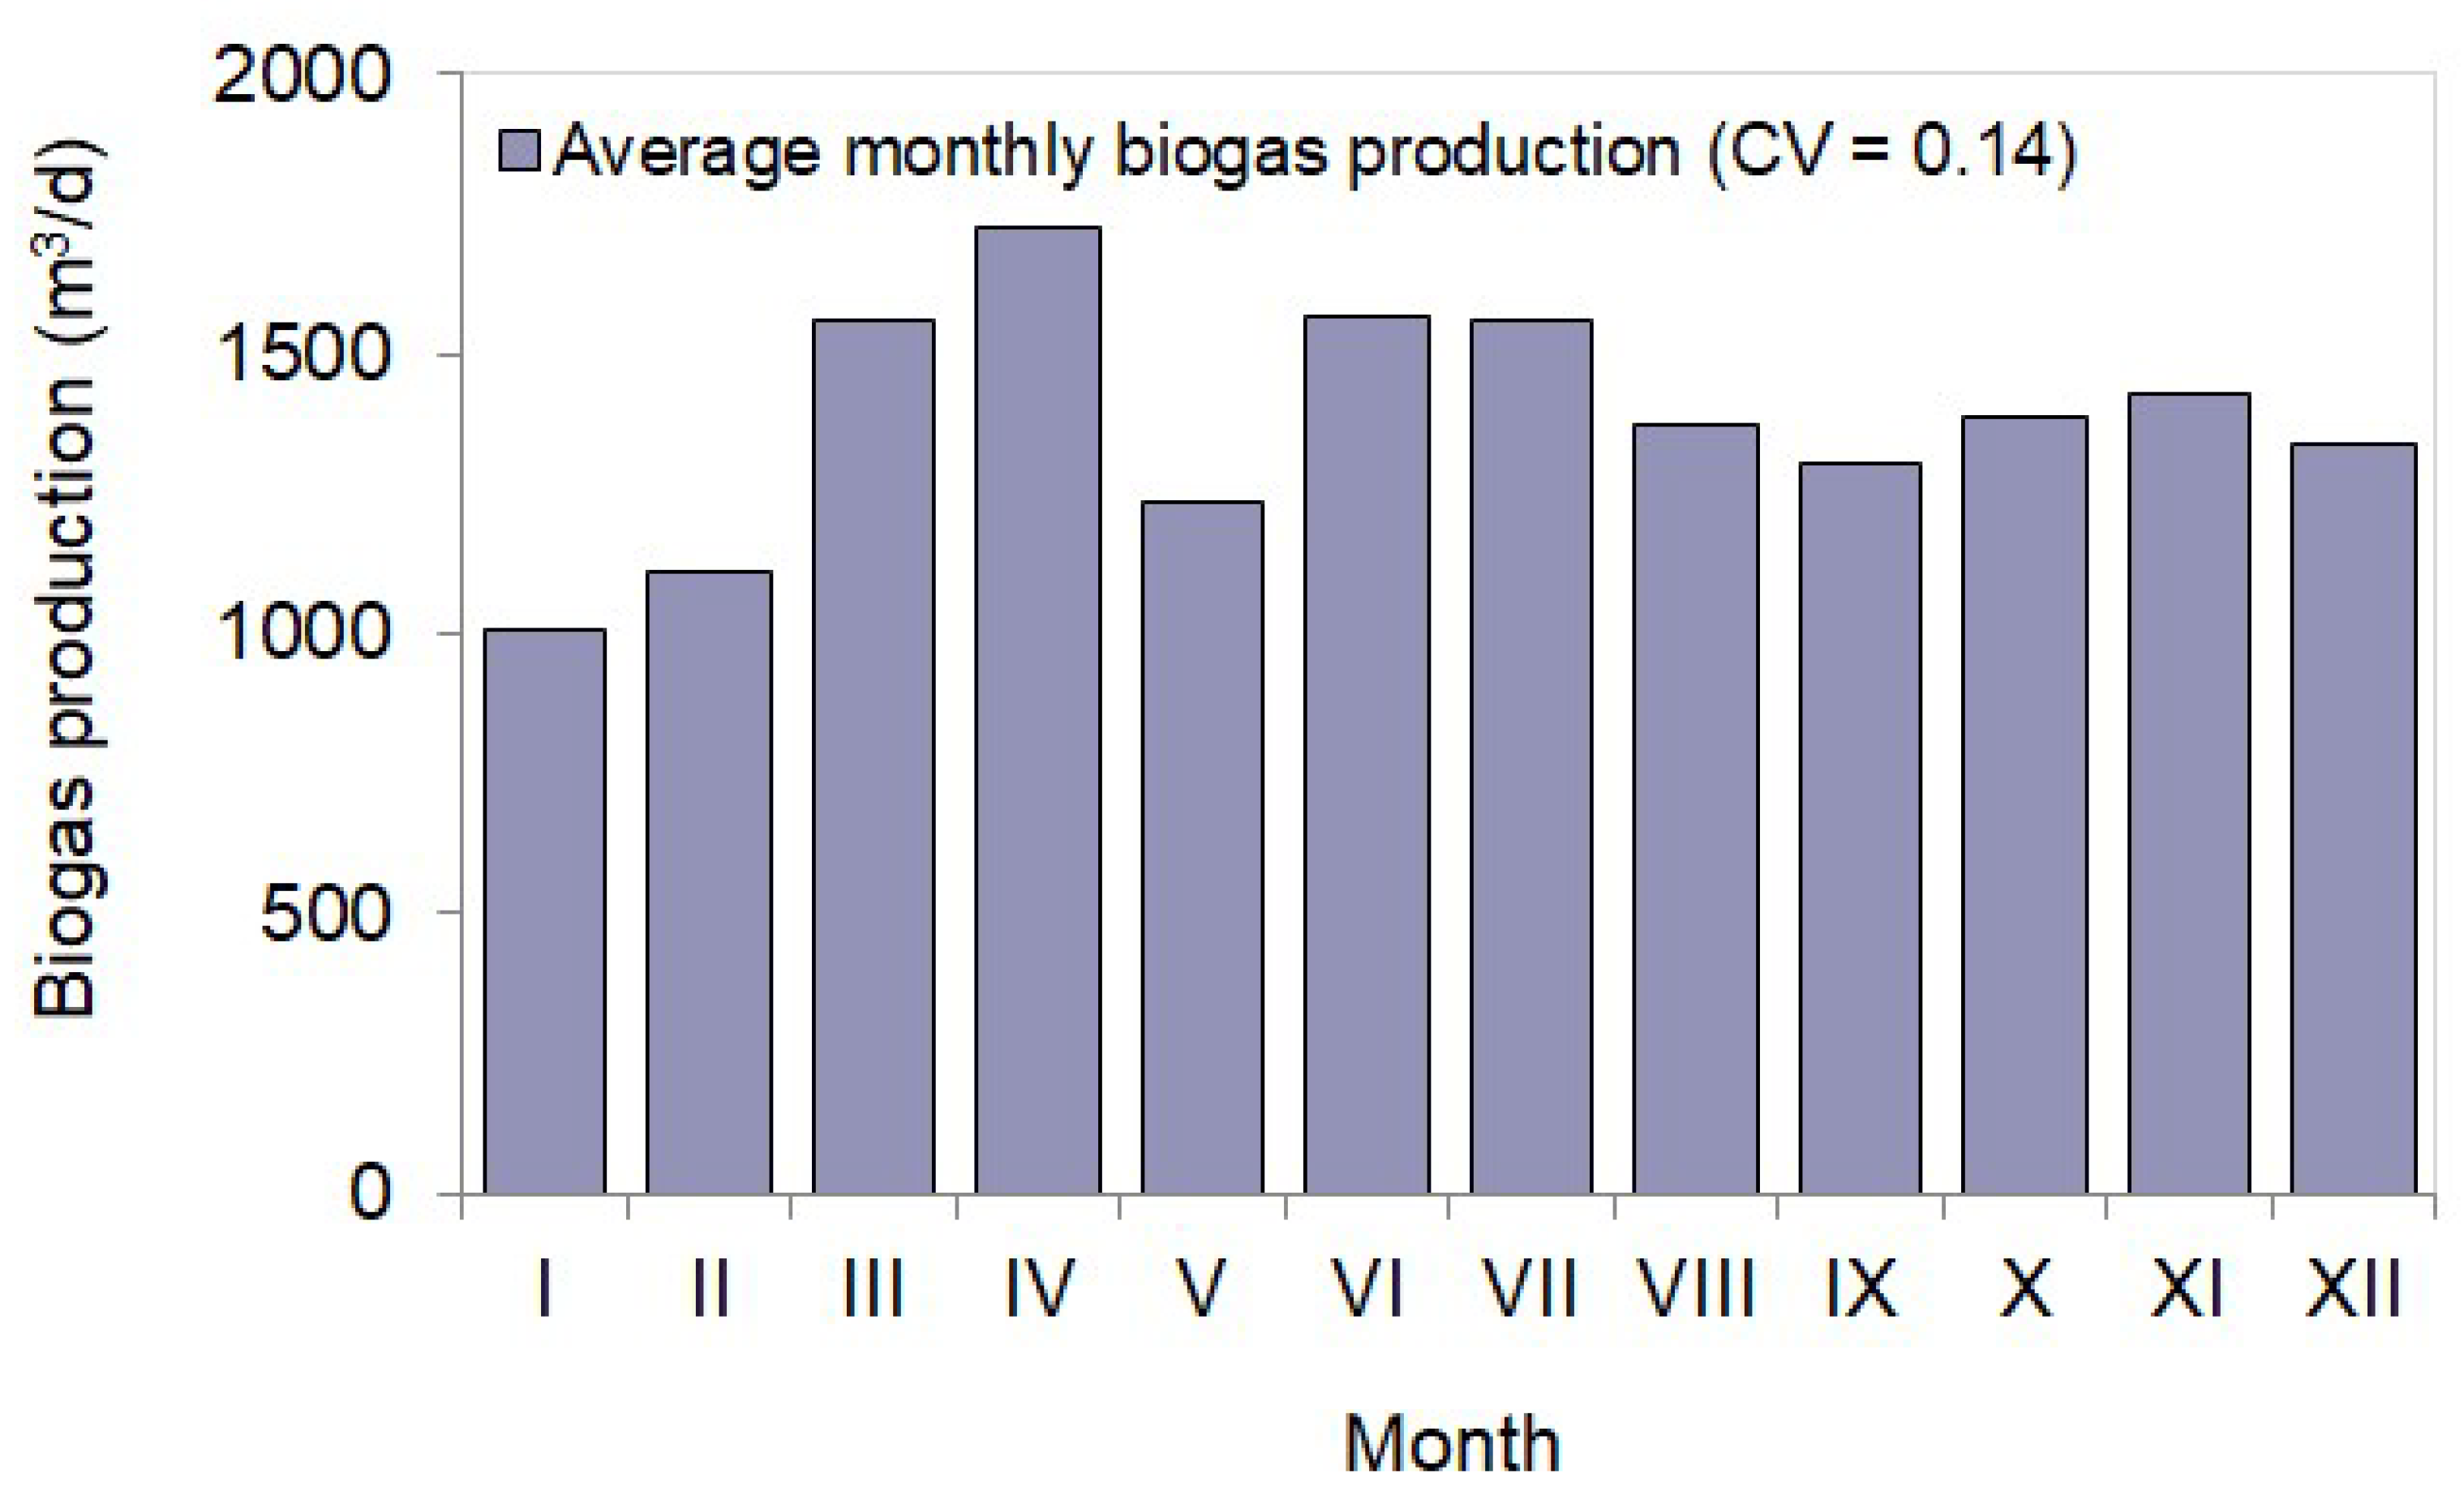
The analysis of daily biogas production for individual months of 2024 also shows that biogas production remained stable (CV = 0.14 indicates low variability) (Figure 5). The lowest average value occurred in January (1004.25 m3/d), while the highest average value was recorded in April (1727.86 m3/d).
The results summarized in Table 4 indicate that within individual months, daily biogas production was characterized by variability ranging from low (CV = 0.07 in March) to moderate (CV = 0.33 in January). Other descriptive statistics for daily biogas production in individual months of 2024 are presented in Table 4.
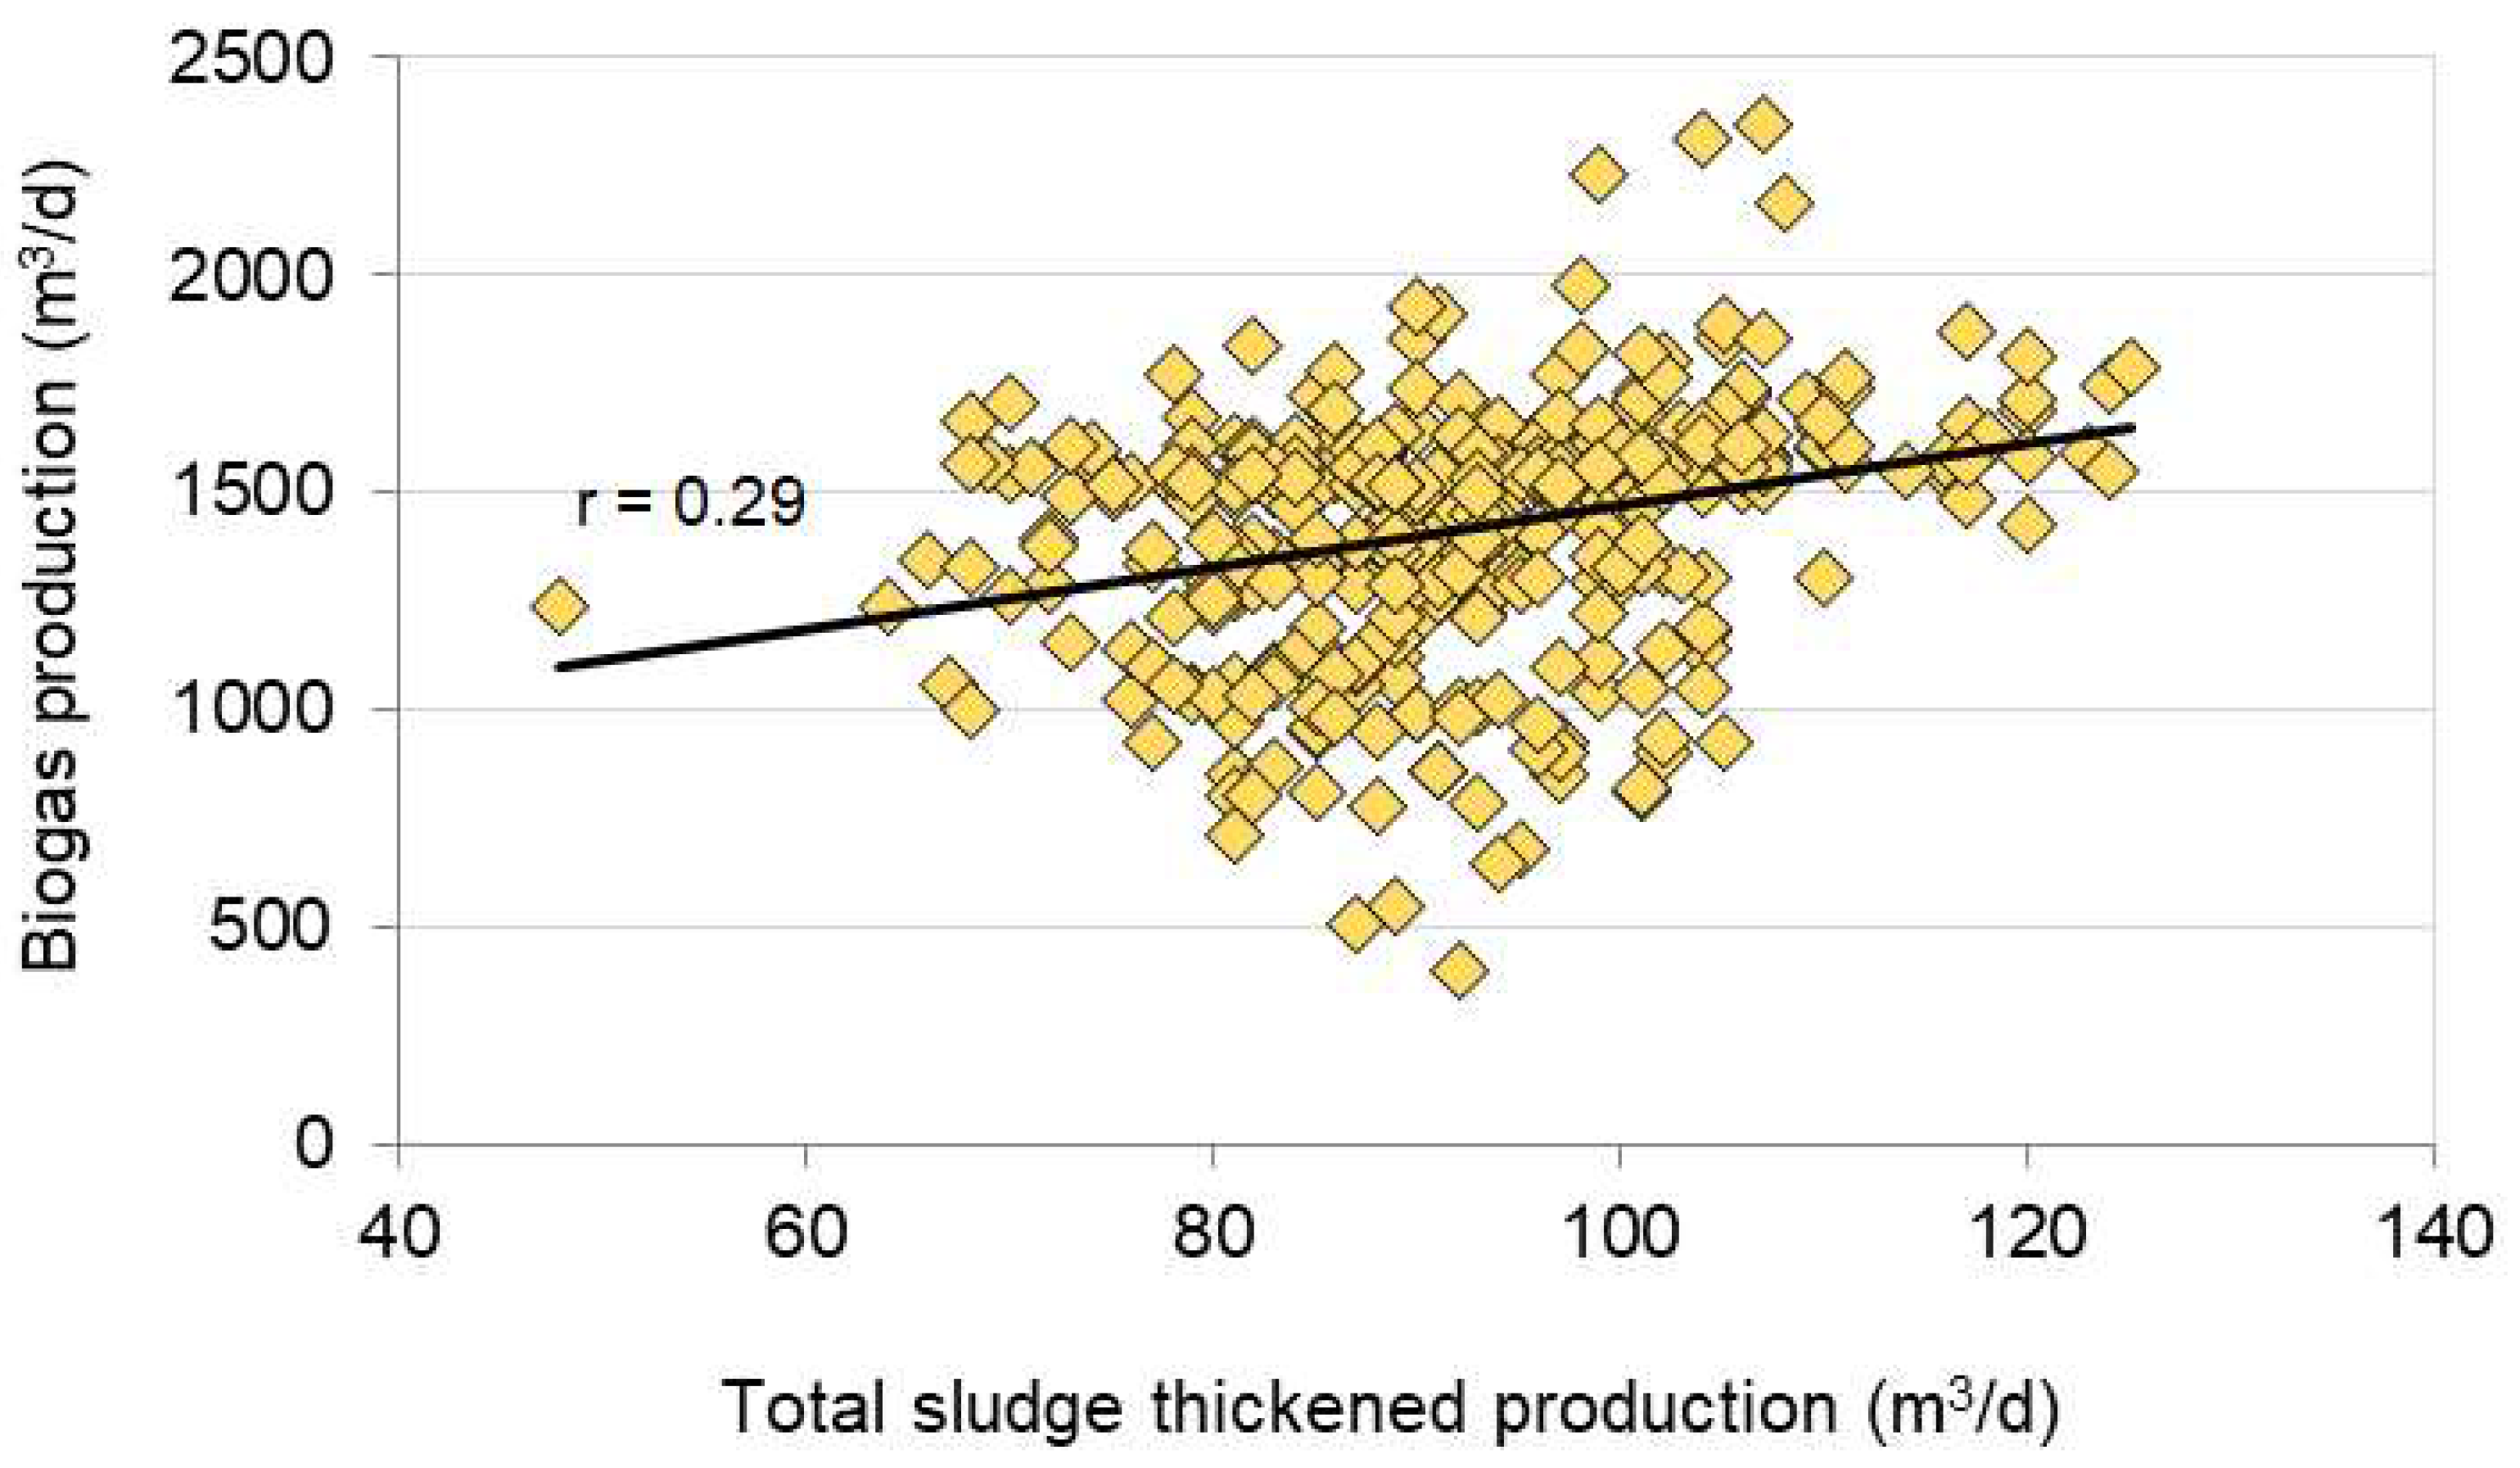
Because biogas is produced from the total thickened sludge, as a part of this study, the relationship between the total sludge produced (i.e., jointly primary thickened sludge and excessive thickened sludge) and daily biogas production was examined. The graph in Figure 6 shows a positive correlation between the variables, i.e., as the amount of sludge discharged increases, the amount of biogas produced also increases. However, based on the determined value of the correlation coefficient r = 0.29 (Figure 6), it can be concluded that there is a weak correlation between the amount of discharged sludge and the amount of biogas produced.
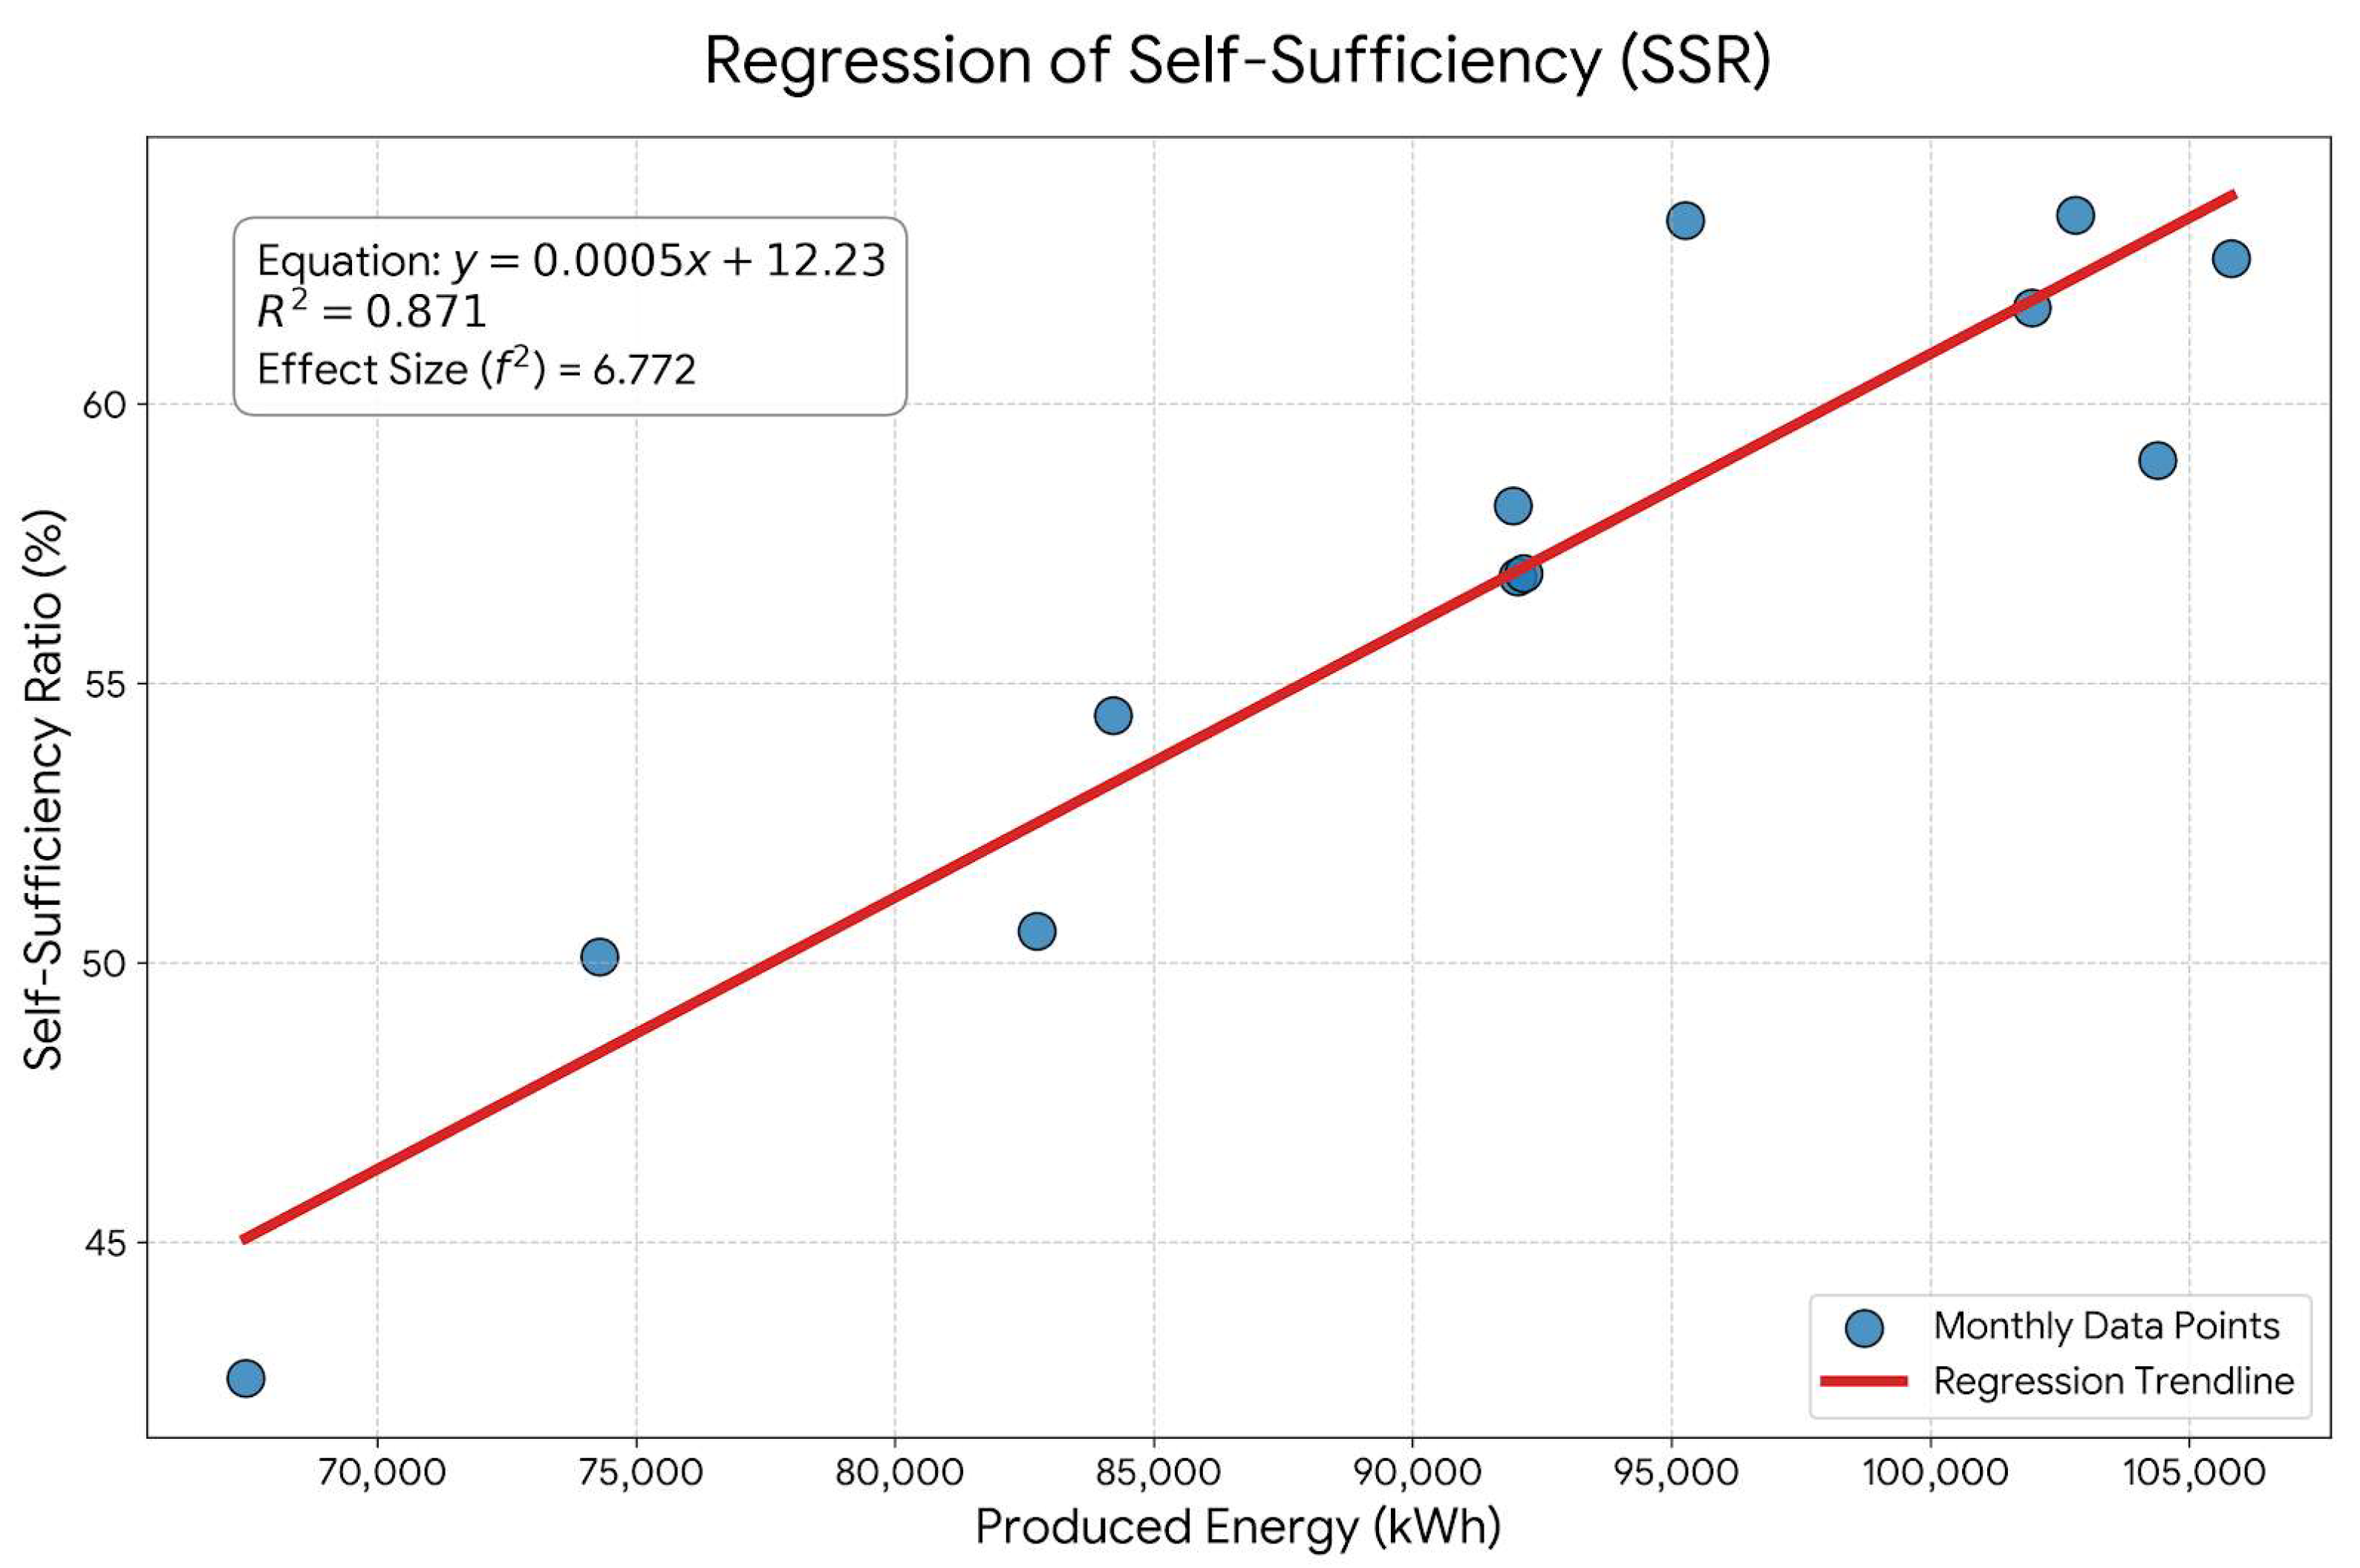
The analysis revealed a total annual production of 1,095,047 kWh, meeting 56.72% of the facility’s total energy demand. The statistical model for self-sufficiency showed a high coefficient of determination (R2 = 0.871), proving a nearly perfect linear relationship between production levels and grid independence (Figure 7).
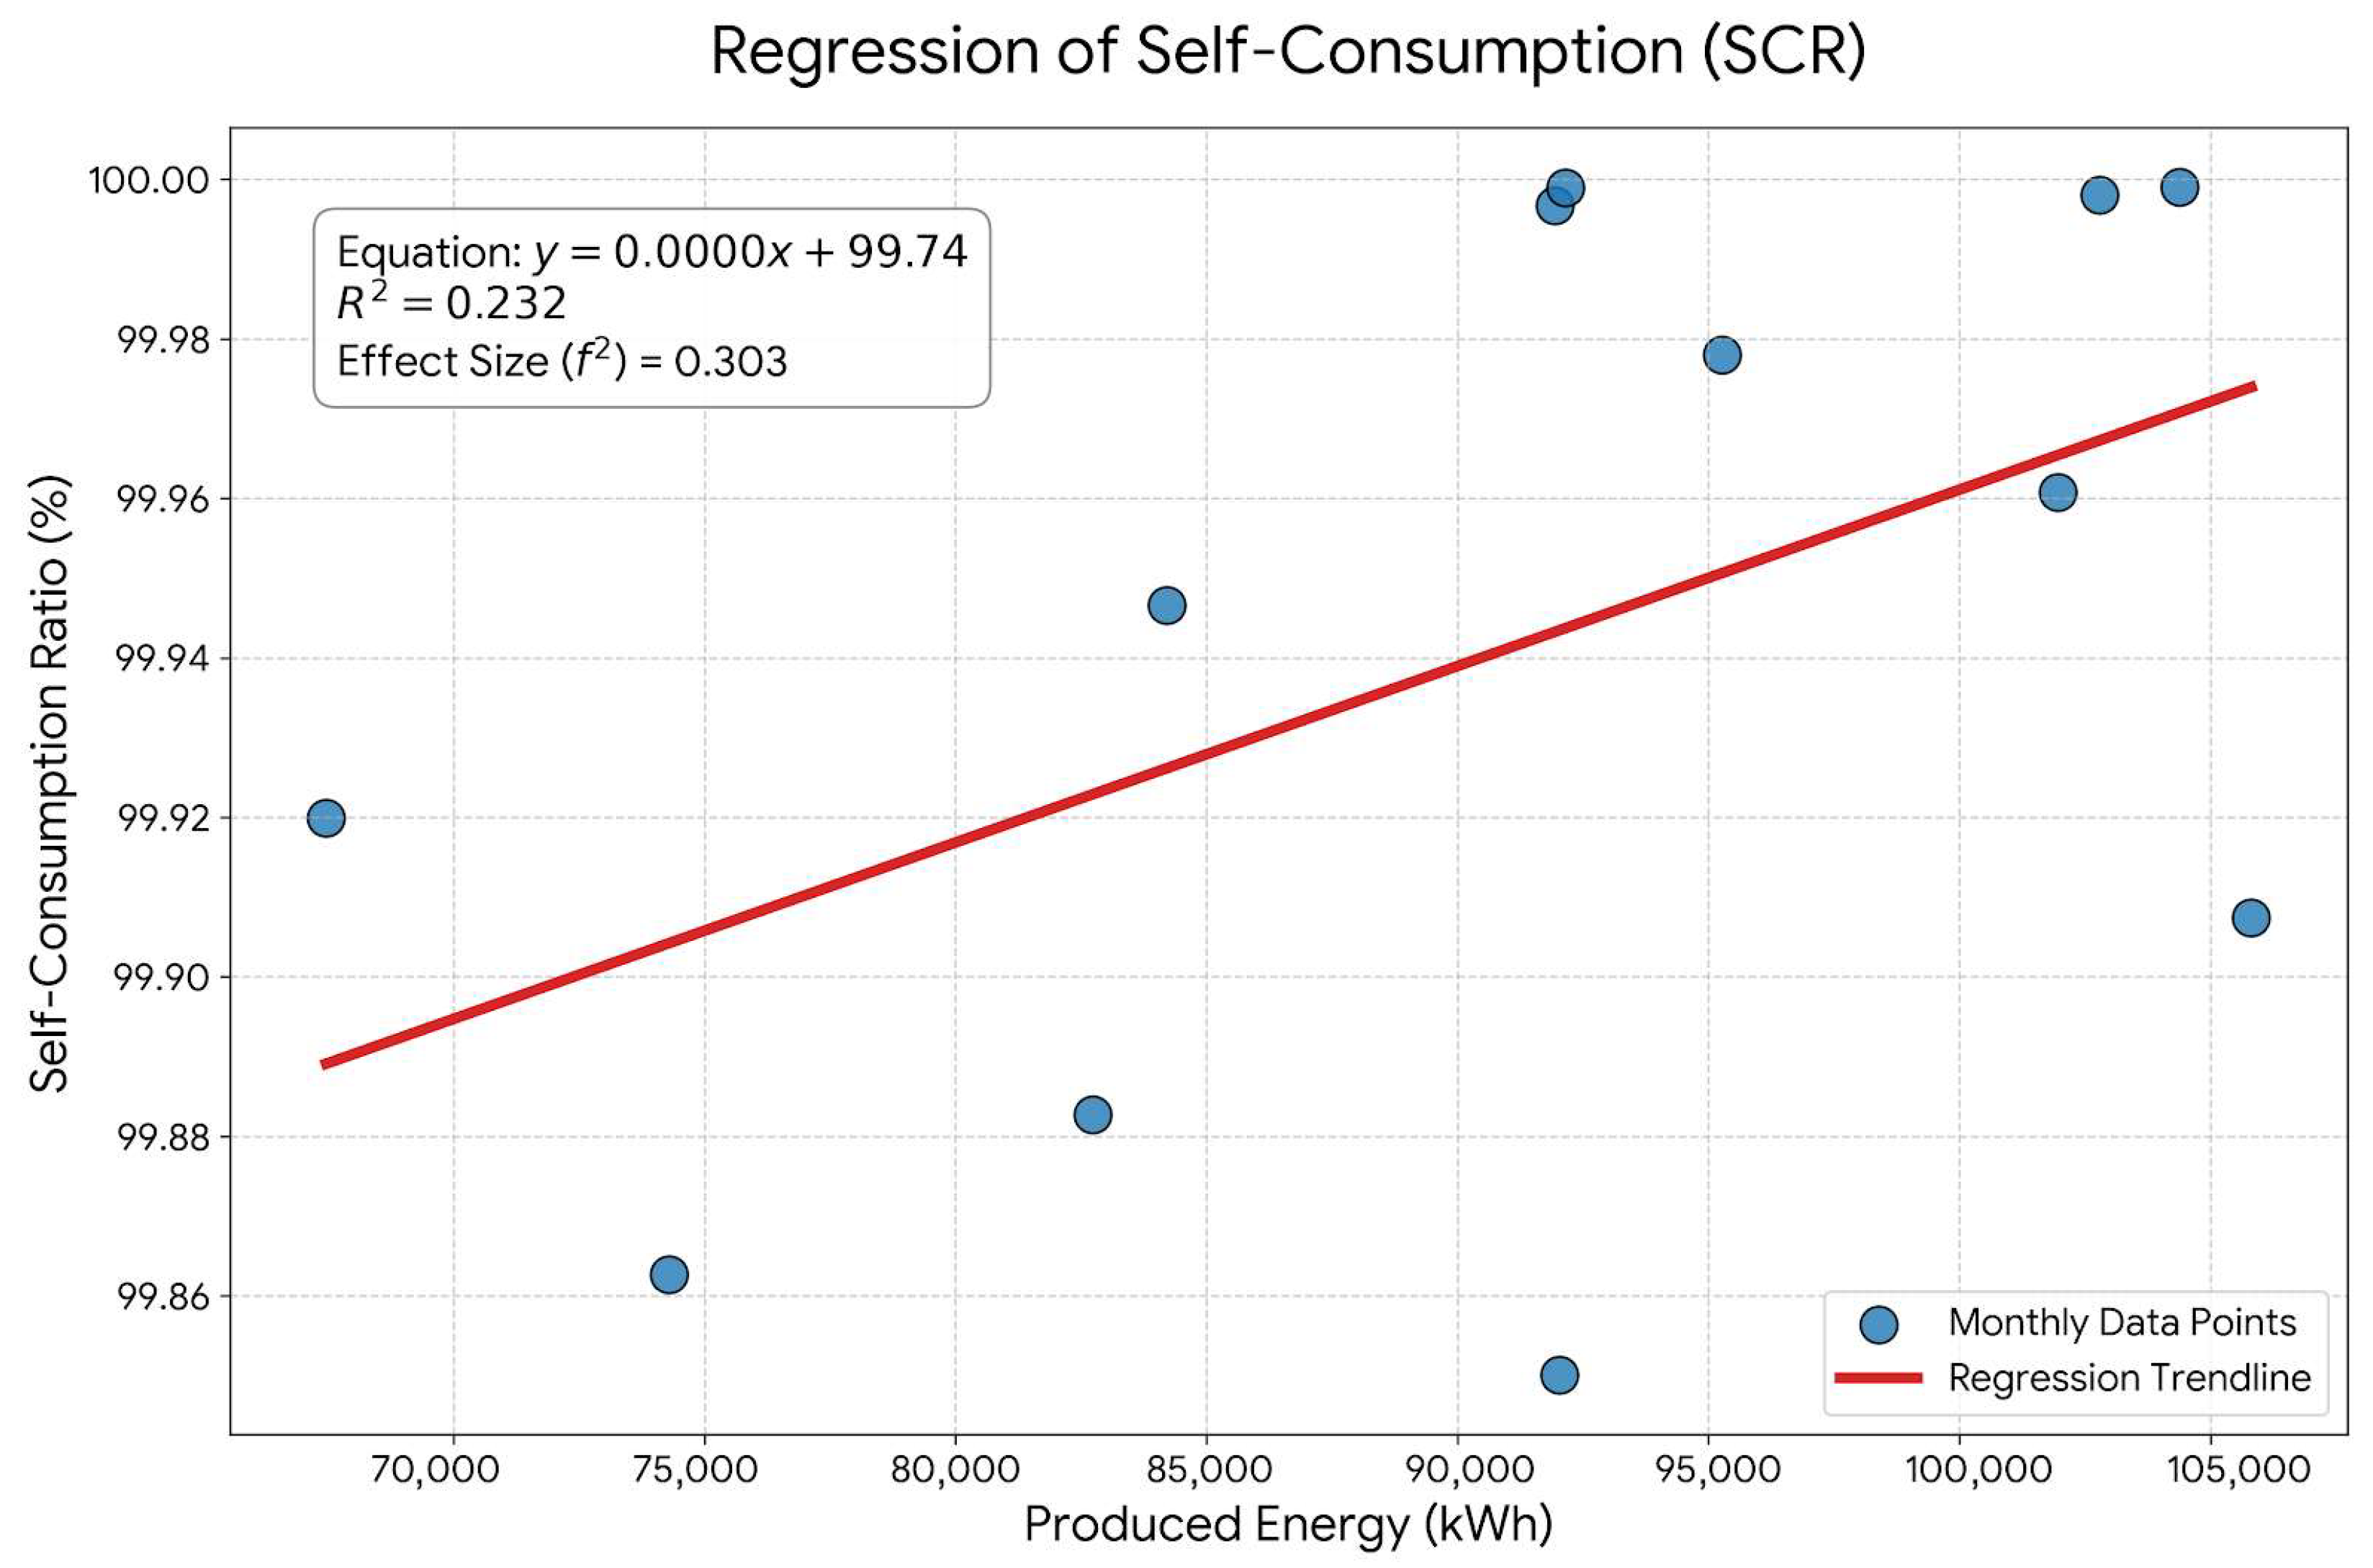
The regression analysis yielded an equation with an R-squared (R2) value of 0.232 and a moderate effect size (f2) of 0.303. The data points remain concentrated in the high-efficiency zone, ranging between 99.85% and 100% self-consumption regardless of whether production was 70,000 kWh or over 100,000 kWh (Figure 8).
The correlation matrix (Figure 9) reveals a very strong negative relationship between cogenerator and boiler usage (r = −0.85), while biogas production shows a significant positive correlation with heat output (r = 0.66).
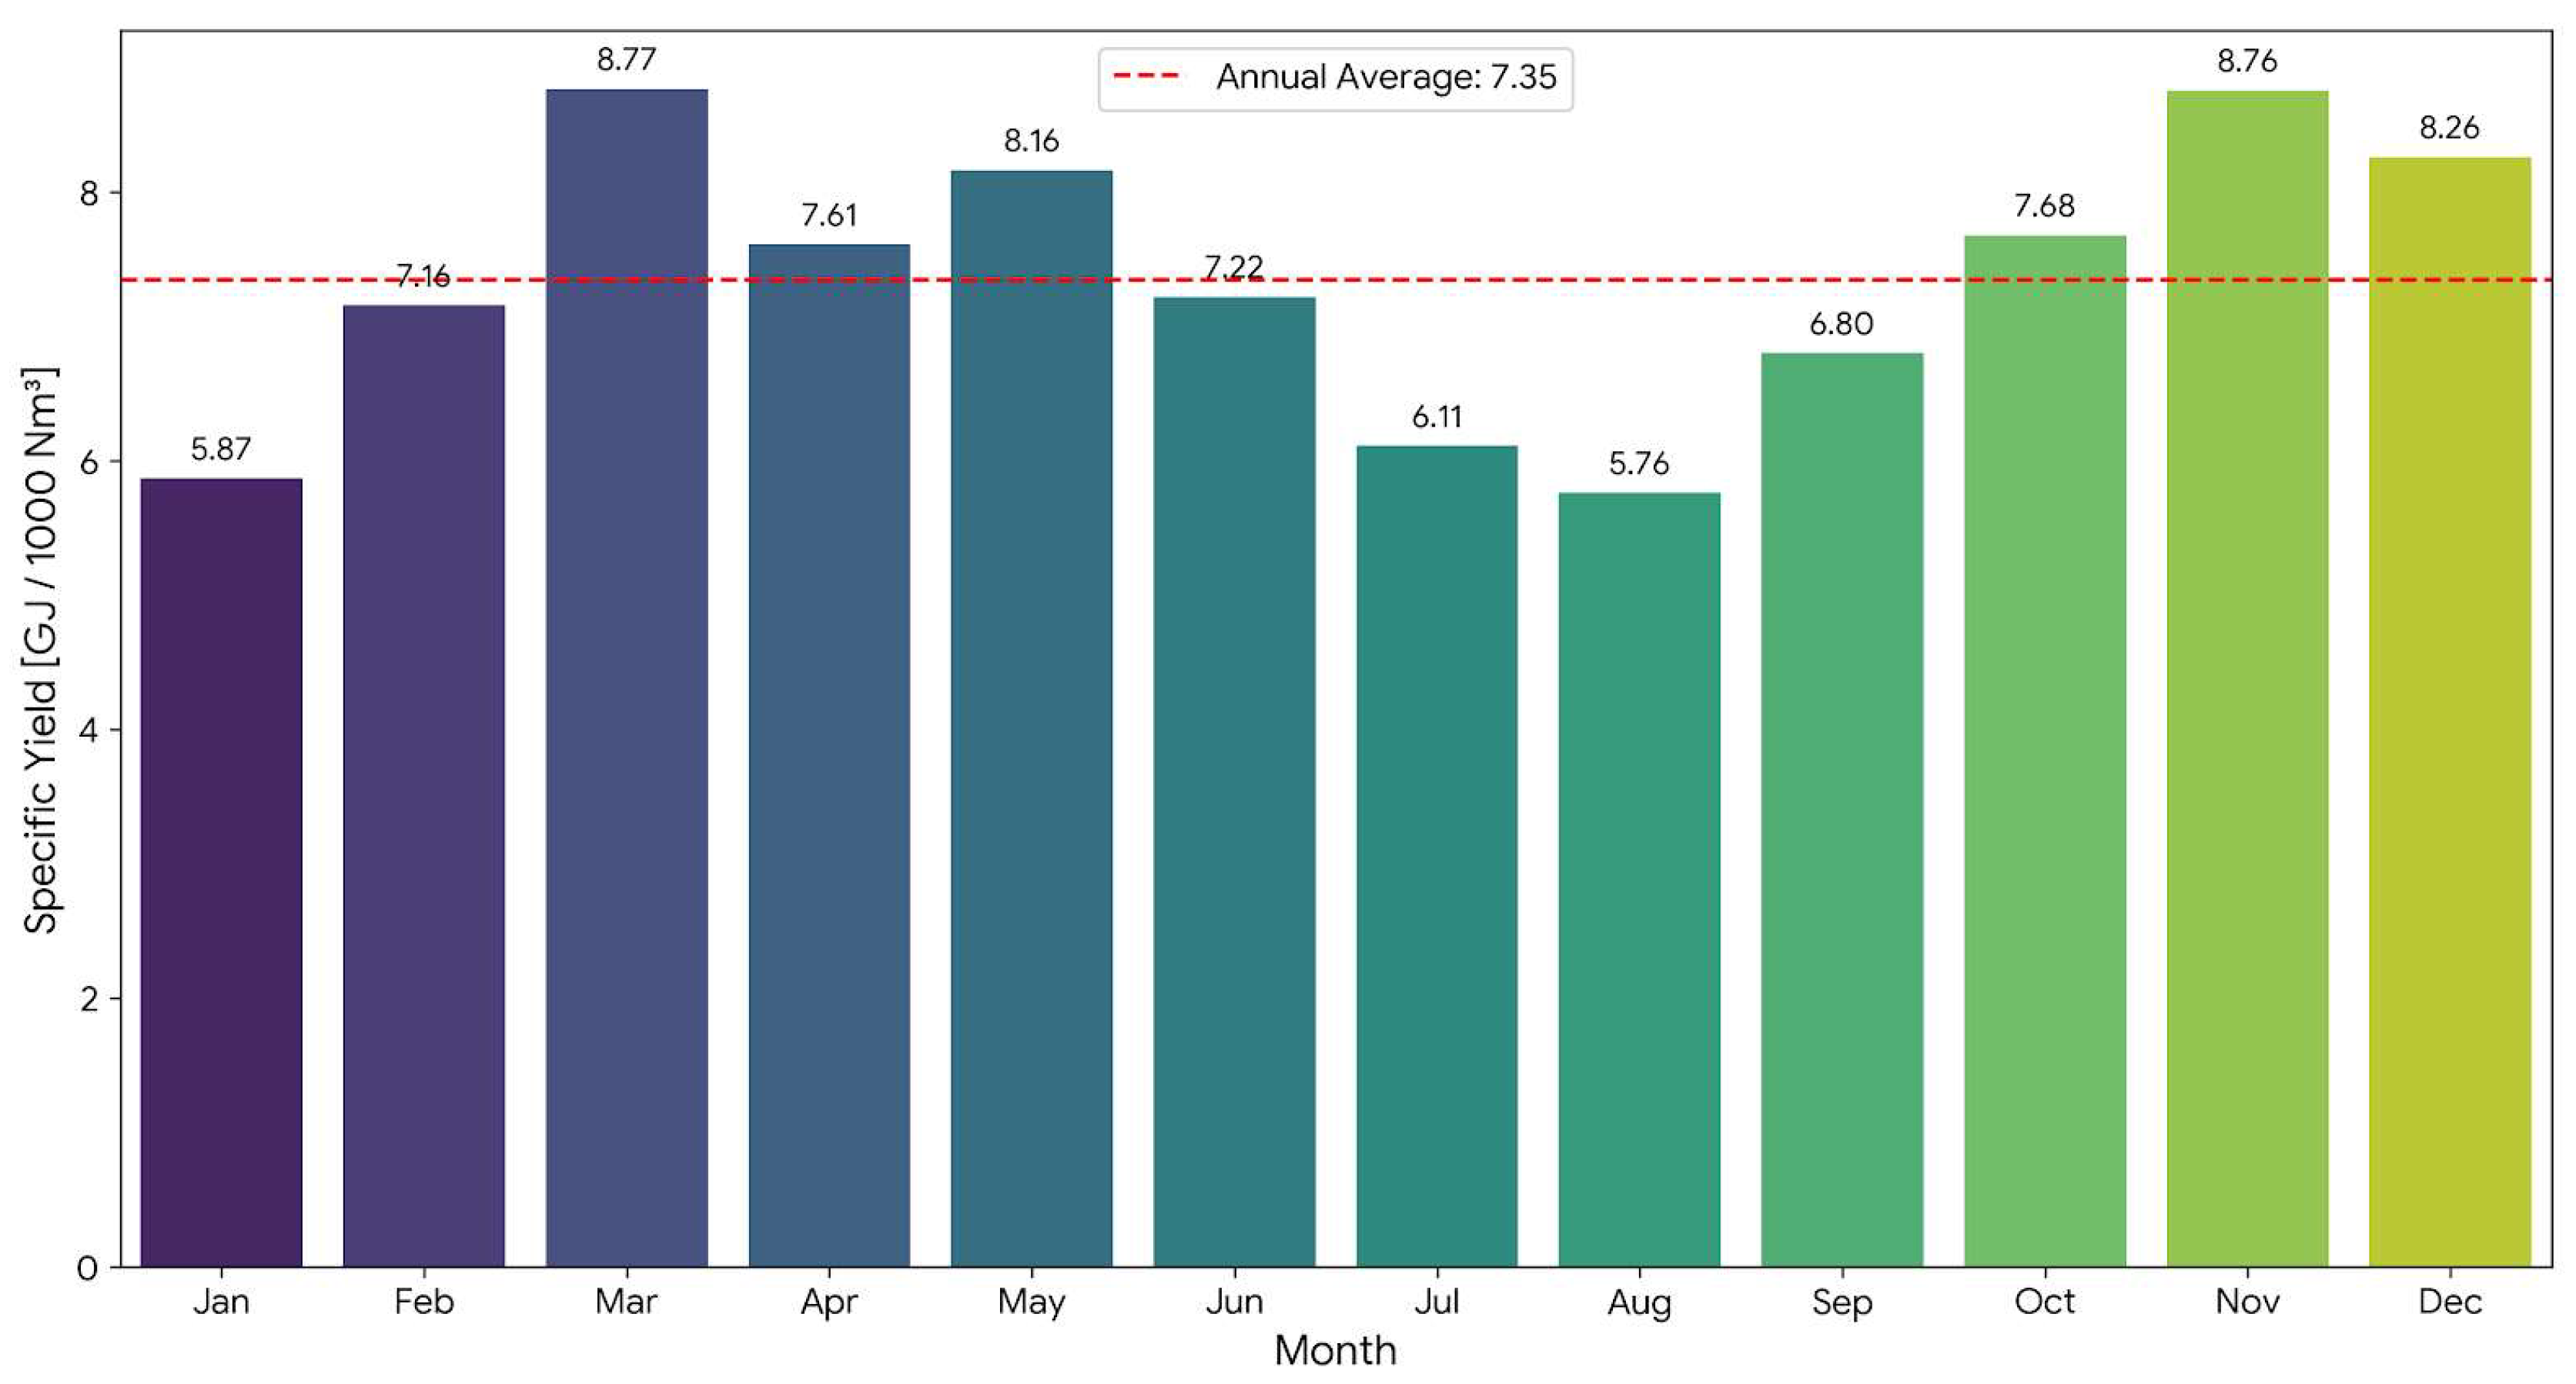
Total biogas production for the year reached 553,347 Nm3, with only 1.05% of that volume being lost to the flare. The specific yield analysis resulted in an annual average of 7.59 GJ/1000 Nm3. Efficiency peaked in March at 8.77 GJ/1000 Nm3, while the lowest efficiency was recorded in August at 5.76 GJ/1000 Nm3 (Figure 10).
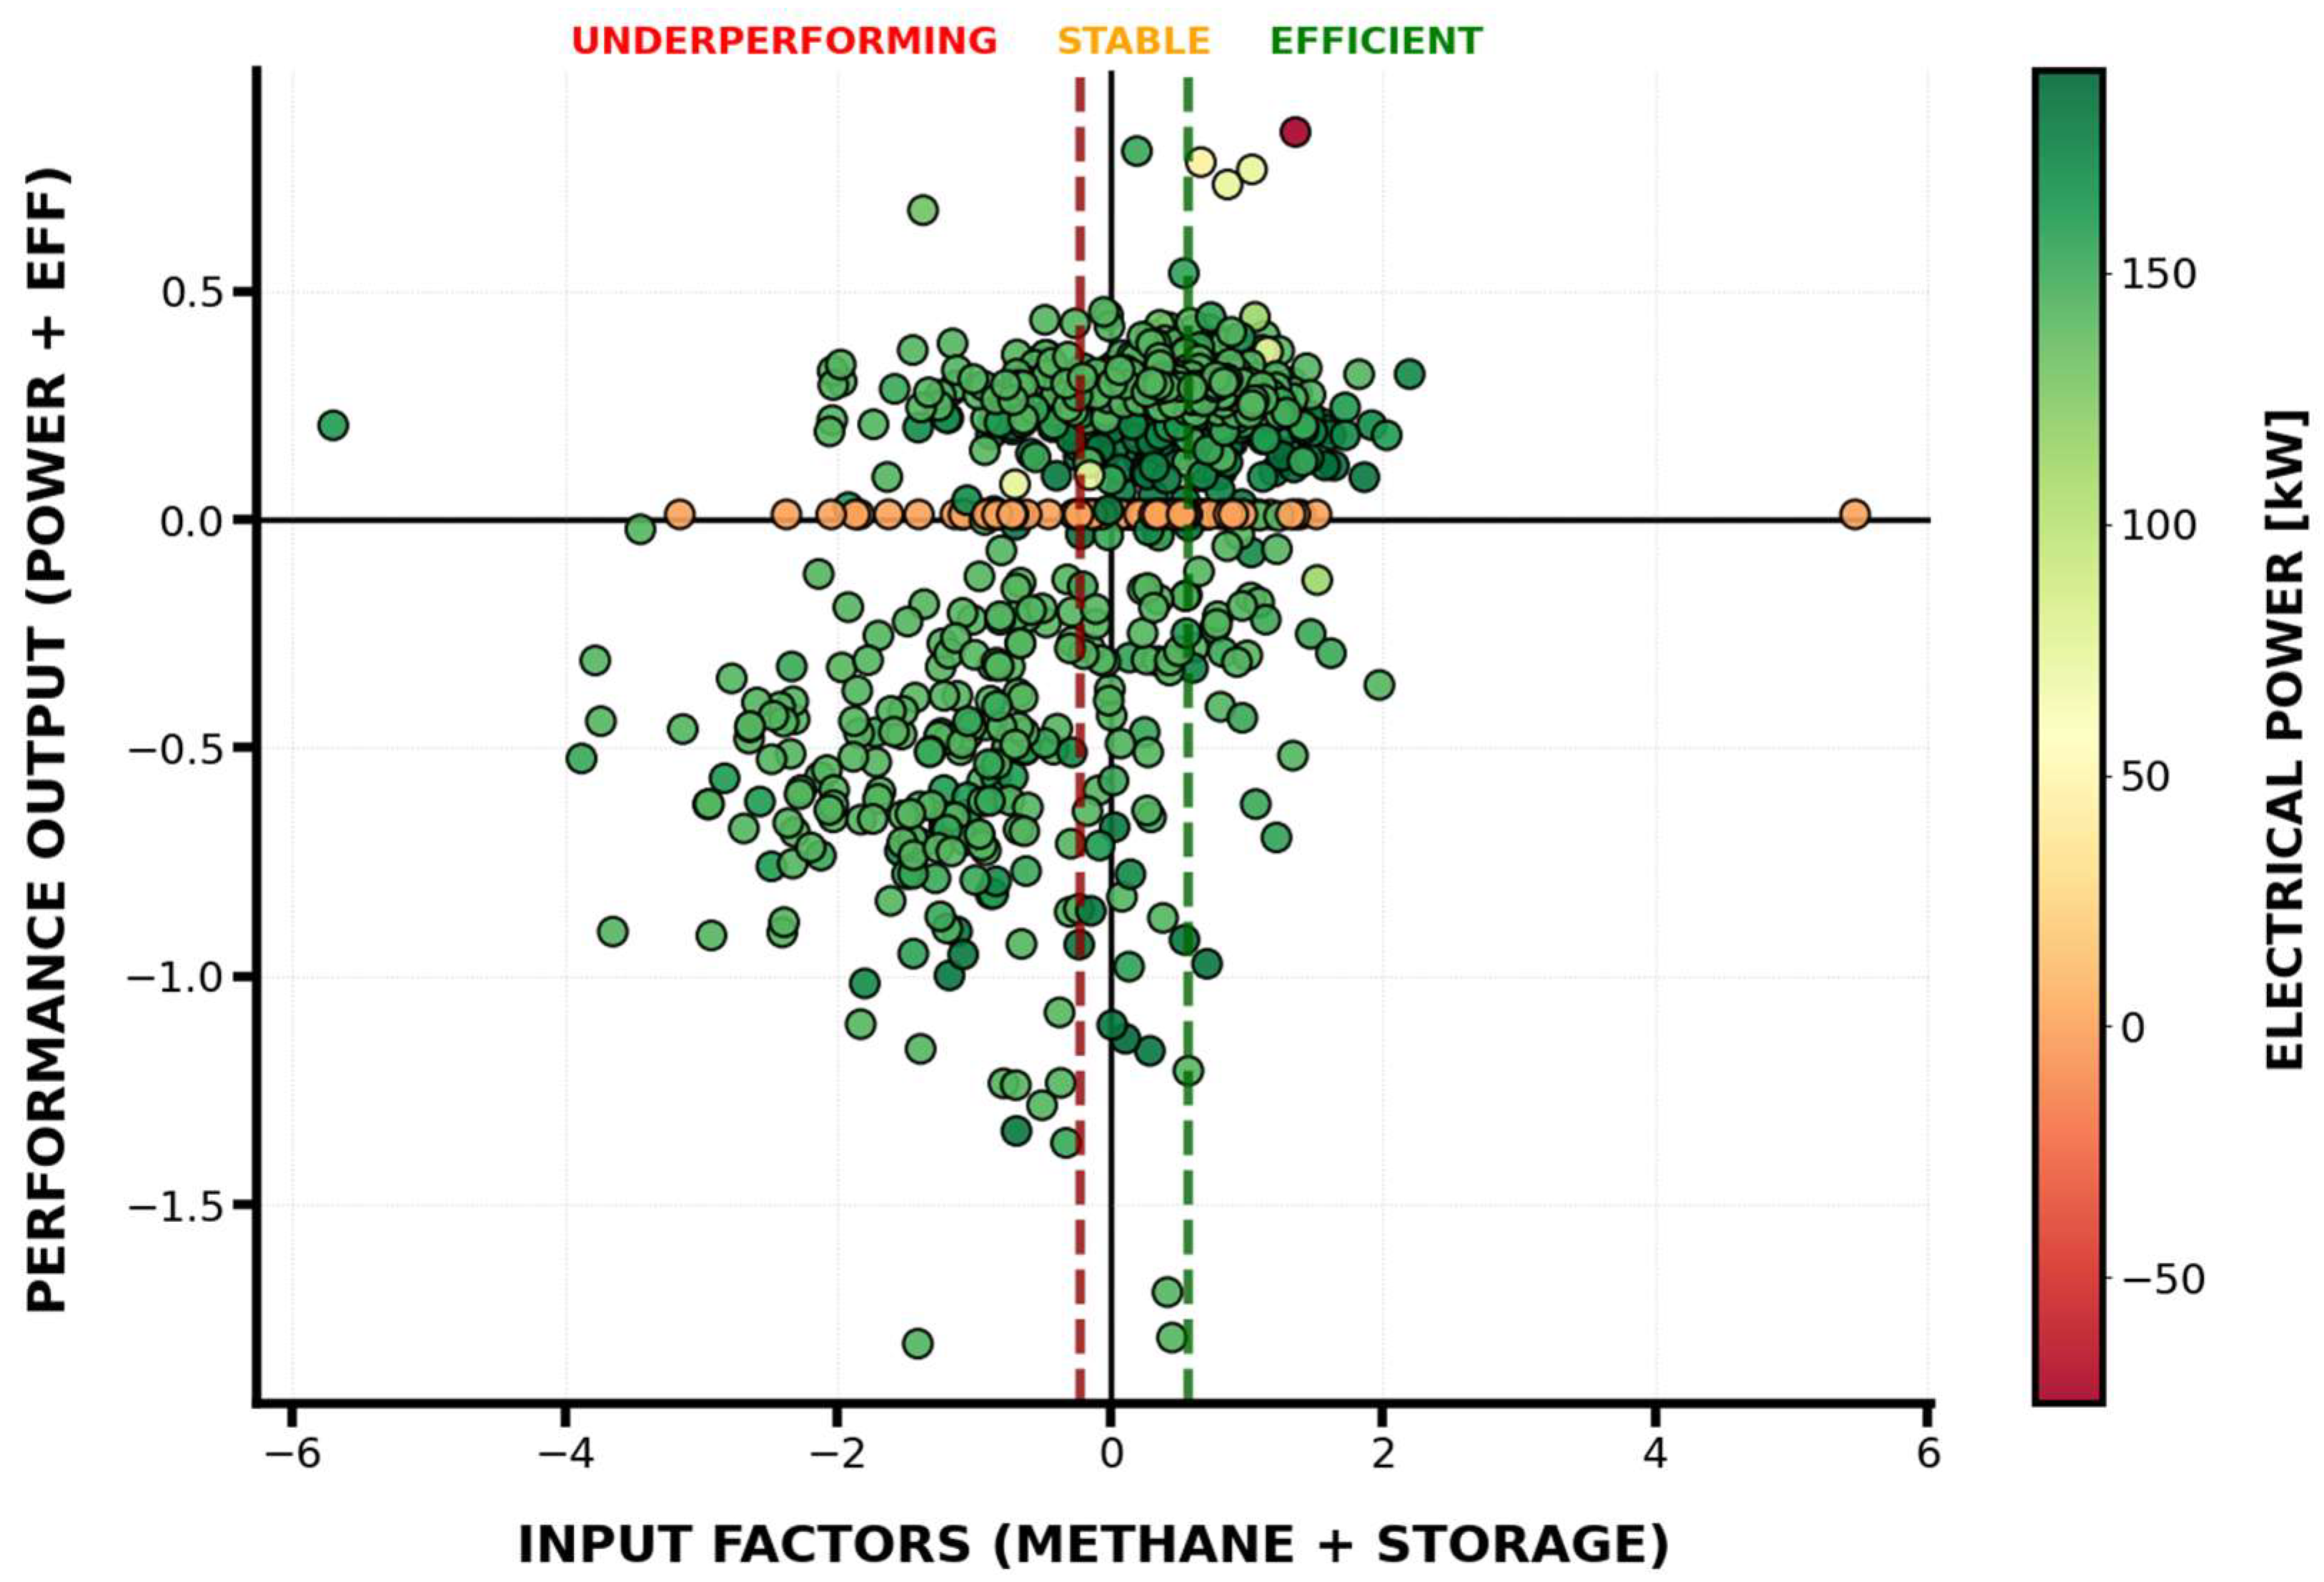
The ordination revealed a clear relationship between input conditions and system performance. Higher methane availability and sufficient storage capacity are associated with increased electrical power output, as indicated by the concentration of green points in the efficient zone. The analysis shows that most observations cluster in the central and efficient zones, while only a few points appear in the underperforming region, including a single outlier with negative power output. The CCA plot illustrates the dynamic relationship between process inputs (methane quality and storage levels) and performance outputs (power and efficiency). Each data point represents an operational “snapshot,” where the X-axis indicates the fuel potential and the Y-axis represents the realized electrical performance. The color gradient serves as a physical verification, mapping statistical scores back to real-world electrical power [kW], which clearly shows that the “efficient” zone (green dashed line) consistently correlates with the highest power generation (Figure 11).
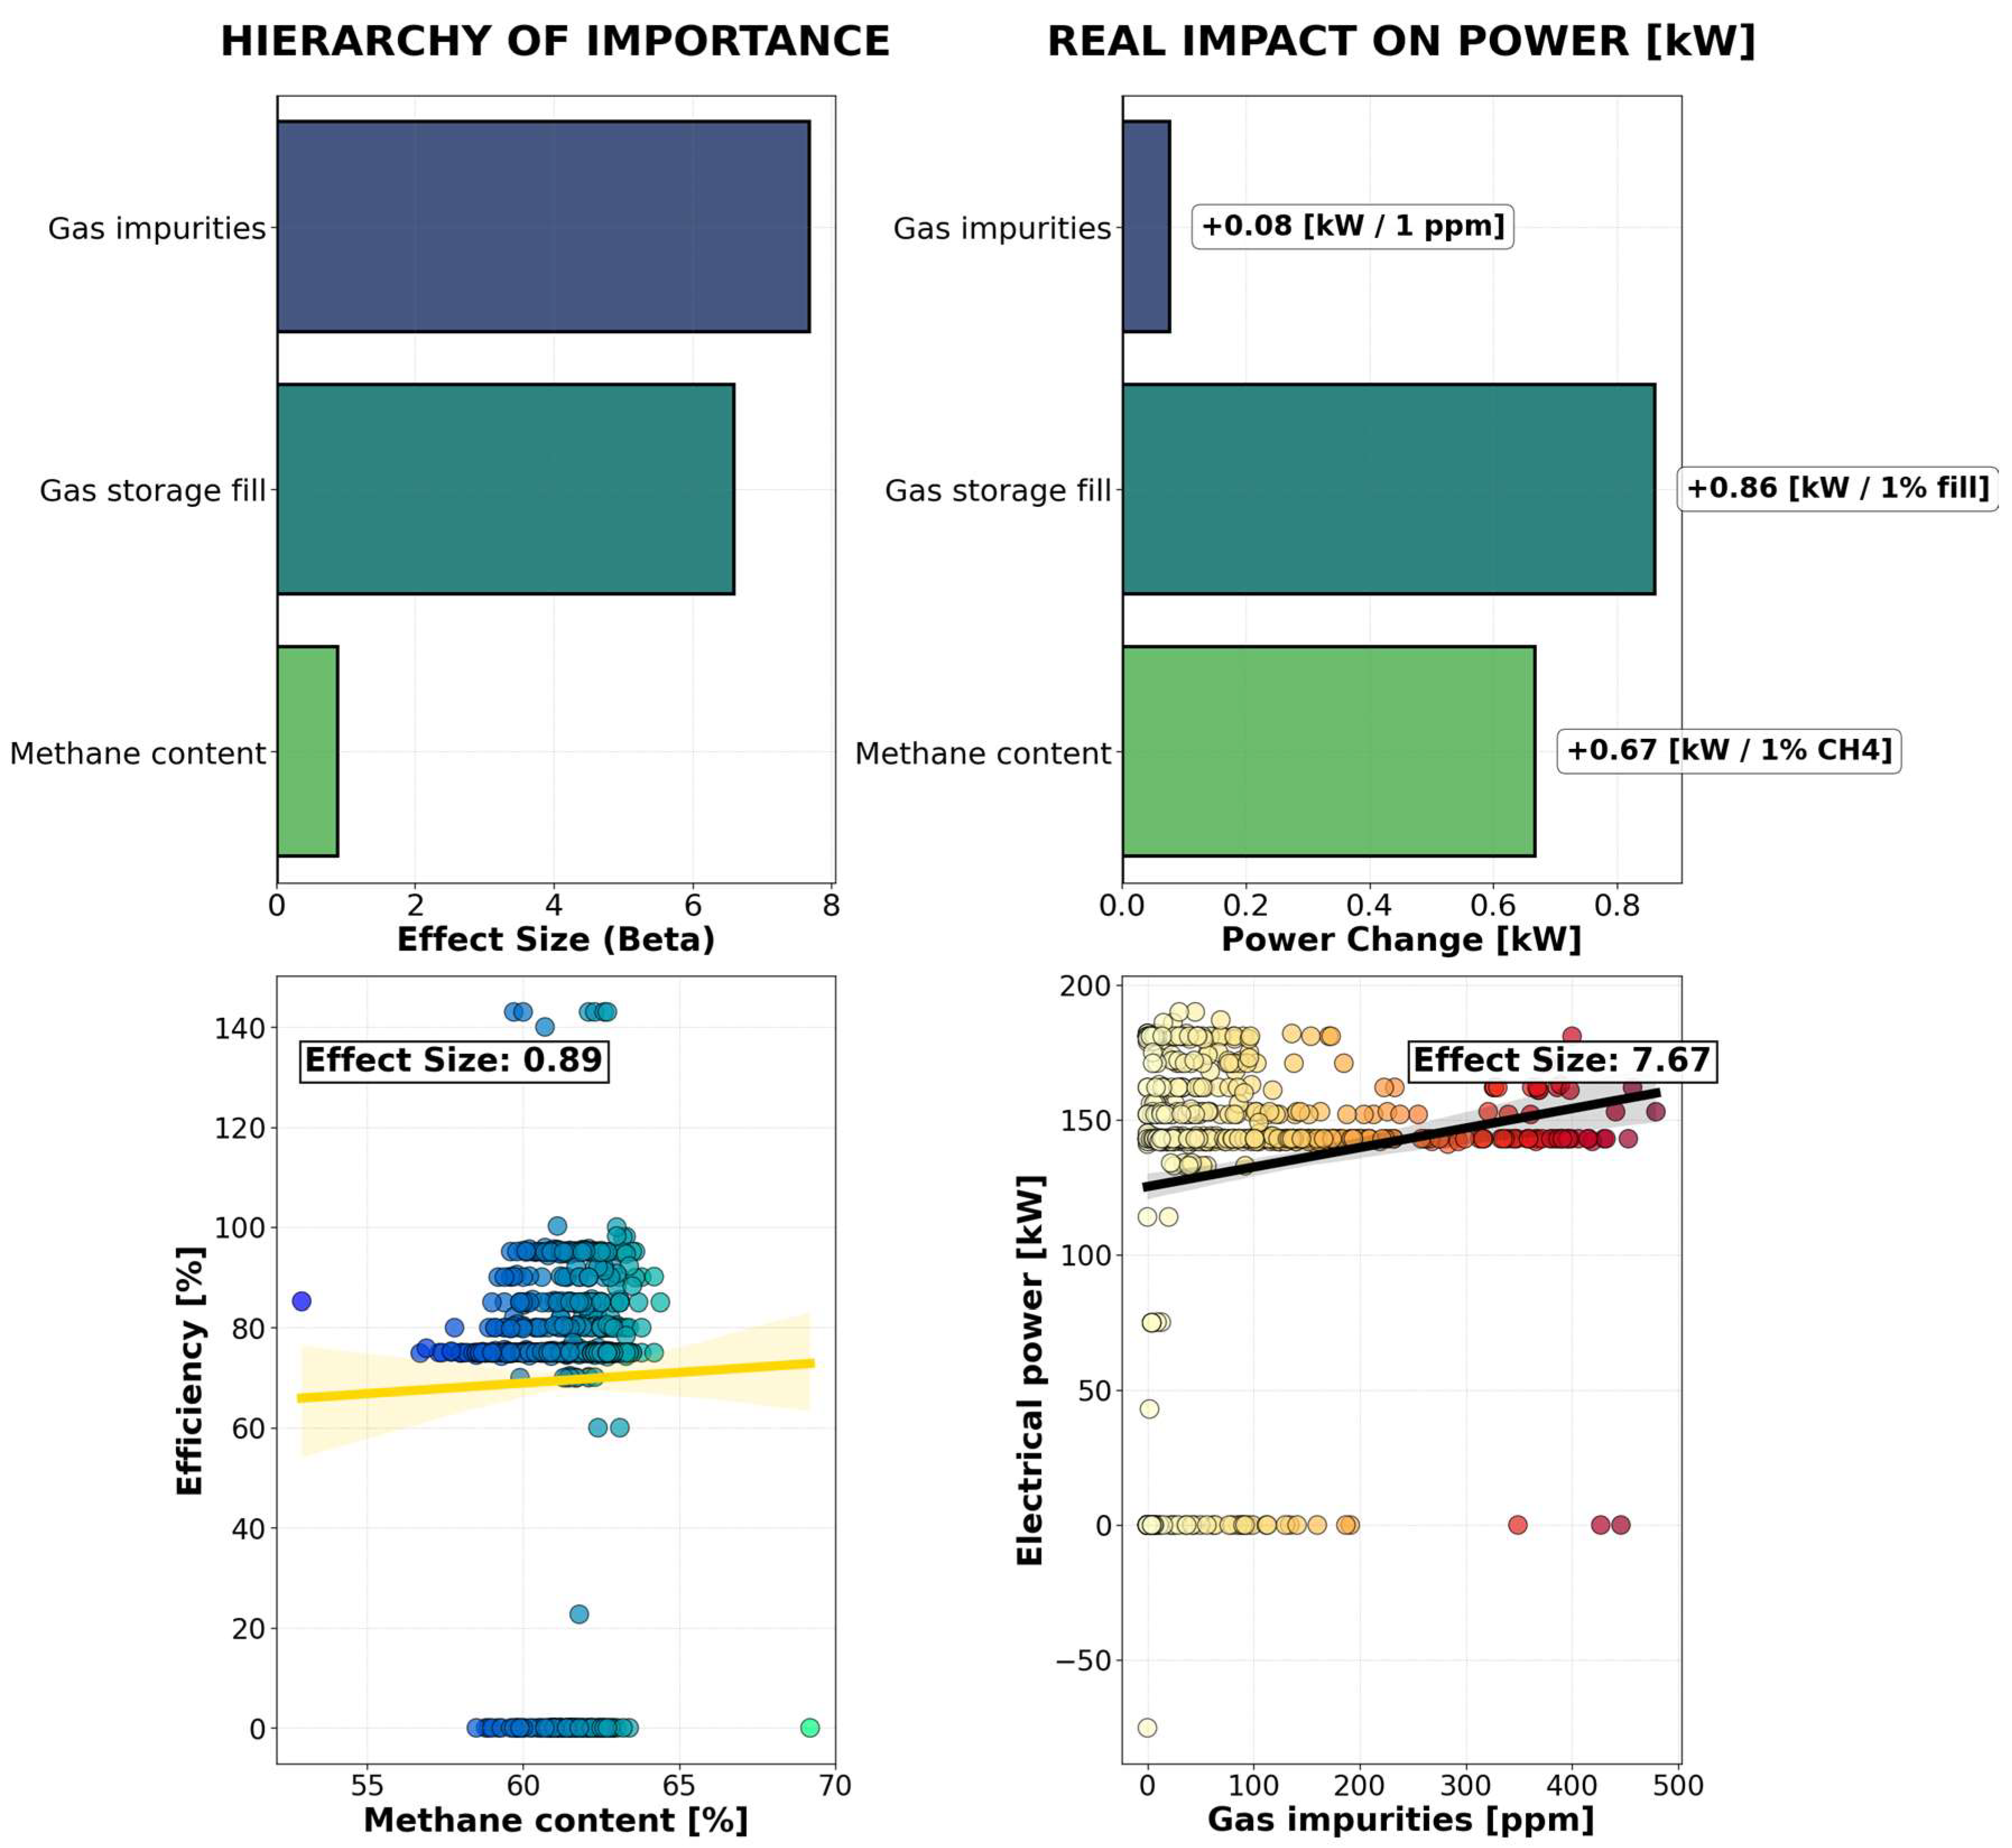
Based on the data, gas storage fill is the most influential driver, providing a substantial increase of +0.86 kW for every 1% of tank capacity. Methane content closely follows as a quality benchmark, contributing +0.67 kW per 1% of CH4 purity. Interestingly, while gas impurities have a massive statistical effect size (7.67), their immediate impact on power per unit is much smaller at +0.08 kW (Figure 12).

4. Discussion

4.1. Process Performance and Factors Influencing Sludge Fermentation

Sludge fermentation is a critical process in sewage treatment, converting organic matter into volatile fatty acids (VFAs), biogas, and stabilized sludge and serving as a foundation for resource recovery [21]. The performance of sludge fermentation is closely linked to both sludge characteristics and operational conditions. Hydrolysis is often considered a major rate-limiting step in anaerobic digestion; however, the overall fermentation rate is also influenced by microbial community dynamics, substrate biodegradability, particle size distribution, and mass-transfer limitations, all of which interact to determine process efficiency. Sludge rich in readily degradable organics generally exhibits faster hydrolysis and higher VFA yields, whereas more recalcitrant or mixed sludge may slow the process, reducing overall productivity [22]. Operational parameters significantly influence microbial activity and process efficiency. For example, pH is critical for acidogenic bacteria, with an optimal range of 5.5–6.5; deviations can suppress metabolism and limit VFA accumulation. Temperature affects hydrolysis and microbial growth, with mesophilic conditions (30–38 °C) providing stable performance and thermophilic conditions (50–55 °C), enhancing reaction rates but increasing sensitivity to disturbances. Temperature not only affects hydrolysis and microbial growth rates but also plays a central role in maintaining overall process stability. It influences enzymatic activity, the balance between hydrolytic, acidogenic, and methanogenic microorganisms, and the resilience of the system to organic or hydraulic shocks. Mesophilic conditions typically provide a stable operational environment, supporting consistent biogas production and reducing the risk of process inhibition [23,24]. Hydraulic retention time (HRT) and solid retention time (SRT) dictate the duration of substrate–microbe interaction; shorter retention favors VFA accumulation, while longer retention allows partial methanogenesis and greater sludge stabilization [25]. The distinction between high and low production was most pronounced in the methane and electrical power dimensions, confirming their central role in operational success. These findings confirmed that optimizing methane purity, thermal energy recovery, and electrical conversion were key strategies for sustaining high-performance operation in the biogas plant (Figure A2). The microbial community structure is another key determinant of performance, as it influences the fermentation process. Acidogenic bacteria dominate in VFA-focused fermentation, while methanogens may reduce acid yields if present in significant numbers. The presence of inhibitors—including ammonia, heavy metals, and xenobiotics—can impair microbial activity, reducing hydrolysis efficiency and product yield. Mixing and maintaining strict anaerobic conditions are essential to ensure uniform substrate availability and prevent oxygen-induced microbial inhibition [26]. Strategies such as sludge pre-treatment (thermal, mechanical, or chemical) and co-fermentation with high-carbon substrates can enhance hydrolysis and substrate bioavailability. The analysis confirmed that gas storage fill was the dominant operational variable, delivering the strongest real-time increase in power availability. Methane quality emerged as the second most influential factor: each 1% rise in purity translated into a substantial +0.67 kW gain in electrical output. Although gas impurities exhibited a high statistical weight of 7.67, their marginal effect on performance remained modest at only +0.08 kW per 1 ppm (Figure 12). Taken together, these results indicated that operators should have prioritized maintaining adequate storage levels and maximizing methane purity to ensure the engine operated at its highest economic efficiency.
Adjusting the C/N ratio further stabilizes microbial metabolism and increases VFA production. These interventions highlight the importance of integrated process control, which accommodates sludge variability and optimizes operational parameters to achieve consistent fermentation outcomes [27]. Overall, sludge fermentation performance is governed by a complex interplay of substrate characteristics, microbial dynamics, and operational factors. Careful optimization of these parameters can maximize VFA and biogas yields, improve sludge stabilization, and support sustainable sewage treatment and resource recovery [28]. Understanding the factors influencing fermentation is essential for designing robust processes capable of handling variable sludge streams while maintaining high performance.

4.2. Implications of Sewage Sludge Variability for Anaerobic Digestion Performance and Methane Yield

The findings showed a dominant negative correlation of −0.85 between cogenerator and boiler activity, which was statistically significant at the 99%confidence level. Heat production demonstrated a robust positive correlation of 0.66 with total biogas production. Interestingly, the flare showed a near-zero correlation with heat output, confirming that gas flared during the year did not contribute to the thermal energy balance (Figure 9). The analysis revealed an annual mean efficiency of 7.59 GJ per 1000 Nm3. The data highlighted two distinct performance peaks in March (8.77) and November (8.76). In contrast, the summer months showed a significant contraction in efficiency, bottoming out at 5.76 in August. This represents a 34% decrease in thermal capture efficiency compared to the annual peak (Figure 10). During summer, the thermal energy demand of the plant decreases substantially, as less heat is required to maintain digester temperature and auxiliary processes. When the available heat cannot be fully utilized on site, the surplus is effectively wasted, which directly lowers the overall energy efficiency of the system. Therefore, the observed 34% reduction relative to peak values reflects not only seasonal variability but also the structural limitation of biogas plants, where heat utilization strongly depends on external demand. This phenomenon is widely described in the literature as the problem of excess heat, which often forces a reduction in CHP output or an increase in the amount of gas sent to the flare. In summary, the results of the analysis clearly indicate that the determinants of energy efficiency are: stable biogas production, a high share of cogenerator operation in meeting heat demand, and the availability of year-round heat off-take. Reducing losses associated with biogas flaring and improving heat utilization during the summer months could significantly enhance the overall system efficiency.
The findings of this study align with those of [29]. They emphasize the critical role of efficient energy utilization in investment decision tools for biogas plants. The authors demonstrate that insufficient heat utilization leads to a decline in overall efficiency and deterioration of economic indicators, which directly corresponds to the summer efficiency drop observed in the present study. The reported efficiency levels [29] fall within a range comparable to the annual mean value of 7.59 GJ/1000 Nm3 obtained here, confirming the representativeness of the analyzed installation relative to reference facilities. Similarly, [30] highlights the importance of process stability and the integration of biogas plants into local energy systems. Although reduced heat demand significantly affects the overall energy efficiency of biogas plants, it should be considered as one of several contributing factors. Seasonal temperature variations, digester insulation quality, process stability, and the balance between thermal and electrical energy production also influence system performance. Therefore, heat demand interacts with these operational conditions rather than acting as a single dominant constraint. The decrease in efficiency observed in the present results during summer months directly supports this conclusion and indicates that, without additional heat consumers or thermal storage solutions, the energetic potential of biogas cannot be fully exploited. Moreover, the near-zero correlation between flaring and heat production is consistent with the conclusions of Holm-Nielsen et al., who regard emergency flaring as an energy loss and a systemic challenge in the development of sustainable biogas systems.
Sewage sludge is inherently heterogeneous, exhibiting substantial variation in its physical, chemical, and biological properties. This variability has direct consequences for anaerobic digestion performance. High variability in volatile solids content and particle size distribution can influence the hydrolysis rate, which is often the rate-limiting step in anaerobic digestion [31,32,33]. In contrast, the system showed diminishing returns when the efficiency exceeded the 110% threshold, as the power output began to decline toward the 80–120 kW range. Furthermore, performance dropped significantly at the boundaries of the map; specifically, power production fell below 20 kW whenever the methane content moved outside the 58–68% window or when the system efficiency plummeted. These results confirmed that maintaining a stable methane concentration near 62% was critical for maximizing total power generation (Figure A1).
Low variability in the daily and monthly volumes of discharged sludge (CV = 0.05 ÷ 0.29) indicates a stable substrate supply to the anaerobic digestion process, which favors predictable methane production. Differences in the proportions of primary and excess (secondary) sludge have important implications for hydrolysis rate, biodegradability profile, and potential methane yield: a predominance of readily degradable fractions accelerates conversion to VFAs and methane, whereas an increased share of recalcitrant material prolongs reaction times and reduces methane production efficiency. Stability of the sludge feed (low CV for individual fractions and their sum) supports maintenance of a stable methanogenic phase and limits the risk of sudden VFA accumulation and pH drops that inhibit methanogenesis. However, dominance of primary sludge (approximately threefold greater volume) suggests a relatively high overall methane potential for the plant, while episodic increases in the share of excess sludge may reduce methanogenic conversion efficiency due to the higher content of recalcitrant material. As noted by [34], low volumetric variability provides a sound basis for stable AD. Studies show that addition of readily degradable co-substrates or a higher proportion of primary sludge increases methane yield, whereas a high share of secondary sludge often requires pretreatment to achieve comparable gains. Overall, the variability of sewage sludge underscores the importance of flexible digester design and operation, tailored feeding strategies, and continuous monitoring to ensure stable anaerobic digestion and maximize methane recovery. Understanding the specific characteristics of the incoming sludge allows for predictive management and optimization of energy recovery from sewage treatment systems [35].

4.3. Interactions Between Sewage Sludge Loading and Daily Biogas Production

The self-sufficiency ratio (SSR) proves that the facility has successfully transitioned to a “prosumer” model where more than half of its operational energy is generated on site. The strong statistical fit suggested that the energy independence of the plant is not yet saturated (Figure 7). Strategically, this reduces the facility’s exposure to volatile market energy prices and high distribution fees for more than 50% of its total consumption. The self-consumption ratio (SCR) was analyzed through a quantitative regression model to determine the actual utilization rate of generated energy (Figure 8). This confirmed that the facility operated as a perfect “energy sponge,” with a baseload demand that consistently exceeded peak production levels. Consequently, the data proved that there was zero energy waste and no requirement for battery storage investment, as the facility maximized every unit of generation to directly reduce the monthly energy bill.
High levels of self-sufficiency are particularly advantageous in biogas-based cogeneration systems, as they ensure long-term price stability and significantly reduce exposure to volatile electricity markets and grid-related charges [30]. As emphasized by Karellas et al. [29], maximizing on-site consumption of generated energy is a key determinant of the economic performance of biogas CHP installations, since electricity exported to the grid typically yields lower financial returns and is often subject to regulatory constraints. The literature further indicates that self-consumption ratios (SCRs) exceeding 90% are widely interpreted as evidence of excellent matching between energy generation and internal demand, while values approaching unity characterize an almost ideal, demand-driven prosumer system. In this context, an SCR close to 100% observed in the present study confirms that the facility operates under conditions of sustained baseload demand exceeding peak generation. Consequently, energy storage solutions are both technically unnecessary and economically unjustified, as virtually all generated electricity is instantaneously utilized on site, resulting in zero energy waste and maximal reduction in purchased electricity. The primary objective of this analysis was to define the “Optimal Operating Window” for the biogas facility by filtering out sensor noise and focusing on the strongest correlations. By categorizing operations into underperforming, stable, and efficient zones, the project moved from reactive monitoring to proactive process management (Figure 11). This allowed operators to identify exactly which combinations of methane purity and tank levels were required to maintain maximum output, ultimately reducing mechanical strain and preventing energy losses during periods of low fuel quality.
Daily biogas production in anaerobic digestion (AD) is strongly influenced by sludge loading rates, which reflect the balance between substrate availability and the metabolic capacity of the microbial community. Increasing sludge loading generally enhances the supply of organic matter to the digester and may lead to higher daily methane yields [34]. However, excessive loading can exceed microbial processing capacity, resulting in substrate accumulation, volatile fatty acid (VFA) build-up, and process inhibition, ultimately reducing biogas production and compromising digester stability. Conversely, under-loading leads to suboptimal biogas generation due to insufficient substrate availability, highlighting the need for careful control of organic loading rates (OLRs) to ensure stable and efficient performance [34,35,36]. In contrast, sludge containing a greater proportion of refractory or slowly degradable components may exhibit delayed or reduced methane production, even at elevated loading rates. Variations in total solid (TS) concentration, particle size distribution, and microbial community structure can further modulate this response, indicating that the impact of loading is both quantitative and qualitative. Operational parameters such as hydraulic retention time (HRT), temperature, pH, and mixing intensity interact closely with sludge loading to determine daily biogas output [37]. The relationship between sludge loading and daily biogas production is further mediated by sludge characteristics, including volatile solid (VS) content, the carbon-to-nitrogen (C/N) ratio, and biodegradability. Sludge rich in readily degradable organic compounds typically respond rapidly to increase loading, producing higher daily biogas volumes [38]. Short HRTs combined with high loading rates may intensify VFA accumulation and inhibit methanogenic activity, whereas maintaining adequate retention times and optimal temperature conditions promote efficient substrate conversion to methane. Effective buffering capacity and pH control are also essential to prevent acidification resulting from sudden increases in readily biodegradable organic matter. In practice, optimizing the interaction between sludge loading and biogas production requires balancing organic input with microbial capacity while accounting for variability in sludge properties and operational conditions. Controlled loading strategies—such as gradual increases in the OLR or co-digestion with complementary substrates—can enhance daily methane production while minimizing the risk of process disturbances. Continuous monitoring of daily biogas production, VFA concentrations, pH, and temperature provides real-time feedback for adjusting feeding strategies and maintaining stable operation. Key management practices include continuous OLR monitoring, flexible feeding control, and the selective application of pretreatment or co-digestion in response to changes in sludge quality [39,40]. In conclusion, daily biogas production is a dynamic outcome of the interaction between sludge loading, substrate characteristics, and digester operating conditions. A thorough understanding of these relationships is essential for the design and operation of efficient anaerobic digestion systems, maximizing methane yield, and ensuring long-term process stability in wastewater treatment facilities [41]. Biogas production transforms wastewater treatment plants into resource recovery centers by converting sewage sludge into a carbon-neutral energy source [42]. This process achieves energy self-sufficiency through heat and power generation while significantly reducing waste volume [43]. Advanced engineering optimizes this pathway to guarantee stable, sustainable, and cost-effective operation [44,45].
While microbial community composition is known to influence anaerobic digestion performance, microbial profiling was not included in the scope of this study. Recent research has demonstrated that pre-treatment strategies and optimized digestion configurations can enhance microbial activity and improve renewable natural gas production [46] and that co-digestion conditions can shift microbial pathways and increase biogas yield [47], enhance treatment quality [48,49] and efficiency [50]. These studies provide the necessary biological context for interpreting the operational-scale results presented here. In our case, the analysis focused on operational and energy-related indicators, which provide a robust assessment of full-scale performance even in the absence of microbial sequencing data.
Although the R2 value of 0.232 indicates modest explanatory power, this level of model fit is consistent with anaerobic digestion modeling studies, where high biological and operational variability typically limits the achievable R2 [51]. The corresponding effect size (f2 = 0.303) reflects a moderate influence of the predictor, which aligns with the magnitude of effects commonly observed in biogas system modeling (Figure 8). The SEM (Structural Equation Modeling) shows a set of connected process variables arranged as nodes, linked by arrows indicating the direction and strength of influence. Each arrow is labeled with a numerical coefficient and colored either green for positive influence or red for negative influence. Methane content and gas impurities are positioned on the left, both pointing toward the fuel quality node. Fuel quality, heat output, electrical power, and efficiency are arranged toward the right, connected through directional arrows that represent how one process affects the next (Figure A3).

4.4. Limitations and Future Work

The study focused on long-term operational and energy-related indicators at full scale, which means that some aspects of the digestion process were not captured in detail. Microbial community dynamics, known to influence methane yield and process stability, were not analyzed, and future work integrating metagenomic or activity-based profiling could provide deeper insight into biological drivers of performance. The dataset represents a single facility, so extending the analysis to multiple WWTPs operating under different climatic and loading conditions would strengthen the broader applicability of the findings. Further research could also explore predictive modeling approaches to anticipate fluctuations in biogas production and energy self-sufficiency, as well as evaluate the impact of emerging pretreatment and co-digestion strategies reported in the recent literature. Because the system operated very steadily throughout the year, the data did not include periods of stress, disturbances, or unusual operating conditions, which made it impossible to evaluate how the sludge-to-energy process would perform under more variable or challenging scenarios.
The analysis of daily volumes of thickened sewage sludge produced in 2024 (Figure 2, Table 1) revealed several limitations that should be considered when interpreting the results. Although the data showed relatively stable daily discharge rates—confirmed by low coefficients of variation (CV = 0.16 for primary sludge, 0.23 for excessive sludge, and 0.13 for total sludge)—this stability also indicated that the dataset did not capture operational extremes or atypical events, limiting the ability to assess short-term fluctuations. The distribution characteristics, expressed through kurtosis and skewness values (Table 1), further demonstrated a strong concentration of results around the mean, which restricted the identification of irregularities that might occur under varying hydraulic or technological conditions. Monthly analysis (Figure 3, Table 2) also showed only moderate variability, with limited seasonal influence, as reflected in the narrow range of monthly averages and CV values (0.11–0.29). These findings suggested that external factors such as rainfall, temperature changes, or influent composition were not fully represented in the dataset. To address these limitations, future research should consider extending the temporal scope to include multiple years, integrating operational and environmental parameters, incorporating data from atypical or stress conditions, and applying predictive or statistical modeling approaches to better understand and forecast sludge production dynamics.
The analysis of biogas performance revealed several limitations that affected the interpretation of the results. The weak correlation between total sludge and biogas production (r = 0.29; Figure 6) indicated that sludge quantity alone did not sufficiently explain biogas output. Although annual energy production reached 1,095,047 kWh and the self-sufficiency model showed strong internal linearity (R2 = 0.871; Figure 7), the regression for monthly self-consumption had limited explanatory power (R2 = 0.232; Figure 8), as nearly all values clustered in the high-efficiency zone. The strong correlations observed in the matrix (Figure 9) did not account for operational or environmental factors, while seasonal variation in thermal efficiency (Figure 10) could not be linked to specific process conditions due to missing data on feedstock quality and microbial activity. Multivariate analysis (Figure 11) and effect-size results (Figure 12) identified key drivers such as gas storage fill and methane content, yet the absence of detailed operational constraints restricted deeper interpretation. Future work should therefore incorporate broader operational data, longer time series, and modeling approaches to better capture the complexity of biogas system performance.

5. Conclusions

The annual biogas yield of 553,347 Nm3, together with the very low flaring losses (1.05%), indicates that the system captures and utilizes biogas efficiently, with only a minimal fraction remaining unused. The specific energy yield averaged 7.59 GJ per 1000 Nm3, with a maximum of 8.77 GJ per 1000 Nm3 in March and a minimum of 5.76 GJ per 1000 Nm3 in August. These seasonal fluctuations indicate that targeted operational adjustments could further improve performance during lower-efficiency summer periods. Overall, the WWTP functioned as a stable and energy-efficient sludge-to-energy system. Biogas-derived electricity covered more than half of the annual energy demand, and nearly all generated power was consumed on site. System coherence was reflected in the strong negative correlation between cogenerator and boiler operation and the positive correlation between biogas production and heat output. The integrated analysis of power generation, methane quality, impurity levels, heat production, and efficiency supported all four research objectives and demonstrated how sludge volume, biogas quality, thermal conditions, and cogeneration performance jointly shaped daily and seasonal variability in energy recovery. The observed fluctuations in electrical power and heat output aligned with the objective of evaluating digestion performance across both short-term and seasonal timescales. The detailed quantification of electrical generation patterns, self-consumption behavior, and operational efficiency addressed the goal of assessing energy recovery and self-sufficiency. Finally, the structural relationships, multivariate correlations, and driver analysis provided clear evidence of system-level interactions, demonstrating how sludge volume, biogas quality, thermal conditions, and cogeneration processes collectively shaped overall performance.

Author Contributions

Conceptualization, W.H. and A.M.; methodology, W.H.; software, W.H.; validation, W.H., M.G., A.P. and K.C.; formal analysis, K.C.; resources, K.C.; data curation, W.H.; writing—original draft preparation, W.H.; A.M. and A.P., writing—review and editing, W.H.; visualization, W.H. and A.M.; supervision, M.G.; funding acquisition, M.G. All authors have read and agreed to the published version of the manuscript.

Funding

The publication is financed from the subsidy granted to the Krakow University of Economics within the Support for Conference Activities, ADN/WOFK/2026/000007.

Data Availability Statement

Data will be available upon request.

Acknowledgments

During the preparation of this manuscript/study, the authors used Copliot for the purposes of reviewing the English. The authors have reviewed and edited the output and take full responsibility for the content of this publication.

Conflicts of Interest

The authors declare no conflicts of interest.

Appendix A

Figure A1. Biogas system performance analysis.
Energies 19 01377 g0a1
Figure A2. Biogas plant performance analysis: Multivariate process correlation.
Energies 19 01377 g0a2
Figure A3. Biogas plant performance analysis: Structural equation model for process of biogas production.
Energies 19 01377 g0a3

References

  1. Sulewski, P.; Ignaciuk, W.; Szymańska, M.; Wąs, A. Development of the biomethane market in Europe. Energies 2023, 16, 2001. [Google Scholar] [CrossRef] [Scilit]
  2. Kabeyi, M.J.B.; Olanrewaju, O.A. Biogas production and applications in the sustainable energy transition. J. Energy 2022, 2022, 8750221. [Google Scholar] [CrossRef] [Scilit]
  3. Mishra, A.; Kumar, M.; Bolan, N.S.; Kapley, A.; Kumar, R.; Singh, L. Multidimensional approaches of biogas production and up-gradation: Opportunities and challenges. Bioresour. Technol. 2021, 338, 125514. [Google Scholar] [CrossRef] [Scilit]
  4. Mitraka, G.C.; Kontogiannopoulos, K.N.; Batsioula, M.; Banias, G.F.; Zouboulis, A.I.; Kougias, P.G. A comprehensive review on pretreatment methods for enhanced biogas production from sewage sludge. Energies 2022, 15, 6536. [Google Scholar] [CrossRef] [Scilit]
  5. Petrovič, A.; Zirngast, K.; Predikaka, T.C.; Simonič, M.; Čuček, L. The advantages of co-digestion of vegetable oil industry by-products and sewage sludge: Biogas production potential, kinetic analysis and digestate valorisation. J. Environ. Manag. 2022, 318, 115566. [Google Scholar] [CrossRef] [Scilit]
  6. Khawer, M.U.B.; Naqvi, S.R.; Ali, I.; Arshad, M.; Juchelková, D.; Anjum, M.W.; Naqvi, M. Anaerobic digestion of sewage sludge for biogas & biohydrogen production: State-of-the-art trends and prospects. Fuel 2022, 329, 125416. [Google Scholar] [CrossRef] [Scilit]
  7. Admasu, A.; Bogale, W.; Mekonnen, Y.S. Experimental and simulation analysis of biogas production from beverage wastewater sludge for electricity generation. Sci. Rep. 2022, 12, 9107. [Google Scholar] [CrossRef] [Scilit] [PubMed]
  8. Lafratta, M.; Thorpe, R.B.; Ouki, S.K.; Shana, A.; Germain, E.; Willcocks, M.; Lee, J. Demand-driven biogas production from anaerobic digestion of sewage sludge: Application in demonstration scale. Waste Biomass Valorization 2021, 12, 6767–6780. [Google Scholar] [CrossRef] [Scilit]
  9. Cañote, S.J.; Barros, R.M.; Lora, E.E.S.; del Olmo, O.A.; dos Santos, I.F.S.; Piñas, J.A.V.; de Castro e Silva, H.L. Energy and economic evaluation of the production of biogas from anaerobic and aerobic sludge in Brazil. Waste Biomass Valorization 2021, 12, 947–969. [Google Scholar] [CrossRef] [Scilit]
  10. Zhu, Y.; Sun, C.; Zhang, Y. Focus on co-digestion of waste activated sludge and food waste via yeast pre-fermentation and biochar supplementation: The optimization and mechanism. Environ. Res. 2023, 238, 117146. [Google Scholar] [CrossRef] [Scilit]
  11. Peces, M.; Astals, S.; Clarke, W.P.; Jensen, P.D. Semi-aerobic fermentation as a novel pre-treatment to obtain VFA and increase methane yield from primary sludge. Bioresour. Technol. 2016, 200, 631–638. [Google Scholar] [CrossRef] [Scilit]
  12. Liang, S.; McDonald, A.G. Anaerobic digestion of pre-fermented potato peel wastes for methane production. Waste Manag. 2015, 46, 197–200. [Google Scholar] [CrossRef] [Scilit]
  13. Liu, X.; Peng, L.; Deng, P.; Xu, Y.; Wang, P.; Tan, Q.; Dai, X. Co-hydrothermal carbonization of sewage sludge and rice straw to improve hydrochar quality: Effects of mixing ratio and hydrothermal temperature. Bioresour. Technol. 2025, 415, 131665. [Google Scholar] [CrossRef] [Scilit]
  14. Wani, S.S.; Parveez, M. Quality and potential assessment of sewage sludge for clean energy utilization: A study from Srinagar City. Biomass Convers. Biorefin. 2025, 15, 19127–19142. [Google Scholar] [CrossRef] [Scilit]
  15. Cieślik, B.M.; Namieśnik, J.; Konieczka, P. Review of sewage sludge management: Standards, regulations and analytical methods. J. Clean. Prod. 2015, 90, 1–15. [Google Scholar] [CrossRef] [Scilit]
  16. Demirbas, A.; Taylan, O.; Kaya, D. Biogas production from municipal sewage sludge (MSS). Energy Sources Part A 2016, 38, 3027–3033. [Google Scholar] [CrossRef] [Scilit]
  17. Felca, A.T.A.; Barros, R.M.; Tiago Filho, G.L.; Dos Santos, I.F.S.; Ribeiro, E.M. Analysis of biogas produced by the anaerobic digestion of sludge generated at wastewater treatment plants in the South of Minas Gerais, Brazil as a potential energy source. Sustain. Cities Soc. 2018, 41, 139–153. [Google Scholar] [CrossRef] [Scilit]
  18. Lopes, L.S.; Rosa, A.P.; Marco, J.S.; Possetti, G.R.C.; Mesquita, T.C.R. Energy potential of biogas and sludge from UASB reactors in the state of Paraná, Brazil. Rev. Ambient. Água 2020, 15, e2398. [Google Scholar] [CrossRef] [Scilit]
  19. Tamar, S.A.; Umer, M.I. Stabilization of sludge in Zakho municipal wastewater by anaerobic digestion for biogas production in Kurdistan Region, Iraq. Sci. J. Univ. Zakho 2022, 10, 86–92. [Google Scholar] [CrossRef] [Scilit]
  20. Guilford, J.P. Fundamental Statistics in Psychology and Education; McGraw-Hill: New York, NY, USA, 1965. [Google Scholar]
  21. Mineo, A.; Di Leto, Y.; Cosenza, A.; Capri, F.C.; Gallo, G.; Alduina, R.; Ni, B.J.; Mannina, G. Enhancing volatile fatty acid production from sewage sludge in batch fermentation tests. Chemosphere 2024, 349, 140859. [Google Scholar] [CrossRef] [Scilit]
  22. Ucisik, A.S.; Henze, M. Biological hydrolysis and acidification of sludge under anaerobic conditions: The effect of sludge type and origin on the production and composition of volatile fatty acids. Water Res. 2008, 42, 3729–3738. [Google Scholar] [CrossRef] [Scilit]
  23. Ramos-Suarez, M.; Zhang, Y.; Outram, V. Current perspectives on acidogenic fermentation to produce volatile fatty acids from waste. Rev. Environ. Sci. Biotechnol. 2021, 20, 439–478. [Google Scholar] [CrossRef] [Scilit]
  24. Kakar, F.L.; Aqeel, H.; Liss, S.N.; Elbeshbishy, E. Impact of hydrothermal pretreatment parameters on mesophilic and thermophilic fermentation and anaerobic digestion of municipal sludge. Fermentation 2023, 9, 508. [Google Scholar] [CrossRef] [Scilit]
  25. Ibro, M.K.; Ancha, V.R.; Lemma, D.B. Impacts of anaerobic co-digestion on different influencing parameters: A critical review. Sustainability 2022, 14, 9387. [Google Scholar] [CrossRef] [Scilit]
  26. Iglesias-Iglesias, R.; Campanaro, S.; Treu, L.; Kennes, C.; Veiga, M.C. Valorization of sewage sludge for volatile fatty acids production and role of microbiome on acidogenic fermentation. Bioresour. Technol. 2019, 291, 121817. [Google Scholar] [CrossRef] [Scilit] [PubMed]
  27. Wang, X.; Jiang, C.; Wang, D.; Fan, L.; Yang, Y.; Yang, T.; Peng, J.; Zhang, X.; Zhuang, X. Harnessing the potential of sludge fermentation liquid to induce partial nitrification. Fermentation 2024, 10, 289. [Google Scholar] [CrossRef] [Scilit]
  28. Sun, J.; Zhang, L.; Loh, K.C. Review and perspectives of enhanced volatile fatty acids production from acidogenic fermentation of lignocellulosic biomass wastes. Bioresour. Bioprocess. 2021, 8, 68. [Google Scholar] [CrossRef] [Scilit]
  29. Karellas, S.; Boukis, I.; Kontopoulos, G. Development of an investment decision tool for biogas production from agricultural waste. Renew. Sustain. Energy Rev. 2010, 14, 1273–1282. [Google Scholar] [CrossRef] [Scilit]
  30. Holm-Nielsen, J.B.; Al Seadi, T.; Oleskowicz-Popiel, P. The future of anaerobic digestion and biogas utilization. Bioresour. Technol. 2009, 100, 5478–5484. [Google Scholar] [CrossRef] [Scilit]
  31. Sakaveli, F.; Petala, M.; Tsiridis, V.; Darakas, E. Enhancing methane yield in anaerobic co-digestion of primary sewage sludge: A comprehensive review on potential additives and strategies. Waste 2024, 2, 29–57. [Google Scholar] [CrossRef] [Scilit]
  32. Wang, X.; Lu, X.; Li, F.; Yang, G. Effects of temperature and carbon-nitrogen (C/N) ratio on the performance of anaerobic co-digestion of dairy manure, chicken manure and rice straw: Focusing on ammonia inhibition. PLoS ONE 2014, 9, e97265. [Google Scholar] [CrossRef] [Scilit] [PubMed]
  33. Pratap, V.; Kumar, S.; Yadav, B.R. Sewage sludge management and enhanced energy recovery using anaerobic digestion: An insight. Water Sci. Technol. 2024, 90, 696–720. [Google Scholar] [CrossRef] [Scilit] [PubMed]
  34. Elsayed, M.; Diab, A.; Soliman, M. Methane production from anaerobic co-digestion of sludge with fruit and vegetable wastes: Effect of mixing ratio and inoculum type. Biomass Convers. Biorefin. 2021, 11, 989–998. [Google Scholar] [CrossRef] [Scilit]
  35. Radetić, B. Anaerobic digestion: Technical realizations in municipal sludge treatment. In Handbook of Water and Used Water Purification; Lahnsteiner, J., Ed.; Springer: Cham, Switzerland, 2024. [Google Scholar] [CrossRef] [Scilit]
  36. Gracia, J.; Acevedo, O.; Acevedo, P.; Mosquera, J.; Montenegro, C.; Cabeza, I. Statistical modeling and optimization of volatile fatty acids production by anaerobic digestion of municipal wastewater sludge. Environ. Sci. Pollut. Res. 2025, 32, 27929–27941. [Google Scholar] [CrossRef] [Scilit]
  37. Wu, H.-M.; Li, X.; Chen, J.-N.; Yan, Y.-J.; Kobayashi, T.; Hu, Y.; Zhang, X. Food waste anaerobic digestion under high organic loading rate: Inhibiting factors, mechanisms, and mitigation strategies. Processes 2025, 13, 2090. [Google Scholar] [CrossRef] [Scilit]
  38. Ghaleb, A.A.S.; Kutty, S.R.M.; Imteaz, M.A.; Jagaba, A.H.; Saeed, A.A.H.; Almahbashi, N.M.Y. Anaerobic co-digestion of waste activated oily-biological sludge with sugarcane bagasse using thermo-chemical pre-treatment under thermophilic condition. Environ. Dev. Sustain. 2024, 1–31. [Google Scholar] [CrossRef] [Scilit]
  39. Dalkılıç, K.; Uğurlu, A. Influence of hydraulic retention time and reactor configuration during fermentation of diluted chicken manure. Appl. Biochem. Biotechnol. 2017, 181, 157–176. [Google Scholar] [CrossRef] [Scilit]
  40. Appels, L.; Baeyens, J.; Degrève, J.; Dewil, R. Principles and Potential of the Anaerobic Digestion of Waste Activated Sludge. Prog. Energy Combust. Sci. 2008, 34, 755–781. [Google Scholar] [CrossRef] [Scilit]
  41. Rusanowska, P.; Zieliński, M.; Kisielewska, M.; Dudek, M.; Paukszto, Ł.; Dębowski, M. Methane production, microbial community, and volatile fatty acids profiling during anaerobic digestion under different organic loading. Energies 2024, 18, 575. [Google Scholar] [CrossRef] [Scilit]
  42. Halecki, W.; Młyńska, A.; Chmielowski, K. Appraisal of Industrial Pollutants in Sewage and Biogas Production Using Multivariate Analysis and Unsupervised Machine Learning Clustering. Appl. Sci. 2025, 15, 6222. [Google Scholar] [CrossRef] [Scilit]
  43. Michalski, K.; Kośka-Wolny, M.; Chmielowski, K.; Bedla, D.; Petryk, A.; Guzdek, P.; Dąbek, K.A.; Gąsiorek, M.; Grübel, K.; Halecki, W. Examining the Potential of Biogas: A Pathway from Post-Fermented Waste into Energy in a Wastewater Treatment Plant. Energies 2024, 17, 5618. [Google Scholar] [CrossRef] [Scilit]
  44. Sionkowski, T.; Halecki, W.; Jasiński, P.; Chmielowski, K. Achieving High-Efficiency Wastewater Treatment with Sequencing Batch Reactor Grundfos Technology. Processes 2025, 13, 1173. [Google Scholar] [CrossRef] [Scilit]
  45. Sionkowski, T.; Halecki, W.; Chmielowski, K. Advancing Urban Wastewater Management: Optimizing Sewer Performance through Innovative Material Selection for the Armlet with a Wet Circuit Measurement System. Appl. Sci. 2023, 13, 10892. [Google Scholar] [CrossRef] [Scilit]
  46. Ahring, B.K.; Enriquez, F.A.; Khan, M.U.; Valdez, P.; Pierobon, F.; Seiple, T.E.; Garrison, R. Improving Anaerobic Digestion of Sewage Sludge to Renewable Natural Gas by the Advanced Pretreatment & Anaerobic Digestion Technology (APAD): Pilot Testing. Chem. Eng. J. 2026, 531, 173931. [Google Scholar] [CrossRef] [Scilit]
  47. Wu, R.; Liu, Y.; Zhang, Q.; Zhang, Y.; Sun, Y. Flexible Biogas Production from Co-Digestion of Food Waste and Waste Activated Sludge via Two-Phase Anaerobic Digestion Enhanced by Eggshell-Mediated Acidogenesis. J. Environ. Chem. Eng. 2026, 14, 121532. [Google Scholar] [CrossRef] [Scilit]
  48. Ayyoub, H.; Kaicer, M.; Elabbassi, I.; Taky, M. Predictive Modelling of Aerobic Membrane Bioreactors Using Machine Learning Algorithms for the Treatment of Wastewater from Fish Canneries. J. Water Land Dev. 2025, 66, 79–88. [Google Scholar] [CrossRef] [Scilit]
  49. Barahi, S.; Azizi, A.; Taky, M.; Belhamidi, S. Machine Learning Algorithms in Wastewater Technology: Predicting Treatment Quality and Efficiency. J. Water Land Dev. 2025, 66, 137–151. [Google Scholar] [CrossRef] [Scilit]
  50. Jucherski, A.; Walczowski, A.; Grabowska-Polanowska, B.; Operacz, A.; Bugajski, P. Opportunities and Constraints for Effective Treatment of Domestic Wastewater in Rural Onsite Wastewater Treatment Systems Operating in a Foothill Climate. J. Water Land Dev. 2025, 66, 244–253. [Google Scholar] [CrossRef] [Scilit]
  51. Donoso-Bravo, A.; Pérez-Elvira, S.I.; Fdz-Polanco, F. Model selection, identification and validation in anaerobic digestion: A review. Water Res. 2011, 45, 5347–5364. [Google Scholar] [CrossRef] [Scilit]
Figure 1. Sludge-to-energy process flow diagram.
Energies 19 01377 g001
Figure 2. Daily amounts of sewage sludge at the WWTP in 2024.
Energies 19 01377 g002
Figure 3. Average monthly amounts of sewage sludge at the WWTP in 2024.
Energies 19 01377 g003
Figure 4. Daily biogas production at the WWTP in 2024.
Energies 19 01377 g004
Figure 5. Average monthly biogas production at the WWTP in 2024.
Energies 19 01377 g005
Figure 6. The dependence of the amount of biogas produced on the amount of the total sludge produced.
Energies 19 01377 g006
Figure 7. Grid autonomy performance model for monthly production and self-sufficiency ratio.
Energies 19 01377 g007
Figure 8. Linear regression model of monthly self-consumption ratio stability.
Energies 19 01377 g008
Figure 9. Pearson correlation matrix of cogeneration, boiler, flare, total biogas, and heat output. (*) indicates statistically significant differences; * p < 0.05, ** p < 0.01, *** p < 0.001, ns = not significant.
Energies 19 01377 g009
Figure 10. Biogas thermal performance during the study.
Energies 19 01377 g010
Figure 11. Multivariate efficiency mapping: A Canonical Correlation Analysis (CCA) of plant operations.
Energies 19 01377 g011
Figure 12. Statistical hierarchy and driver analysis of biogas power output.
Energies 19 01377 g012
Table 1. Descriptive statistics for sewage sludge produced at the WWTP in 2024.
Descriptive StatisticsParameter
SkKurtCVSTDMaxAvgMin
(–)(–)(–)(m3/d)(m3/d)(m3/d)(m3/d)
0.290.20.1610.8610167.9929Primary thickened sludge
0.23−0.820.235.513923.8810Excessive thickened sludge
0.120.460.1311.712591.748Total thickened sludge
Min is minimum, Avg is average, Max is maximum, STD is standard deviation, CV is coefficient of variation, Kurt is kurtosis, and Sk is skewness.
Table 2. Descriptive statistics for sewage sludge produced at the WWTP in particular months of 2024.
MonthDescriptive
Statistics
XIIXIXIXVIIIVIIVIVIVIIIIII
Primary thickened sludge
542947485165656859514951(m3/d)Min
64.2354.2359.6573.769.9777.5281.2778.0671.565.4257.6262.29(m3/d)Avg
7375769810193999086786973(m3/d)Max
4.968.97.39.579.86.8410.435.468.237.625.395.98(m3/d)STD
0.080.160.120.130.140.090.130.070.120.120.090.1(–)CV
−0.624.37−0.531.281.92−0.17−1.15−0.06−1.54−0.54−0.56−1.06(–)Kurt
−0.20−1.420.3800.640.460.160.580.23−0.070.68−0.23(–)Sk
Excessive thickened sludge
201717141019222016252823(m3/d)Min
21.7120.0319.2316.5317.0622.1926.4726.2327.129.9744.8128.35(m3/d)Avg
252323192026303136393833(m3/d)Max
1.321.721.431.52.052.092.172.75.522.82.332.12(m3/d)STD
0.060.090.070.090.120.090.080.10.20.090.050.07(–)CV
−0.15−0.680.2−1.033.09−1.31−0.82−0.54−0.832.01−0.060.31(–)Kurt
0.750.190.550.12−1.210.02−0.09−0.37−0.271.010.52−0.02(–)Sk
Total thickened sludge
774864676685889379818181(m3/d)Min
85.9472.378.8790.2387.0399.71107.73104.2998.695.3989.6290.65(m3/d)Avg
97969611412011712511810910798102(m3/d)Max
5.379.17.899.0810.657.9211.156.556.687.54.626.18(m3/d)STD
0.060.130.10.10.120.080.10.060.070.080.050.07(–)CV
−0.574.84−0.651.151.75−0.33−1.11−0.370.81−0.70−0.55−1.03(–)Kurt
0.16−1.510.20.150.390.36−0.060.59−0.75−0.16−0.060.24(–)Sk
Min is minimum, Avg is average, Max is maximum, STD is standard deviation, CV is coefficient of variation, Kurt is kurtosis, and Sk is skewness.
Table 3. Descriptive statistics for biogas produced at the WWTP in 2024.
Descriptive StatisticsParameter
SkKurtCVSTDMaxAvgMin
(–)(–)(–)(m3/d)(m3/d)(m3/d)(m3/d)
−0.470.730.2229123451311.29403Biogas production
Min is minimum, Avg is average, Max is maximum, STD is standard deviation, CV is coefficient of variation, Kurt is kurtosis, and Sk is skewness.
Table 4. Descriptive statistics for biogas produced at the WWTP in particular months of 2024.
MonthDescriptive
Statistics
XIIXIXIXVIIIVIIVIVIVIIIIII
Biogas production
980.9928.4997.9649807.4948.71049.7933.21183.51064.6714.9403(m3/d)Min
1341.771428.411389.891304.131374.281559.181564.191237.241727.861557.771113.641004.25(m3/d)Avg
1606.91692.517111841.51784.91930.523141977.723451653.41623.11853(m3/d)Max
220.7202.07201.96264.87207.91214.04266.96230257.96101.48219.89330.91(m3/d)STD
0.160.140.150.20.150.140.170.190.150.070.20.33(–)CV
−1.530.38−0.960.181.631.661.231.471.2619.01−0.070.42(–)Kurt
−0.51−1.22−0.45−0.18−0.61−1.060.78−1.180.43−4.05−0.680.72(–)Sk
Note: The higher variability in biogas production observed in January is associated with winter temperature conditions that reduce digestion activity, seasonal changes in sludge composition (lower vs. content), and routine operational adjustments performed at the beginning of the year. Min is minimum, Avg is average, Max is maximum, STD is standard deviation, CV is coefficient of variation, Kurt is kurtosis, Sk is skewness.
Disclaimer/Publisher’s Note: The statements, opinions and data contained in all publications are solely those of the individual author(s) and contributor(s) and not of MDPI and/or the editor(s). MDPI and/or the editor(s) disclaim responsibility for any injury to people or property resulting from any ideas, methods, instructions or products referred to in the content.