1. Introduction
Energy is one of the most fundamental organizing principles of human societies and economic systems. Historical experience consistently shows that every major technological leap—from the Industrial Revolution to the digital age—has been accompanied by an increase in energy consumption. A historical review indicates that during energy transitions, demand for energy services has typically increased, while new technologies have not entirely supplanted prior ones [
1]. This observation is further reinforced by [
2], who shows that major technological transitions are slow, often additive, and, in the long run, lead to an increase in total energy consumption. Another study reaches a similar conclusion, emphasizing that large-scale technological and institutional changes take decades to unfold, while infrastructure expansion itself increases energy demand [
3]. Methodological reflections further point out that the measurement of historical technological transitions was dominated by their “additive” nature, resulting in a permanent increase in total energy use [
4].
However, the literature on the relationship between technological progress and energy efficiency also warns that efficiency gains do not necessarily reduce energy consumption. Comprehensive empirical evidence underscores the importance of rebound effects [
5], while Fich et al. (2022) demonstrate—through a modern interpretation of the Jevons paradox—that technological progress often induces excess consumption in complex economic systems [
6]. According to the dynamic panel model of Jin et al. (2018) [
7], in the short run, innovation increases energy consumption, whereas in the long run, a bidirectional positive relationship emerges between innovation and energy use. Sorrell’s (2010) [
8] comprehensive theoretical and empirical review also concludes that historical experience has shown that absolute energy consumption has increased despite efficiency improvements.
These historical patterns are also observed in the current digital era. The rise of artificial intelligence, large data centers, and the digital economy is generating new, unprecedented levels of electricity demand. Several recent studies analyze the rapidly increasing energy demand of AI-based data centers and the associated data-collection challenges [
9], while other work quantifies how the cumulative power demand of AI accelerators can affect electricity systems [
10]. Model-based analysis further highlights the structural tension between the rapid growth in digital data demand and the limitations of renewable capacity scalability [
11]. Several recent studies warn that digital demand could soon exceed realistic electricity generation capacity [
12,
13,
14]. At the same time, ref. [
15] emphasizes that data centers can also enhance system flexibility within appropriate regulatory and technological environments.
The relationship between energy and economic performance is extremely close. GDP and energy use have historically moved together, as energy is a fundamental input to all technological and production processes. Nevertheless, traditional economic models often under-represent the role of energy, which can also lead to distortions in policy-making. The energy crisis of the 2020s—and the subsequent wave of inflation—once again highlighted that the stability of energy supply is a key factor in the economic and social order of the European Union. A wide range of empirical evidence supports a strong link between energy and economic growth [
16,
17], whereas some studies present a more nuanced picture, noting that a decrease in energy consumption does not always lead to a decline in growth [
18].
In Europe, the intertwining of energy, prosperity, and social complexity has been particularly acute amid dependence on Russian energy sources. In the wake of the 2022 war in Ukraine, energy security has clearly acquired a geopolitical and social dimension. The adoption of the REPowerEU program is a good example of how crises accelerate institutional and policy innovation to strengthen energy security [
19]. However, several analyses point out that the early effectiveness of policy responses is significantly influenced by external factors, such as global price movements and Russian strategic decisions [
20,
21,
22].
Three studies on the EU’s energy independence are similar [
23,
24,
25]. Their common conclusion is that the EU’s energy independence is not a goal that can be captured by a single indicator, but rather the result of a systemic transformation: it is shaped by security of supply, import exposure, energy mix, and transitional performance. All three works emphasize that the shocks of the 2020s (especially the European energy crisis) accelerated the political weight of the energy transition and forced new paths in the Member States. They also consistently point to heterogeneity within the EU: the starting energy structures and adaptability of the Member States differ, and therefore, the path towards energy independence differs for each group of countries. Finally, all three studies implicitly suggest that energy independence can only be meaningfully interpreted in conjunction with diversification, decarbonization, and institutional/political adaptation.
Several studies emphasize that the EU’s energy security is a multidimensional issue: the stability of supply is not only a function of import exposure, but also of technological, systemic, and institutional “readiness”. A common element is that the transition (decarbonization) only strengthens energy security if the system’s flexibility—especially that of the electricity system—develops in parallel (e.g., storage, integration, and operational adaptation). In addition, all three articles implicitly point to heterogeneity within the EU: the initial energy structures and the “secure transition” trajectories of the Member States differ; therefore, a differentiated policy toolbox is needed [
26,
27,
28].
Recent research highlights that the transition to a high share of renewable energy in interconnected energy systems involves significant operational risks and uncertainties, as inadequate grid flexibility and storage capacity can lead to instability and limit renewable energy generation, increasing the likelihood of system disruptions even if fossil fuel sources are gradually phased out [
29]. The energy transition creates new, difficult-to-predict risks to system stability due to the rise of variable and low-inertia renewables. Therefore, flexibility tools (especially storage) are crucial to maintain a reliable supply [
30].
This study provides a comprehensive picture of the security of energy supply and the evolution of import dependence in the European Union, with a particular focus on the period 2014–2023, focusing on the structure of energy imports, degree of energy dependence, gas balance, and source mix of electricity generation. It also reveals that energy is not just an economic input, but also a key factor in social stability, competitiveness, and political space in the EU.
The novelty of the study lies in the fact that it uses a combination of quantitative methods—panel regression, volatility indicators, and cluster analysis—to examine the relationships between energy dependence and security of supply. Through robustness tests (pre- and post-2020), the study provides a reliable picture of how the Russian–Ukrainian war and energy market shocks have transformed the vulnerability and relative position of the Member States.
The originality of the research lies in the fact that it captures energy dependence in a multidimensional way by taking into account import volumes, domestic production capacities, and the structure of the energy mix. This method allows the identification of which EU countries are particularly vulnerable and which are relatively stable.
The contributions of the study are twofold: on the one hand, it provides new scientific evidence of the close relationship between energy and economic performance and its regime-dependent development; on the other hand, it provides guidance for the EU from a policy perspective. Based on the results, the key to increasing energy security is diversification, expanding domestic production capacities, and strengthening flexible crisis management mechanisms. This research thus contributes to reducing the EU’s energy dependency and maintaining long-term supply security. The analysis aims to highlight that energy is not just an input to the economy, but also a determinant of social stability and political space.
In response to the geopolitical shock following Russia’s invasion of Ukraine, the European Union articulated a strategic objective of eliminating its structural dependence on Russian pipeline gas. This objective has been accompanied by a rapid expansion of LNG import capacity and the development of alternative supply routes, including the Balkan vertical gas corridor, aimed at strengthening interconnectivity between Southern and Central Europe. These measures represent not only short-term crisis management but a structural reconfiguration of the EU’s external energy exposure.
The study interprets energy dependence as the proportion of imported energy in a country’s total energy consumption, i.e., as a measure of structural exposure to external sources. Security of supply, on the other hand, means the extent to which the energy system can provide a stable, continuous, and affordable energy supply even in the event of external shocks, while energy vulnerability is the combined consequence of dependence and volatility: the extent to which a country is vulnerable to geopolitical, market, or infrastructural disruptions. The three concepts are thus hierarchically linked: high energy dependence increases potential vulnerability, which can ultimately weaken security of supply, especially with low diversification and high volatility.
The research hypotheses are formulated as follows:
H1: Energy import dependency increases structural vulnerability in the EU, but its effects differ across Member States depending on volatility and diversification levels.
(Member States with high and volatile import dependency exhibit greater exposure to external shocks, although the magnitude of vulnerability is not uniform.)
H2: Diversification of the energy mix significantly reduces vulnerability and volatility in the EU energy system.
(Member States with a more balanced electricity generation structure are more resilient to market and geopolitical disruptions.)
H3: Deterioration in supply security is associated with heightened macroeconomic pressures, particularly through volatility effects rather than dependency levels alone.
(Periods of increased energy price volatility and supply instability are linked to inflationary pressures and economic stress in Member States.)
H4: Coal imports no longer constitute a statistically significant determinant of overall energy dependency in the European Union.
(Although coal historically played a central role in industrial production and electricity generation, empirical evidence suggests that its current contribution to structural energy dependency is limited compared to gas and oil.)
3. Results
The results presented below reveal how energy import structure, domestic production capacities, and volatility patterns affect the energy dependence and security of supply situation of EU Member States, highlight structural differences between countries, and provide a basis for subsequent policy interpretation.
3.1. Panel Regression Results (FE vs. RE)
The main results are shown in
Table 3 (coefficient (SE), significance: ***
p < 0.001, *
p < 0.05).
The economic interpretation of the panel estimates clearly outlines the structural determinants of the European Union’s energy dependence. The positive and significant coefficient for the logarithm of natural gas imports in both the fixed- and random-effects models suggests that increases in gas imports disproportionately strengthen import dependence. Since gas plays a key role in the EU energy system—especially in industrial use and electricity balancing—exposure to external gas sources creates structural vulnerability.
For oil imports, the positive relationship is significant only in the random-effects model, suggesting that oil continues to contribute to energy dependence. Still, its impact is less homogeneous across Member States. This is consistent with the fact that oil is primarily dominant in the transport sector, where demand elasticity and substitutability are limited. At the same time, the diversification of supply sources is more advanced than for natural gas.
Coal imports do not show a stable and significant relationship with energy dependence in any of the models. This suggests that the role of coal in the EU energy structure is no longer a determining structural factor, which empirically supports the realignment within the fossil energy mix and the gradual relegation of coal to the background.
The negative, highly significant coefficient for the gas balance (supply/use ratio) indicates that strengthening domestic availability—for example, through storage, LNG capacity, or alternative supply routes—reduces energy dependence. This expresses economically that supply-side stabilizing mechanisms reduce the structural weight of external exposure.
The negative sign of the logarithm of electricity production—especially pronounced in the random effects model—indicates that higher domestic production capacity reduces overall import dependence. This suggests that electrification and strengthening the domestic production base (especially renewables and nuclear sources) represent a structural advantage for EU member states not only from a climate policy perspective, but also from an energy security perspective.
The R2 of 0.968 means that the model “captures” the differences between countries and between years very well, i.e., the development of energy dependence can be largely explained by the factors involved. The fact that the random effects model gives similar results shows that the main conclusions do not depend on a single calculation method, but reflect a stable pattern.
The regression results indicate that natural gas and oil imports are statistically significant determinants of energy dependency, while coal imports do not exert a robust and significant effect. This finding suggests that the contemporary structure of EU energy vulnerability is primarily linked to gas and oil exposure rather than coal reliance. The diversification variable shows a negative and significant coefficient, indicating that a more balanced electricity generation structure mitigates structural dependency. Country fixed effects confirm persistent heterogeneity across Member States, while time effects reveal a marked post-2020 increase in common volatility without fundamentally altering the underlying structural drivers of dependency.
According to the verbal assessment of the data, (1) Hypothesis H1 (import dependence vs. vulnerability) is supported by the fact that the coefficients for gas and oil imports are consistently positive and (especially for gas) highly significant. (2) H2 (diversification reduces risks) is indirectly supported: the negative sign of the gas balance and domestic electricity production suggests that higher domestic availability/production is associated with lower dependence. (3) The effect of coal imports is not significant; this may be consistent with the persistent decline in the weight of coal in the EU energy mix and with the fact that the variance in the dependency ratio is predominantly driven by gas and oil.
For the EU as a whole, the panel regression results clearly show that the most significant drivers of EU energy dependence are natural gas and oil imports. In other words, the greater the proportion of these that an EU Member State has to obtain from abroad, the more vulnerable the economy and society are. This relationship was also statistically robust, especially in the case of natural gas. This resonates with the experience of the 2022 energy crisis, when disruptions in Russian gas supplies directly drove up prices and triggered a wave of inflation in the EU.
However, the impact of import dependence is tempered by the role of domestic resources and production: where domestic electricity generation is high (for example, in France thanks to nuclear power plants, or in the Scandinavian countries based on hydropower), the economy is less dependent on external energy suppliers. Similarly, in the gas balance, the existence of domestic production and storage capacity (for example, the Netherlands, while still producing large volumes of natural gas from the Groningen field) significantly reduced dependence. This kind of “energy self-sufficiency” is also a key issue in political decision-making, because it is directly related to security of supply and the daily livelihood of the population (utilities, fuel prices).
The extremes in each Member State further illustrate the complexity of the situation. The import dependence of the Baltic States (Estonia, Latvia, Lithuania) and Finland was almost 100% for natural gas between 2014 and 2021, which means that they were almost entirely dependent on a single (Russian) source—this meant not only economic but also geopolitical vulnerability.
The results also show that Hungary is the most vulnerable economy in the EU to energy price shocks, as it is both highly import-dependent and highly energy-intensive. In the event of an EU-wide Russian gas embargo, Hungary would suffer the most significant GDP drop in the EU, of more than 4%.
Germany and Italy are among the largest gas and oil importers in the EU: the development of consumption in these countries directly affected the priorities of the EU’s energy policy, as these countries are decisive in terms of inflation and industrial competitiveness in the EU.
On the other extreme are countries such as France (nuclear self-sufficiency) and Sweden (hydro and wind energy), where high domestic energy production acts as a protective shield and has mitigated the risks arising from import dependence.
In addition to the aggregated EU-level results, the country-specific effects of the panel estimates also show well-interpretable patterns. In the case of France and Sweden, the negative sign of the country-fixed effects and the significant role of diversification indicate that nuclear and renewable electricity production reduce the structural level of import dependence. The energy dependence of these two countries is less sensitive to changes in gas imports than the EU average.
In the case of the Netherlands, the coefficient for gas imports is positive and strong, suggesting that the country has become more sensitive to external procurement following the decline in its domestic production capacity. According to the model, the change in the gas market position significantly increases the dependency indicator.
In Estonia, Latvia, and Lithuania, the effect of gas imports is particularly pronounced, which can be explained by historical Russian exposure and small-scale energy systems. When interpreted together with the volatility indicators, these countries belong to the most shock-sensitive group.
In Finland, the model shows a moderate but positive gas import effect, while diversification of the electricity generation structure partially dampens dependency. The results indicate signs of structural adjustment after 2022.
In Hungary, gas imports have a strong, positive relationship with the dependency indicator, while the effect of diversification is weaker. This indicates that the system is sensitive to external gas sources and that structural exposure is permanent.
For Germany, the coefficients for gas and oil imports are positive, but the growth in electricity generation (especially the increase in the share of renewables) partially offsets the dependency effect. The model reflects the structural consequences of the high gas exposure before 2022.
In Italy, the role of oil imports is more pronounced. At the same time, gas imports are also significant, suggesting an import-oriented structure stemming from the country’s geographical location and Mediterranean supply routes.
Overall, the panel regression results show that, while gas and oil are the most important determinants for the EU as a whole, structural differences across the individual Member States—energy mix, size, historical trajectory, and diversification—significantly influence the intensity and sensitivity of dependency.
The strong and statistically robust impact of gas imports on dependency levels provides empirical support for the EU’s strategic objective of phasing out Russian gas supplies. The results suggest that diversification through LNG imports and alternative transit corridors is economically justified, as gas dependency constitutes the most structurally significant driver of vulnerability within the Union.
Overall, the panel regression analysis provides quantitative evidence that EU energy dependency is shaped by both import structure and internal diversification capacity, highlighting the differentiated nature of vulnerability across Member States.
3.2. Results of Absolute Volatility Calculation
Table 4 shows the standard deviations for gas, oil, coal imports, gas balance, and electricity production by EU Member States.
Based on the calculation of absolute volatility, this study reveals that the most significant fluctuations in the European Union’s energy imports and consumption are observed in the oil and gas markets. The standard deviation for oil imports is in the order of several ten thousand GWh, while that for the gas balance is also outstanding. This high volatility reflects the extent to which the EU’s energy system is exposed to external shocks, including global price fluctuations, geopolitical events (e.g., sanctions and war conflicts), and changes in market demand and supply.
In contrast, the electricity generation sector is characterized by a greater degree of stability than the gas balance. The absolute volatility here is lower, which means that the domestic production capacities of EU Member States (e.g., nuclear power plants, renewables, and conventional power plants) can ensure a more continuous supply to meet consumption. This highlights that domestic energy production is a key stabilizing factor in the EU’s security of supply.
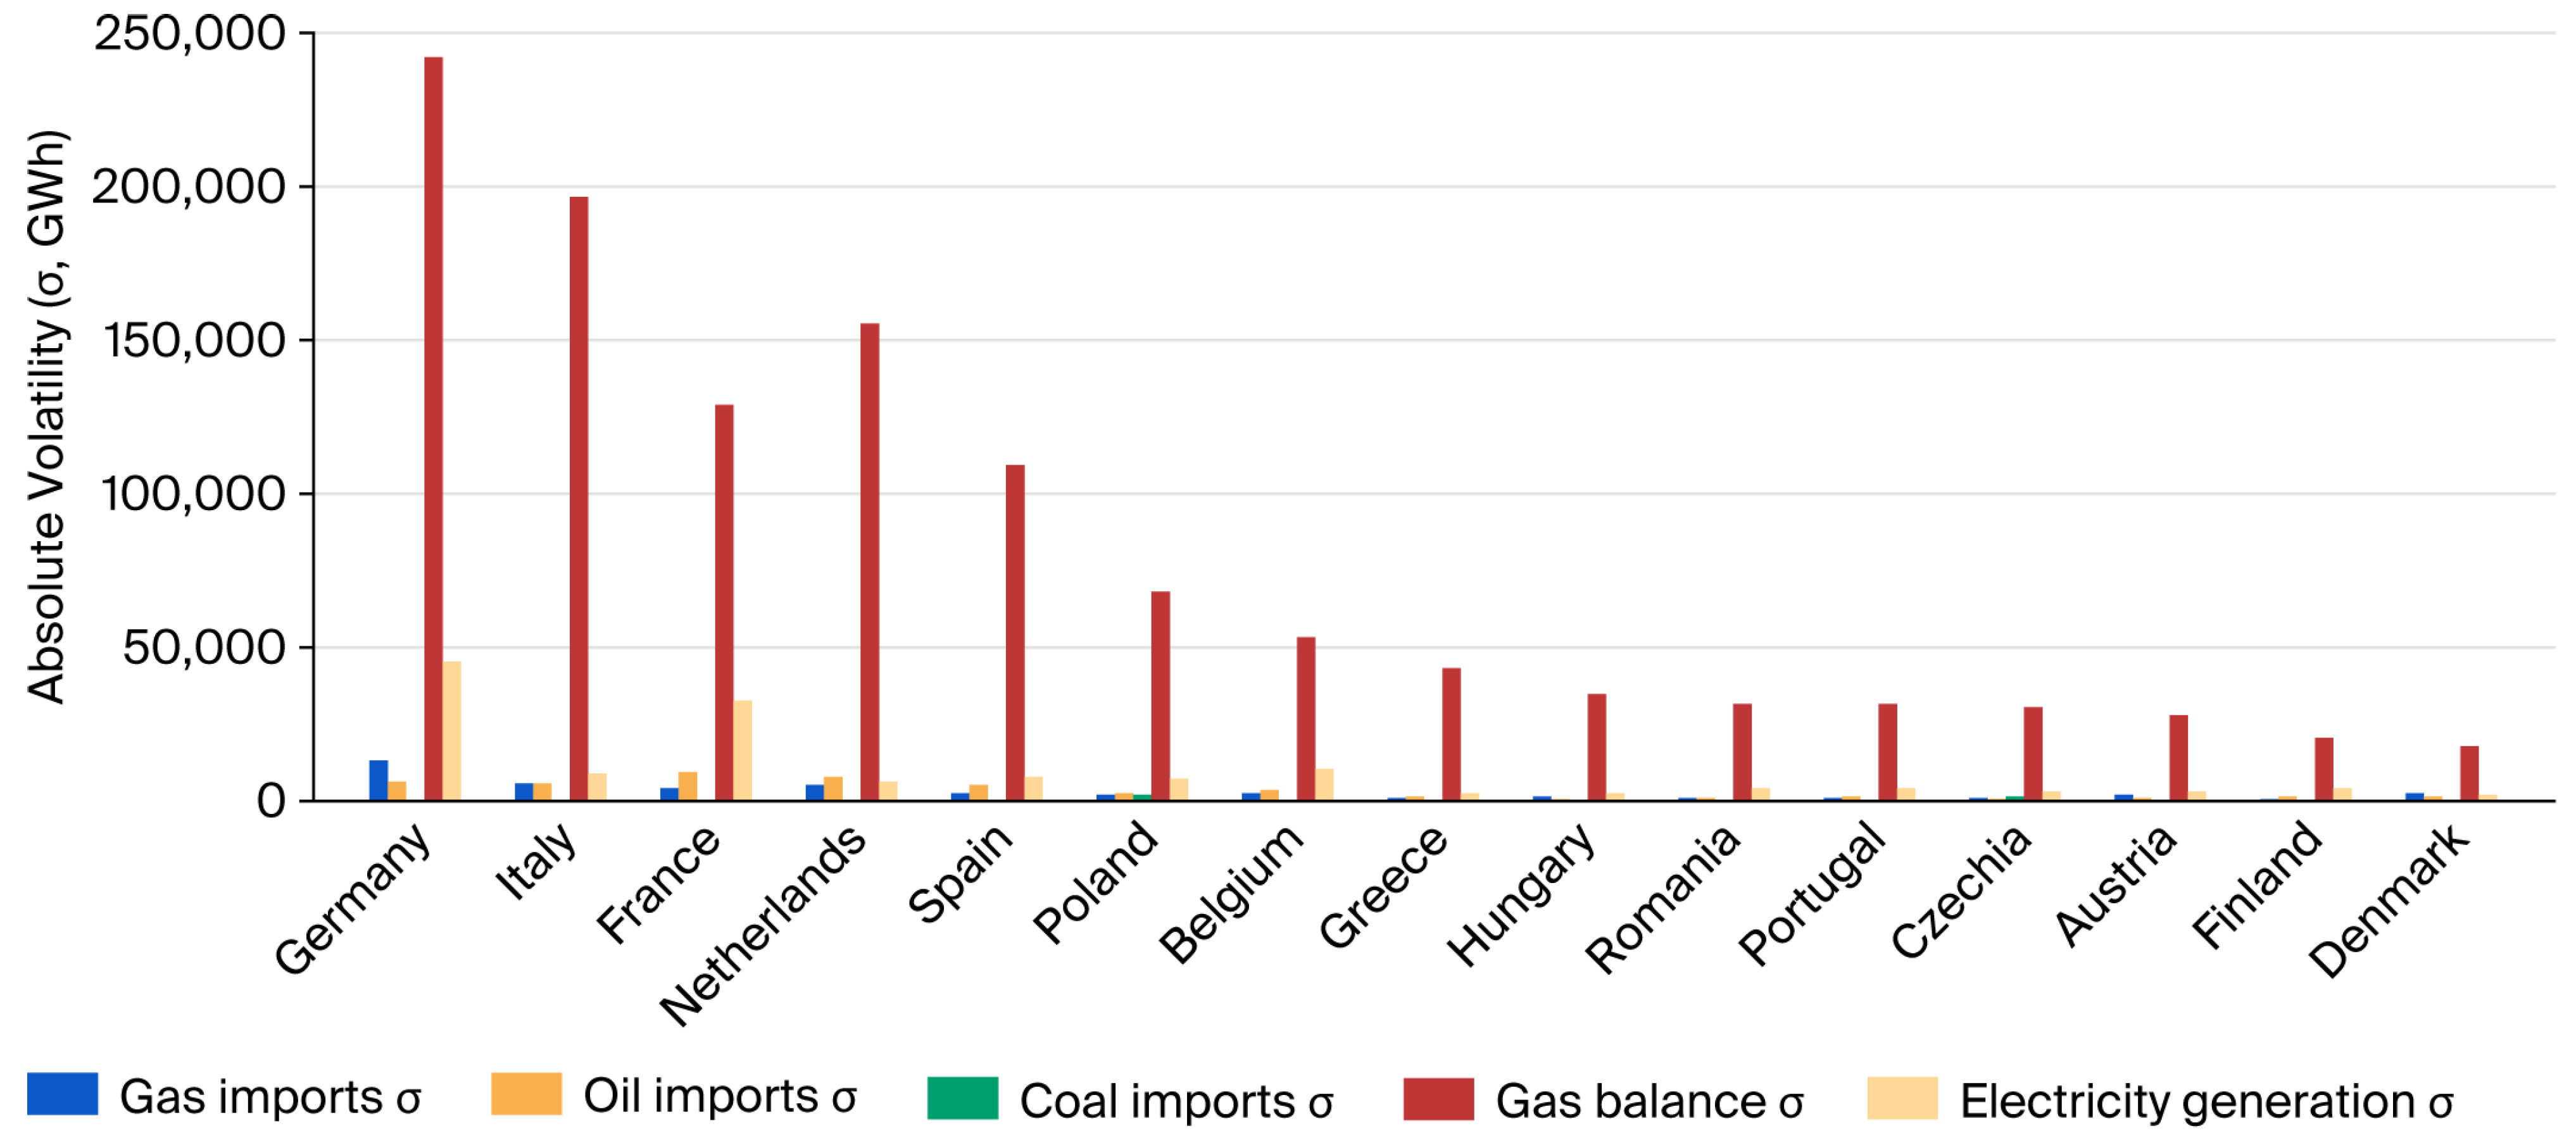
There are countries in the EU with significant fluctuations, such as Germany, Italy, and France. These large economies exhibit a substantial absolute variance in oil and gas imports. The magnitude alone explains the high volatility: with annual imports of hundreds of billions of GWh, even a slight percentage fluctuation represents a significant absolute fluctuation. This magnitude is why the political decisions of these countries have a direct impact on the entire EU energy market.
The case of Poland is unique: It has exceptionally high volatility in coal imports and coal-related energy consumption. This is a sign of the transformation of the coal-based energy mix: due to the phase-out policy and market forces (e.g., CO2 quota prices), the volume of coal imports has fluctuated strongly.
There are countries in the EU with low volatility, but these Member States are highly vulnerable. These countries include the Baltic States (Estonia, Latvia, and Lithuania) and smaller Member States (Malta, Cyprus, and Luxembourg), for which the absolute standard deviations are low, because the total volume of energy imports is also low. However, this does not mean a lower risk: these countries typically rely on a few sources, so the loss of even one supplier can have dramatic consequences. Absolute volatility in itself can therefore be misleading—in relative terms (based on the CV to be calculated in the next step), these countries show a much more volatile picture. Finally, this study highlights special case countries, such as France: Although its import volatility is significant, its electricity production is remarkably stable (relative to the size of the country’s electricity production). This is due to the large nuclear capacity, which ensures quasi-constant production, highlighting that domestic, low-carbon energy sources support not only climate protection goals but also supply security goals.
Figure 1 illustrates the 15 Member States of the European Union with the highest energy volatility, based on data from 2014 to 2023.
This study ranked the countries based on the aggregated absolute volatility of the five indicators examined (gas, oil, coal imports, gas balance, and electricity production). For each country, five columns are displayed, indicating the standard deviation (volatility) of the different energy sources in GWh. The diagram clearly highlights that Germany, Italy, and France exhibit the highest volatility, particularly in the areas of gas and oil imports. In contrast, in the case of several Central and Eastern European countries, coal-related volatility is dominant, while electricity production is relatively stable everywhere.
3.3. Relative Volatility Results
The relative indicator of absolute volatility in
Table 5 shows that it is not only large EU importers that are vulnerable. The CV values of oil and gas imports are lower in several large Member States (e.g., Germany, around 0.05–0.14), while in smaller states, they are often above 0.3–0.5. This indicates that small and medium-sized EU economies are more susceptible to relative volatility.
Member States with high CV values, such as Cyprus, Malta, Croatia, Bulgaria, and the Baltic States (especially in coal and gas imports), exhibit extreme volatility in relative terms (e.g., Cyprus’s coal import CV exceeds 2.5). This suggests that the energy supply structure in these EU Member States is highly vulnerable, and even minor market shocks can have a significant socio-economic impact.
Contrary to the previous statement, Member States with low CV values, such as those for Germany, France, Italy, and Spain, generally range between 0.05 and 0.15, reflecting the stabilizing effect of the order of magnitude and the multi-tiered energy structure.
The results also show sectoral differences, for example, for coal imports: it shows exceptionally high relative volatility in several Central and Eastern European countries (Bulgaria, Croatia, and Poland). This is the result of the coal phase-out and market uncertainties.
Gas imports present a different picture: their relative volatility is significantly higher in smaller EU Member States, while it is more moderate in larger economies; however, in absolute terms, it remains the most critical factor.
EU electricity production is stable in most Member States, with CV values between 0.05 and 0.15. This confirms that domestic production is much less volatile than import-dependent sources.
Relative volatility is a significant indicator because it indicates which EU Member States are most exposed to security of supply risks. Smaller Member States such as Cyprus, Malta, or Lithuania, despite being in the “low-risk” category based on absolute variance, are highly vulnerable in relative terms. This situation is also politically sensitive, as fluctuations in household prices can directly trigger social discontent.
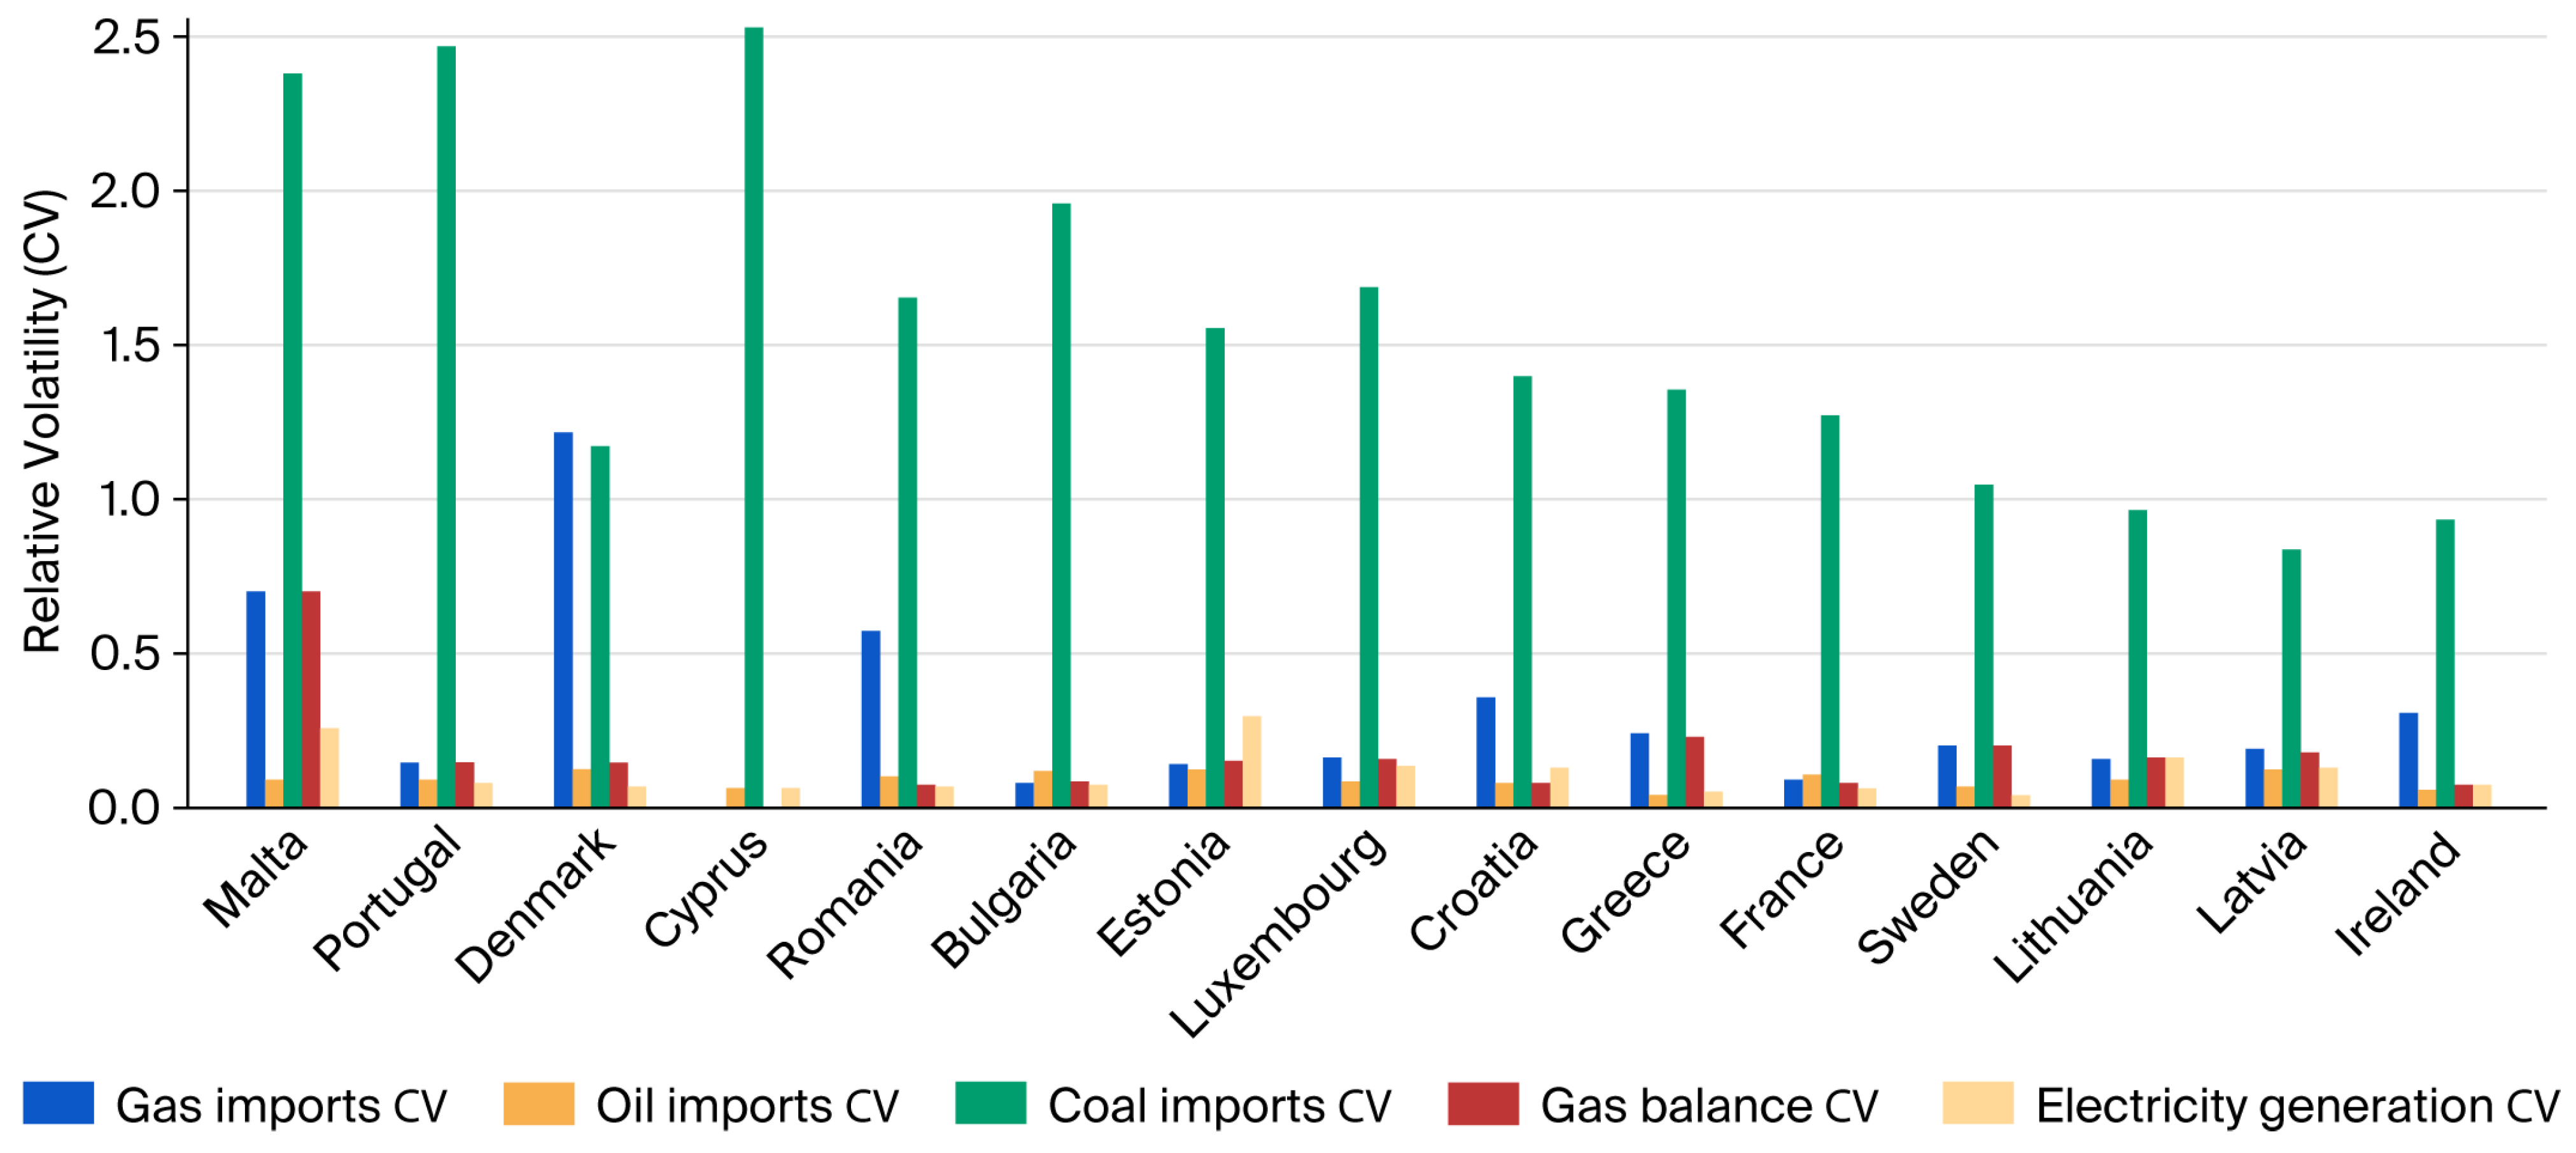
Figure 2 shows the 15 EU Member States with the highest relative volatility (CV) in energy supply between 2014 and 2023.
The study ranked the countries based on the combined magnitude of relative volatility in gas, oil, coal imports, gas balance, and electricity generation.
For each country, five columns are displayed, showing the volatility of each energy source relative to the average for that country. The results show that smaller and more import-dependent countries (e.g., Cyprus, Malta, and Lithuania) are much more volatile in relative terms than larger economies (e.g., Germany, France, Italy).
The more robust volatility indicates that smaller EU Member States face higher security of supply risks, even if they have smaller energy flows in absolute terms.
3.4. Clustering Results
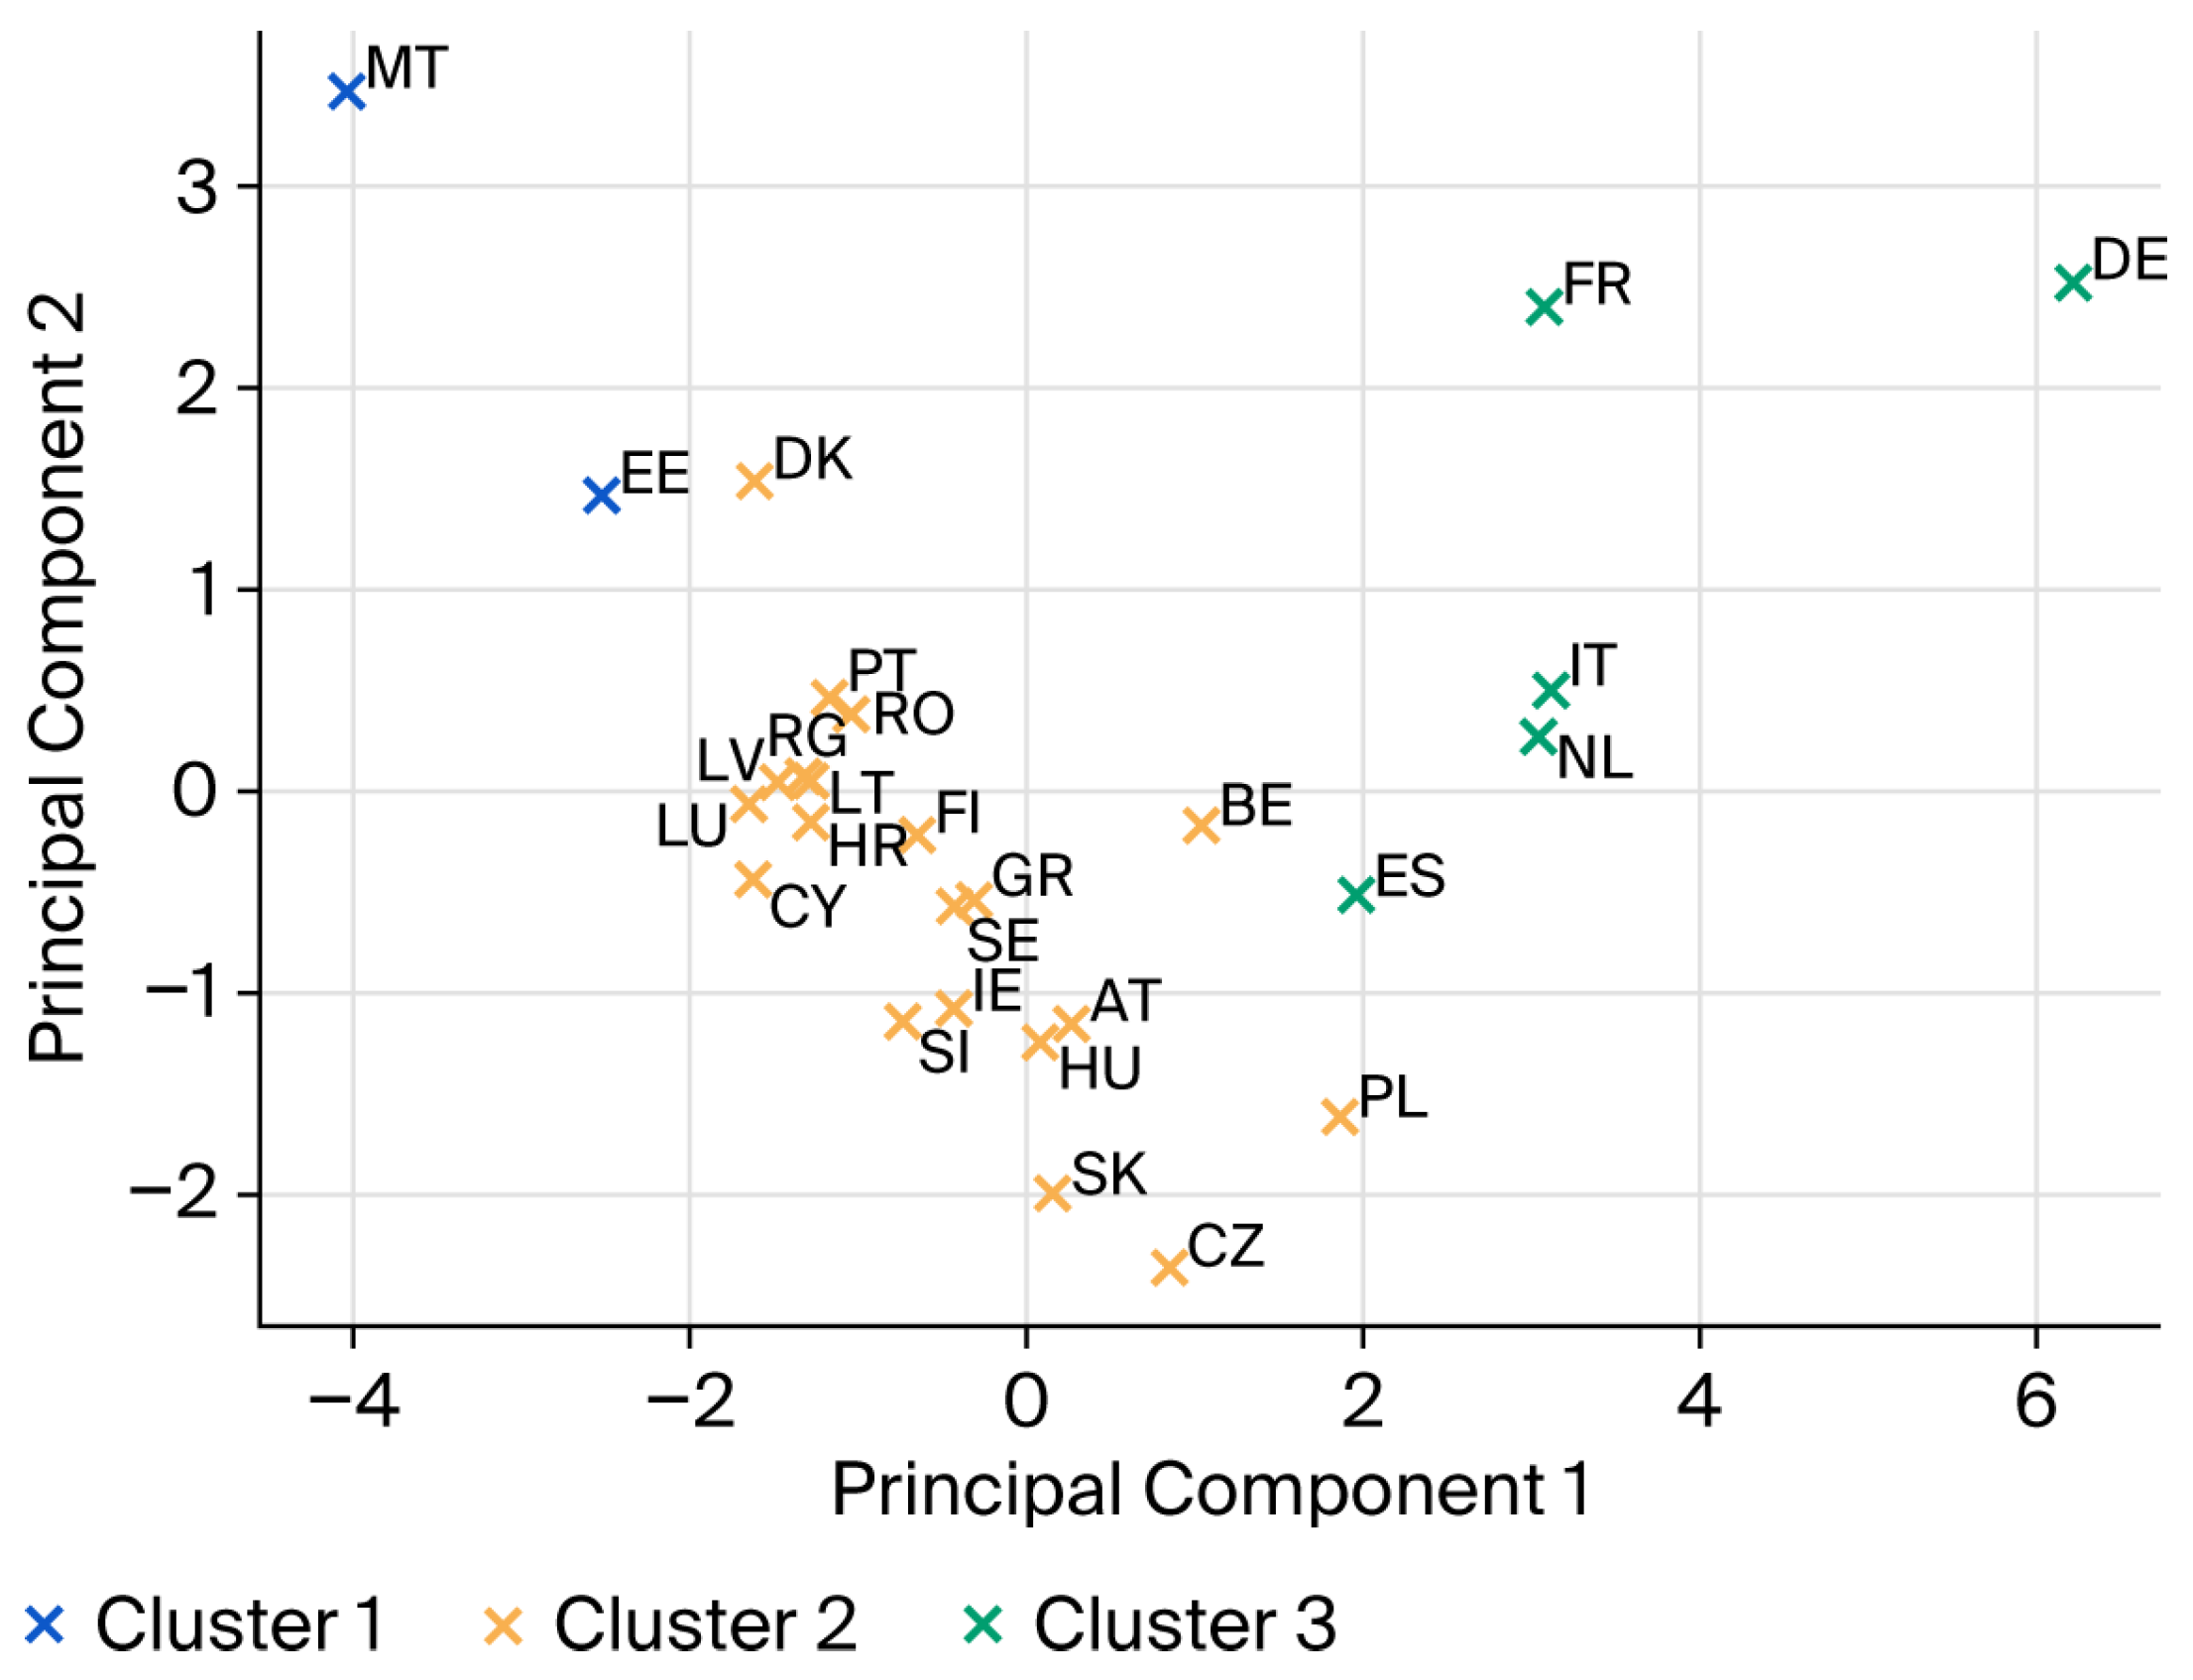
K-means clustering distinguished three distinct clusters, which are presented in detail below.
Cluster 1—Cluster of small, volatile importers: The first cluster comprises countries whose energy systems have a small absolute size but exhibit the most significant fluctuations in relative terms. The CV values of gas and coal imports are particularly high (Gas imports CV ≈ 0.42; Coal imports CV ≈ 1.97), meaning that the volume of imports varies very strongly from year to year compared to the average. Due to the low volume in these EU Member States, even a slight actual fluctuation can represent a relatively profound economic shock. The Member States classified here are Cyprus, Malta, Luxembourg, Lithuania, Latvia, Estonia, Croatia, and Bulgaria. Their common feature is strong import dependence and limited diversification of supply routes. From a policy perspective, this means that even minor market disruptions can easily compromise the stability of their energy supply. They need to strengthen regional integration, for example, by building new interconnectors, increasing access to LNG terminals, and developing strategic reserves.
Cluster 2—Medium-sized, moderate-risk countries: The second cluster includes countries with medium-sized energy systems and moderate volatility. The absolute volatility (σ) values are medium (Gas σ ≈ 949; Oil σ ≈ 1058; Electricity σ ≈ 3081), and the relative CV is lower than in Cluster 1 but higher than in the largest economies. These countries tend to have a diversified energy mix, but are still significantly affected by external shocks. Examples include the Czech Republic, Slovakia, Slovenia, Portugal, Greece, Ireland, Hungary, and Romania. In this group, the most critical issue for energy policy is to maintain the existing diversification and increase demand-side flexibility (energy efficiency, consumption reduction, and demand response). These countries exhibit a medium level of vulnerability; however, EU energy policy coordination can serve as a valuable safety net for them.
Cluster 3—Cluster of large, stable, systemic countries: The third cluster includes the Member States with the largest energy systems, which show extremely high volatility in absolute terms (Gas σ ≈ 6094; Oil σ ≈ 6866; Gas balance σ ≈ 166,404; Electricity σ ≈ 20,234), but in relative terms these fluctuations are more minor (Gas CV ≈ 0.11; Oil CV ≈ 0.07; Electricity CV ≈ 0.05). This means that although their markets are subject to huge volumes, these shocks have a less significant impact on the economy compared to their size. The countries included here are Germany, France, Italy, Spain, the Netherlands, Poland, Sweden, Belgium, Austria, Finland, and Denmark. These large systems are, in fact, key players in the stability of the EU’s energy policy: if a severe disruption occurs in them, the consequences will also be felt at the EU level. From a political perspective, the countries in this cluster are therefore responsible not only for their own stability but also for the resilience of the EU’s energy market as a whole. In their case, the primary challenge is to manage systemic risks (e.g., the loss of Russian imports during the 2022 gas crisis) and to refine the mechanisms of the internal energy market to prevent price crises.
The countries are arranged in three clusters in
Figure 3, which are separated by colors (red, blue, and green). The figure, therefore, provides a visual summary of how EU Member States are separated by their energy profile and highlights the distances between the clusters.
3.5. Robustness Checks and Results
By demonstrating that the main drivers of dependency remain robust, while the relative vulnerability of Member States has shifted, robustness checks ensure that the conclusions are scientifically credible and policy-relevant, providing a sound basis for long-term energy security strategies.
The results of the robustness tests for the four methodologies used in the study are presented in
Table 6.
To check the stability of the empirical results, the dataset was split into two sub-periods: 2014–2019 (pre-shock period) and 2020–2023 (shock/post-shock period), reflecting the structural break caused by the COVID-19 pandemic and the subsequent European energy crisis. Panel regression analyses, volatility indicators, and cluster analyses were repeated in these two regimes. The results show that while the structural drivers of energy dependence remain robust, the relative positions of EU Member States show a significant rearrangement after 2020.
The panel regression results indicate that natural gas and oil imports consistently increase energy dependence, whereas a stronger domestic gas balance and increased electricity generation reduce it. Coal imports are not significant in either period. Absolute volatility indices (σ) were found to be stable, with Spearman rank correlations above 0.7 between the two time windows, meaning that the EU Member States with the most considerable absolute fluctuations remained unchanged. In contrast, relative volatility ranks (CV) were much less stable (ρ ≈ 0.1–0.2, not significant), indicating that a shift in the relative vulnerability of several smaller and medium-sized Member States occurred.
Robustness checks confirm the temporal consistency of the results, but also highlight that the EU energy vulnerability map has evolved since 2020, necessitating more flexible energy security strategies, particularly those tailored to smaller Member States.
4. Discussion and Conclusions
The results of the study clearly show that the European Union’s energy security remains heavily dependent on fossil fuel imports. Panel regressions indicate that natural gas and oil imports are strongly and positively correlated with the energy dependency indicator; that is, the more a country relies on these sources, the more vulnerable it becomes to external shocks. In contrast, diversification of domestic production capacities, especially in electricity generation, reduces dependency and contributes to stability. This is particularly evident in the case of France, where nuclear capacity has reduced import dependency, and in Sweden and Finland, where a high share of renewable generation has strengthened resilience.
The volatility analyses also revealed that the magnitude and relative importance of energy imports vary considerably across Member States. While absolute volatility was significant in Germany and Italy due to their large volumes, relative volatility was high in many smaller Member States, such as Estonia, Latvia, and Croatia. This suggests that although larger Member States consume more energy overall, smaller economies are relatively more vulnerable to supply disruptions, as they have smaller internal markets and fewer alternative sources of supply.
The cluster analysis identified three relatively well-defined groups. The first cluster comprises large, stable countries with internal production capacities (e.g., France and Sweden), characterized by low dependence and moderate volatility. The second cluster includes medium-sized countries with moderate exposure (e.g., Spain, Portugal, and Poland), which are in a balanced situation but not free from risks. The third cluster comprises smaller, highly volatile, and import-dependent countries (e.g., the Baltic States and Malta), where the security of supply is most at risk. This three-tier structure has persisted during the post-2020 shocks. Still, the cluster classification of several countries—such as Hungary and Slovakia—has shifted, indicating that the crisis has rearranged the relative positions of the Member States.
The first three hypotheses of the research have been fully confirmed. The structure and volume of energy imports are indeed decisive in dependence; internal production capacities and a diversified energy mix mitigate risks. The post-2020 period has clearly demonstrated that shocks have reshaped the vulnerabilities of Member States. Overall, energy is not just an economic input for the EU, but also a crucial factor in maintaining social and political stability.
However, the fourth hypothesis was not confirmed, as the results showed that coal imports have now become a marginal factor and that the EU’s energy dependence is fundamentally determined by its exposure to gas and oil imports.
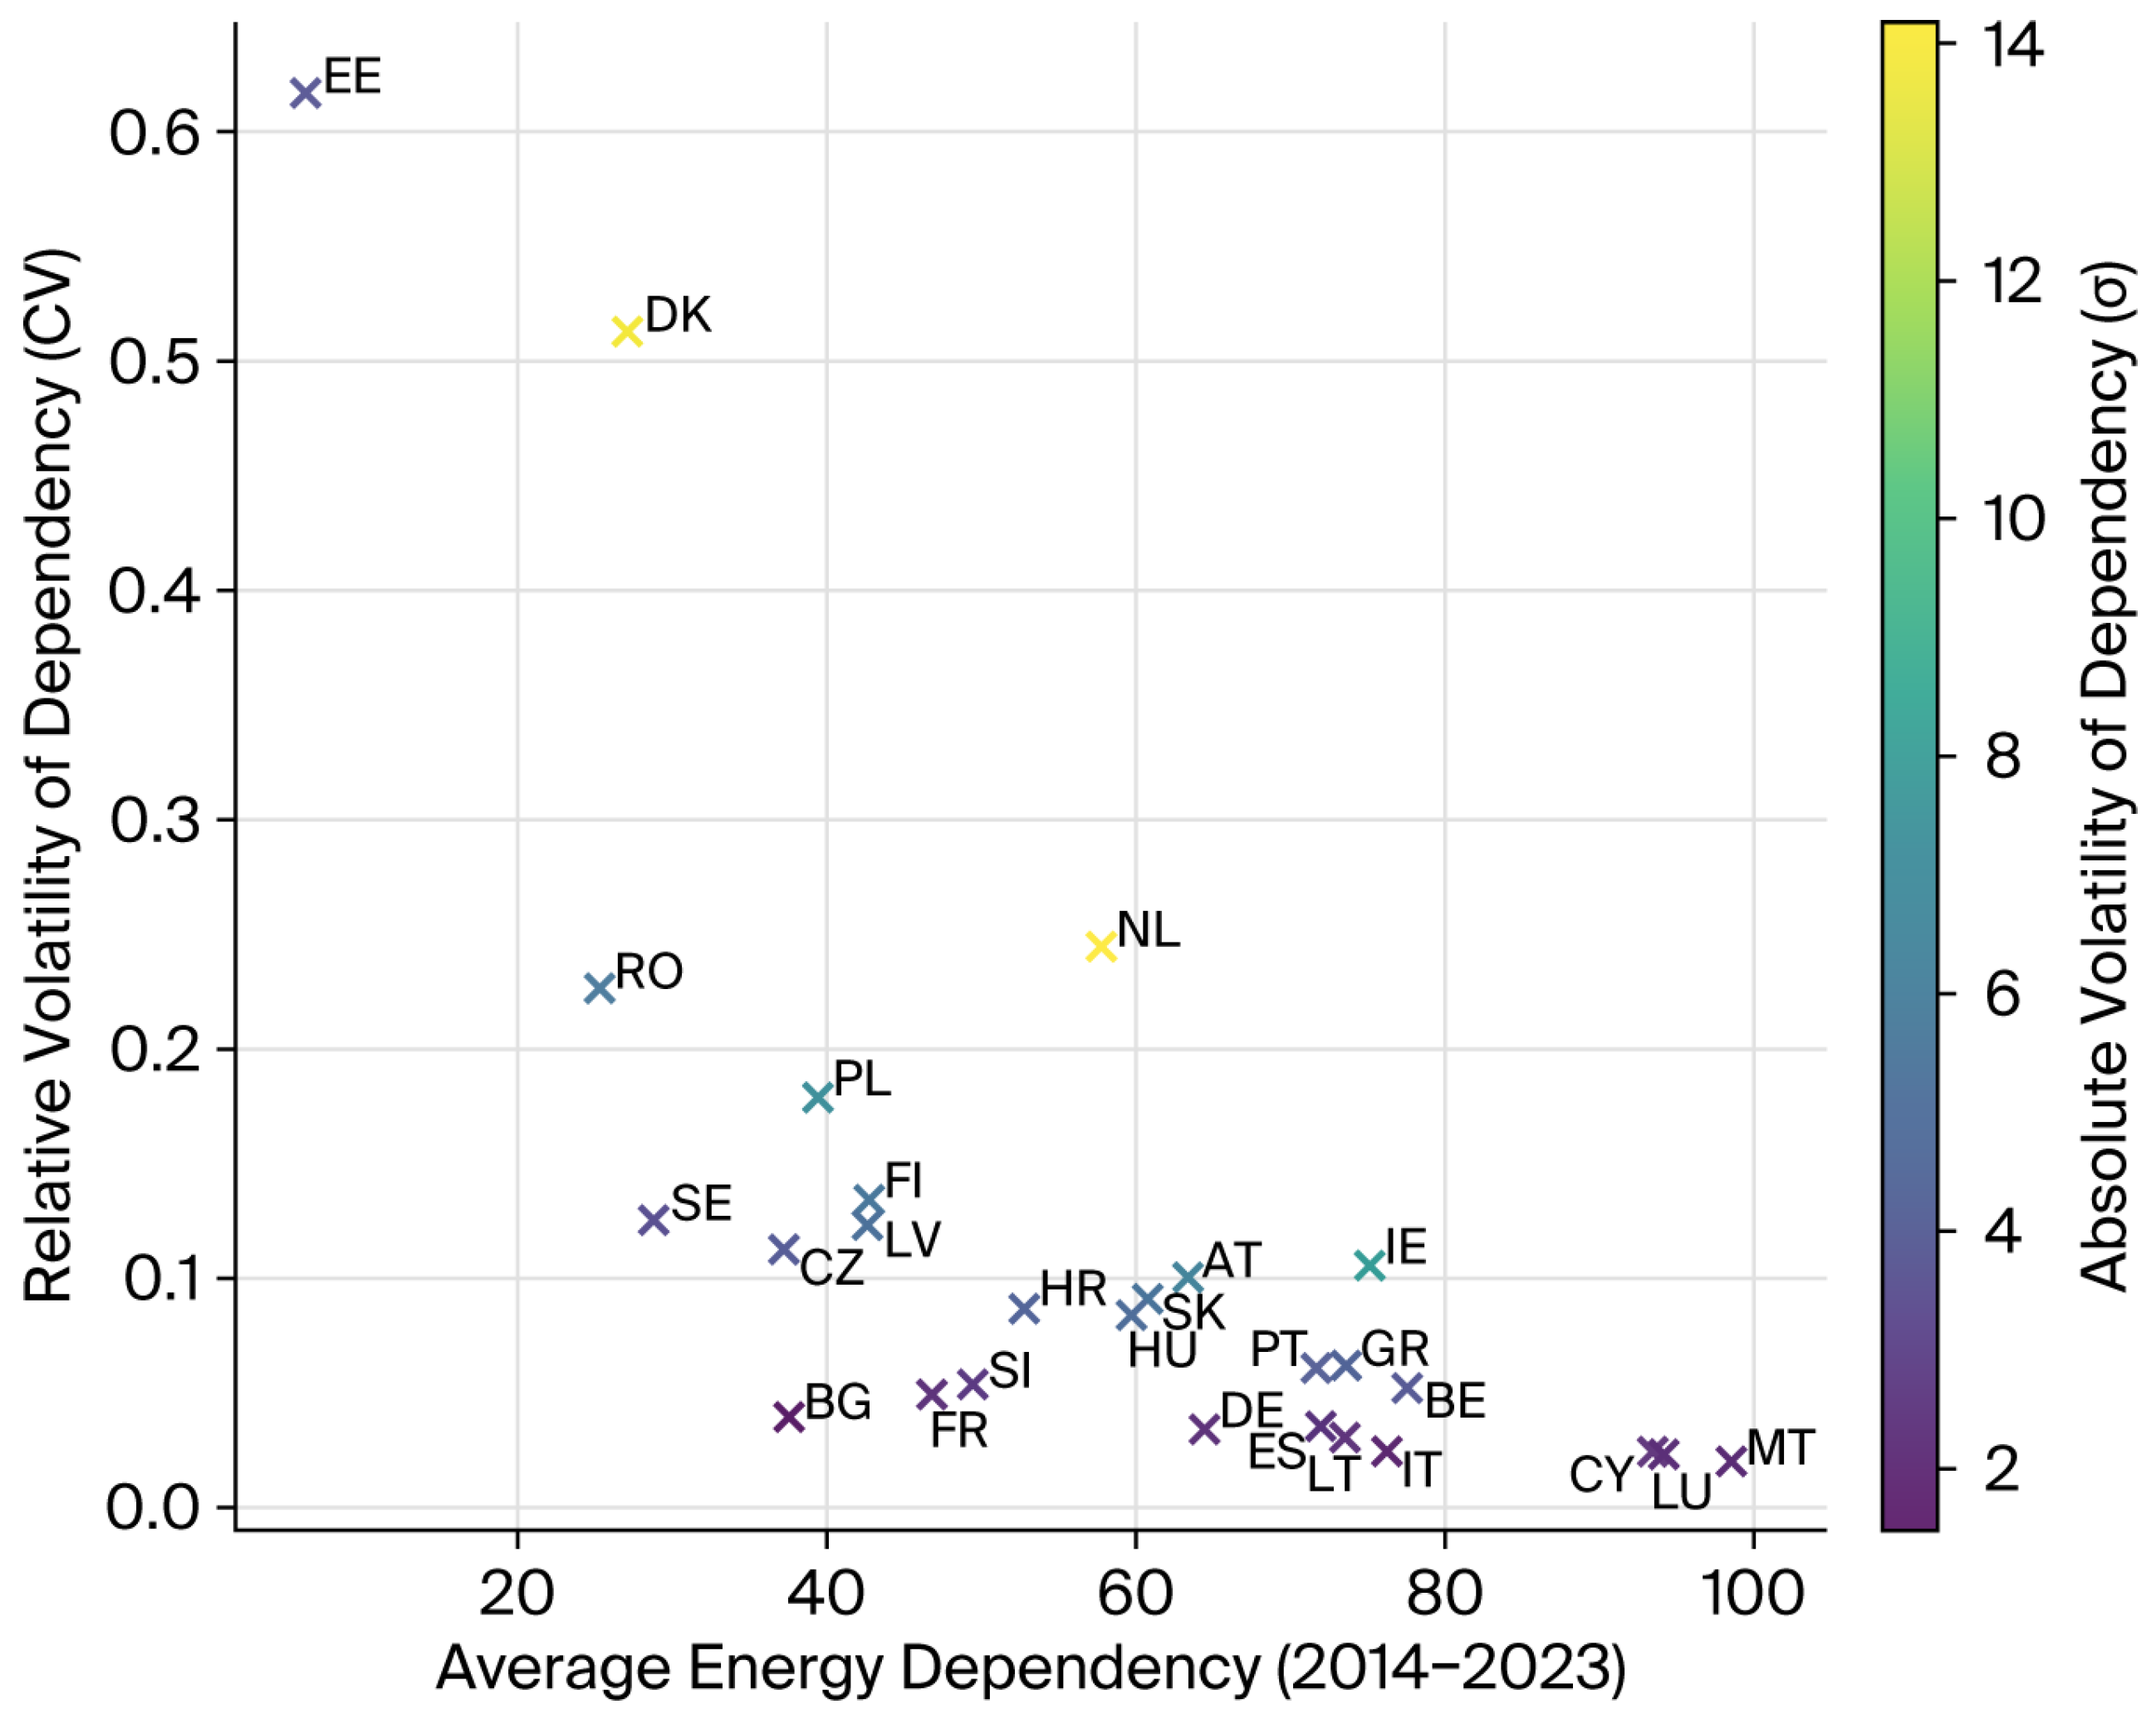
Figure 4 illustrates the average level and volatility of energy dependence in the 27 EU Member States between 2014 and 2023. Countries with a high average dependence and high relative fluctuations (e.g., Malta, Lithuania, Latvia, and Estonia) appear in the upper right quadrant, highlighting their structural vulnerability. In contrast, large Member States with significant domestic production capacity, such as France (nuclear energy) and Sweden (renewables and hydropower), exhibit relatively low dependence and volatility. Germany and Italy exhibit medium to high levels of dependence, characterized by significant absolute volatility, which reflects their exposure to fossil fuel import shocks. Hungary and Slovakia occupy an intermediate position, characterized by moderate reliance, which is expected to increase in volatility after 2020. Southern European countries, such as Spain and Portugal, are closer to the EU average and benefit from the gradual diversification of electricity generation. Finally, Poland still has an exceptionally high dependency on fossil fuels, although diversification efforts have somewhat mitigated volatility. Overall, the figure shows that the EU’s energy dependency is unevenly distributed across Member States, with small, import-dependent economies facing disproportionately higher risks compared to larger, diversified producers.
One limitation of the research is that it is based solely on Eurostat data, and thus cannot fully capture the unobservable institutional, contractual, or geopolitical dimensions of security of supply. Another limitation is that the analysis focuses on the national level and therefore cannot address regional differences or the detailed company-level adaptation of supply chains.
5. Policy Implications
The results have direct policy implications. The first and most important lesson is that diversification remains key. Reducing dependence on Russian fossil fuels has become an urgent necessity following the events of 2022. Although the EU has made significant progress in building alternative sources, such as LNG imports and new supplier relationships, the data show that several EU Member States still have overly concentrated procurement structures. Future policies should therefore aim to ensure that a broader range of supply sources is available to all Member States.
Secondly, the research highlights that smaller and more vulnerable Member States, such as the Baltic States, Malta, and Cyprus, are particularly exposed to volatility. For them, standard EU mechanisms such as strategic stocks, a common gas procurement platform, or better interconnection of electricity networks can play a key role. These instruments can mitigate asymmetric exposures and address imbalances within the internal market.
Thirdly, the study underlines the importance of developing crisis management capabilities. The post-2020 period has demonstrated that shocks can impact the energy system rapidly and unexpectedly. Therefore, EU policy should place greater emphasis on measures to increase resilience—including encouraging demand-side responses, developing energy storage technologies, and rapidly activating crisis management protocols.
Ultimately, strengthening the EU’s energy security cannot be divorced from its climate policy objectives. The results of the study show that expanding renewable energy sources and decarbonizing electricity generation are also the most effective ways to reduce dependency. This means that energy security and climate protection are not mutually exclusive, but can be complementary objectives if implemented within the proper policy framework. This insight is directly linked to the UN Sustainable Development Goals, in particular Goal 7 (Affordable and Clean Energy). Improving security of supply, reducing import dependency, and increasing the share of clean energy sources not only strengthens the EU’s internal stability but also contributes to global sustainability efforts. The research indicates that providing affordable and clean energy simultaneously serves economic competitiveness, social well-being, and environmental sustainability, ensuring that the EU’s energy policy decisions are closely aligned with the long-term goals set by the international community.
The findings of this study indicate that the EU’s objective of achieving full independence from Russian gas is not merely a political declaration but a statistically grounded structural necessity. Expanding LNG infrastructure enhances short-term shock absorption capacity, while the development of alternative corridors—such as the Balkan vertical gas corridor—strengthens regional interconnectivity and reduces concentration risk. Together, these measures contribute to lowering systemic volatility and mitigating structural energy dependency across Member States. Importantly, the empirical results show that gas dependency remains the primary channel of vulnerability, reinforcing the strategic priority of sustained diversification efforts.
Overall, the research suggests that general targets are insufficient to enhance the EU’s energy security. A specific, differentiated approach is needed, taking into account the different situations of individual Member States and simultaneously striving to promote diversification, internal capacity development, crisis resilience, and climate policy goals.