1. Introduction
Carbon pricing mechanisms are considered a fundamental component of contemporary climate policy, with the objective of internalising the environmental costs of greenhouse gas emissions by assigning them an explicit economic value [
1,
2]. In recent decades, market-based instruments have gained prominence as tools for reducing emissions while preserving economic efficiency. The most notable types of instruments are carbon taxes and emissions trading systems [
3,
4]. This growing adoption can be seen as indicative of a broader shift towards price-based climate policies, particularly in the context of international commitments under the Paris Agreement [
5,
6].
An analysis of data from the last three decades shows an exponential increase in the number of jurisdictions implementing carbon pricing mechanisms. While only two carbon tax systems were in place in 1990, by 2024, the number of mechanisms had grown to over 70 initiatives covering various types of instruments at the global level [
7,
8].
This dynamic development indicates the growing prominence of market-based instruments in climate policy and the expanding institutional footprint of carbon pricing initiatives. The evolution of carbon pricing systems is characterised not only by quantitative growth but also by qualitative diversification of instruments, including carbon taxes, emissions trading systems and hybrid solutions combining elements of both approaches [
9,
10,
11,
12].
The global expansion of carbon pricing has been accompanied not only by an increase in the number of implemented instruments but also by their qualitative diversification. Carbon taxes, emissions trading systems, and hybrid policy designs are now applied across multiple regions and economic sectors. This evolution underscores the mounting significance of economic incentives in climate mitigation strategies and highlights the role of carbon pricing as a pivotal policy instrument in the transition towards low-carbon energy systems [
13,
14].
From a theoretical standpoint, the economic concept underpinning carbon pricing is the correction of negative externalities. The introduction of a price signal for emissions has been demonstrated to incentivise firms and households to reduce carbon intensity and invest in low-emission technologies. Carbon taxes offer price certainty and administrative simplicity, whereas ETS frameworks provide quantity-based emission control and market flexibility. The extant literature suggests that these instruments vary in terms of their performance characteristics, predictability, and sectoral impacts. This suggests the presence of potential complementarities rather than mutual exclusivity [
15,
16,
17,
18,
19,
20].
Empirical evidence demonstrates a steady increase in the share of global emissions covered by carbon pricing instruments, alongside rapidly growing public revenues generated through these mechanisms. These revenues have become an increasingly significant component of climate finance, providing support for energy transition policies and public budgets. Notwithstanding this development, the extant academic literature remains fragmented. Numerous studies have been conducted on individual carbon pricing schemes and qualitative policy evaluations. However, there is a paucity of comprehensive quantitative analyses examining the relationship between the scale of carbon pricing implementation, emissions coverage, and revenue dynamics at the global level [
21,
22,
23,
24].
The present study addresses this research gap by conducting a quantitative time-series analysis based on global carbon pricing data. Utilising secondary data from Statista, the study explores the correlation between the proliferation of carbon pricing mechanisms, the scope of greenhouse gas emissions coverage, and the progression of public revenues generated by these instruments. The analysis focuses on identifying correlation patterns and long-term trends that characterise the long-run co-evolution of carbon pricing diffusion, emissions coverage and revenue dynamics from environmental and fiscal perspectives.
Existing global reports provide valuable descriptive overviews of carbon pricing diffusion, emissions coverage and revenues; however, they rarely formalise these trends within a single empirical framework that enables consistent long-run comparison across indicators. This paper addresses that gap by offering a transparent and replicable time-series assessment of global co-evolution patterns between institutional diffusion (number of mechanisms), coverage (share of global emissions priced) and fiscal outcomes (revenues), while explicitly separating correlation-based evidence from causal impact evaluation.
Accordingly, the study tests the following research hypotheses:
H1: There exists a strong and statistically significant positive long-run association between the number of carbon pricing mechanisms in operation worldwide and the share of global GHG emissions covered by these instruments.
H2: Global revenues from carbon pricing exhibit non-linear (accelerating) scaling over time, consistent with the expansion of emissions coverage and the institutional diffusion of carbon pricing, i.e., revenues increase faster than under a linear time trend.
In this study, the term fiscal scaling refers to the empirical pattern in which global carbon-pricing revenues increase in a non-linear manner alongside the expansion of emissions coverage and instrument diffusion. This is a descriptive macro-level indicator of the growing fiscal footprint of carbon pricing and does not constitute a welfare-based efficiency measure (e.g., marginal abatement costs or optimal taxation).
The findings contribute to the empirical literature on market-based climate policy by providing quantitative evidence on long-run co-evolution patterns between instrument diffusion, emissions coverage and revenue trajectories at the global level. The results are intended to complement narrative global reports with a transparent and replicable empirical synthesis.
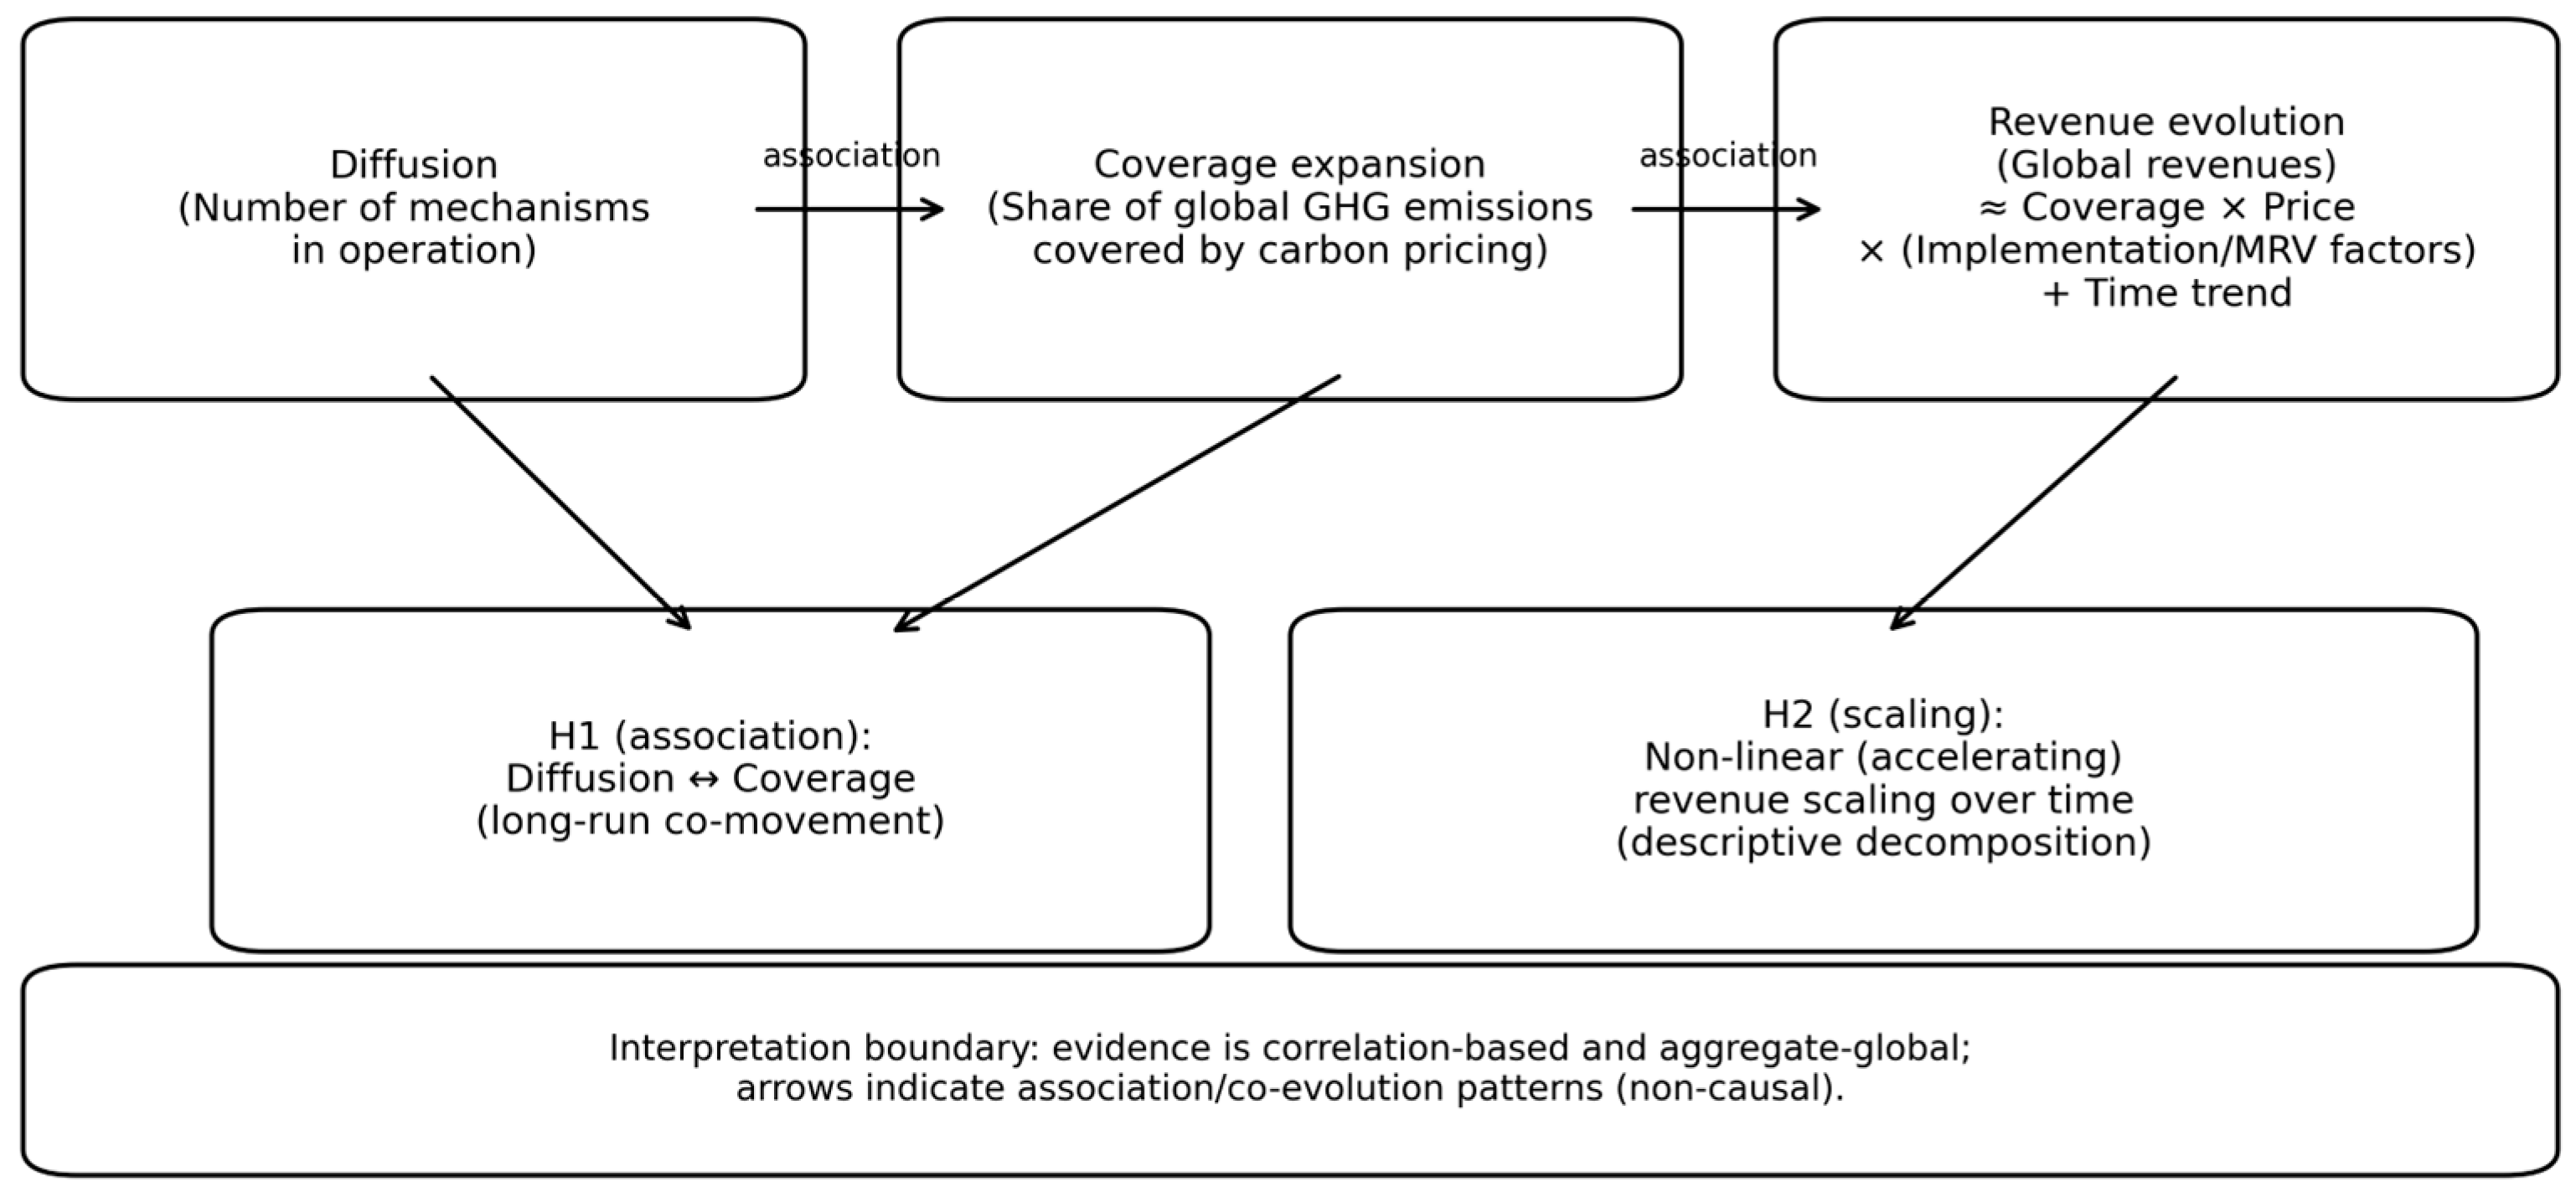
Figure 1 summarises the conceptual logic of the study and links hypotheses H1–H2 to the main variables and analytical steps. It also makes the interpretation boundary explicit: the evidence is aggregate-global and correlation-based, and the arrows indicate association/co-evolution patterns rather than causal effects.
The diffusion of carbon pricing is measured by the number of mechanisms in operation, while its coverage is determined by the share of global greenhouse gas (GHG) emissions that are covered by carbon pricing. The revenue is measured by global carbon-pricing revenues. The first hypothesis (H1) concerns the assessment of the long-term relationship between diffusion and coverage. The second hypothesis (H2) pertains to the examination of non-linear (accelerating) revenue scaling over time, utilising a descriptive decomposition approach. This decomposition involves the incorporation of coverage and price indicators, along with a time-trend component, to facilitate the analysis. The interpretation boundary is correlation-based and aggregate-global.
2. Materials and Methods
This study is based on secondary data obtained from the Statista platform, comprising five key datasets related to global carbon pricing mechanisms [
7]. The first dataset includes information on the number of carbon pricing mechanisms implemented worldwide over time, distinguishing between carbon taxes and emissions trading systems. The second dataset covers the share of global greenhouse gas emissions covered by carbon pricing instruments. The third dataset focuses on emissions covered exclusively by ETS schemes. The fourth dataset reports the global public revenues generated from carbon pricing mechanisms, while the fifth dataset contains the average annual carbon prices.
The analysis employs secondary global indicators obtained from Statista, a data compilation service that sources time-series information from official and institutional sources. In the interest of transparency, it is imperative to note that each indicator is regarded as an aggregate global descriptor, as opposed to a harmonised micro-level dataset. The “number of mechanisms” is defined as the annual count of carbon pricing initiatives in operation worldwide (including carbon taxes and ETS). The term “emissions coverage” is used to denote the estimated share of global greenhouse gas emissions that is subject to an explicit carbon price. “Revenues” refer to global public revenues collected through carbon pricing instruments (USD bn), and “average direct carbon price” is an emissions-weighted global average price indicator. The series were extracted, checked for internal consistency across years, and aligned on overlapping samples for pairwise comparisons. No interpolation was applied; analyses were conducted on the reported annual observations.
The variation in the time coverage across indicators is indicative of the availability of the underlying global reporting architecture. The mechanism counts are available over a longer historical period (1990–2024), whereas global emissions coverage is reported consistently from the mid-2000s onwards. Furthermore, the revenue series commences in 2006, corresponding to the first consistent global revenue observation. In order to ensure the comparability of the data, correlation analyses are conducted on overlapping windows (e.g., 2005–2024 for diffusion–coverage; 2006–2023 for revenue-related models). The manuscript explicitly labels each table and figure with the relevant sample period.
The empirical strategy has been developed for the purpose of quantifying long-run co-movement and association between global indicators. It is imperative to note that, due to the aggregation of the dataset at the global level and the presence of significant time trends in the key series, the reported correlations and trend models should not be interpreted as causal effects of carbon taxes or ETS on coverage or revenues. Instead, the analysis documents global co-evolution patterns consistent with institutional diffusion and fiscal scaling. In order to carry out causal identification, it would be necessary to have access to disaggregated panel data and explicit counterfactual strategies (for example, differences-in-differences or instrumental variables). However, it should be noted that the global time-series dataset available at present falls short of this requirement.
A two-stage analytical framework was applied, combining correlation analysis and regression modelling. In the initial phase, Pearson’s correlation coefficient was utilised to assess the strength and direction of relationships between the number of carbon pricing mechanisms, emissions coverage, and revenue variables. The selection of Pearson’s method was made on account of the continuous nature of the variables and the approximately linear relationships that were observed in the time-series data. Statistical significance was assessed at the α = 0.001 level.
In the second stage, regression analysis was conducted to model the relationship between carbon pricing mechanisms and revenue dynamics. The performance of both linear and exponential models was evaluated using the coefficient of determination (R2). The exponential specification was retained due to its superior explanatory power. All statistical analyses were conducted in accordance with standard econometric procedures.
To characterise the long-run dynamics of global carbon pricing revenues, an exponential trend model was estimated. Let
Rt denote the global revenues (USD bn) in year
t. The baseline specification is
where
τt =
Yeart −
Year0 is a re-scaled time index with Year
0 = 2006 (the first revenue observation). Equation (1) is estimated by ordinary least squares after log-transformation:
ln(
Rt) =
ln(
α) +
βτt +
εt. The model fit is assessed using R
2, and the statistical significance of β is evaluated using standard
t-tests. In addition, 95% confidence intervals were computed for β and for the implied average annual growth rate
g =
exp (
β) − 1.
Because revenue growth may reflect not only time trends but also changes in emissions coverage and effective carbon price levels, we complement the baseline trend model with an alternative specification that decomposes revenue co-movement into coverage, price and trend components.
Specifically, the following model is estimated:
where
Coveraget is the share of global emissions covered by carbon pricing instruments, and
Pricet is the global weighted average direct carbon price. The model is used as a non-causal (descriptive) decomposition of revenue co-movement within the limits of aggregate global data.
The period-based growth dynamics were summarised using the compound annual growth rate (CAGR):
where n denotes the number of years in the period; qualitative growth labels provide a concise comparison of the relative growth intensity across periods.
Because the analysed indicators exhibit pronounced time trends, the correlation coefficients computed in levels may overstate the association due to common trending behaviour. To mitigate this risk, the study complements baseline Pearson correlations with Spearman rank correlations, one-year lagged correlations, and correlations computed on first differences (year-on-year changes). Pearson’s correlation coefficient was computed as
In addition, formal time-series diagnostics were performed to assess non-stationarity and long-run co-movement: Augmented Dickey–Fuller (ADF) unit-root tests were applied to the main series. These checks support interpreting the empirical findings primarily as long-run co-evolution rather than immediate annual responsiveness. ADF tests were implemented with a constant and linear trend (regression = ct), with the lag length selected automatically using the AIC criterion.
All computations were performed in Python 3.14.2 (pandas, numpy, statsmodels) and cross-checked for internal consistency.
It is important to acknowledge the limitations of the study’s global time-series de-sign. The analysis uses aggregated global indicators, which necessarily mask cross-country heterogeneity in policy design, enforcement, sectoral scope and price levels. Therefore, the results should be interpreted as global co-evolution evidence rather than country-specific policy guidance or a causal assessment of policy impacts.
3. Results
3.1. Correlation Analysis of Carbon Pricing Mechanisms
The correlation analysis examines the association between the diffusion of carbon pricing mechanisms and the expansion of global emissions coverage. To provide additional descriptive insight, instrument-specific co-movement patterns are compared patterns for carbon taxes and ETS; this comparison is not interpreted as a ranking of causal impacts.
The results (
Table 1) indicate very strong positive correlations across the analysed pairs, which is consistent with the co-evolution of instrument diffusion and coverage at the global level. These findings should be interpreted as long-run associations rather than evidence of causal policy impact.
In order to provide a more comprehensive analysis,
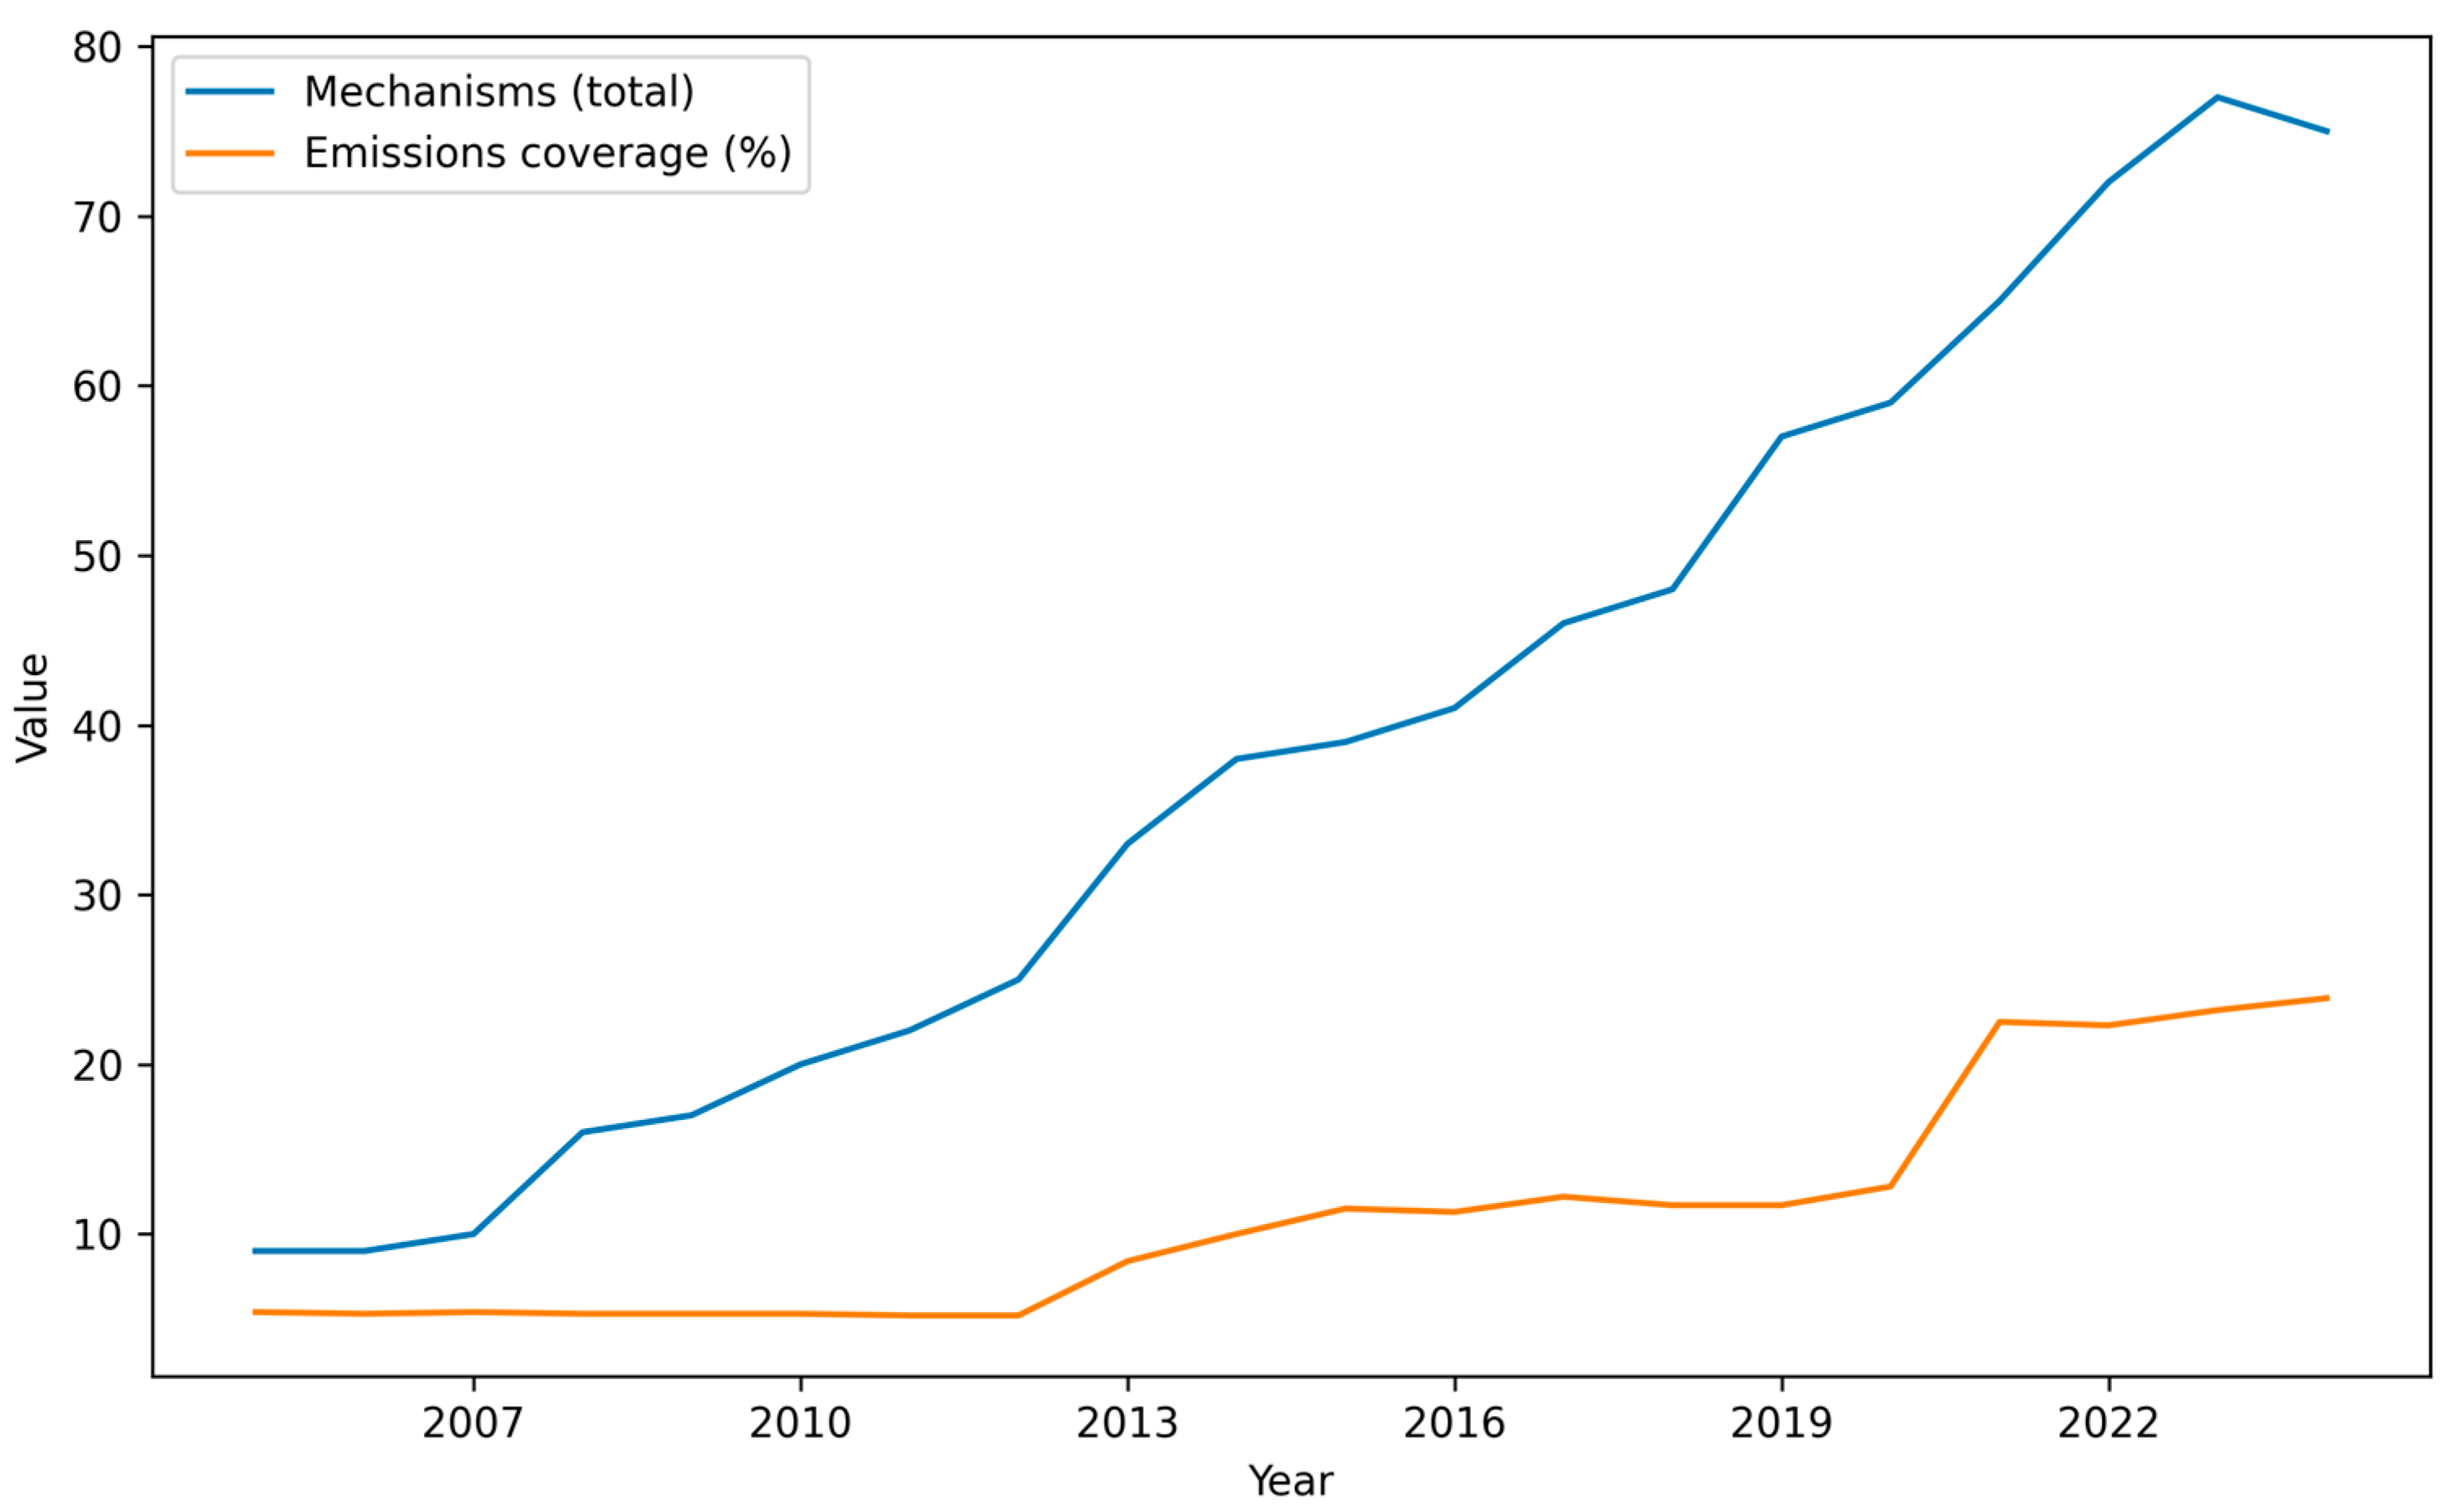
Figure 2 plots the joint evolution of the total number of carbon pricing mechanisms and the share of global emissions covered by carbon pricing over the overlapping period (2005–2024).
As demonstrated in
Figure 2, this hypothesis is corroborated by visual evidence, which lends further credence to the hypothesis. The number of mechanisms under consideration increases in a relatively smooth and persistent manner, whereas emissions coverage evolves more stepwise, which is consistent with discrete policy events such as adoption rounds or scope extensions. This descriptive pattern lends support to the interpretation of H1 as a long-run relationship, thereby motivating the subsequent period-based trend assessment reported in
Table 2.
As illustrated in
Table 2, the evolution of carbon pricing mechanisms has been observed across four distinct development periods. These periods encompass the early implementation phase (1990–2000), the expansion and maturation phase (2001–2020), and the current acceleration phase (2021–2024). The analysis encompasses the mean number of mechanisms, the mean emissions coverage, and the mean growth dynamics in each decade.
A temporal analysis reveals distinct phases in the development of carbon pricing mechanisms. The period of expansion (2001–2010) was characterised by the most dynamic growth in the number of mechanisms (228%) and coverage (176%). During the maturation phase (2011–2020), the growth rate remained high but exhibited a slight decline. The present acceleration phase (2021–2024) has been shown to stabilise the growth rate while maintaining high momentum. It is crucial to note that the observed growth in coverage consistently corresponds to the growth in the number of mechanisms, thereby providing support for H1.
As illustrated in
Table 3, hypothesis H1 is supported across the applied assessment criteria, indicating a robust long-run association between the diffusion of mechanisms and global emissions coverage within the analysed sample.
As summarised in
Table 3, the evidence is consistent with H1 within the scope of the study. The correlation coefficient r = 0.941 exceeds the threshold of 0.9 adopted to indicate a very strong association, and the relationship is positive. Given the aggregate global time-series setting and the interpretative limits stated in the Methods section, this result is interpreted as long-run co-movement between the diffusion of carbon pricing mechanisms and emissions coverage rather than as a causal effect. Statistical significance indicates that the estimated association is unlikely to be driven by random variation in the analysed sample.
Table 4 summarises the most important descriptive statistics from the entire correlation analysis, presenting extreme correlation values, average indicators and growth dynamics throughout the research period. It provides a compendium of key numerical results supporting the research conclusions.
The summary statistics indicate the presence of exceptionally strong correlations across the entire spectrum of the analysed relationships, with an average correlation of 0.930. Of particular significance is the 1152% increase in the number of mechanisms and the 952% increase in coverage between 1990 and 2024, which documents the transformative nature of carbon pricing development. The highest correlation between carbon taxes and ETS systems (0.982) indicates their complementarity, while the lowest correlation (0.862) is still within the range of strong relationships.
As shown in
Table 5, carbon taxes and ETS are compared in terms of their co-movement with global emissions coverage and their mutual association, providing a descriptive supplement to the aggregate mechanisms–coverage results.
A comparison of instrument-specific co-movement patterns suggests that both carbon taxes and ETS are strongly associated with expanding overall emissions coverage at the global scale. In view of the aggregate nature of the evidence, these differences are to be interpreted with caution and should not be used to rank instruments in terms of causal effectiveness.
As illustrated in
Table 6, the detailed results of the statistical significance tests for all correlations that were analysed are presented. These include the correlation coefficients, the coefficients of determination (r
2), the percentage of explained variance and the levels of statistical significance. The analysis confirms the statistical reliability of all identified relationships.
All correlations analysed show the highest level of statistical significance (p < 0.001), which supports the reliability of the results. The analysis indicates that carbon pricing mechanisms explain between 74.3% and 96.4% of the variance in emissions coverage, as indicated by the coefficients of determination. The elevated r2 = 0.964 for the tax–ETS correlation substantiates their robust interdependence. The lowest, yet still elevated, r2 = 0.743 for ETS systems indicates the presence of other factors particular to this instrument.
As illustrated in
Table 7, a comprehensive analysis is presented on the growth dynamics of carbon pricing mechanisms and emissions coverage in distinct periods. The initial and final values for each decade are outlined, along with the characteristics of the growth rate. The analysis enables the identification of developmental phases and the prediction of future trends.
Periodic analysis reveals a shift from a slow early diffusion of carbon pricing mechanisms to an accelerated expansion in the 2010s and early 2020s. Over time, this institutional diffusion has co-evolved with a rising share of global emissions covered by explicit carbon pricing, consistent with the widening adoption and scope.
3.2. Modelling Revenue Dynamics Under Carbon Pricing
The verification of hypothesis H2 covers the period 2006–2023, which reflects the availability of global revenue data for carbon pricing. The analysis focuses on assessing whether revenues generated by carbon pricing mechanisms exhibit an exponential growth pattern and whether this growth is systematically related to the expansion of implemented mechanisms and the widening of emissions coverage.
A regular analysis discloses a marked disparity between the rates of emissions coverage and revenue growth (
Table 8). Across the periods examined, revenue growth has often outpaced coverage growth, which is consistent with fiscal scaling, an expanding fiscal footprint of carbon pricing at the global level. This pattern may reflect a combination of factors (coverage expansion, changes in effective price levels, and macroeconomic conditions) and should not be interpreted as a welfare-based efficiency result.
As reported in
Table 9, the estimated parameters of the exponential revenue trend model are presented to characterise the long-run growth pattern of global carbon-pricing revenues. Consistent with Equation (1), the model is specified as R
t = αexp(βτt), where R
t denotes global revenues (USD bn) in year t, and τt = Year
t − Year
0 is the re-scaled time index. The model fit is evaluated using the coefficient of determination (R
2).
The parameter estimates in
Table 9 provide empirical support for hypothesis H2 regarding the exponential character of global carbon-pricing revenue growth. The trend parameter β = 0.203 implies an average annual growth rate of g = exp(β)−1, which corresponds to approximately 20.3%. The high goodness of fit (R
2 = 0.966) indicates that the exponential specification accounts for 96.6% of the observed variation in revenues over the sample period, suggesting that the long-run scaling of carbon-pricing revenues dominates short-run deviations. The scale parameter α = 3.396 represents the baseline level of revenues at τt = 0 (i.e., in the base year Year
0).
As illustrated in
Table 10, a systematic comparison is presented between the dynamics of revenue growth and the dynamics of emissions coverage. This comparison provides an interpretable measure of how the fiscal footprint of carbon pricing evolves relative to its environmental reach.
A comparison of the growth rates reveals a systematic advantage of revenue growth over emission coverage growth in all periods analysed. The most significant advantage was observed during the period 2006–2010 (ratio of 1764.0), which can be attributed to minimal coverage growth coupled with moderate revenue growth. The periods 2011–2015 and 2021–2023 are characterised by the most balanced growth (ratios of 1.18 and 1.23), indicating the maturation of carbon pricing markets. The consistent advantage of revenue growth validates hypothesis H2 and signals rising costs in regulated sectors.
The fiscal scaling indicator highlights periods in which global carbon-pricing revenues increased faster than the emissions coverage share. This descriptive metric captures the relative steepness of revenue growth versus coverage expansion and should be interpreted as an aggregate macro-pattern rather than a welfare-based efficiency measure or evidence of superior instrument performance.
Table 11 summarises the evolution of the fiscal scaling indicator across the analysed sub-periods, reporting the revenue growth relative to changes in the emissions coverage share.
Over the analysed sub-periods, the indicator increases from 1.50 (2006–2010) to 4.26 (2021–2023), which is consistent with an intensification of revenue scaling relative to coverage growth in recent years.
The following criteria were used to verify hypothesis H2, as summarised in
Table 12. The three factors to be considered are as follows: the functional form of the revenue trend, statistical significance and model fit, and the consistency of results across sub-periods. These criteria are widely used in time-series analysis to distinguish long-run growth patterns from transitory changes.
As summarised in
Table 12, the empirical evidence is consistent with H2 in the sense that a non-linear (exponential) trend provides a better descriptive fit to the global revenue series than a linear specification. The high goodness of fit (e.g., R
2 = 0.966) indicates that the long-run revenue trajectory is strongly trend-driven in the analysed sample. In line with the interpretation scope stated above, these results are treated as descriptive evidence of revenue scaling rather than causal attribution or welfare-based efficiency.
It is important to note that the revenue advantage observed across all sub-periods indicates that revenue growth has systematically outpaced the expansion of emissions coverage. This phenomenon can be attributed to two key factors: firstly, the increased adoption of carbon pricing measures across various jurisdictions and, secondly, the enhancement of implementation capabilities. Consequently, the implementation of carbon pricing has been demonstrated to enhance not only its environmental reach but also its fiscal capacity. This, in turn, has the potential to reinforce the durability of policy through the provision of stable public funding streams.
In order to provide a complementary overview of the regression results and the verification criteria, as summarised in
Table 12,
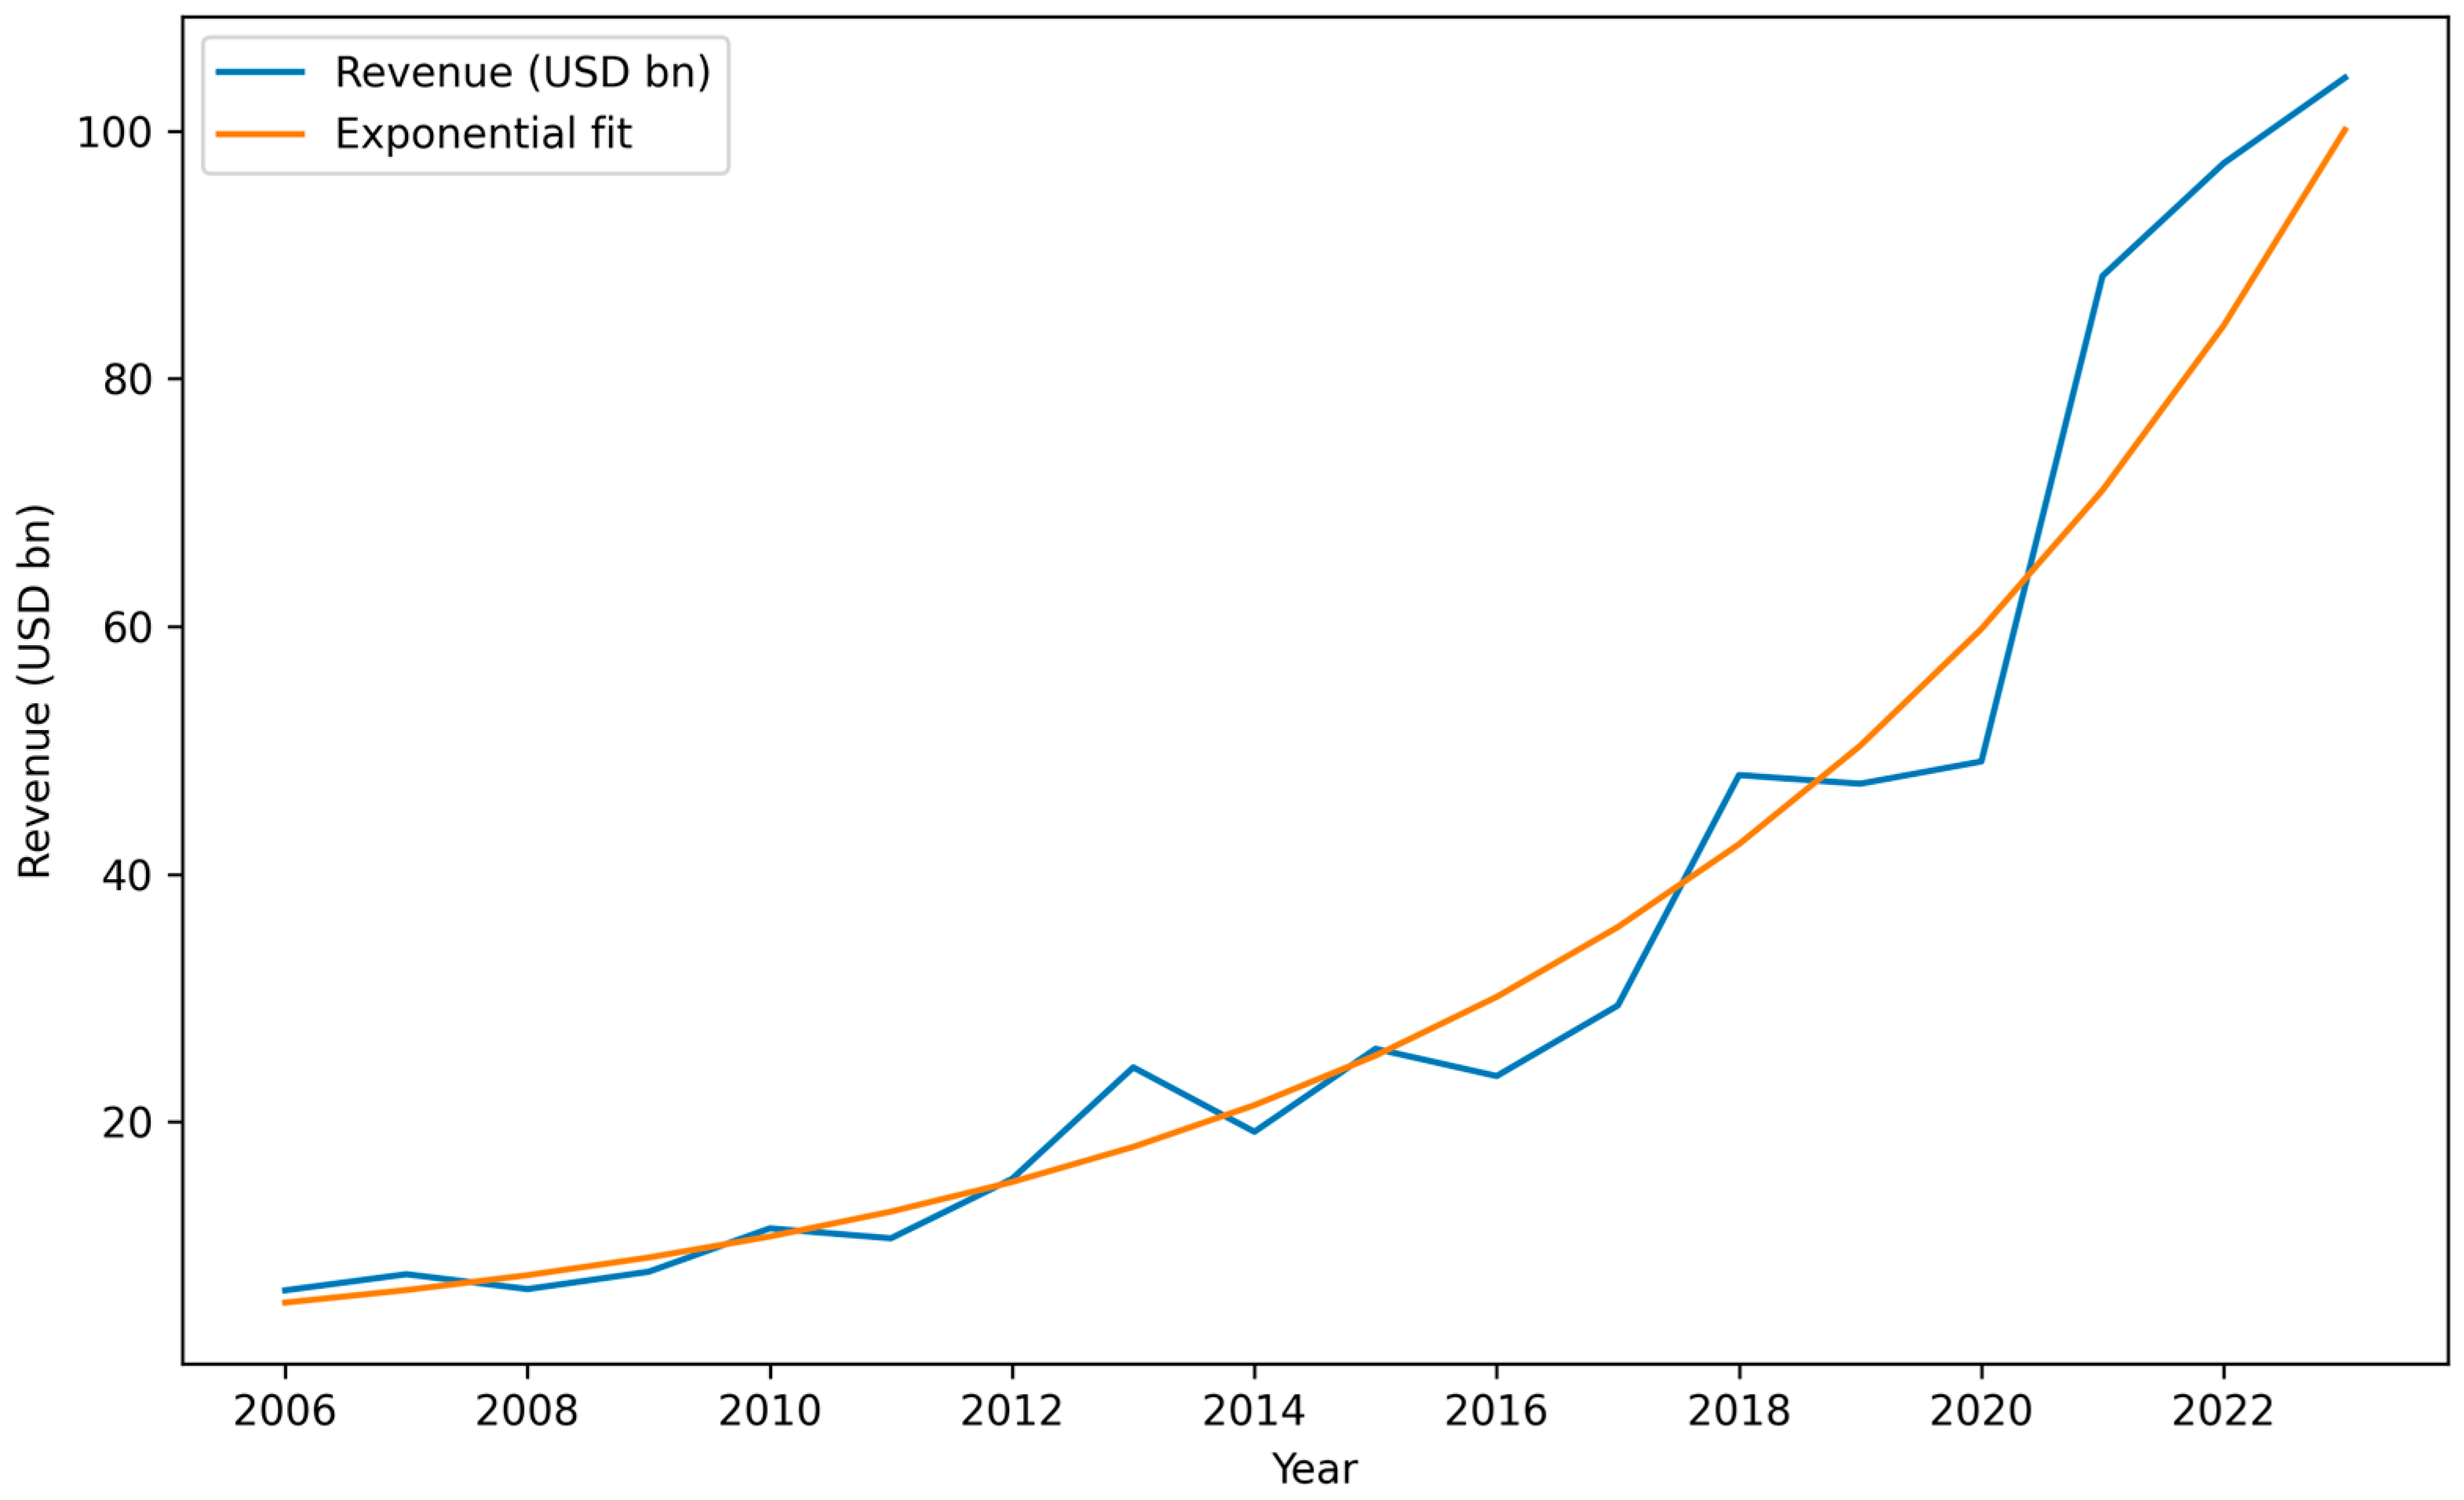
Figure 3 presents the observed trajectory of global revenues from carbon pricing mechanisms, together with the fitted exponential trend. This visualisation provides an intuitive assessment of the adequacy of the exponential specification and highlights the long-run scaling pattern captured by the model.
As demonstrated in
Figure 3, global carbon pricing revenues exhibit a pronounced non-linear increase, which is closely approximated by an exponential trend. Short-run deviations from the fitted curve reflect year-specific variability and discrete policy or market events, yet the long-run pattern remains consistent with the high explanatory power of the exponential specification reported above (R
2 = 0.966). This finding lends further support to the interpretation that the fiscal capacity of carbon pricing has increased disproportionately over time.
In order to ensure that the results are not solely driven by common time trends in rapidly expanding global indicators, the subsequent subsection reports robustness checks and alternative specifications.
3.3. Robustness Checks and Alternative Specifications
In view of the pronounced trend exhibited by global carbon pricing indicators, supplemental robustness checks were undertaken to evaluate the stability of the estimated associations. In addition to Pearson’s correlation coefficients, Spearman’s rank-based correlations were calculated, and lagged correlations, defined as those delayed by one year, were analysed. As a conservative measure to guard against spurious correlation driven by common trends, Pearson correlations were also computed for first differences (year-on-year changes).
The robustness results presented in
Table 13 demonstrate that the primary associations identified in the baseline analysis remain consistent across various correlation measures. In particular, the relationships remain strong when using Spearman rank correlations, indicating that the results do not depend on the strict linearity assumption of Pearson’s coefficient. The one-year lagged correlations are also high, suggesting that the co-movement between the diffusion of carbon pricing mechanisms and emissions-coverage expansion is not limited to contemporaneous alignment within the same year.
As anticipated, given the pronounced trend exhibited by global indicators, the correlations calculated on first differences (year-on-year changes) are substantially diminished. This pattern is consistent with the interpretation that the strongest signal occurs in long-run cumulative dynamics (levels), whereas short-run annual changes are more volatile and can reflect discrete policy events (e.g., adoption rounds, coverage extensions, or administrative and reporting adjustments) rather than smooth year-to-year evolution. It is important to note that the direction of the main associations remains positive, thereby supporting the robustness of the study’s core findings.
Overall,
Table 13 supports interpreting the results primarily as evidence of the long-horizon co-evolution of carbon pricing adoption, emissions coverage, and revenue capacity.
Due to the significant time trends observed in the analysed global indicators, formal stationarity diagnostics were performed to evaluate the potential for trend-driven associations in level-based measures.
Table 14 reports the results of the Augmented Dickey–Fuller (ADF) unit-root test for the key series, using a constant-plus-trend specification (CT), with the lag length selected using the AIC method on overlapping samples.
Table 14 suggests that several series exhibit pronounced trending behaviour, and the ADF tests do not reject the unit-root null under a constant-and-trend ADF specification, most notably total mechanisms and global revenues. In contrast, the total emissions coverage and carbon tax mechanisms show evidence consistent with trend-stationarity over the overlapping sample. Given the short sample lengths (N = 18–20) and the mixed stationarity properties across series, the empirical results are interpreted primarily as long-run co-movement and institutional scaling rather than as immediate year-to-year responsiveness. This motivates the robustness checks reported below, including rank-based correlations, lagged correlations, and first-difference (year-on-year) correlations.
Because the revenue series is strongly trend-driven, we complement the exponential fit with log-linear specifications that include emissions coverage and the global average direct carbon price (2006–2023).
Table 15 summarises the model fit. The specification including coverage and trend (Model B) improves the information criteria relative to a pure trend model, while adding the global average price (Model C) does not improve fit in this aggregate dataset. Consistent with the interpretative scope stated above, these results are used as a descriptive decomposition of co-movement rather than causal attribution.
As demonstrated in
Table 15, the specification including emissions coverage alongside the time trend (Model B) performs best in terms of the information criteria (AIC/BIC). This outcome suggests that the inclusion of coverage facilitates the capture of the global revenue trajectory beyond the confines of a pure trend specification. Conversely, incorporating the global average direct carbon price (Model C) does not yield a further enhancement in this aggregated dataset. This pattern is consistent with the view that, at the global level, revenue dynamics co-move strongly with coverage expansion, whereas the signal from the average price series may be diluted by aggregation and measurement heterogeneity. These results are interpreted as a descriptive robustness check that supports the non-linear scaling narrative in H2, within the non-causal scope of the study.
Cointegration and structural stability diagnostics. As an additional robustness check, cointegration tests were used as descriptive diagnostics of long-run co-movement consistency (without implying causal identification). Engle–Granger residual-based tests for key pairs (ln(Coverage)–ln(Mechanisms), ln(Revenue)–ln(Coverage), ln(Revenue)–ln(Price)) do not reject the null of no cointegration in the available samples (
Table S2). Johansen system tests for [ln(Revenue), ln(Coverage), ln(Price)] similarly fail to reject r = 0, indicating no stable long-run equilibrium relation detectable in this aggregate dataset (
Table S2).
In addition, the parameter stability was assessed using a priori structural-break diagnostics around 2015 (Paris Agreement year). Chow tests do not indicate a statistically strong break at conventional levels for the baseline specifications (
Table S3), and CUSUM tests suggest stable parameters over the sample. For transparency, the supplementary figures report log-level and first-difference series (
Figures S1 and S2) and the exponential revenue trend with the 2015 marker (
Figure S3). See
Supplementary Materials: Tables S1 and S3 and Figures S1 and S3. Descriptive statistics and distributional summaries (including boxplots) for both raw series (levels) and processed series (year-on-year log changes) are reported in the
Supplementary Materials (Tables S4 and S5; Figures S4 and S5).
3.4. Synthesis of Empirical Findings
When considered as a whole, the findings indicate a dual co-evolution pattern: the institutional diffusion of carbon pricing is associated with a higher share of global emissions subject to an explicit carbon price and simultaneously strengthens the fiscal footprint of carbon pricing through revenue scaling over time.
Secondly, the fiscal dimension of carbon pricing demonstrates a marked tendency towards growth. The revenue modelling supports an exponential pattern with high explanatory power (R2 = 0.966), indicating that global revenues have expanded disproportionately over time. It is important to note that the verification of H2 across sub-periods implies that this revenue advantage is not confined to a specific time window but rather reflects a persistent scaling of the fiscal capacity embedded in carbon pricing frameworks. In substantive terms, the results indicate that carbon pricing has become increasingly salient not only as an environmental instrument (through coverage expansion) but also as a revenue-generating mechanism capable of supporting broader climate-policy architectures, including revenue recycling and long-term policy durability.
The findings should be read as global co-evolution evidence. Because the analysis uses aggregate global indicators, it inevitably masks heterogeneity in policy design, enforcement, sectoral scope and price levels across jurisdictions. Therefore, the results do not provide country-specific policy guidance nor allow ranking the policy impacts of ETS versus carbon taxes; rather, they document how instrument diffusion, coverage and revenues have jointly evolved at the global scale.
Overall, the results converge on a consistent global co-evolution pattern: the diffusion of carbon pricing mechanisms is associated with higher emissions coverage and a growing fiscal footprint as reflected in revenue scaling. This synthesis provides the basis for the subsequent discussion, which focuses on interpretation and limitations rather than causal attribution.
4. Discussion
The findings are consistent with the broad picture reported by international organisations such as the World Bank [
25] and the OECD [
26] regarding the global diffusion of carbon pricing and the expansion of covered emissions. In our framework, this manifests as a strong long-run association between mechanism diffusion and emissions coverage. However, given the correlational design and aggregate global data, these results should not be interpreted as causal evidence of policy impact or as an assessment of welfare performance.
The instrument-specific correlations suggest that both carbon taxes and ETS co-move strongly with global emissions coverage, while also exhibiting a very strong mutual association, which is consistent with the view that the two instrument types have expanded jointly as part of global climate governance [
27,
28,
29,
30,
31,
32]. Differences in correlation magnitudes are descriptive and should not be used to rank instrument superiority, as they may reflect composition effects, policy design heterogeneity and data aggregation.
From a descriptive perspective, the revenue results highlight an often under-emphasised dimension of carbon pricing: fiscal scaling. The exponential trend in global carbon-pricing revenues suggests that, beyond expanding emissions coverage, carbon pricing has increasingly constituted a financially material policy instrument at the global level. This pattern is consistent with two complementary interpretations. First, revenue growth may reflect the cumulative scaling of pricing frameworks through broader coverage and, in many jurisdictions, higher observed carbon price levels. Second, it may also be consistent with institutional maturation over time, although such mechanisms cannot be directly tested with the aggregate global dataset used in this study. Accordingly, the discussion remains descriptive and does not imply causal attribution.
Importantly, the policy relevance of revenue growth depends on the governance of these funds. Transparent and rule-based revenue recycling (e.g., targeted compensation, reductions in distortionary taxes, or financing low-carbon investment) can enhance political acceptability and increase the durability of carbon pricing. In this context, the complementarity between carbon taxes and ETS is not only an institutional feature but may also be functional in policy portfolios that seek to balance environmental reach with fiscal credibility.
The limitations of this study, particularly the absence of control variables and the aggregation of data at the global level, warrant cautious interpretation of the results. The use of secondary aggregate indicators may mask regional heterogeneity and differences in policy design (e.g., sectoral coverage, exemptions, price floors/ceilings, and allocation rules). In addition, the time-series nature of the variables implies a risk of trend-driven associations. Future research should therefore incorporate richer covariates, regional disaggregation, and time-series methods that explicitly address non-stationarity and potential confounding.
The following implications are framed as conditional design considerations that are consistent with the documented global co-evolution patterns. They are presented as high-level guidance for policy design and governance and do not constitute causal effectiveness rankings between instruments.
Differentiated pathways by development level and administrative capacity. For jurisdictions with limited MRV and administrative capacity, initial implementation may be more feasible through relatively simple upstream carbon taxes combined with gradual expansion of sectoral scope and coverage. In higher-capacity settings, hybrid portfolios that combine ETS and carbon taxes can be considered, supported by price-stabilisation features (e.g., price floors/ceilings, market stability reserves) to reduce revenue volatility and improve predictability.
Revenue governance and durability of carbon pricing. Given the strong global scaling of carbon-pricing revenues documented in this study, policy durability may depend on transparent revenue recycling frameworks. Conditional design options include targeted compensation for vulnerable households and firms, reductions in distortionary taxes, and earmarking for low-carbon investment. Clear governance rules can improve acceptability and help align fiscal and environmental objectives without implying welfare-optimality conclusions from the present aggregate evidence.
Instrument complementarity and sectoral allocation of roles. The co-movement evidence is consistent with the view that ETS and carbon taxes can play complementary roles within broader climate-policy architectures. As a design heuristic, carbon taxes may be considered where administrative simplicity and predictable price signals are prioritised, whereas ETS frameworks may be considered where quantity-based control and market allocation are central, while recognising that sectoral scope, exemptions/free allocation, and enforcement conditions can materially shape outcomes and cannot be assessed causally with the current global aggregates.
External incentives and policy diffusion. Recent developments such as border-adjustment mechanisms (e.g., CBAM-type arrangements) can be discussed as potential external incentives that may accelerate the adoption and strengthening of carbon pricing in trade partners. In the context of this study, such examples are treated as illustrative of regional policy architecture and diffusion dynamics rather than as causal evidence of impact.
Overall, these conditional implications are intended to translate the paper’s global descriptive findings into design-relevant considerations while keeping the interpretation boundary explicit.
The robustness checks provide an important nuance for interpreting the empirical findings. The persistence of strong correlations in levels, Spearman ranks, and lagged specifications lends support to the hypothesis that carbon pricing diffusion and emissions-coverage expansion are structurally linked in the long run. Concurrently, the weaker correlations in first differences suggest that short-run year-to-year changes are considerably noisier and may be influenced by discrete policy events (e.g., adoption rounds, revisions, sectoral expansions) rather than smooth annual adjustments.
Consequently, the results are best interpreted as evidence of long-run co-movement among global carbon pricing diffusion, emissions coverage and revenue scaling, rather than as policy-induced causal effects. The robustness checks underscore that trend-driven associations dominate level-based measures. Future research using disaggregated panel data and counterfactual designs could separate common global trends from policy-induced effects more explicitly.
In the context of EU climate policy, the results of the analysis are consistent with the direction of recent reforms that strengthen market-based instruments. The Fit for 55 package constitutes a significant expansion of the scope and ambition of emissions pricing, encompassing reforms of the EU ETS and the establishment of a parallel emissions trading system for fuels utilised in buildings and road transport (ETS2). In conjunction with measures designed to prevent carbon leakage, such as the Carbon Border Adjustment Mechanism (CBAM), these reforms exemplify a policy trajectory in which carbon pricing is anticipated to assume an increasingly significant role in achieving decarbonisation targets.
A further policy dimension pertains to the interaction between carbon pricing and international trade. The CBAM is designed to address the issue of carbon leakage by aligning the carbon cost of selected imported emissions-intensive goods with the carbon price faced by EU producers under the EU ETS. The mechanism increases transparency and incentivises lower-carbon production practices among trading partners by requiring the reporting of embedded emissions and the purchase of corresponding CBAM certificates. More broadly, the emergence of border carbon measures has the potential to create external incentives for jurisdictions to introduce or strengthen domestic carbon pricing, which could contribute to wider global adoption of emissions pricing instruments.
5. Conclusions
The analysis documents a strong long-run association between the diffusion of carbon pricing mechanisms and the share of global emissions covered by carbon pricing. Global revenues show pronounced non-linear scaling over time and a steep upward trajectory in the post-2015 period.
These patterns are consistent with the institutional scaling of carbon pricing at the global level. Given the aggregate correlation-based nature of the evidence, the results are interpreted as long-run co-movement and do not support ranking causal policy impacts between ETS and carbon taxes.
At the global scale, the evidence is consistent with the view that carbon taxes and ETS function as complementary instruments within the climate governance architecture. Future research should use country- or sector-level panel data and explicit counterfactual methods (e.g., differences-in-differences or instrumental variables) to identify causal impacts and to unpack heterogeneity in policy design, enforcement and price trajectories.
The study relies on global aggregate indicators and therefore cannot account for cross-country differences in sectoral scope, enforcement, supporting policies, or macroeconomic controls. Accordingly, the reported relations should be interpreted as descriptive long-run association patterns. The added alternative revenue specifications with coverage and price terms are intended as a non-causal decomposition of co-movement and do not constitute a welfare-based efficiency evaluation.