Article

Performance Optimization and Vortex Analysis of a Micro-Head Dual-Duct Hydraulic Turbine

School of Energy and Power Engineering, Changsha University of Science and Technology, Changsha 410114, China
*
Author to whom correspondence should be addressed.
Energies 2026, 19(4), 968; https://doi.org/10.3390/en19040968
Submission received: 8 January 2026 / Revised: 30 January 2026 / Accepted: 5 February 2026 / Published: 12 February 2026

Abstract

In order to solve the technical bottlenecks of low efficiency and high starting flow velocity of traditional turbines in the area of development of micro-head hydropower resources, a new type of hydraulic turbine in which the dual-duct is used was suggested and was structurally optimized to enhance the energy conversion efficiency and operational stability of micro-head hydraulic turbines. By integrating Computational Fluid Dynamics with orthogonal experimental design, the influence of blade inlet angle, blade count, and axial length on the flow field within the turbine and hydraulic performance of the turbine was analyzed systematically, which gave the best runner set-up. Based on vortex analysis, supporting plate-type flow guide ribs were added at the diffuser exit to optimize the vortex structure. The results show that the optimized turbine output increased from 3.38 kW to 3.72 kW with a 10.06% increase, and the efficiency improved to 75.05% with a 18.41% enhancement. In addition, there is a significant wake vortex structure at the outlet of the micro-head dual-duct hydraulic turbine, and the asymmetric layout of three runner blades can achieve better vortex breaking and dissipation effects, improving flow field stability and unit operation reliability. The use of a dual-duct diffuser for micro-head hydropower provides a new technological path for promoting efficient development of micro-head hydraulic resources.

1. Introduction

As the cornerstone of clean and renewable energy, which can be recyclable, low-cost, and highly efficient, hydropower has become a significant part of the general Chinese energy system [1]. Micro-head hydropower resources (0–3 m head) are extensively found in irrigation systems on farmlands, mountainous rivers, and urban drainage networks, and they have a huge potential in developing power [2]. There are three significant technical bottlenecks in micro-head conditions with traditional hydraulic turbines, namely steep efficiency decrease, high minimum starting flow velocity requirements, and cavitation susceptibility. Such problems are extremely restrictive to the decent exploitation of micro-head energy resources [3]. Thus, the design of structural optimization for micro-head hydraulic turbines is of great theoretical and practical importance.
Even though there are several models of the micro-head hydraulic turbine, the structural and hydraulic performances of this turbine can be improved [4]. The technology of numerical simulation provides an economical and efficient approach to record elaborate flow patterns, including pressure fields and velocity distributions, in the channel of flows and significantly aids in the design and analysis of fluid machinery optimization, such as low-head cross-flow turbines [5], Francis turbines [6], and in-pipe axial turbines [7]. Performance optimization of micro-head hydraulic turbines through the utilization of the numerical simulation model has become the subject of numerous studies in the world. Zheng et al. did a numerical study of a bulb turbine within five conditions with varying hub ratios [8]. Sun et al. applied multi-objective optimization to a two-bladed bulb turbine; optimization variables were the installation angle, hub ratio, the blade twist angle, and the number of guide vanes [9]. A study by Li et al. confirmed through CFD simulation that the front-mounted bulb turbine without guide vanes offers advantages, including simple structure, good performance, low cost, and stability in its functionality [10]. Picone et al. suggested a new micro-head hydraulic turbine with a simple design, horizontal outlet flow direction, and efficiency comparable to Kaplan turbines [11]. This research is essential in terms of performance optimization and innovation in micro-head hydraulic turbines.
Successful application of guide hood in wind power and tidal energy equipment provides fresh ideas in optimization of micro-head hydraulic equipment [12,13]. The study by Zou et al. has explored the concept of micro-head hydraulic turbines with guide hoods, using the hydraulic performance of various units operating in arrays of different configurations [14]. Gao et al. found that the design of hydraulic turbines was a flow-capturing device that utilized a turbine diffuser, enabling turbines to capture low-velocity flows earlier [15]. Nevertheless, all these diffusers have single flow channels; dual-channel diffusers with inner and outer flow channels remain unused in micro-head hydraulic turbines.
Contemporary studies of micro-head hydraulic turbines and diffusers are mainly concerned with general efficiency. However, there is increasing evidence that, as essential carriers of energy dissipation and flow instability, vortices have a direct impact on the hydraulic performance and operational reliability of the unit through their generation, evolution, and collapse processes [16,17,18]. Highly time-varying vortex structures known as multiscale under micro-head, low-velocity conditions tend to develop in the flow channel, such as tip vortices, wake vortices, as well as secondary flows [19]. These vortices not only ensure energy loss and local pressure pulse but can also cause unit vibration and noise, which, in turn, impact unit lifespan and stable operation [16,17,18]. Thus, exploring the possible ways of the evolution of the internal vortices in micro-head double-duct hydraulic turbines and suggesting the specific vortex-control optimization strategies in accordance with the characteristics of the flow fields is of great theoretical importance to the increase in the stability of the units’ operations.
This paper proposes the concept of the double-duct diffuser to the micro-head hydropower domain, creating a new concept of a micro-head double-duct hydraulic turbine. The scientific contribution of this work is articulated on two levels. Methodologically, it establishes a systematic framework by first employing orthogonal experimental design for the multi-objective optimization of key runner parameters and subsequently integrating high-resolution vortex identification (using the Ω criterion) to analyze the resulting flow dynamics. Physically, the vortex analysis investigates the formation and helical evolution mechanism of the dominant wake vortex in the inner duct. Crucially, based on the analysis of vortex core stability and spatial development modes, the arrangement of diversion ribs was optimized, proposing and validating a vortex control strategy employing an asymmetric layout, which proves more effective in fragmenting the vortex core and enhancing energy dissipation than conventional symmetric arrangements. This work, therefore, aims to provide not only an optimized turbine design but also new insights into vortex physics and control principles applicable to micro-head dual-duct hydraulic machinery.

2. Geometric Model

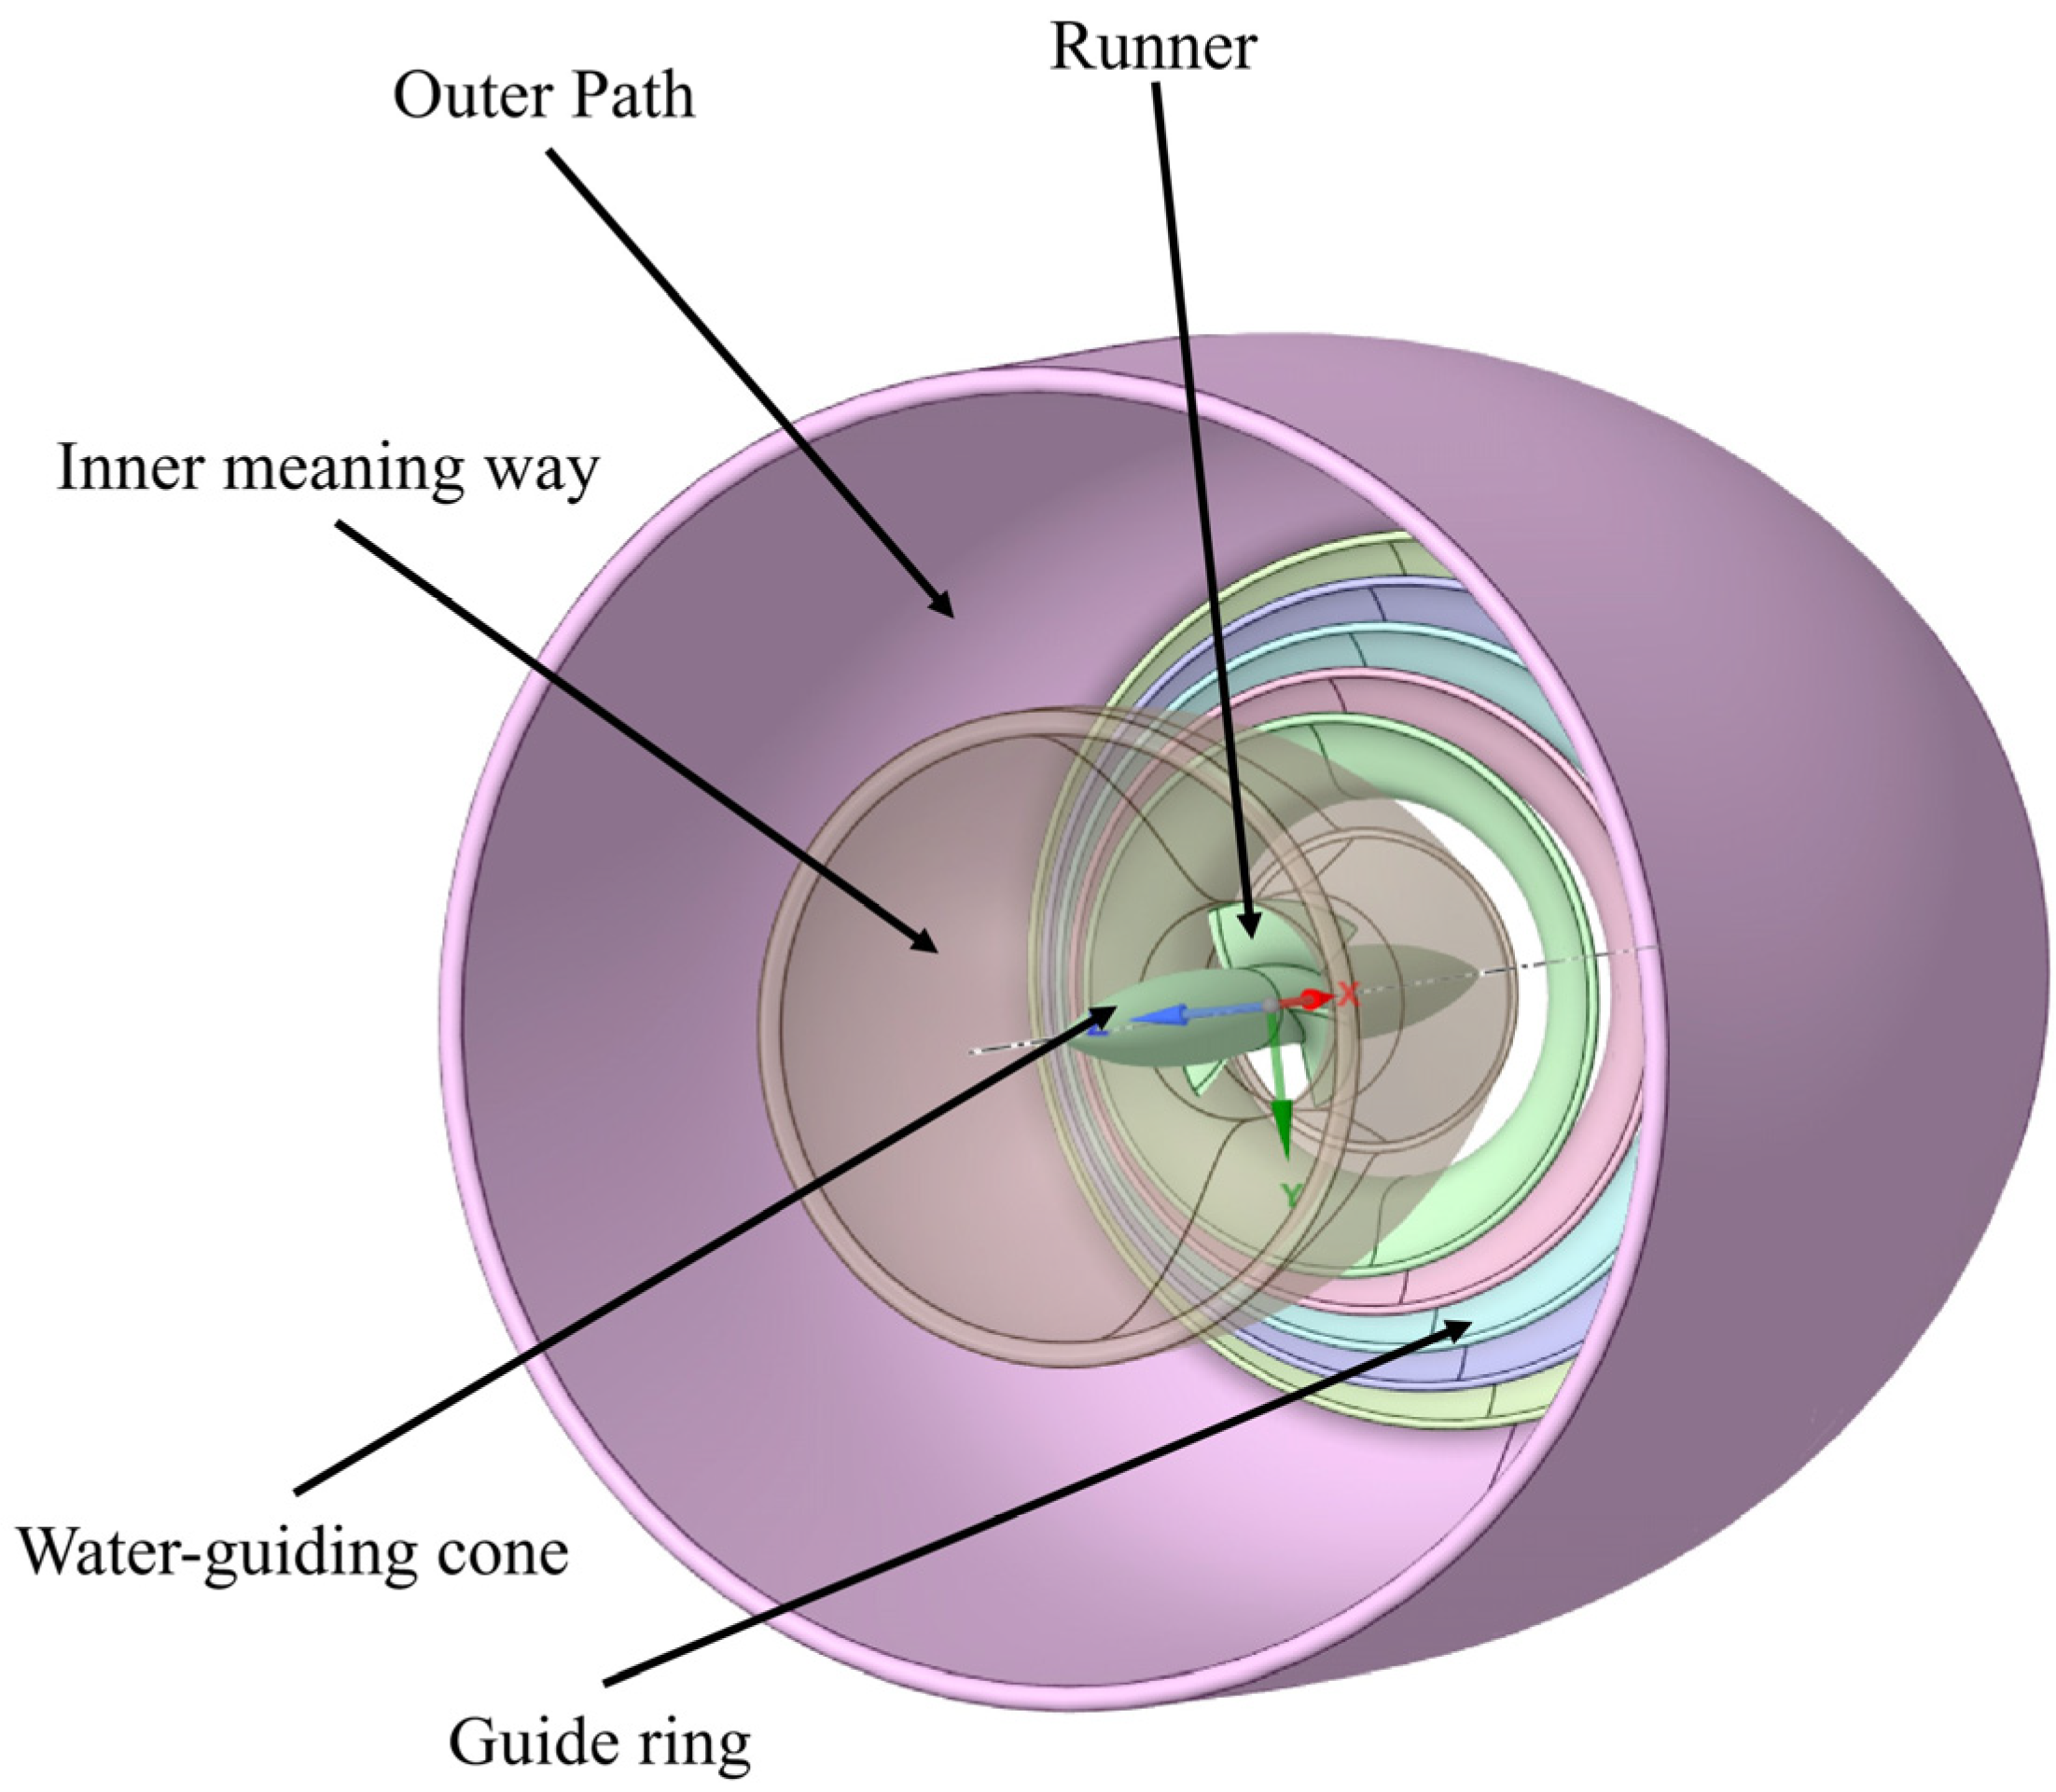
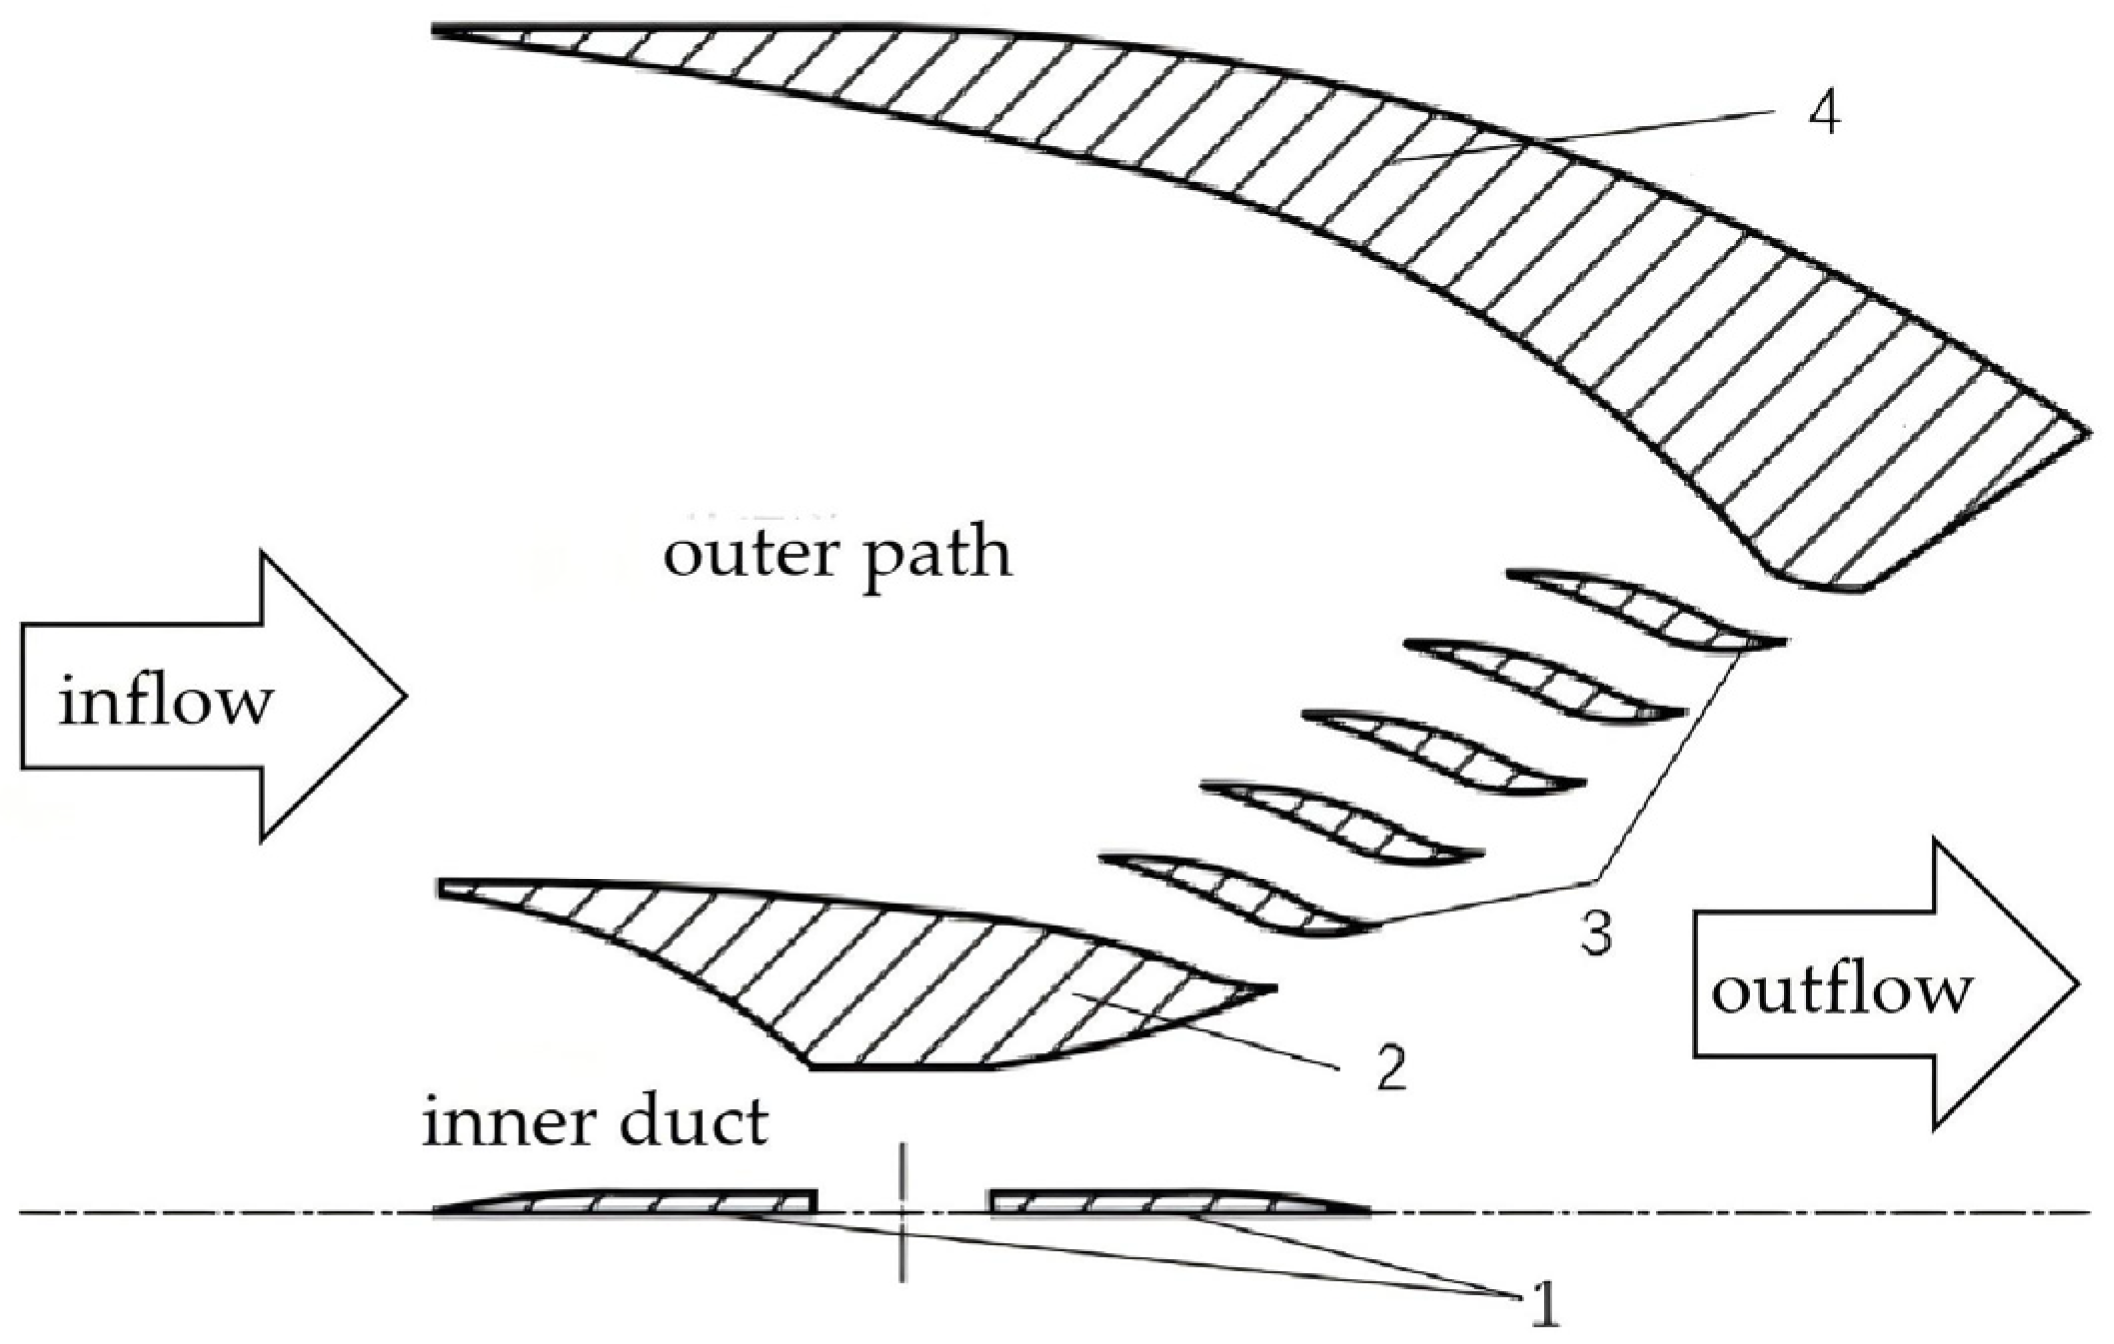
The micro-head double-duct hydraulic turbine is mainly composed of an inner meaning way, outer path, guide ring, water-guiding cone, and runner blades, as its three-dimensional model is represented in Figure 1. In addition, Figure 2 is a half cross-sectional view of the micro-head dual-duct hydraulic turbine. The inner duct acts to form, which can hold the turbine generator unit, and the discharge aspect on the inner and outer has a shared guide ring. In particular, water accelerated through the outer duct enters the guide ring, and it creates several high-speed jets. These jets positively impact the inner duct by decreasing the pressure in the outlet of the guide ring to increase the velocity of the flow to create water with higher kinetic energy to run the turbine. Table 1 gives the basic parameters of the micro-head double-duct hydraulic turbine.

3. Calculation Methods and Reliability Verification

3.1. Solution Methods and Boundary Conditions

Numerical simulation of the internal flow characteristics in the hydraulic turbine was done using ANSYS 2024 Fluent solver, which relies on the finite volume method. Due to the relatively high rotational speed in the impeller region, the flow in the passages undergoes large-scale distortion, leading to a highly complex internal flow field. The flow within the water turbine is treated as an incompressible fluid dynamics problem. Steady-state flow field simulations are performed by solving the three-dimensional, incompressible Navier–Stokes equations coupled with the continuity equation. The SST k-ω turbulence model was chosen to be used in the numerical computation to obtain a more realistic fluid simulation of the micro-head double-duct hydraulic turbine [20]. This model has the strengths of the wall-proximity simulation of the Wilcox k-ω model coupled with the ability of the standard k-ε model to use efficiency in far-field free-stream areas, and it has good simulation ability for complex flows. The k-ω equations are activated near walls to capture fine flow details, whereas the k-ε mode is used in regions distant from walls, balancing computational efficiency with effective capture of flow field variations.
The three-dimensional incompressible Navier–Stokes equations are expressed as follows [21]:
( ρ u ) t + u ( ρ u ) x + v ( ρ u ) y + w ( ρ u ) z = p x + μ u x 2 + u y 2 + u z 2
( ρ v ) t + u ( ρ v ) x + v ( ρ v ) y + w ( ρ v ) z = p y + μ v x 2 + v y 2 + v z 2
( ρ w ) t + u ( ρ w ) x + v ( ρ w ) y + w ( ρ v ) z = p z + μ w x 2 + w y 2 + w z 2
The three-dimensional continuity equation for incompressible flow is expressed as follows:
( ρ u ) x + ( ρ v ) y + ( ρ w ) z = 0
where ρ is the fluid density (kg/m3), t is time (s), u , v , and w are the veloci ty components in the x , y , and z directions, respectively (m/s); and p is the pressure (Pa).
The equation of the SST k-ω model is [20]:
t ( ρ k ) + x i ( ρ k u i ) = x j Γ k k x j + G k Y k + S k
t ( ρ ω ) + x i ( ρ ω u i ) = x j Γ ω ω x j + G ω Y ω + D ω + S ω
where k is the turbulent kinetic energy (J), ω is the specific dissipation rate (s−1), u i represents the mean velocity component (m/s), Γ k and Γ ω are the effective diffusion term of k and ω , respectively, G k denotes the generation term of turbulent kinetic energy k caused by the average velocity gradient, G ω is the ω equation, Y k and Y ω are the diffusion term of k and ω , respectively, S k and S ω are custom items, and D ω is an orthogonal divergence term.
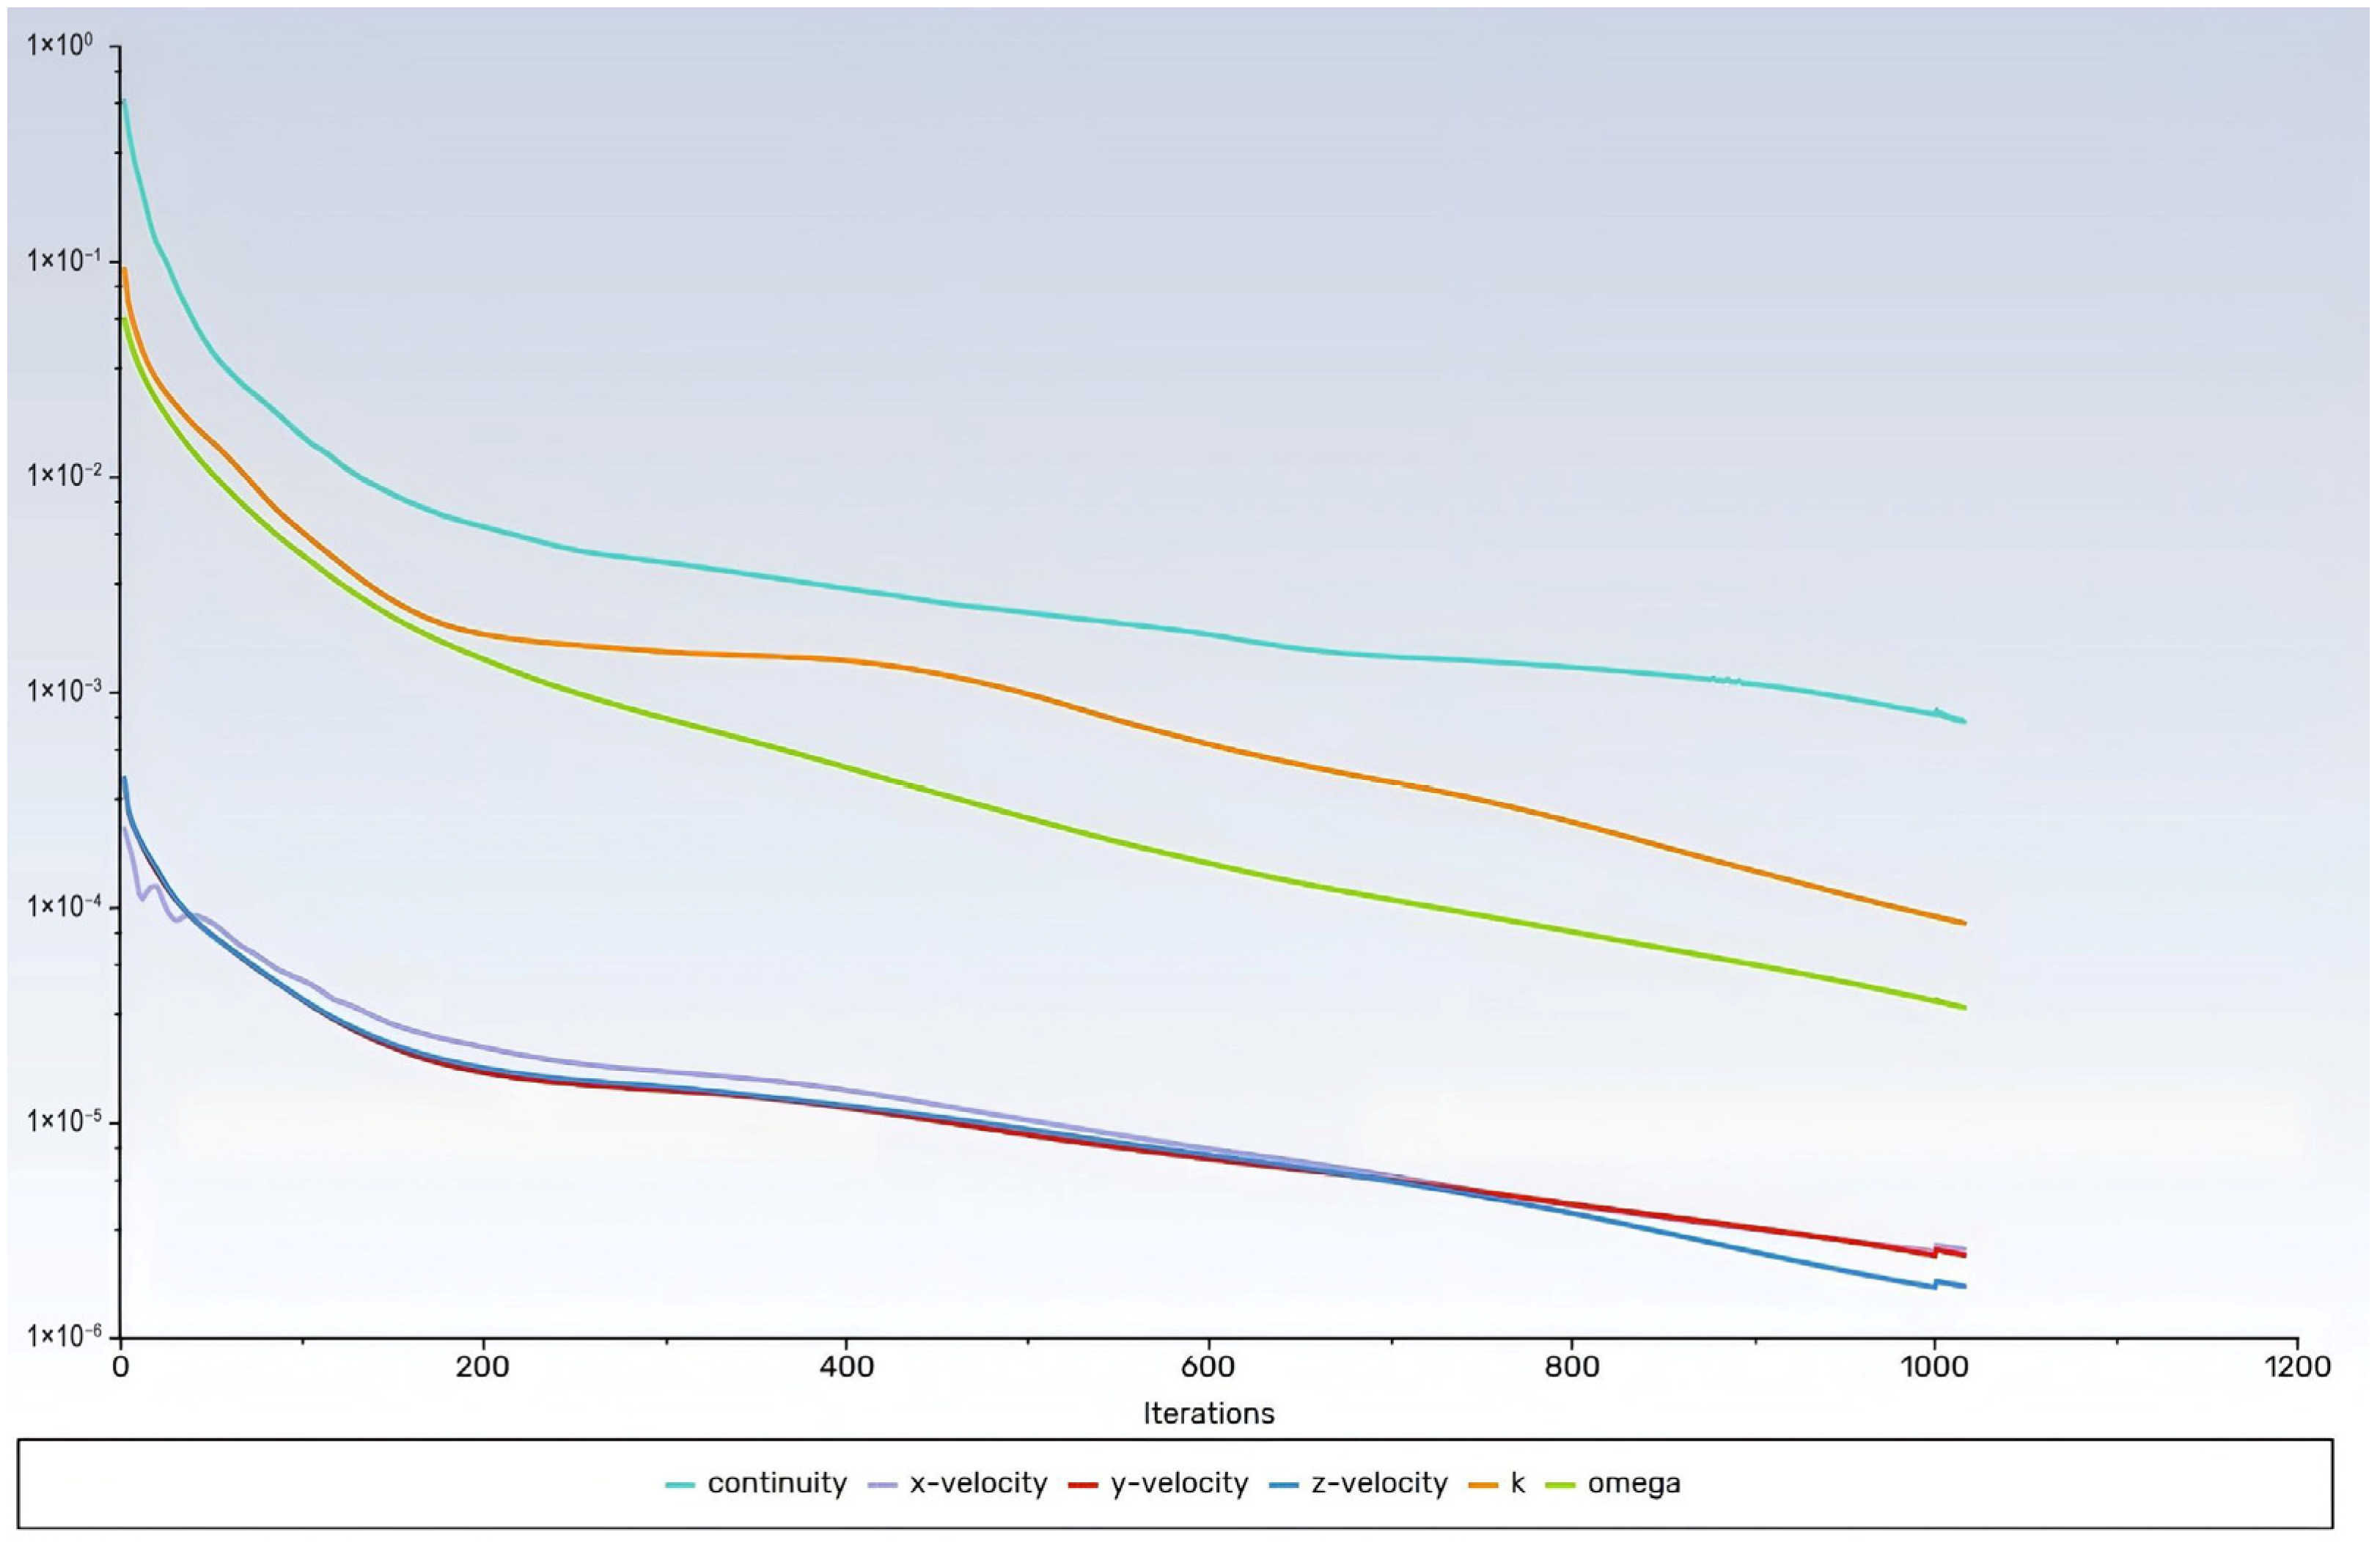
Boundary conditions for the computational domain are assigned as follows: a velocity inlet with a uniform flow velocity of 1 m/s was specified at the domain inlet, along with a turbulent intensity of 5% and a turbulent viscosity ratio of 10, a pressure outlet at the outlet, and no-slip boundary conditions applied to solid walls. For the treatment of the rotating impeller, the Multiple Reference Frame (MRF) model was adopted. The impeller region was defined as a rotating frame with a rotational speed of 80 rpm, while the surrounding domains remained stationary. The interfaces between rotating and stationary zones were configured using the Frozen Rotor interface model. A steady-state simulation approach was utilized, with the coupled pressure-velocity equations solved using the SIMPLEC algorithm. Spatial discretization of the convection terms for momentum, turbulent kinetic energy, and specific dissipation rate was performed using a second-order upwind scheme. The solution was initialized using a hybrid initialization method. Convergence was monitored against two criteria: the scaled residuals for continuity, momentum, k, and ω equations should be kept as low as possible, below 10−5, and key global parameters, including mass flow rate imbalance and impeller torque, were monitored to ensure they had reached a stable, asymptotically constant value. The residual curve of convergence accuracy illustrated in Figure 3 verified the reliability of the numerical solution developed in the present investigation.

3.2. Mesh Generation and Mesh-Independent Verification

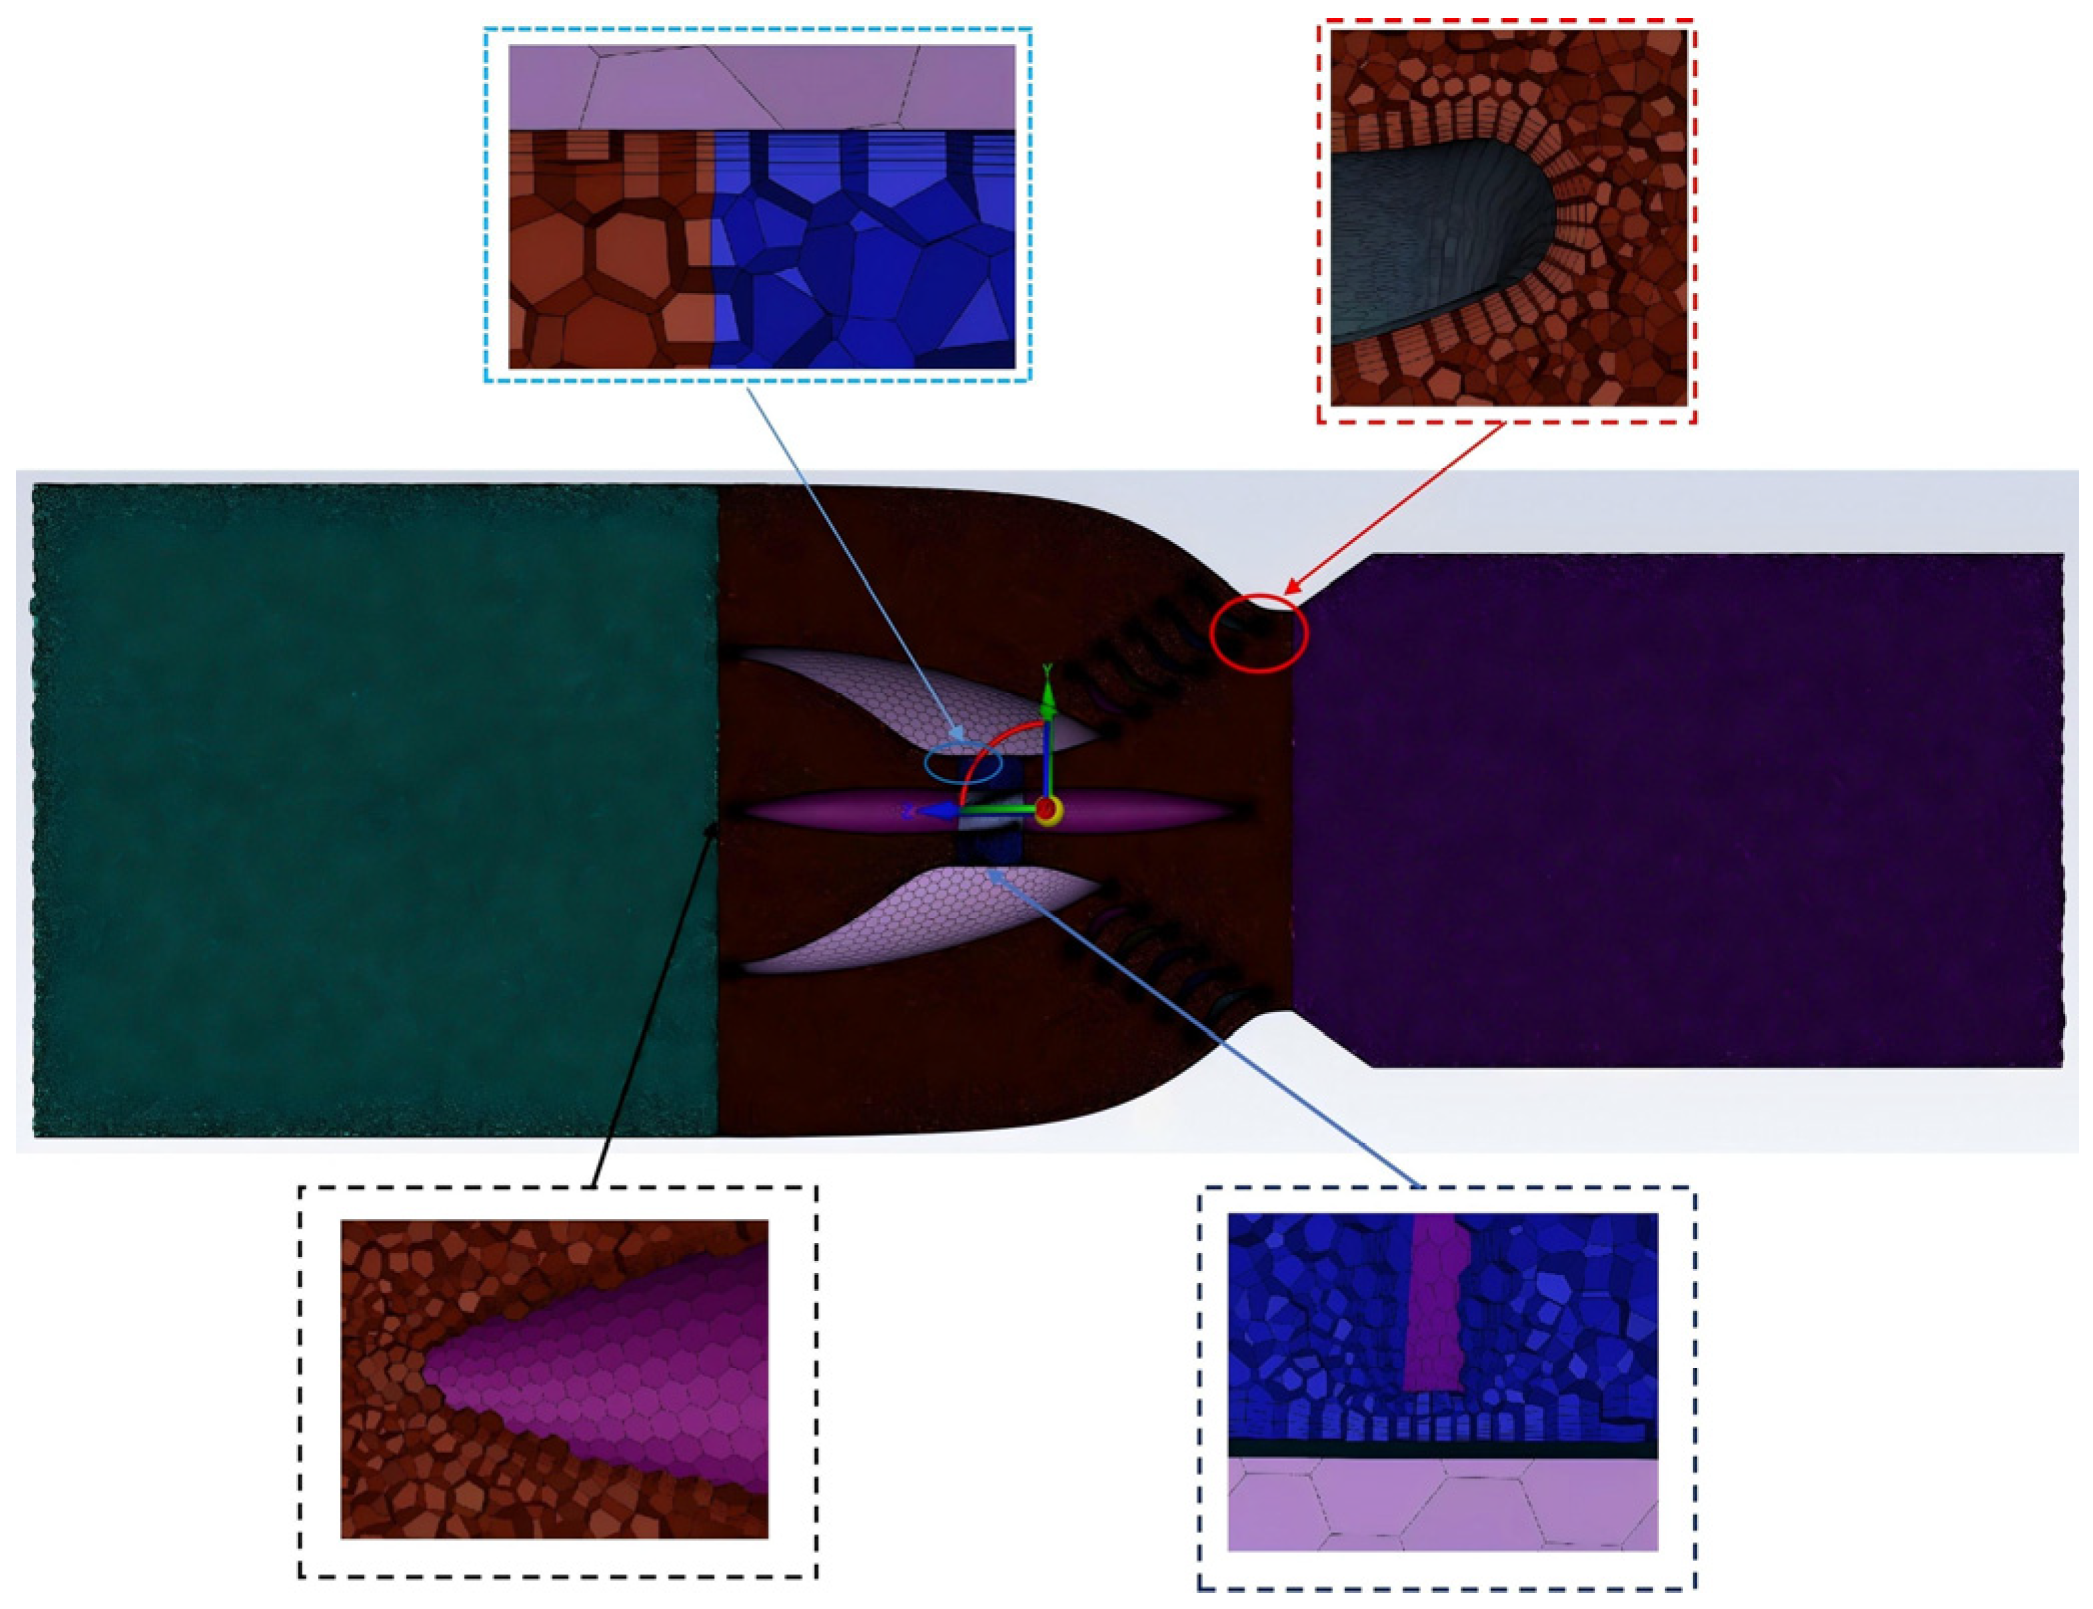
An unstructured grid, in the form of a polyhedral mesh, was used, with local refinement applied to the complex, structurally challenging areas of the impeller and guide ring, as depicted in Figure 4.
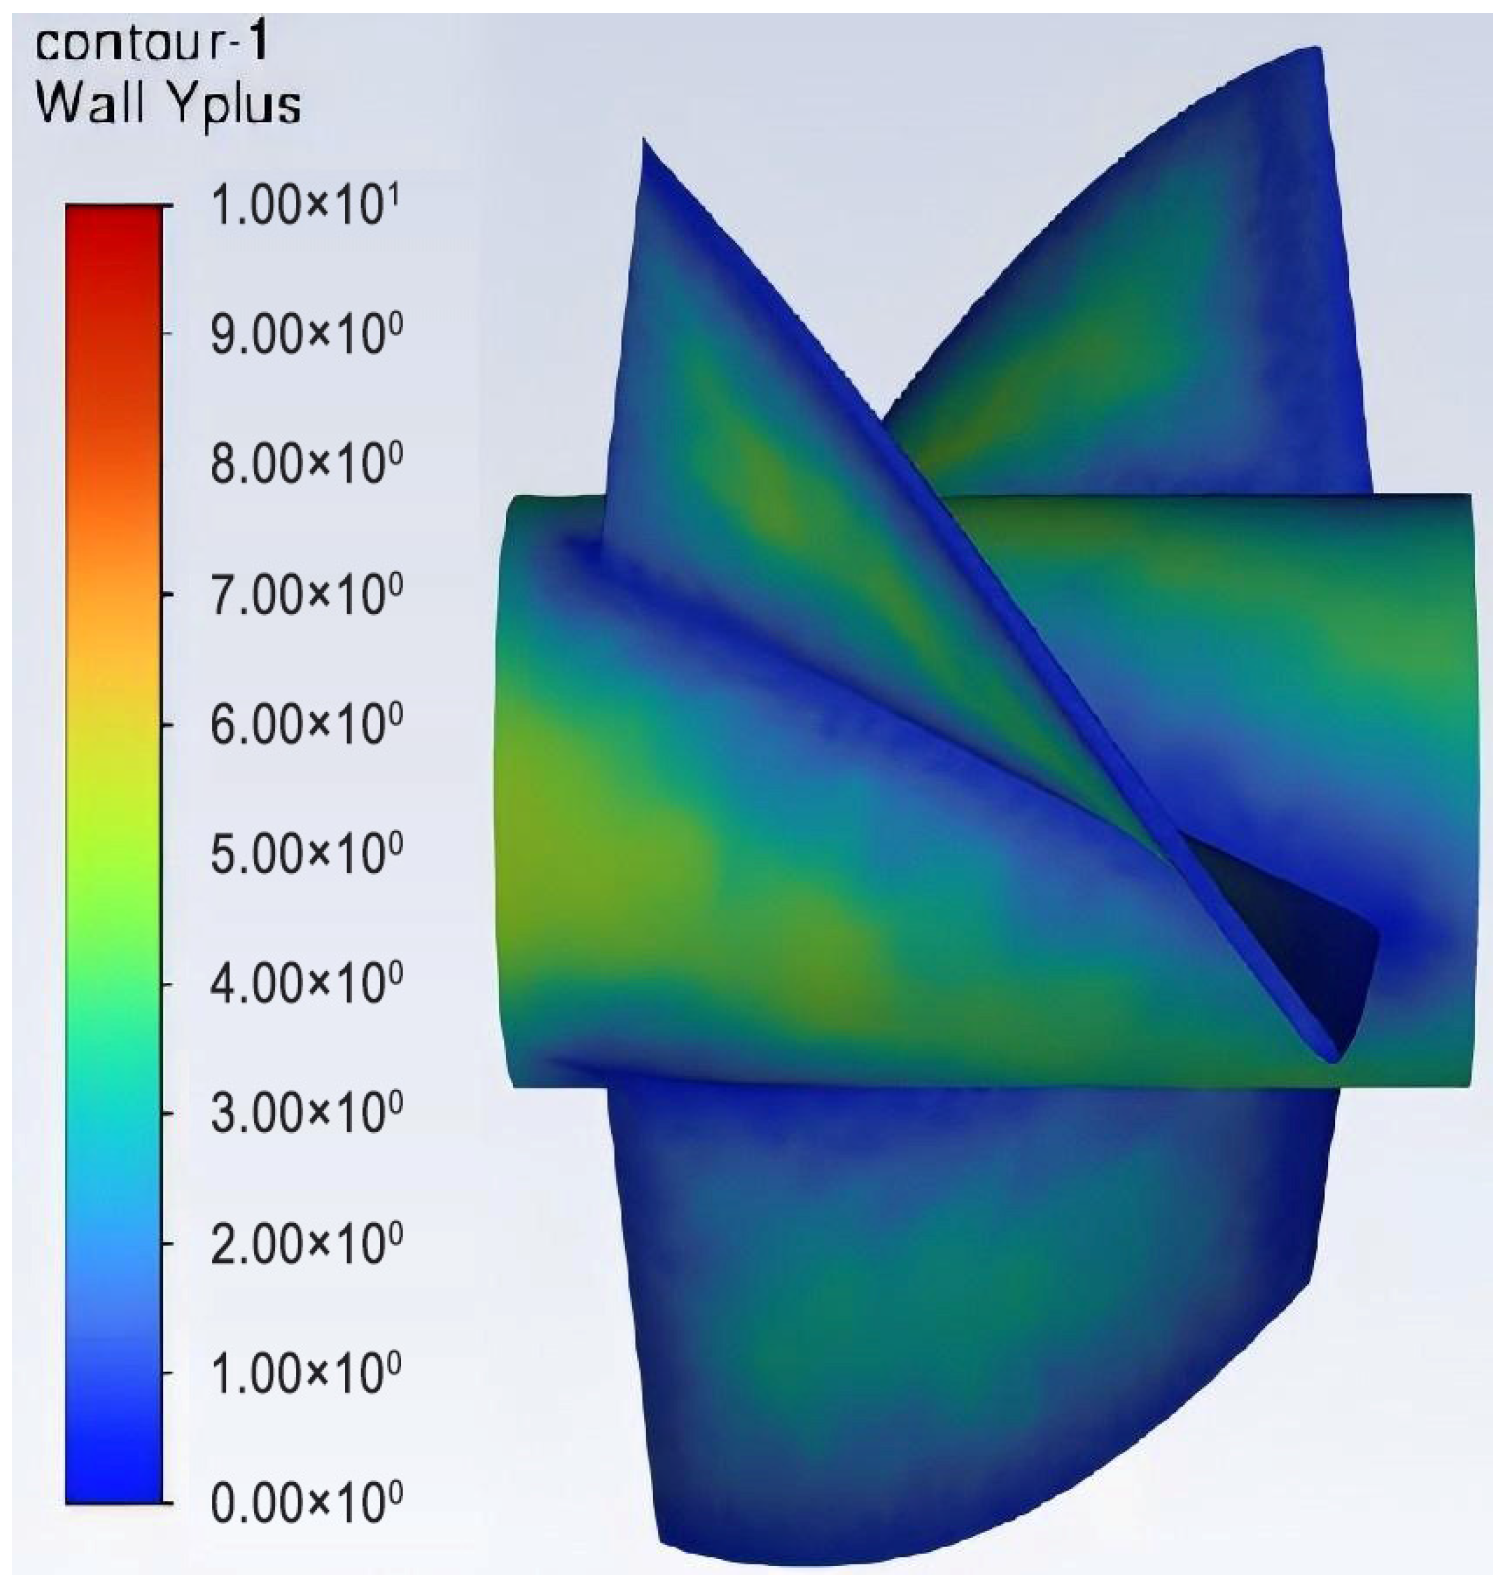
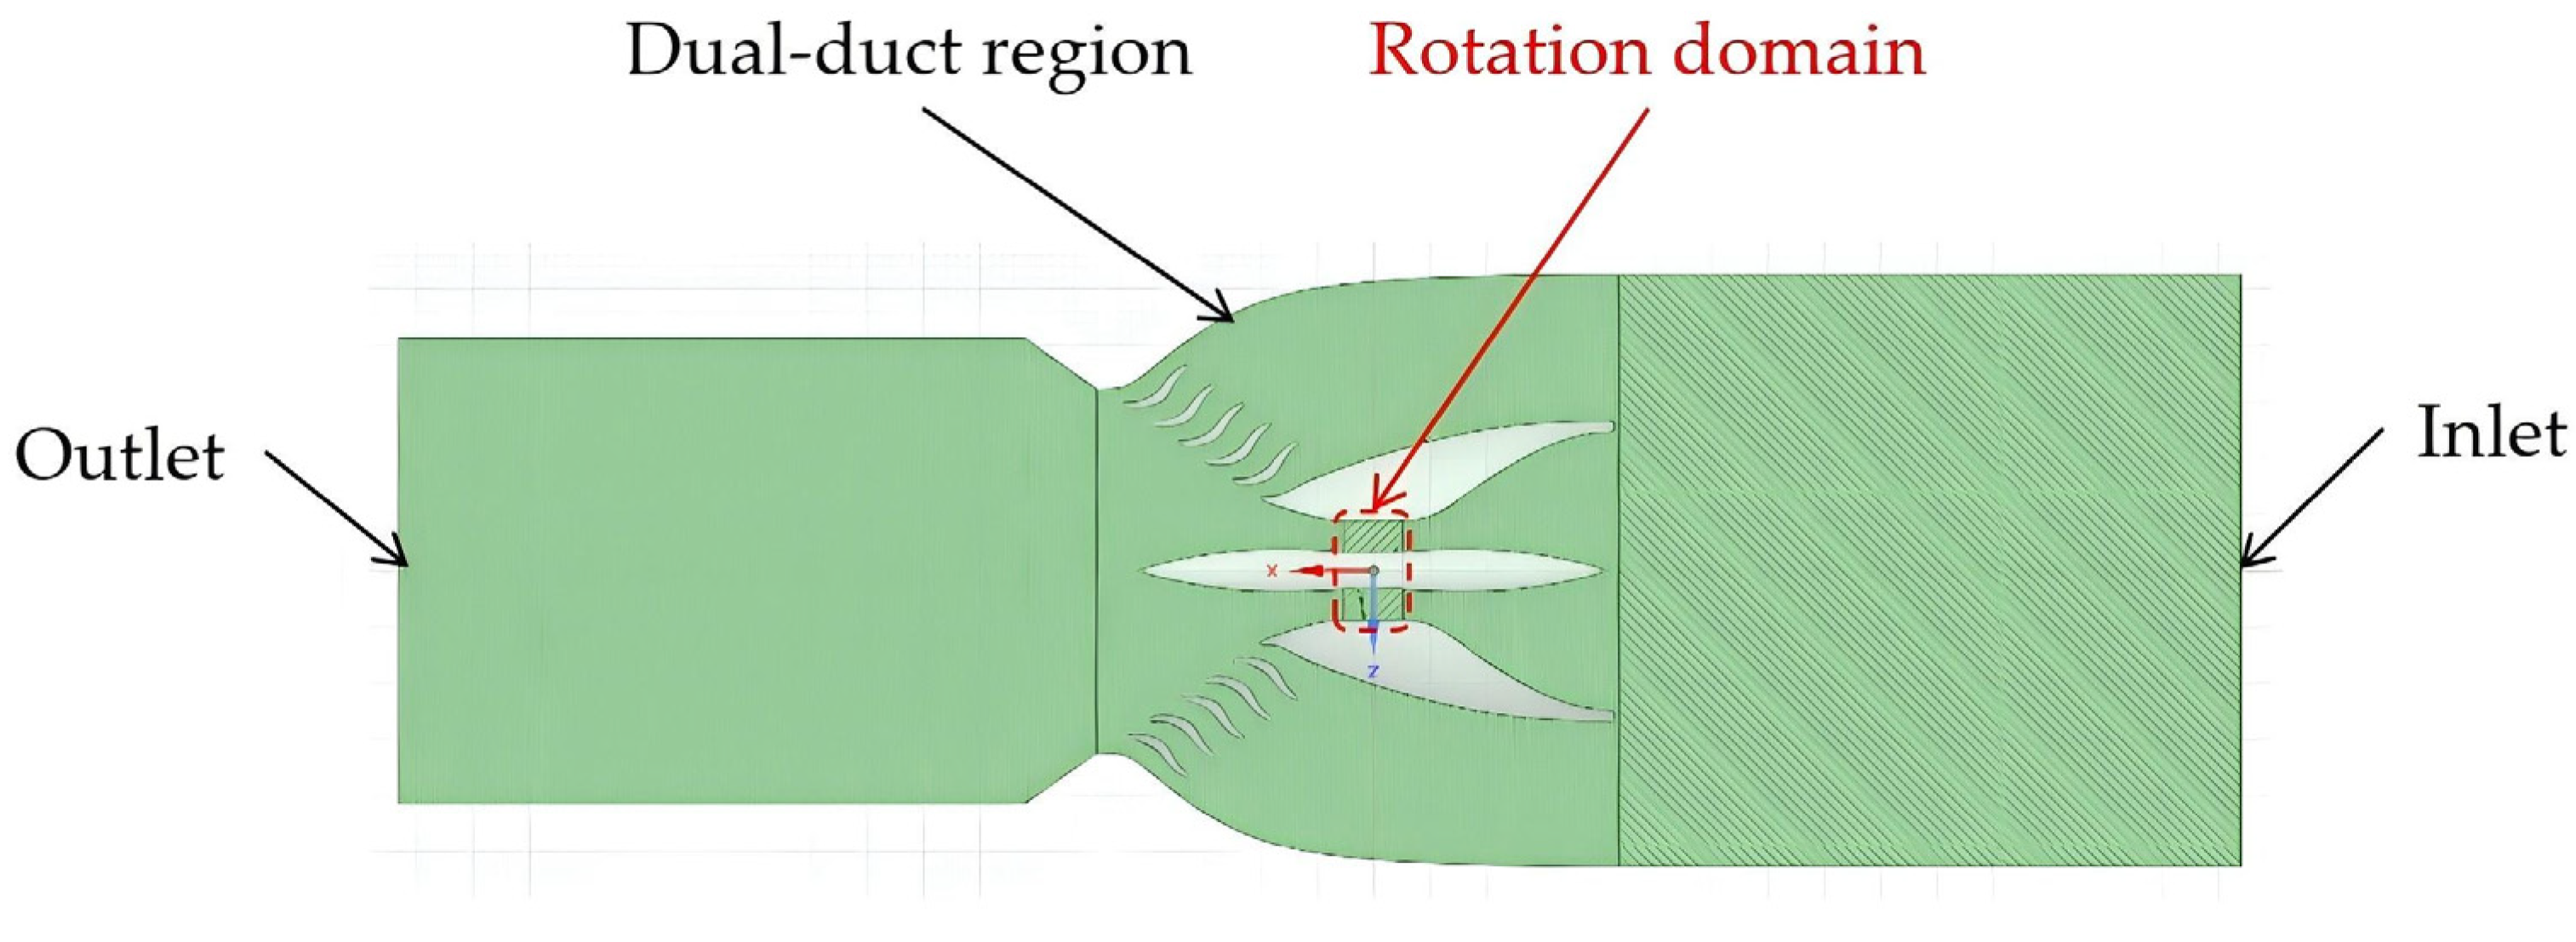
Mesh independence verification was performed using head as the key metric, involving iterative comparison of computational results from different mesh densities [20]. A total of 5 types of grids with grid numbers ranging from 6.32 million to 14.81 million were simulated. When the number of grids reached 12.65 million, the impact of increasing the number of grids on single machine efficiency could be ignored. The variation in water head with the grid is shown in Table 2. The final mesh structure with 12.65 million elements was chosen, and it has a head error below 2% and is also good in accuracy. The scheme meets the requirement of a minimum grid quality of 0.2 and arranges 5 layers of boundary layer grids in the near-wall area. The adhesion thickness of the initial layer was 0.2 mm with an interlayer growth ratio of 1.2. The chosen mesh scale ensured compliance with the y+ requirement for turbulent flow calculations, enabling precise capture of flow gradients. Figure 5 illustrates the wall y+ contour on the runner blades. The lengths of the axial inlet and outlet of the turbine were extended accordingly in order to achieve complete development of turbulence. The computational fluid domain is illustrated in Figure 6.
The calculation of head error in this study is based on relative error, and the formula is as follows:
h e a d   e r r o r = H c a l c H r e f H r e f × 100 %
where H c a l c is the calculated water head at a certain grid density, and H r e f is the grid-independent benchmark head.

4. Orthogonal Test Plan Design and Results Analysis

4.1. Determination of Indicators and Test Factors

The optimization study of the micro-head double-duct hydraulic turbine aims to comprehensively enhance its hydraulic performance and operational stability. To systematically evaluate the overall performance of micro-head double-duct hydraulic turbines, this research selects unit output, efficiency, axial force, and radial force as core optimization indicators. The rationale behind the choice is as follows: Output directly reflects the power generation capacity of the turbine, serving as a direct indicator of hydropower resource development benefits; efficiency is the core metric for evaluating a turbine’s conversion of hydraulic energy into mechanical energy, with high efficiency being the fundamental optimization goal, especially in low-energy-density, micro-head resources; the axial and radial forces are important mechanical parameters since they determine both the operational reliability and structural safety of a turbine. Flow fields working under micro-head conditions are subject to unstable vortices and can enhance these mechanical loads. Thus, reducing the effect of these forces is a prerequisite to having the unit work long-term and in a stable mode.
According to the orthogonal experimental design method, the research was undertaken whereby the optimization variables were blade inlet placement angle (A), quantity of blades (B), and axial length (C). The parameters of the first turbine model were A = 40°, B = 4, and C = 400 mm. The test head was 0.35 m, with a unit output of 3.38 kW and an efficiency of 63.38%.

4.2. Determination of Orthogonal Test Plan

The research design used in this study is a three-factor, three-level orthogonal test. The test uses the L9(33) orthogonal table (Table 3), which systematically examines the influence of blade inlet angle, blade count, and axial length on the hydraulic performance and stability of a micro-head double-duct hydraulic turbine. This approach enables effective identification of the main effects of each factor with fewer tests and allows for preliminary analysis of interactions. The choice of the optimization variables was carried out through the analysis of the energy loss mechanisms in micro-head hydraulic turbines.

4.3. Orthogonal Test Calculation Results

The hydraulic characteristics of a turbine are determined by performance metrics, including its power and flow rate. The hydraulic input power of a turbine (denoted as P i n ) refers to the total energy of the fluid passing through the turbine per unit time, i.e., the power conveyed by the fluid flow, as expressed by [22]:
P i n = ρ g Q H
where ρ is the fluid density, g is the gravitational acceleration, Q is the volumetric flow rate, and H is the pressure head.
Q is initially specified via the velocity-inlet boundary condition, as expressed by:
Q = v A
where v is the inlet velocity of the inner duct and A is the inlet cross-sectional area of the inner duct.
H is also defined as the total pressure energy head calculated by:
H = Δ p t o t a l ρ g
where Δ p t o t a l is the total pressure difference between the inlet and outlet of the turbine.
The turbine’s output power ( P o u t ) corresponds to the quantity of hydraulic energy converted into mechanical energy by the turbine per unit time; it is correlated with the turbine’s rotational speed, runner structure, and hydrodynamic characteristics. A higher hydraulic head and larger flow rate result in greater energy captured by the turbine, thus yielding a higher power output. Typically, the output power is calculated using rotational speed and torque derived from flow field analysis. In this study, the mechanical power output is computed by monitoring the torque and rotational speed of the runner via the solver, as expressed by:
P o u t = T ω = T 2 π n 60
where T is the runner torque (N·m), ω is the angular velocity of the runner (rad/s), and n is the rotational speed (rpm).
The ratio of the output power of the hydraulic turbine to the hydraulic input power is called the efficiency of the hydraulic turbine, expressed as follows:
η = P o u t P i n × 100 %
In order to ensure consistency in comparison, all conditions remained identical with the exception of the variable parameters of impellers, which were set following the orthogonal test design. Table 4 gives the numerical simulation results of each scheme. Through intuitive analysis, according to Table 4, the maximum power output is 3.72 kW, and the best configuration is A3B1C3. The highest efficiency is 75.05%, also obtained by A3B1C3. The minimum axial force is 1797.9 N, which corresponds to A1B1C1. The minimum radial force is 8.81 N, which is A1B2C2.

4.4. Range Analysis

Range analysis is an essential instrument in orthogonal experiments, allowing for the exclusion of any random factor. Moreover, the range analysis method is simple and intuitive. Firstly, after calculating the indicator values of the experimental plan, the statistical parameters K i value and K ¯ i value are calculated for the indicator values at each factor level, as shown in Equations (13) and (14), respectively:
K i = k = 1 n Y k
K ¯ i = 1 n K i
where K i is the average of multiple results of each factor at level i ; Y k is the k th indicator value; K ¯ i is the average value of K i ; and n is the number of experiments.
The formula for calculating the range R j is shown in Equation (3):
R j = max { K 1 ¯ , K 2 ¯ , } min { K 1 ¯ , K 2 ¯ , }
Under range analysis, the larger the range of a particular factor, the greater the impact on the particular evaluation metric [9]. The results of the range analysis of each factor under various metrics are summarized in Table 5.
(1)
Effects of Experimental Factors on Unit Output
According to Table 5, axial length has the highest range, which illustrates its highest regulatory impact on the unit output. Optimal unit output is achieved at an axial length of 480 mm. Blade inlet placement angle follows in influence, while blade count has the least impact on unit output. According to the main effects model [23], the predicted optimal combination is A3B3C3: blade inlet placement angle 50°, blade count 5, and axial length 480 mm.
(2)
Effect of Test Factors on Efficiency
Table 5 shows RA > RC > RB, indicating the influence order of test factors on efficiency is: blade inlet placement angle > axial length > blade count. The blade inlet placement angle has the most significant impact on efficiency, with the highest efficiency achieved at 50°. The optimal combination is A3B2C3.
(3)
Effect of Experimental Factors on Axial Force
Excessive axial force can lead to thrust bearing failure and shortened service life of the bearings, which are directly related to unit reliability. Thus, the forces of axial are to be minimized. Table 5 shows RB > RA > RC. This implies that the number of blades is the most important value in controlling the axial force, and when the number of blades is 3, the axial force is minimized. A1B1C2 is the best combination.
(4)
Influence of Test Factors on Radial Force
Perpendicular to the shaft of the turbine is the resultant force referred to as the radial force. Excessive radial forces may cause vibration and noise, and may result in premature bearing and seal failure. That is why it is important to reduce the radial force to make the work of the units stable. Table 5 indicates that RA > RC > RB. This confirms the fact that the inlet angle exerts the greatest effect on the radial force, with the least radial force being at the blade inlet placement angle of 30°. A1B3C1 is the most optimal combination.

4.5. Comprehensive Frequency Analysis

Comprehensive frequency analysis is an effective decision-making mechanism in solving multi-objective conflicts; the complexity optimization is converted into a statistical problem with frequencies [9]. The overall frequency of each level of factor by combining the optimal solutions of intuitive and range analysis (8 in total) and statistically comparing the frequency of the factors results in the following data: A1 and A3 have the same frequency (4/8). As the increase in the unit output and efficiency is the main aim of the optimization design, and A3 has the best performance in terms of unit output and efficiency, A3 is chosen. B1 has the highest frequency (4/8), and both B2 and B3 have frequencies of 2/8. Therefore, B1 is selected. C3 has the highest frequency (4/8), with C2 and C3 both having a frequency of 2/8. Therefore, C3 is selected. Combining the preceding analysis, the optimal configuration for the turbine is A3B1C3, which corresponds precisely to test plan 7 in Table 3. The best parameters of the configuration are a blade inlet placement angle of 50°, three blades, and an axial length of 480 mm.
The micro-head double-duct hydraulic turbine had considerable performance improvement through orthogonal multi-objective optimization testing. The unit output increased from 3.38 kW before optimization to 3.72 kW, representing a 10.06% increase. The efficiency was improved from 63.38% to 75.05%, representing an increase of 11.67 percentage points, or an 18.41% enhancement relative to the baseline. The most efficient design not only improves the energy conversion efficiency of the turbine but also increases its mechanical reliability and operational stability.

5. Flow-Field Analysis and Tail Vortex Structure Optimization

5.1. Optimization Scheme Design

The flow field analysis of the optimal scheme based on orthogonal experiments (hereafter referred to as Scheme 1) demonstrated that the water flow has very intense phased velocity variations as it passes through the system. From the inlet to the duct opening, the flow and cross-sectional area are constant, which causes a low change in velocity. The second phase is between the point of duct inlet and the impeller inlet; the flow field transformation takes place in the inner duct, where the main transformation takes place. The front part of the inner duct is a gradually shrinking channel. Together with the guide-cone structure before the impeller inlet, this will result in a continuous increase in the velocity of the flow. The third phase involves the impeller area located at the middle part of the duct, whereby the water flow impacts the blades and causes the impeller to rotate and perform work. The fourth stage occurs downstream of the impeller and this means that this stage can be split into two portions: the outer duct, whereby the water flows through the guide ring to a form high-velocity jet, which generates a substantial velocity gradient in the surrounding environment; the inner duct’s gradually widening channel, where water moves towards the expanding flow channel, loses velocity gradually after passing through the impeller. A clear zone with low velocity is created below the guide cone. This part is the major source of generating the tail vortex due to the nature of the flow in the impeller outlet (residual annular flow).
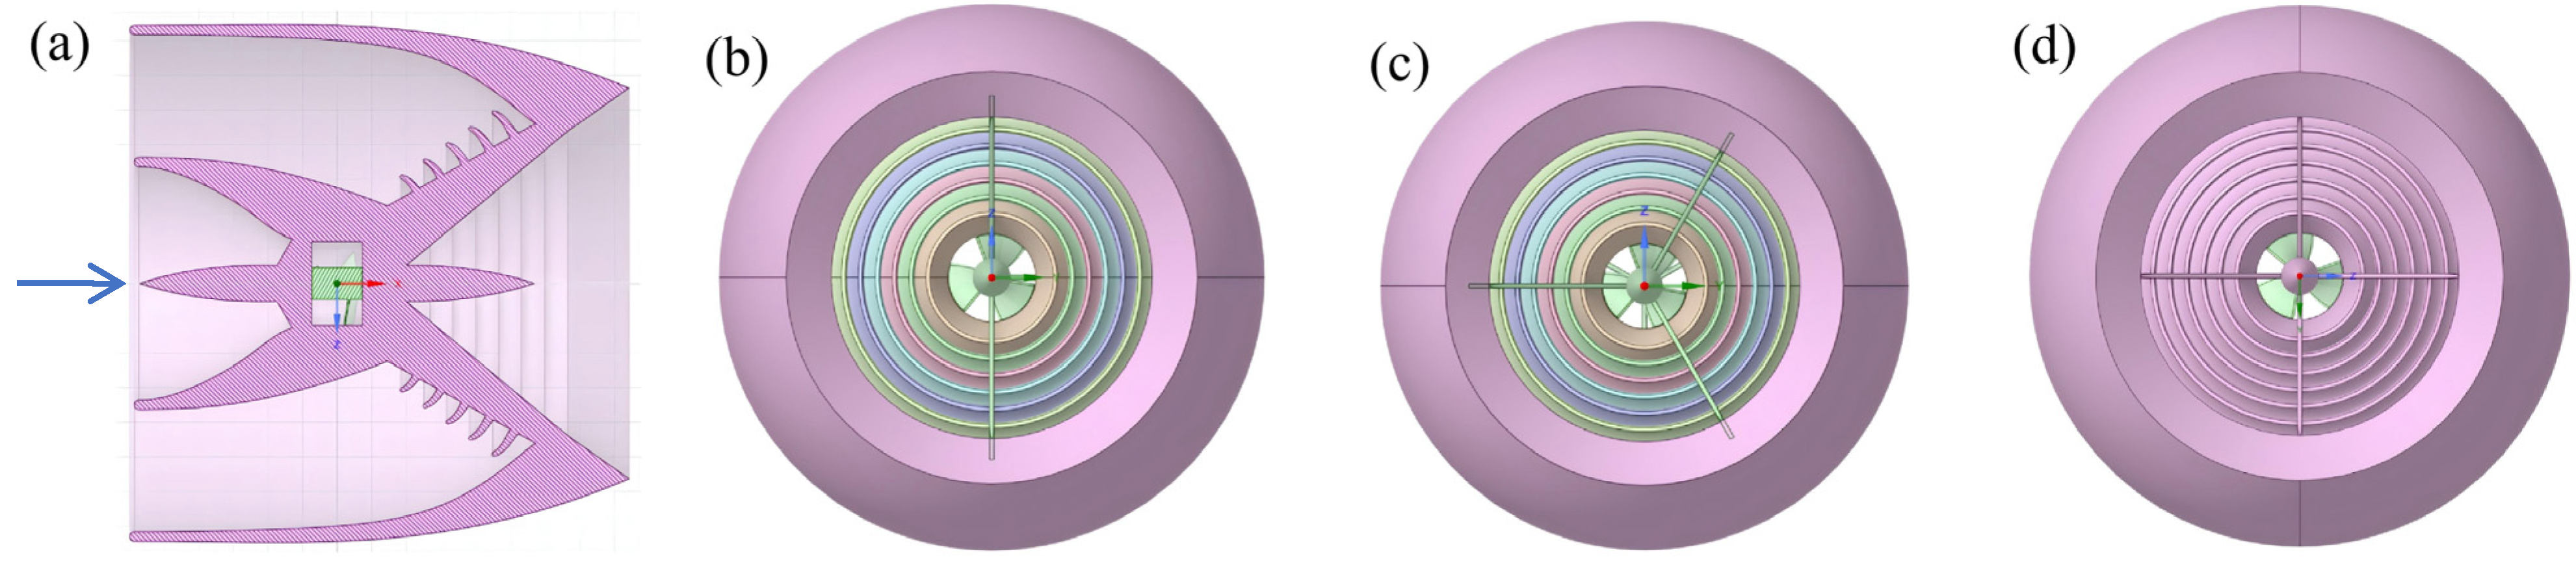
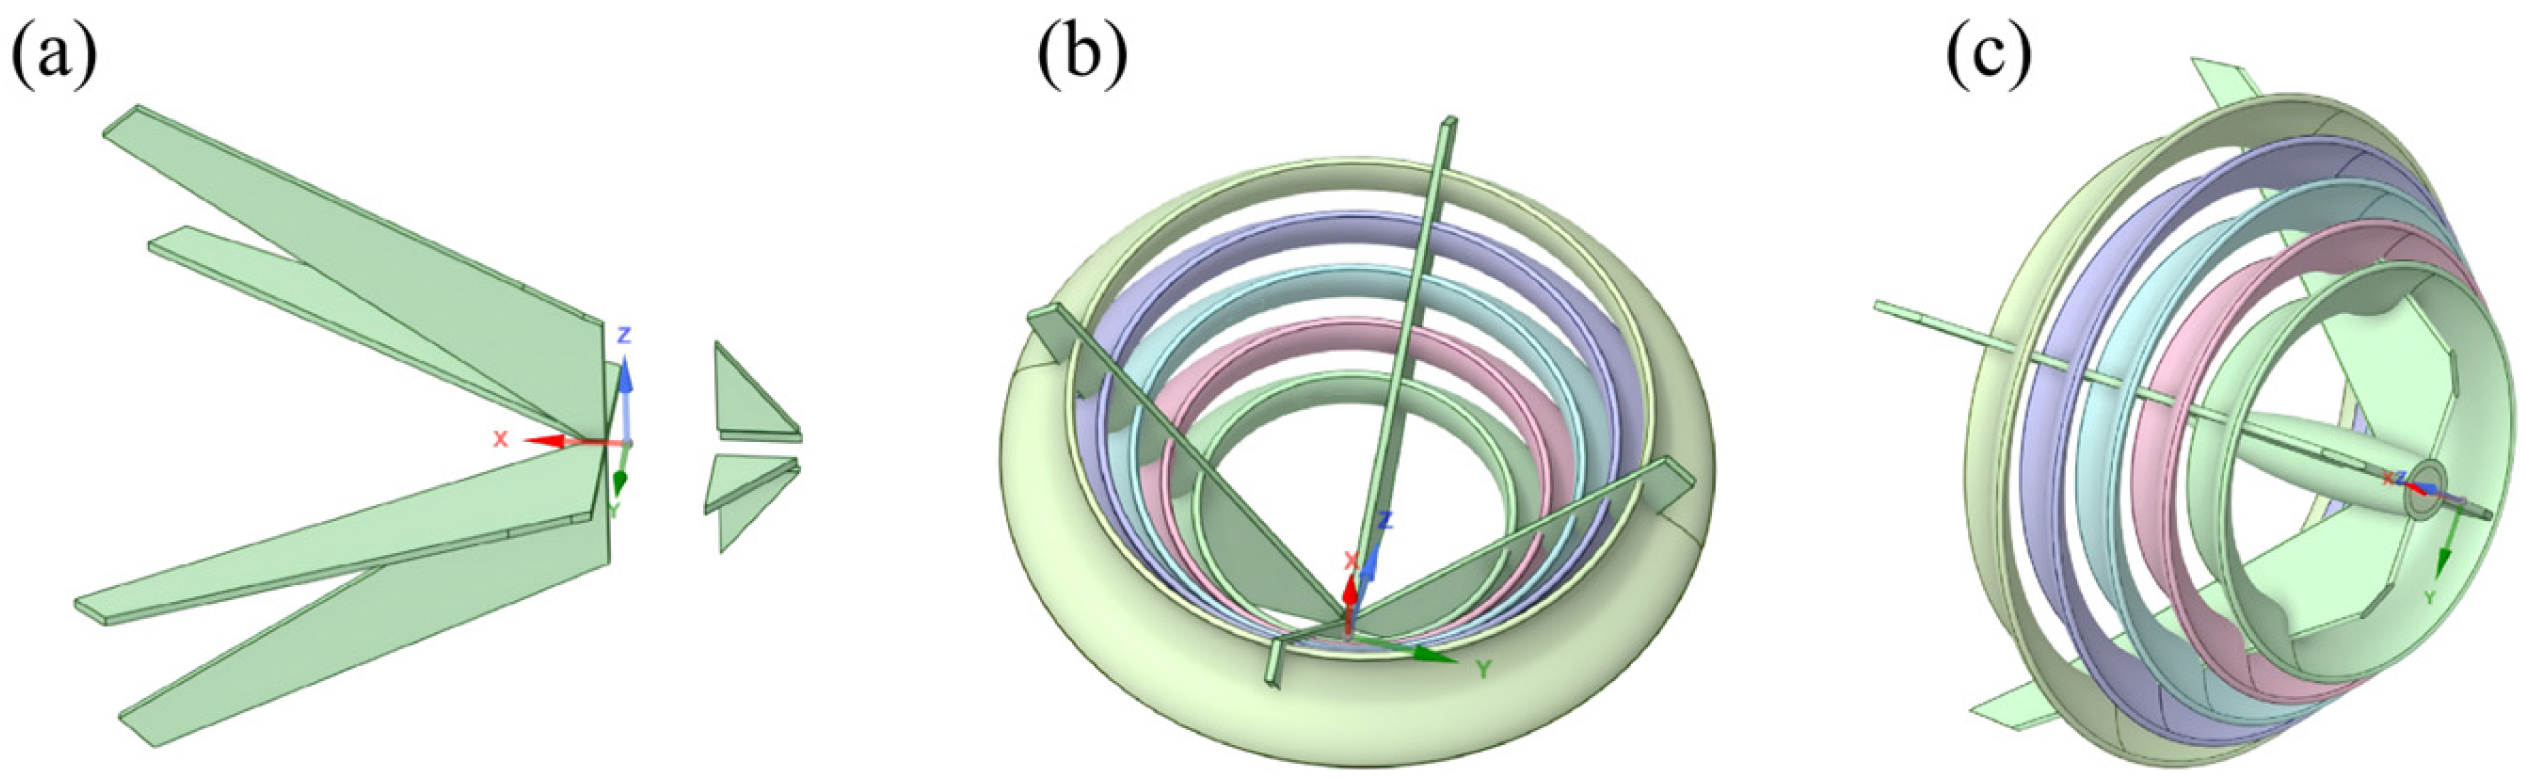
Due to the structural characteristics of the inner and outer channels and formation of the vortex at the inner channel outlet, this work obtains four structural configurations supported by diversion ribs (see Figure 7): no diversion ribs, two diversion ribs, three diversion ribs, and four diversion ribs. Figure 8 shows the shape and position of the diversion ribs. The objective of the study is to investigate the regulation of the diversion ribs on vortex distribution and intensity at the inner duct outlet, assess the effectiveness of the layout of the support structure to consequently weaken the intensity of tail vortices, and minimize hydraulic losses.

5.2. Flow Field Analysis

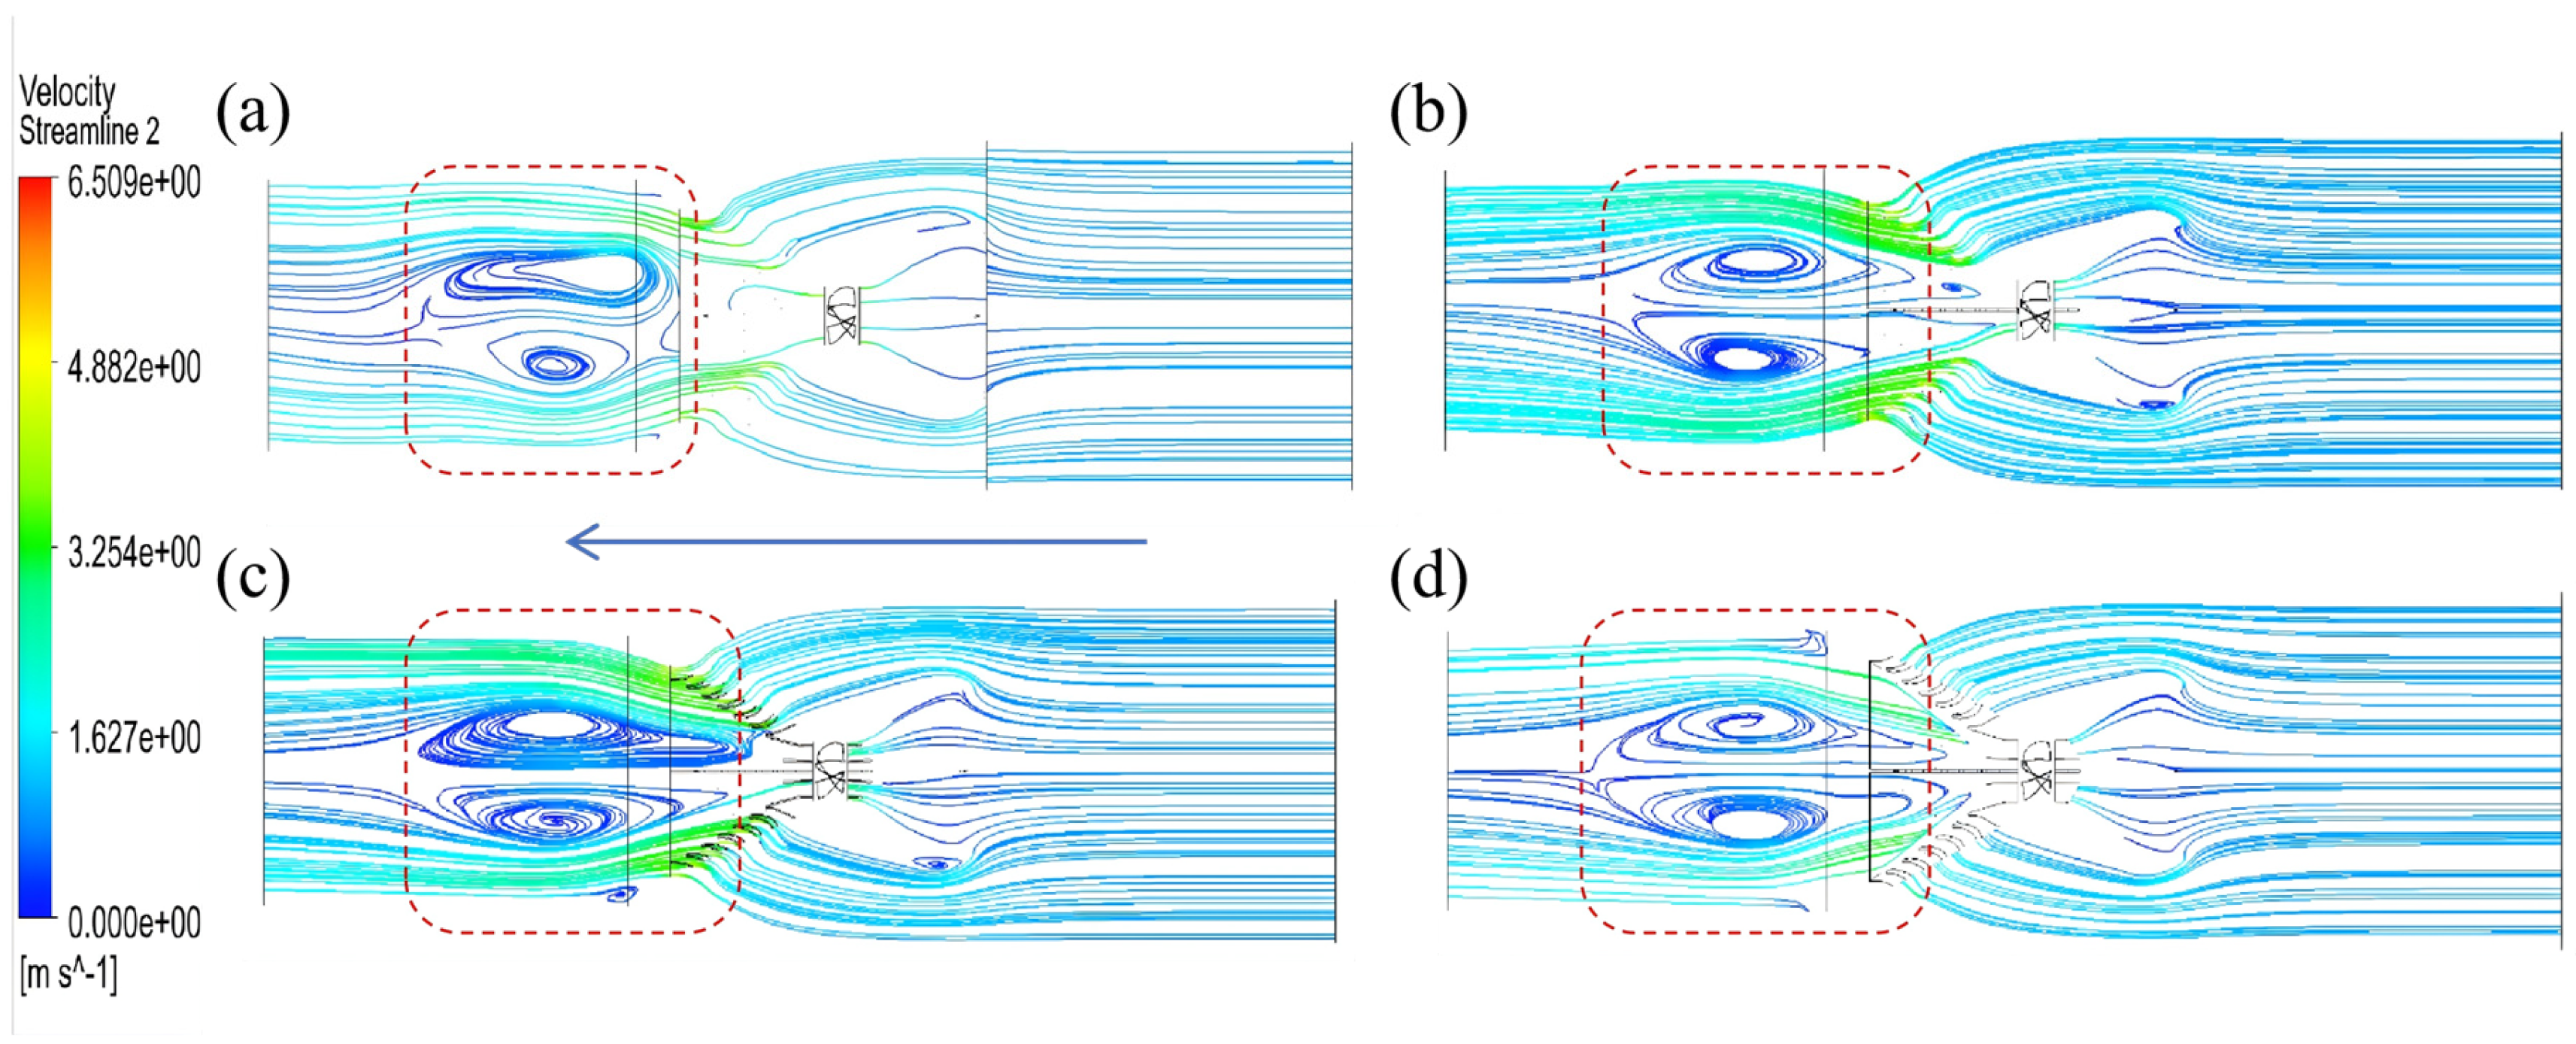
Since the flow channel and impeller domain take up a considerable part of the computational domain, spatial streamline analysis is prone to interference from these elements, making it difficult to clearly observe the influence of the runner blades on the flow pattern. Thus, flow state analysis is done using axial screenshots. In Figure 9, the axial distribution of streamlines with various design schemes has been shown. Based on streamline distribution characteristics, the formation of vortices can be observed between the impeller outlet and the outlet domain, which is highlighted by the red dashed box in Figure 9. A comparison of schemes has shown that diversion ribs affect the distributions of the cross-sectional streamlines greatly. Design 1 exhibits a disordered vortex structure; designs 2 and 3 show relatively constrained, flattened vortex distributions, while designs 2 and 4 demonstrate higher symmetry in vortex shape. These results indicate that the number and arrangement of diversion ribs significantly influence the vortex distribution in the outlet region.
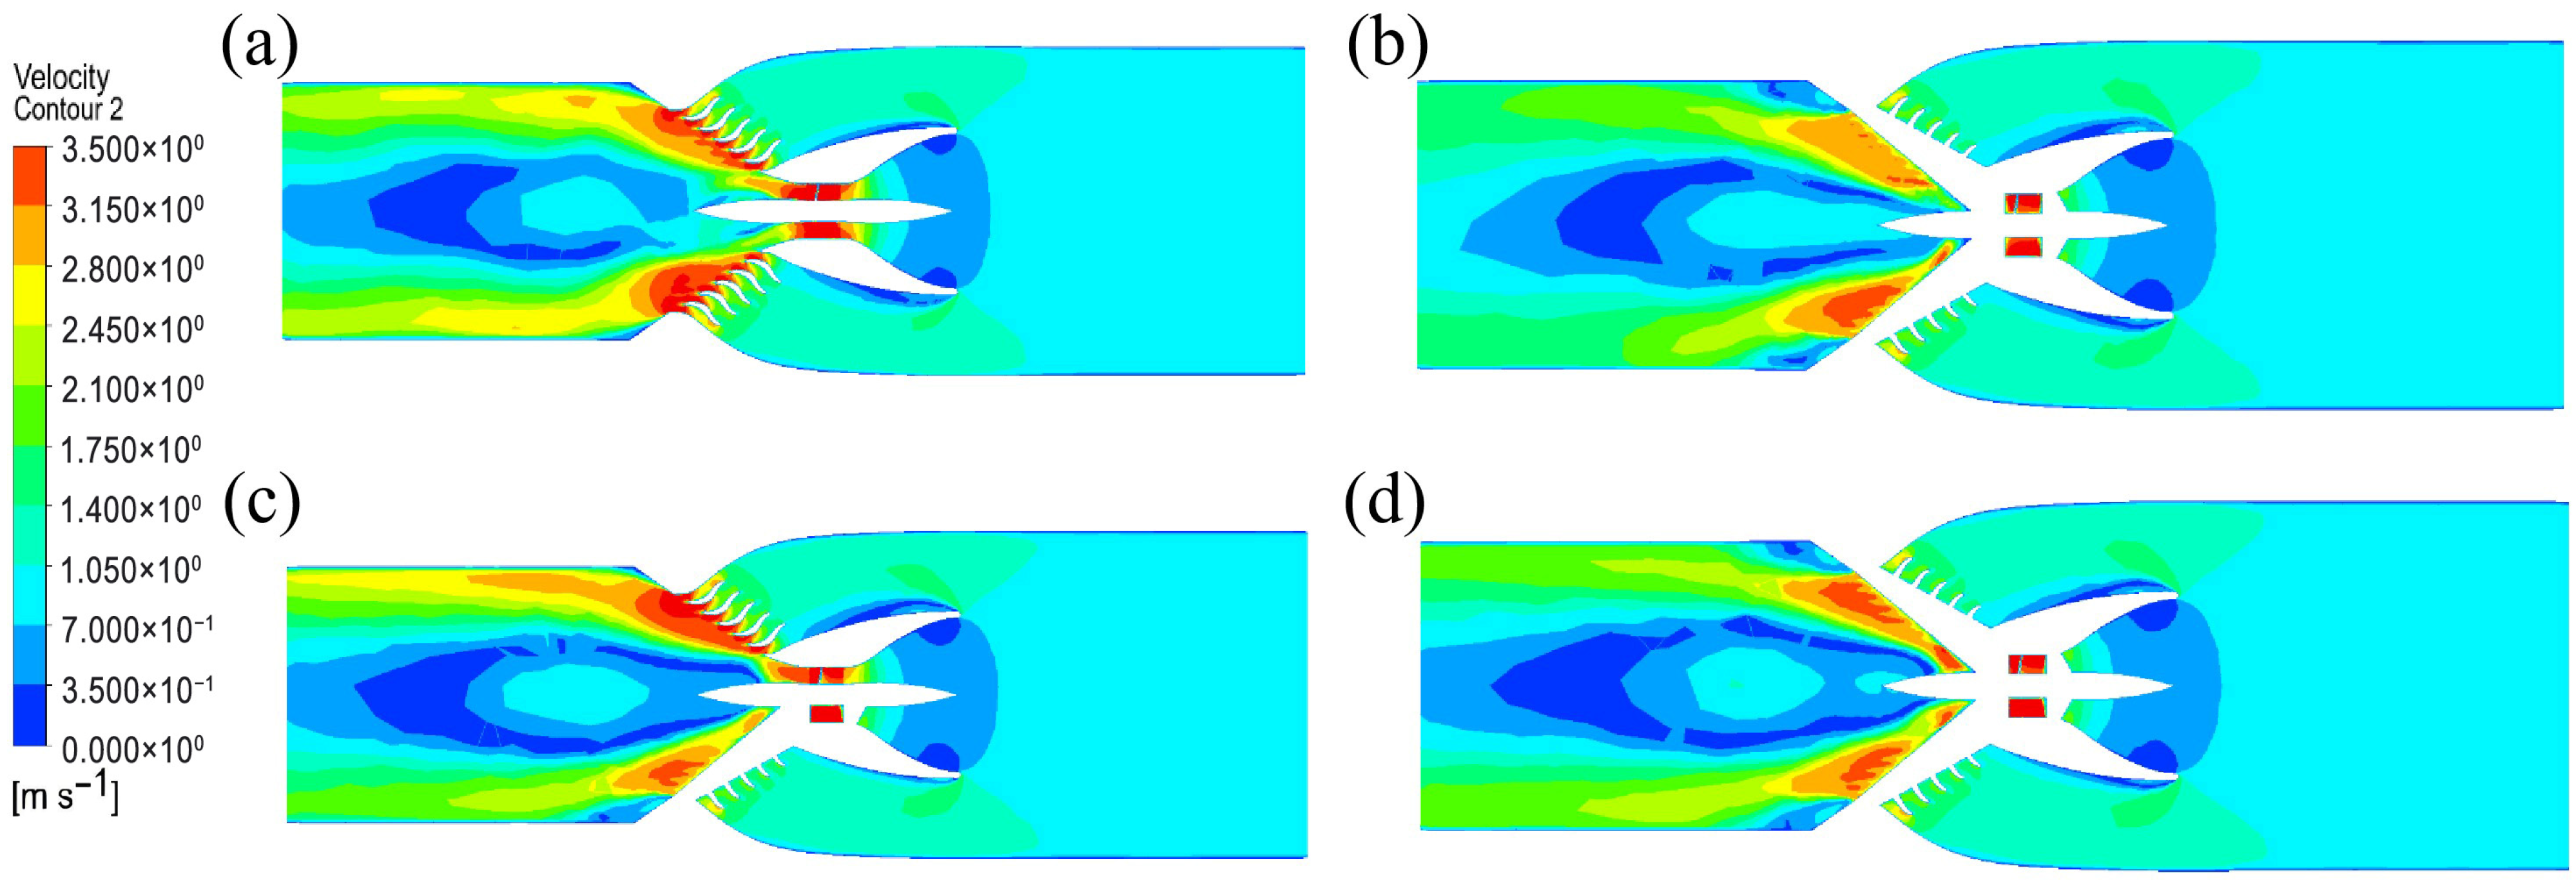
Figure 10 displays the velocity contour distributions across the shaft surface under different design schemes. The gaps between annular guide rings form multiple nozzle-like channels, generating high-velocity jets at their exit regions with speeds significantly higher than in other areas. In the impeller zone of the mid-section of the inner channel, the combined acceleration effect from the inner channel’s Venturi structure and the ejector effect of the outer channel is clearly observable. In the gradually expanding section of the inner channel, the velocity gradually decreases as the fluid domain widens. Figure 7 and Figure 8 reveal that the fluid leaving the inner duct will have tangential velocity components caused by the action of the circumferential velocity of the impeller in the duct, causing it to generate the vortex strip [24]. In particular, the circumferential velocity induces strong velocity shear in the gradually expanding channel, leading to flow instability and the formation of wake vortices. The vortex structure diagram reveals a distinct helical vortex band forming at the inner channel outlet, coinciding with the low-velocity zone in Figure 10. This confirms residual rotation as the dominant factor in tail vortex generation.
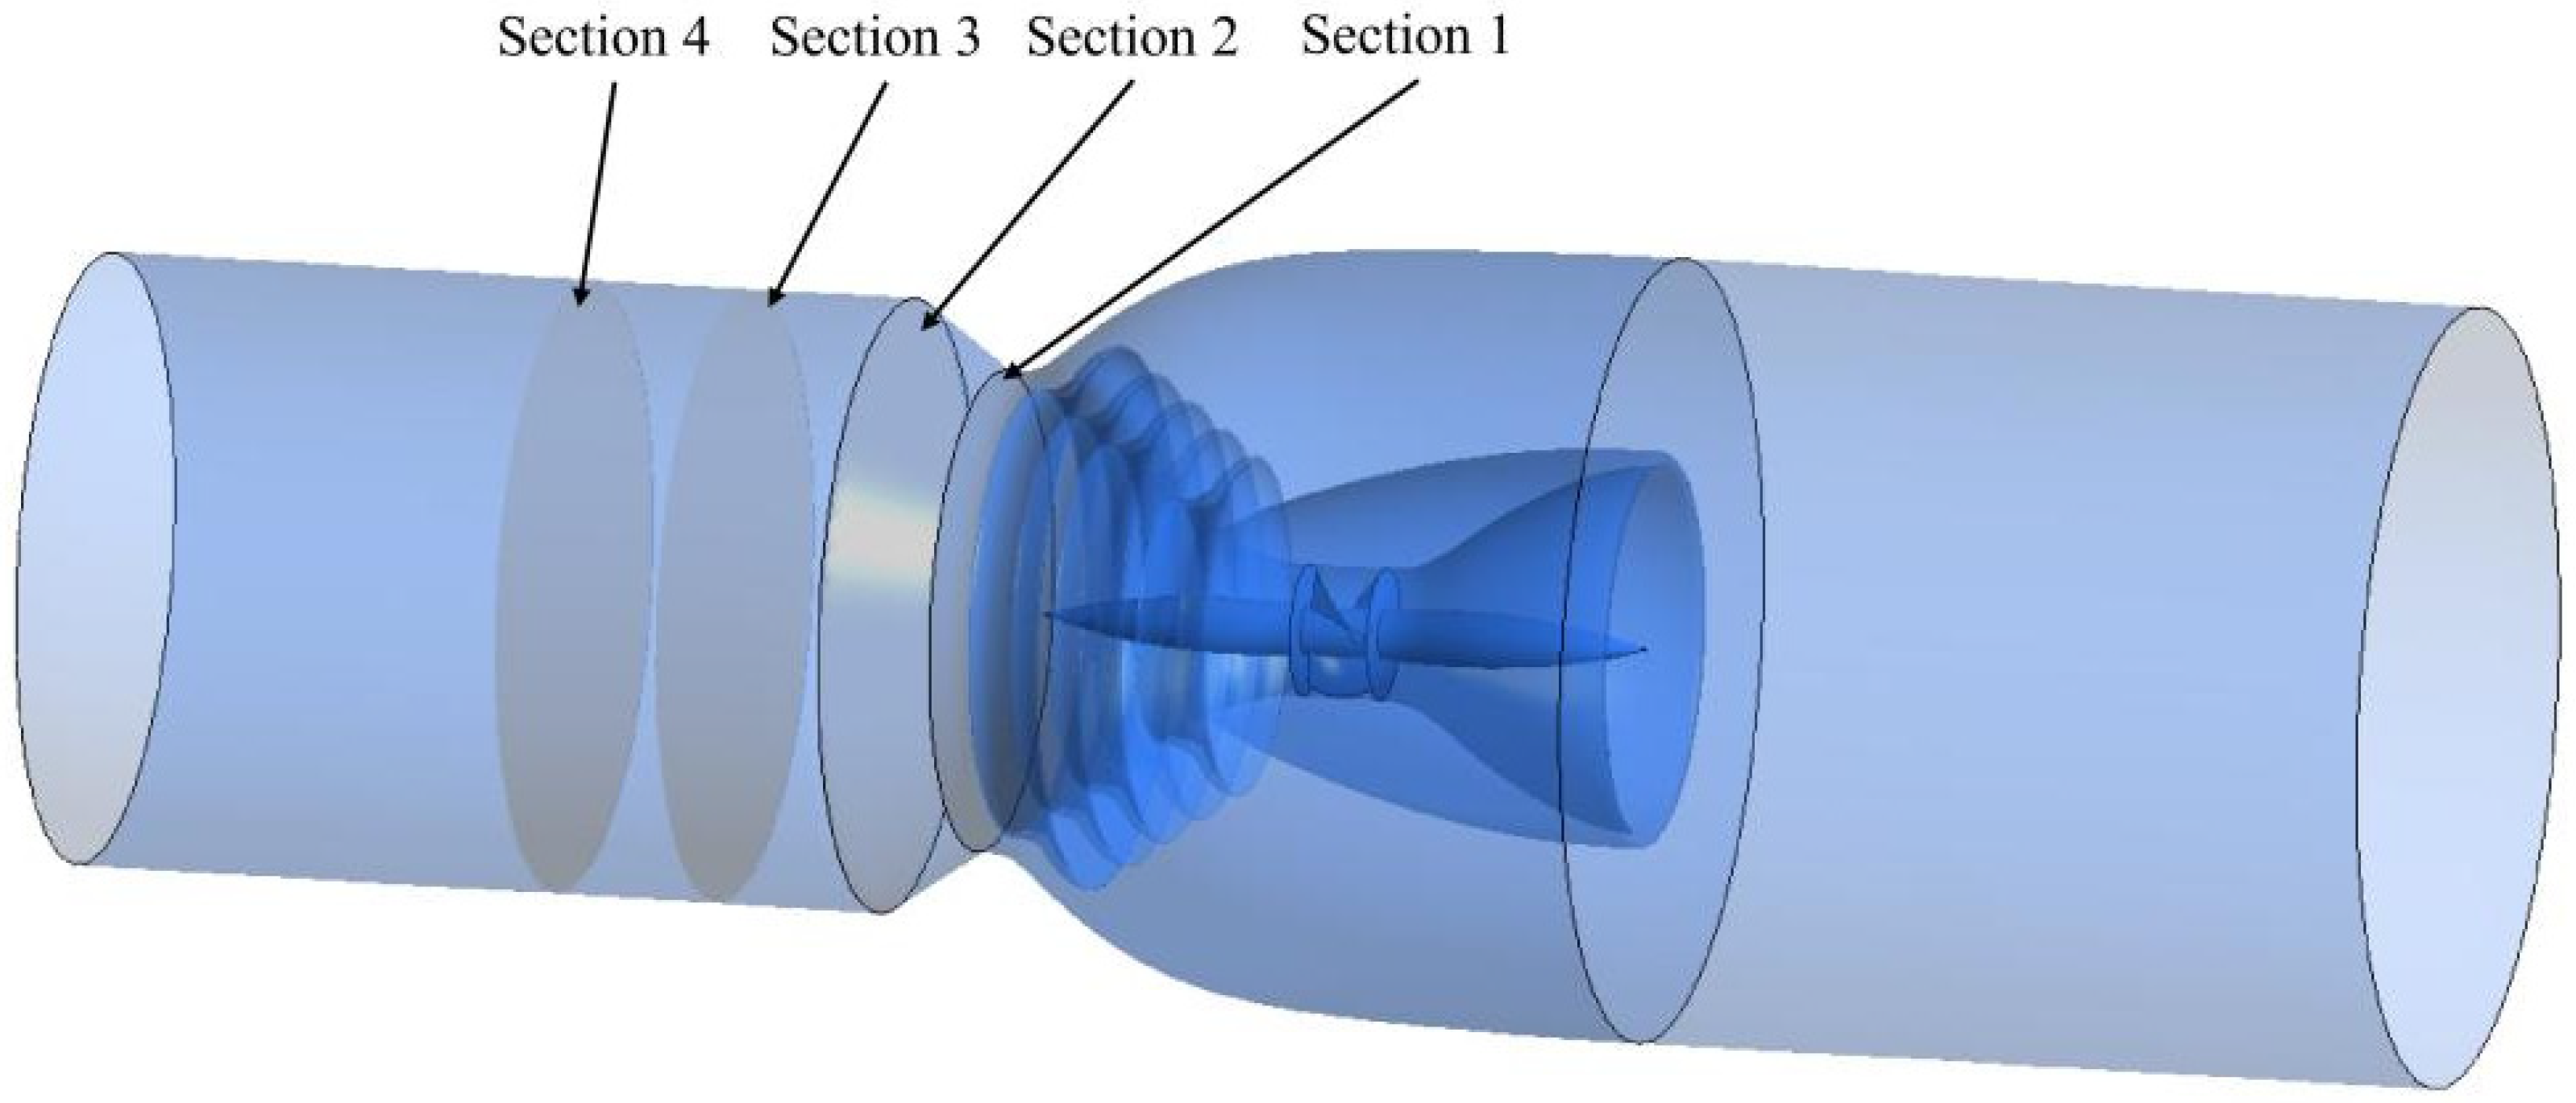
To more accurately investigate the velocity distribution in the wake region, different cross-sections were extracted from the fluid domain shown in Figure 11. Section 1 is the interface between the duct and the outlet domain. Section 2 is the junction between the gradually expanding section of the outlet domain and the straight pipe. Section 3 is located 1000 mm from Section 2, and Section 4 is located 1000 mm from Section 3.
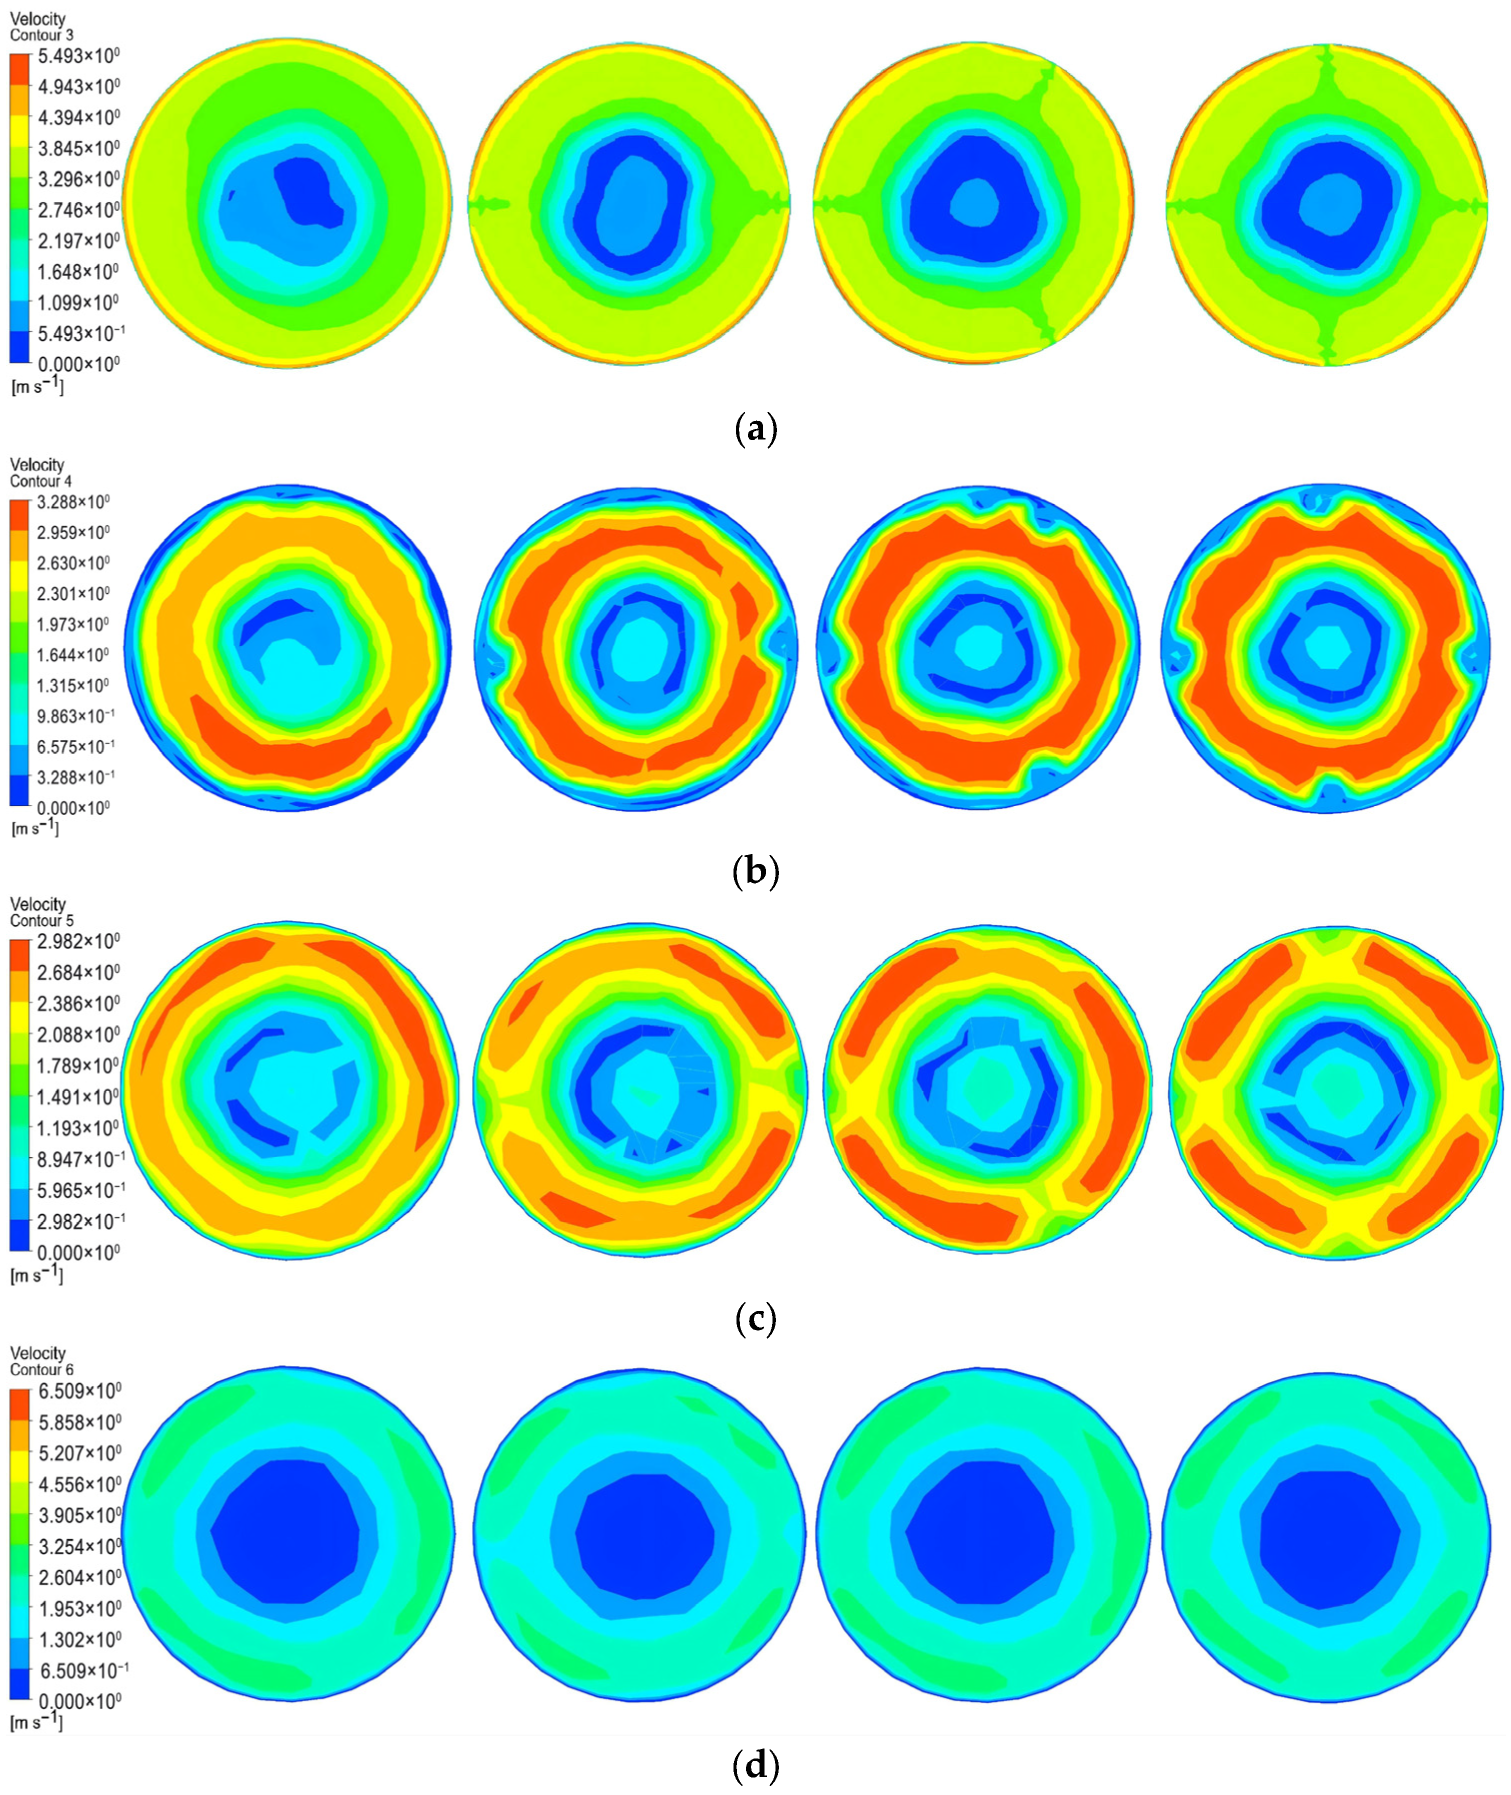
Figure 12 shows the velocity distributions across different cross-sections in the outlet domain for each design scheme, from left to right: Scheme 1 to Scheme 4. As shown in Figure 12, the velocity distributions across all schemes are generally uniform at Section 1. However, localized low-velocity zones exist near the central region. This occurs because the fluid, after performing work through the impeller in the inner channel, forms a low-velocity, turbulent region known as a wake. At the edges of the contour plots for Schemes 2 to 4, velocity gradient variations correlated with the number of diversion ribs are discernible. This feature is also present in Sections 2 and 3, with the most pronounced manifestation in Section 3. This is likely because Section 3 is located in the area with the largest trailing vortex coverage, where the influence of diversion ribs on the wake morphology is most directly observable. By Section 4, the velocity distributions for all schemes reached convergence. Considering the previously described axial velocity distribution characteristics, this section is situated in the downstream region where the trailing vortex has fully dissipated, resulting in no significant differences in the velocity contour plots. The results demonstrate that the number and layout of diversion ribs significantly regulate the generation, development, and dissipation of the wake vortex. A rational vane configuration can effectively suppress the vortex and improve the uniformity of the flow field in the outlet region.
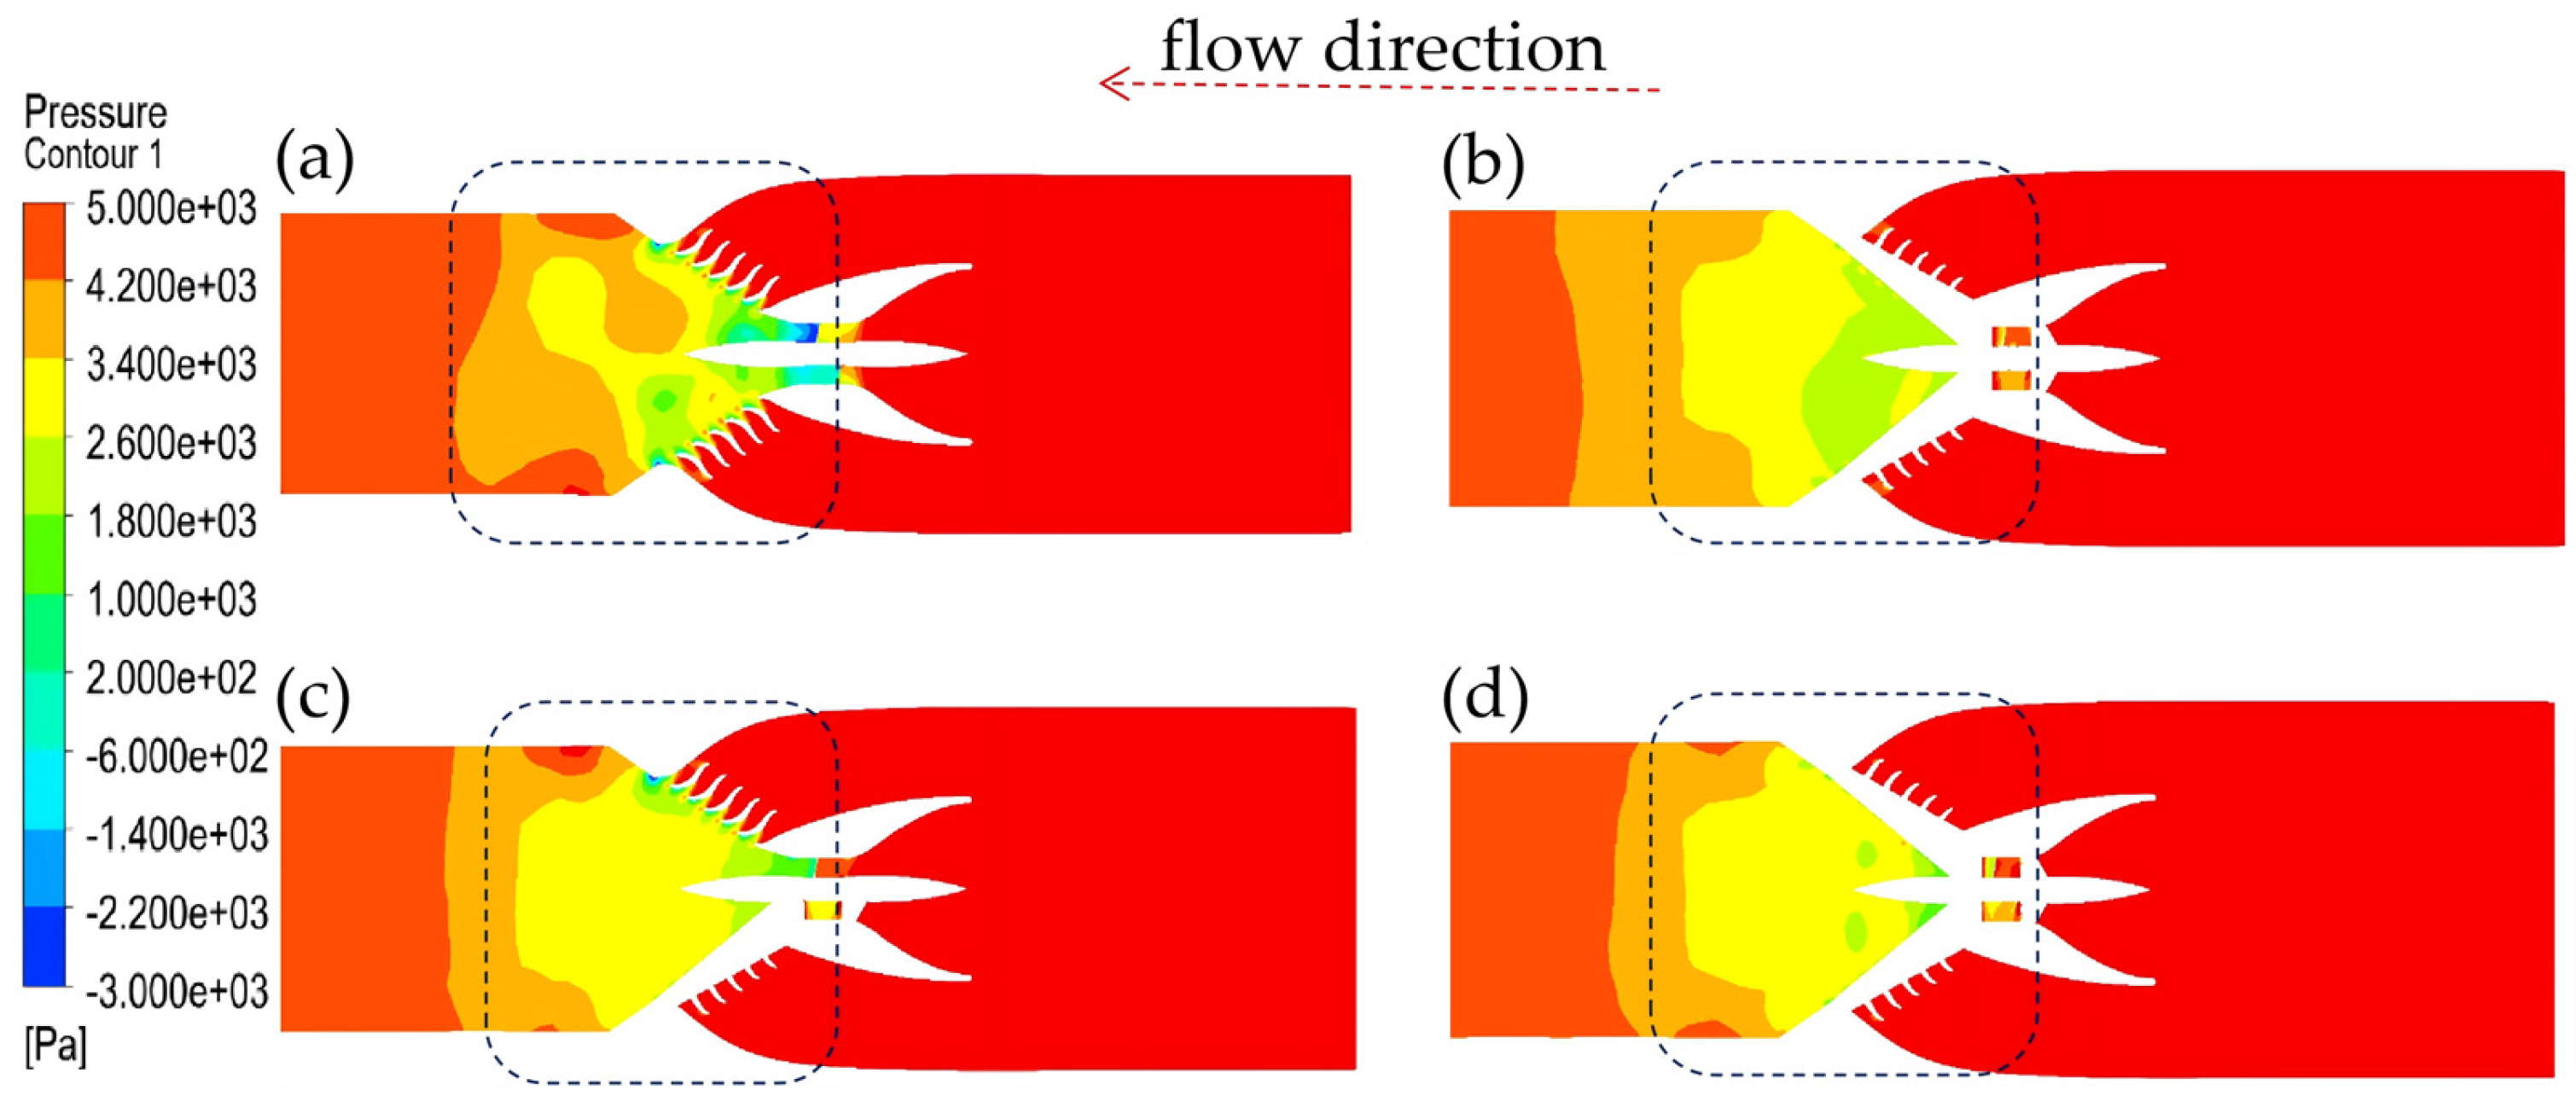
To further reveal the energy conversion mechanism and flow stability characteristics in the dual-duct hydraulic turbine, the axial pressure contour distributions of different diversion rib schemes are presented in Figure 13. Consistent with the law of conservation of energy, the pressure field and velocity field exhibit a complementary conversion relationship. As illustrated in Figure 13 (at the black dashed box), the significant pressure gradient variations are concentrated in two key regions: the diversion ring area and the region from the impeller outlet to the outlet domain, which is consistent with the velocity distribution characteristics observed in Figure 10. In the diversion ring region, the annular gaps form nozzle-like structures that induce a sharp pressure drop. This pressure reduction is attributed to the conversion of pressure energy into velocity energy, which generates high-speed jets as verified in the velocity contour (Figure 10). These jets enhance the ejector effect on the inner duct flow, promoting the acceleration of fluid in the Venturi structure of the inner duct and improving energy capture efficiency. In the region from the impeller outlet to the outlet domain, the pressure distribution exhibits obvious low-pressure zones that coincide with the low-velocity regions in Figure 10. This pressure difference is primarily caused by vortex formation and evolution. The residual circumferential velocity of the fluid exiting the impeller induces strong velocity shear in the gradually expanding channel, leading to flow instability and wake vortex generation. The vortex core region is characterized by low pressure due to the centrifugal effect of rotational flow, which further intensifies the pressure gradient and causes energy dissipation.
A comparative analysis of the four schemes in Figure 13 shows that the pressure distribution uniformity is significantly affected by the number and layout of diversion ribs. Scheme 1 (no diversion ribs) exhibits the largest low-pressure zone and the most severe pressure fluctuation, indicating intense vortex-induced energy loss. Schemes 2 (two diversion ribs) and 4 (four diversion ribs) show improved pressure distribution. In contrast, Scheme 3 (three diversion ribs) achieves the most uniform pressure distribution with the smallest low-pressure area. The asymmetric layout of three diversion ribs effectively disrupts the continuity of the vortex core and suppresses the expansion of low-pressure vortex regions.
Although the streamline analysis and velocity distribution based on axial and cross-sectional views can preliminarily reveal the two-dimensional morphological differences in vortices under different schemes, the vortex structure is inherently three-dimensional. Therefore, cross-sectional views alone are insufficient for comprehensively and quantitatively assessing its overall intensity and spatial extent. Therefore, to more scientifically compare the vortex suppression effects of each design, this study further employs the Ω criterion to identify and visualize the three-dimensional vortex structure throughout the entire flow domain.

5.3. Influence of Deflector Ribs on Vortex Belt Structure

Vortex identification was studied using the Ω criterion [25]. This is used to define the vortices as adjacent areas with vorticity greater than the deformation, which is its relative value. Its main characteristic is a normalized threshold to be set between 0 and 1; it does not rely on threshold tuning in the different operating conditions. This method is very effective in capturing strong and weak vortex structures simultaneously.
Ω = B F 2 A F 2 + B F 2
where A represents the symmetric vector, denoting fluid deformation; B represents the antisymmetric vector, denoting fluid rotation; and Ω denotes the proportion of rotational vorticity within the total vorticity.
In order to avoid the denominator being zero in case of total vorticity being zero, the initial equation is normalized by adding a small positive constant ε in the denominator. Using Q-criterion analysis, ε is usually indicated as 1/500 of the highest Q value [25,26]. In the event of Ω = 1, it means rigid-body rotation of the fluid. Any fixed threshold of Ω = 0.51 or 0.52 is frequently used in actual vortex structure detection. The modified formula is:
Ω = B F 2 A F 2 + B F 2 + ε
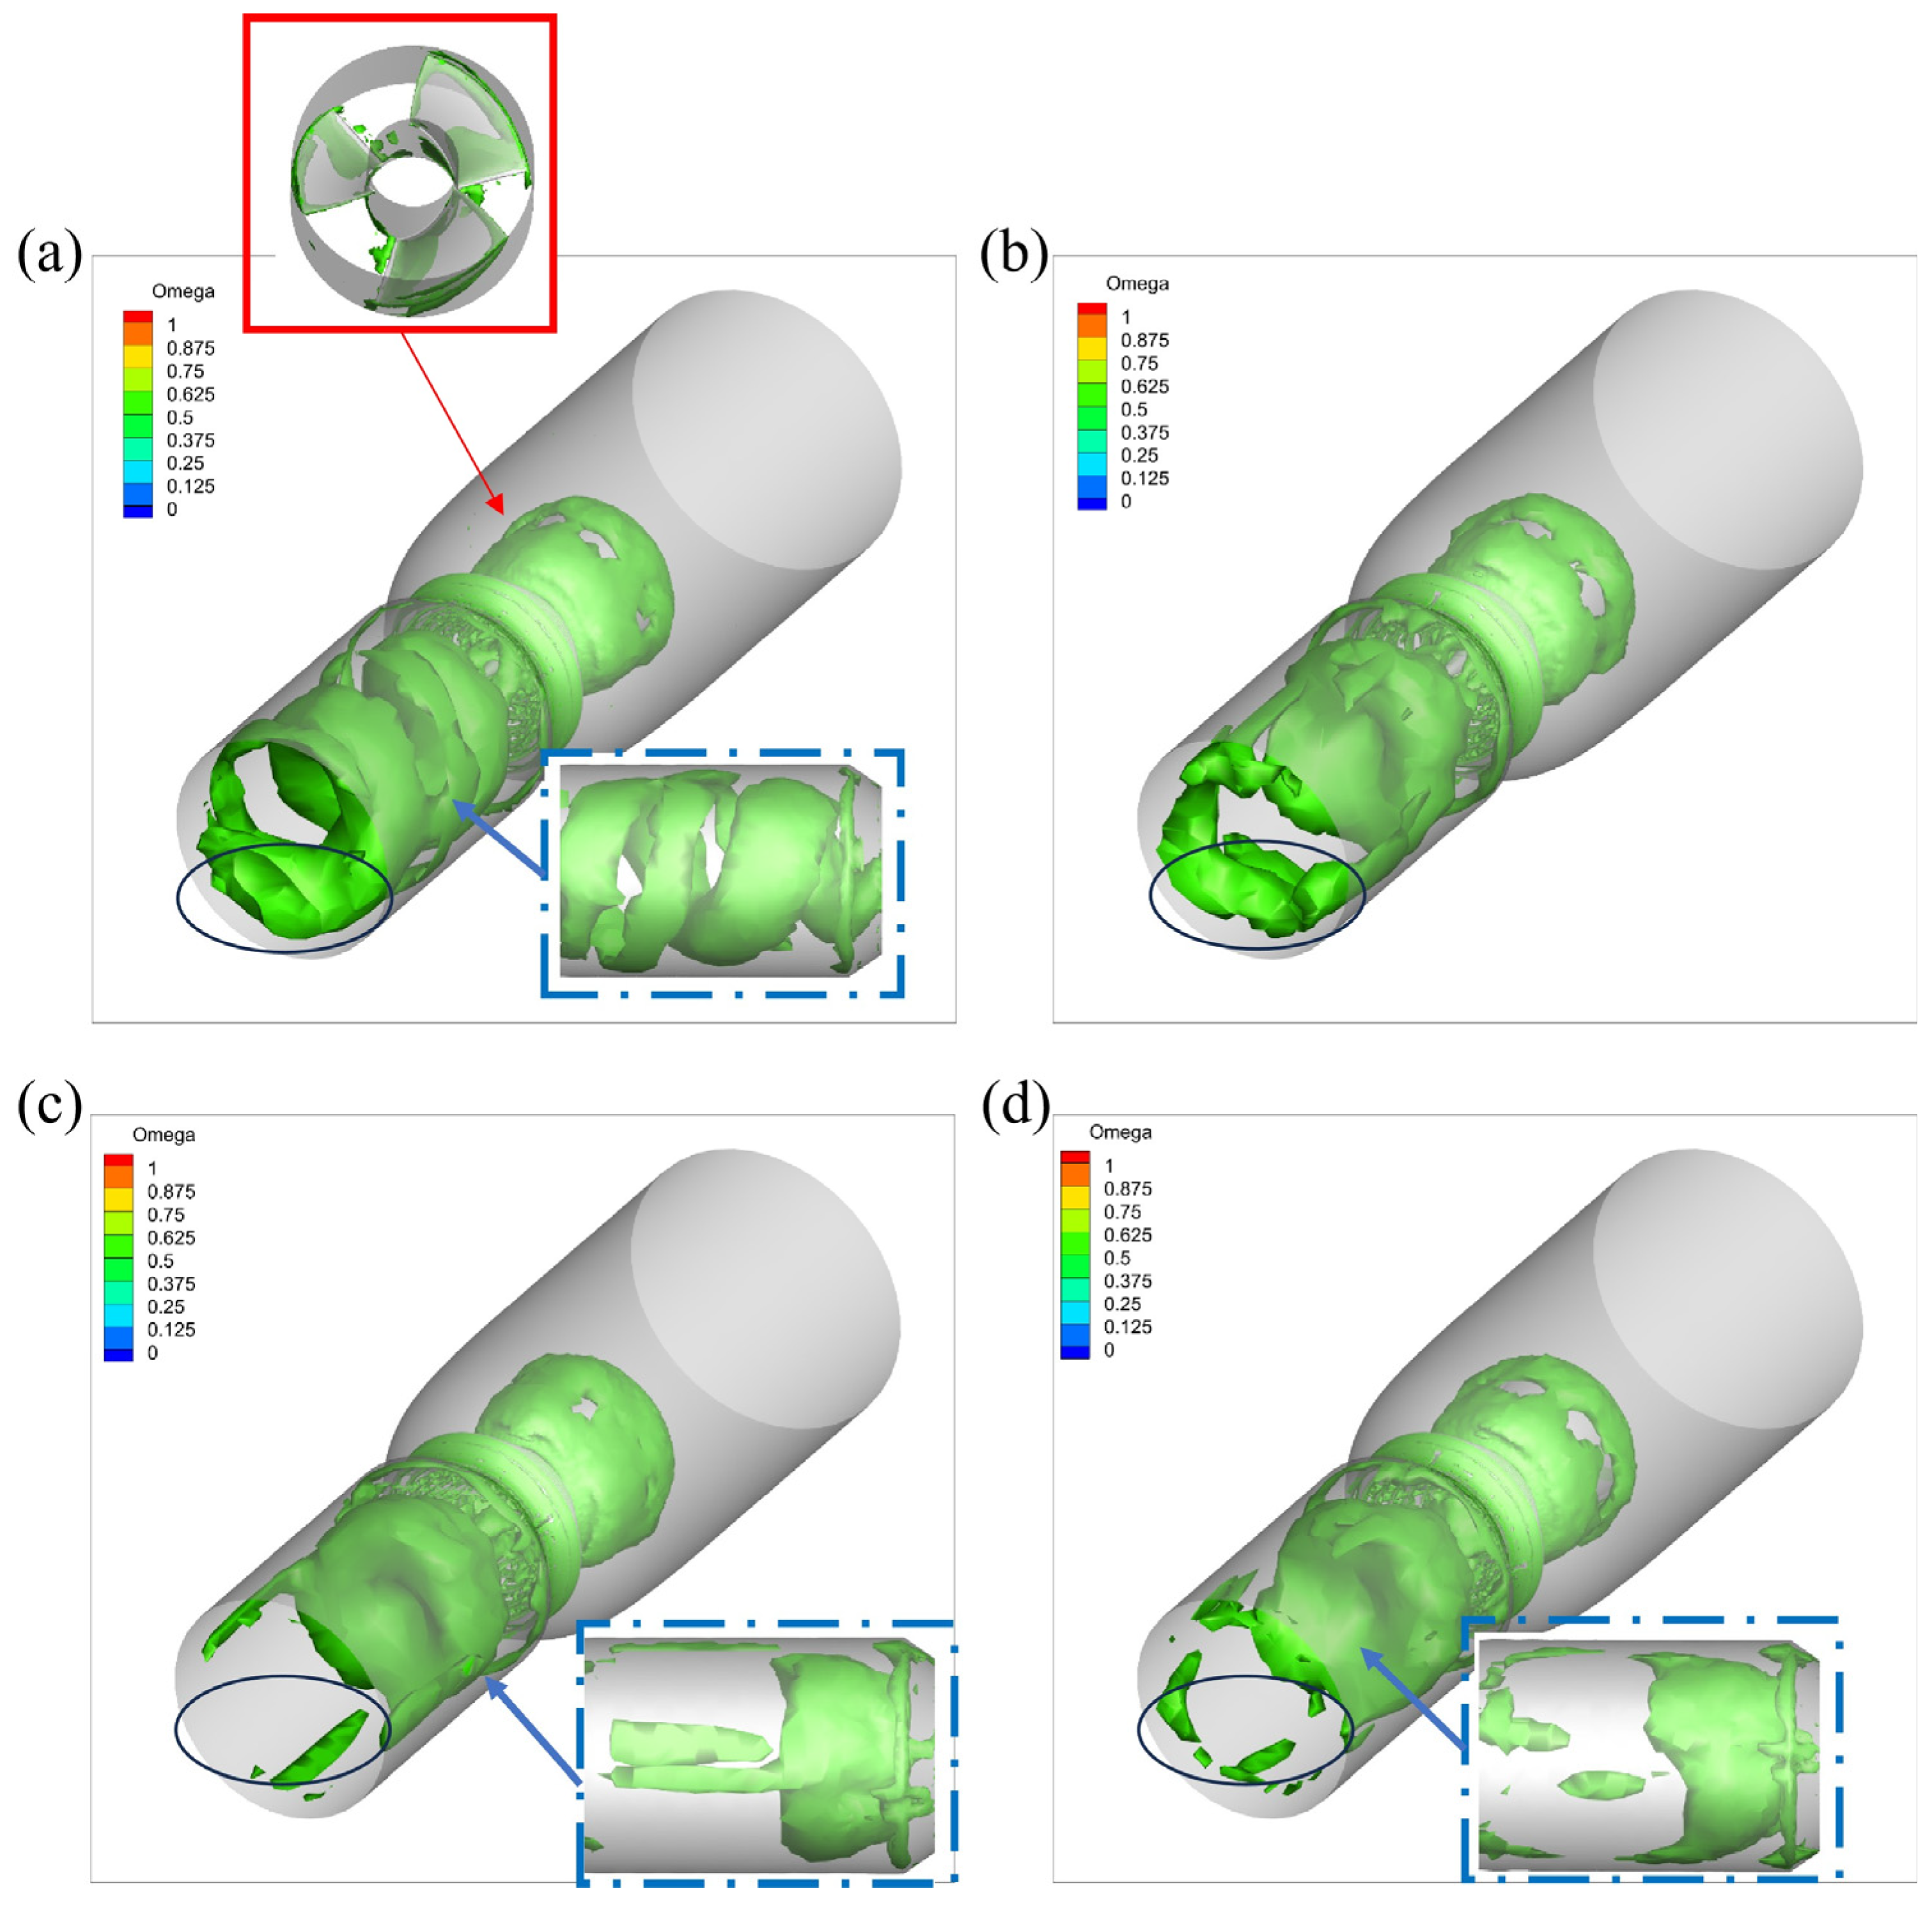
Figure 14 shows the distribution of vortex-structure isosurfaces in the system of various design schemes. At the threshold value of 0.52, the outlet channel has conspicuous vortex structures that can be detected in both the inner channel and in the neighborhood of the impeller. The gap vortices due to the gap between the impeller rim and the inner channel are the main cause of the creation of the vortices in the impeller region, and the gap vortices are created at every rotation of the impeller. As a result, vortices here are assembled in the gap zone (shown by the red box). The flow exiting the impeller causes a wake vortex through the rotational effect. The distribution pattern of this wake vortex in the outlet duct is rotating in nature and forms a band of vortex (as shown by the blue outline). It moves in the direction of the guide cone from the impeller towards the outlet section and grows along the wall. The acceleration effect of the guide ring on the fluid flow in the outer flow channel region makes the velocity gradient higher, resulting in the development of vortex structures near the guide ring.
According to the results mirrored distinctly in the region within the black outline in Figure 14, Schemes 3 and 4 are markedly better in terms of their vortex structure than Scheme 1. This has a significant decrease in the volume of vortices in this area after the diversion ribs fragmented it. The relative comparison between the blue-outlined areas also shows that Scheme 3 has the least vortex range and best performance. Although fragmented vortices appear in the outlet region of Scheme 4, the volume of the vortex band is significantly smaller than in Schemes 1 and 2. This indicates that using more diversion ribs is not always advantageous: excessive ribs increase flow resistance, while too few ribs cannot effectively break up the trailing vortex band. Symmetrical arrangements should be avoided in distribution. Since the wake vortex belt exhibits a helical distribution, symmetrical layouts (e.g., Design 4) can fragment the vortex belt but allow the fragmented vortex structure to continue rotating under the influence of the wake. In contrast, asymmetrical layouts (e.g., Design 3) more effectively disrupt the vortex belt structure, achieving superior vortex fragmentation and dissipation.
The performance outcomes of the four diversion rib schemes are quantitatively summarized in Table 6. Among them, Scheme 3 delivers the optimal overall performance, achieving the highest efficiency of 80.43% and the highest mechanical power output of 4.05 kW. It is noteworthy that while the pressure drop for Scheme 3 is marginally higher than that for the baseline case with no ribs (Scheme 1), it remains lower than that of the symmetric four-rib configuration (Scheme 4). This indicates that the three-rib asymmetric layout effectively manages flow resistance while significantly improving the flow structure. These quantitative results align directly with the vortex analysis presented earlier. The asymmetric arrangement of three ribs successfully disrupts the coherence of the vortex core, promotes the breakdown of the helical wake vortex, and thereby enhances the stability and uniformity of the outlet flow field. The resulting suppression of unsteady vortex structures reduces associated energy dissipation, which is the primary mechanism behind the observed gains in power and efficiency. The concurrent improvements in efficiency and power output, as evidenced in Table 6, are therefore regarded as synergistic benefits arising from a more stabilized and organized flow.

6. Conclusions

This study proposes a novel micro-head double-duct hydraulic turbine. Through a combination of orthogonal experiments and numerical simulations, the runner was optimized. Based on vortex identification and analysis, support plate-type diversion ribs were added at the duct outlet to optimize the tail vortex structure. The main conclusions are as follows:
(1)
The micro-head double-duct hydraulic turbine was optimized orthogonally, and there was an outstanding improvement in hydraulic performance. The best design is one with an inlet installation angle of 50°, three blades, and an axial length of 480 mm. After optimizing, the unit’s power output increased from 3.38 kW to 3.72 kW (10.06% increase), while efficiency improved from 63.38% to 75.05% (18.41% relative improvement).
(2)
The analysis of flow fields and vortices indicated that there was a strong trailing vortex at the inner duct outlet of the micro-head double-duct hydraulic turbine. The mechanism of its generation is mostly based on the strong velocity shear existing radially in the residual rotation at the flow exiting the runner that causes the instability in the flow and the formation of vortices. This trailing vortex evolves downstream as a helical vortex band, constituting the core cause of hydraulic losses and operational instability.
(3)
Vortex structure identification based on the Ω criterion further reveals that the evolution of the wake vortex is governed by vortex core stability and spatial development modes. Installing three diversion ribs at the outlet of the double-duct guide hood effectively disrupts vortex core continuity, promotes vortex fragmentation and energy dissipation, thereby enhancing flow stability and unit operational reliability.
Subsequent research will be conducted on this basis to arrange multiple micro-head double-duct hydraulic turbines in an array and to verify and calibrate numerical simulation results through physical model experiments, providing strong support for the reliable design and performance prediction of micro-head double-duct hydraulic turbines.

Author Contributions

Methodology, X.Z. and Z.L.; Software, X.Z.; Validation, X.Z. and B.Y.; Analysis, X.Z.; Investigation, B.Y. and S.Z.; Resources, Z.L. and Z.Y.; Data curation, X.Z.; Visualization, X.Z. and Z.Y.; Supervision, Z.L.; Project administration, Z.L., Z.Y. and S.Z.; Funding acquisition, S.Z.; Writing—original draft, X.Z.; Writing—review & editing, S.Z. All authors have read and agreed to the published version of the manuscript.

Funding

This research was supported by the National Natural Science Foundation of China (approval No.: 52079011), the Natural Science Foundation of Hunan Province, China (2024JJ39176), and the Hunan Graduate Research Innovation Project, China (LXBZZ2024216).

Data Availability Statement

The original contributions presented in this study are included in the article. Further inquiries can be directed to the corresponding author.

Acknowledgments

The authors acknowledged the Changsha University of Science and Technology for its support and provision of computational resources.

Conflicts of Interest

The authors declare no conflicts of interest.

References

  1. Zhang, Y.; Yang, Z.; Lu, J.; Wu, Z.; Tang, W. Status of clean energy project innovation. J. Hydroelectr. Eng. 2025, 44, 13–23. [Google Scholar]
  2. Ham, S.; Adeeb, E.; Lee, J.W.; Ha, H. Numerical evaluation of low-head inverted cross-flow turbine design method: A comprehensive study. Energy Convers. Manag. 2024, 311, 118521. [Google Scholar] [CrossRef] [Scilit]
  3. Pang, J.; Liu, X.; Song, H.; Deng, H.; Yang, H.; Peng, Y.; Yang, J. Research on the stability of mixed flow turbine in ultra low output region based on water photovoltaic storage complementary combined power generation system. Hydroelectr. Pumped Storage 2021, 75, 39–46. [Google Scholar]
  4. Williamson, S.; Stark, B.; Booker, J. Low head pico hydro turbine selection using a multi-criteria analysis. Renew. Energy 2014, 61, 43–50. [Google Scholar] [CrossRef] [Scilit]
  5. Assefa, E.Y.; Tesfay, A.H. Effect of Blade Number on Internal Flow and Performance Characteristics in Low-Head Cross-Flow Turbines. Energies 2025, 18, 318. [Google Scholar] [CrossRef] [Scilit]
  6. Jia, L.; Zeng, Y.; Liu, X.; Huang, W.; Xiao, W. Testing and Numerical Analysis of Abnormal Pressure Pulsations in Francis Turbines. Energies 2024, 17, 237. [Google Scholar] [CrossRef] [Scilit]
  7. Monsalve-Cifuentes, O.D.; Vélez-García, S.; Sanín-Villa, D.; Revuelta-Acosta, J.D. Fluid-Structure Numerical Study of an In-Pipe Axial Turbine with Circular Blades. Energies 2024, 17, 3539. [Google Scholar] [CrossRef] [Scilit]
  8. Zheng, Y.; Li, L.; Chen, H.; Li, D.; Li, C. Influence of hub ratio on hydraulic performance and structural strength of bulb tubular turbine. J. Hydraul. Eng. 2018, 49, 1303–1311. [Google Scholar]
  9. Sun, J.; Cai, J.; Ge, X.; Zhang, H.; Han, Y.; Wang, J.; Zhang, L.; Wu, E.; Zheng, Y. Performance optimization of bulb tubular turbine with two blades based on multi-objective orthogonal test. Proc. CSEE 2022, 42, 3317–3327. [Google Scholar]
  10. Li, L.; Zheng, Y.; Chen, Y.; Zhou, D. The influence of bulb preposed or postposed on hydraulic efficiency of micro-head bulb turbine. Adv. Sci. Technol. Water Resour. 2015, 35, 62–66. [Google Scholar]
  11. Picone, C.; Sinagra, M.; Gurnari, L.; Tucciarelli, T.; Filianoti, P. A new cross-flow type turbine for ultra-low head in streams and channels. Water 2023, 15, 973. [Google Scholar] [CrossRef] [Scilit]
  12. Tan, J.; Lang, X.; Yuan, P.; Si, X.; Du, X. Performance analysis of diffuser for small tidal current turbines under low flow velocity. Period. Ocean Univ. China 2025, 55, 87–95. [Google Scholar]
  13. Wang, B.; Yu, Y.; Niu, X. A parametric analysis of the performance of a horizontal axis tidal current turbine for improving flow-converging effect. Ocean Eng. 2024, 291, 116481. [Google Scholar] [CrossRef] [Scilit]
  14. Zou, S.; Yu, F.; Zhou, X.; Xiao, Q.; Liu, Z. Research on hydraulic performance of arrayed micro-head hydraulic turbine. Yangtze River 2025, 56, 168–173. [Google Scholar]
  15. Gao, Q.; Ren, Y.; Zhang, Y.; Yan, H. Research on the hydrodynamic performance of micro head water flow energy turbine. Acta Energiae Solaris Sin. 2022, 43, 419–426. [Google Scholar]
  16. Wang, W.; Yu, Z.; Yan, Y.; Wei, X. Numerical investigation on vortex characteristics in a low-head Francis turbine operating of adjustable-speed at part load conditions. Energy 2024, 302, 131800. [Google Scholar] [CrossRef] [Scilit]
  17. Yan, Q.; Xiong, Z.; Zheng, Y.; Feng, C.; Li, Z.; Hu, L.; Xu, L. Computational fluid dynamics analysis of draft tube flow characteristics in a Kaplan turbine. Actuators 2025, 14, 298. [Google Scholar] [CrossRef] [Scilit]
  18. Masoodi, F.; Goyal, R. Aspects of vortex breakdown phenomenon in hydraulic turbines. Exp. Therm. Fluid Sci. 2024, 150, 111051. [Google Scholar] [CrossRef] [Scilit]
  19. Li, C.; Luo, X.; Wu, G.; Fu, Y.; Feng, J.; Zhu, G. Investigation on effect of anti-cavitation edge on performance and leakage vortex characteristics of tubular turbine for ocean power generation. Ocean Eng. 2023, 281, 114797. [Google Scholar] [CrossRef] [Scilit]
  20. Li, Q.; Tang, H.; Mou, X.; Li, Z.; She, M. Transient flow characteristics in turbine mode of pump turbine with different guide vanes opening under off-design conditions. Trans. Chin. Soc. Agric. Mach. 2025, 56, 422–433+486. [Google Scholar]
  21. Liu, Y.; Zhe, H.; Tan, J.; Si, X.; Yuan, P.; Wang, H. Study on influence of vortex generator on flow separation characteristics of tidal turbine blades. Acta Energiae Solaris Sin. 2022, 43, 358–363. [Google Scholar]
  22. Delgado-Currín, R.R.; Calderón-Muñoz, W.R.; Elicer-Cortés, J.C.; Hunter-Alarcón, R. Effect of Electrical Load and Operating Conditions on the Hydraulic Performance of a 10 kW Pelton Turbine Micro Hydropower Plant. Energies 2025, 18, 4413. [Google Scholar] [CrossRef] [Scilit]
  23. Lv, S.; Wu, F.; Wang, H.; Ge, H. Analysis and experimental research on interaction effect of influencing factors of turbine blade cooling effectiveness. J. Propuls. Technol. 2022, 43, 278–289. [Google Scholar]
  24. Yu, F.; Ran, Q.; Zhou, M.; Pan, H.; Liu, Y.; Wu, W. Analysis of flow field inside Francis turbine based on cavitation erosion of movable guide vanes. J. Drain. Irrig. Mach. Eng. 2025, 43, 990–997. [Google Scholar]
  25. Liu, C.; Wang, Y.; Yang, Y.; Duan, Z. New omega vortex identification method. Sci. China-Phys. Mech. Astron. 2016, 59, 684711. [Google Scholar] [CrossRef] [Scilit]
  26. Jin, Y.; Tian, Z.; Zeng, H. Vortex characteristics of rod bundles with different vortex identification methods. J. Harbin Eng. Univ. 2022, 43, 1736–1742. [Google Scholar]
Figure 1. Three-dimensional model of micro-head dual-duct hydraulic turbine.
Energies 19 00968 g001
Figure 2. 1/2 section of the dual-duct diffuser: (1) water-guiding cone; (2) inner duct diffuser; (3) guide ring; (4) outer duct diffuser.
Energies 19 00968 g002
Figure 3. Convergence history of the scaled residuals.
Energies 19 00968 g003
Figure 4. Grid division of the hydraulic turbine.
Energies 19 00968 g004
Figure 5. Contour of the wall y+ on the runner blades.
Energies 19 00968 g005
Figure 6. Fluid computing domain: no-slip boundary conditions are applied to all solid walls.
Energies 19 00968 g006
Figure 7. Layout of diversion ribs: (a) sectional view, flow direction indicated by the blue arrow, (b) two diversion ribs, (c) three diversion ribs, and (d) four diversion ribs.
Energies 19 00968 g007
Figure 8. Schematic diagram of the shape and position of the diversion ribs (four diversion ribs): (a) shape of diversion ribs; (b,c) position of the diversion ribs on the guide ring.
Energies 19 00968 g008
Figure 9. Distribution of streamlines in different schemes: (a) scheme 1, (b) scheme 2, (c) scheme 3, and (d) scheme 4. The arrow indicates the direction of flow.
Energies 19 00968 g009
Figure 10. Speed cloud maps of different schemes: (a) scheme 1, (b) scheme 2, (c) scheme 3, and (d) scheme 4.
Energies 19 00968 g010
Figure 11. Schematic diagram of section selection.
Energies 19 00968 g011
Figure 12. Velocity cloud map of each section: (a) Section 1, (b) Section 2, (c) Section 3, and (d) Section 4.
Energies 19 00968 g012
Figure 13. Axial pressure cloud maps for different schemes: (a) scheme 1, (b) scheme 2, (c) scheme 3, and (d) scheme 4.
Energies 19 00968 g013
Figure 14. Equivalent surface distribution of vortex band structure: (a) scheme 1, (b) scheme 2, (c) scheme 3, and (d) scheme 4.
Energies 19 00968 g014
Table 1. Basic parameters of the micro-head dual-duct hydraulic turbine.
Basic ParametersNumerical Value
Hydraulic turbine rotational speed/(r/min)80
Impeller diameter/mm800
Blade inlet installation angle/°40
Number of blades4
Axial length/mm400
Hub ratio0.375
Water head/mm350
Total length of the fairing/mm4716
Outer duct inlet diameter of the diffuser/mm4732
Inlet diameter of the duct within the diffuser/mm2222
Table 2. Grid independence verification.
PlanNumber of GridsWater Head/mmHead Error/%
16,320,456319.82.05
28,520,120326.54.75
310,634,582342.82.11
412,658,154350.20.74
514,818,204352.8-----
Table 3. Orthogonal test scheme.
Test PlanBlade Inlet Placement Angle/°Number of BladesAxial Length/mm
ABC
1303320
2304400
3305480
4403400
5404480
6405320
7503480
8504320
9505400
Table 4. Orthogonal experimental calculation results.
PlanOutput/kWEfficiency/%Axial Force/NRadial Force/N Δ p /Pa Q /(m3/s)
12.6964.421797.9015.423280.491.27
23.4571.482054.068.813525.941.37
33.6871.132061.8810.203549.491.46
43.3272.211827.3724.653191.851.44
52.7472.272474.6040.283070.541.24
63.1471.822258.5916.873840.711.14
73.7275.051840.7814.063150.481.57
83.2372.572205.9213.153732.221.19
93.3172.662059.8818.863552.321.28
Table 5. Range analysis of various indicators.
ParametersOutput/kWEfficiency/%Axial Force/NRadial Force/N
ABCABCABCABC
K13.2733.2433.02069.0170.5669.6019711822208811.4818.0415.15
K23.0673.1403.36072.1072.1172.1221872245198027.2720.7517.44
K33.4203.3773.38073.4371.8772.8220362127212615.3615.3121.51
Range R0.3530.2370.3604.4201.5503.220215.6422.8107.115.795.4406.360
K3 > K1 >
K2
K3 > K1 >
K2
K3 > K2 >
K1
K3 > K2 >
K1
K2 > K3 > K1K3 > K2 >
K1
K2 > K3 >
K1
K2 > K3 >
K1
K3 > K1 >
K2
K2 > K3 >
K1
K2 > K1 > K3K3 > K2 >
K1
Table 6. Optimization results of the diversion rib scheme.
SchemeNumber of RibsEfficiency/%Mechanical Power/kW Δ p /Pa
1075.053.723150.48
2276.543.873215.20
3380.434.053170.35
4478.223.983228.90
Disclaimer/Publisher’s Note: The statements, opinions and data contained in all publications are solely those of the individual author(s) and contributor(s) and not of MDPI and/or the editor(s). MDPI and/or the editor(s) disclaim responsibility for any injury to people or property resulting from any ideas, methods, instructions or products referred to in the content.