Article

Modeling of Methane Pyrolysis in a Bubble Column Reactor Operating in Different Flow Regimes


1
Wintershall Dea AG, 34119 Kassel, Germany
2
Institute of Energy Process Engineering and Fuel Technology, Clausthal University of Technology, 38678 Clausthal-Zellerfeld, Germany
*
Author to whom correspondence should be addressed.
Energies 2026, 19(4), 884; https://doi.org/10.3390/en19040884
Submission received: 21 November 2025 / Revised: 9 January 2026 / Accepted: 14 January 2026 / Published: 8 February 2026
(This article belongs to the Section A5: Hydrogen Energy)

Abstract

Methane pyrolysis in molten metal bubble column reactors (MMBCR) is a promising technology for hydrogen production with minimal CO2 emissions. This study presents a numerical model, which is computationally easy to handle, for early industrial analysis and scalability, focusing on both homogeneous and heterogeneous flow regimes. The one-dimensional model integrates thermodynamics, hydrodynamics, heat transfer, and reaction kinetics and is validated against experimental data at varying temperatures and flow rates. Simulation results indicate that the commonly assumed homogeneous flow regime in laboratory experiments may not always apply, particularly at higher temperatures and flow rates. Transitions into the heterogeneous regime were observed more frequently than expected, challenging the existing models that often neglect these conditions. Furthermore, it was found that Kassel’s kinetic model is suitable for temperatures up to 1095 °C (±5 °C), while Napier’s kinetic model provides better accuracy at higher temperatures. A detailed analysis of the key parameters was conducted to assess their influence on conversion rates. Sensitivity analysis revealed that reaction rates and gas holdup significantly affect conversions, whereas bubble diameter and heat transfer coefficients had minor effects. Thus, this study provides new insights into methane pyrolysis in MMBCRs, particularly under both homogenous and heterogeneous flow conditions.

1. Introduction

Methane pyrolysis is a promising technology for hydrogen production from natural gas without significant CO2 emissions. During this process, the hydrocarbons in the natural gas are decomposed into hydrogen and solid carbon by means of electric energy. The electric energy heats up the natural gas to a very high temperature, by which the hydrocarbons are cracked.
C H 4 C + 2 H 2     ( h 0 = 74.85   k J   m o l 1 )          Global   Methane   Pyrolysis   Reaction
Methane pyrolysis has several advantages compared to other hydrogen production technologies. It does not require a CO2 capture and storage infrastructure, since no additional CO2 is produced by this technology in comparison to steam methane reforming to achieve a very low carbon footprint of the hydrogen production process. In comparison to hydrogen production via electrolysis, methane pyrolysis requires only approximately 25% of the energy needed for hydrogen production, making it a cost-effective solution for localized, medium-scale hydrogen production [1].
However, methane pyrolysis technology is still subject to extensive research and development efforts. Different reactor concepts for this process are currently under development, each with their own advantages and drawbacks. One of the most crucial aspects for commercial success is the ability to scale up this technology. In this context, bubble column reactors provide excellent heat transfer characteristics and a homogeneous temperature distribution. Additionally, unlike plasma-based reactors, bubble column reactors offer a high potential for operation under elevated pressure [2], making them promising candidates for scale-up. Typical liquids used in bubble column reactors for methane pyrolysis are molten metals and molten salts. Some of these materials catalyze the hydrocarbon decomposition.
The technical information that is currently available for methane pyrolysis in the bubble column reactor is based on laboratory size test rigs [3,4,5,6,7,8,9,10,11,12]. Although the data provided by these researchers give valuable insights into the fundamentals of methane pyrolysis in molten metal bubble columns, this information alone is not sufficient to scale up this technology to a semi-commercial size. The data available in the literature are typically limited to low-pressure operations and homogenous or transition flow regimes within the bubble column. The operation at elevated pressure and with a high throughput, which may cause heterogenous flow, are of particular interest for a commercial operation of the reactor. Both aspects lead to a compact design of the equipment, relative to the amount of hydrogen produced by the reactor. Accordingly, a validated model which exceeds the limitations of the currently available experimental data and theoretical results is required for a reliable scale-up of the reactor. To address this, a model is developed and employed for a theoretical investigation of the operational behavior of a molten metal bubble column reactor for methane pyrolysis. The model focuses on operating conditions that are relevant for industrial application of this technology and the identification of an optimal operating point. A fundamental approach for modeling methane pyrolysis within bubble column reactors is explained hereafter.
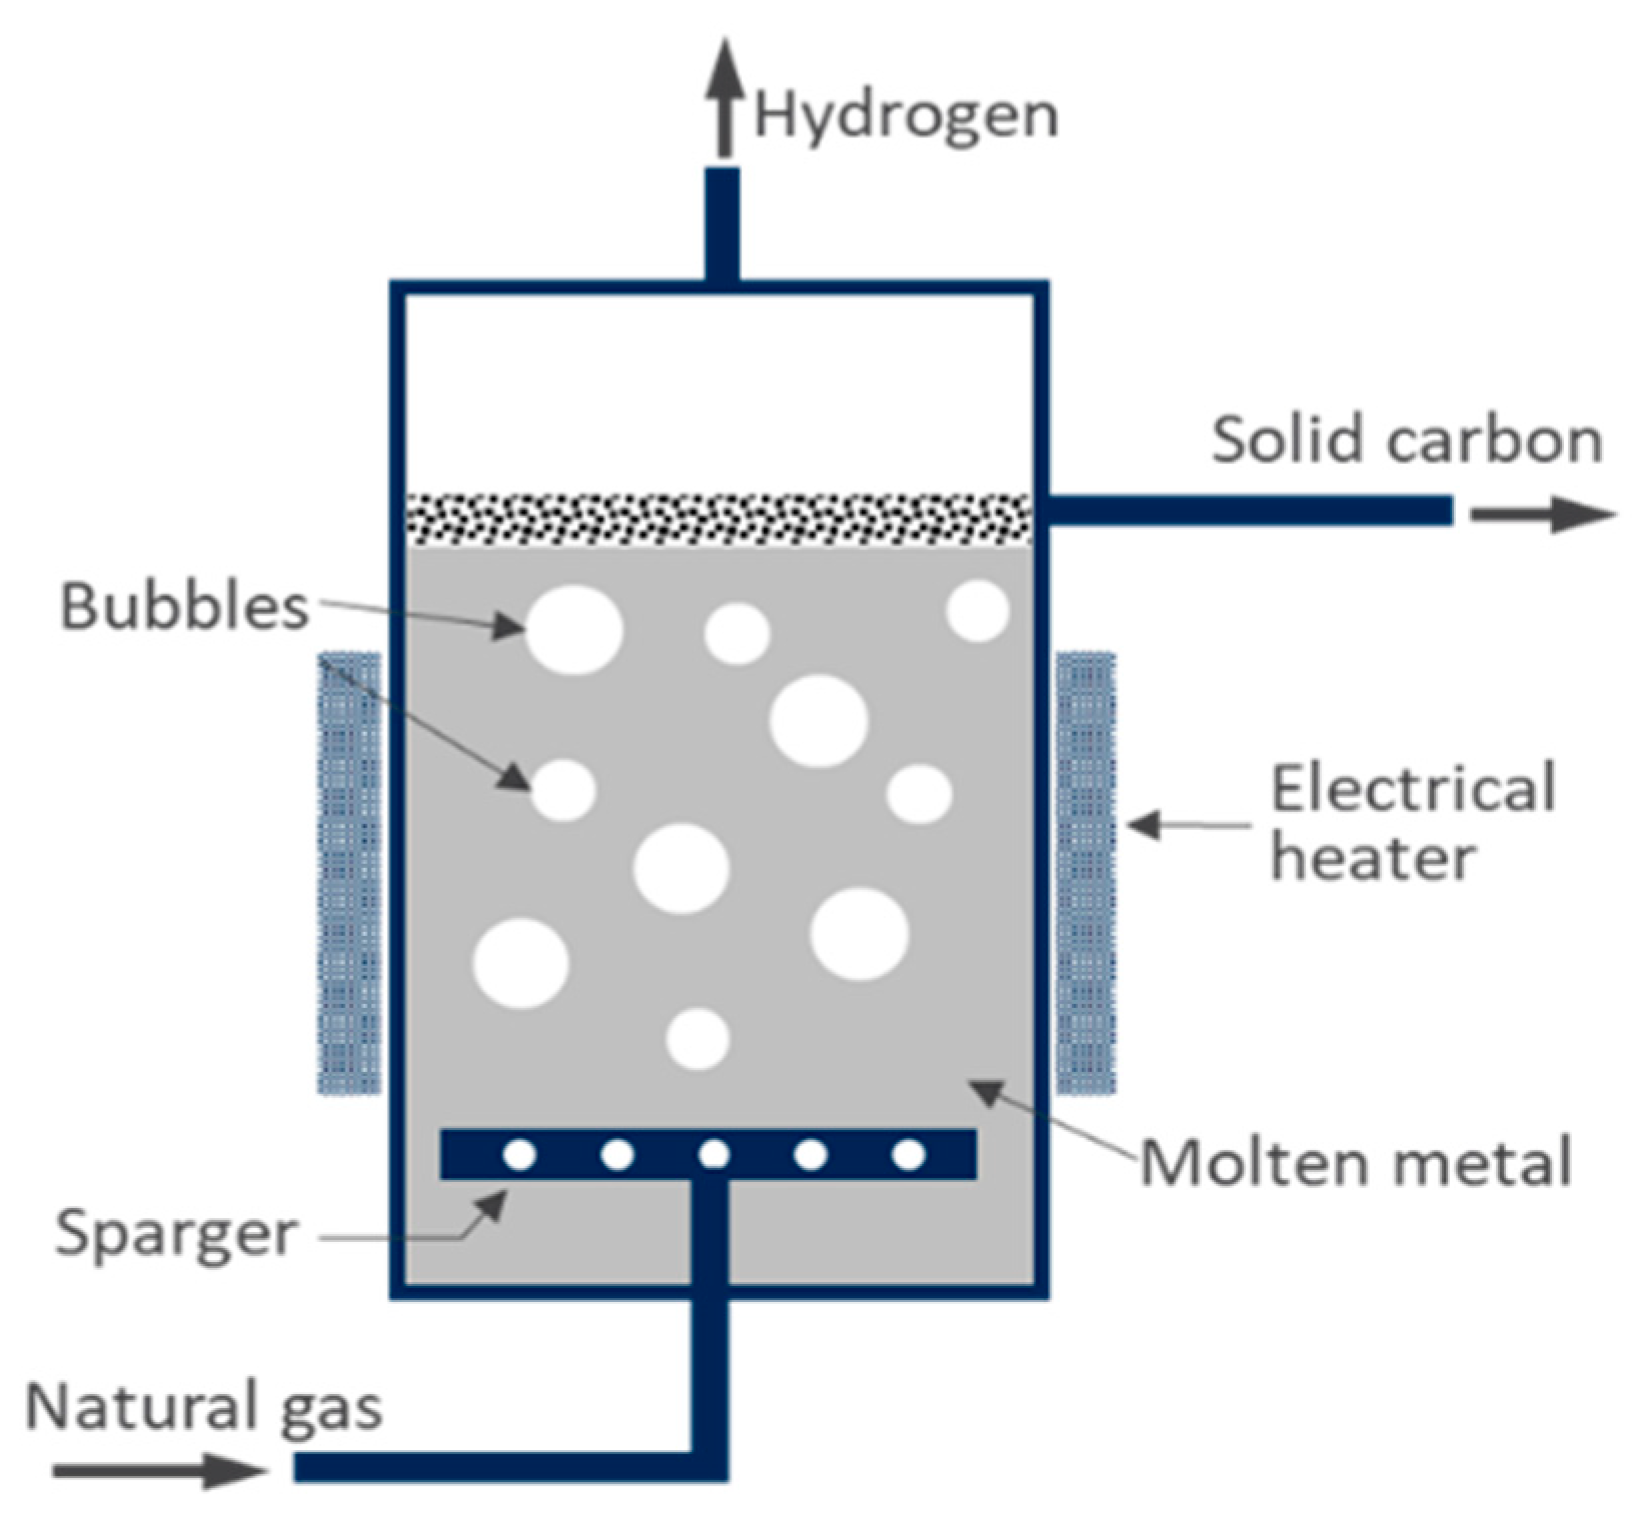
The general setup of the bubble column reactor is shown in Figure 1. It consists of a vessel which is filled with molten metal. In this particular case, the molten metal is tin. The molten metal in the bubble column is heated by an external heater. Natural gas is fed into the bubble column from the bottom through a sparger. The gas bubbles formed at the sparger rise upward due to buoyancy. Heat is transferred from the molten metal to the gas bubbles as they move towards the surface. The hydrocarbons in the gas bubbles are decomposed into hydrogen and solid carbon at high temperatures. Other hydrocarbon such as ethane, ethylene, and acetylene are also co-products of the pyrolysis reaction and are split into hydrogen and solid carbon in subsequent reaction steps. The bubbles burst at the surface of the molten metal. Consequently, the solid carbon is collected at the top of the molten metal bath and is continuously discharged. The gas flows further upwards in the gas section above the liquid bath to the outlet of the reactor.
A one-dimensional model was developed to numerically describe the processes in the bubble column reactor, capturing variations along its height. In this model, reaction rates and equilibrium limitations, as well as hydrodynamics and heat transfer are considered by individual sub-models, which are explained more in detail hereafter. Mass transfer between the gas phase and liquid is not considered, since the liquid will become promptly saturated with gas after the start-up of the reactor [13,14]. Qiao et al. [13] demonstrated that, in molten Sn bubble column systems, methane decomposes within the gas bubbles, resulting in the direct assembly of carbon species on the bubble surface. This occurs without dissolution into the molten metal, since carbon is highly insoluble in tin. Nemanič et al. [14] measured the hydrogen uptake in solid and liquid Sn and found it to be at or below ~1 ppb H/Sn at 1 bar. This result indicates that tin is highly inert toward hydrogen. Unlike hydrogen, which dissolves only after dissociation into atomic hydrogen in metals, methane remains molecular, is larger, and is nonpolar. Therefore, methane is expected to be even less soluble than hydrogen in molten tin. Since the molten tin bath is not replaced during operation, any dissolved gas inventory remains at its very small equilibrium value after start-up. Therefore, chemical reactions are only considered in the gas phase. Pure methane is used in this work, instead of natural gas, since the experimental data used for validating this model were also obtained with pure methane as feedstock. The thermo-physical properties of pure methane and hydrogen used in this work are calculated according to the VDI Heat Atlas [15]. The properties of its mixtures are calculated with the mixing rules of Wilke [16] and Wassiljeva, Mason and Saxena [17]. The thermal conductivity of liquid tin is interpolated from experimental data published by Giordanengo et al. [18]. The remaining thermo-physical properties for liquid tin are calculated according to Gancarz et al. [19].
A few other modeling approaches to simulate the processes in a molten metal bubble column reactor for methane pyrolysis have already been published in the literature [6,20,21,22]. Earlier efforts to simulate catalytic molten metal bubble column reactors (MMBCRs) have relied on basic estimations regarding bubble dimensions. For instance, Upham et al. [10] presumed a uniform bubble diameter of 1 cm within the molten substance. Meanwhile, Farmer et al. [22] posited that bubbles were initiated at 1.5 cm in diameter at the base of the melt, with their size changing during ascent due to factors such as decreasing hydrostatic pressure, the stoichiometry of methane decomposition, and hydrogen diffusion across the gas–molten metal interface. Compared to the aforementioned models, the one presented here differs, among other things, in a significantly reduced number of assumptions and estimated physical quantities. At the same time, the complexity of the model presented here has been intentionally kept as low as possible to facilitate its industrial use, on the one hand, and to make it easier to adapt the model to the data of future experimental investigations with just a few parameters, on the other. Simple yet physically consistent assumptions and equations, which are based on a mechanistic understanding of the hydrodynamic processes in the reactor, have been employed in the model to enhance our understanding of the key parameters within the process and to facilitate validation through the experimental analyses available in the literature. For example, bubble diameter and gas holdup are not given as fitting variables, as performed by Farmer et al. [22], but are calculated by physically consistent validated sub-models. Furthermore, these variables and the thermo-physical properties of the gas and liquid phases are calculated locally as a function of composition, pressure, and temperature.
A considerably different approach of MMBCR modeling was proposed in the work of Catalan et al. [21], where a kinetic–hydrodynamic model to predict methane decomposition rates at near-equilibrium conversions was developed. The authors used drift-flux sub-models to estimate gas holdup. Yet, the created model is applicable only to non-catalytic pyrolysis, as it does not cover the gas–liquid bubble surface area. They assumed isothermal conditions in the reactor, which the experiments of Geißler et al. [6] demonstrated to be inaccurate for the process under investigation. The model aimed to optimize industrial-scale hydrogen production, considering the churn-turbulent regime (also known as heterogenous flow regime) and the effect of pressure changes on gas holdup. It is worth noting that the drift-flux models, originally by Hibiki et al. [23,24] and Kataoka and Ishii et al. [25], were tested mainly with nitrogen in water, gallium, and lead/bismuth metal mixtures. The validation covered predominantly bubbly, cap-bubbly (transitional), churn-like, and early slug flow regimes, with void fractions typically below 32% and equivalent column diameters of up to 60 cm. While accurate in predicting gas holdups within ±30%, Hibiki et al. emphasized the need to adjust the model coefficients for different liquid metal/gas mixtures using the experimental data. In the latest publication, Catalan and Rezaei et al. [20] enhanced their initial drift-flux model by incorporating catalytic reactions at the gas–liquid interface. They optimized designs for an industrial-scale multi-tubular molten metal bubble column reactor to produce 10,000 Nm3 h−1 of hydrogen. Using correlations developed by Akita and Yoshida, [26] they calculated the specific gas–liquid interfacial area as a function of superficial gas velocity, column diameter, and the molten metal’s properties (surface tension, viscosity, and density) without the need for identification of the bubble size. It is important to note that Akita and Yoshida [26] validated these correlations using air-(non-metallic) solvent mixtures in columns up to 30 cm in diameter and for gas holdups less than 14%, limiting their extrapolation to larger-scale production. Recently, Le et al. [27] presented a one-dimensional MMBCR model considering bubbly, transition, and slugging regimes that incorporate heat transfer and axial dispersion directly, thereby expanding the drift-flux formulation that is already proposed by Catalan et al. [21] Importantly, the authors used the drift-flux model within its validated parameters and tackled its limitations by adding a smoothing function to the gas-phase axial dispersion coefficient. Axial dispersion appeared to have a minimal effect on methane conversion in bubbly flow regimes, but reduced conversion by as much as 17% in transition/slugging flow regimes, showing the relevance of its applicability in large-diameter reactors.
In contrast to the aforementioned models, in our work, we developed a single model that considers both homogenous and heterogenous regimes with an applicable range of gas holdup calculations of up to 32%. Furthermore, the applied models incorporate equations that account for the orifice diameters in place and their impact on the initial bubble size. Given that the model identifies the change in the bubble size along the reactor, it is possible to apply the model for catalytic reactions and to consider the temperature change within the bubble, as they rise. Although axial dispersion is not explicitly included in our model, non-ideal flow characteristics, i.e., gas-phase back mixing, are indirectly included through the empirical correlations for the gas holdup employed in the heterogeneous flow regime.
A further significantly different, two-dimensional model was developed by Geißler et al. [6]. In this work, authors considered energy, species, and pressure equations, inside a bubble traveling through the liquid metal reactor. The bubble is assumed to be a spherical body with a constant radius and residence time (identified experimentally), which, in reality, is not the case. The bubble diameter is calculated by Tate’s law, which is based on force balance between buoyancy and surface tension. Geißler et al. [6] considered the temperature profile inside the bubble as a function of the bubble radius and the location in the bubble column. This led to a two-dimensional temperature field, which is described by a set of partial differential equations. In the model presented in this paper, the temperature in the bubble is assumed to be uniform. A change in the gas temperature is only considered as a function of the height of the bubble column, which leads to a one-dimensional temperature dependency along the reactor and thereby heat transfer from the liquid to the gas inside the bubble is taken into account by assuming an equal gas bulk temperature inside the bubble. By this approach, the overall bubble column model presented here is reduced to a set of ordinary differential equations (ODEs), which reduces the effort to solve the set of equations. Yet, the developed model accounts for variations in bubble size along the reactor as a function of the operating conditions and estimates the residence time of the bubble by using experimentally validated correlations.
The biggest difference to the majority of the models published so far, however, is the fact that this model considers not only the homogeneous flow regime, but also the heterogeneous flow regime in the bubble column, enabling applicability to catalytic and non-catalytic pyrolysis reactions over a wide range of operating conditions. The peculiarities of the model do facilitate parametric sensitivity analysis for a better understanding of the key mechanical factors within the reactor for the sizing of a pilot as well as an industrial-sized reactor. All sub-models and boundary conditions required for the overall model are explained in more detail hereafter.

2. Model Implementation

The model presented in this work consists of a set of ODEs for mass balance, energy balance, and pressure change, which are used in the developed model. Individual sub-models are used for the detailed description of reaction kinetics and thermodynamics, heat transfer, and fluid dynamics, which are explained in-depth hereinafter. The ODEs and their connection with all sub-models are explained in Section 2.4.
The purpose of the model is to provide a tool for rapidly scaling the reactor to the technical size. In order to keep pace with the rapid development process being driven by industry partners, sub-models for hydrodynamics are used that have never been developed or validated for molten metal systems, due to a lack of corresponding models in the literature. The associated uncertainties are accepted in favor of faster development of a larger test rig, which will then serve to gather operational experience for improving this model and serve as a basis for further scaling. In industrial practice, the development of products and processes often precedes the scientific investigation of all associated detailed processes.

2.1. Reaction Kinetics and Thermodynamics

During the development of the model in this study, experimental data from the works by Geißler et al. [28] and Plevan et al. [4] have been used. Previous studies indicate that the catalytic effect of methane pyrolysis in the presence of liquid tin was not observed, indicating the occurrence of non-catalytic gas phase reactions [4,6]. Understanding the kinetics of such reactions is crucial for characterizing reactor systems. Investigations into methane pyrolysis kinetics have mainly utilized shock tube or tubular reactor types, covering a wide range of temperatures, pressures, and reactor materials. The various catalysts and partial pressures of gases (e.g., Ar, N2, He) have been studied, leading to diverse findings due to the complex reaction mechanisms under different operating conditions [29]. One discrepancy among researchers is whether a homogeneous or heterogeneous reaction takes place in methane pyrolysis. Catalytic methane pyrolysis with solid catalysts involves a heterogeneous gas–solid system, whereas thermal methane pyrolysis is predominantly homogeneous [29,30]. Yet, many studies have reported different conversions and kinetic models influenced by heterogeneous parameters, such as surface-to-volume ratios, and the presence of the catalytic effects of formed carbon particles during gas phase methane pyrolysis [30]. Characterizing the uncatalyzed gas phase forward reaction rate for methane pyrolysis is challenging for several reasons. The heterogeneous nature of the reaction complicates experimental setups, as the solid carbon produced can act as a catalyst if allowed to accumulate [31]. It is believed that solid carbon’s autocatalytic effect can be minimized by utilizing shock-tube reactors [32]. These reactors increase temperatures and pressures for brief residence times, diminishing solid carbon autocatalytic and wall effects [30]. However, deriving a kinetic rate law from shock-tube reactor experiments is not straightforward and demands us to determine residence time and temperature within the shockwave, relying on assumptions that are difficult to validate [22]. Due to that, different investigators have reported significantly different rate constants based on similar shock-tube experiments. Keeping that in mind, it is also unclear whether homogeneous or heterogeneous catalysis is relevant for the ongoing reaction within the molten metal bubble column, as the extent of carbon particle presence within bubbles is not well-understood and has not been quantitatively analyzed.
In our study, we therefore analyze different kinetic models to find the one that fits our purpose. The best kinetic model was identified by validating the overall model with experimental data from the literature. Table A1 in Appendix A presents kinetic parameters from different authors determined in various reactors, assuming a first-order reaction. These studies analyze methane decomposition rates into pyrolysis products at different temperatures, with activation energies (Eact) and pre-exponential factors (k0) described by the Arrhenius equation.
k = k 0 exp ( E a c t R T )
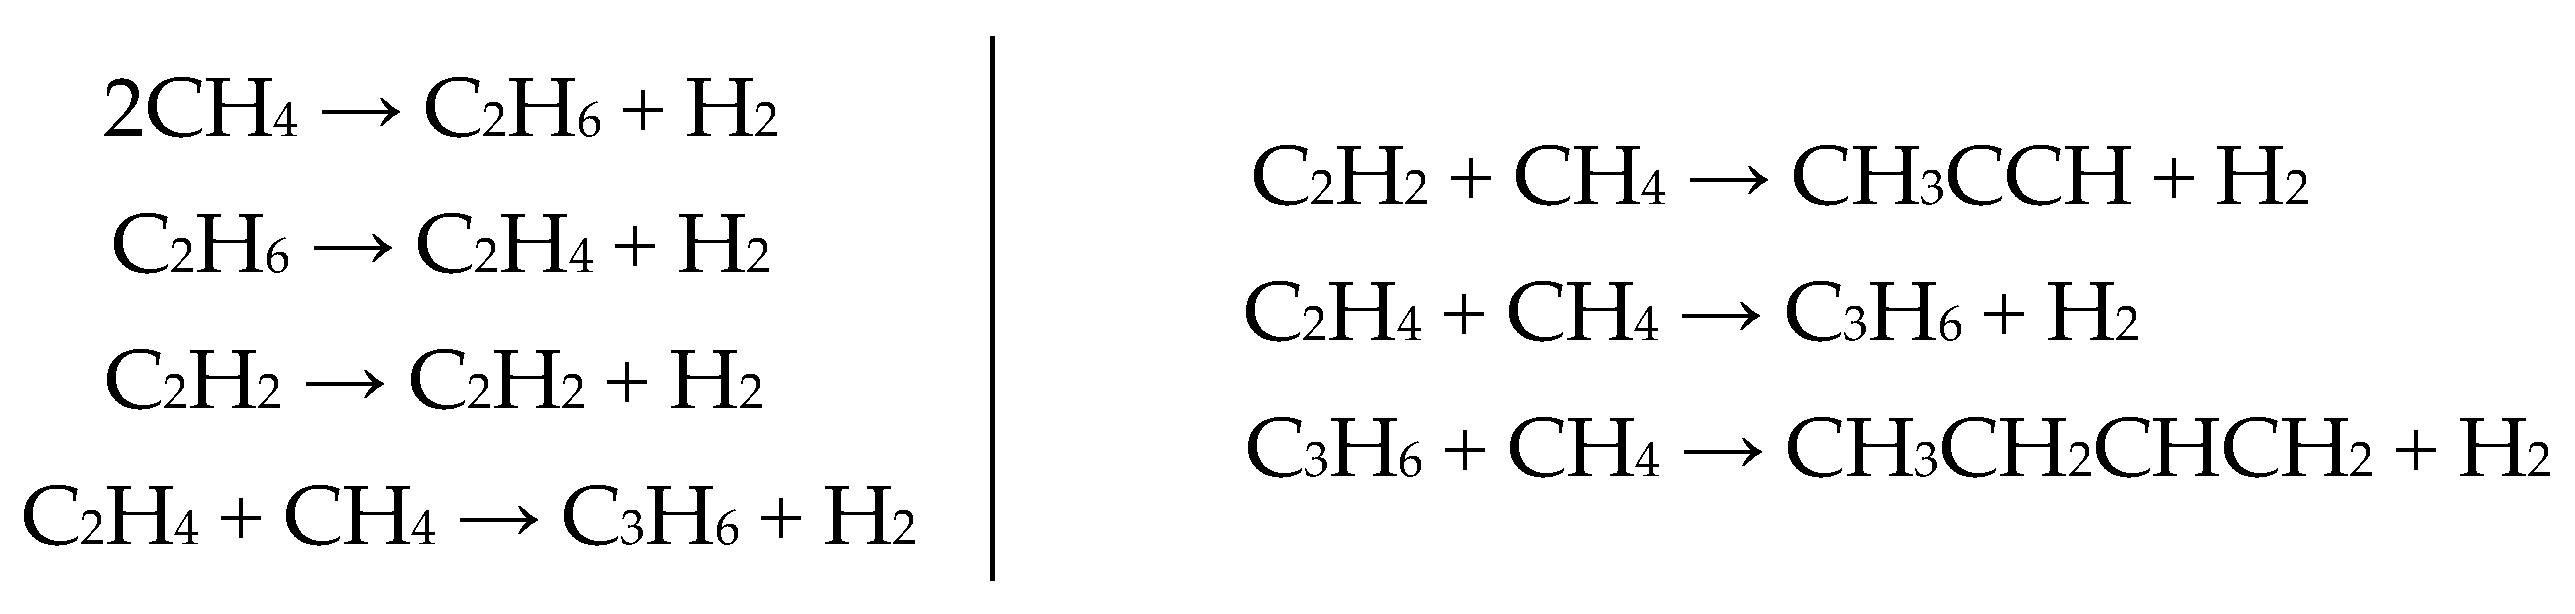
It is worthy of mention that the considered kinetic models are mathematical expressions describing the rate of the global reaction in a relatively narrow range of temperatures. In contrast, the mechanistic expressions would account for the single reaction steps, which are anticipated during methane pyrolysis. The potential reaction mechanism of the noncatalytic methane pyrolysis proposed by Chen et al. [33,34] is shown below in Figure 2.
However, developing mechanistic reaction rate equations has been reported to be increasingly challenging due to the high-temperature endothermic nature of the reactions. In contrast, global reaction rate equations have been shown to be sufficient for practical use.
C H 4 C + 2 H 2     ( h 0 = 74.85   k J   m o l 1 )          Global   Methane   Pyrolysis   Reaction
It is crucial to note that activation energies tend to be higher in shock tube experiments—around 390 kJ mol−1 compared to approximately 340 kJ mol−1 in tubular reactors—suggesting heterogeneous effects in the latter (see Table A1 in Appendix A). Deviations in activation energies can be attributed to possibly imprecise reaction conditions, particularly temperature distribution within experimental reactors and negligence of wall/carbon catalytic effects.
While validating catalytic methane pyrolysis within molten metal bubble columns falls beyond the scope of this paper, it is important to acknowledge the numerous studies that have investigated the kinetics of these processes. For instance, molten metal alloys such as Ni/Bi, Cu/Bi, Cu/Sn and others have been reported to exhibit significant catalytic properties [10,12]. The developed model can readily incorporate considerations of catalytic reactions, provided that the necessary parameters are supplied.
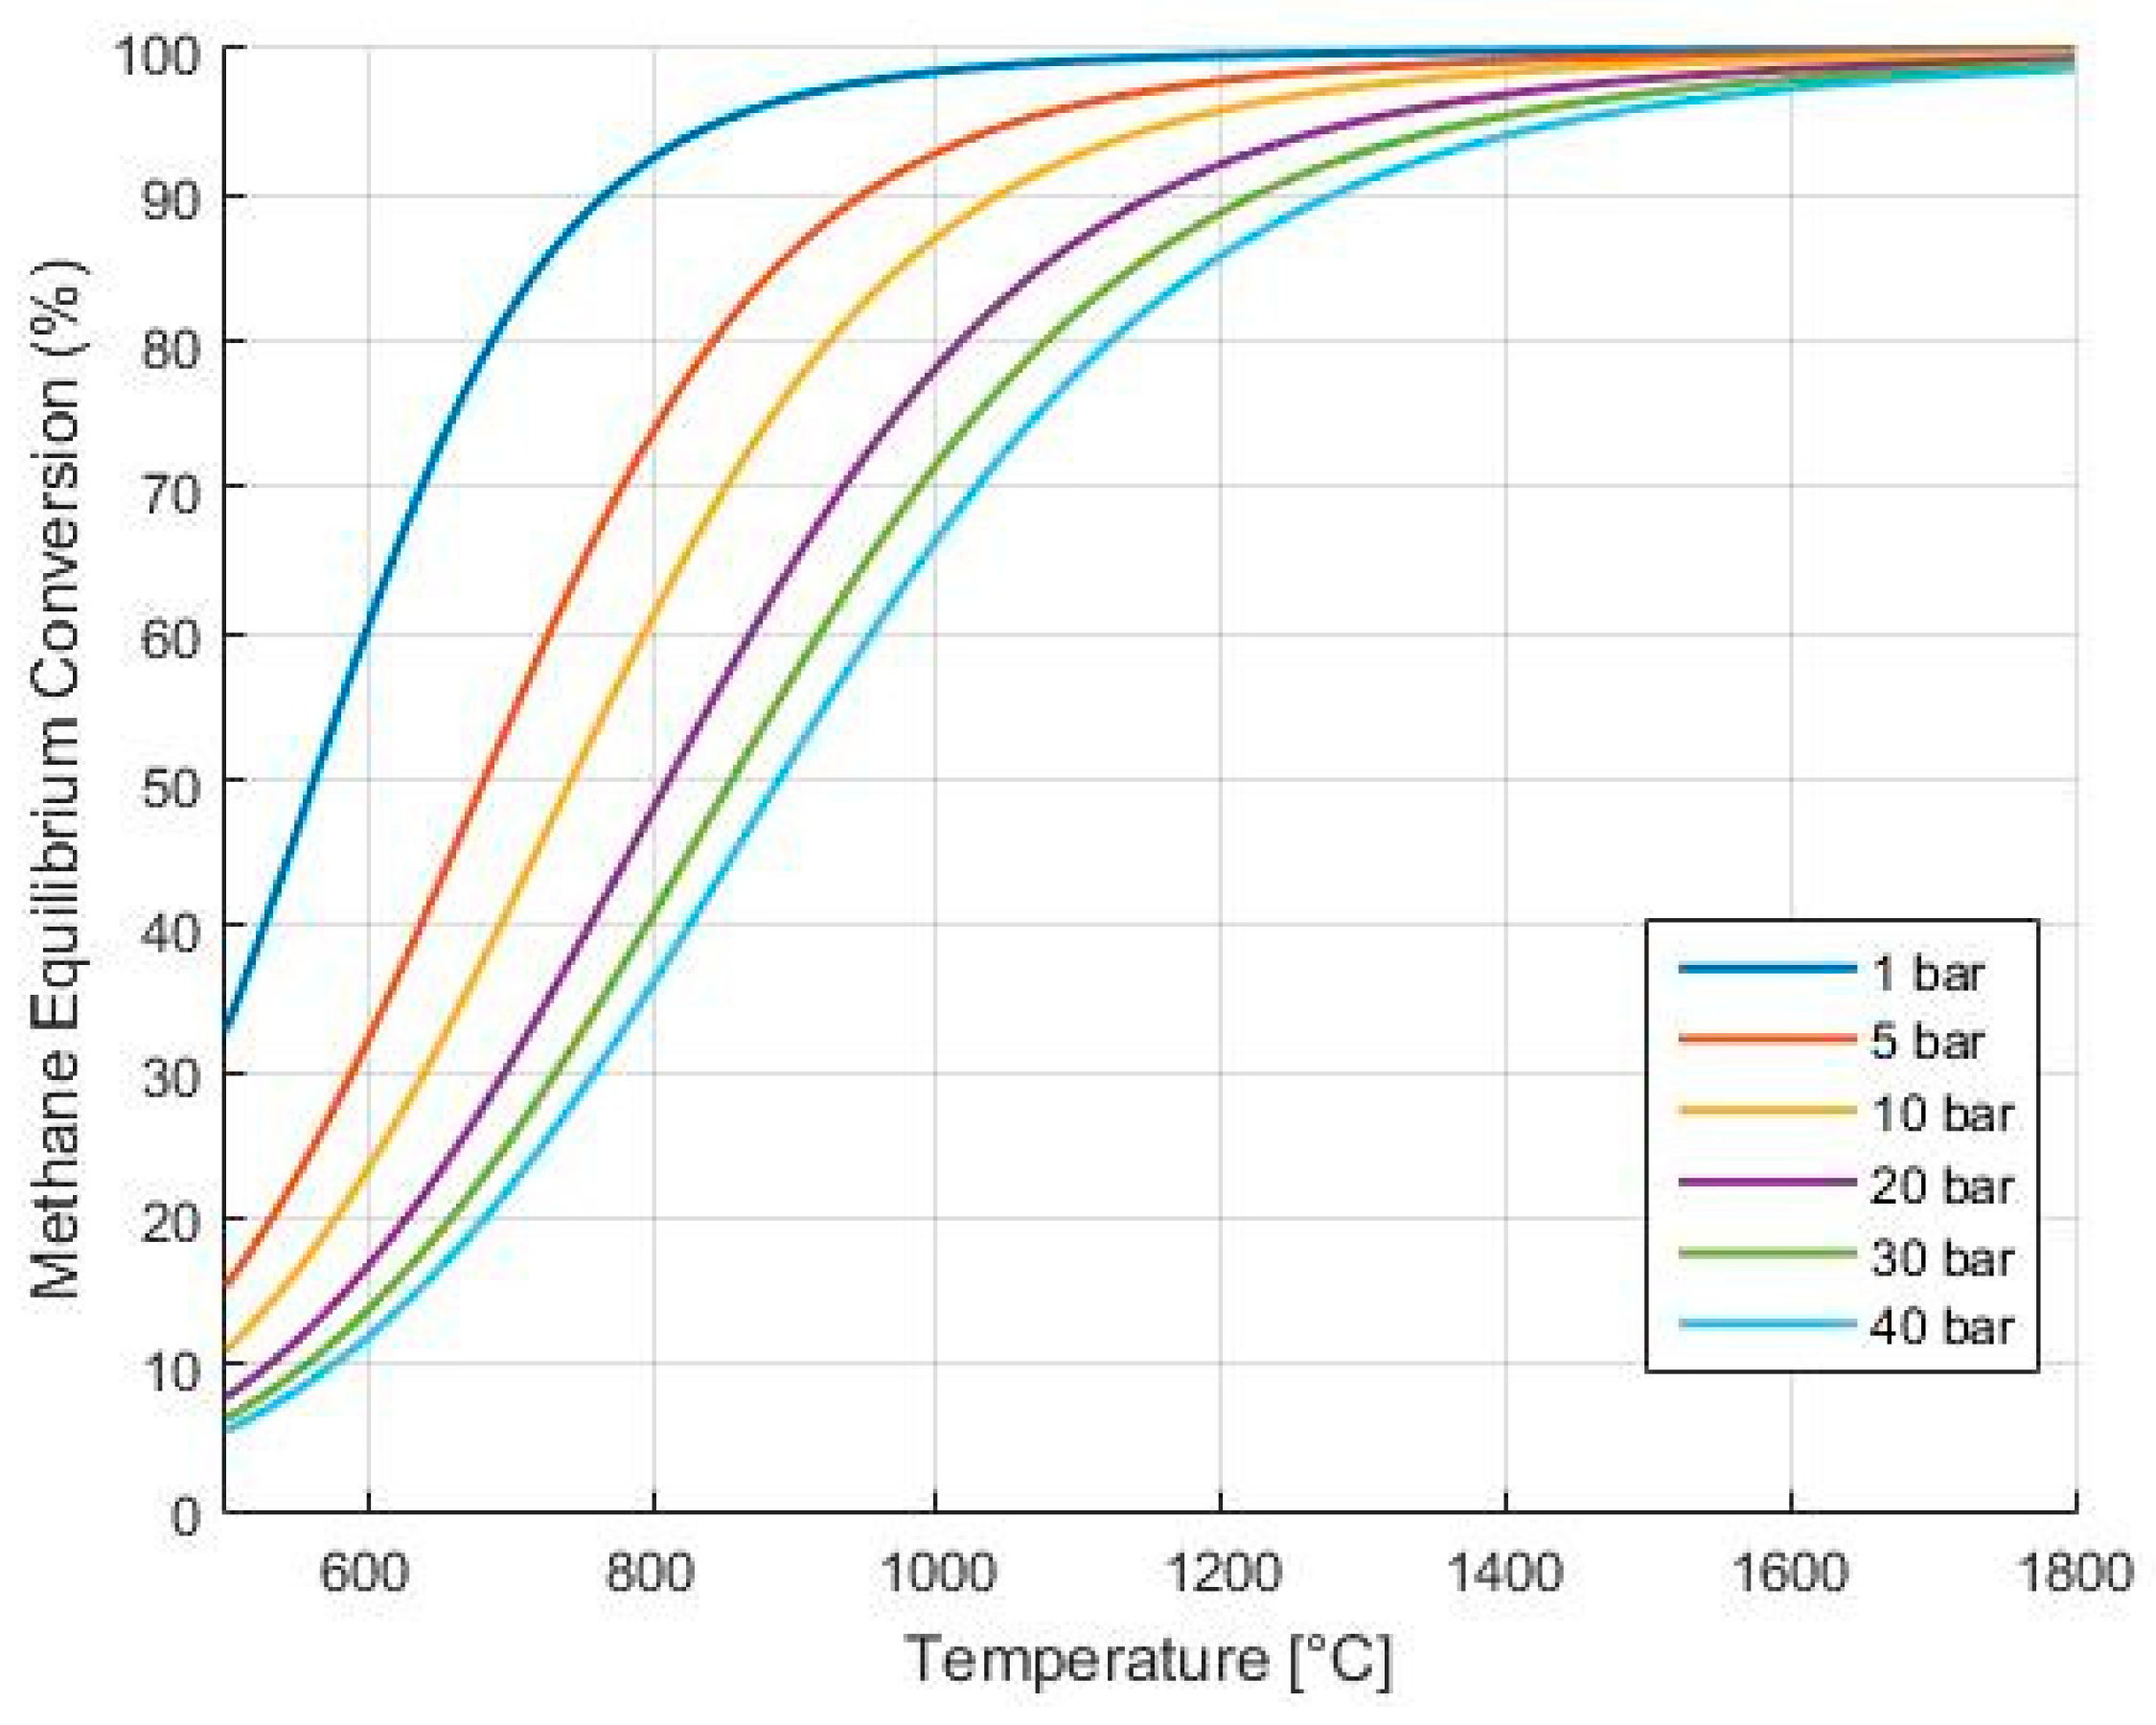
Thermodynamically, the thermal decomposition of methane represents an endothermic process, requiring a minimum reaction initiation temperature of approximately 400 °C under ambient pressure conditions. Complete conversion of methane at an ambient pressure necessitates temperatures exceeding 1100 °C. The volumetric expansion associated with the full methane decomposition reaction implies that, in accordance with Le Chatelier’s principle, an increase in pressure favors the formation of methane, while a decrease in pressure promotes the formation of the reaction products. As a result, elevated temperatures, reduced pressures, and prolonged residence times contribute to the decomposition of methane into H2 and carbon particles. This is also evidenced by the equilibrium conversion dependence on temperature and pressure, illustrated in Figure 3.
Given the equilibrium-driven nature of the reaction within industrially relevant operational parameters, consideration of the reverse reaction rate, and hence the equilibrium constant, is crucial. The equilibrium constant (Keq) is calculated using the temperature-dependent correlation developed by Catalan et al. [19] for estimating the equilibrium constant within the temperature range of 900 to 1200 °C, which has been applied in our model.
ln K e q = 13.2714 91,204.6 R u T
For simplicity, a modified reaction equilibrium constant (Kp) is used in the subsequent sections. The equations showing the relation of Kp to Keq are presented in the Appendix A.2.

2.2. Heat Transfer

The analysis of heat transfer between the reactor wall and molten metal, conducted according to the methodologies recommended by Joshi et al. [35] and Kantarci et al. [36], has revealed exceedingly high heat transfer rates, surpassing 25,000 W m−2 K−1. Consequently, for the model’s development, it is assumed that the primary resistance to heat transfer lies between the bubbles and the liquid metal. The temperature profile along the reactor in the gas phase is governed by the temperature within the bubble, which changes over time. The method established by Tokunaga et al. [37] is utilized to characterize heat transfer to the bubble, employing the concept of the overall heat transfer coefficient. Additionally, it is assumed that the temperature within the bubble is uniform.
The heat source is the heat transfer from hot molten metal to the bubble, and the heat sink is the consumption of energy due to the endothermic reaction.
C p , m i x ρ m i x V b d T d z v b u b b l e = U m A s , b ( T t i n T b ) r b H r , T b V b
The variable v bubble represents the bubble rise velocity, A s , b denotes the surface area of a bubble, and V b corresponds to the actual volume of the bubble.
According to Tokunaga et al. [37], the Nusselt number can be estimated with the help of the following expression:
N u m p = U m d b λ l = 0.58 [ P e 1 + k ] 0.68
where U m is the heat transfer coefficient between the bubble and liquid tin, λ l is the thermal conductivity (W m−1 K−1) of liquid tin, Pe—Peclet number of the bubble (which is calculated as the product of the gas bubble’s Reynolds number and the gas’ Prandtl number), and k is the ratio of gas viscosity within a bubble to the viscosity of liquid tin surrounding it.

2.3. Hydrodynamics

In this study, particular attention has been devoted to the modeling of flow regimes. For the homogeneous flow regime, the model proposed by Farmer et al. [22] was adapted and employed. In this model, a constant rate of bubble flow through the reactor is assumed, which is justified by the negligible occurrence of breakup and coalescence under the given flow conditions. The initial bubble size and bubble rise velocity were determined by using correlations created by Andreini et al. [38], which were originally developed experimentally for molten metals. Notably, the utilized model incorporates an increase in bubble size along the reactor. Consequently, with the known bubble rise velocity, both the residence time and gas holdup can be readily calculated.
To describe the heterogeneous model and predict its onset, the concept developed by Krishna et al. [39] was applied. This concept subdivides the flow into two phases consisting of small and large bubbles. As the number of bubbles fluctuates, rather than remaining constant, bulk parameters such as gas holdup are employed. According to experimental findings from the work of Krishna and colleagues, the heterogeneous regime commences when the superficial gas velocity exceeds the transition gas velocity. Correlations, which are dependent on system properties, are utilized to identify the transition superficial gas velocity and gas holdup. Given the lack of studies on heterogeneous and transition regimes for liquid metal systems and considering that many correlations are derived for water/air systems, in this work, the transition regime is represented as a combination of homogeneous and heterogeneous models. The respective sub-models and concepts are elaborated upon in subsequent chapters.

2.3.1. Homogenous Flow Regime

This regime is described using the method suggested by Farmer et al. [22]. According to this concept, bubbles neither break up nor combine within the homogeneous regime. Consequently, the number of bubbles moving through the reactor, which resembles the suspension density, remains constant along the reactor’s length. Farmer and his coworkers proposed that the number of bubbles, denoted as B ˙ , can be determined by dividing the volumetric gas flow rate at the reactor inlet by the initial bubble volume at the nozzle. The corresponding equation is given as follows:
B ˙ = F T , 0 R u T 0 P 0 ( 4 3 π r b , 0 3 )
In this context, B ˙ represents the number of bubbles moving per unit time (s−1), F T , 0 denotes the inlet molar feed, T 0 is the initial temperature, P 0 is the initial pressure, and r b , 0 corresponds to the radius of the bubble at the nozzle.
In the model of Farmer et al. [22], the initial bubble size must either be experimentally determined or established as a fitting parameter within the model. It should be noted that determining the initial bubble size in molten metal presents a considerable challenge. Optical and photographic techniques are impractical for measuring bubble sizes in opaque liquids such as molten metals. Several studies have utilized techniques based on differential pressure and acoustical measurements to determine the bubble size as bubbles detach from a submerged orifice in various liquid metals.
In the developed model, we propose to estimate the initial bubble size by utilizing correlations established through the experimental work carried out by Andreini et al. [38] on molten metals. Researchers conducted velocity and volume measurements of gas bubbles injected into liquid metals under laminar flow conditions at the orifice. The study unveiled a unique dependency of the bubble size on the magnitudes of the orifice Froude and Weber numbers for the given metal melts, implying consistent bubble formation modes across all examined metals.
d b d o r i f i c e = ( F r 0 ) 0.227 ( W e 0 ) 0.112
Consequently, using the assumption of the constant bubble number and the suspension density, the radius of the bubble at the given state in the reactor is detected by the quotient of the volumetric flow rate and B ˙ .
r b , z = ( F T , z R T z P z ( 4 3 π ) B ˙ ) 1 3
Another important parameter that is needed for the calculation of the pressure drop across the reactor as well as the amount of H2 produced during the reaction, is gas holdup. For its determination, the time spent by the bubble in the reactor needs to be known. The residence time is therefore estimated through the ratio of height and bubble velocity along the reactor. Notably, the study of Andreini et al. [38] demonstrated a concordance between the effective drag coefficients of the rising bubbles and previously established data in aqueous systems, facilitating the development of a correlation between the bubble diameter and bubble rise velocity. Therefore, in the developed model, the velocity of the bubble is estimated using the respective correlation, which is shown in Equation (8). The changing bubble diameter and, consequently, the bubble rise velocity along the reactor are simultaneously estimated within the running model. This approach facilitates a more accurate estimation of the residence time, particularly for reactor heights exceeding 1 m, where the hydrostatic pressure drop increases, and the variation in bubble diameter becomes more pronounced.
v b = 29.69 d b 0.316
According to the concept developed by Farmer et al. [22], the bubble volume fraction at the position z ( φ g , z ), also resembling the gas holdup at the position z, is then described as follows:
φ g , z = ρ b 4 3 π r b , z 3
Here, ρ b —the suspension density—is estimated via the following:
ρ b = B ˙   τ V r
where τ denotes the residence time of the bubbles in the reactor and V r represents the total reactor volume.
Accordingly, the melt–gas interfacial area per unit reactor volume can be calculated via a similar approach. It is important to note that this parameter is necessary for catalytic pyrolysis in the liquid metal bubble column:
α g , z = ρ b 4 π r b , z 2
Therefore, the total reaction rate (R) on a moles/s/volume of reactor basis can be written as follows:
R = ( k f , m α g , z R u T + k f , g φ g , z R u T ) [ P C H 4 1 K p P H 2 2 ]
Here k f , g is the gas phase reaction rate constant corresponding to non-catalytic methane pyrolysis, k f , m is the catalytic reaction rate constant (equals to 0, when molten tin is utilized), α g , z is the melt–gas interfacial area per unit reactor volume, φ g , z is the gas holdup at the given position, R u is the universal gas constant, and P C H 4 and P H 2 are the partial pressures of methane and hydrogen.
The same kinetic framework and reaction system apply regardless of whether the flow regime is homogeneous or heterogeneous. Consequently, the total reaction rate is determined by using the same approach for both flow regimes.

2.3.2. Heterogenous Flow

For estimating the gas holdup within heterogeneous flow regimes, the correlation developed by Krishna et al. [39] is employed. This correlation is grounded in a two-phase theory, where the flow is characterized by dense and dilute phases. The dense phase represents the population of small bubbles, while the dilute phase encompasses the larger bubble population. The total gas holdup was estimated by using a correlation that integrates gas holdups from both the dense (ϵtrans) and dilute (ϵb) phases, expressed as
ϵ = ϵ t r a n s ( 1 ϵ b ) + ϵ b
Krishna et al. [39] conducted a comprehensive series of experiments involving various gas–liquid mixtures. Their findings revealed that the gas holdup of the dense phase remains practically constant across the heterogeneous flow regime. For determining the gas holdup at the transition point from a homogenous to heterogenous flow regime, the authors used the correlation proposed by Reilly et al. [40]:
ϵ t r a n s = 0.59 B 1.5 ρ g a s 0.96 ρ l σ 0.12
where B is ranging between 2.6 and 4.6 for different air–water and air–hydrocarbon systems (only applicable for ϵ t r a n s < 0.32 ).
It remains uncertain whether the coefficient B for these systems is appropriate for the liquid metal hydrogen/methane system, necessitating further investigation through experimental analysis. Currently, a value of 3.85 is assumed, as Reilly et al. [39,40] reported this to be optimal for most of the analyzed systems in their study. It is important to highlight that an accurate prediction of the transition point gas holdup is crucial for correctly estimating the transition point’s superficial velocity, Utrans. This velocity is essential for identifying the boundaries between homogeneous and heterogeneous regimes. Krishna et al. [39] employed the correlation proposed by Reilly et al. [40] for estimating Utrans as
U t r a n s = v s m a l l ϵ t r a n s ( 1 ϵ t r a n s )
where v s m a l l stands for small bubble swarm rising velocity and is calculated as follows:
v s m a l l = 1 2.84 1 ρ g a s 0.04 σ 0.12
Krishna et al. [39] revealed that the large bubble holdup for superficial gas velocities in the established churn turbulent flow (>0.1 m s−1) is virtually independent of the liquid properties, the manner in which the gas is distributed, and the density of the gas phase. As a result of this experimental analysis, the authors developed a correlation to estimate the large bubble population gas holdup
ϵ b = 0.268 D r 0.18 1 ( U U t r a n s ) 0.22 ( U U t r a n s ) 0.8
which is also employed in this study. For a relevant representation of the heat transfer within the heterogeneous flow regime, further assumptions and modifications to the concept developed by Krishna et al. [39] are made in this study. It is presumed that the temperature inside small and large bubbles might differ due to the distinct diameters and the reactant conversion within them. The likely mass transfer and associated heat transfer between bubbles due to coalescence or breakup have been ignored, as these phenomena require more sophisticated experimental analysis, which is beyond the scope of the current work. For the analysis of heat transfer by using the concept described in Section 2.2, the diameter and velocity of the rising bubbles need to be known.
Considering the small bubble population, given that the number of bubbles is unknown and varies along the reactor due to possible breakup and coalescence, direct estimation of the diameter from gas holdup of the respective phase is not possible. The equivalent diameter of the small bubbles is therefore identified through back-calculation from the known small bubble swarm velocity, using Andreini’s correlation (Equation (8)).
For the large bubble population, as the exact number of coalesced large bubbles is not known, the diameter of the bubbles at the respective height is identified by using the equation developed by Darton and his coworkers [41]. This equation, from their work on bubble growth due to coalescence, depicts the dependency of bubble size on height within the reactor.
D e = ( 0.46 ( U U t r a n s ) 0.5 h g 0.25 + D e 0 5 4 ) 4 5
Here, D e 0 is the initial bubble size at the orifice, which is assumed to be equal to the equivalent size of the small bubble. It is important to note that, according to the concept of Darton et al. [41], large bubbles increase in size due to coalescence up to the equilibrium height (h*), which is often assumed to be about 0.2–0.3 m. Although it is not entirely clear if the reported equilibrium height value can be used for the liquid tin system, at this stage of the study, we presume this value to be 0.3 m. It is noteworthy that at greater heights, the diameter of the large bubbles does not increase due to coalescence and depends only on the increasing superficial gas velocity. It is essential to emphasize that the model of Darton presumes that the influence of particles on the bubble breakup is negligible due to their small size or low content. Therefore, the described methodology cannot be reliably applied if the content or size of the carbon black particles is large; a quantitative analysis of these parameters is needed. For the estimation of large bubble velocity, similarly, Andreini’s correlation is used. It must be emphasized that this methodology is employed due to the absence of other options, as Andreini’s correlations are primarily used for relatively smaller bubbles.
For the implementation of a heterogeneous model coupled with a homogeneous model, the following assumptions are made:
  • The heterogeneous regime begins once the superficial gas velocity exceeds the transition superficial velocity at the reactor’s entry conditions.
  • The transition gas holdup cannot exceed 32%, and the total gas holdup at the entry may not exceed 35%, which are the experimental validity boundaries established by Krishna et al. [39].
  • The feed flow rate is subdivided into the small bubble population feed and the large bubble population feed. Therefore, the methane molar flow rate for the respective phases at the reactor entry is identified based on the ratio between the gas holdups.
R l a r g e = ϵ b ϵ t o t a l
F e e d l a r g e = R l a r g e × F e e d
F e e d s m a l l = F e e d F e e d l a r g e
Here, R l a r g e represents the equivalent fraction of the feed within the dilute phase with large bubbles. F e e d l a r g e and F e e d s m a l l are the molar feed flow rates allocated to the dilute and dense phases, respectively.
  • The number of small and large bubbles along the reactor is not known; therefore, the respective gas holdups of the phases are estimated using the described correlations. The change in gas holdup along the reactor for the small bubble population is represented by the following equation:
ϵ s m a l l = ϵ t r a n s ( 1 ϵ b )
Consequently, ϵ t r a n s and ϵ b are estimated along the reactor (considering changing conditions) and substituted into Equation (22).
  • The equilibrium size of the large bubbles is reached at approximately 0.3 m. At greater heights, the diameter of the large bubbles does not increase due to coalescence and depends solely on the increasing superficial gas velocity.
  • The variation in the transition and superficial gas velocities due to the changes in operating conditions is considered.
The numerical integration for both bubble populations is conducted by using the same ODE model. Consequently, the changing values of gas holdups for small and large bubbles are simultaneously used for the numerical integration of the differential equations that describe their behavior.

2.4. Balance Equations, Boundary Conditions, and Connection of Sub-Models

A set of ODEs for mass balance, energy balance, and pressure change are used in the developed model. Since mass transfer from the gas phase to the molten metal is not significant in this case, the mass balance for each component is based on the ongoing reaction as
d F C H 4 d z 1 A c r o s s = R ,   where   F C H 4 ( z = 0 ) = F C H 4 , F e e d
d F H 2 d z 1 A c r o s s = 2 R ,   where   F H 2 ( z = 0 ) = F H 2 , F e e d
The respective equations are then numerically integrated along the reactor. Here, the reaction rates are calculated using Equation (12).
The pressure drop along the reactor is estimated by considering the volume of bubbles, and the corresponding ODE is as follows:
d P d z = ρ t i n g ( 1 φ g , z ) ,   where   P ( z = 0 ) = P 0
The respective ODE for energy balance, which is based on the single bubble concept described in Section 2.3.1 is as follows:
d T d z = U m A s , b ( T t i n T b ) r b H r , T b V b v b u b b l e C p , m i x ρ m i x V b ,   where   T ( z = 0 ) = T 0 , F e e d
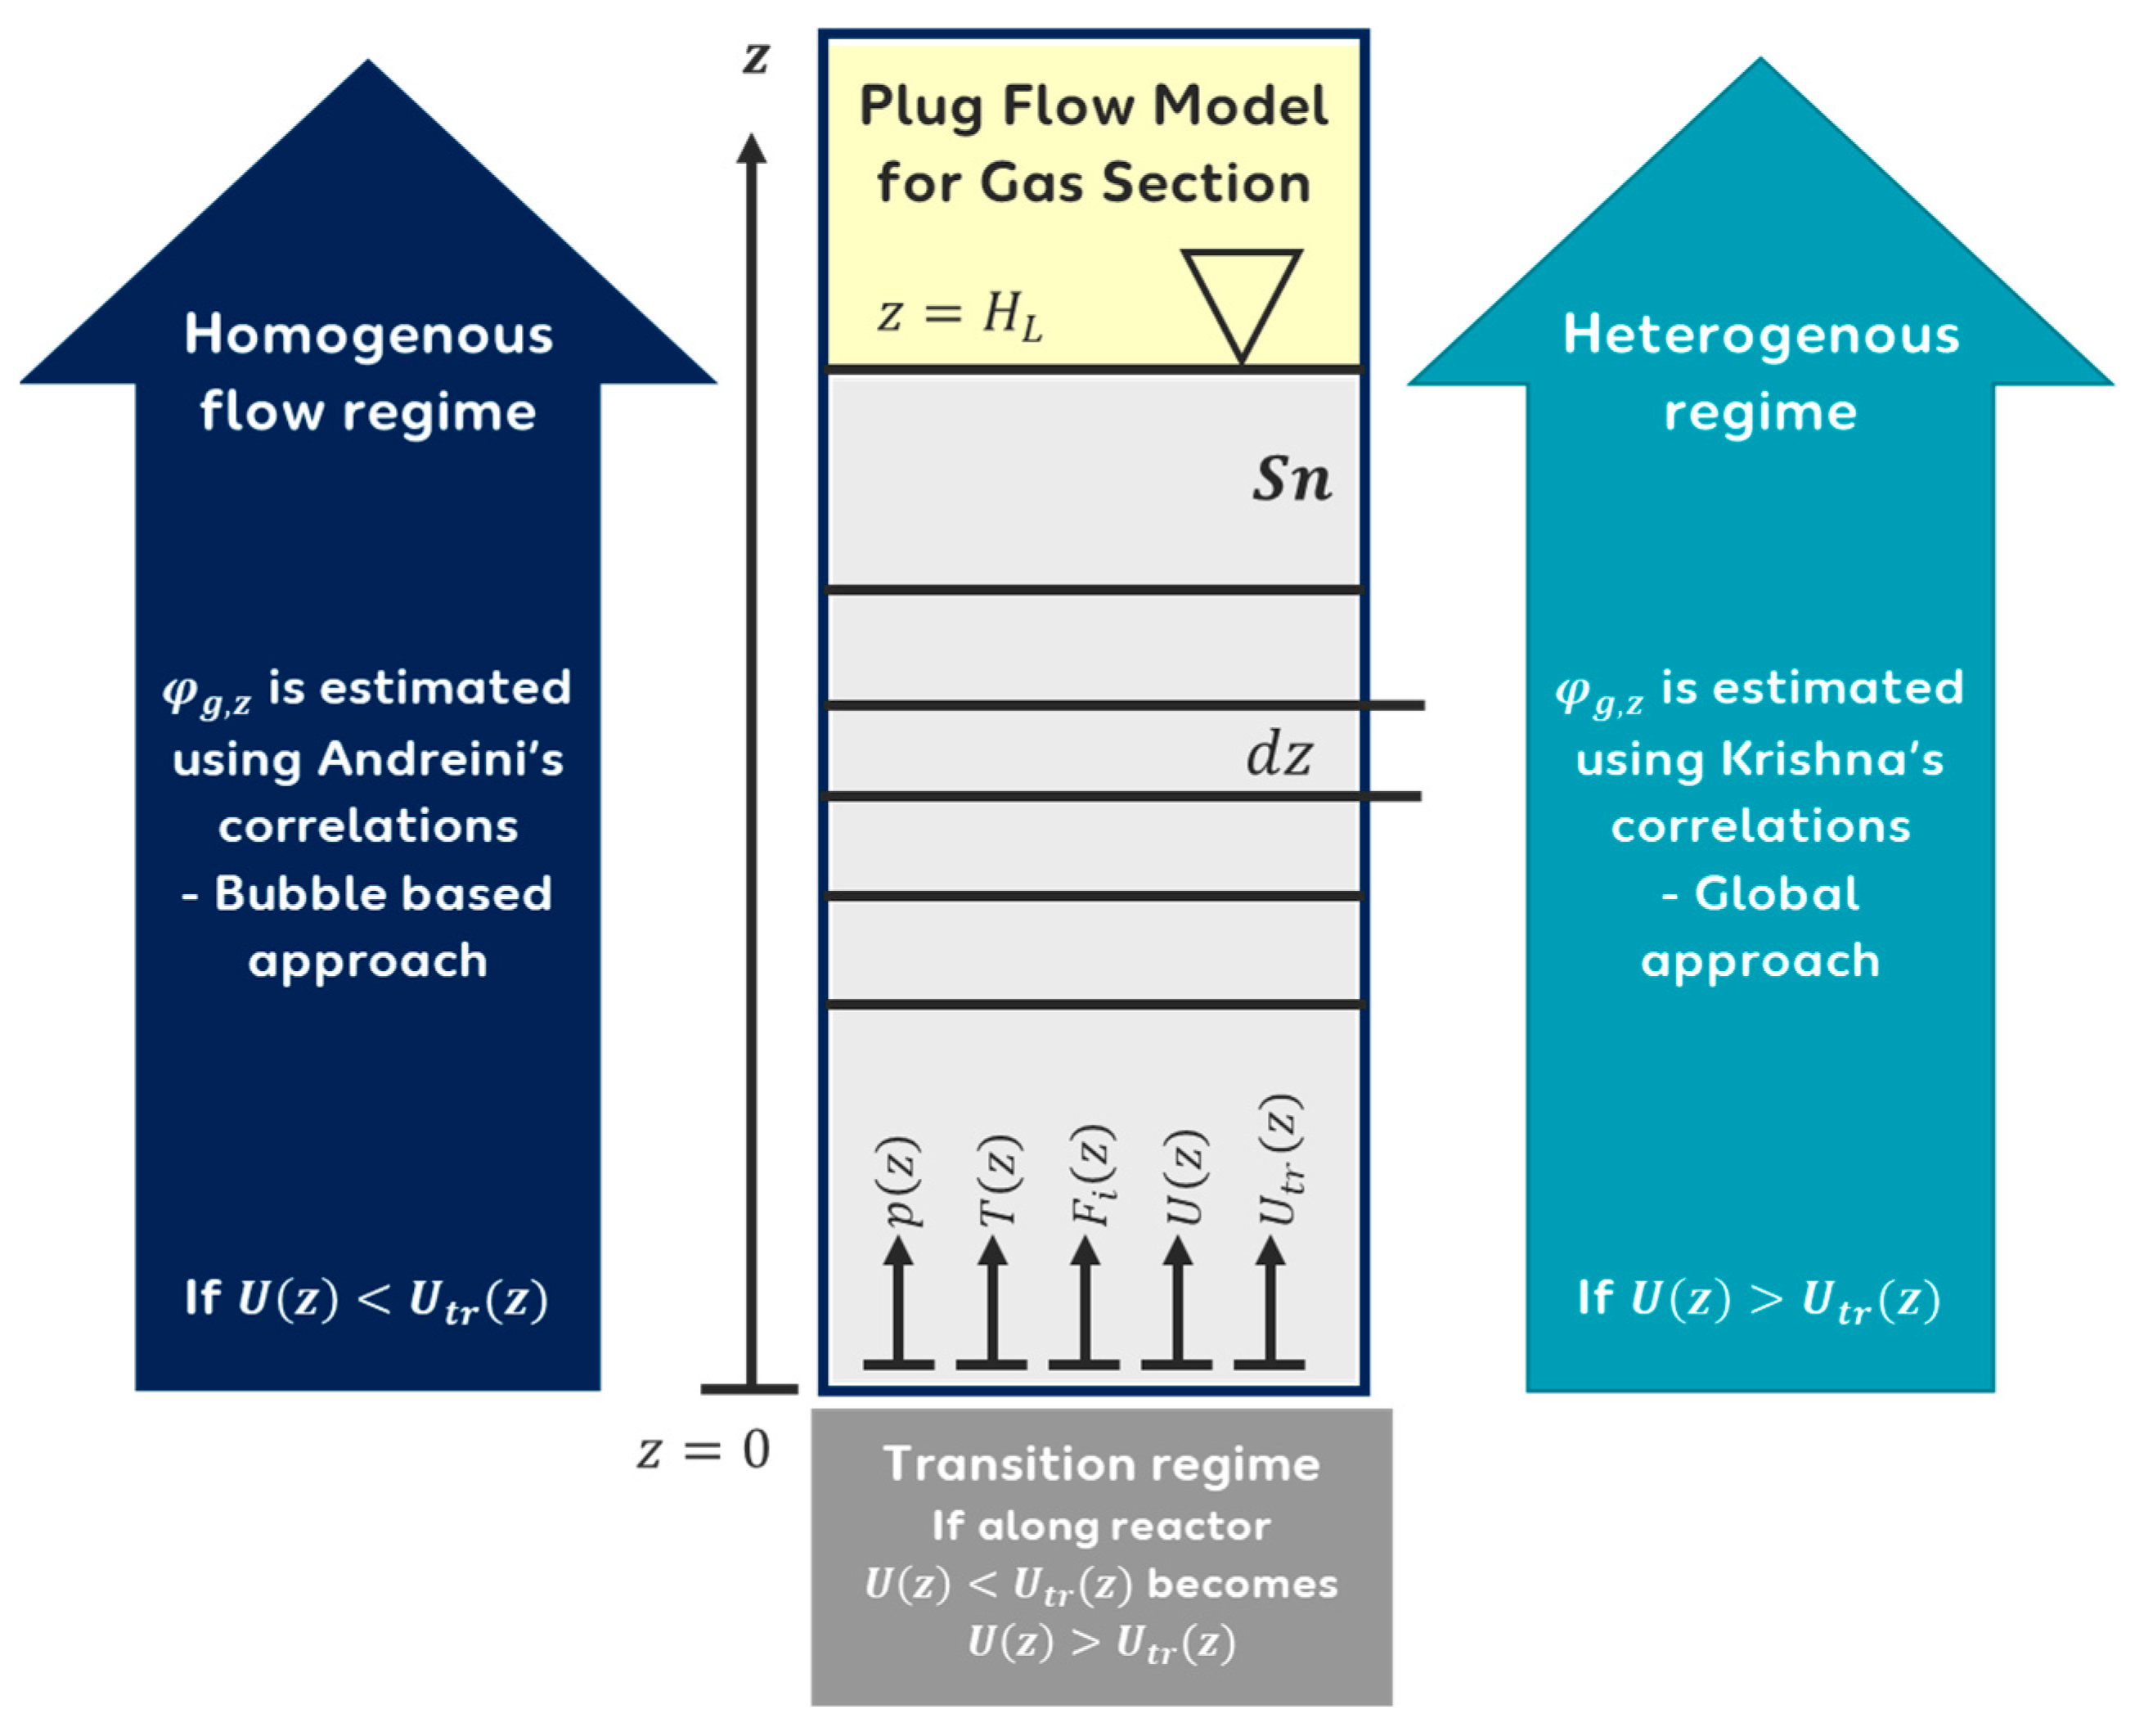
Figure 4 illustrates the sub-models used in our study. In the developed model, if the superficial gas velocity is less than the transition superficial gas velocity, the homogeneous model is triggered. In this scenario, the local gas holdup is estimated by using Andreini’s correlations for the single bubble approach. Additionally, a plug flow reactor model is applied to account for the ongoing pyrolysis reaction above the liquid tin, which aligns with most experimental analyses. When the superficial gas velocity exceeds the transition superficial gas velocity, a heterogeneous flow regime is assumed, with the local gas holdup continuously being estimated using Krishna’s correlations. If the homogeneous flow regime transitions into a heterogeneous flow regime at any position inside the reactor, a transition model is applied, which combines aspects of both the homogeneous and heterogeneous models. To the best of our knowledge, there are no studies describing transition regime hydrodynamics within liquid metals [30,38,42]. Therefore, to ensure the continuity of the simulation over a wide range of conditions, we represented the transition model as a combination of the homogeneous and heterogeneous models. This reflects the spatial evolution of the flow patterns along the reactor height, where the flow may enter into the homogeneous regime and develop into transition and fully heterogeneous regimes at higher axial positions. The applied holdup and transition correlations are primarily based on the drift-flux framework of Krishna et al. [39] and the transition criteria of Reilly et al. [40]. Although these correlations were developed for non-metallic systems, they are largely functions of system properties and are therefore qualitatively transferable to liquid metals, while their direct application to molten tin must be regarded as approximate. Due to the high density of molten tin (≈7000 kg m−3), the hydrostatic pressure gradient is about 70 kPa m−1, leading to rapid gas expansion and a sharp increase in superficial gas velocity with height. As a result, the transition from homogeneous to heterogeneous flow is expected to occur over a relatively short axial section of the reactor, having a low impact on overall conversion.

3. Results and Discussion

3.1. Experimental Validation for Homogenous Flow Conditions

3.1.1. Experimental Setup

For model validation at higher temperatures, experimental data were sourced from Geißler et al. [28]. Their setup, designed to endure corrosive conditions, featured a quartz glass inner tube (1268 mm length, 40.5 mm diameter) within a steel shell. Gas dispersion into molten tin was achieved through a 0.5 mm orifice, with cooling systems for the gas supply line and temperature probe. Experiments were conducted at temperatures of 950 °C, 1000 °C, 1050 °C, 1100 °C, and 1175 °C, with methane flow rates of 50, 100, 150, and 200 mln min−1. The overpressure in the gas section was maintained at around 1 atm, and the molten metal bath level was within a range of 1.05 ± 0.05 m. The known temperature profiles from this study were utilized to account for temperature losses and other unmodeled influences in the model validation.
For model validation at a lower temperature, data from M. Plevan et al. [6] were used. Their reactor, measuring 1.075 m in length, was filled with liquid tin to heights of 0.6 or 1 m, depending on the test run. Experiments were performed at 750 °C, 850 °C, and 900 °C, with an overpressure of 1 atm. Methane flow rates varied from 25 to 200 mln min−1, and the temperature profile along the reactor’s gas section was well-characterized. These temperature profiles were also incorporated into the model to address temperature losses and similar effects. Detailed information on the experimental conditions can be found in the studies by Geißler et al. [28] and M. Plevan et al. [6].

3.1.2. Comparison with Experimental Data

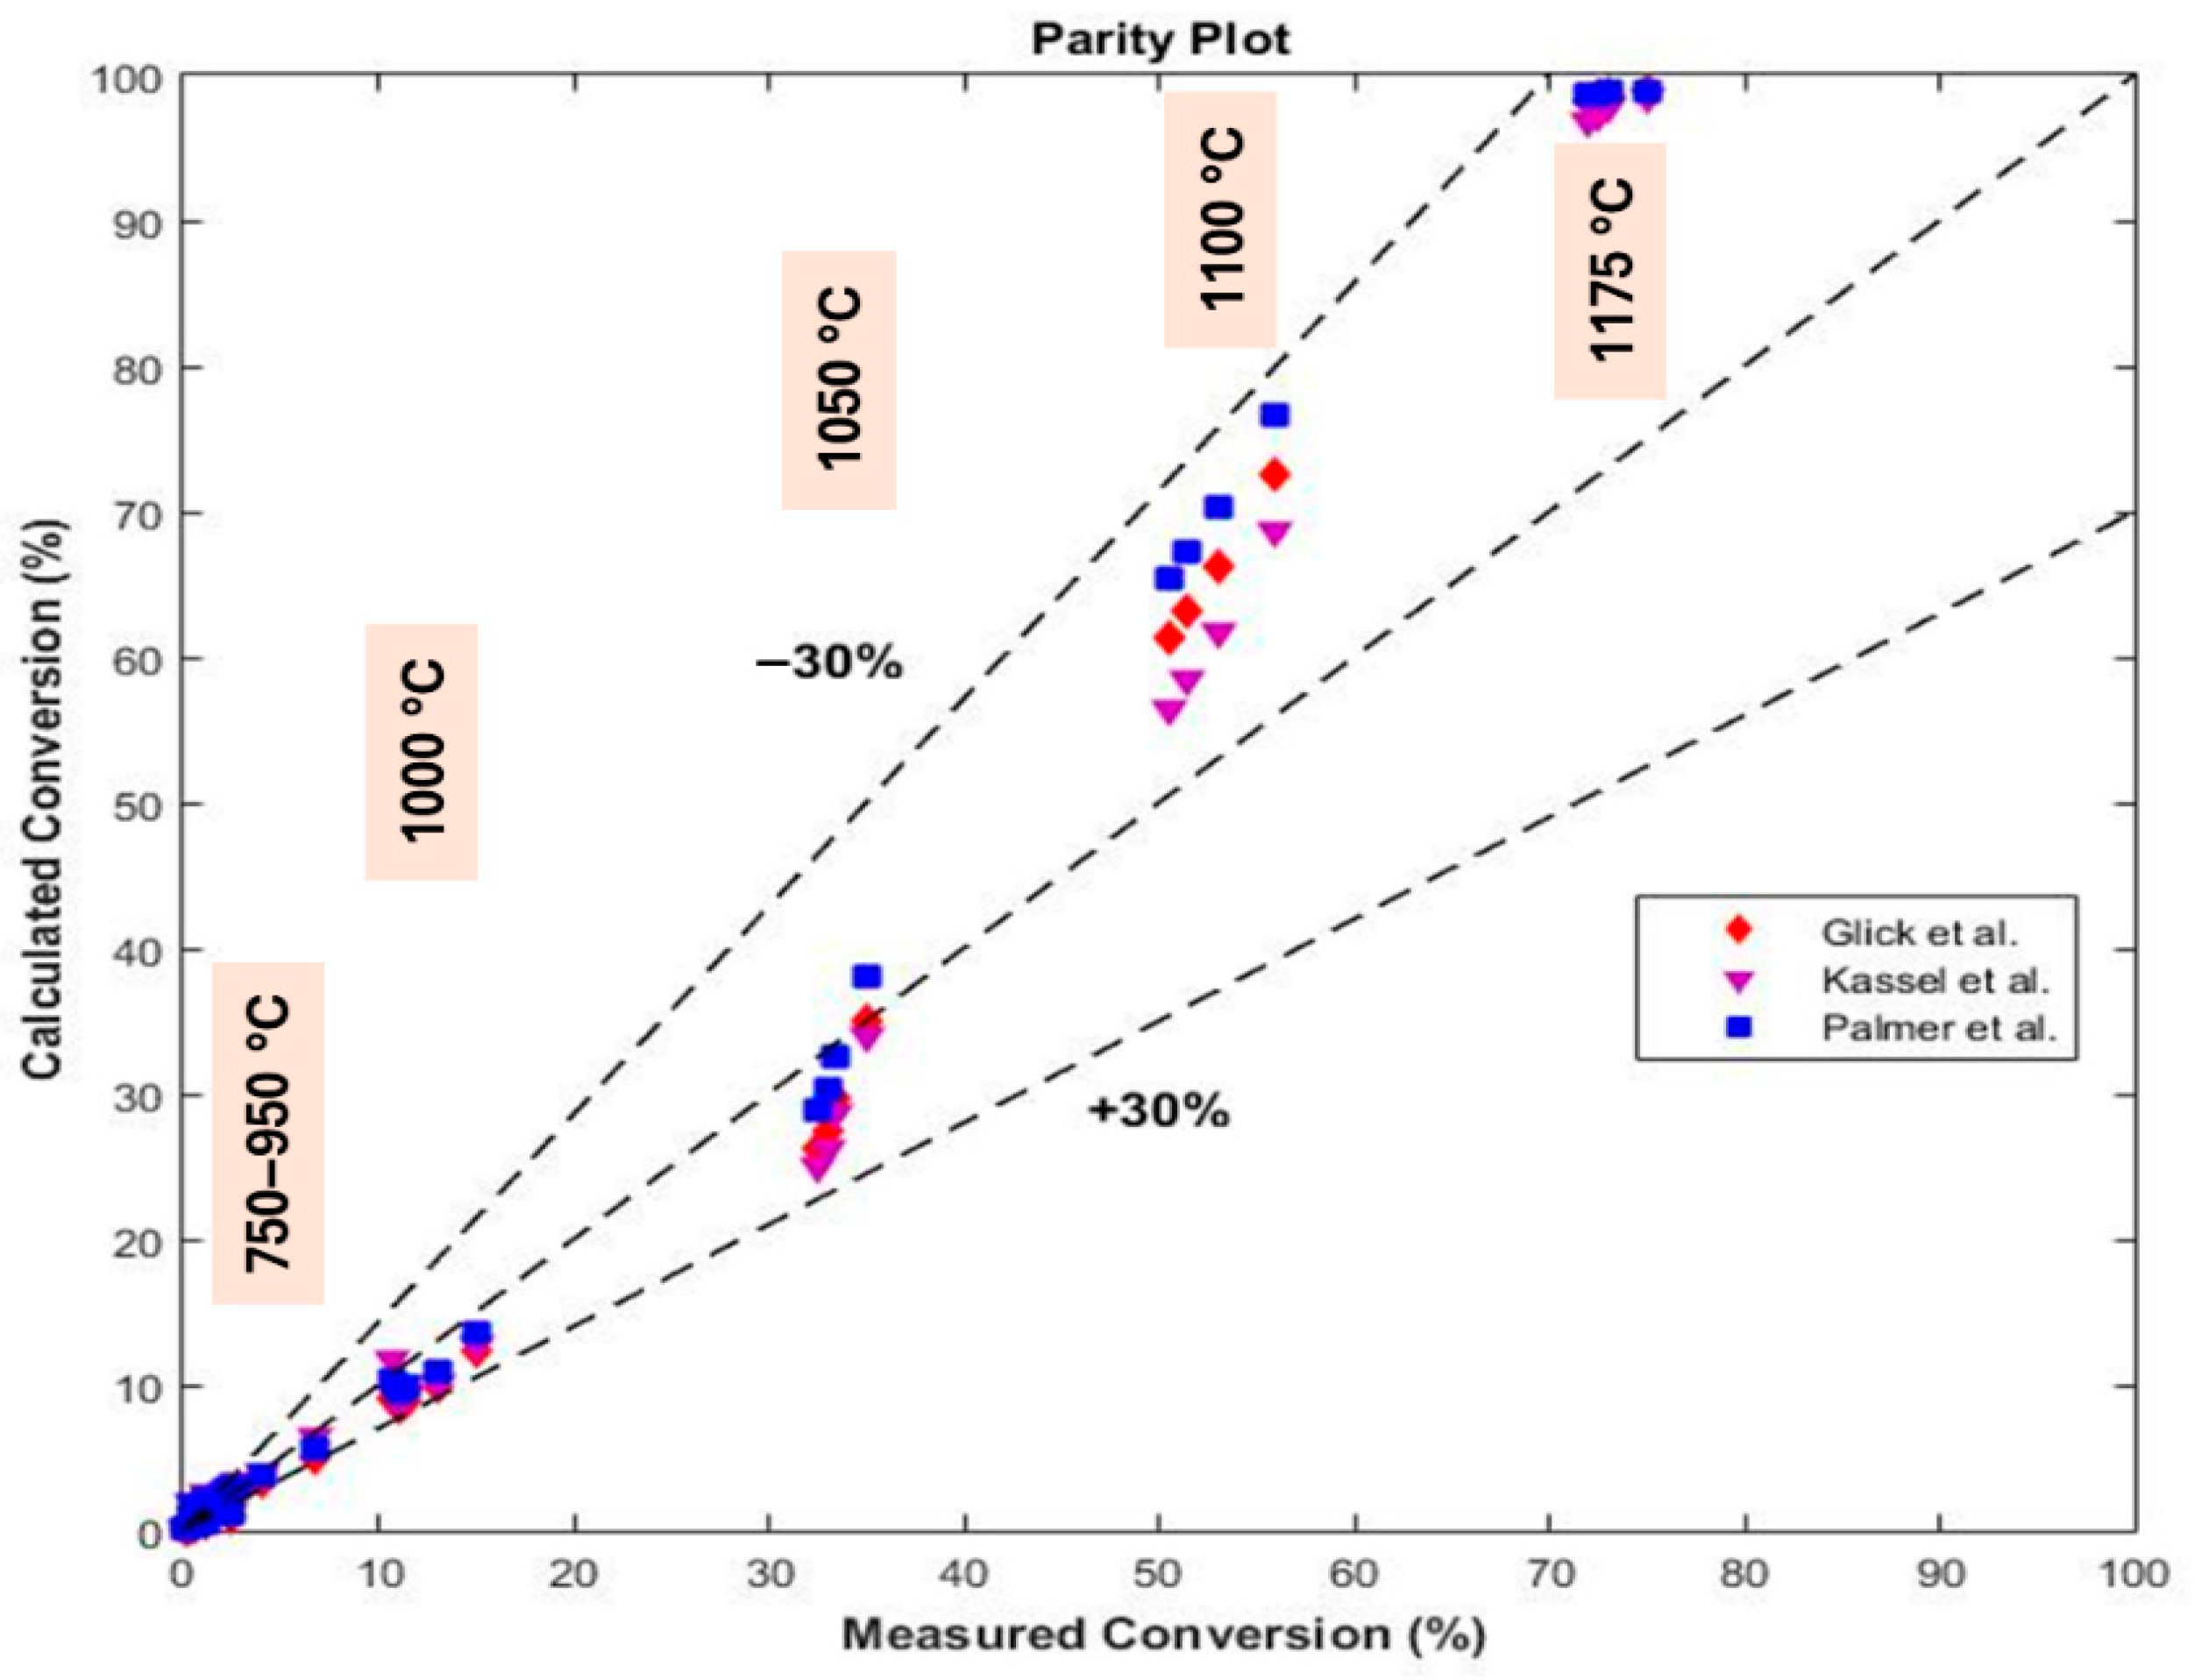
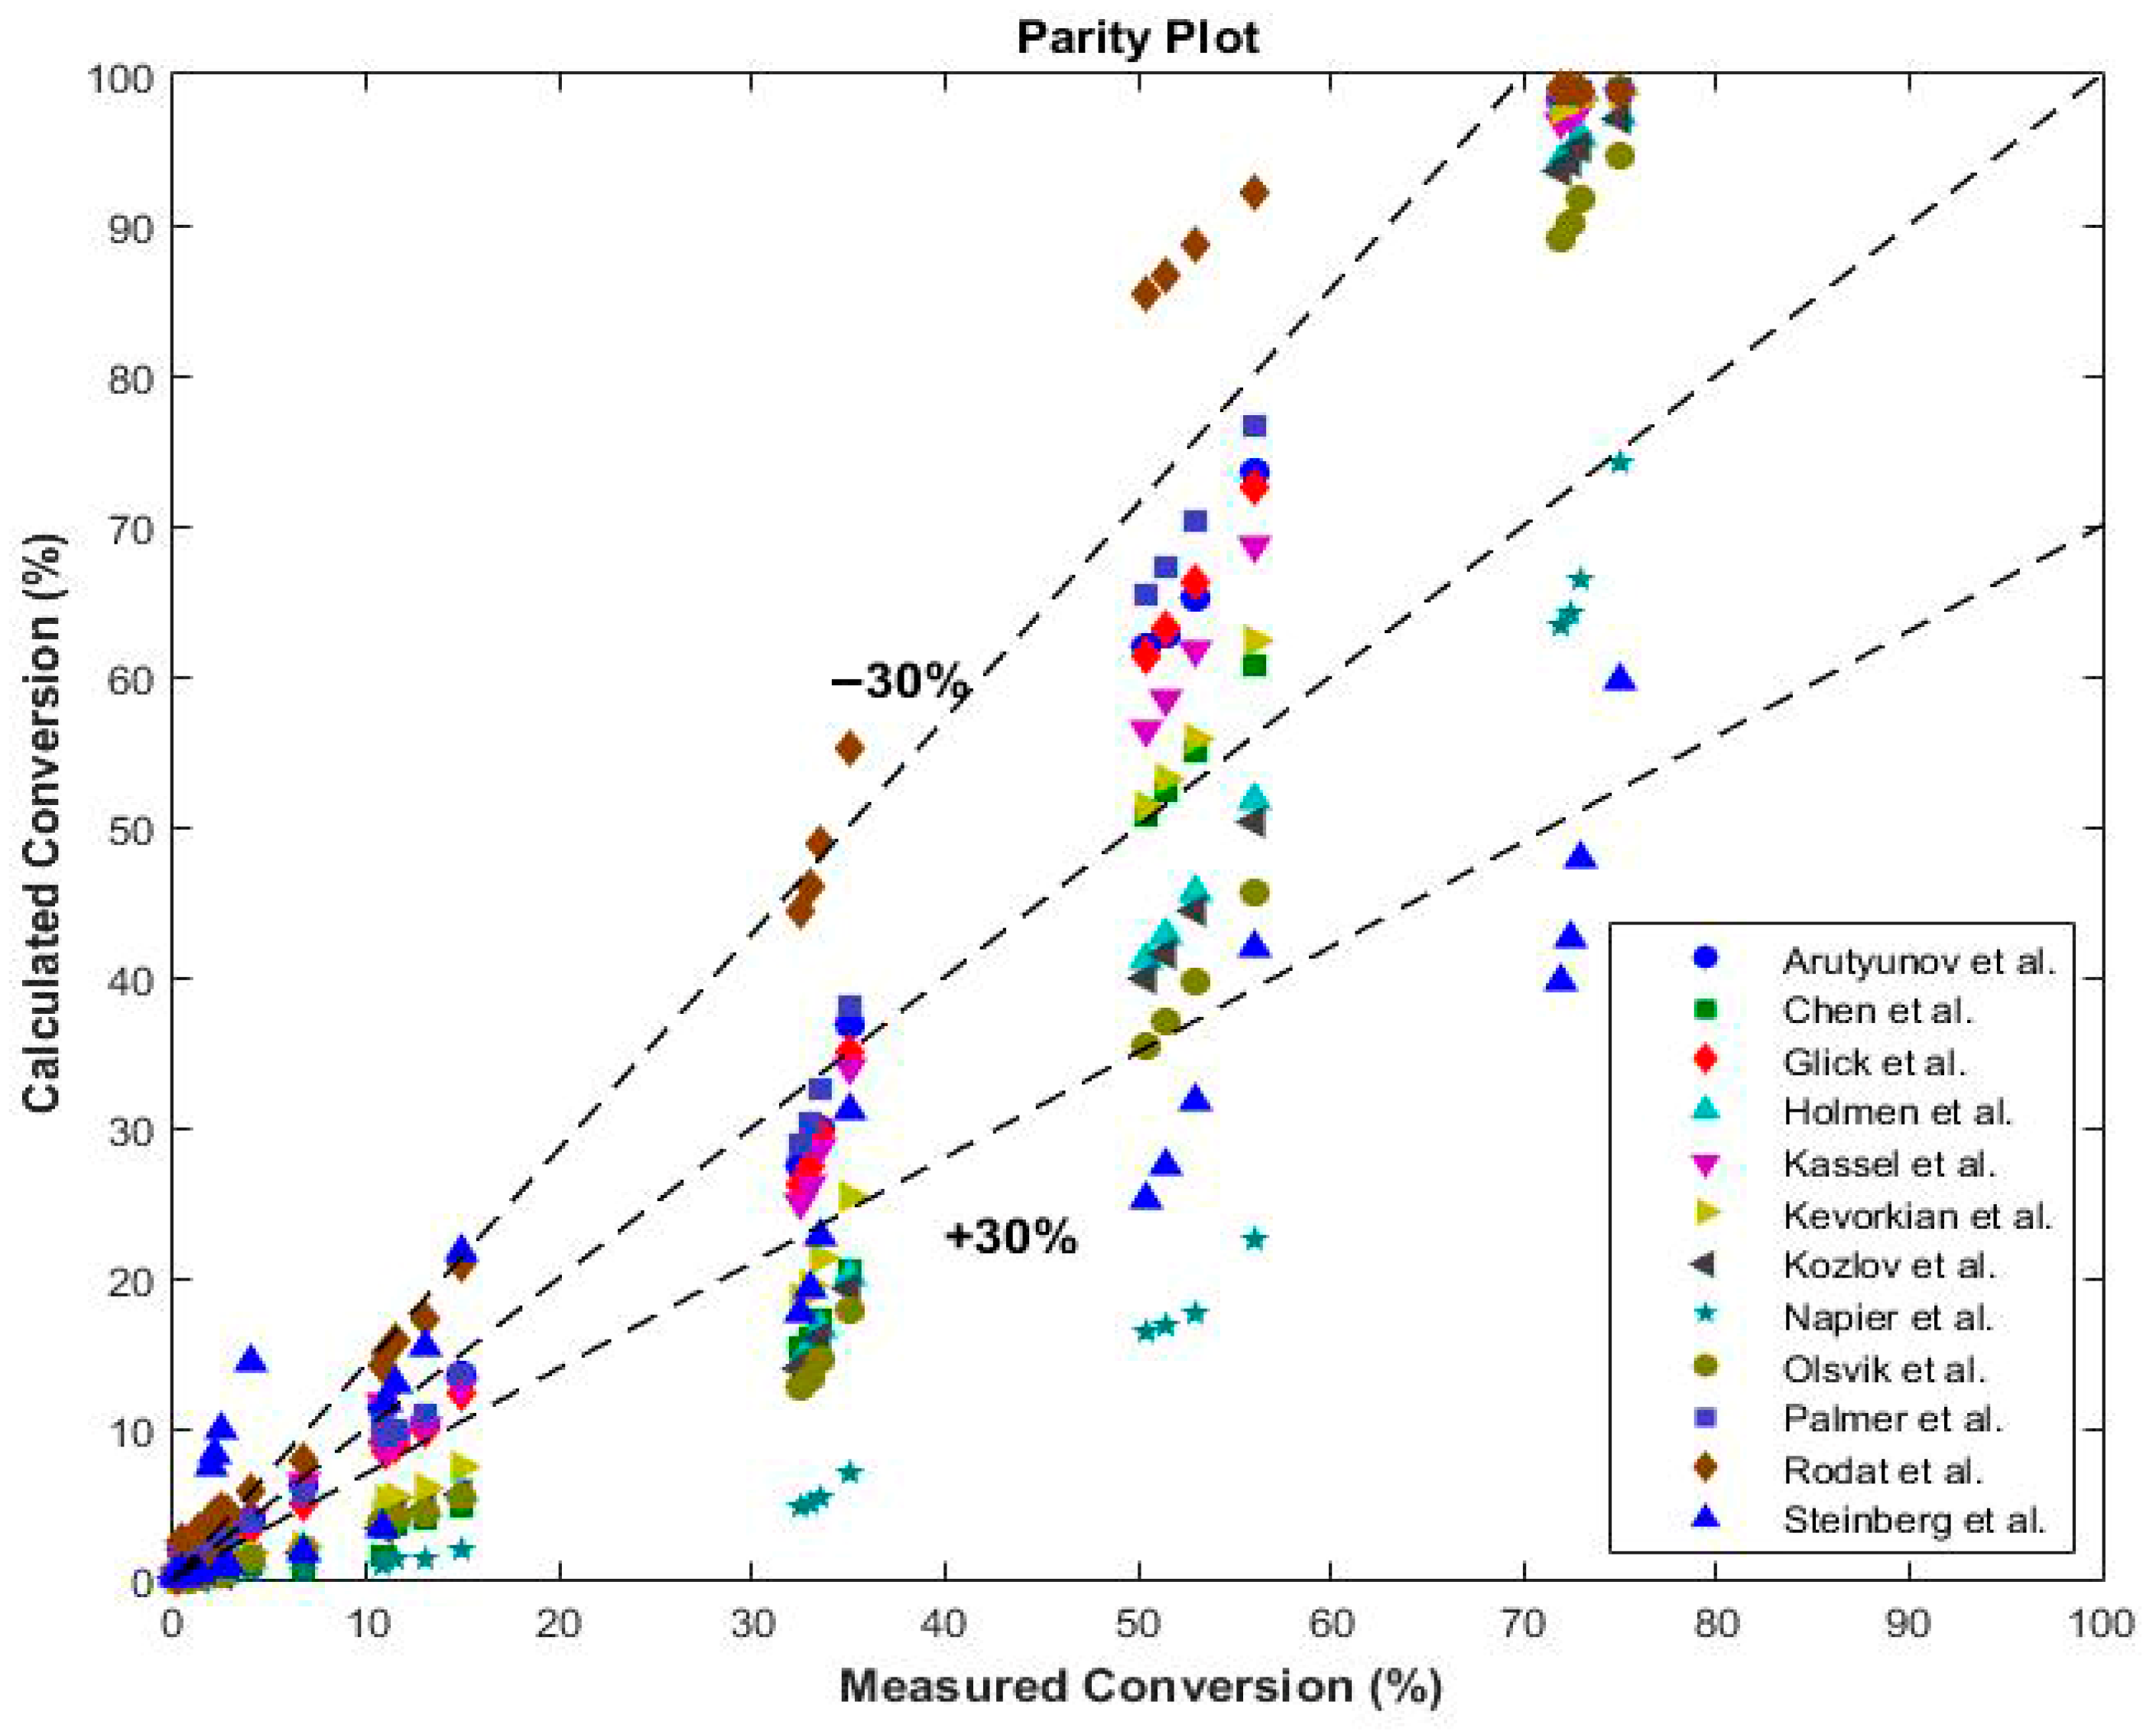
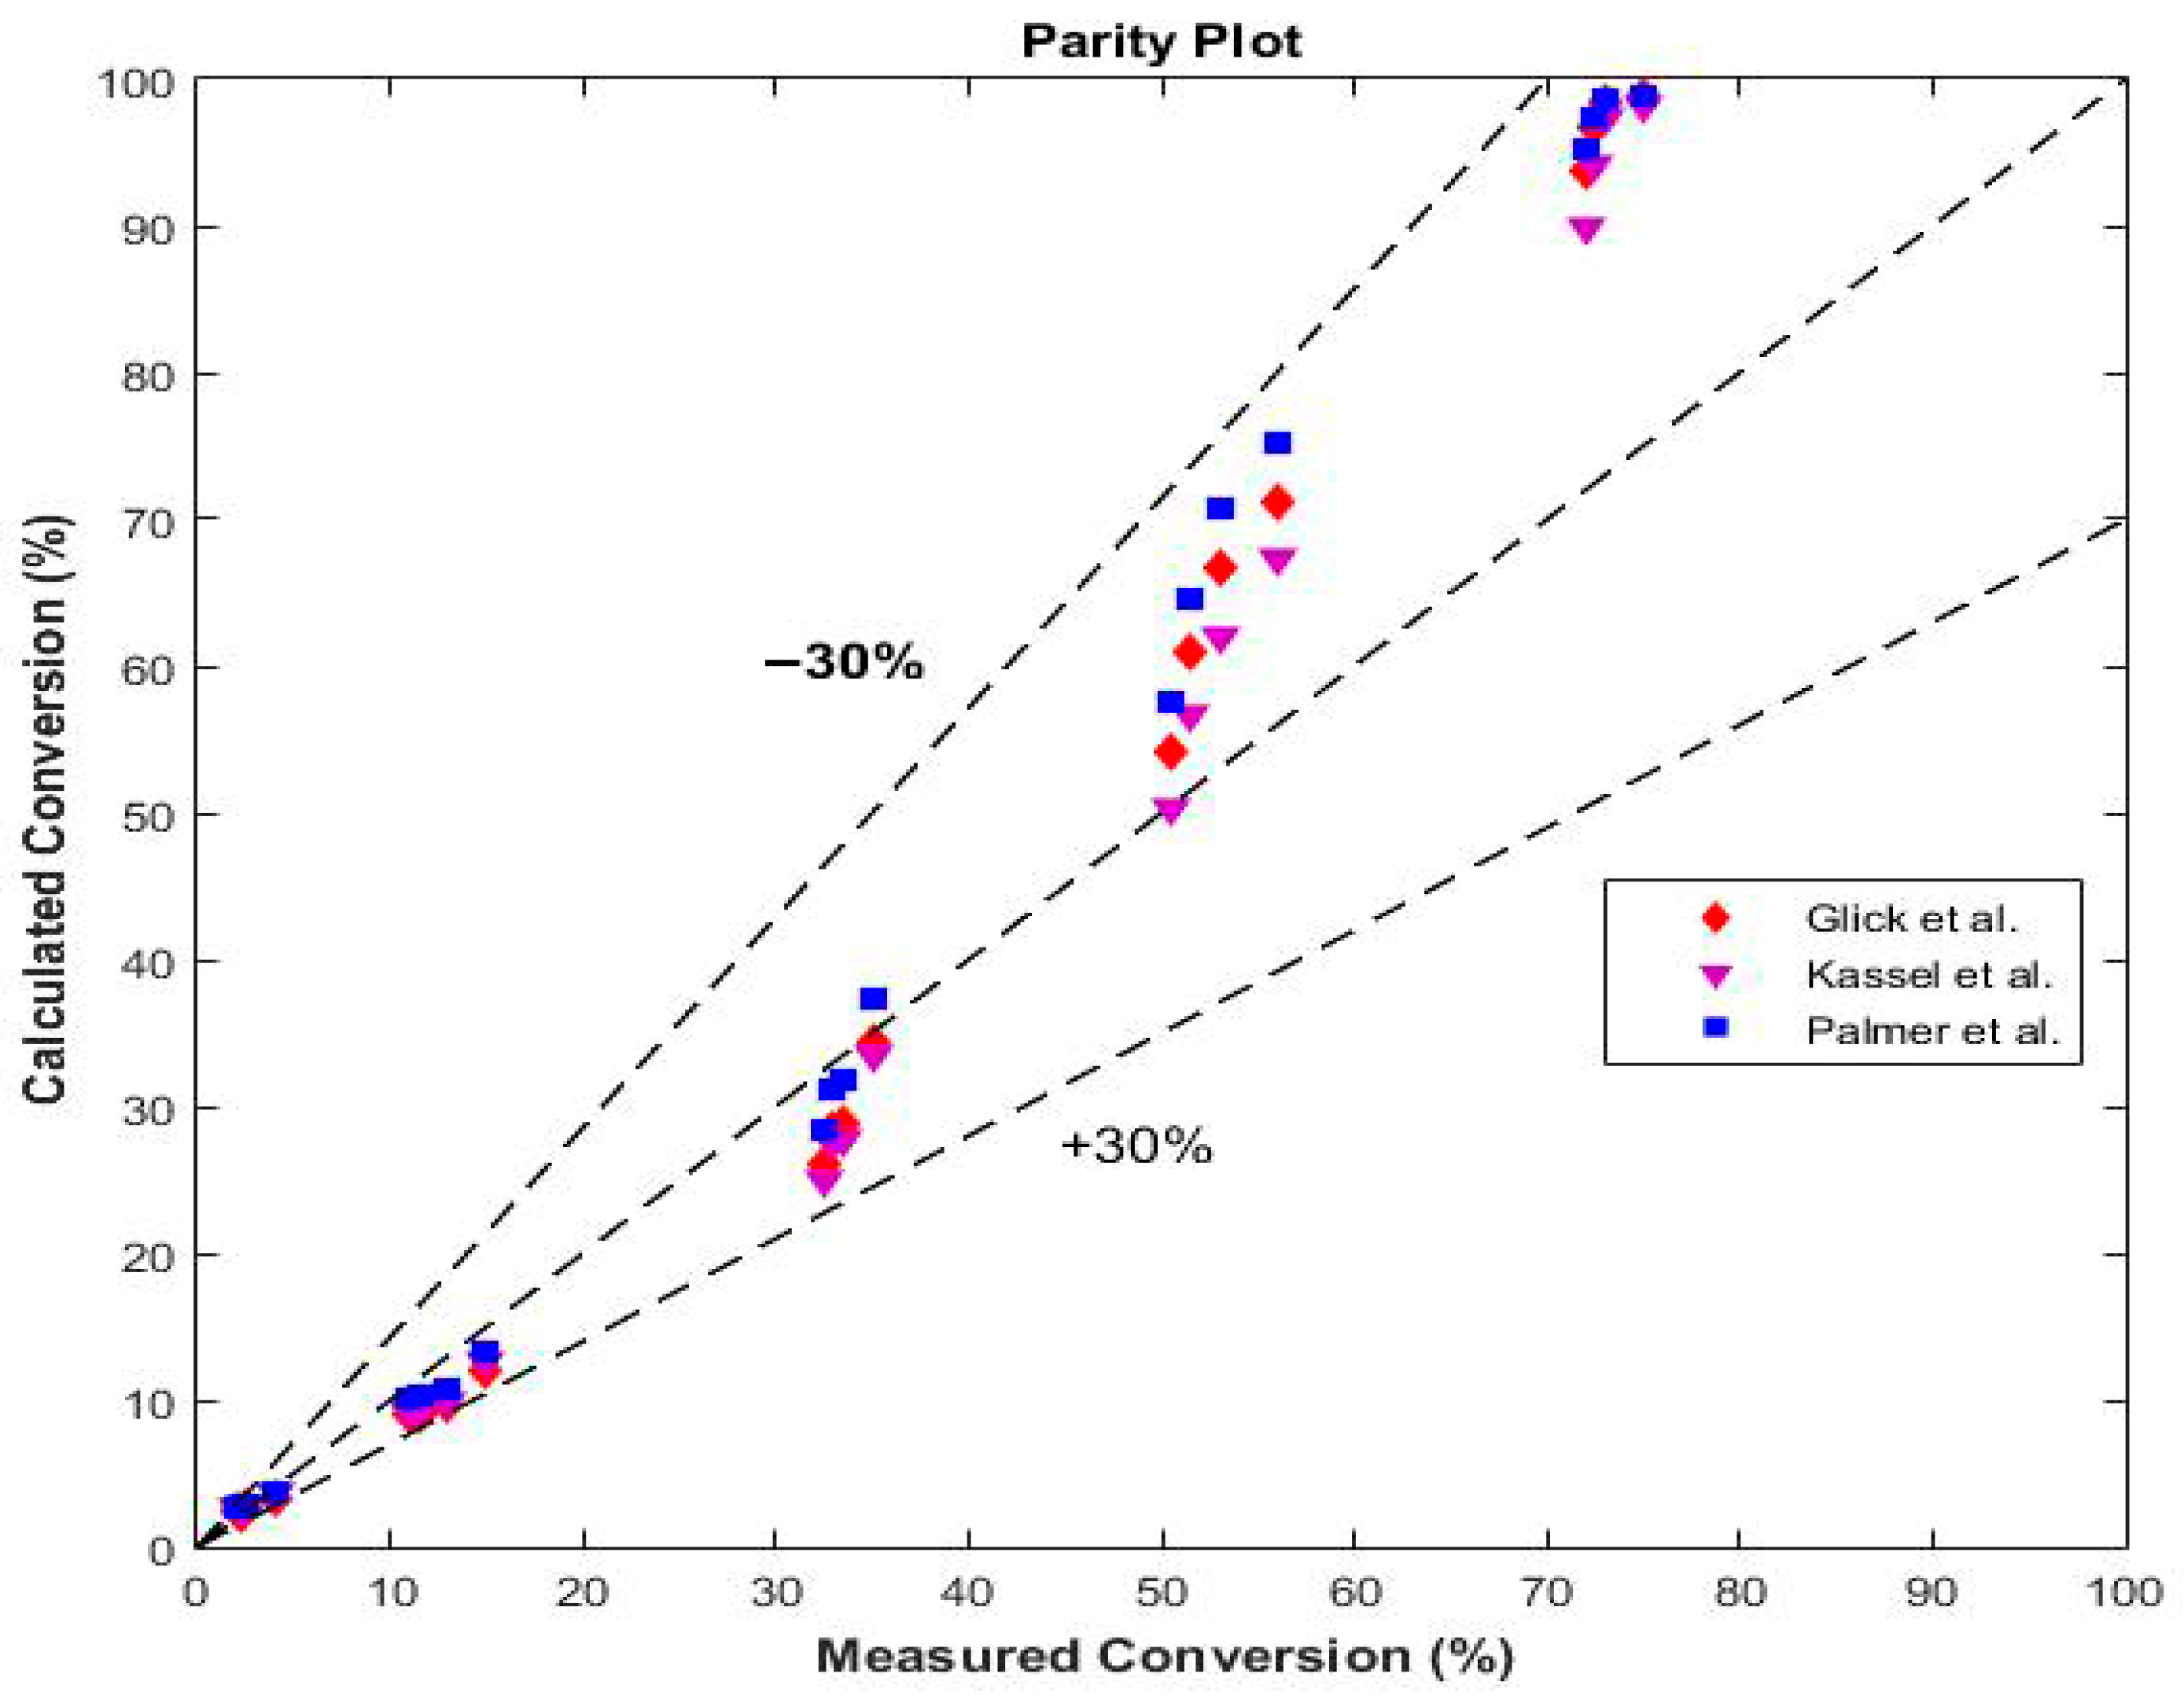
In this section, we compare the experimental data from Geißler et al. [28] and M. Plevan et al. [6] with the model predictions, which are presented as parity plots. Twelve kinetic models, summarized in Table A1 in Appendix A, were applied for this comparison. As both studies assumed operation under a homogeneous flow regime, we initially used our homogeneous model to fit the data. Parity plots illustrating the performance of all twelve kinetic models are included in the Appendix B, while Figure 5 presents the results of the three best-fitting models for clarity.
As shown in Figure 5, three kinetic models—those of Kassel et al. [43], Glick et al. [42], and Palmer et al. [31]—achieved a fitting accuracy within 30%. It is noteworthy that the models by Kassel et al. [43] and Palmer et al. [31] were developed by using experimental data from tubular reactors, whereas Glick et al.’s model was derived from shock tube experiments, which minimize the catalytic effects from carbon black formation and wall interactions. Statistical analysis reveals that the Kassel et al. [43] model provides the best fit for the experimental datasets and was therefore selected for further modeling. This model was also developed and validated across a broader temperature range, enhancing its applicability. The statistical analysis of the model of Kassel et al. shows an R-squared value of 0.872, indicating that 87.2% of the variance in the experimental data is explained by the model. The typical error between the measured and predicted conversion rates is around 9.2%, demonstrating moderate deviations between the model and the experimental values.
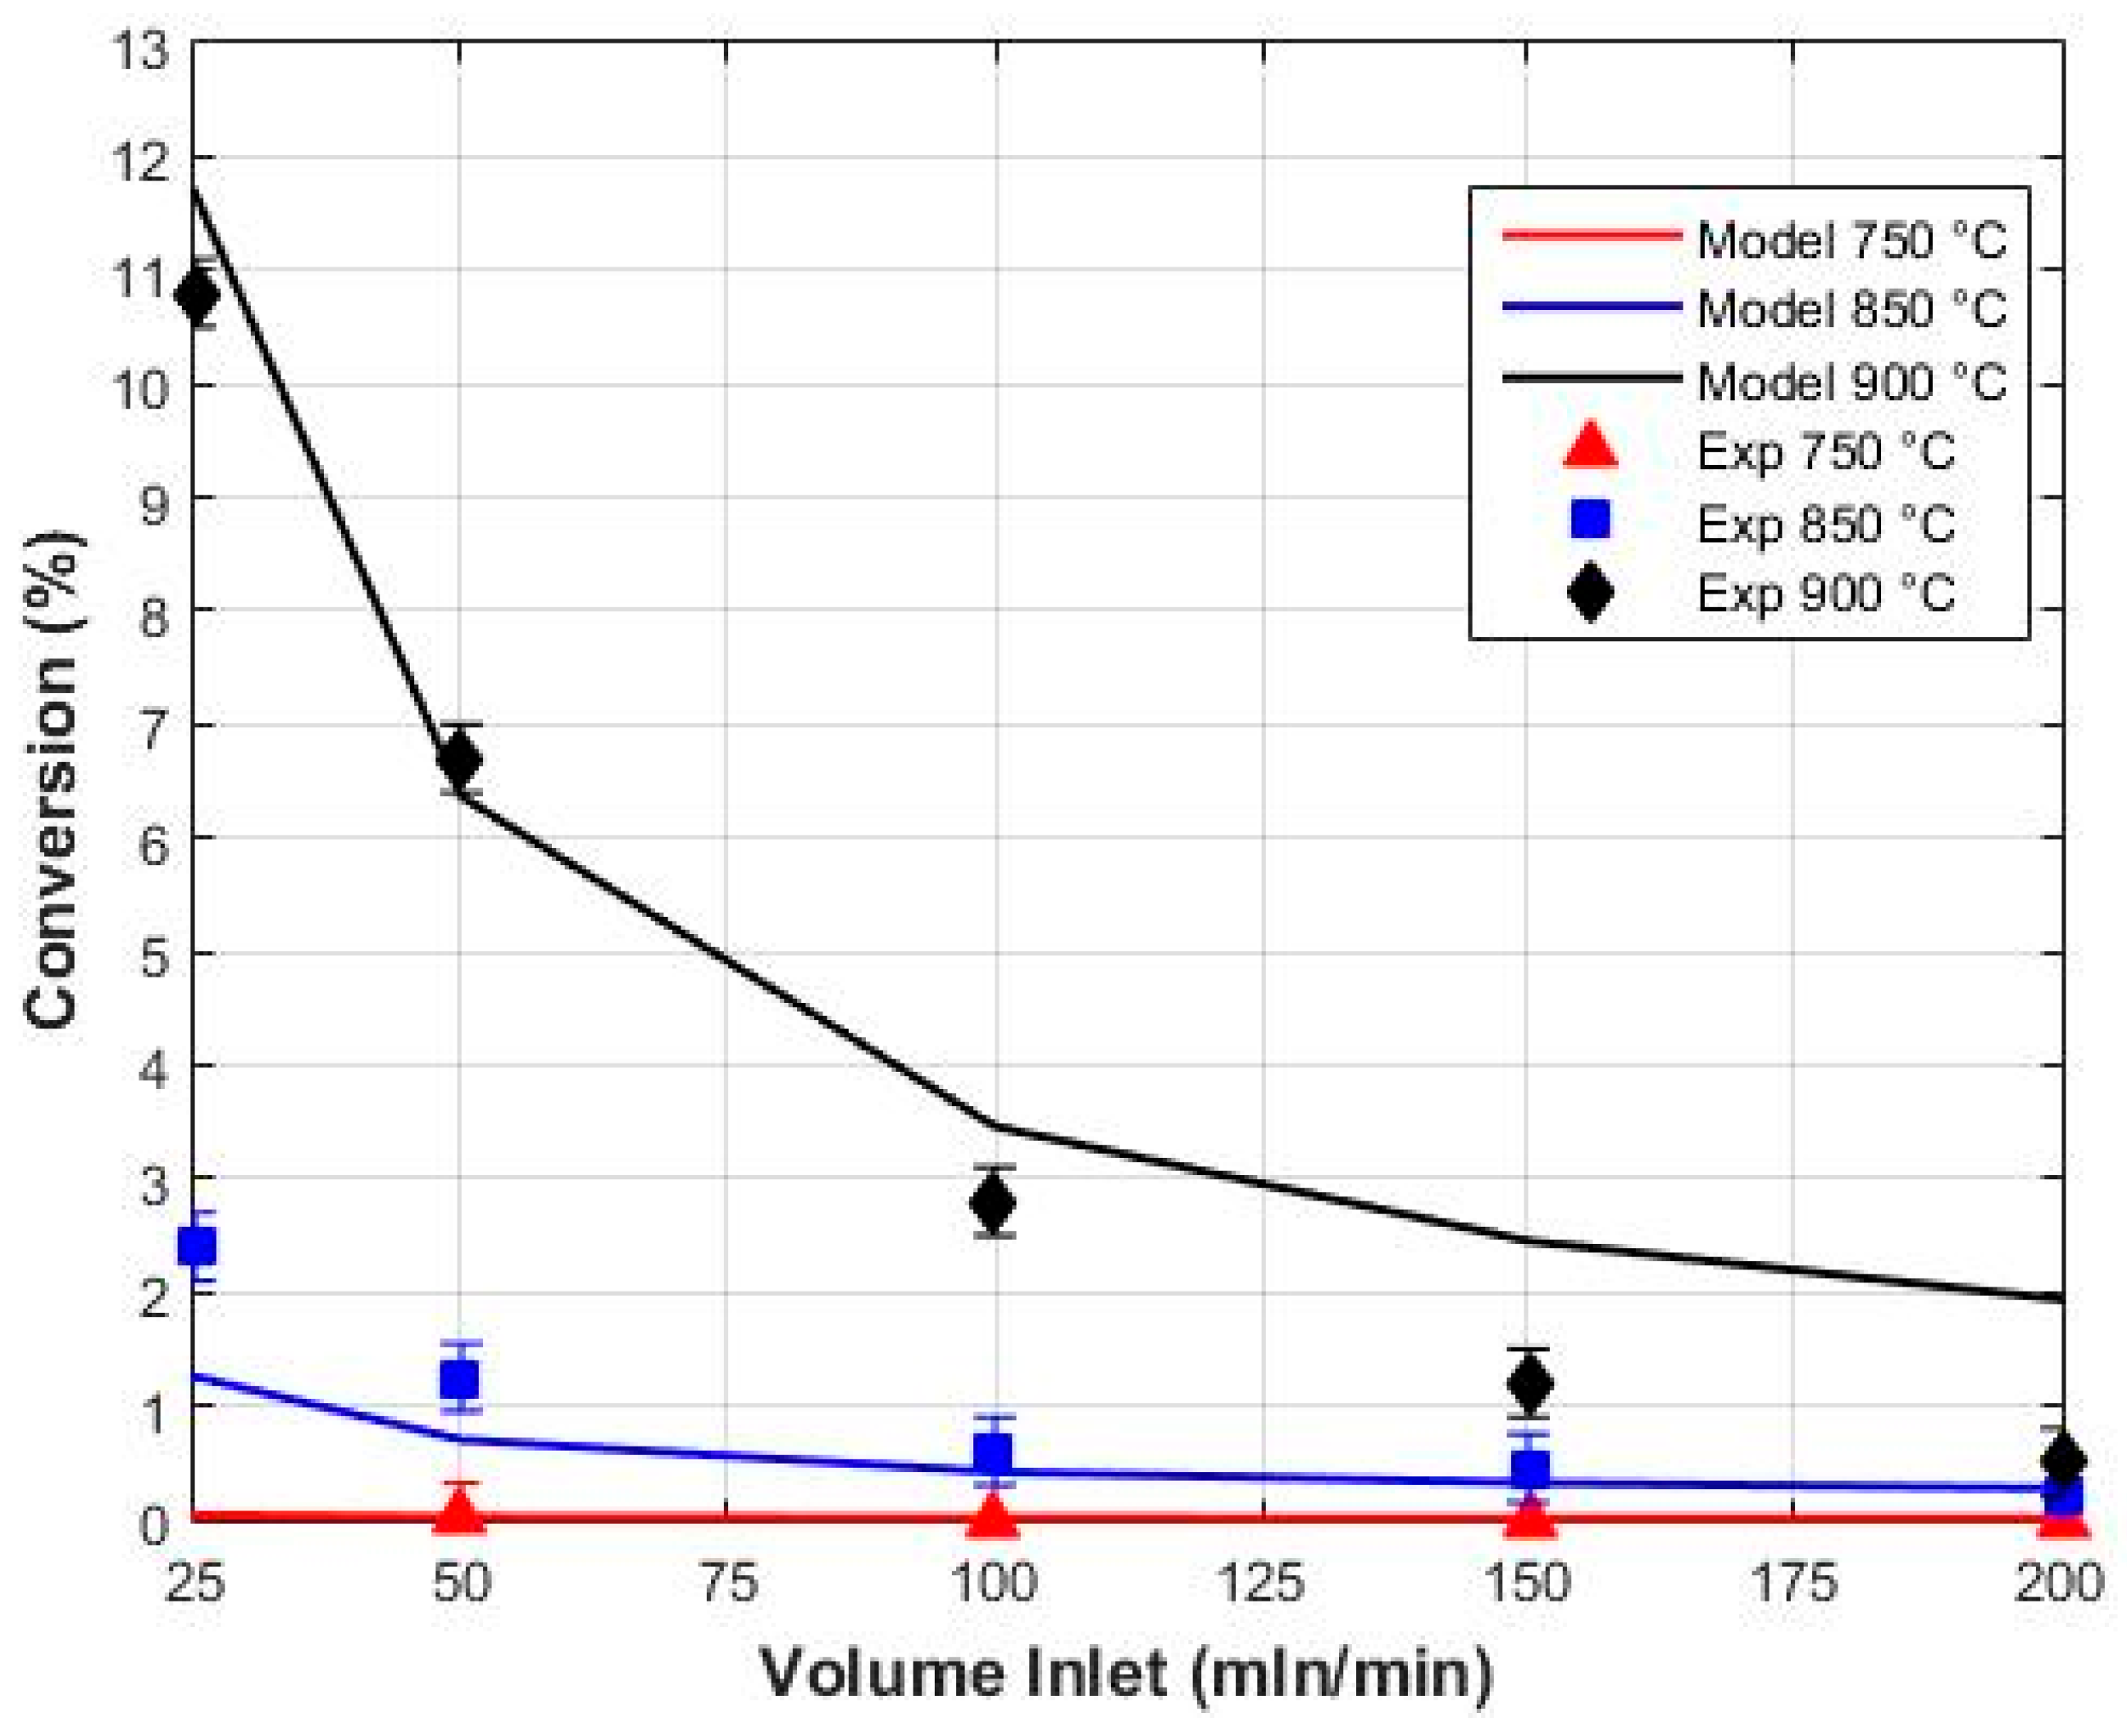
For a more detailed analysis, additional plots comparing the experimental and model-predicted data are provided, showing the relationship between conversion and volumetric flow rate. Figure 6 illustrates the fitting of the experimental data from M. Plevan et al. [6], who conducted experiments at lower temperatures with liquid tin levels of 0.6 m at 900 °C and 1 m at lower temperatures. The application of the kinetic model of Kassel et al. [43] captures the qualitative dependency of conversion on the flow rate and temperature quite well, although the model tends to slightly overpredict conversion at higher temperatures.
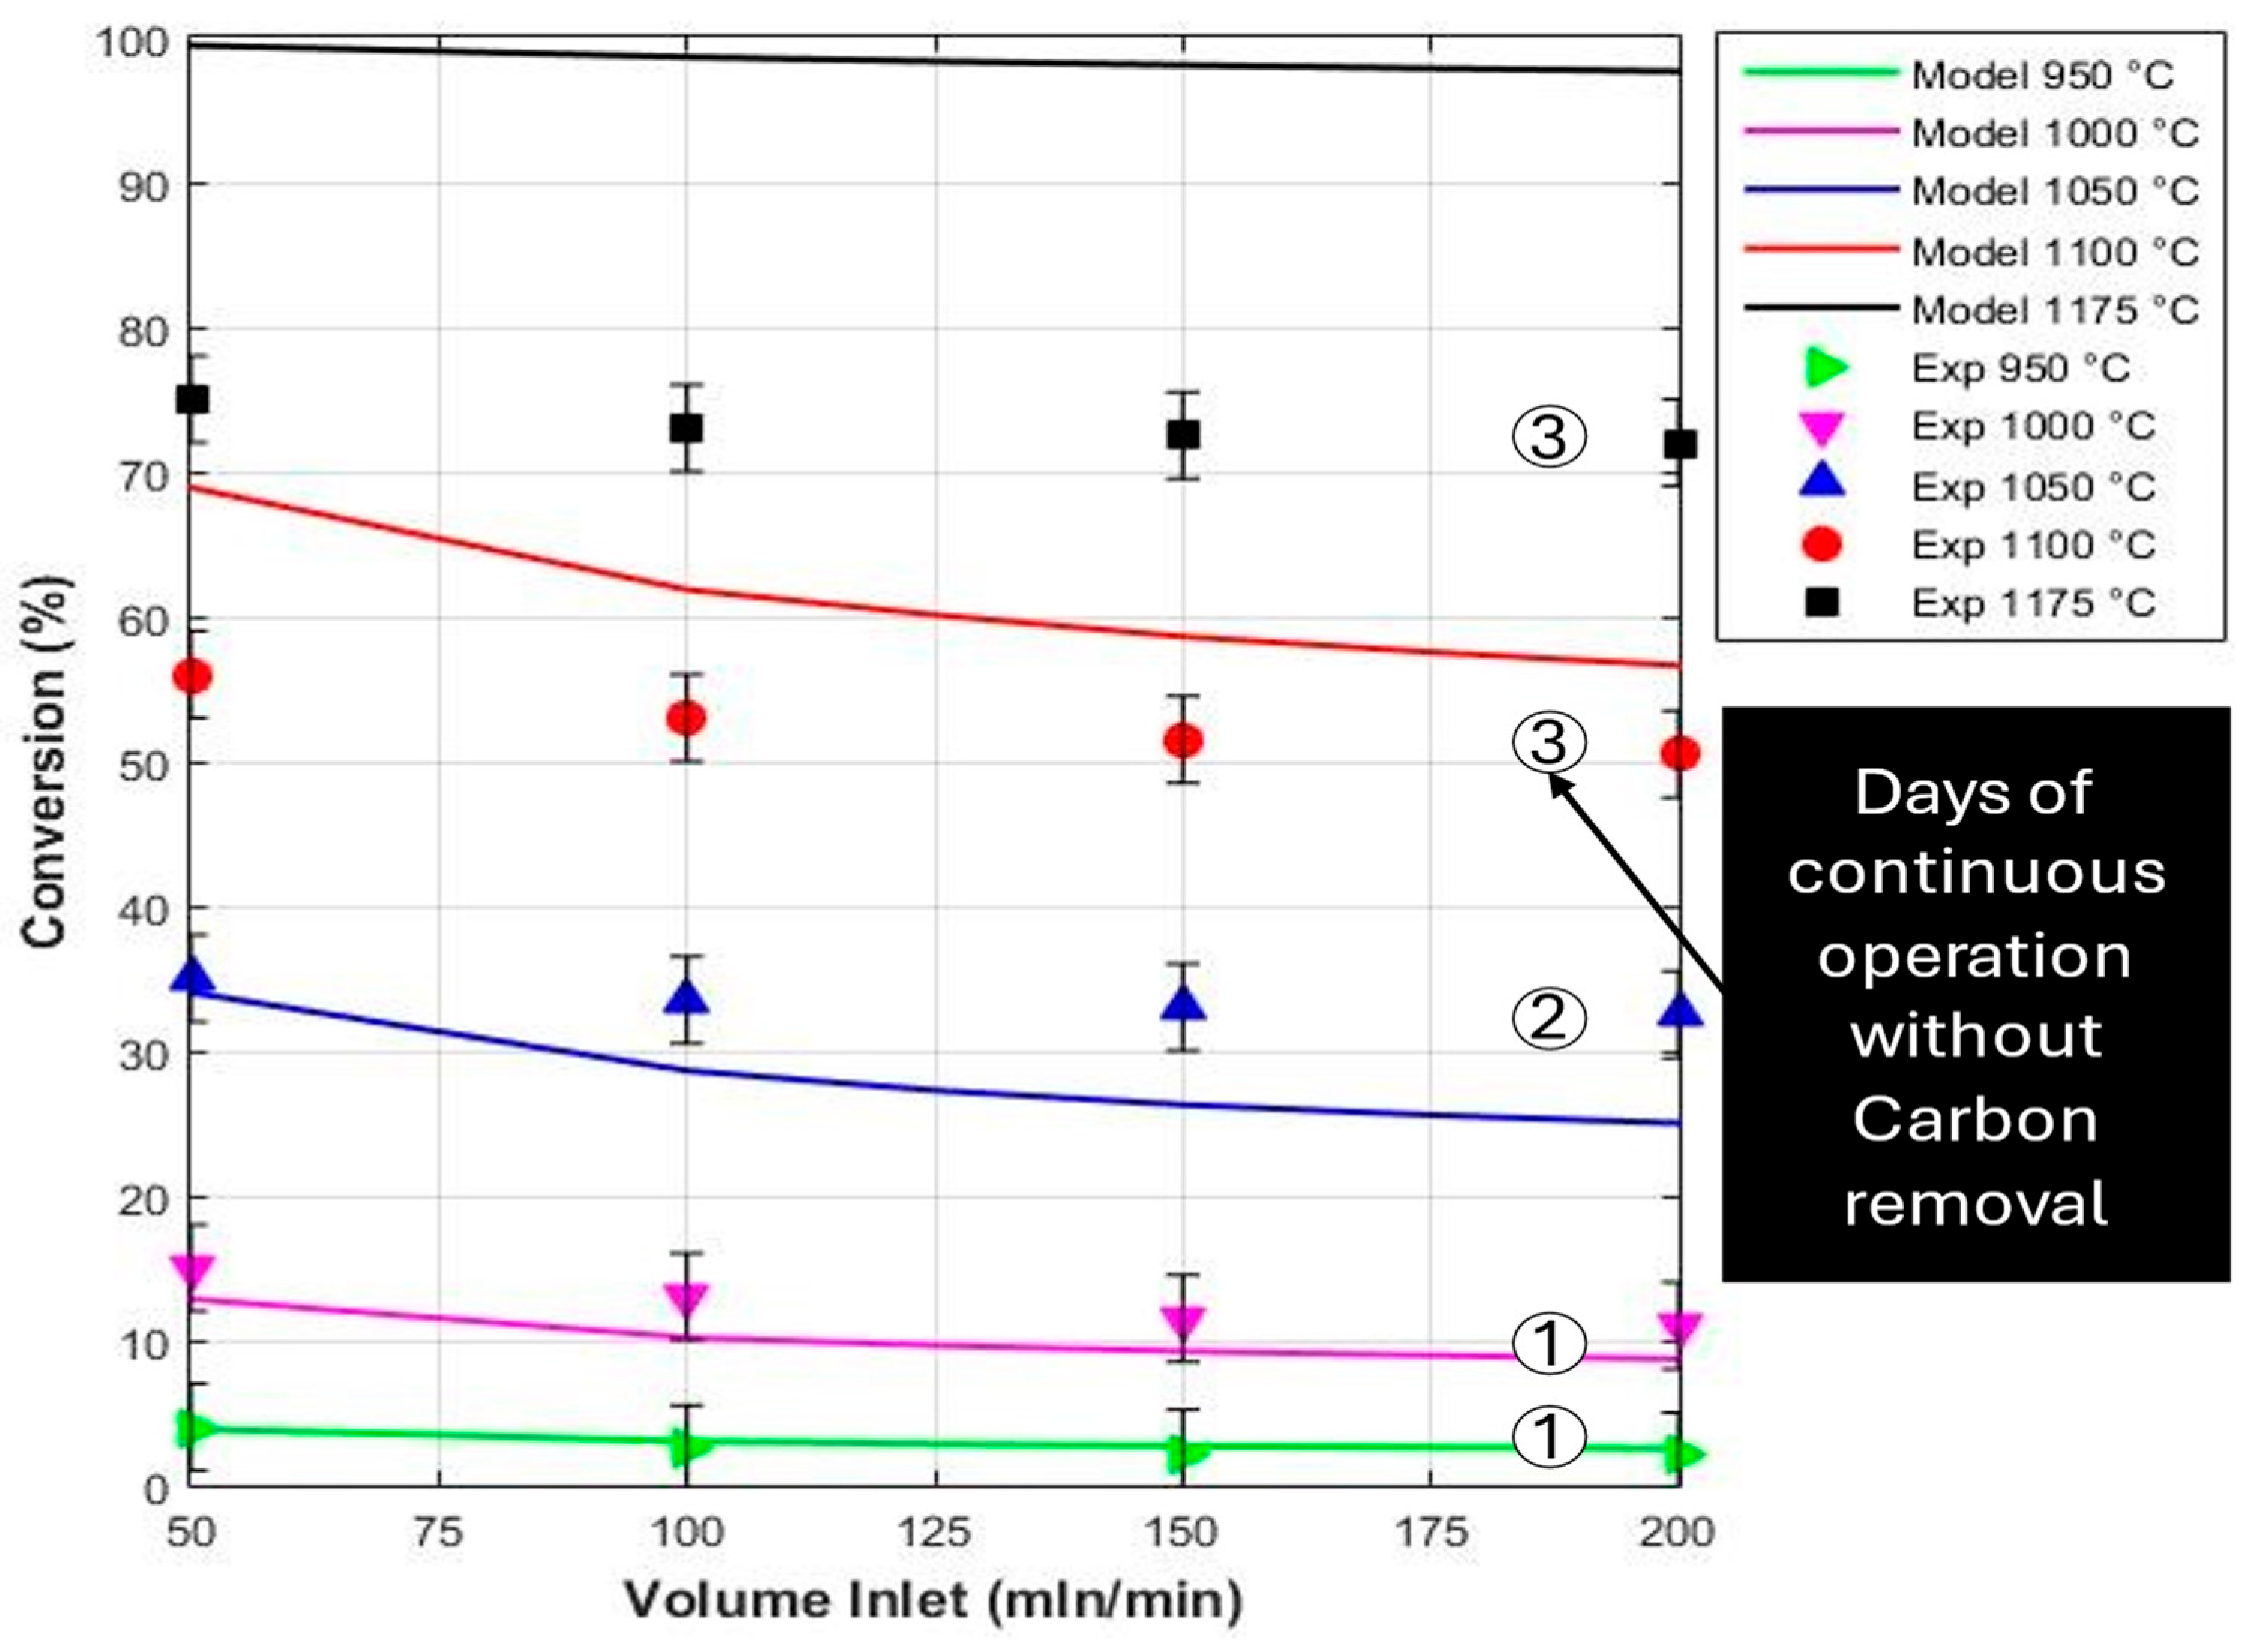
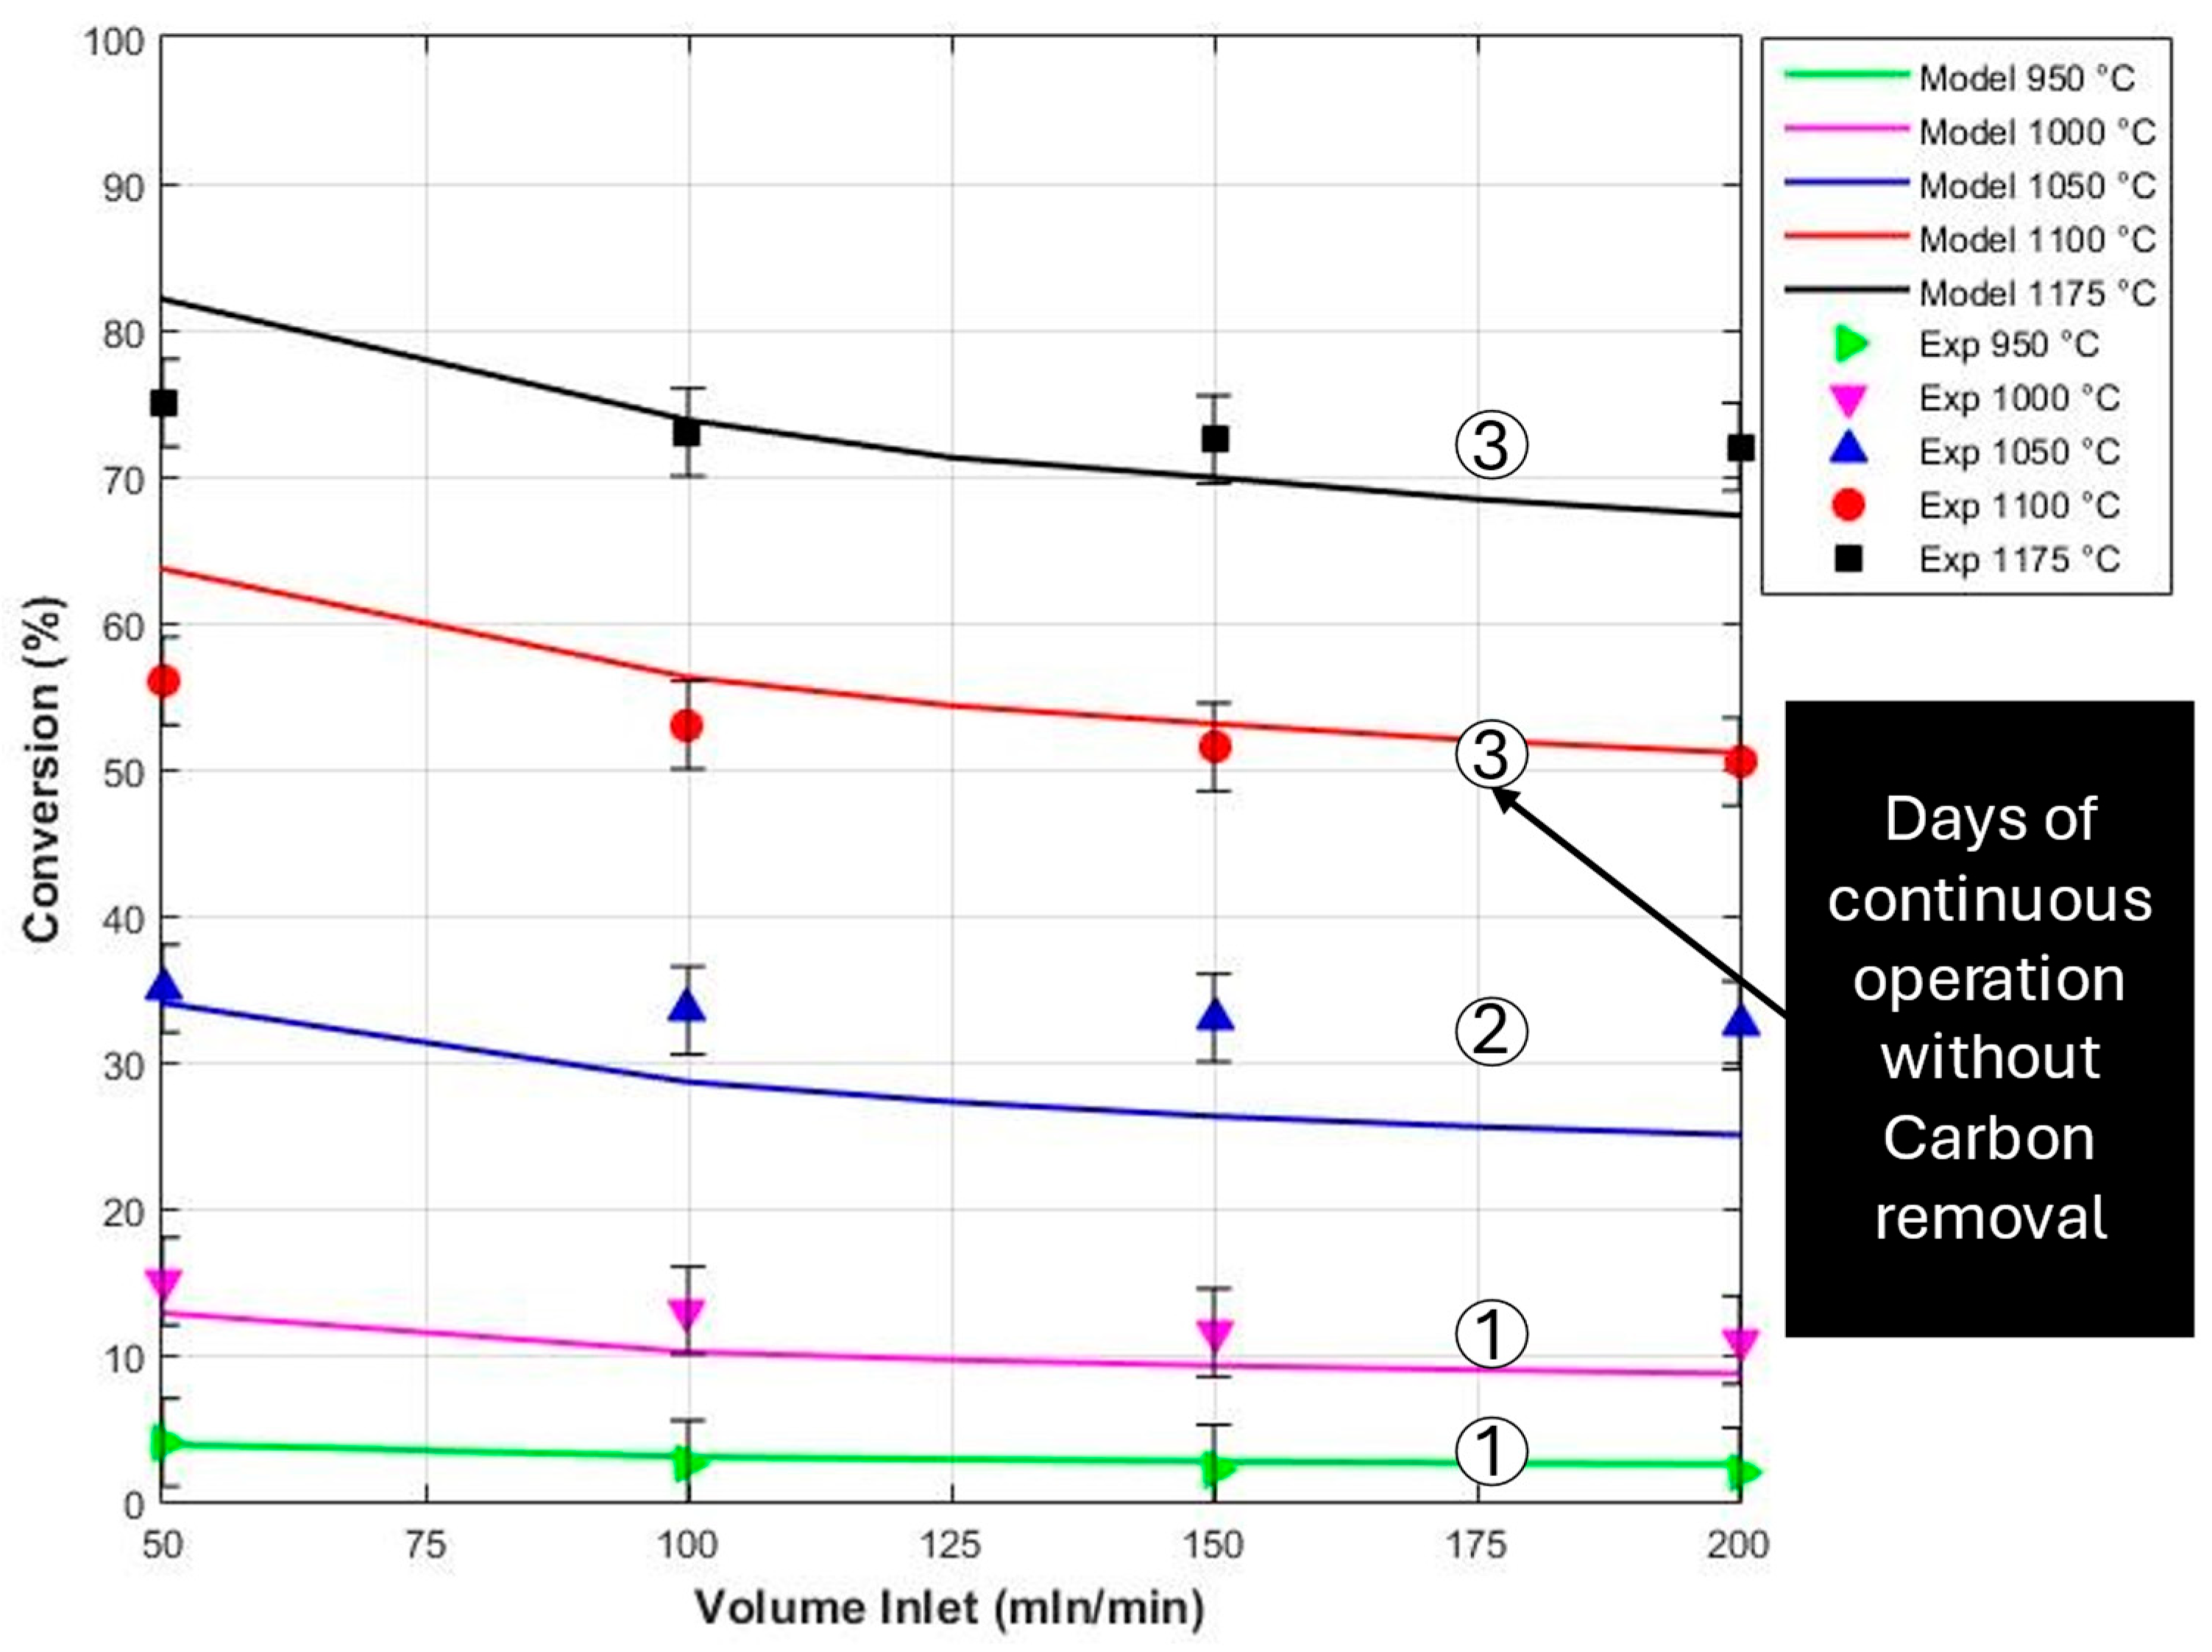
The comparison of experimental data from Geißler et al. [28] is presented in Figure 7, which depicts the conversion as a function of the volumetric flow rate. Given that these experiments were conducted in continuous mode without carbon black removal, the number of operational days is also indicated on the plot. As the number of operational days increases, more carbon black is expected to accumulate at the surface of the molten bath. The impact of carbon black on methane conversion or decomposition in these systems remains insufficiently studied. Nevertheless, as seen in the plot, the Kassel et al. [43] model provides a reasonable fit of up to 1095 °C, though most kinetic models, including Kassel et al. [43], tend to overpredict conversion at higher temperatures.
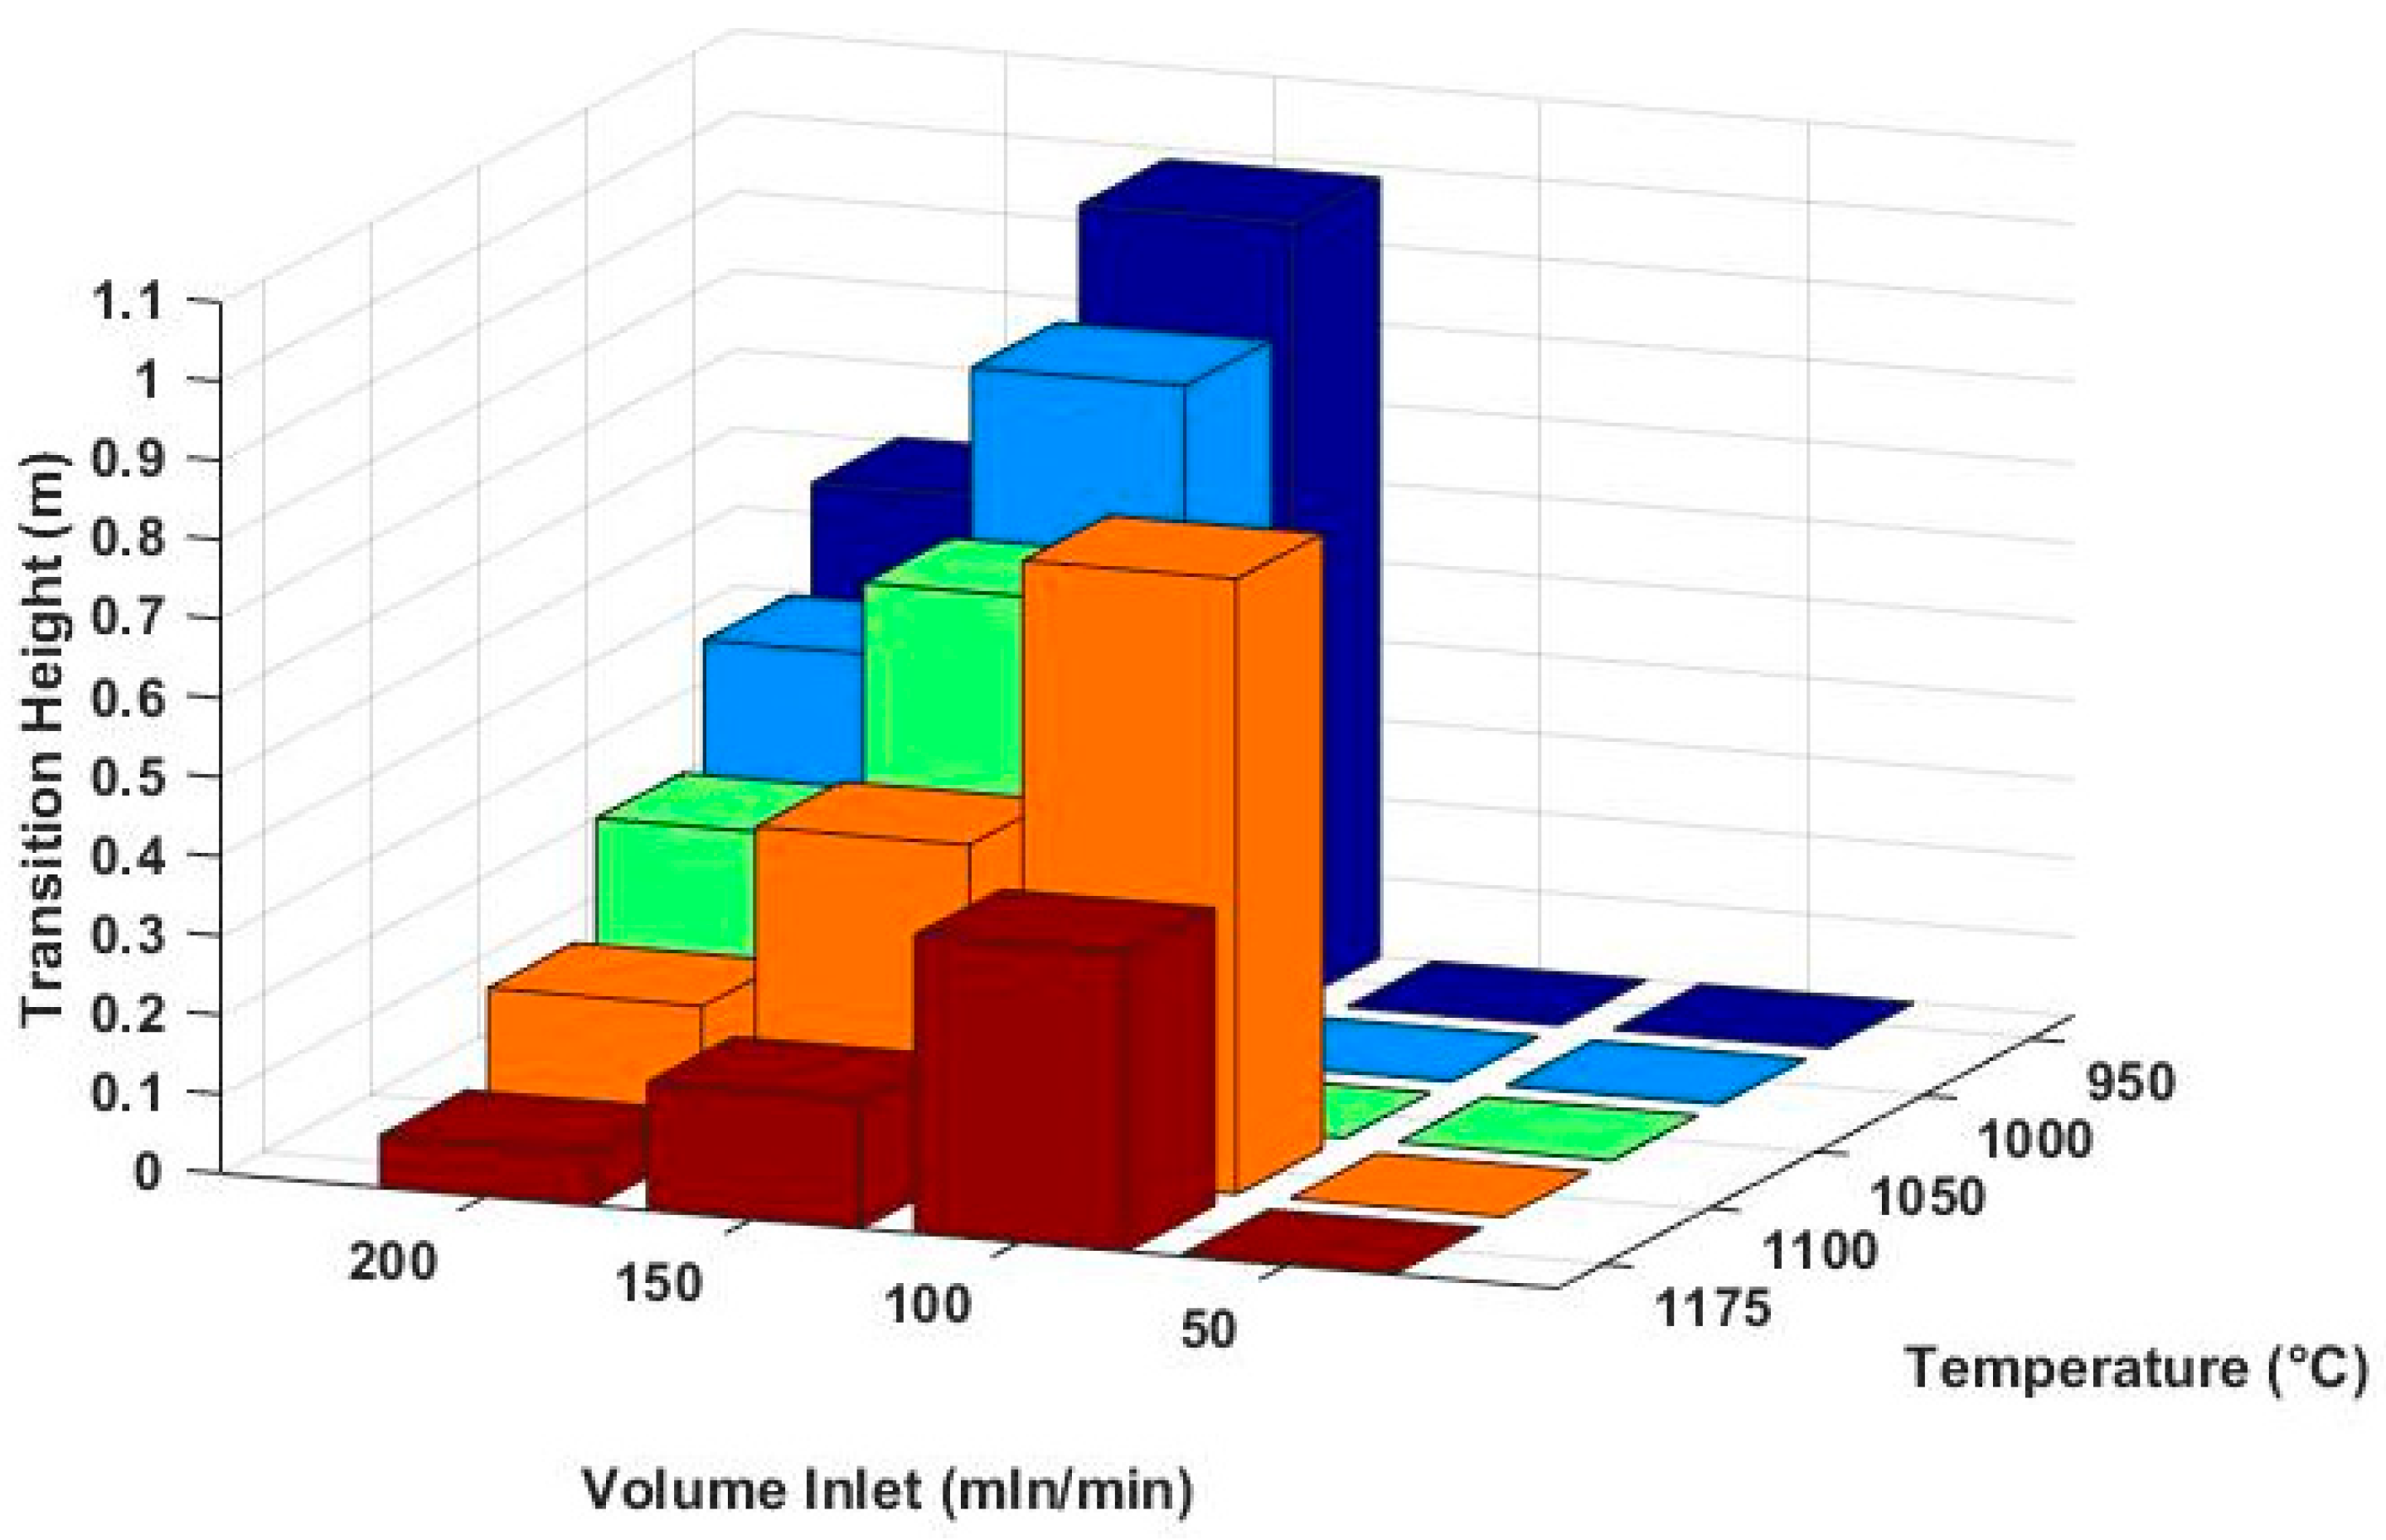
To address the overprediction of conversion at elevated temperatures, we further examined the flow regimes in the experimental studies mentioned earlier. As discussed in earlier sections, our study developed a model that was capable of describing both homogeneous and heterogeneous flow regimes, with a particular emphasis on molten metal systems. The transition between these regimes, especially from homogeneous to heterogeneous, is not extensively covered in the existing literature, particularly for modeling methane pyrolysis in molten metals. Our approach aimed to fill this gap by applying a compound model to the experimental data, despite prior assumptions of homogeneous flow in these studies. Upon applying the model, we found that a heterogeneous flow regime could emerge along the reactor, even when the initial flow appeared to be bubbly and homogeneous. Figure 8 presents a 3D bar plot illustrating the transition height, defined as the point where the superficial gas velocity exceeds the transitional threshold, plotted against the operating temperature and inlet volumetric flow rate. A transition height greater than zero signifies the onset of flow regime heterogeneity. According to our model and the applied correlations, the transition occurs earlier at higher temperatures and greater inlet flow rates, whereas no transition is predicted at a flow rate of 50 mln min−1.
The results indicate that the development of a heterogeneous flow regime can occur even at relatively low flow rates, due to the distinct properties of molten metal. This challenges the common assumption that low flow rates correspond to a homogeneous regime during methane pyrolysis in molten metal bubble columns. While the equations for the heterogeneous flow regime were originally derived from water/hydrocarbon systems, they may potentially provide a reasonable qualitative description of molten metal systems, as the correlations are largely dependent on system-specific properties. Experimental analysis of molten metals in the heterogeneous regime is needed to refine Krishna et al.’s correlation [39] and improve model accuracy. Despite the scarcity of experimental data on bubble size during methane pyrolysis in molten tin systems, similar trends were observed in studies by Geißler et al. [28] and Kudinov et al. [44]. When simulating the conditions from Kudinov et al.’s [44] study, our predictions aligned closely with their experimental data. Their study investigated heat transfer, hydrodynamics (including bubble size), and diffusion during methane flow through molten tin at 1000 °C, with gas supply rates from 25 to 250 mL min−1. At a flow rate of 50 mln min−1, our model predicts a homogeneous flow regime with bubble sizes of around 5 mm, which is consistent with Kudinov et al.’s [44] reported range of 3 to 5 mm. At higher flow rates (>100 mln min−1), our model predicts the onset of a heterogeneous flow regime and bubble sizes exceeding 20 mm, aligning with their findings.
However, these results only demonstrate that the chosen models can replicate small-scale experimental data and do not necessarily confirm their general validity across different molten metal systems. Further experimental validation is required to establish broader applicability.
To evaluate whether the transition in flow regime at higher flow rates and temperatures could explain the low experimental conversions reported by Geißler et al. [28], we applied our model to fit their experimental data. The results, shown in the parity plot (Figure A1 in Appendix B), indicate a slight improvement in the model fit. However, significant overprediction of conversion at high temperatures persists. This suggests that, although a transitional regime is likely present, its effect on overall conversion is limited, as it occurs over relatively short sections of the reactor. Modeling transitional flow regimes in molten metal systems is generally challenging, and, to our knowledge, no experimental study on molten metal systems in the literature describes this regime in detail. In the presented model, the transitional flow regime is represented as a combination of homogeneous and heterogeneous regimes. However, this approach cannot be definitively validated at the current stage and lies outside of the scope of our study. Nonetheless, the methodology provides qualitative insights into potential system behaviors. The developed model, which includes the kinetic model of Kassel et al. [43], predicts that high conversion rates can be achieved at elevated temperatures in both homogeneous and transitional/heterogeneous regimes. Therefore, our findings suggest that variations in flow regime under the observed experimental conditions have a relatively minor impact on overall conversion, with other factors likely contributing to the overpredictions observed at high temperatures.
We hypothesize that autocatalysis plays a key role in these discrepancies at high temperatures, since it was likely present in many of the experiments conducted for kinetic analysis by various authors. In molten metal bubble column reactors, we propose that the catalytic influence of carbon particles is diminished. In these systems, carbon particles predominantly accumulate at the melt surface and interact with each other and the molten tin, which may obstruct the active catalytic sites and reduce the available active carbon surface area. In contrast, in gas-phase reactors, high conversion rates often lead to the rapid formation of carbon layers on the reactor walls, which exhibit autocatalytic effects at elevated temperatures. Despite this, the occurrence of autocatalysis in bubble column reactors cannot be definitively ruled out. Minor autocatalytic contributions may arise from carbon particles floating in the molten metal that come into contact with methane bubbles. Additionally, a gas phase exists above the molten metal, which facilitates interactions between gas-phase species and carbon particles, especially when there is a high concentration of unreacted methane, primarily at lower temperatures and high flow rates. In laboratory-scale systems, it is often difficult to ensure that this gas phase section is sufficiently cooled to quench the reaction. Therefore, considerable conversion may occur in that section. Consequently, catalyzed reactions may continue in the gas phase, resulting in pronounced autocatalytic effects. However, the extent and practical relevance of these phenomena are uncertain. Further laboratory analysis is required to understand the role of autocatalysis in molten metal systems and its implications for the technology.
Together with the aforementioned reactor-specific effects, the systematic overprediction of methane conversion by the Kassel correlation at elevated temperatures can be explained by the origin and validity range of the underlying kinetics. Kassel’s rate expression was derived from static quartz–reactor experiments conducted at moderate temperatures, with the mechanistic model mainly supported by data in the range of approximately 700–850 °C. The applicable temperature range in Kassel’s original work is extended only by a limited initial-rate dataset of up to ~1113 °C and an extrapolation against the high-temperature literature data. While several authors have applied Kassel’s correlation at higher temperatures with good results, extrapolating global Arrhenius kinetics beyond their development range can introduce significant errors in predicted rates and conversions. Additionally, as mentioned above, the kinetics derived from static or tubular reactors may inherently “bake in” effects that are specific to the reactor, such as wall exposure and carbon deposition. These effects can introduce heterogeneous contributions, such as carbon-assisted autocatalysis, which are difficult to isolate experimentally and are expected to intensify at elevated temperatures. In molten-metal bubble columns, where no stable catalytic wall layer is formed and carbon accumulates primarily at the melt surface, these effects are significantly reduced, providing a plausible explanation for why Kassel’s kinetics (and many other kinetic models) begin to systematically overpredict conversion at higher temperatures in our validation.
It is notable that Napier’s model [45] is the only one that consistently predicts conversion rates at elevated temperatures, aligning with findings from the study of Farmer et al. [22], who identified Napier’s model [45] as being particularly suitable for real gas-phase reactions with the absence of the influence of carbon black. In contrast to tubular and static reactor studies, Napier’s correlation is based on shock-tube experiments conducted at much higher temperatures (1477–2427 °C) and extremely short residence times, which are intended to minimize the wall effects and coke formation and thereby limit carbon-assisted autocatalysis. Consequently, Napier’s model better represents intrinsic high-temperature gas-phase behavior and avoids the systematic positive bias observed for tubular/static-reactor-derived correlations at the highest temperatures. At lower temperatures, however, Napier’s model tends to underpredict conversion, consistent with its high-temperature origin and the possibility that carbon-related autocatalytic effects may still influence molten-metal systems, even if reduced.
Therefore, we conclude that for temperatures below 1095 (±5) °C, the kinetic model of Kassel et al. provide reliable data fitting, while for higher temperatures, where industrial implementation is technically challenging, Napier’s kinetic model [45] offers the best fit.
The data fitting results presented in Figure 9 show the dependency of conversion on the volumetric flow rate for both experimental and model-predicted data.
Overall, with the given model approach, the experimental data are fitted with an accuracy of approximately 30%. Possible reasons for the discrepancies between the simulation results and experimental data may include experimental errors in temperature measurement, the approximation of temperature profiles using polynomials, the effect of carbon black deposition (increased carbon on subsequent days), variations in operating pressure, and/or inaccuracies in the hydrodynamic and kinetic models. As a result, no single kinetic model was found to be valid across all temperature ranges.
These findings highlight the importance of accounting for both homogeneous and heterogeneous flow regimes when modeling conversion in molten metal systems, as well as the potential impact of autocatalysis in explaining conversion overpredictions. Future experimental work is crucial to validate these findings and to further elucidate the complex interactions occurring within the molten metal bubble columns.

4. Sensitivity Analysis

Due to the lack of sufficient experimental data, direct validation of the heterogeneous flow model was not feasible. However, a comprehensive sensitivity analysis was conducted, using the developed model to identify the key operational parameters influencing methane conversion in molten tin bubble columns. This analysis is particularly relevant for the use of the given model in industrial applications, where the focus is on practical applicability rather than on achieving the highest level of accuracy. The goal was to determine how reactor dimensions and operating conditions affect methane conversion and to identify the optimal point of operation. This analysis is also critical for future scale-up efforts.
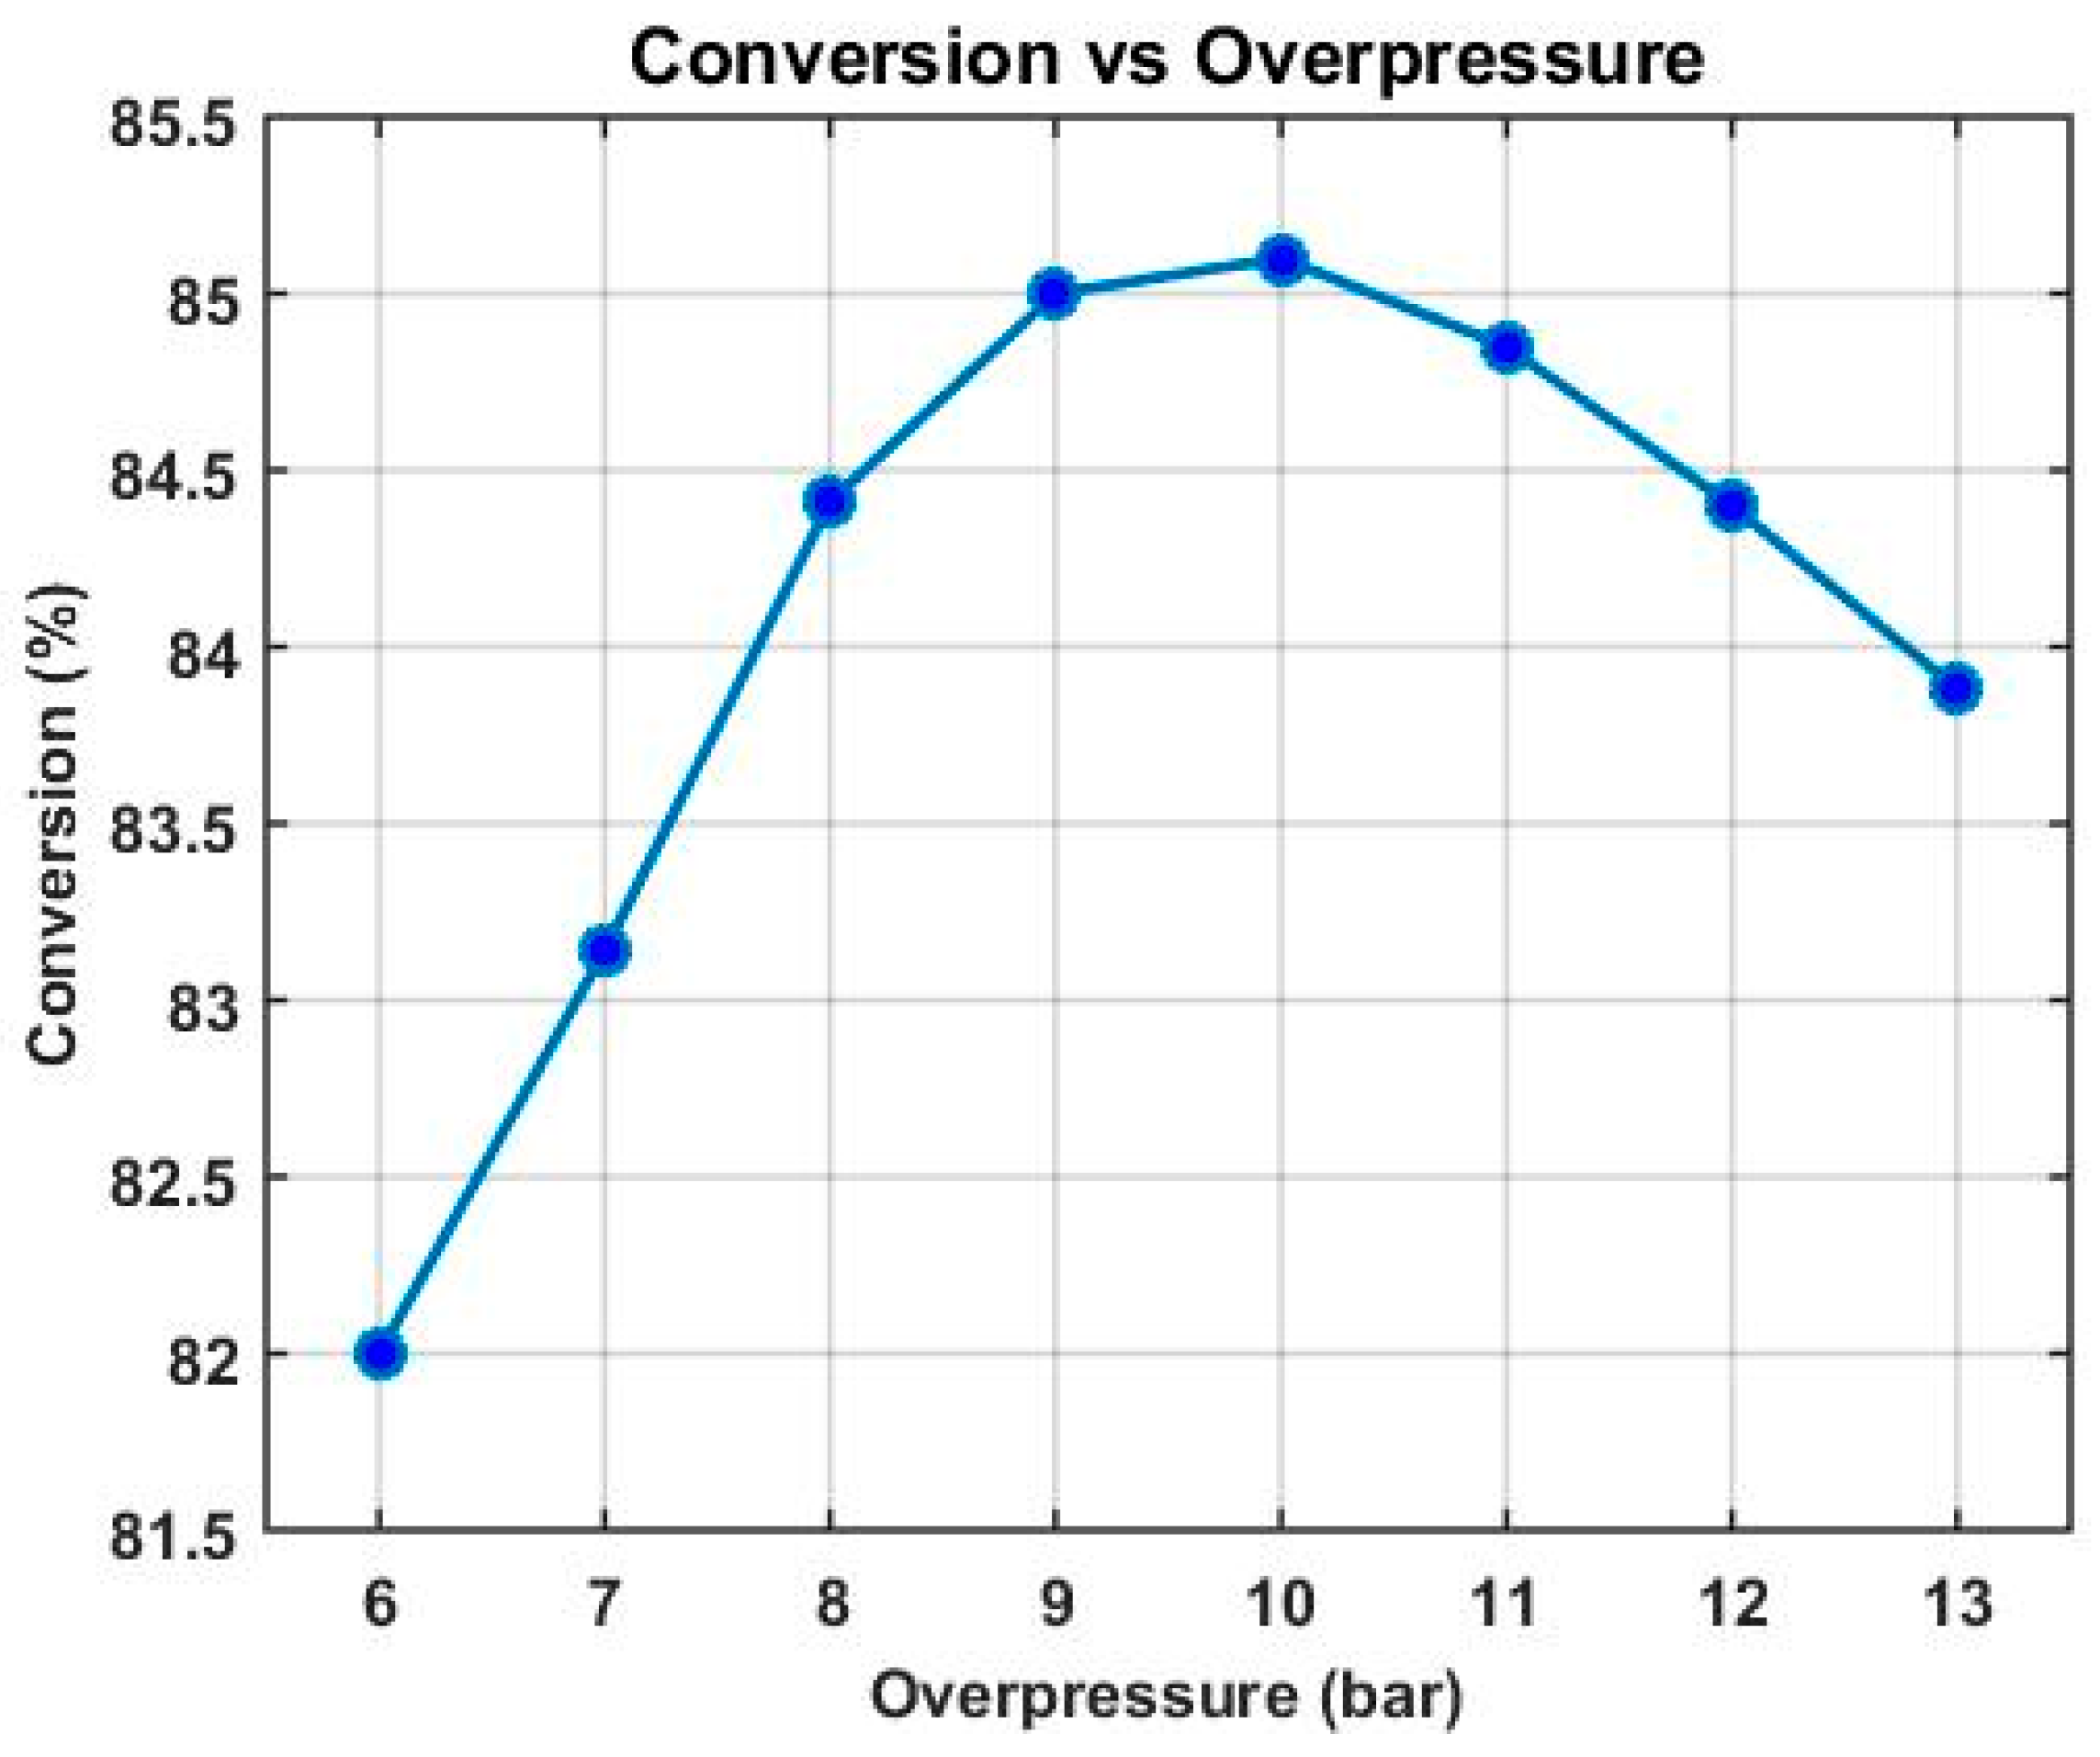
The initial step focused on examining the influence of reactor dimensions’ variation on methane conversion under set conditions within the simulations. A methane feed flow rate of 3800 kg h−1 was assumed, based on the preliminary studies of typical industrial bubble column configurations. The model-simulated reactor operates at an overpressure of 10 bar, which refers to the pressure above the molten metal bath, and an industry relevant temperature of 1050 °C, with 85% of the reactor height filled with liquid tin and an orifice size of 1 mm. A key finding from the sensitivity analysis was the identification of an optimal operating pressure for methane conversion for the given operating conditions and reactor’s dimensions. The generated conversion versus overpressure plot in (Figure 10) clearly illustrates this trend. For the presented case, the reactor had a height of 13 m and a diameter of 5.5 m. Initially, increasing the pressure improves methane conversion due to favorable hydrodynamic effects, particularly up to the overpressure of 10 bar. However, beyond this point, thermodynamic equilibrium became the limiting factor. This reduced the potential for further improvements, resulting in a decrease in conversion. It is essential to highlight that while the overpressure of 10 bar was determined to be optimal for the specific case considered, this does not necessarily indicate its universal applicability across all systems. The optimal operating pressure is inherently dependent on reactor geometry and process-specific conditions. This finding underscores the potential for further optimization under varying industrial operating scenarios. Although lower pressures are conventionally favored due to the equilibrium constraints of the reaction system, exploring higher pressures may offer distinct advantages, depending on specific process requirements and system dynamics.
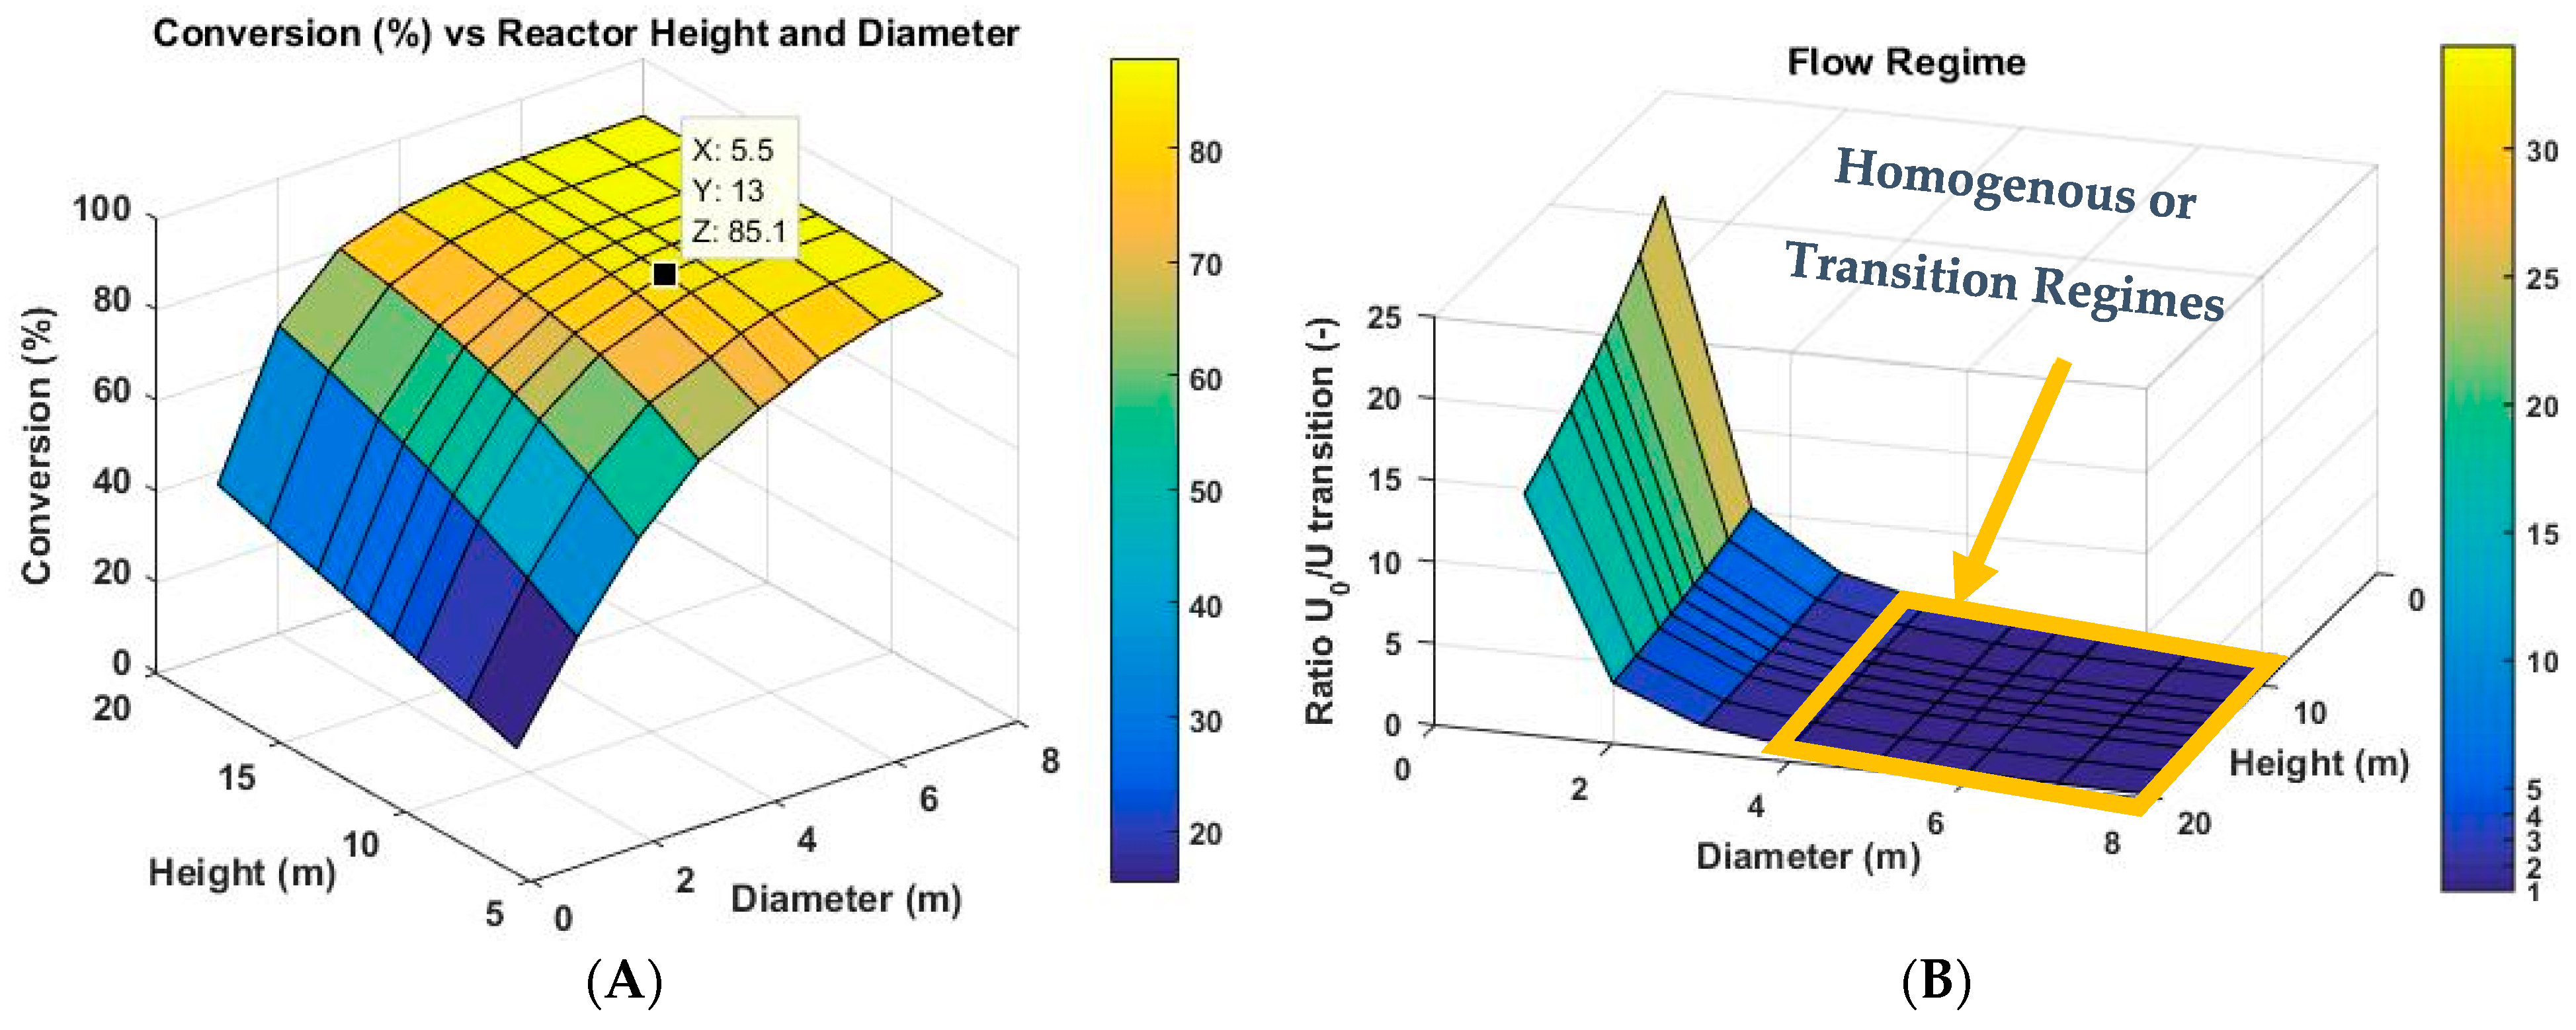
Further insights into the influence of reactor dimensions (height and diameter) on methane conversion were obtained through simulations conducted at the previously specified feed flow rate. For these simulations, the reactor height was varied between 8 and 20 m, while the diameter ranged from 1 to 8 m, as these dimensions are considered to be industrially relevant and feasible for bubble column reactors. The results are illustrated in the 3D plots (Figure 11). Plot (A) demonstrates the variation in methane conversion with reactor height and diameter, while plot (B) shows the corresponding flow regime classification. The flow regime is determined by the ratio of superficial gas velocity to transition velocity. Values which are greater than one indicate operation in the heterogeneous regime, while values below one correspond to the homogeneous or transitional regimes. The transitional regime occurs when bubbly flow is present at the inlet and lower part of the reactor, whereas the heterogeneous flow regime tends to be established in the upper sections of the reactor due to the increased superficial gas velocity.
The results indicate that reactor heights between 4 and 8 m generally operate within the homogeneous or transitional flow regimes in the model, where higher methane conversion values are typically achieved. Taller reactors lead to increased conversion values, primarily due to the extended gas residence time, which has a more significant impact than the pressure effects caused by the molten metal’s hydrostatic pressure. The tendency toward homogeneous flow regimes in taller reactors is also attributed to the stabilizing effect of increased hydrostatic pressure. In contrast, smaller reactor diameters are more likely to establish a heterogeneous flow regime. This occurs because, at a given flow rate, reducing the reactor diameter increases the superficial gas velocity. As the superficial gas velocity exceeds the transition velocity threshold, the system shifts from a homogeneous to a heterogeneous flow regime, where conversion appears to decrease for the given system conditions. The highest methane conversion, up to 85%, was observed in the homogeneous regime. Specifically simulations with a reactor height of 13 m and a diameter of 5.5 m resulted in a simulated hydrogen production rate of 800 kg h−1 (approximately 6.4 kton year−1), emphasizing the critical role of reactor size in achieving optimal conversion efficiency.
While the results suggest that homogeneous flow regimes maximize methane conversion, operating in the heterogeneous regime may offer advantages for scale-up. Heterogeneous flow regimes typically sustain higher gas holdups, allowing greater throughput per cubic meter of reactor volume. This reduces the need for larger reactors, which require significant quantities of expensive molten metals. However, the model predicts lower conversion rates in the heterogeneous regime, prompting further investigation into the underlying causes.
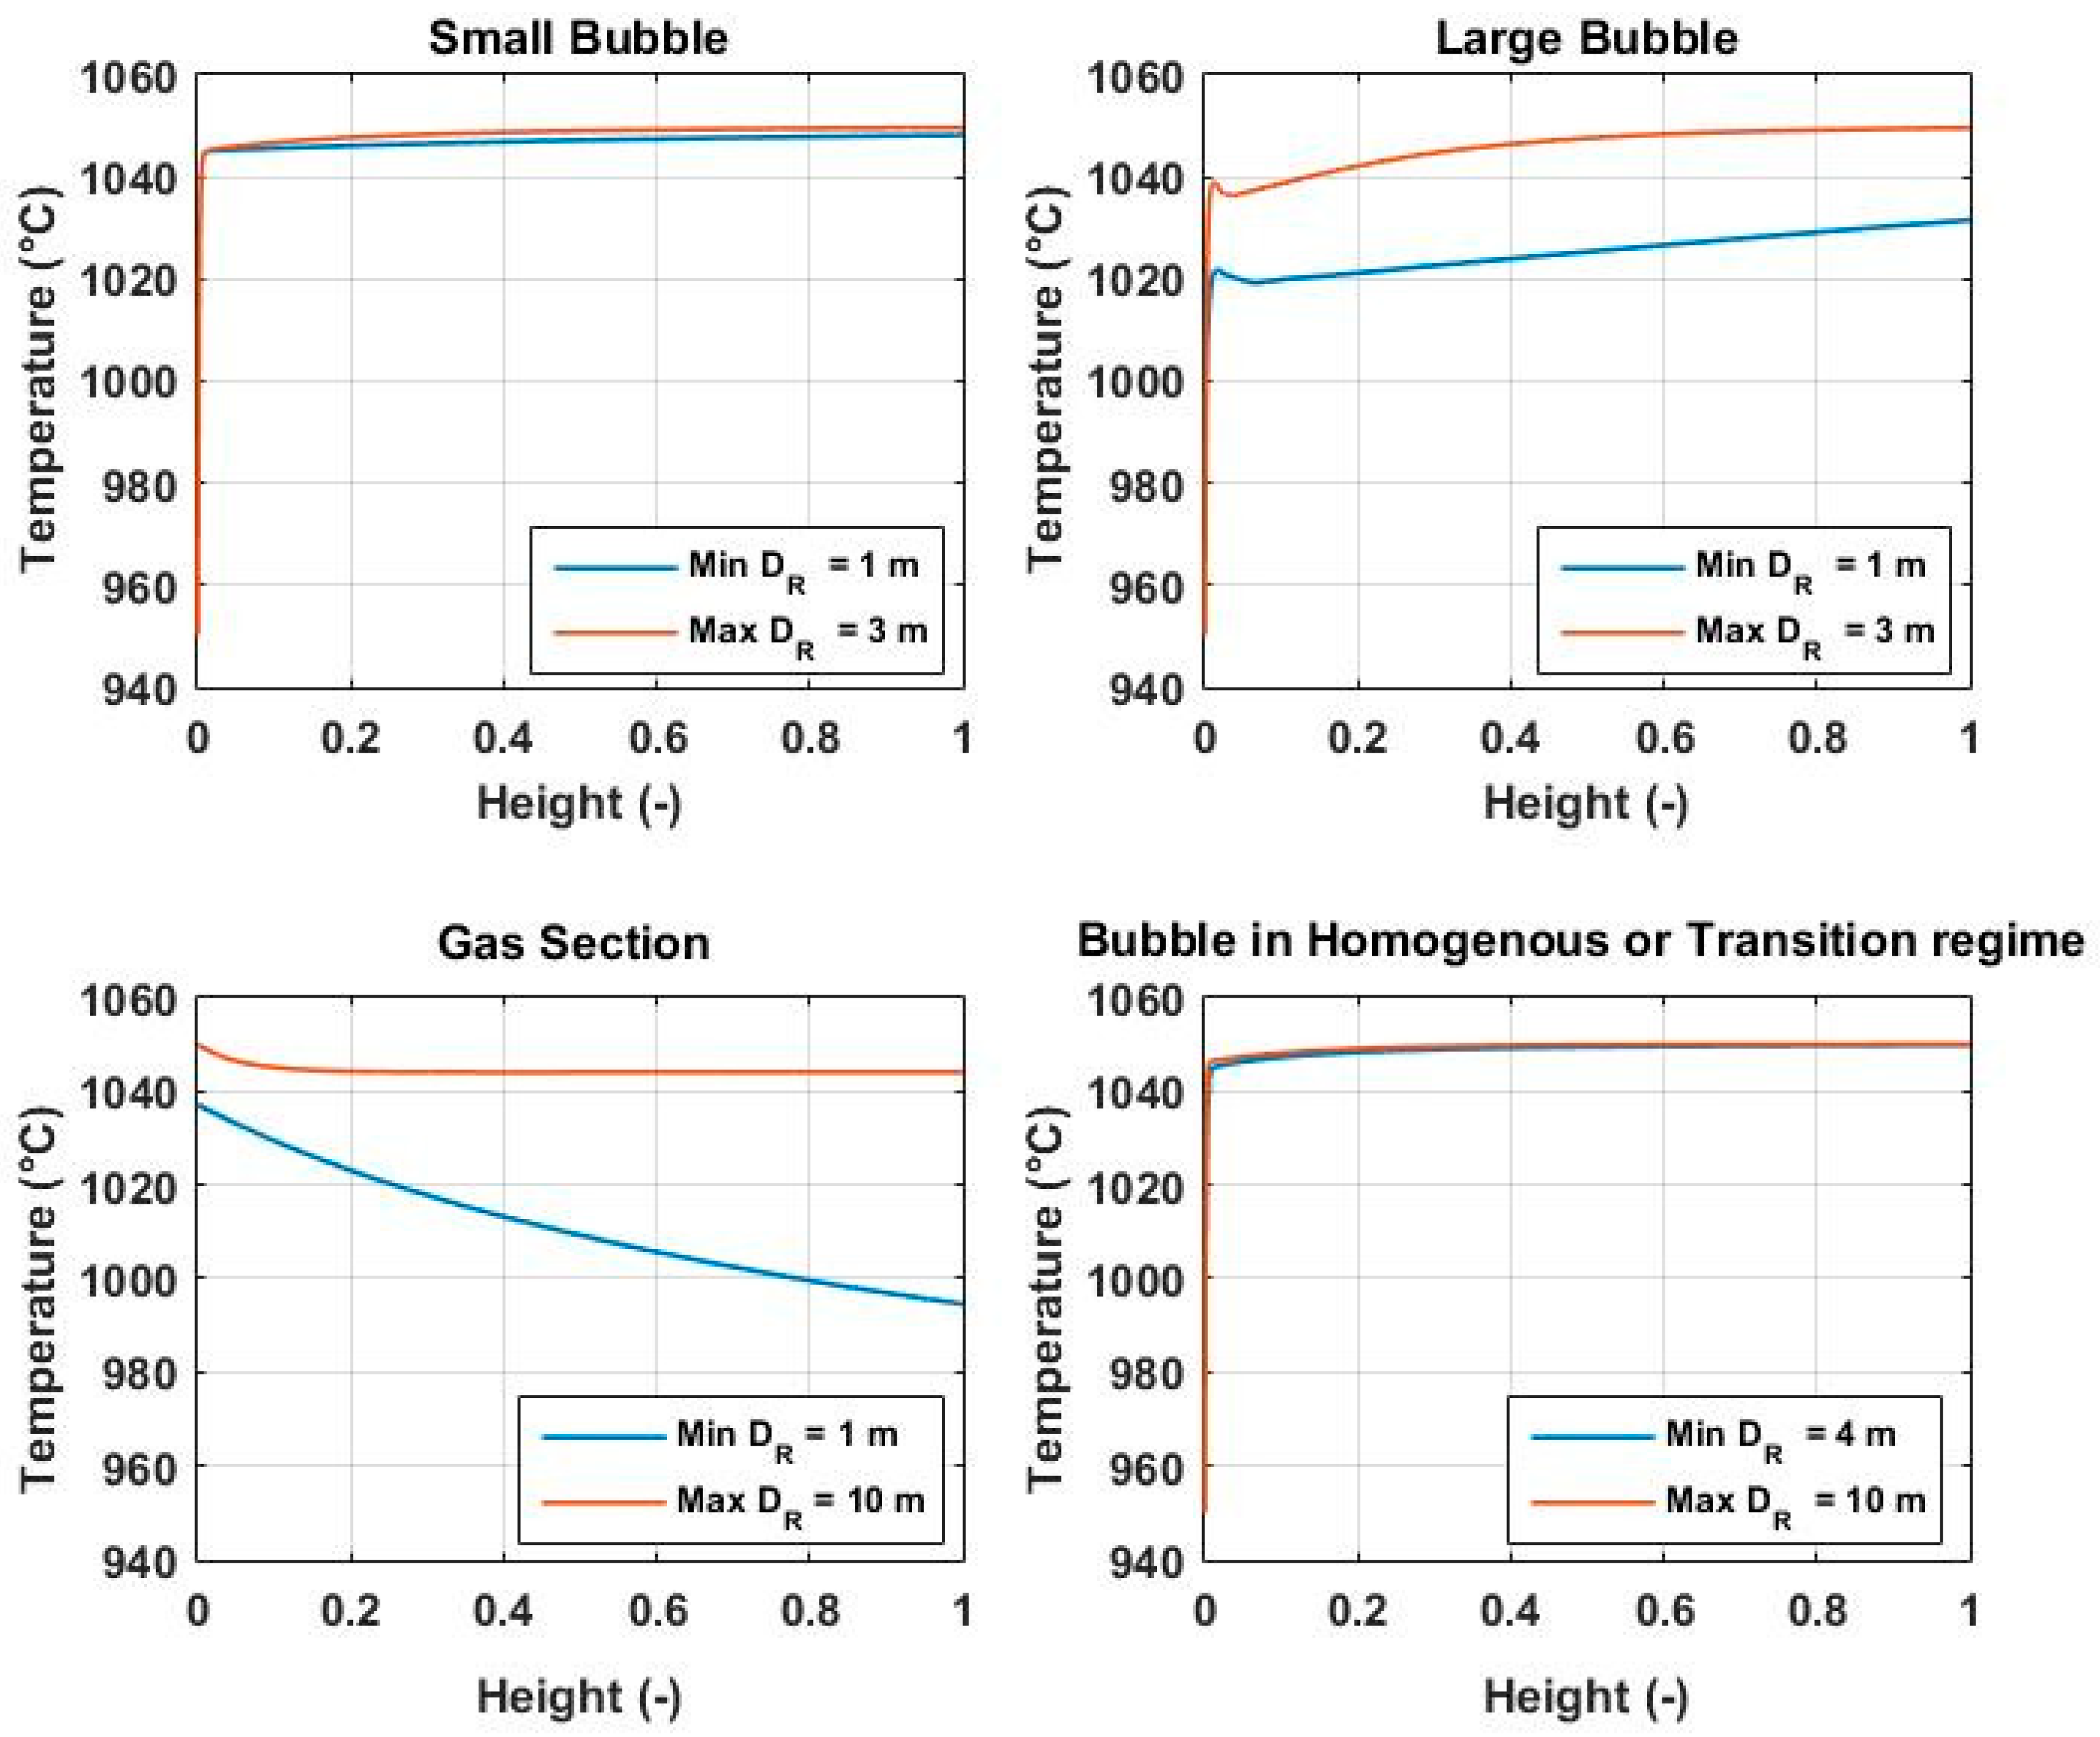
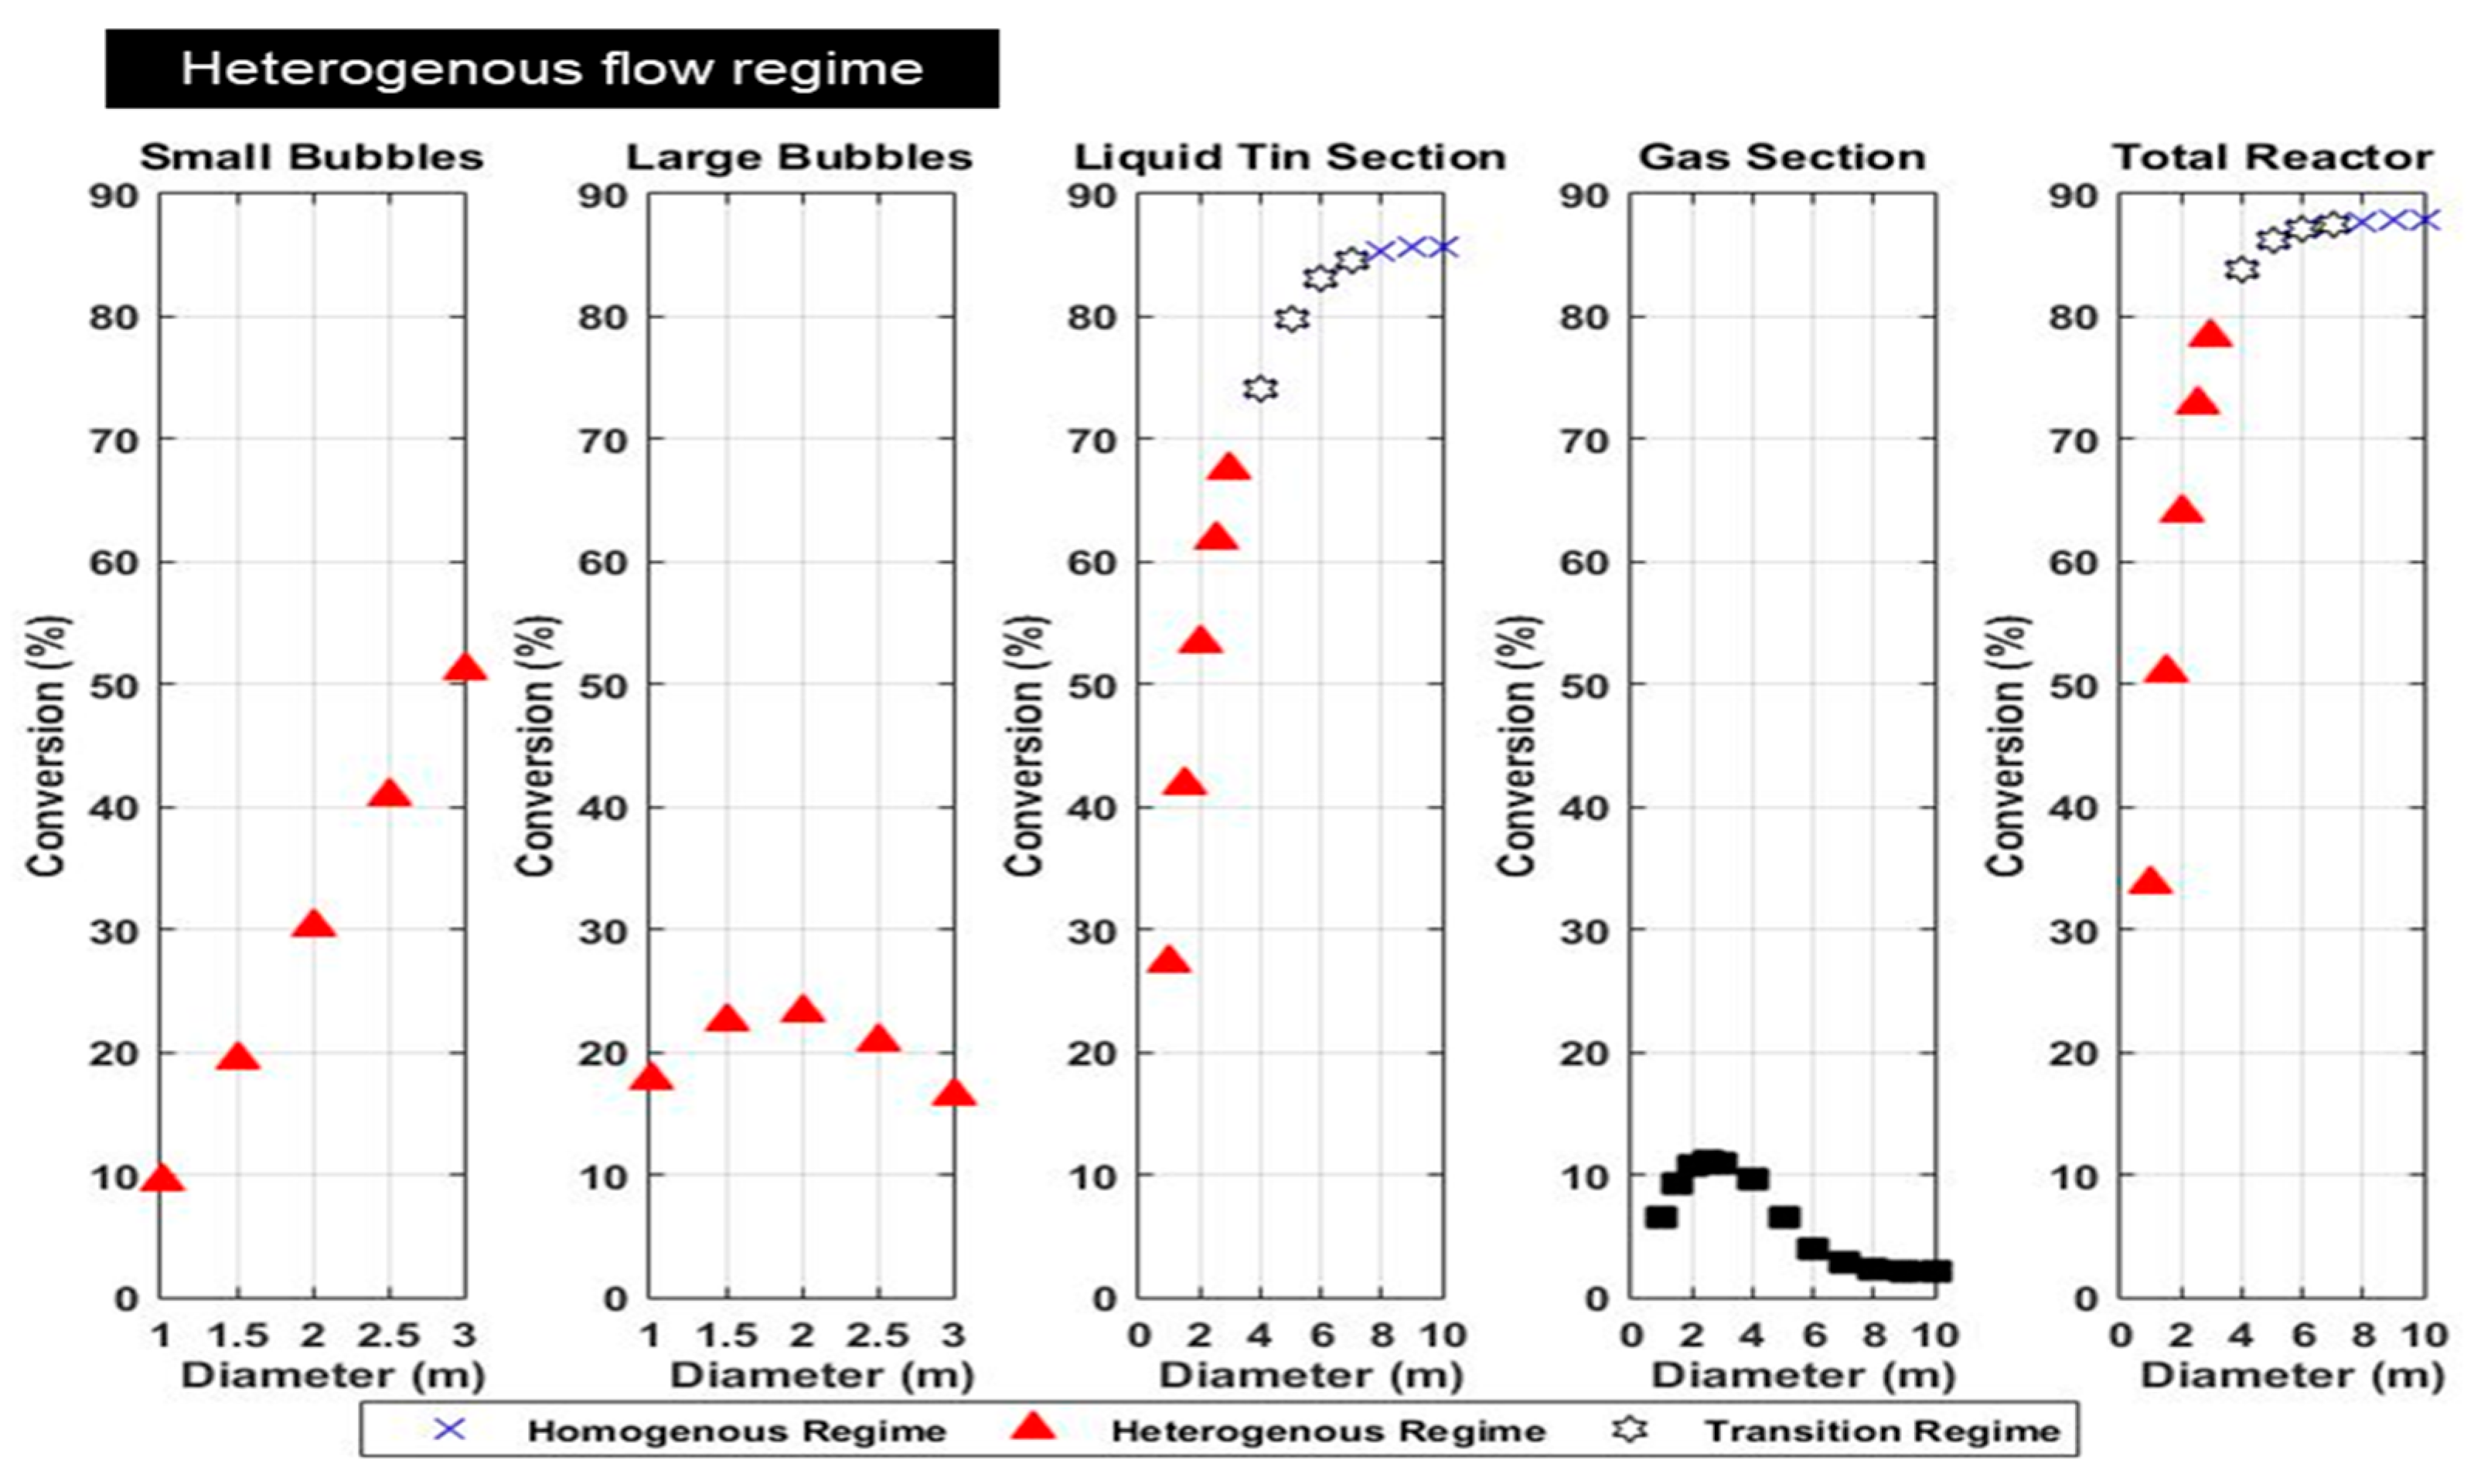
Further simulations were conducted to better understand the temperature profiles within small and large bubbles during the heterogeneous flow regime, as well as within small bubbles during the homogeneous or transitional flow regimes. Additionally, the temperature drop behavior within the gas section above the molten metal bath, where the gas-phase reaction continues, was also analyzed. Although one can argue that the temperatures within small and large bubbles during the heterogeneous flow regime may average out, due to ongoing coalescence and breakup, at this stage of the study, and in the absence of experimental data, it was assumed that temperatures within bubbles of different sizes may vary and influence the overall reactor performance. The analysis of temperature dependence on flow regime and variation in reactor diameters in these gas phases is presented in Figure 12. Here, the x-axis represents the dimensionless height of the molten metal bath for the temperature profiles within bubbles, and the dimensionless height of the gas section for the temperature profile in the gas section. The temperature profiles are shown for both the minimum and maximum reactor diameters considered. With the methane mass flow rate, feed temperature, molten metal bath temperature, and operating pressure held constant, variations in reactor diameter impact the superficial gas velocity: smaller diameters result in higher velocities, while larger diameters produce lower velocities. A methane mass flow rate of 3800 kg h−1, an operating pressure of 10 bar, and a temperature of 1050 °C were maintained. The reactor height was fixed at 18 m, and the diameter was varied between 1 and 10 m to capture the transition across different flow regimes under these conditions. For small bubbles, it can be concluded from the temperature profile that they heat up quickly in both homogeneous and heterogeneous regimes. This is due to their larger surface area-to-volume ratio and longer residence time of these bubbles within the reactor. Furthermore, changes in superficial gas velocities due to a varying reactor diameter have negligible influence on the temperature profiles within small bubbles; as bubble size remains largely unchanged, the frequency of bubble formation varies, not the size under the given conditions. These findings are consistent with the results reported by Andreini et al. [38]. In contrast, large bubbles heat up slowly. At higher superficial gas velocities, larger bubbles form (as predicted by Darton’s equation), requiring more time to heat up due to their larger size. Additionally, the faster rise in these larger bubbles also contributes to the weaker heating process. In the gas section, the temperature drop is considerably smaller in larger diameter reactors compared to those with smaller diameters. This behavior can be attributed to the ongoing gas-phase reaction and the presence of turbulent flow at higher superficial gas velocities, which enhances heat transfer between the reactor walls and the gas flow. However, the primary factor is the high conversion (close to equilibrium) of the gas exiting the molten metal bath, where the homogeneous flow regime dominates. The composition of the gas exiting the molten metal bath is close to equilibrium composition, so no significant heat is consumed by the reaction in the gas section above the molten metal. In contrast, at higher superficial gas velocities in small diameter reactors, the exiting methane from the molten metal bath is far from equilibrium conversion. As a result, the high reaction rate in the gas section consumes more energy, resulting in a larger temperature drop.
To gain a better understanding of the conversion tendencies within small and large bubbles in the heterogeneous regime, as well as within the gas section, additional simulations were conducted. Figure 13 illustrates the variation in conversion for small and large bubbles in heterogeneous flow regimes, the total conversion within the liquid tin section, conversion within the gas section, and the overall conversion along the reactor as a function of changing reactor diameter. As in previous analyses, the reactor diameter corresponds to changes in superficial gas velocity. It is important to note that similar operating conditions were maintained as in the temperature profile analysis. The conversion values are based on the total molar feed of methane, and the sum of individual contributions represents the total reactor conversion. Before discussing the findings, it is crucial to clarify the influence of key parameters. An increase in reactor diameter generally corresponds to a decrease in superficial gas velocity, which facilitates a transition towards the homogeneous flow regime. This shift implies a higher proportion of small bubbles compared to large bubbles within the heterogeneous regime. The model predicts that, in the heterogeneous flow regime, a larger fraction of total methane decomposition occurs within small bubbles, and this fraction increases as the reactor diameter increases. This outcome aligns with the model equation assumptions, which suggest that a larger proportion of the methane flow will be distributed into smaller bubbles. Furthermore, given that temperatures are expected to be higher in smaller bubbles (as observed in previous analyses), methane conversion is also anticipated to be higher in these bubbles. For large bubbles, an initial increase in conversion is observed, followed by a decline as the reactor diameter increases. This behavior results from the interaction of two factors: a decrease in superficial gas velocity leads to smaller-sized large bubbles (from the large bubble population), which heat up faster and thus contribute to higher conversion. However, at larger reactor diameters within the heterogeneous regime, the lower superficial gas velocity leads to a reduced number of large bubbles (meaning that the gas holdup of larger bubbles is comparatively lower). This reduction in the population of large bubbles decreases the overall fraction of methane feed in these bubbles, and consequently, the fraction of methane conversion that is attributable to them drops. From the simulated data, it is also evident that in the homogeneous regime, conversion is almost independent of the reactor diameter, as near-equilibrium conditions are achieved with the given reactor height. Conversion in the homogeneous regime is higher compared to the heterogeneous regime, due to more efficient heat transfer to the uniformly small bubbles and their longer residence time. In the gas section of the reactor, conversion generally increases with the reactor diameter. This is attributed to longer residence time being associated with larger diameters, which allow for more time for gas-phase reactions to occur. As long as equilibrium conversion is not reached, this increase in residence time directly contributes to higher conversion rates. In a homogeneous regime, total conversion within the reactor is greater than in a heterogeneous regime. As a result, the methane (CH4) concentration entering the gas section is lower, since a significant portion of the conversion has already occurred in the earlier sections of the reactor. Thus, only a small fraction of the remaining conversion occurs in the gas section, contributing less to the overall reactor conversion. The simulation results indicate that allowing 15% of the gas section in molten metal bubble columns without external cooling can lead to up to 10% methane conversion. This conversion, forming extra carbon black, could have significant technical implications for downstream operations.
The analysis of methane conversion tendencies within homogeneous and heterogeneous flow regimes suggests that the lower overall conversion in the heterogeneous regime, compared to the homogeneous regime, may be due to less efficient heat transfer in large bubbles and a shorter gas residence time. In the homogeneous regime, the uniformity of small bubbles leads to better heat transfer and longer residence times, resulting in consistently higher conversion. However, to validate this hypothesis, detailed simulations were conducted to investigate other key parameters affecting methane conversion in the heterogeneous flow regime.
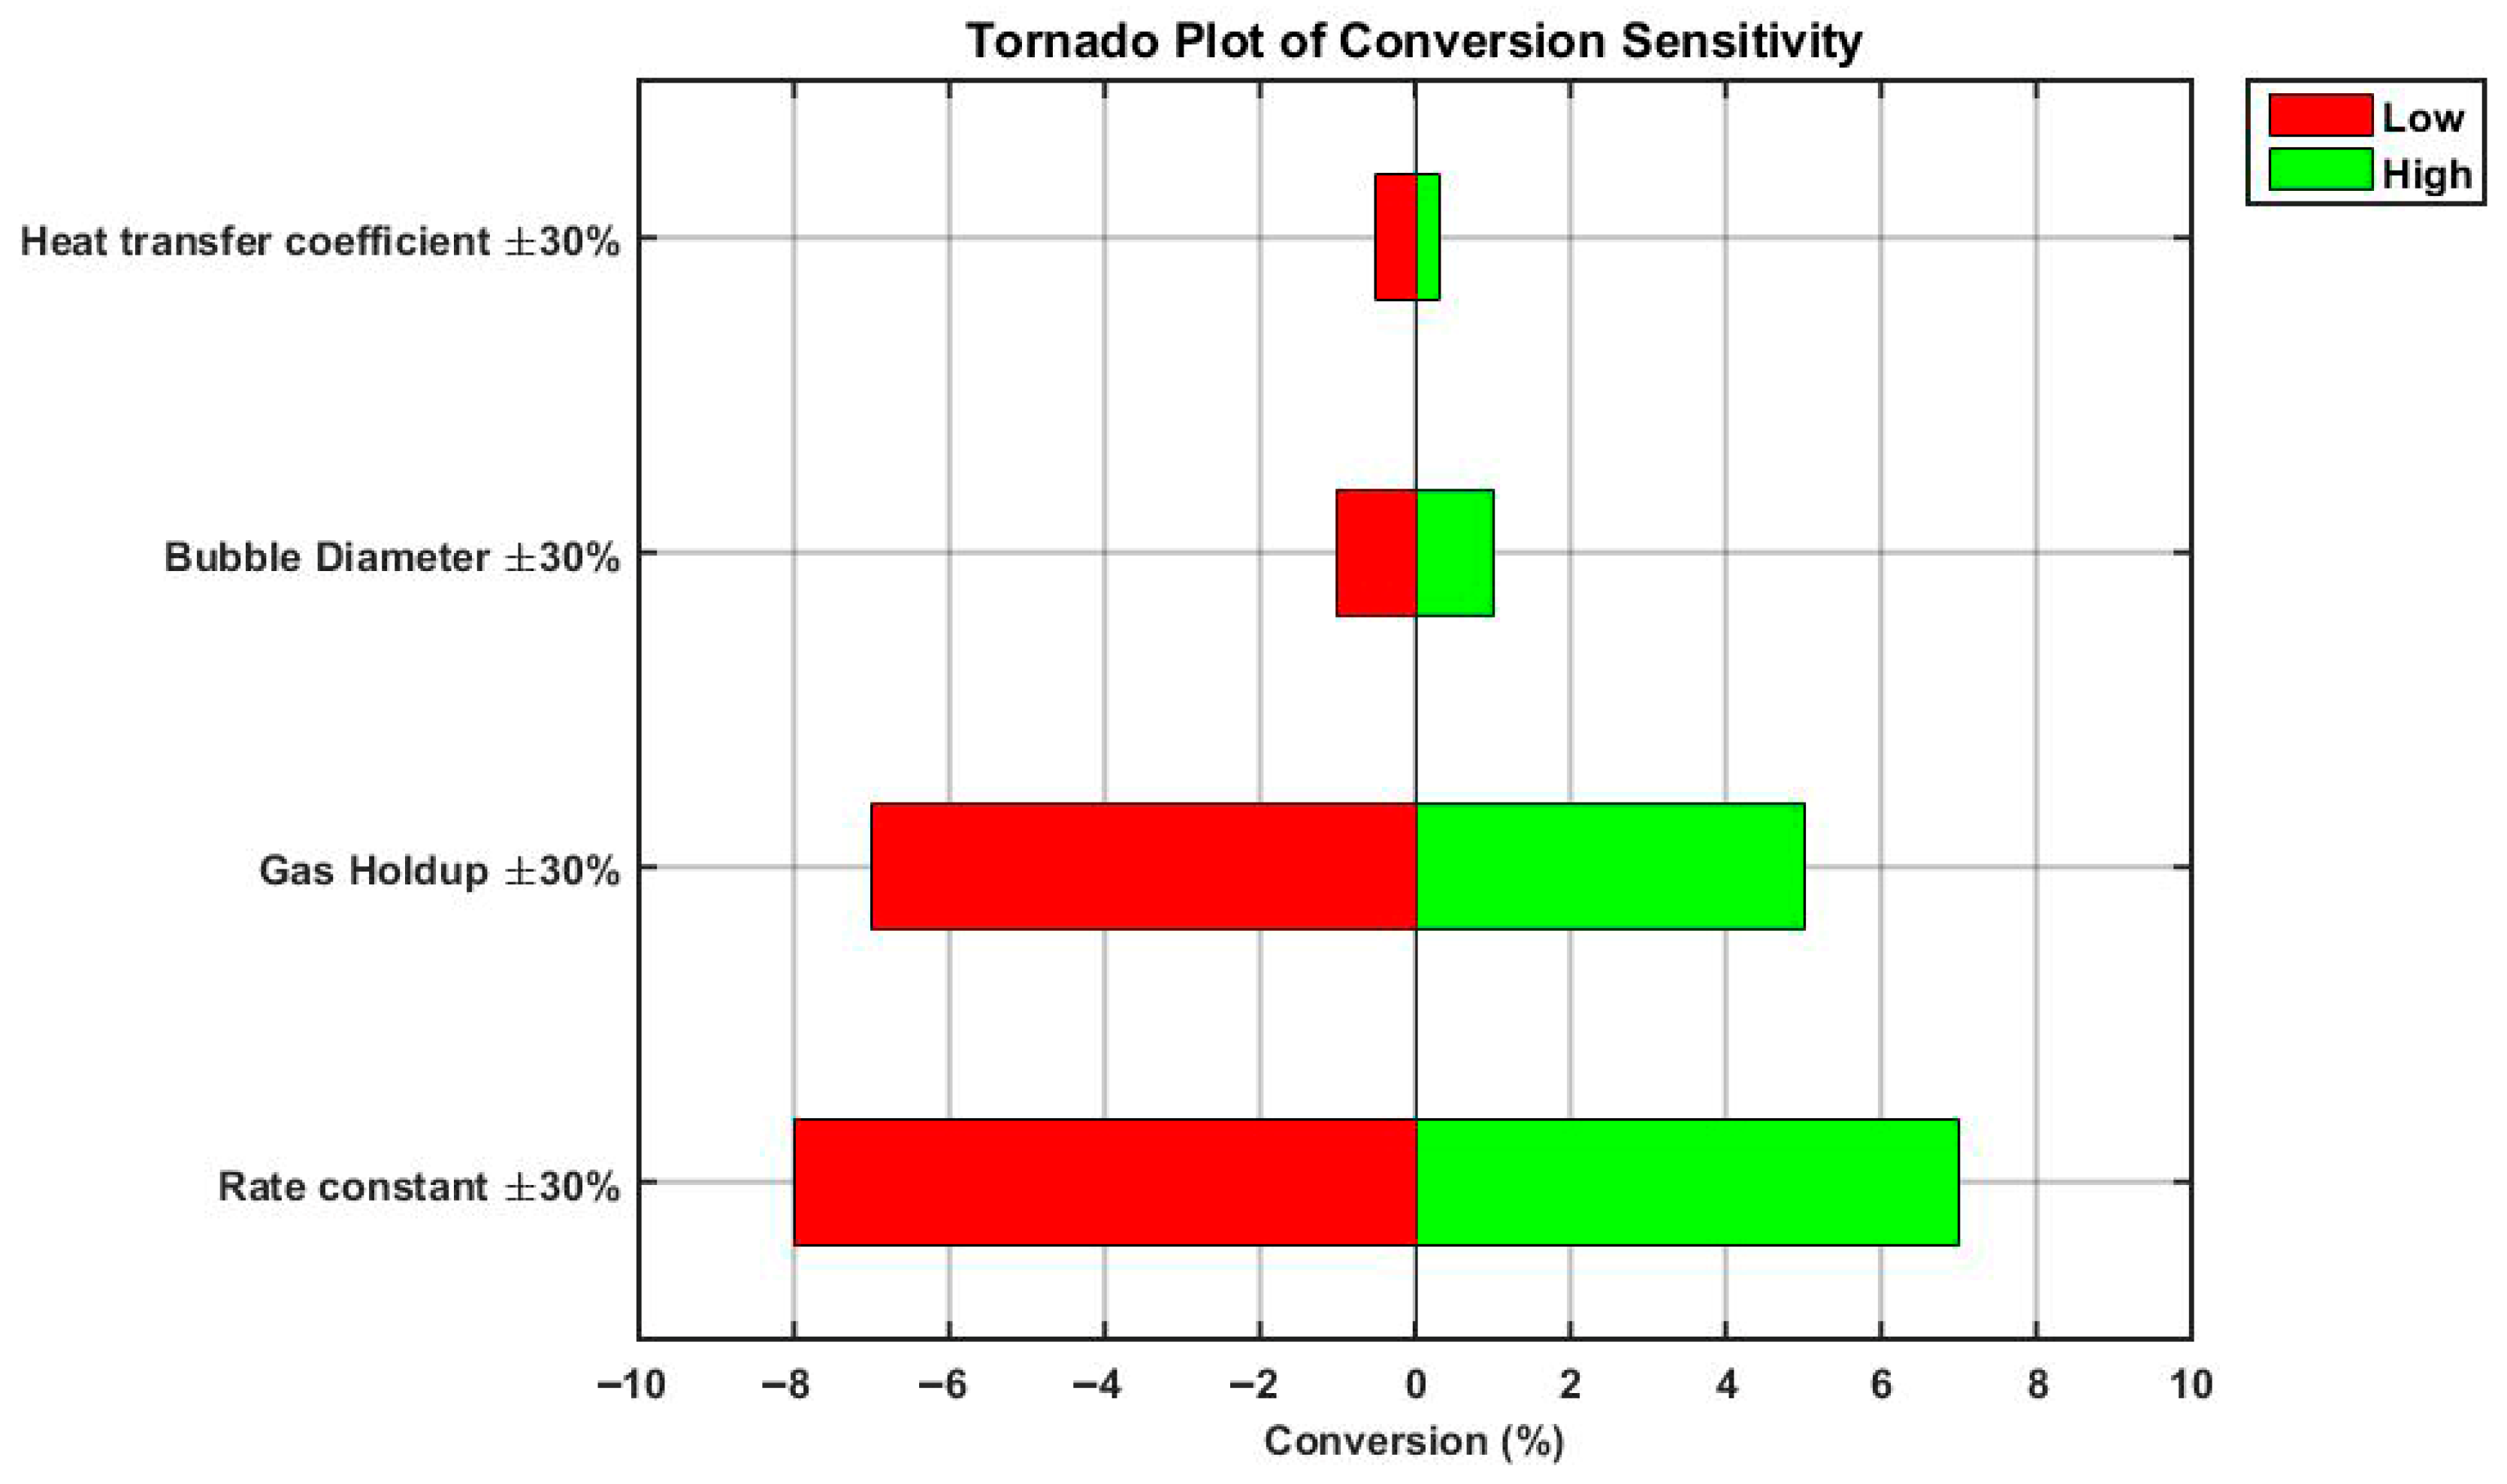
The main objective was to identify the parameters that could be technically optimized to enhance the conversion levels under industrially relevant heterogeneous flow conditions. The arbitrary operating point in the heterogeneous regime was chosen based on prior analysis, using a reactor height of 13 m, a diameter of 3 m, and a methane conversion rate of 69.7%. The influence of critical parameters, including the reaction rate, gas holdup, bubble diameter, and heat transfer coefficient, was analyzed by varying each parameter by ±30%. The results, presented in a tornado plot (Figure 14), illustrate the relative sensitivity of methane conversion to these parameters. The analysis revealed that the reaction rate and gas holdup had the most significant impact on conversion efficiency, indicating that optimizing these two parameters could substantially improve system performance in heterogeneous flow conditions. In contrast, the bubble diameter and heat transfer coefficient had comparatively minor effects, suggesting that these factors are not the primary constraints on conversion efficiency in the simulated conditions. Interestingly, these findings challenge the initial hypothesis that low conversion in the heterogeneous regime is primarily due to lower temperatures within the large bubbles. Instead, the results indicate that the dominant limiting factors are the insufficient gas holdup and suboptimal reaction rates, both of which directly influence residence time and reaction kinetics—crucial elements for achieving higher methane conversion rates.
The simulations underscore the importance of optimizing the gas holdup and reaction kinetics to improve the overall methane conversion in heterogeneous flow regimes. Future research and development should prioritize enhancing gas–liquid interactions and reaction rates to overcome the current limitations in conversion efficiency, offering valuable insights for refining reactor design and operational strategies.

5. Conclusions and Outlook

This study developed and validated a computationally efficient yet comprehensive model for methane pyrolysis in a molten metal bubble column reactor: a promising technology for hydrogen production from natural gas with minimal CO2 emissions. The model was designed to address the limitations of the existing experimental data by incorporating more accurate descriptions of hydrodynamics, heat transfer, and reaction kinetics. Previous studies have mainly focused on low-pressure and homogeneous flow regimes. By addressing these gaps, the model effectively simulates both homogeneous and heterogeneous flow conditions, enhancing its applicability to commercial-scale operations. Validation against the experimental data demonstrated reasonable accuracy, particularly when using the kinetic models of Kassel et al. [43] for temperatures below 1095 °C and Napier et al. [45] for higher temperatures. Methane conversion was predicted with an accuracy of approximately ±30%. Furthermore, the simulations also identified an optimal pressure for a given operating temperature, flow rate, and reactor size, where methane conversion was maximized. This optimal pressure balances hydrodynamic benefits with thermodynamic limitations, beyond which further pressure increases do not significantly improve the conversion efficiency. The diameter of the bubble column was also identified as a very relevant design parameter. With the increasing diameter, the superficial gas velocity decreases. Low superficial gas velocities result in a homogenous flow regime in the bubble column with more smaller bubbles, which are favorable in terms of heat transfer and residence time in contrast to larger bubbles.
Sensitivity analysis revealed that the reaction rate and gas holdup are the most critical parameters influencing conversion efficiency in the heterogeneous flow regime, while the bubble diameter and heat transfer coefficients had relatively minor effects. The study also highlighted the potential for flow regime transitions, particularly at higher temperatures and flow rates, which could significantly impact the reactor performance. Future work should focus on refining the model to enhance its predictive accuracy, especially for transitional and heterogeneous flow regimes. Experimental validation under heterogeneous flow conditions in molten metal systems is essential to confirm the model’s applicability at larger scales. Furthermore, additional investigation into the role of autocatalysis by carbon particles and its influence on methane pyrolysis is necessary to address the observed overpredictions at higher temperatures. Research should also aim to optimize the reactor design by improving gas–liquid interactions and reaction kinetics, potentially through the use of catalytically active molten metals or alloyed metal mixtures. Given the importance of gas holdup and reaction rates, future reactor scale-up efforts must prioritize these parameters to maximize methane conversion efficiency. Large-scale implementation of methane pyrolysis will require more sophisticated models that account for catalyst presence, autocatalysis effects, and heat-transfer limitations, particularly under elevated pressure and temperature conditions. Ultimately, the insights from this study provide valuable guidance for optimizing the reactor design and operations, advancing methane pyrolysis technology towards commercialization for sustainable hydrogen production.

Author Contributions

K.A. “Conceptualization, methodology, software, validation”; M.O. “Conceptualization, methodology, software, validation, visualization, supervision”. All authors have read and agreed to the published version of the manuscript.

Funding

This research received no external funding.

Data Availability Statement

The original contributions presented in this study are included in the article. Further inquiries can be directed to the corresponding author.

Acknowledgments

We acknowledge support from the Open Access Publishing Fund of Clausthal University of Technology.

Conflicts of Interest

K.A. was employed by Wintershall Dea AG. The remaining authors declare that the research was conducted in the absence of any commercial or financial relationships that could be construed as a potential conflict of interest.

Abbreviations

List of Symbols
TTemperature°C or K (Kelvin)
PPressurePa (Pascal)
FCH4Molar flow rate of methanemol s−1
FH2Molar flow rate of hydrogenmol s−1
kfForward reaction rate constantmol m−3 s−1
krReverse reaction rate constantmol m−3 s−1
EactActivation energy of the reactionJ mol−1
AcrossCross-sectional area of the reactorm2
VbVolume of a bubblem3
dbDiameter of a bubblem
vbubbleBubble rise velocitym s−1
ρmixDensity of the gas mixturekg m−3
Cp,mixSpecific heat capacity of the gas mixtureJ kg−1 K−1
HrHeat of reactionJ mol−1
ΔGRGibbs free energy of the reactionJ mol−1
RuUniversal gas constantJ mol−1 K−1
KeqEquilibrium constant[-]
KpModified equilibrium constant[-]
αgInterfacial area between gas and liquid phases per unit volumem2 m−3
ϕgGas holdup (volume fraction of gas in the liquid)[-]
εsmallGas holdup of the small bubble phase[-]
εbGas holdup of the large bubble phase[-]
UmOverall heat transfer coefficient between bubble and liquidW m−2 K−1
λThermal conductivityW m−2 K−1
NuNusselt number[-]
PePeclet number[-]
τResidence time of the bubbles
gGravitational accelerationm s−2
σSurface tension of the molten metalN m−1
ρliquidDensity of the liquid phase (molten metal)kg m−3
vsmallSwarm velocity of small bubblesm s−1
DrReactor diameterm
HReactor heightm
ΔPPressure drop along the reactorPa
RTotal reaction rate per unit reactor volumemol m−3 s−1
UtransTransition superficial gas velocity m s−1
dorificeDiameter of the sparger orificem
εtransGas holdup in the transition region[-]
XConversion of methane[-]
αiActivity of species i[-]
Fr0Froude number[-]
We0Weber number[-]
Abbreviations
MMBCRMolten Metal Bubble Column Reactor
CH4Methane
H2Hydrogen
CCarbon (e.g., graphite or carbon black)
ODEOrdinary Differential Equation
PFRPlug Flow Reactor
CO2Carbon Dioxide
GHSVGas Hourly Space Velocity
PSDParticle Size Distribution
ReReynolds Number
PrPrandtl Number
SMRSteam Methane Reforming
CCSCarbon Capture and Storage

Appendix A

Appendix A.1

Table A1. Overview of the considered literature for the non-catalytic pyrolysis of methane.
AuthorsReactor TypeT [°C]Pre-Exp. Factor (k0) [mol s−1m−3]Activation Energy
(Eact) [kJ mol−1]
Glick et al. [42]Shock Tube1227–26279.12 × 1012355.9
Kevorkian et al. [32]Shock Tube1383–16921.32 × 1014389.4
Hartig et al. [46]Shock Tube1577–22271.26 × 1015435.4
Napier et al. [45]Shock Tube1477–24273.80 × 1013391.9
Kassel et al. [43]Tubular Reactor (Quartz) 700–13231.00 × 1012332.4
Palmer et al. [31]Tubular Reactor (Annular)1323–15231.00 × 1013355.6
Holmen et al. [47]Tubular Reactor 1500–20004.47 × 1013380.7
Steinberg et al. [48]Tubular Reactor700–9005.40 × 103131
Olsvik et al. [49]Tubular Reactor1200–15001.00 × 1013366
Arutyunov et al. [30]Tubular Reactor827–14271.91 × 1012343
Rodat et al. [50]Tubular Reactor (Solar)1227–20276.60 × 1013370
Chen et al. [34]Tubular Reactor (Quartz) 720–8302.82 × 1016450.5

Appendix A.2

The equilibrium constant (Keq) is commonly calculated using the following equation:
ln K e q = G R o R u T
where G R o is reaction Gibbs free energy at the given temperature, R u universal gas constant.
Catalan et al. [19] proposed a temperature-dependent correlation for estimating the equilibrium constant within the temperature range of 900 to 1200 °C, which has been applied in our model.
ln K e q = 13.2714 91,204.6 R u T
Furthermore, for gas phase reactions, K e q could be related to the partial pressure of the species, as demonstrated below:
K e q = [ α i ] v i = [ P i ] v i p 0 v i = K p · p 0 v i
where α I is the activity and p 0 is the standard pressure (101,325 Pa).
Accordingly, for the activity of ideal gas (which is assumed for the modeling purposes), the following expression holds true:
α i = P i p 0
Subsequently, the reverse reaction rate constant can be estimated as follows:
k r e v e r s e = k f o r w a r d K p = k f o r w a r d K e q p 0 v i = k f o r w a r d K e q p 0
Here, kforward is the forward reaction rate constant, kreverse is the reverse reaction rate constant, Keq is the equilibrium constant, Kp is the modified reaction equilibrium constant, and v I is the stoichiometric coefficient of the component.

Appendix B

Figure A1. Parity plot of all considered kinetic models and experimental data from the studies by Geißler et al. [23] and Plevan et al. [2]. The dashed lines indicate ±30% deviation from parity between measured and calculated conversion [30,31,32,34,42,43,45,47,48,49,50,51].
Energies 19 00884 g0a1
Figure A2. Parity plot considering possible transition along reactor [31,42,43]. The dashed lines indicate ±30% deviation from parity between measured and calculated conversion.
Energies 19 00884 g0a2

References

  1. Timmerberg, S.; Kaltschmitt, M.; Finkbeiner, M. Hydrogen and hydrogen-derived fuels through methane decomposition of natural gas—GHG emissions and costs. Energy Convers. Manag. 2020, 7, 100043. [Google Scholar] [CrossRef]
  2. Harrison, S.B. Turquoise Hydrogen Production by Methane Pyrolysis. Available online: https://www.digitalrefining.com/article/1002720/turquoise-hydrogen-production-by-methane-pyrolysis (accessed on 26 September 2024).
  3. Zaghloul, N.; Kodama, S.; Sekiguchi, H. Hydrogen Production by Methane Pyrolysis in a Molten-Metal Bubble Column. Chem. Eng. Technol. 2021, 44, 1986–1993. [Google Scholar] [CrossRef]
  4. Plevan, M.; Geißler, T.; Abánades, A.; Mehravaran, K.; Rathnam, R.; Rubbia, C.; Salmieri, D.; Stoppel, L.; Stückrad, S.; Wetzel, T. Thermal cracking of methane in a liquid metal bubble column reactor: Experiments and kinetic analysis. Int. J. Hydrogen Energy 2015, 40, 8020–8033. [Google Scholar] [CrossRef]
  5. Geißler, T.; Abánades, A.; Heinzel, A.; Mehravaran, K.; Müller, G.; Rathnam, R.; Rubbia, C.; Salmieri, D.; Stoppel, L.; Stückrad, S.; et al. Hydrogen production via methane pyrolysis in a liquid metal bubble column reactor with a packed bed. Chem. Eng. J. 2016, 299, 192–200. [Google Scholar] [CrossRef]
  6. Geißler, T.; Plevan, M.; Abánades, A.; Heinzel, A.; Mehravaran, K.; Rathnam, R.; Rubbia, C.; Salmieri, D.; Stoppel, L.; Stückrad, S.; et al. Experimental investigation and thermo-chemical modeling of methane pyrolysis in a liquid metal bubble column reactor with a packed bed. Int. J. Hydrogen Energy 2015, 40, 14134–14146. [Google Scholar] [CrossRef]
  7. Scheiblehner, D.; Neuschitzer, D.; Wibner, S.; Sprung, A.; Antrekowitsch, H. Hydrogen production by methane pyrolysis in molten binary copper alloys. Int. J. Hydrogen Energy 2023, 48, 6233–6243. [Google Scholar] [CrossRef]
  8. Pérez, B.J.L.; Jiménez, J.A.M.; Bhardwaj, R.; Goetheer, E.; Annaland, M.v.S.; Gallucci, F. Methane pyrolysis in a molten gallium bubble column reactor for sustainable hydrogen production: Proof of concept & techno-economic assessment. Int. J. Hydrogen Energy 2021, 46, 4917–4935. [Google Scholar] [CrossRef]
  9. Kang, D.; Palmer, C.; Mannini, D.; Rahimi, N.; Gordon, M.J.; Metiu, H.; McFarland, E.W. Catalytic Methane Pyrolysis in Molten Alkali Chloride Salts Containing Iron. ACS Catal. 2020, 10, 7032–7042. [Google Scholar] [CrossRef]
  10. Upham, D.C.; Agarwal, V.; Khechfe, A.; Snodgrass, Z.R.; Gordon, M.J.; Metiu, H.; McFarland, E.W. Catalytic molten metals for the direct conversion of methane to hydrogen and separable carbon. Science 2017, 358, 917–921. [Google Scholar] [CrossRef] [PubMed]
  11. Rahimi, N.; Kang, D.; Gelinas, J.; Menon, A.; Gordon, M.J.; Metiu, H.; McFarland, E.W. Solid carbon production and recovery from high temperature methane pyrolysis in bubble columns containing molten metals and molten salts. Carbon 2019, 151, 181–191. [Google Scholar] [CrossRef]
  12. Palmer, C.; Tarazkar, M.; Kristoffersen, H.H.; Gelinas, J.; Gordon, M.J.; McFarland, E.W.; Metiu, H. Methane Pyrolysis with a Molten Cu-Bi Alloy Catalyst. ACS Catal. 2019, 9, 8337–8345. [Google Scholar] [CrossRef]
  13. Qiao, C.; Che, J.; Wang, J.; Wang, X.; Qiu, S.; Wu, W.; Chen, Y.; Zu, X.; Tang, Y. Cost effective production of high quality multilayer graphene in molten Sn bubble column by using CH4 as carbon source. J. Alloys Compd. 2023, 930, 167495. [Google Scholar] [CrossRef]
  14. Nemanič, V.; Žumer, M.; Zavašnik, J.; Cvelbar, U. Hydrogen interaction with solid and liquid tin. J. Nucl. Mater. 2024, 588, 154771. [Google Scholar] [CrossRef]
  15. Muliyah, T.P.; Aminatun, D.; Nasution, S.S.; Hastomo, T.; Sitepu, S.S.W. VDI Heat Atlas; Springer: Berlin/Heidelberg, Germany, 2020; Volume 7. [Google Scholar]
  16. Wilke, C.R. A Viscosity Equation for Gas Mixtures. J. Chem. Phys. 1950, 18, 517–519. [Google Scholar] [CrossRef]
  17. Mason, E.A.; Saxena, S.C. Approximate Formula for the Thermal Conductivity of Gas Mixtures. Phys. Fluids 1958, 1, 361–369. [Google Scholar] [CrossRef]
  18. Giordanengo, B.; Benazzi, N.; Vinckel, J.; Gasser, J.; Roubi, L. Thermal conductivity of liquid metals and metallic alloys. J. Non. Cryst. Solids 1999, 250–252, 377–383. [Google Scholar] [CrossRef]
  19. Gancarz, T.; Moser, Z.; Gąsior, W.; Pstruś, J.; Henein, H. A comparison of surface tension, viscosity, and density of Sn and Sn-Ag alloys using different measurement techniques. Int. J. Thermophys. 2011, 32, 1210–1233. [Google Scholar] [CrossRef]
  20. Catalan, L.J.J.; Rezaei, E. Modelling the hydrodynamics and kinetics of methane decomposition in catalytic liquid metal bubble reactors for hydrogen production. Int. J. Hydrogen Energy 2022, 47, 7547–7568. [Google Scholar] [CrossRef]
  21. Catalan, L.J.J.; Rezaei, E. Coupled hydrodynamic and kinetic model of liquid metal bubble reactor for hydrogen production by noncatalytic thermal decomposition of methane. Int. J. Hydrogen Energy 2020, 45, 2486–2503. [Google Scholar] [CrossRef]
  22. Farmer, T.C.; McFarland, E.W.; Doherty, M.F. Membrane bubble column reactor model for the production of hydrogen by methane pyrolysis. Int. J. Hydrogen Energy 2019, 44, 14721–14731. [Google Scholar] [CrossRef]
  23. Hibiki, T.; Saito, Y.; Mishima, K.; Tobita, Y.; Konishi, K.; Matsubayashi, M. Study on flow characteristics in gas-molten metal mixture pool. Nucl. Eng. Des. 2000, 196, 233–245. [Google Scholar] [CrossRef]
  24. Hibiki, T.; Ishii, M. One-dimensional drift-flux model and constitutive equations for relative motion between phases in various two-phase flow regimes. Int. J. Heat Mass Transf. 2003, 46, 4935–4948. [Google Scholar] [CrossRef]
  25. Isao, K.; Mamoru, I. Drift flux model for large diameter pipe and new correlation for pool void fraction. Int. J. Heat Mass Transf. 1987, 30, 1927–1939. [Google Scholar] [CrossRef]
  26. Akita, K.; Yoshida, F. Bubble Size, Interfacial Area, and Liquid-Phase Mass Transfer Coefficient in Bubble Columns. Ind. Eng. Chem. Process Des. Dev. 1974, 13, 84–91. [Google Scholar] [CrossRef]
  27. Le, B.T.; Ngo, S.I.; Lim, Y.; Lee, U. One-dimensional kinetic model with novel bubble size equation in molten-metal bubble column reactors for CH4 pyrolysis. AIChE J. 2024, 70, e18540. [Google Scholar] [CrossRef]
  28. Geißler, T.G. Methanpyrolyse in Einem Flüssigmetall-Blasensäulenreaktor. Ph.D. Thesis, Karlsruhe Institute of Technology (KIT), Karlsruhe, Germany, 2017. [Google Scholar]
  29. Albright, L.F.; Crynes, B.L.; Corcoran, W.H. Pyrolysis: Theory and Industrial Practice; Academic Press: New York, NY, USA, 1983. [Google Scholar]
  30. Arutyunov, V.S.; Vedeneev, V.I. Pyrolysis of methane in the temperature range 1000–1700 K. Russ. Chem. Rev. 1991, 60, 1384–1397. [Google Scholar] [CrossRef]
  31. Palmer, H.B.; Lahaye, J.; Hou, K.C. Kinetics and mechanism of the thermal decomposition of methane in a flow system. J. Phys. Chem. 1968, 72, 348–353. [Google Scholar] [CrossRef]
  32. Kevorkian, V.; Heath, C.E.; Boudart, M. The decomposition of methane in shock waves. J. Phys. Chem. 1960, 64, 964–968. [Google Scholar] [CrossRef]
  33. Sánchez-Bastardo, N.; Schlögl, R.; Ruland, H. Methane Pyrolysis for Zero-Emission Hydrogen Production: A Potential Bridge Technology from Fossil Fuels to a Renewable and Sustainable Hydrogen Economy. Ind. Eng. Chem. Res. 2021, 60, 11855–11881. [Google Scholar] [CrossRef]
  34. Chen, C.; Back, M.H.; Back, R.A. The Thermal Decomposition of Methane. I. Kinetics of the Primary Decomposition to C2H6 + H2; Rate Constant for the Homogeneous Unimolecular Dissociation of Methane and its Pressure Dependence. Can. J. Chem. 1975, 53, 3580. [Google Scholar]
  35. Joshi, J.; Sharma, M.; Shah, Y.; Singh, C.P.; Ally, M.; Klinzing, G.E. Heat Transfer in Multiphase Contactors. Chem. Eng. Commun. 1980, 6, 257–271. [Google Scholar] [CrossRef]
  36. Kantarci, N.; Borak, F.; Ulgen, K.O. Bubble column reactors. Process Biochem. 2005, 40, 2263–2283. [Google Scholar] [CrossRef]
  37. Tokunaga, H.; Iguchi, M.; Tatemichi, H. Heat Transfer between Bubbles and Molten Wood’s Metal. ISIJ Int. 1995, 35, 21–25. [Google Scholar] [CrossRef]
  38. Andreini, R.J.; Foster, J.S.; Callen, R.W. Characterization of gas bubbles injected into molten metals under laminar flow conditions. Metall. Trans. B 1977, 8, 625–631. [Google Scholar] [CrossRef]
  39. Krishna, R.; Ellenberger, J. Gas Holdup in Bubble Column Reactors Operating in the Churn-Turbulent Flow Regime. AIChE J. 1996, 42, 2627–2634. [Google Scholar]
  40. Reilly, I.G.; Scott, D.S.; Debruijn, T.J.; Macintyre, D. The role of gas phase momentum in determining gas holdup and hydrodynamic flow regimes in bubble column operations. Can. J. Chem. Eng. 1994, 72, 3–12. [Google Scholar] [CrossRef]
  41. Darton, R.C.; LaNauze, R.D.; Davidson, J.F.; Harrison, D. Bubble Growth Due To Coalescence in Fluidised Beds. Trans. Inst. Chem. Eng. 1977, 55, 274–280. [Google Scholar]
  42. Glick, H. Shock tube studies of reaction kinetics of aliphatic hydrocarbons. Symp. Combust. 1958, 7, 98–107. [Google Scholar] [CrossRef]
  43. Kassel, L.S. The Thermal Decomposition of Methane. J. Am. Chem. Soc. 1932, 54, 3949–3961. [Google Scholar] [CrossRef]
  44. Kudinov, I.V.; Pimenov, A.A.; Kryukov, Y.A.; Mikheeva, G.V. A theoretical and experimental study on hydrodynamics, heat exchange and diffusion during methane pyrolysis in a layer of molten tin. Int. J. Hydrogen Energy 2021, 46, 10183–10190. [Google Scholar] [CrossRef]
  45. Napier, D.H.; Subrahmanyam, N. Pyrolysis of methane in a single pulse shock tube. J. Appl. Chem. Biotechnol. 1972, 22, 303–317. [Google Scholar] [CrossRef]
  46. Hartig, R.; Troe, J.; Wagner, H. Thermal decomposition of methane behind reflected shock waves. Symp. Combust. 1971, 13, 147–154. [Google Scholar] [CrossRef]
  47. Holmen, A.; Rokstad, O.A.; Solbakken, A. High-Temperature Pyrolysis of Hydrocarbons. 1. Methane to Acetylene. Ind. Eng. Chem. Process Des. Dev. 1976, 15, 439–444. [Google Scholar] [CrossRef]
  48. Steinberg, M. Production of hydrogen and methanol from natural gas with reduced co2 emission. Int. J. Hydrogen Energy 1998, 23, 419–425. [Google Scholar] [CrossRef]
  49. Olsvik, O.; Billaud, F. Modelling of the decomposition of methane at 1273 K in a plug flow reactor at low conversion. J. Anal. Appl. Pyrolysis 1993, 25, 395–405. [Google Scholar] [CrossRef]
  50. Rodat, S.; Abanades, S.; Coulié, J.; Flamant, G. Kinetic modelling of methane decomposition in a tubular solar reactor. Chem. Eng. J. 2009, 146, 120–127. [Google Scholar] [CrossRef]
  51. Kozlov, G.I.; Knorre, V.G. Single-pulse shock tube studies on the kinetics of the thermal decomposition of me-thane. Combust. Flame 1962, 6, 253–263. [Google Scholar] [CrossRef]
Figure 1. Schematical drawing of the bubble column reactor.
Energies 19 00884 g001
Figure 2. Reaction mechanism of the noncatalytic methane pyrolysis proposed by Chen et al. [33,34].
Energies 19 00884 g002
Figure 3. Equilibrium methane conversion versus temperature and pressure.
Energies 19 00884 g003
Figure 4. Diagram of methodology of implementing sub-models to simulate pyrolysis of methane within liquid bubble columns. The inverted triangle represents the gas–liquid interface at z = HL.
Energies 19 00884 g004
Figure 5. Parity plot of model calculated and measured conversion (%) [31,42,43].
Energies 19 00884 g005
Figure 6. Dependence of measured and calculated conversion on the inlet volumetric flowrate for low temperature experiments.
Energies 19 00884 g006
Figure 7. Dependence of measured and calculated conversion on the inlet volumetric flowrate for high temperature experiments.
Energies 19 00884 g007
Figure 8. Transition height of the flow regime at various temperatures and inlet volumetric flow rates.
Energies 19 00884 g008
Figure 9. Dependence of measured and calculated conversion on the inlet volumetric flowrate for high-temperature experiments (fitted with kinetic models of Kassel et al. [43] for temperatures lower than 1095 °C and Napier et al. [45] for higher temperatures).
Energies 19 00884 g009
Figure 10. Dependence of methane conversion on overpressure.
Energies 19 00884 g010
Figure 11. (A) Methane conversion as a function of reactor height and diameter; (B) flow regime classification, based on the ratio of superficial gas velocity to transition velocity as a function of reactor height and diameter.
Energies 19 00884 g011
Figure 12. Temperature dependence on reactor diameter within bubbles and gas section under various flow regimes.
Energies 19 00884 g012
Figure 13. Influence of reactor diameter on flow regime and conversion within small, large bubbles, gas section, molten metal bath, and total reactor.
Energies 19 00884 g013
Figure 14. Tornado plot of conversion sensitivity.
Energies 19 00884 g014
Disclaimer/Publisher’s Note: The statements, opinions and data contained in all publications are solely those of the individual author(s) and contributor(s) and not of MDPI and/or the editor(s). MDPI and/or the editor(s) disclaim responsibility for any injury to people or property resulting from any ideas, methods, instructions or products referred to in the content.