Article

Integrated Thermoelectric Power Generation and Membrane-Based Water Desalination Using Low-Grade Thermal Energy


School of Engineering, RMIT University, Melbourne, VIC 3001, Australia
*
Author to whom correspondence should be addressed.
Energies 2026, 19(4), 1054; https://doi.org/10.3390/en19041054
Submission received: 19 January 2026 / Revised: 10 February 2026 / Accepted: 16 February 2026 / Published: 18 February 2026
(This article belongs to the Special Issue Renewable Energy System Technologies: 3rd Edition)

Abstract

This study experimentally investigates a novel hybrid system integrating thermoelectric generators (TEGs) with direct contact membrane distillation (DCMD) for simultaneous low-grade heat recovery, electricity generation, and water desalination. Commercial TEG modules were sandwiched between heat spreaders to transfer thermal energy from a source (approx. 140 °C) to a cooling sink, driving saline water evaporation through a hydrophobic membrane. A validated mathematical model showed strong agreement with the experimental results. The system achieved freshwater mass fluxes of 8–9.5 kg/m2/h and electrical power outputs density of 25–35 W/m2. Increasing heat input (450–700 W) significantly enhanced freshwater production and electrical output, improving the Gain Output Ratio (GOR) and reducing Specific Energy Consumption (SEC). While higher feed salinity (up to 35,000 ppm) measurably declined mass flux and thermal efficiency, thermoelectric generation and thermal resistance remained largely unaffected. Energy and exergy efficiencies showed moderate sensitivity to operating conditions, while the Water–Electrical Energy Cogeneration Index (WEeCI) increased at high salinity, highlighting the robust contribution of electricity generation. These results demonstrate the potential of the TEG–DCMD system for the sustainable co-generation of water and power from industrial waste heat or renewable thermal sources.

1. Introduction

Electrical energy and freshwater are two critical resources essential for global economic development, public health, and environmental sustainability. Rapid population growth, urbanization, and industrial expansion are placing unprecedented pressure on these finite resources [1]. With the global population projected to reach approximately 9.7 billion by 2050 and 10.4 billion by the end of the century [2,3], demand for both electricity and clean water is expected to grow significantly. Meanwhile, only about 3% of the Earth’s water is freshwater [4], and it is estimated that by 2050, nearly 1.7 billion people in 39 countries will fall below the critical threshold of 1000 m3 per capita annually [5,6]. In parallel, the continued reliance on fossil fuels for electricity production poses environmental challenges and risks energy security. For example, approximately 200 million tons of oil are consumed annually to produce 22 million m3/day of desalinated water [7]. These statistics underline the urgent need for integrated technologies that can address both the global energy crisis and the growing freshwater scarcity [8,9].
One promising and underutilized resource for addressing this challenge is low-temperature thermal energy [10,11]. A significant portion of thermal energy in industrial, transport, and residential sectors is wasted, especially in the form of low-grade heat. According to the International Energy Agency (IEA) 2021 data, approximately 246 petajoules (PJ) of global waste heat were identified, with about 63% of this below 100 °C. Additionally, 64% of residential waste heat ranged between 100 °C and 299 °C, mostly originating from fossil fuel combustion [12]. Despite its abundance, the utilization of this energy remains limited due to the lack of cost-effective and efficient recovery technologies [13], especially for heat below 150 °C. Conventional heat recovery systems are either too expensive or technically impractical for low-grade heat applications, leaving vast quantities of recoverable energy untapped. Utilizing this wasted thermal energy can reduce dependence on fossil fuels, mitigate greenhouse gas emissions, and play a critical role in climate change mitigation efforts by enhancing overall energy system efficiency [14,15].
To meet these dual challenges of clean energy and water provision, renewable energy-driven desalination systems are gaining traction, particularly in regions where infrastructure is limited or fossil fuel dependency is economically or environmentally unsustainable [16]. Traditional desalination methods such as multi-stage flash (MSF), multi-effect distillation (MED), reverse osmosis (RO), electrodialysis (ED), and vapour compression (VC) are energy intensive and often not practical for small-scale or off-grid applications [17]. In response, research has increasingly focused on hybrid systems that integrate renewable or waste thermal energy sources—such as solar collectors or industrial process heat—with water treatment technologies to enhance sustainability and efficiency [18]. Several studies have emphasized the promise of coupling photovoltaic (PV) or wind energy systems with desalination modules or using thermal energy from industrial processes to drive membrane-based water treatment [19,20].
Among emerging technologies, thermoelectric generators (TEGs) offer a compelling method to convert low-grade thermal energy into electricity through the Seebeck effect [21]. TEGs operate via charge carrier diffusion across a temperature gradient, providing solid-state, maintenance-free power generation. Babu and Ponnambalam [22,23] performed a comprehensive theoretical analysis to evaluate the performance of hybrid PV–TEG systems. Their work highlighted TEG thermal resistance, cooling-side flow rate, solar radiation, and contact temperature as key influencing parameters. However, their study is limited to theoretical modelling. Nagasri et al. [24] designed an experimental setup comprising a PV panel and a TEG, and studied the impact of integrating a TEG with a PV panel and the energy density of the integrated system. The experimental study revealed that integration of the TEG with the PV system enhances the power density by approximately 8.5% and reduces the space requirement to produce the same power by 16%. Although TEGs have relatively low energy conversion efficiencies—typically in the range of 4% to 6% depending on material and temperature conditions—they are ideal for capturing waste heat from industrial equipment, exhaust systems, or solar thermal collectors [25]. Their compactness and lack of moving parts also make them well-suited for decentralized and integrated applications. To overcome their efficiency limitations, recent studies have investigated hybrid configurations combining TEGs with heat exchangers, phase change cooling, or desalination systems [26,27]. Özcan and Deniz [28] proposed and designed an experimental setup, comprising a TEG with a solar still, and analyzed the performance of the integrated system. Their study revealed that the integrated configuration achieved a daily energy and exergy efficiency of 40.34% and 2.462% respectively, compared with 35.55% and 2.403% for a conventional solar still (CSS), respectively. Furthermore, the integrated system yielded a higher freshwater production than CSS by 13.4%. Lawal et al. [29] developed a novel experimental setup consisting of TEG and air gap membrane distillation (AGMD). In their arrangement, the TEG functions as a heat pump, simultaneously supplying both the heating and the cooling requirements of the AGMD. The obtained result showed that the proposed integrated system achieved a minimal Specific Energy Consumption of 962 kWh/m3. Afaneh et al. [30] conducted a numerical analysis of a DCMD system coupled with a thermoelectric distiller (TED), proposing four new TED–DCMD configurations that utilize condensation waste heat from the TED to satisfy the thermal requirements of the DCMD unit. The performance of each configuration was assessed across a range of operating conditions. Among them, the third configuration, which employs two TED tanks and an external heat exchanger to transfer thermal energy to the DCMD, showed the highest energy efficiency, with a minimum Specific Energy Consumption of 217 kWh/m3 at a current of 2.1 A, a feed flow rate of 4 L/min, and eight thermoelectric modules. Additionally, the third and fourth configurations achieved the best performance, with a coefficient of performance of 3.24 and a freshwater productivity of 2.74 kg/s, respectively.
A thorough literature review demonstrated that in the past, TEG integration with MD has focused on using TEGs as cooling devices for the cold side of the MD. However, the MD system provides a unique opportunity, i.e., the cooling of the TEG. The current research, hence, focuses on using TEGs as power generators and using the MD for cooling the cold side of the TEG and, in turn, using the waste heat from the cold side of TEG. This study builds on that body of work by integrating TEGs with a direct contact membrane distillation (DCMD) system, enhanced with porous media for increased evaporation surface area and an active direct contact condensation system. The proposed system aims to simultaneously generate clean water and electricity using thermal energy below 150 °C, representing sources such as industrial waste heat and non-concentrating solar thermal collectors, presenting a cost-effective pathway to recover underutilized thermal resources and support sustainability goals. Despite numerous advancements in thermoelectric and desalination technologies, there remains a significant research gap in the effective integration and utilization of low-temperature waste heat for simultaneous electricity generation and freshwater production.
This paper investigates the feasibility and performance of a novel compact integrated TEG-DCMD designed to simultaneously produce electricity and clean water. A mathematical model has been developed using MATLAB R2024b to simulate the system’s behaviour under various operating conditions. The model predicts both electrical power output and freshwater flux. The influence of key parameters such as feedwater flow rate, feed salinity, and temperature on system performance such as maximum electrical power output density, temperature across TEG, GOR, SEC, thermal resistance, energy utilization efficiency, exergy efficiency, etc., is analyzed in detail to gain insight into the thermodynamic coupling between the TEG and DCMD units. To validate the theoretical predictions, a laboratory-scale experimental setup was constructed and tested. The experiments serve to evaluate the real-world performance of the system and assess the accuracy of the mathematical model. By bridging computational and experimental approaches, this study provides a comprehensive assessment of integrated energy–water systems and contributes toward the development of sustainable solutions for industrial waste heat utilization and renewable thermal energy applications.

2. Methodology

The integrated system composes of power generation and water desalination by using two subsystems, thermoelectric generator (TEG) and DCMD configuration. The system utilizes low-temperature waste heat as a heat source that will transfer to both subsystems. This study creates a mathematical model and performs experiments to validate the model, which can predict electrical power and freshwater production. The following assumption have been considered:
  • The system is analyzed assuming steady operating conditions.
  • The flow within the channel is fully developed.
  • The effects of membrane fouling are not included in the analysis.
  • Pressure losses throughout the system are assumed to be negligible.

2.1. Experimental Setup

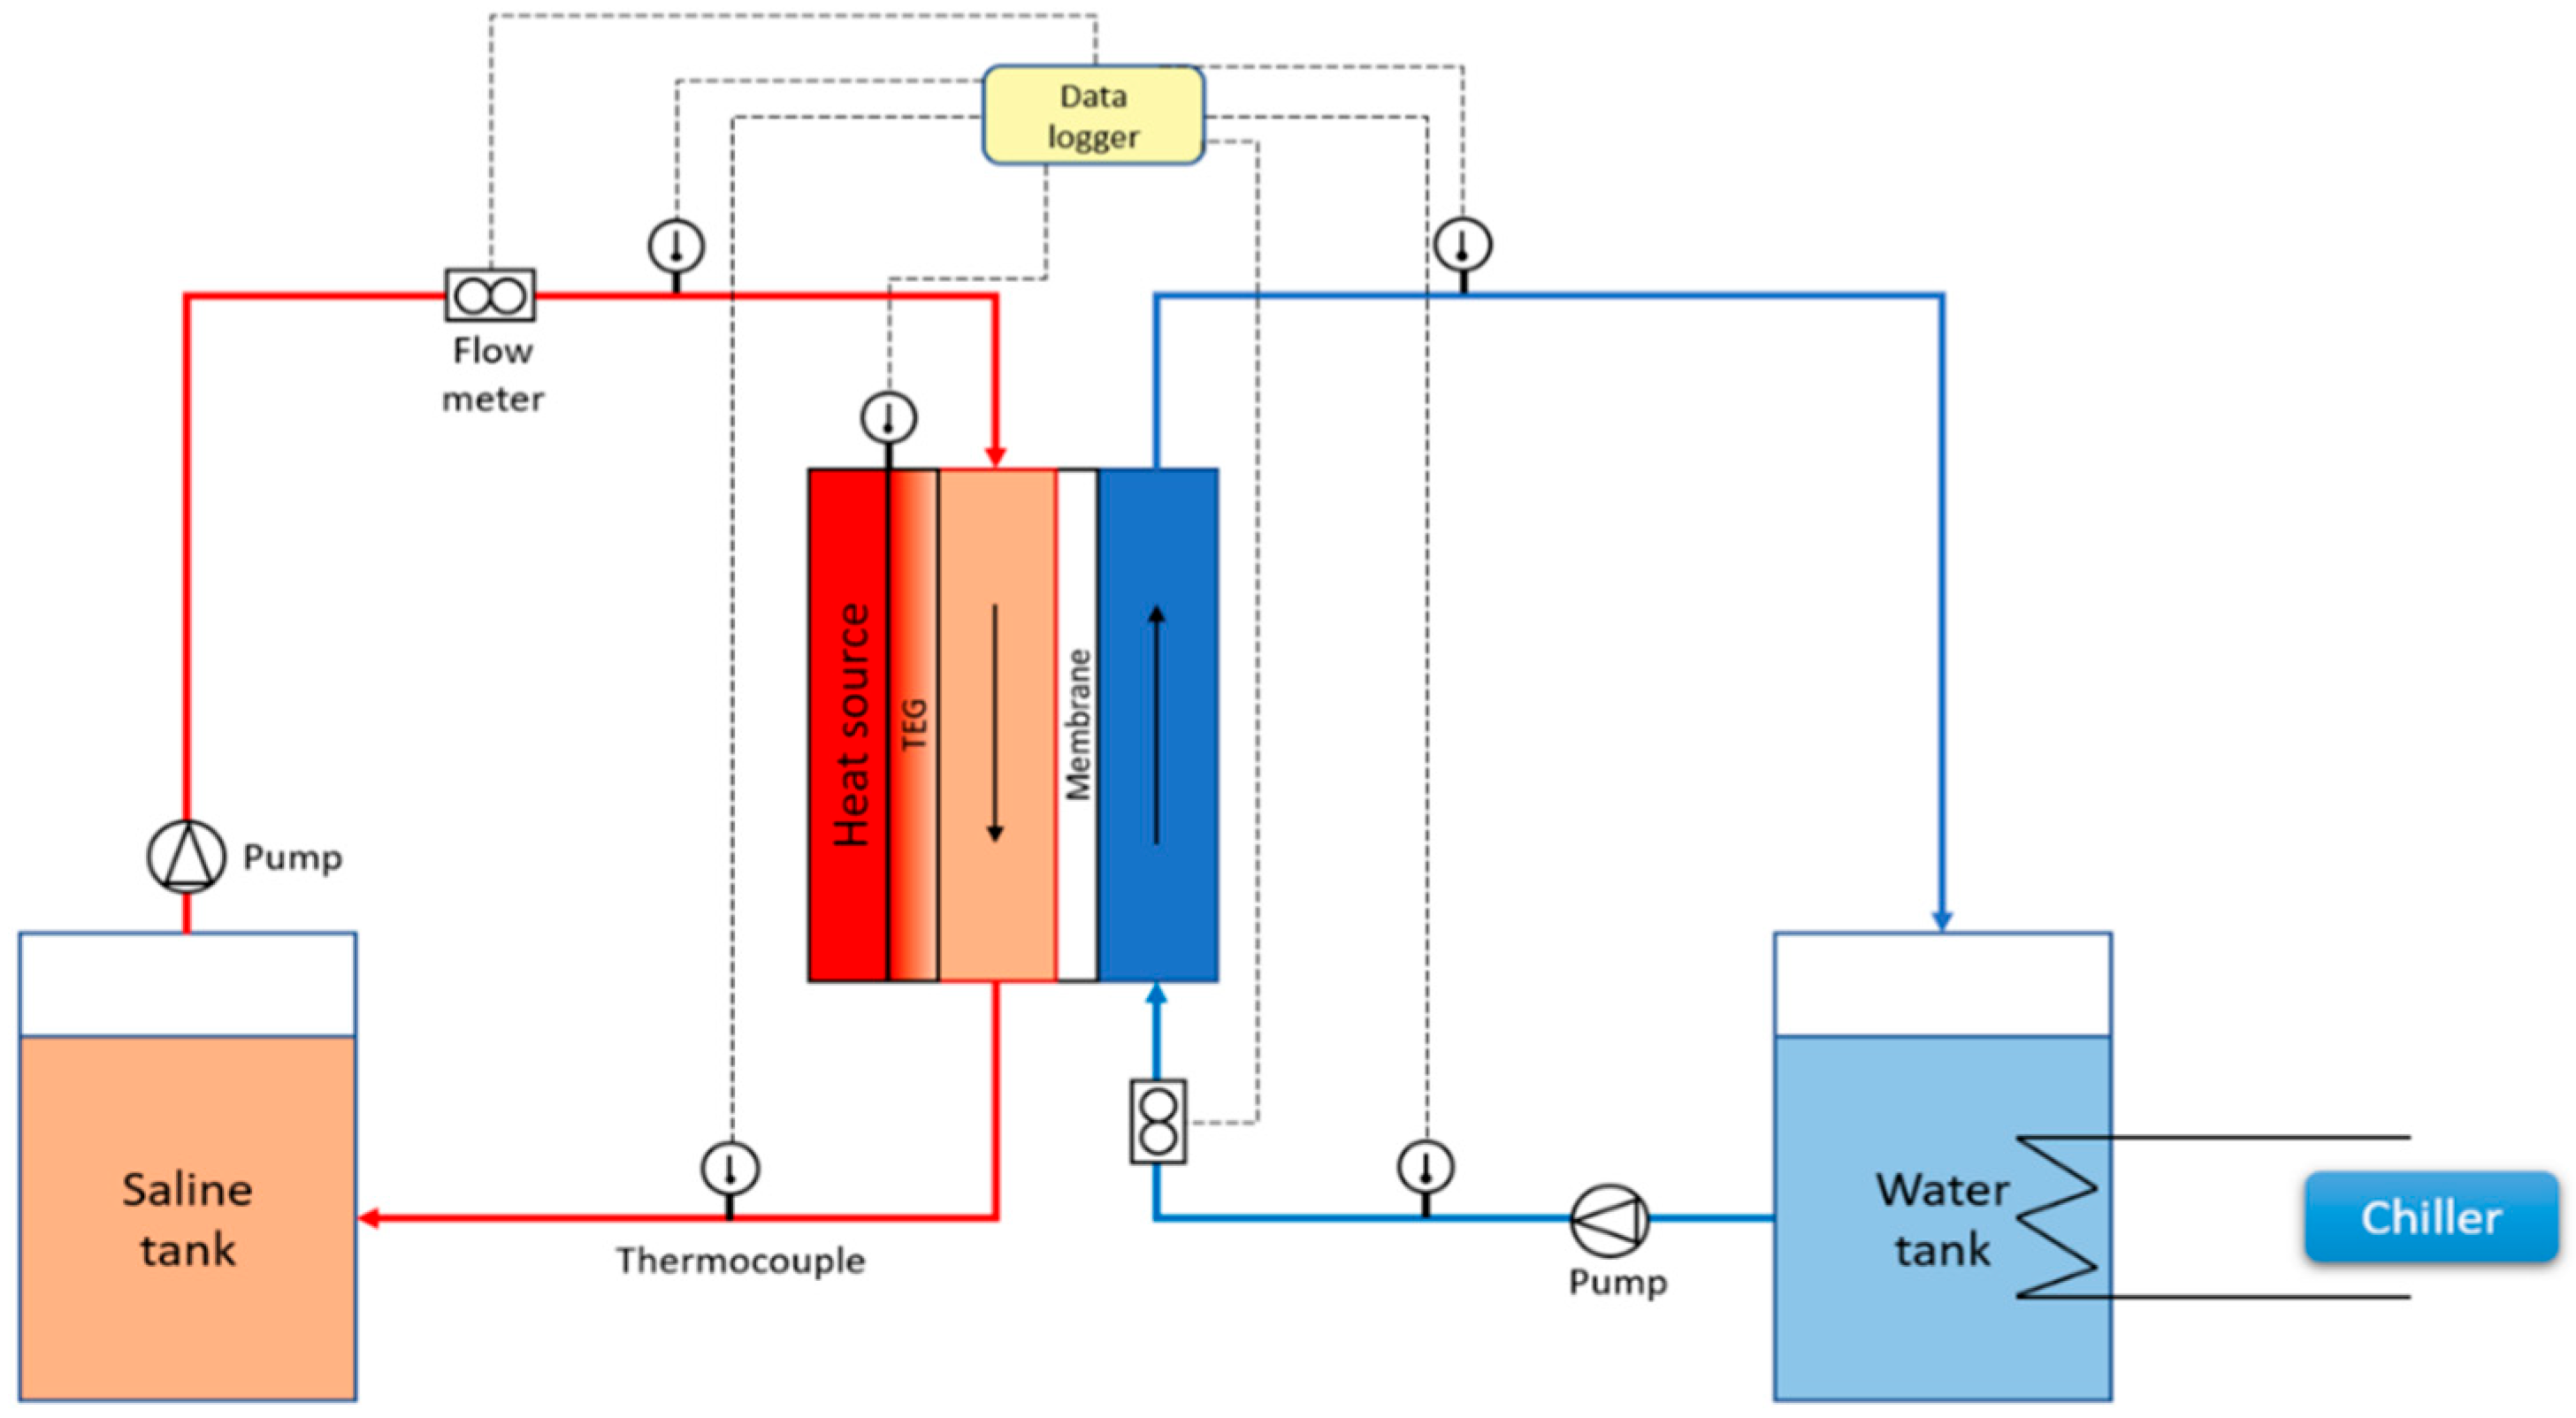
The below figure presents a schematic of the experimental system for the power generation and water desalination modules. As shown in Figure 1, there are two containers, one for hot saline water and another for the cold freshwater that circulates into the TEG-DCMD module. Flow sensors and thermocouples are installed to measure the flow rate and temperature of both the inlet and outlet feed and permeate liquid, respectively. An electrical heater is used to simulate the waste heat from industrial processes which vary the heat source temperature between 80 and 130 °C. Also, a chiller and helical coil heat exchanger are used for maintaining the permeate water temperature, at 20 °C.
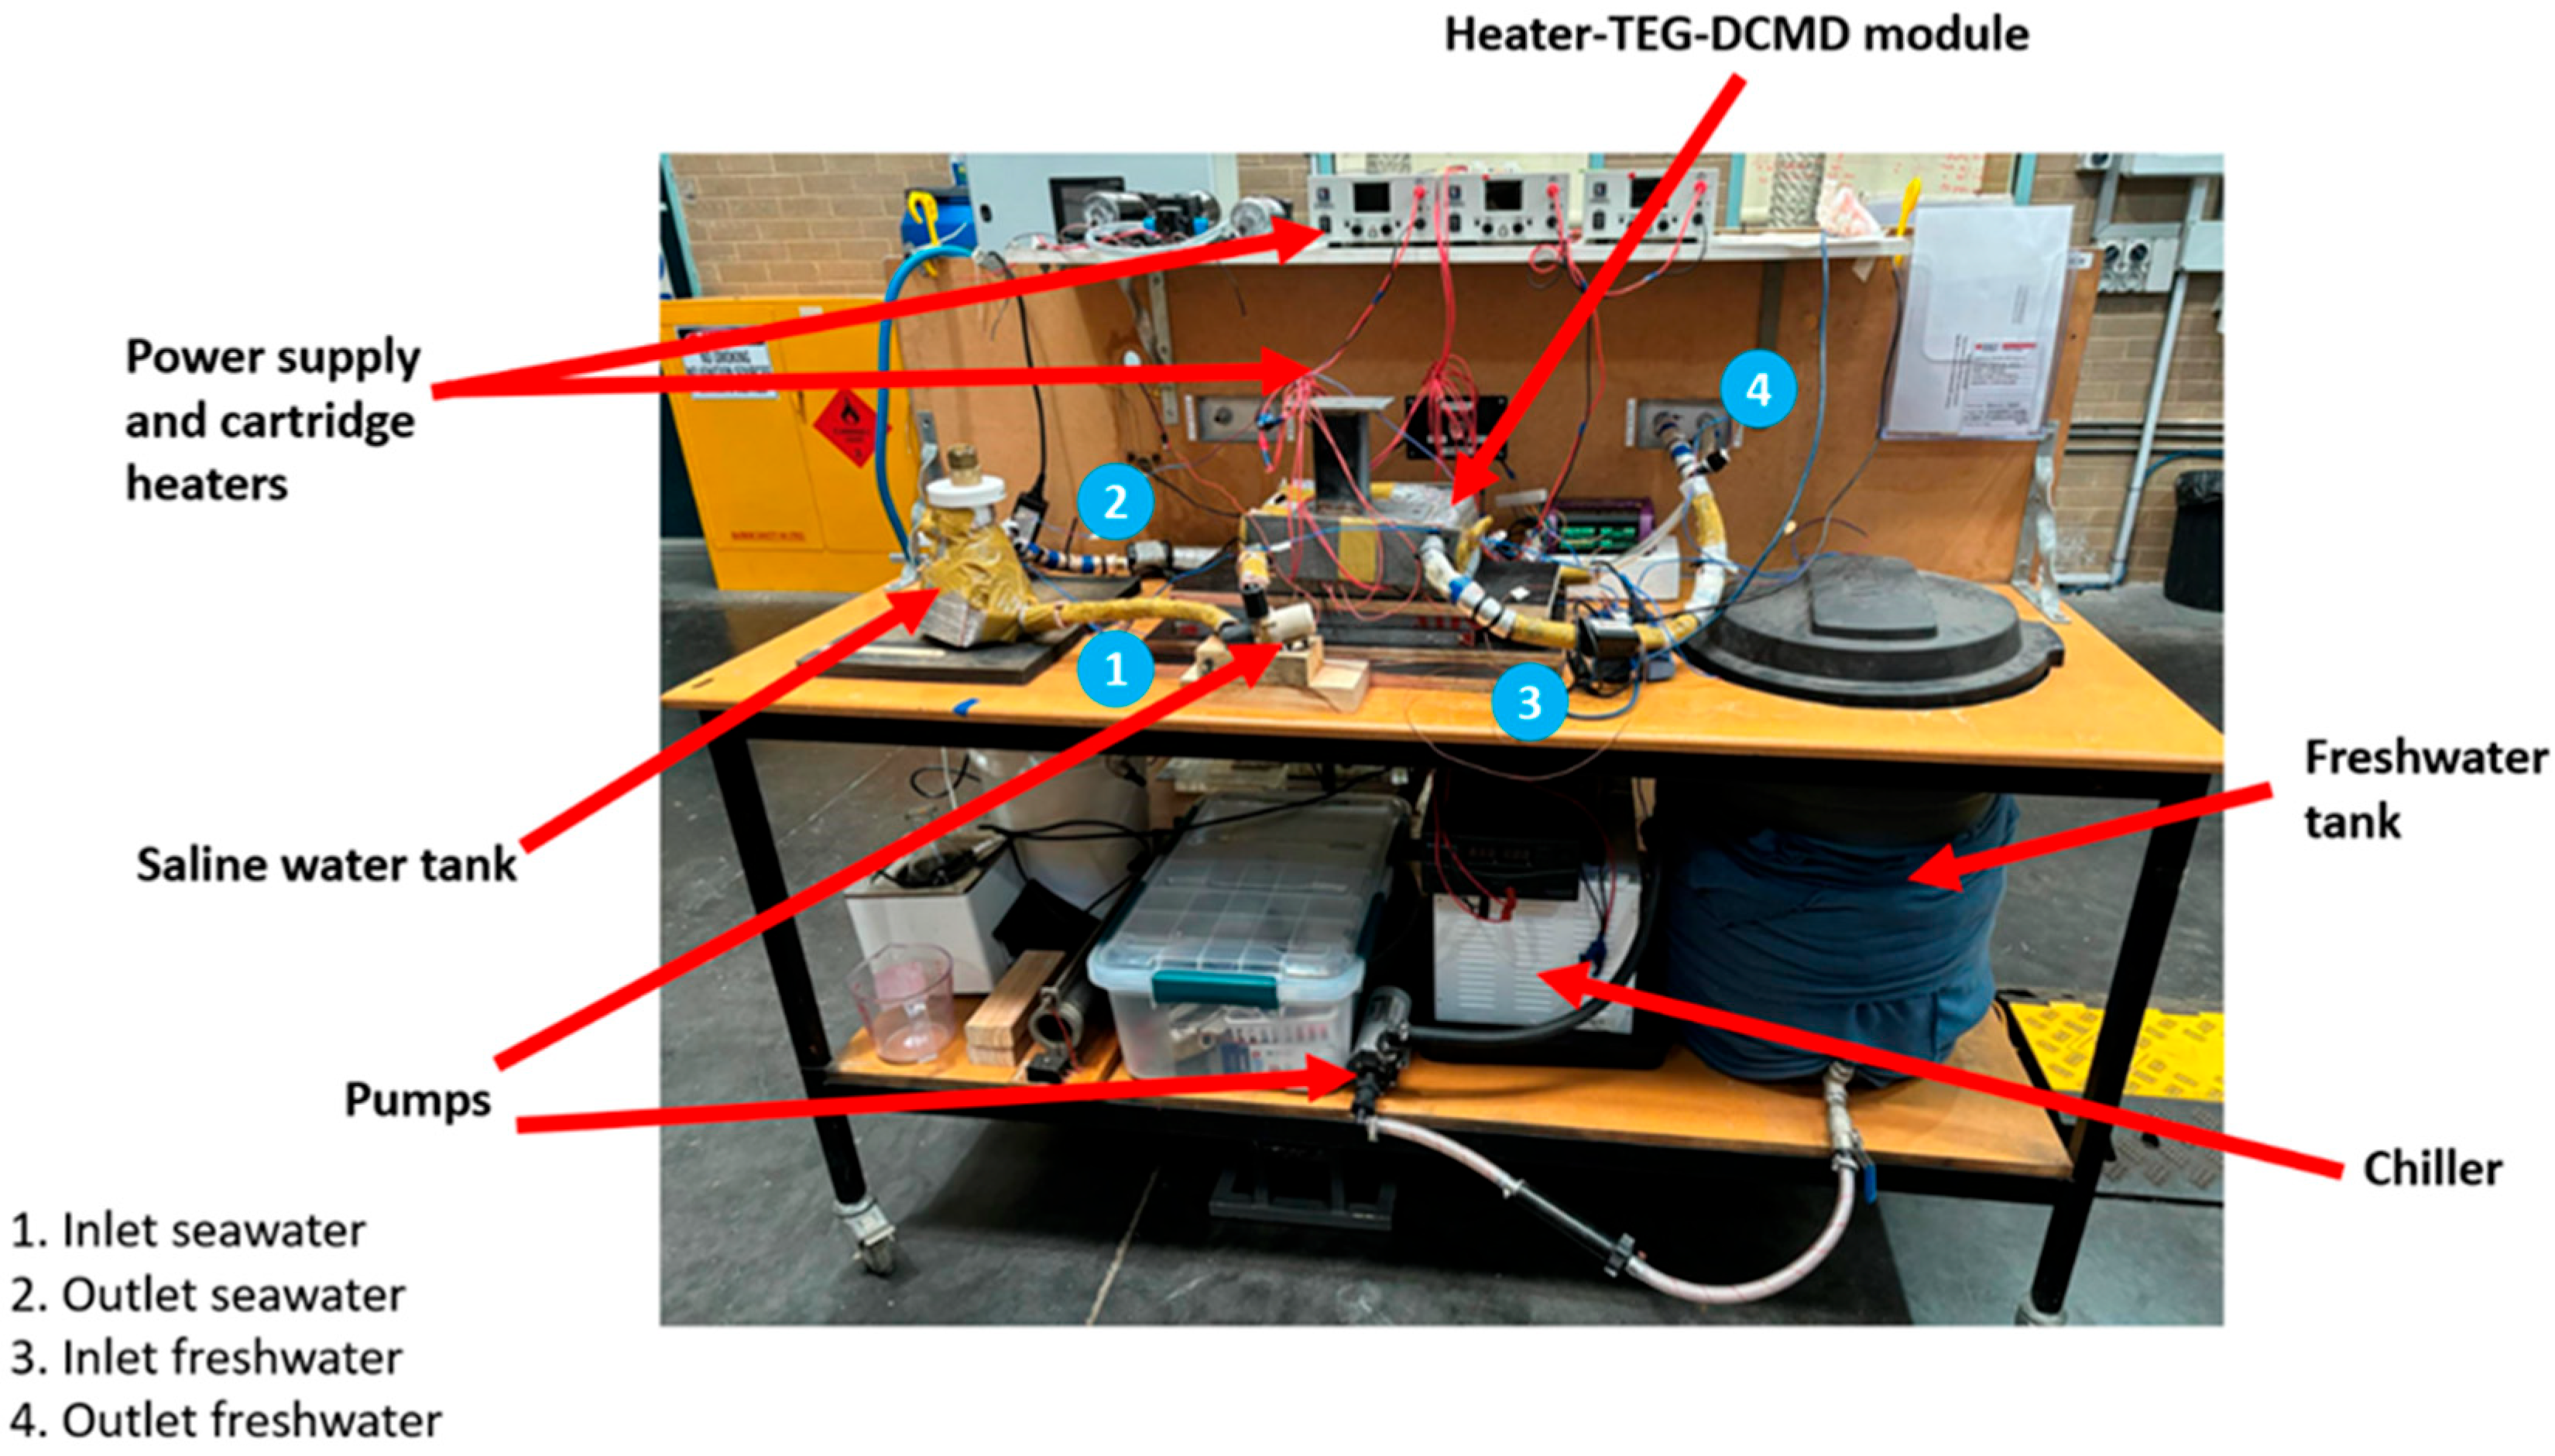
Additionally, as shown in Figure 2, the weight scale is placed under the feed water tank to estimate the amount of mass loss, which is assumed to be equal to the mass of freshwater production. Adjustable resistance is connected to the TEG with multimeters to measure electrical output.
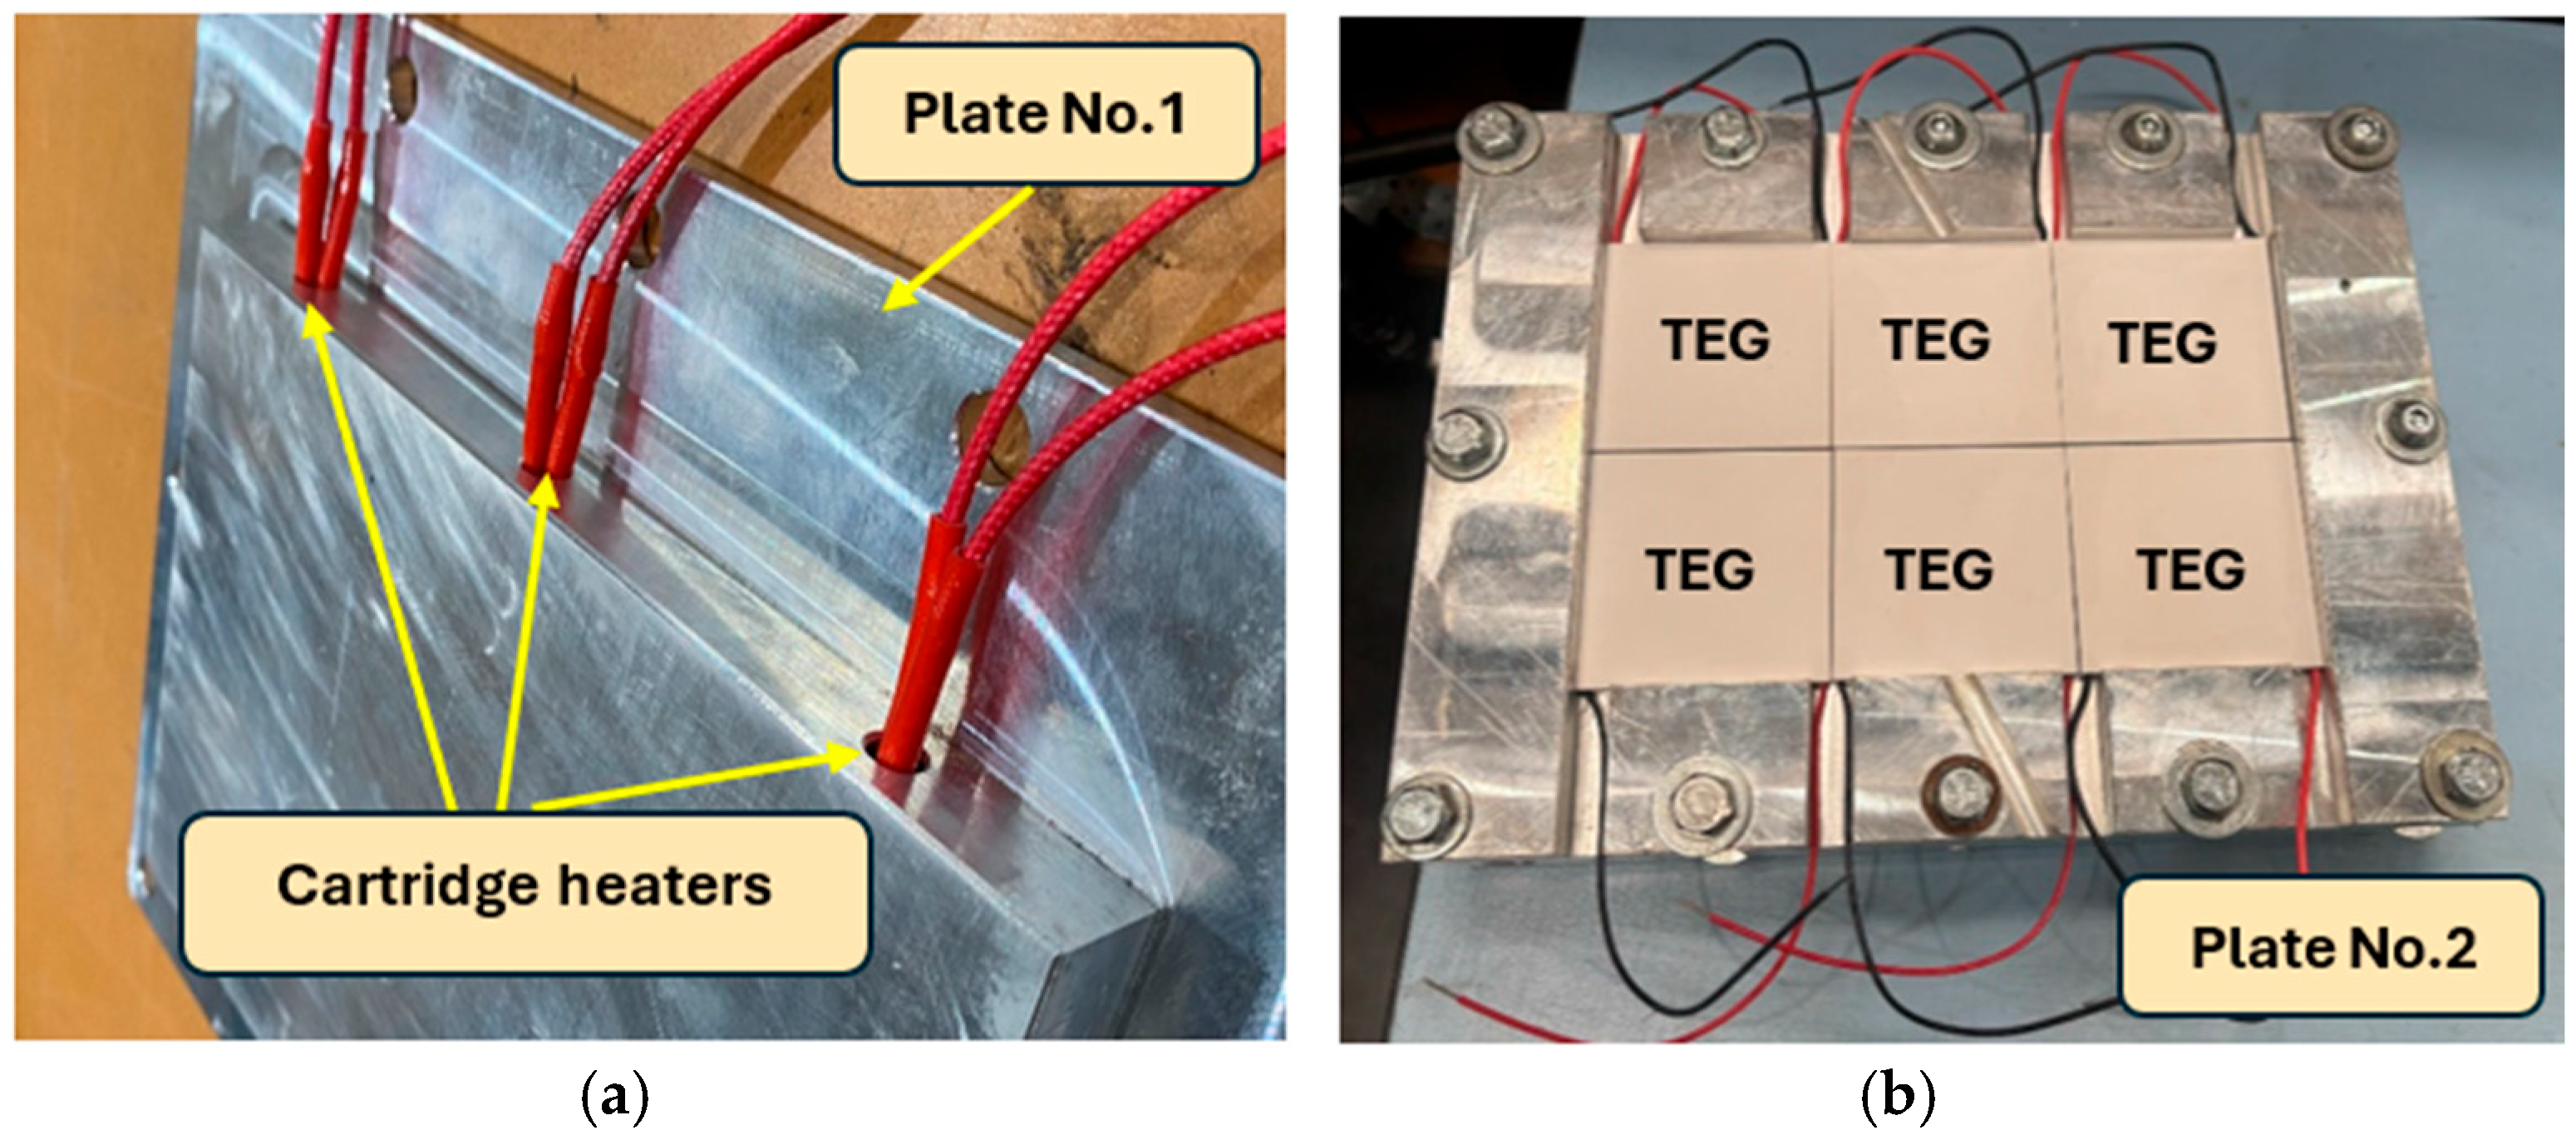
At the start of each experiment, the saline feed and permeate tanks were filled with the required solutions, and the circulation pumps were activated to establish the desired feed and permeate flow rates. The electrical heater embedded in Plate No. 1 (as shown in Figure 3 and Figure 4a) was then switched on to supply the prescribed heat input, simulating low-grade industrial waste heat. The permeate-side temperature was controlled using a chiller and helical coil heat exchanger to maintain a nearly constant cold-side temperature.
The system was allowed to operate until steady-state conditions were achieved, as indicated by the stable temperatures at all thermocouple locations, constant electrical output from the TEG modules, and a linear change in permeate mass with time. The integrated system attained steady state after approximately 90 min. Once the steady state was confirmed, experimental data including temperatures, flow rates, voltage, current, and permeate mass were recorded continuously for an additional 90 min. Freshwater production was determined from the mass change in the feed tank using a digital balance, while the electrical power output was calculated from the measured voltage and current across an adjustable external load. A variable load resistance was used to measure the power output of the TEG’s. Voltage and current were measured at varying loads to estimate the maximum power output. Each test condition was repeated at least three times to ensure repeatability, and averaged values are reported.
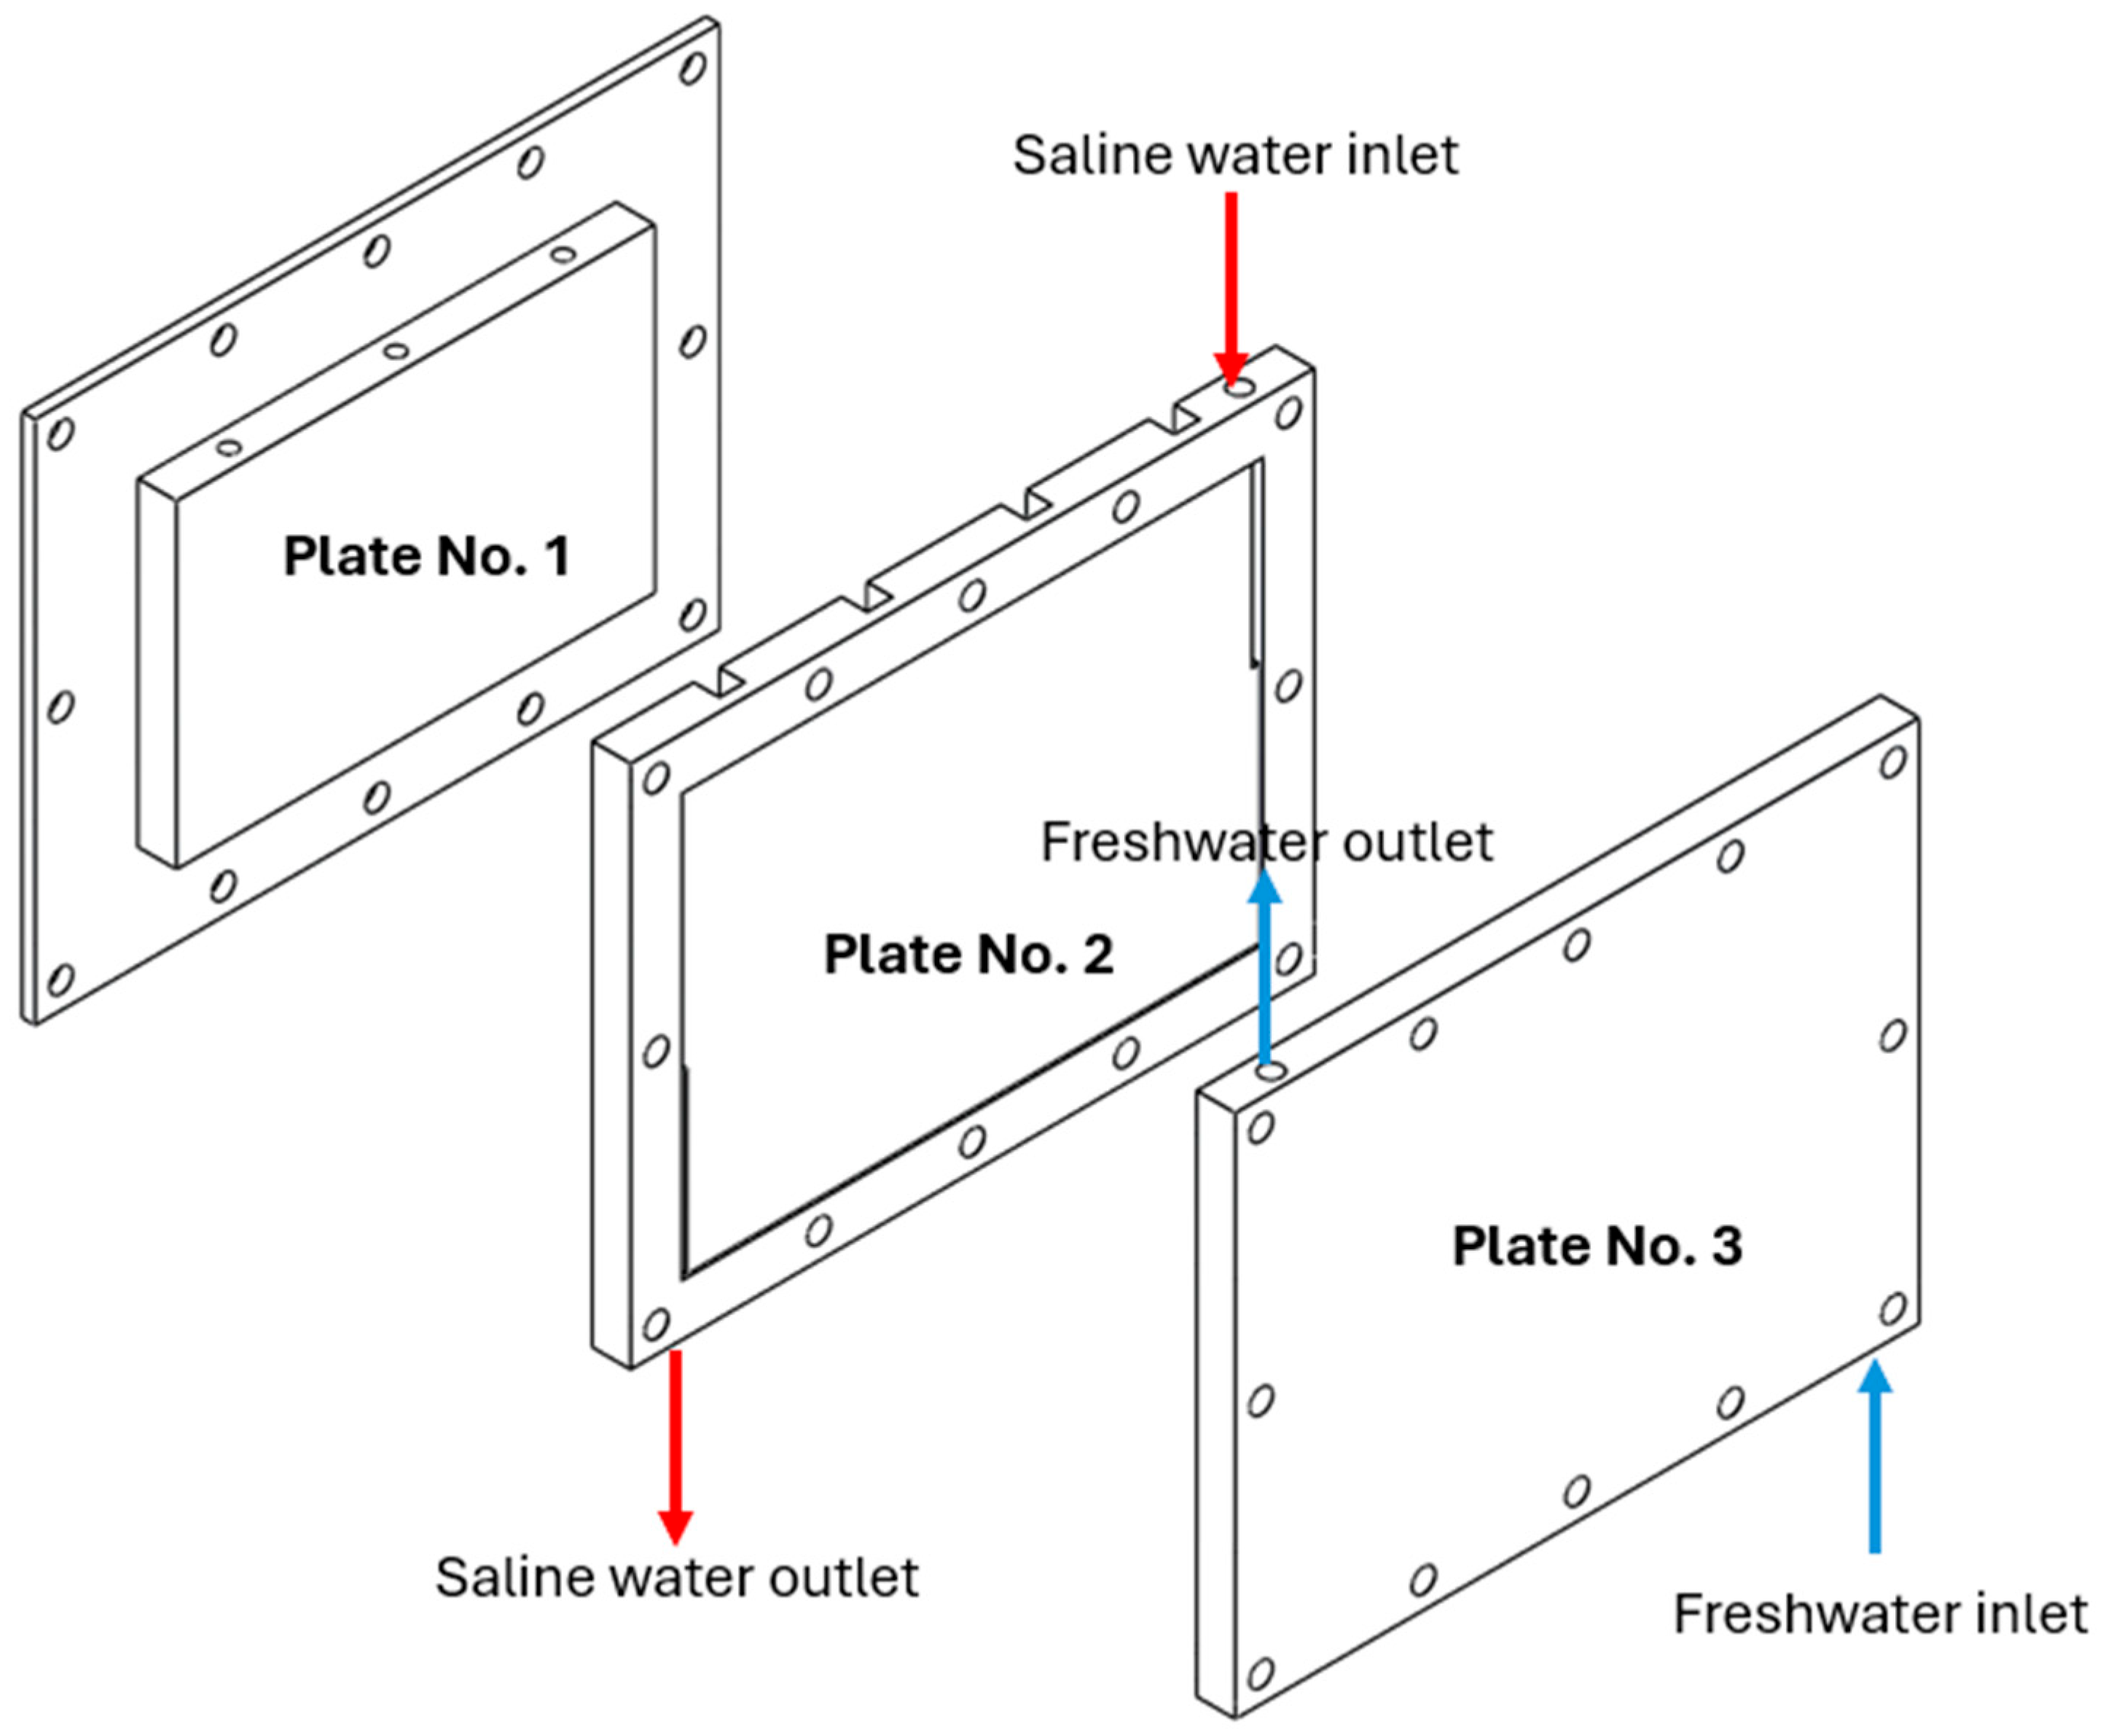
The TEG-MD module can be divided into two sections, the electrical generation system and freshwater production system. Table 1 shows the properties of TEG and Membrane used in this research. Firstly, to obtain the power output, the electrical generation system in this research consists of Plate No.1, to the right side of Plate No.2, as shown in Figure 3. Also, cartridge heaters are placed in Plate No.1, as shown in Figure 4a, and TEGs, which are arranged in series electrically, are placed between Plate No.1 and Plate No.2, as shown in Figure 4b. Secondly, next to the TEG system is the DCMD configuration that receives the rest of the waste heat from the TEG to increase the temperature of the saline water. Saline water and permeate water flow through Plate No.2 and Plate No.3, respectively, as shown in Figure 3.
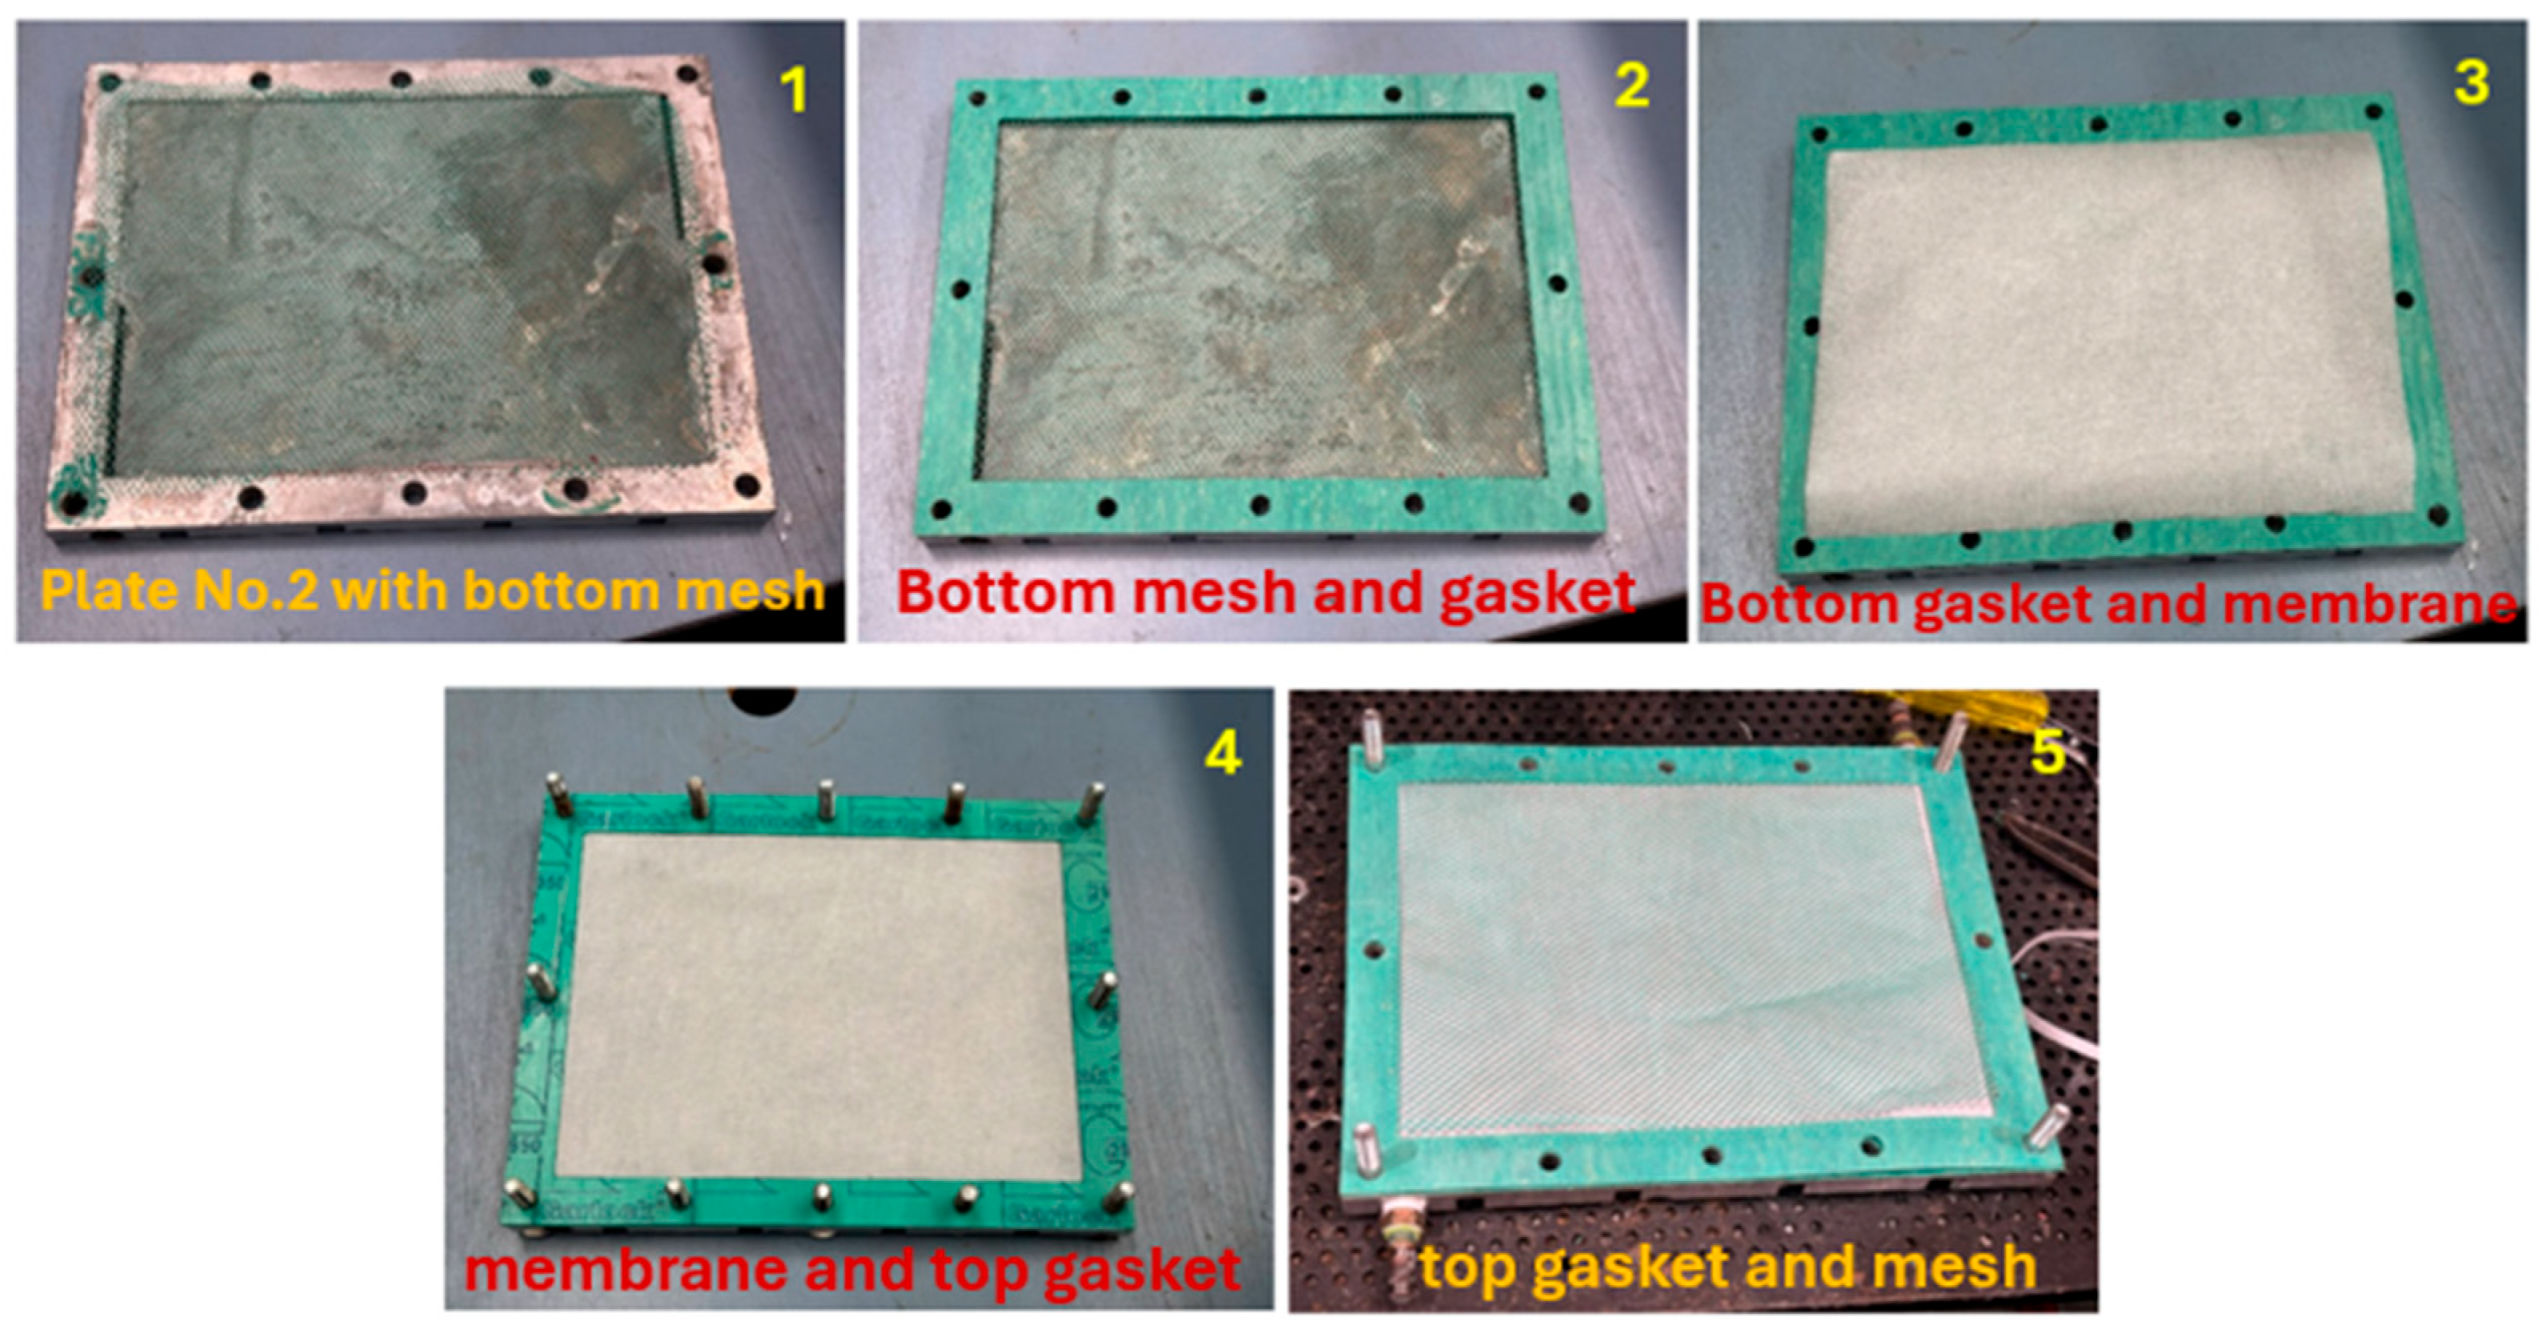
Finally, mesh, gaskets and a hydrophobic membrane are placed between Plate No.2 and Plate No.3, as shown in Figure 5. Mesh is used to create turbulence flow which increases the heat transfer rate. A gasket is also used to improve the water leakage.
In the first step, the bottom mesh is placed on Plate No.2. Secondly, the bottom gasket is placed on Plate No. 2. Then, the hydrophobic membrane is placed on top of the bottom gasket, and the hydrophobic side must be down. In step 4 and step 5, the top gasket and top mesh are placed on the top, respectively. In addition, between all five steps, bolts can be placed throughout Plate No.2 and the gaskets. The last step involves placing Plate No.3 and tightening the nuts.

2.2. Mathematical Modelling

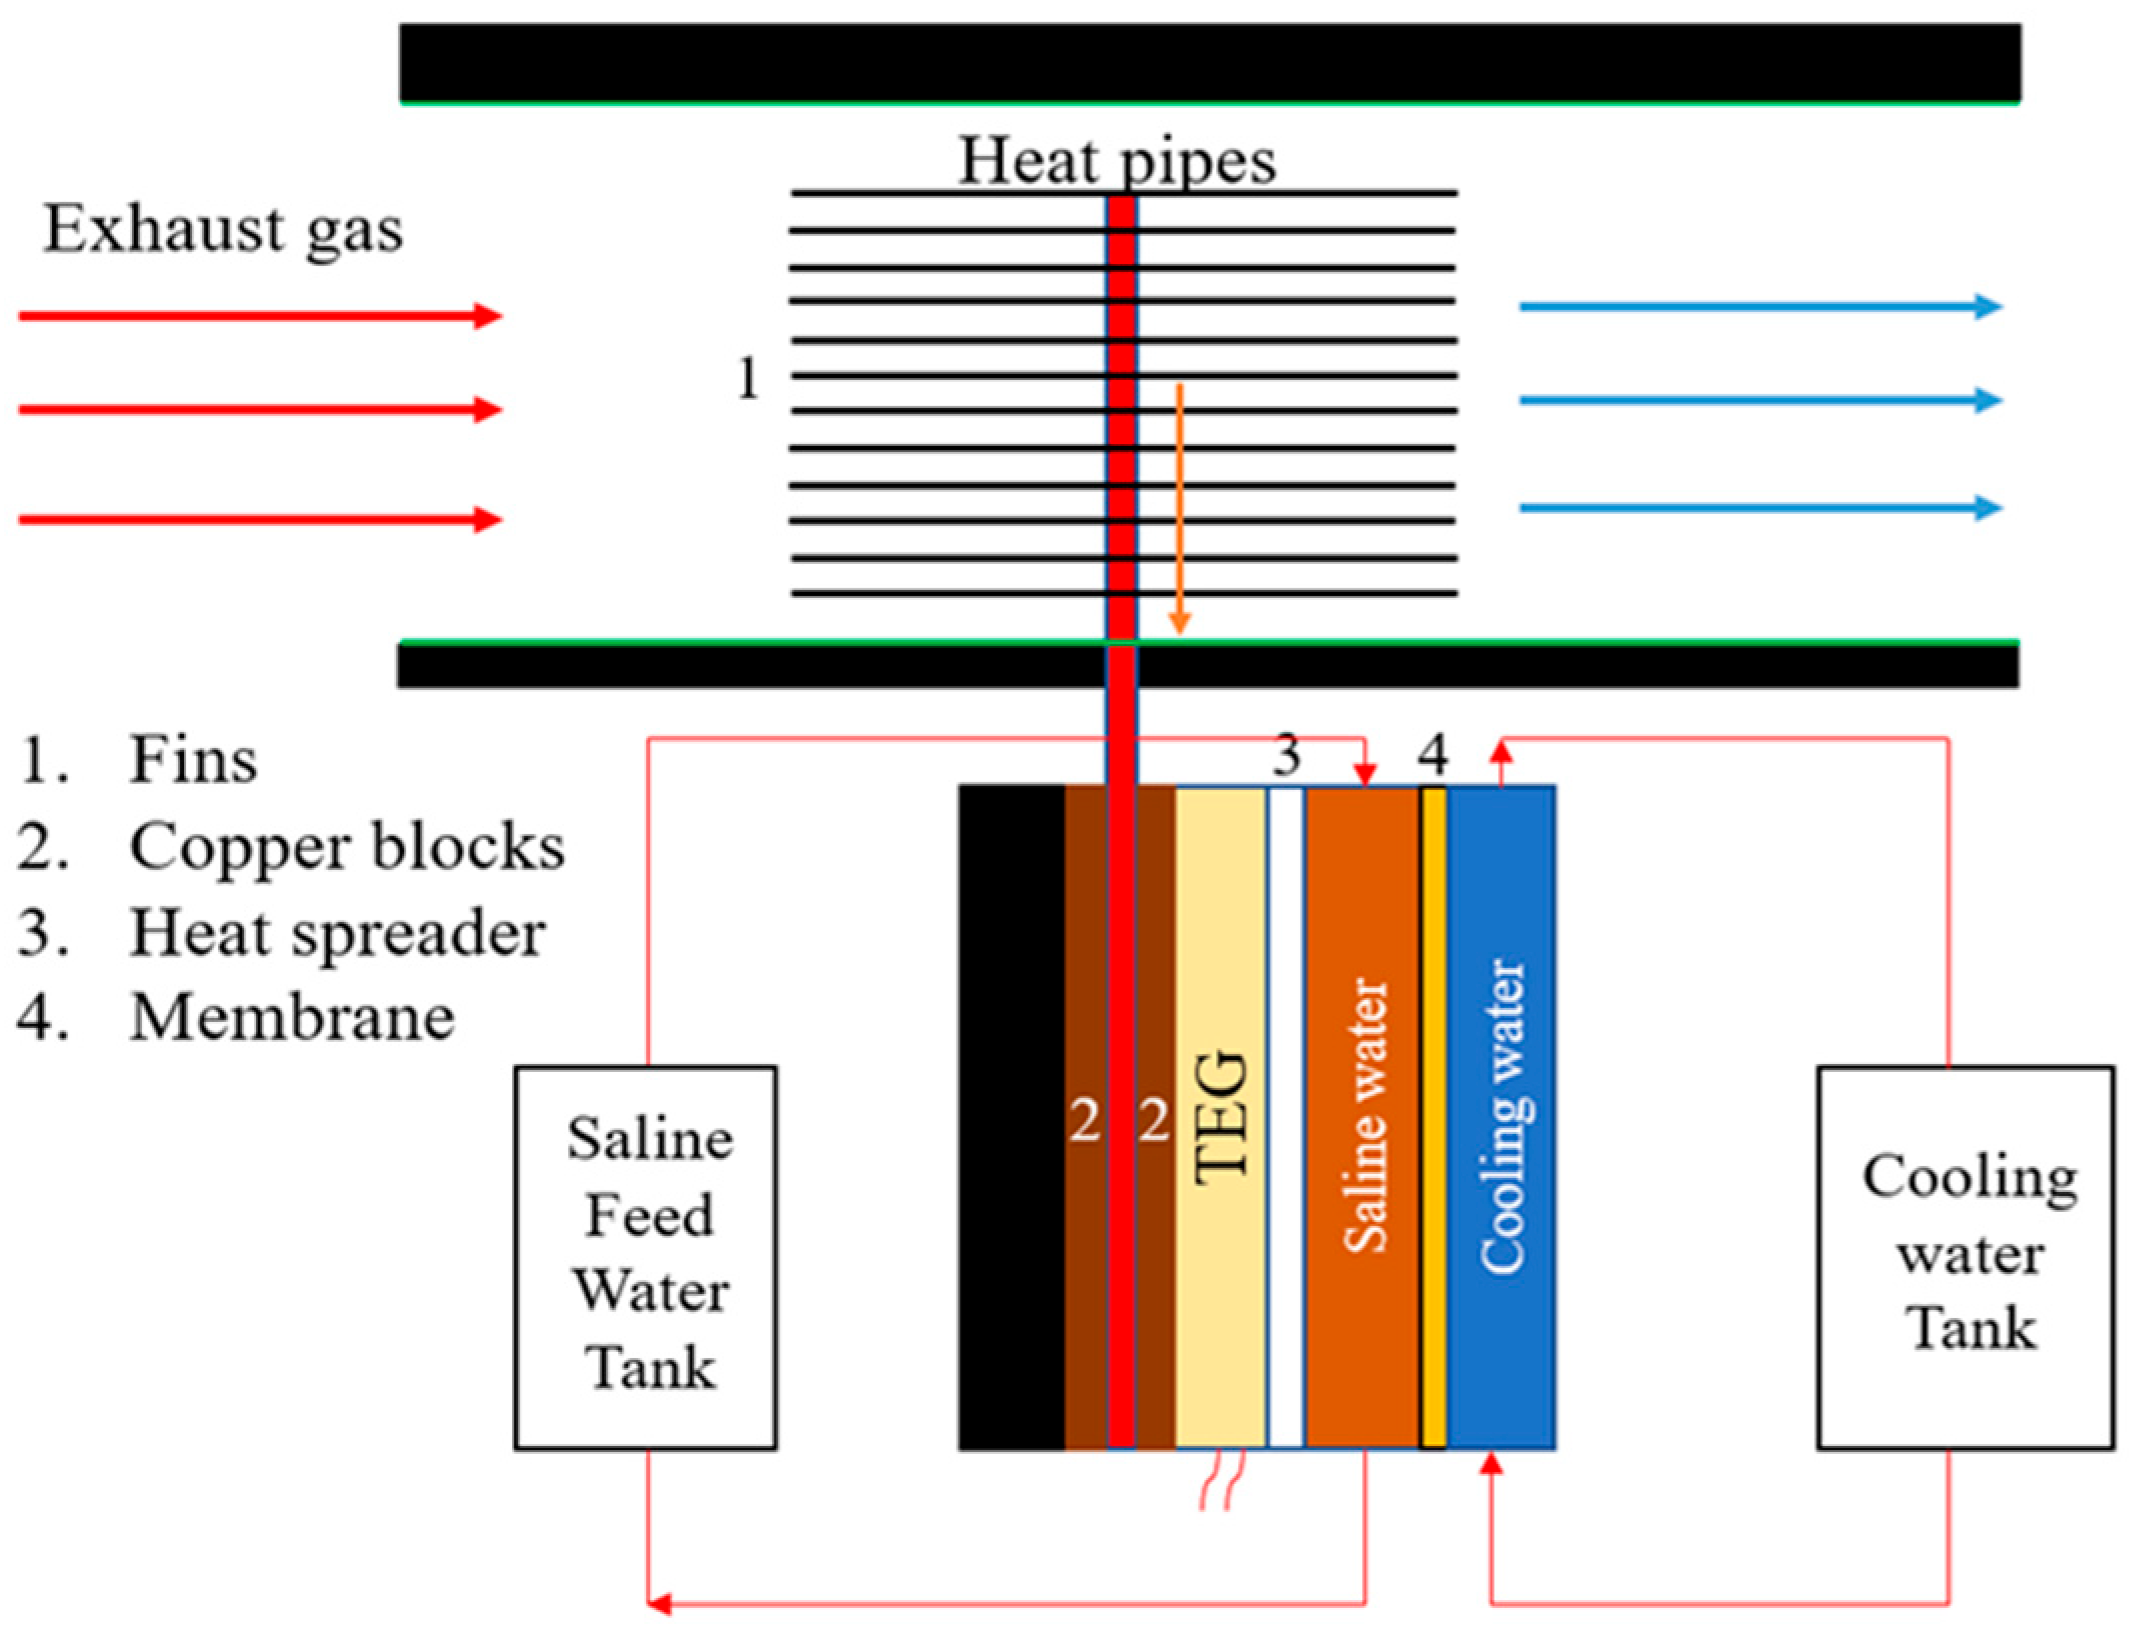
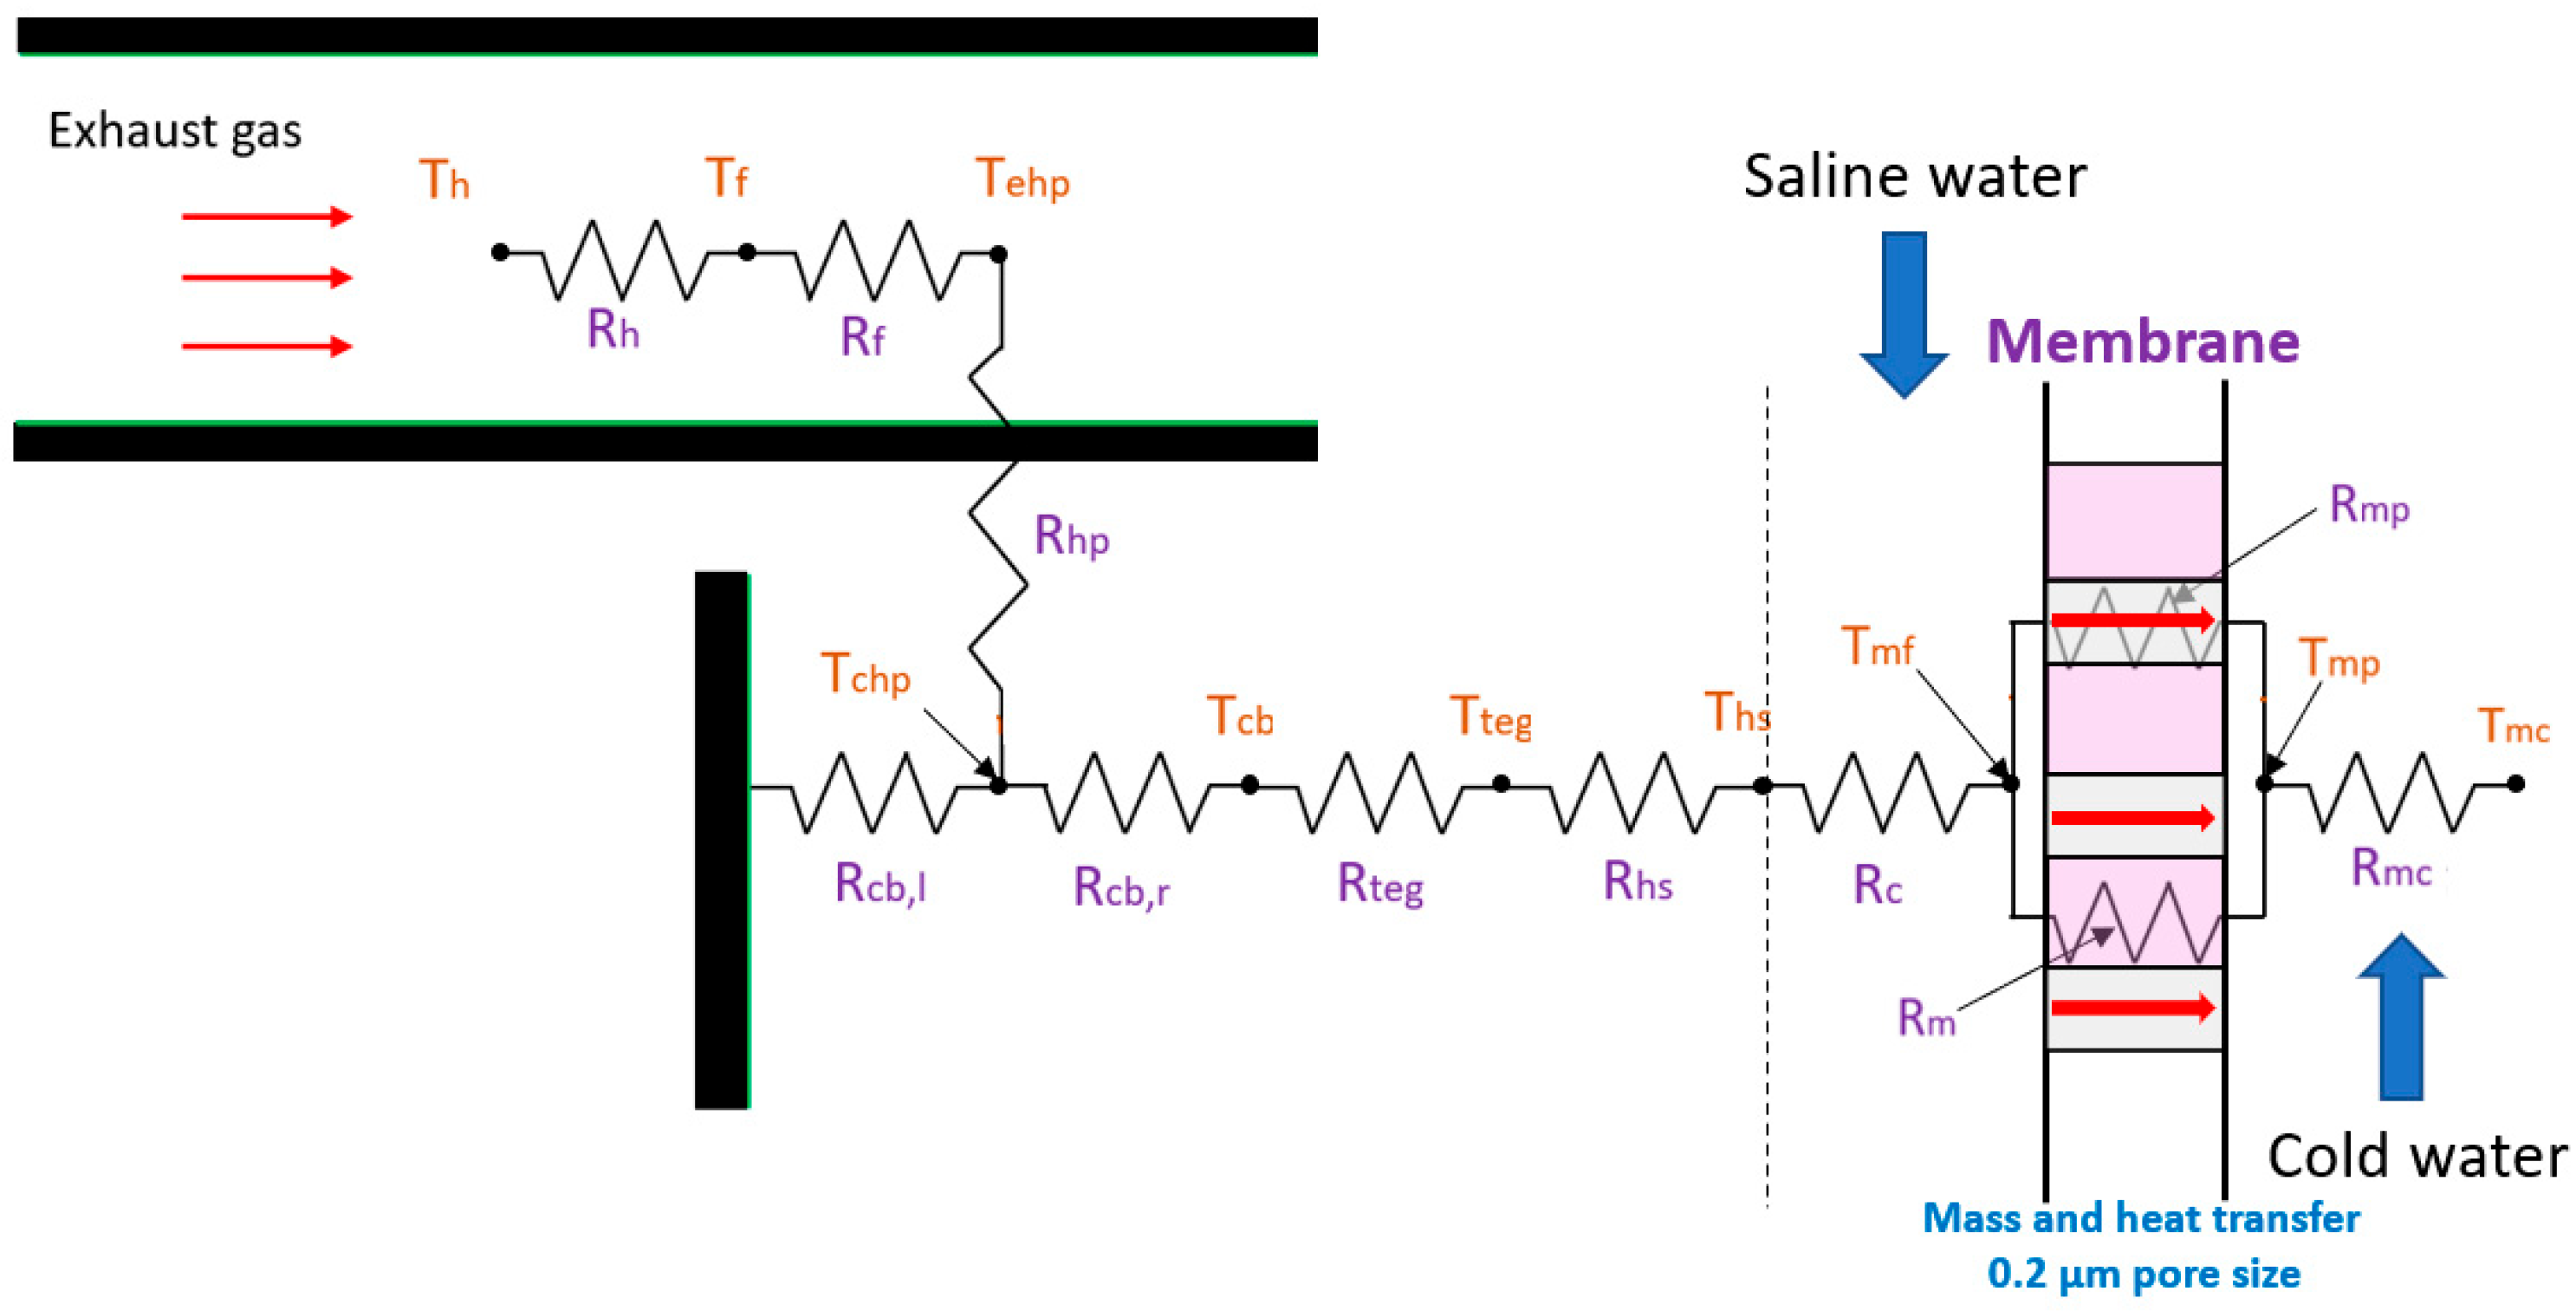
This research creates the model using MATLAB R2024b to predict power generation and freshwater in terms of mass flux. The design model consists of 62 fins, four heat pipes, six TEGs and a DCMD configuration which comprise the potential application design system, as shown in Figure 6, as well as the thermal resistance, as shown in Figure 7, which can help to understand the system and its use for predicting electrical generation, distilled water and system performance.

2.2.1. Waste Heat Recovery to Generate Power by Using Thermoelectric Generation

According to the thermal resistance diagram, start with the thermal resistance of exhaust gas until saline water, for thermoelectric generation calculation. Therefore, the resistance can be determined as in the following equations.
The convective resistance of hot air is calculated as follows [31]:
R h = 1 u 0 h a A t
where h a is the convective heat transfer coefficient of air ( W / m 2 · K ), which can be calculated by following equation:
h a = N u a k a D h , a
where D h , a is hydraulic diameter of fin ( m ), and the Nusselt number can be computed as follows [32]:
N u a = 0.8 R e a 0.4 P r a 0.36
where P r a is the Prandtl number of air and the overall surface efficiency may be calculated as [32]
u 0 = 1 ( N f A f A t ( 1 u f ) )
where A t = N f A f + A b is the total surface area ( m 2 );
N f is number of fins;
A f is fin area ( m 2 );
A b is un-finned area ( m 2 ).
Fin efficiency is computed by following equation:
u f = t a n h ( m l f ) m l f
where m = ( 2 h a k f t f ) 1 / 2 and l f is fin width ( m ).
The heat pipe resistance consists of four thermal resistances, which are shown as follows:
R h p = 1 N h p · ( R p , e + R w , e + R w , c + R p , c )
R p , e = l n ( d o d i ) 2 π L e , c k h p
where d o is the outside diameter of the heat pipe, d i is the inside diameter, L e , c is the length of both the evaporator and condenser and k h p is the thermal conductivity of the heat pipe.
R w , e = l n ( d i d v ) 2 π L e , c k e f f
where d v is the vapour spacing and effective thermal conductivity k e f f = ε k l + k w ( 1 ε ) , k l is the water conductivity and k w is the wick conductivity. The wick porosity may be calculated by following equation:
ε = 1 1 4 ( 1.05 ) π N w d w
where N w is the number of mesh and d w is the wire diameter.
The resistance of the fin and TEG can be calculated as per Equation (10):
R = 1 N · t k A
where t   is the thickness of the material ( m ), k is the thermal conductivity ( W / m · K ) and N is the number of fins or TEGs.
The conduction resistance of the copper block and heat spreader may be calculated by Equation (11):
R = t k A
The convective resistance of the saline water can be computed as follows:
R c = 1 h s w A c b
h s w = N u c k c D h , c
N u c = 0.3387 P r c 1 / 3 R e c 1 / 2 ( 1 + ( 0.0468 P r c ) 2 / 3 ) 1 / 4
The temperature of each component is estimated by using the implicit finite difference method as a transient state until the temperature reaches a steady state. The node equation can be derived from energy balance method [32].
E ˙ i n + E ˙ o u t = E ˙ s t
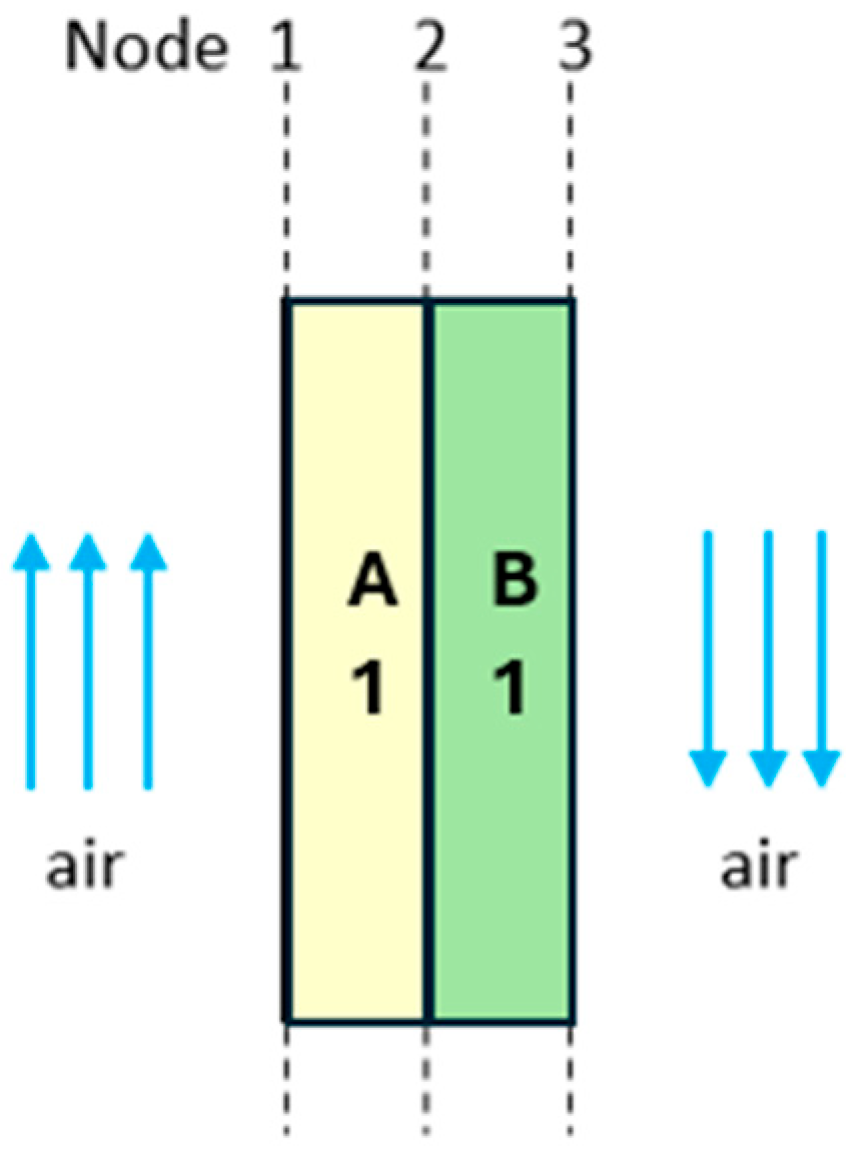
The surface node and interior node are shown in Figure 8. Equation (16) is the equation of the surface node (node 1 and node 3).
( 1 + 2 t R a i r ( ρ C p A x ) A 1 + 2 t ( R ρ C p A x ) A 1 ) T m p + 1 ( 2 t ( R ρ C p A x ) A 1 ) T m + 1 p + 1 = T m p + ( 2 t R a i r ( ρ C p A x ) A 1 ) T
where subscript m is the node number and superscript p and p + 1 are the current step and next step, respectively.
The interior node (node 2) can be calculated as per the following equation:
( 2 t R A 1 + 2 t R B 1 + ( ρ C p A x ) A 1 + ( ρ C p A x ) B 1 ) T m p + 1 ( 2 t R A 1 ) T m 1 p + 1 ( 2 t R B 1 ) T m + 1 p + 1 = ( ( ρ C p A x ) A 1 + ( ρ C p A x ) B 1 ) T m p
The heat transfer rate can be determined by using Equation (18)
Q ˙ i n = ( T h T c ) R T E G + s p r e a d e r = k T E G + s p r e a d e r × A × ( T h T c ) L T E G + s p r e a d e r
Equation (18) presents the means of estimating the rate of heat flow across the TEG, which is approximately equal to the rate of heat flowing into the feed water Q ˙ f . Here, the thermal resistance of the TEG + heat spreader includes the contact thermal resistance. The thermal resistance value was obtained from the literature [33], which gave the value as 0.08 K/W to 0.102 K/W (equal to k of 1.3 to 1.5 W/m.K) with an uncertainty of ±7.5%.

2.2.2. Heating Saline Water for Membrane Desalination Process

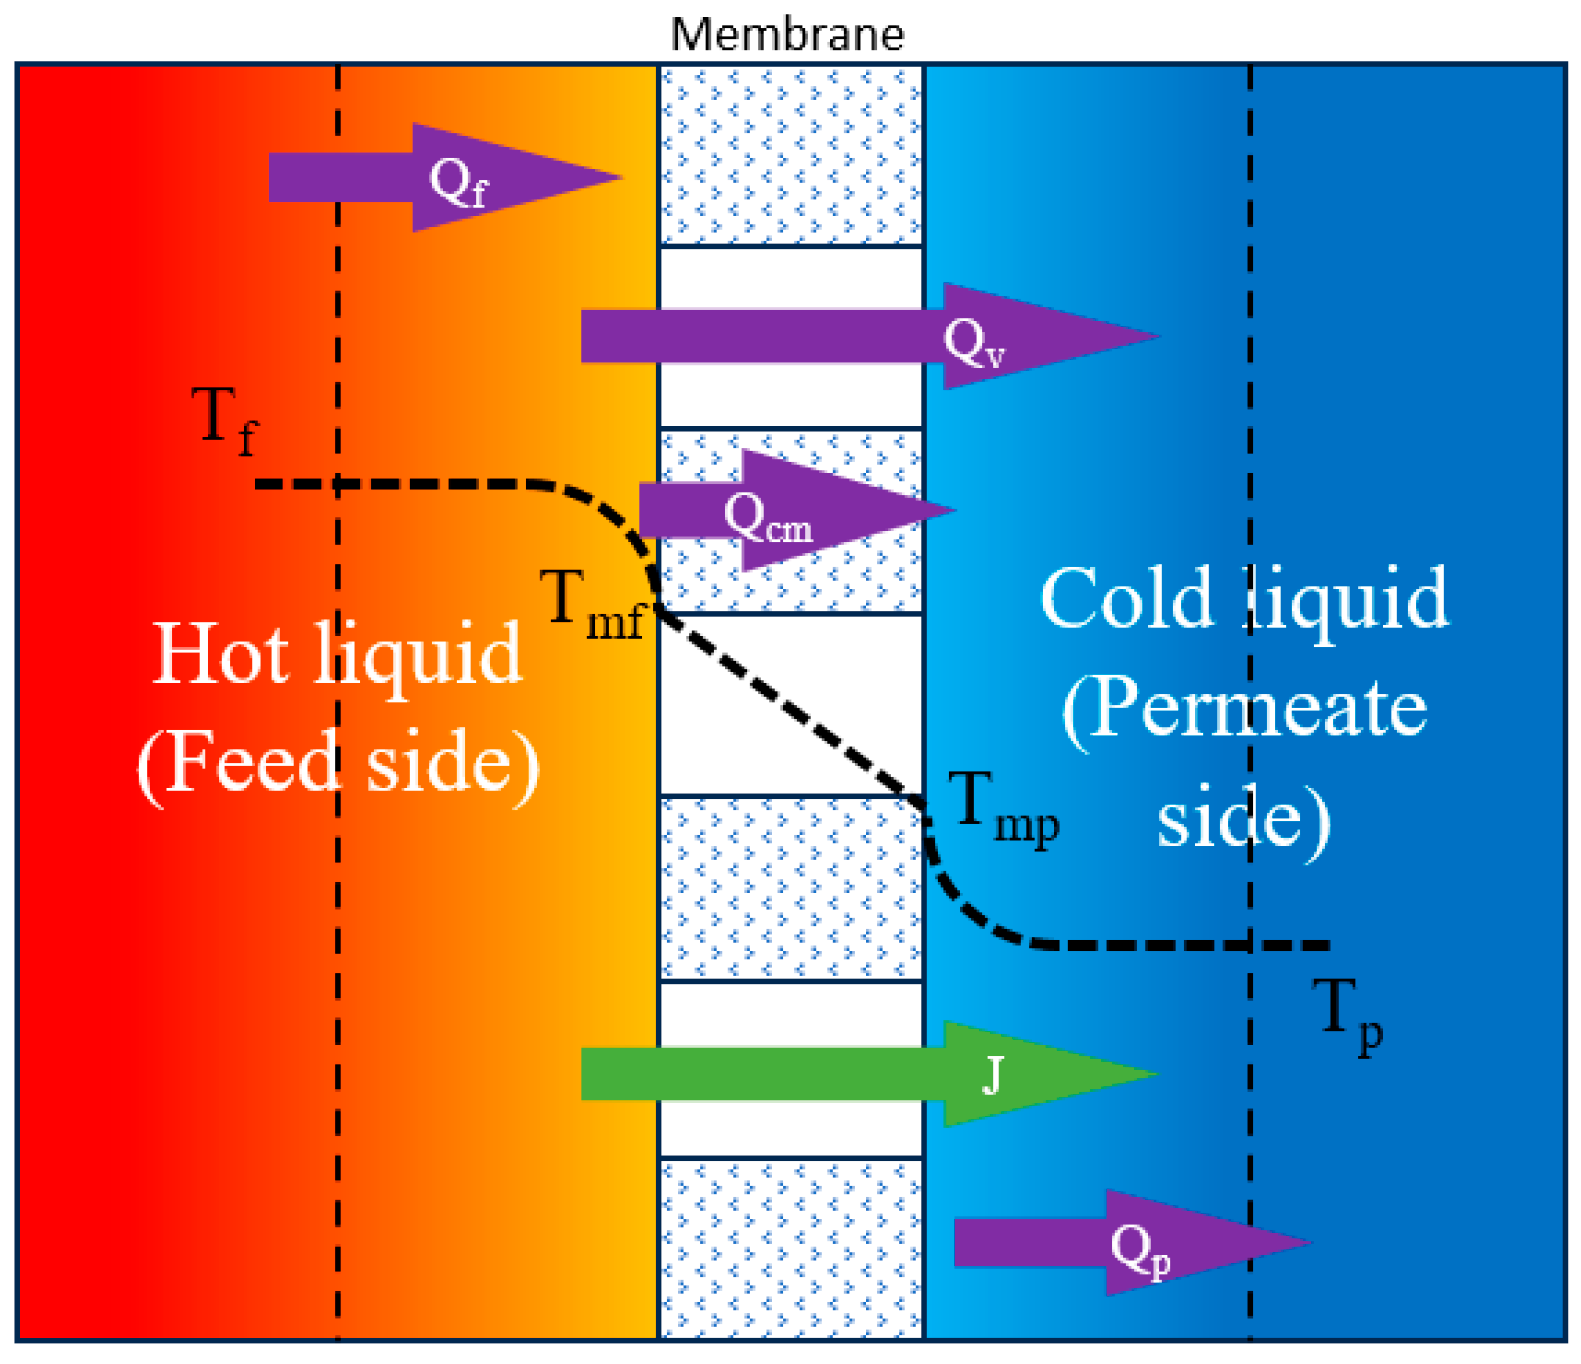
The distillation process involves both heat transfer and mass transfer occurring in the membrane, as shown in Figure 9. The heat transfer through the feed side ( Q ˙ f ) is dependent on the bulk feed temperature ( T f ) and membrane feed temperature ( T m f ), which can be determined by Equation (19). On the other hand, convective heat transfer through the permeate side ( Q ˙ p ) is dependent on the bulk permeate temperature ( T p ) and membrane permeate temperature ( T m p ), which can be determined by Equation (20). In addition, the temperature profile shows that the temperature of the feed water and permeate water drop near the surface area.
Q ˙ f = A h f ( T f T m f )
Q ˙ p = A h p ( T m p T p )
where h f is the convective heat transfer coefficient of the feed solution;   h p is the convective heat transfer coefficient of the permeate solution; and A is the area of the heat transfer.
The rate of the heat transfer of the membrane ( Q ˙ m ) is based on conduction heat loss ( Q ˙ c m ) and the heat transfer of the vapour through membrane ( Q ˙ v ). Membrane heat transfer rate can be calculated by Equation (21):
Q ˙ m = Q ˙ c m + Q ˙ v = A k m ( T m f T m p δ m ) + A J H v , w
where k m is the thermal conductivity of membrane and δ m is the thickness of the membrane. J and H v , w are the mass flux and vapour enthalpy of water, which can be calculated by Equation (22) and Equation (23), respectively.
J = C k m ( P v , s w P v , w )
H v , w = 1.7535 T m f + 2024.3
where P v , w and P v , s w are the vapour pressure of water and seawater, which can be estimated by Equation (24) and Equation (25) [34], respectively.
P v , w = e x p ( a 1 T m p + a 2 + a 3 T m p + a 4 T m p 2 + a 5 T m p 3 + a 6 × l n ( T m p ) )
P v , s w = P v , w × e x p ( 4.5818 × 10 4 S 2.04431 × 10 6 S 2 )
where S is salinity ( 0 160   g / k g ) .
a 1 = 5800 ,   a 2 = 1.3915 ,   a 3 = 4.8640 × 10 2
a 4 = 4.1765 × 10 5 ,   a 5 = 1.4452 × 10 8 ,   a 6 = 6.5460
C k m is the mass transfer coefficient of Knudsen–molecular diffusion as follows from Equation (26) [35]. The Knudsen number ( K n ) is a dimensionless number that is used to indicate the membrane distillation coefficient equation. The Knudsen number relies on the mean free path ( λ ) and the pore diameter of membrane ( d p ), i.e., K n = 2 λ / d p . Under the feed water operating temperature range of this study (approximately 40–42 °C) and atmospheric pressure, the mean free path of the water vapour was estimated to be around 0.12 µm. For the membrane pore diameter of 0.22 µm, the resulting Knudsen number is around K n = 1.1 . Since the Knudsen number in the range of 0.01 < K n < 10   corresponds to the transition regime where both molecular diffusion and Knudsen diffusion contribute to mass transport, the combined Knudsen–molecular diffusion is used.
C k m = 1 R T δ m ( 3 τ 2 ε m r ( π M 8 R g T ) 0.5 + P a τ ε m P t D w a ) 1
P t D w a = 1.895 × 10 5 T m 2.072
where ε m , δ m ,   R g , M ,   τ , r and P a are the porosity of membrane, membrane thickness, gas constant, molecular weight of water, membrane tortuosity, mean pore size radius, and entrapped air pressure, respectively.
This model assumes that heat transfer rates are equal in the steady-state condition.
Q ˙ i n = Q ˙ f = Q ˙ m = Q ˙ p
The total convective heat transfer coefficient can be derived via Equation (32).
1 H = 1 h f + 1 k m δ m + J H v , w ( T m f T m p ) + 1 h p
The temperature of the membrane feed and membrane permeate can be described by Equations (30) and (31).
T m f = H × ( T p + h f h p T f ) + h f T f J H v , w H + h f ( 1 + H h p )
T m p = H × ( T f + h p h f T p ) + h p T p + J H v , w H + h p ( 1 + H h f ) ;   h m = k m δ m
The Gain Output Ratio (GOR) predicts the efficiency of the energy input, which is utilized to produce the mass flux.
G O R = A × J × H v , w Q ˙ f
The Specific Energy Consumption (SEC) is the overall energy requirement for producing 1 m2 of freshwater.
S E C = Q ˙ f × 3600 A × J
The Energy utilization efficiency (EUE) can be determined by Equation (34).
P o w e r   o f   T E G + ( J × A × H v , w ) H e a t   i n p u t
Exergy efficiency can be computed by Equation (35).
P o w e r   o f   T E G + E x e r g y   o f   w a t e r E x e r g y   o f   h e a t   i n p u t
where the exergy of water and the exergy of heat input can be calculated by Equations (36) and (40), respectively.
e x e r g y   o f   w a t e r = J × [ H v , w × ( 1 T 0 T m ) + C p × ( T p T 0 ) + T 0 × l n ( T p T 0 ) ]
e x e r g y   o f   h e a t   i n p u t = h e a t   i n p u t × ( 1 T 0 T h )
The Water–Electrical Energy Cogeneration Index (WeECI) can be calculated by the following equation, and the unit of WeECI is kJe/kg.
W e E C I = P o w e r   o f   T E G J

2.2.3. Calculation of Mathematical Modelling

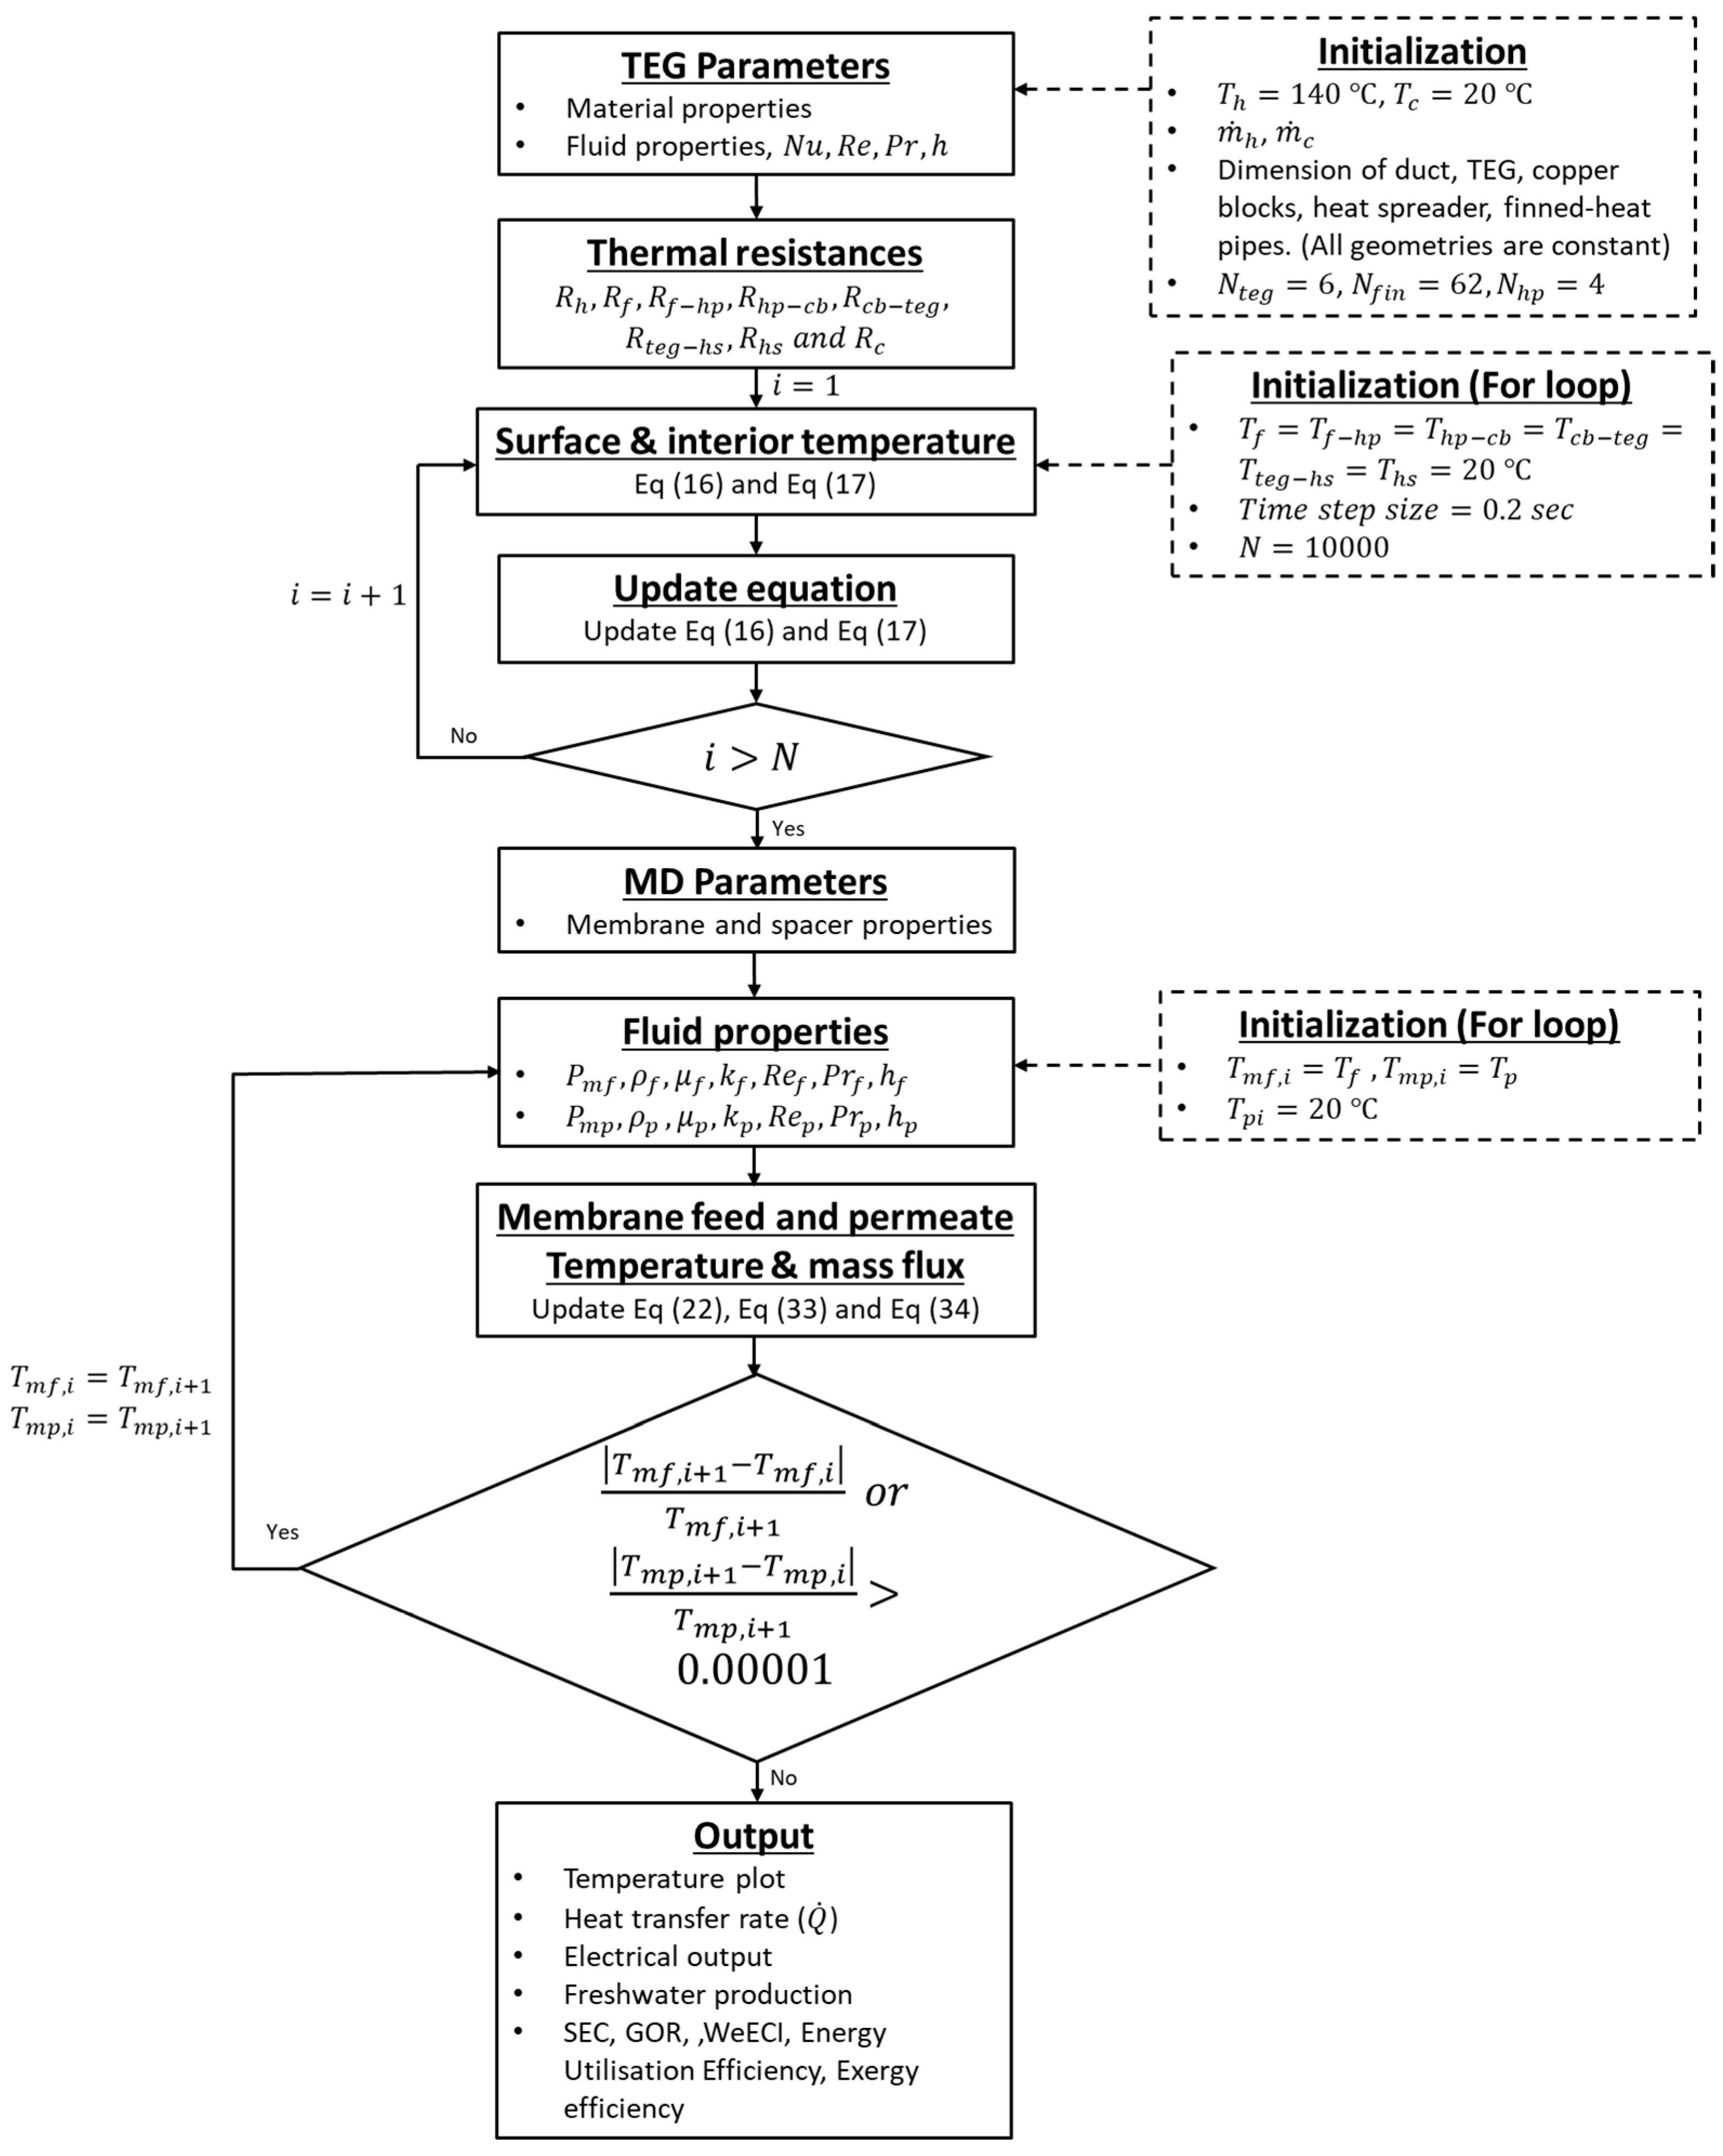
The modelling starts with initial variables such as the exhaust gas temperature and the cold-side temperature of the TEG, as shown in Figure 10, to predict the electrical output of the integrated system, and then temperatures from the first calculation will be the initial parameters for the water desalination system. The temperature profile, heat transfer rate, freshwater production, power output and system performance will be shown as a final result of the system.

2.2.4. Uncertainty Analysis

The uncertainty of the measured parameters, including temperature, flow rate, voltage, and current, was estimated based on the manufacturers of the measuring instruments’ specifications. The combined uncertainty of the derived quantities such as the heat transfer rate, freshwater mass flux, and electrical power output was evaluated using standard error propagation methods and was found to be within ±8%. For example, the following equations have been used to estimate the uncertainty associated with the rate of heat input based on Equation (18).
Q ˙ i n = k T E G + s p r e a d e r × A × ( T h T c ) L T E G + s p r e a d e r = k A d T L
The absolute uncertainty associated with the estimated rate of heat input was determined using the law of propagation of uncertainty, under the assumption that the contributing variables (thermal conductivity, temperature difference, area, and thickness) are measured independently and have no mutual correlation.
Q ˙ i n = ( A × d T L k ) 2 + ( k × d T L A ) 2 + ( k × A L d T ) 2 + ( k × A × d T L 2 L ) 2
Relative   uncertainty   Q ˙ i n Q ˙ i n = ( A × d T L k ) 2 + ( k × d T L A ) 2 + ( k × A L d T ) 2 + ( k × A × d T L 2 L ) 2 Q ˙ i n
The following is a sample calculation that shows how uncertainty was estimated; here, we have used one data point, Th = 102.15C and Tc = 41.6C, i.e., dT = 60.55C. Applying the law of propagation of uncertainty, this temperature difference has an absolute uncertainty ΔdT = ±0.707C. The thermal conductivity of the TEG + spreader, including the contacts, was assumed to be 1.45 W/m.K with a relative uncertainty of 7.5%, based on the literature [33]; this means an absolute uncertainty of Δk = ±0.1087 W/m.K. The surface area A = 0.037064 m2, and the absolute uncertainty of area ΔA = 0.000524 m2. The thickness of the TEG + the heat spreader plate L = 0.0049 m and ΔL = 0.000245 m. Using Equation (39), the rate of heat transfer is estimated to be Q ˙ i n = 664 W . While using Equation (40), the absolute uncertainty of rate of heat transfer is estimated to be Q ˙ i n = 51.3 W ; this gives the relative uncertainty for the rate of heat transfer, ±7.72%. For this same data point the permeate mass flux was 8.7 kg/h/m2. Using this information and the equations shown below, the relative uncertainty of GOR, SEC and EUE was estimated to be ±5.13%, ±2.63% and ±3.25% respectively.
The following are equations of absolute uncertainty for a few more parameters:
The Gain Output Ratio.
G O R = ( J × h f g Q ˙ i n A ) 2 + ( A × h f g Q ˙ i n J ) 2 + ( A × J × h f g Q ˙ i n 2 Q ˙ i n ) 2
Specific thermal energy consumption.
S E C = ( 1 A × J Q ˙ i n ) 2 + ( Q ˙ i n A 2 × J A ) 2 + ( Q ˙ i n J 2 × A J ) 2
Energy utilization efficiency.
E U E = ( 1 Q ˙ i n P T E G ) 2 + ( J × h f g Q ˙ i n A ) 2 + ( A × h f g Q ˙ i n J ) 2 + ( P T E G + A × J × h f g Q ˙ i n 2 Q ˙ i n ) 2

3. Results and Discussion

The performance of commercially available thermoelectric generators and a hydrophobic membrane integrated within the proposed system was experimentally investigated for simultaneous electricity generation and freshwater production. The effects of key operating parameters, including feed salinity and flow rates, on the overall system’s performance were systematically examined. All the experimental data were recorded after the system reached steady-state conditions, which typically required approximately 1.5 h, followed by an additional 1.5 h of continuous data acquisition. To ensure accuracy and repeatability, each experiment conducted at different salinity and flow rate conditions was repeated at least three times, and the reported results represent the averaged values.

3.1. Influence of Salinity

This section examines the effect of feed salinity on the performance of the integrated TEG–DCMD system, focusing on freshwater production, power generation, and energy efficiency indicators. To isolate the influence of salinity, experiments were conducted at a constant heat input of 650–660 W. The feed and permeate flow rates were maintained within narrow ranges of 1.4–1.6 L/min and 3.2–3.4 L/min, respectively. The hot-side temperature of the system was maintained between 102 and 106 °C, while the feed-side bulk temperature and permeate temperature were controlled within ranges of 40–43 °C and 24–26 °C, respectively. Under these fixed operating conditions, the salinity was varied systematically to evaluate its impact on the thermal, electrical, and desalination performance metrics.
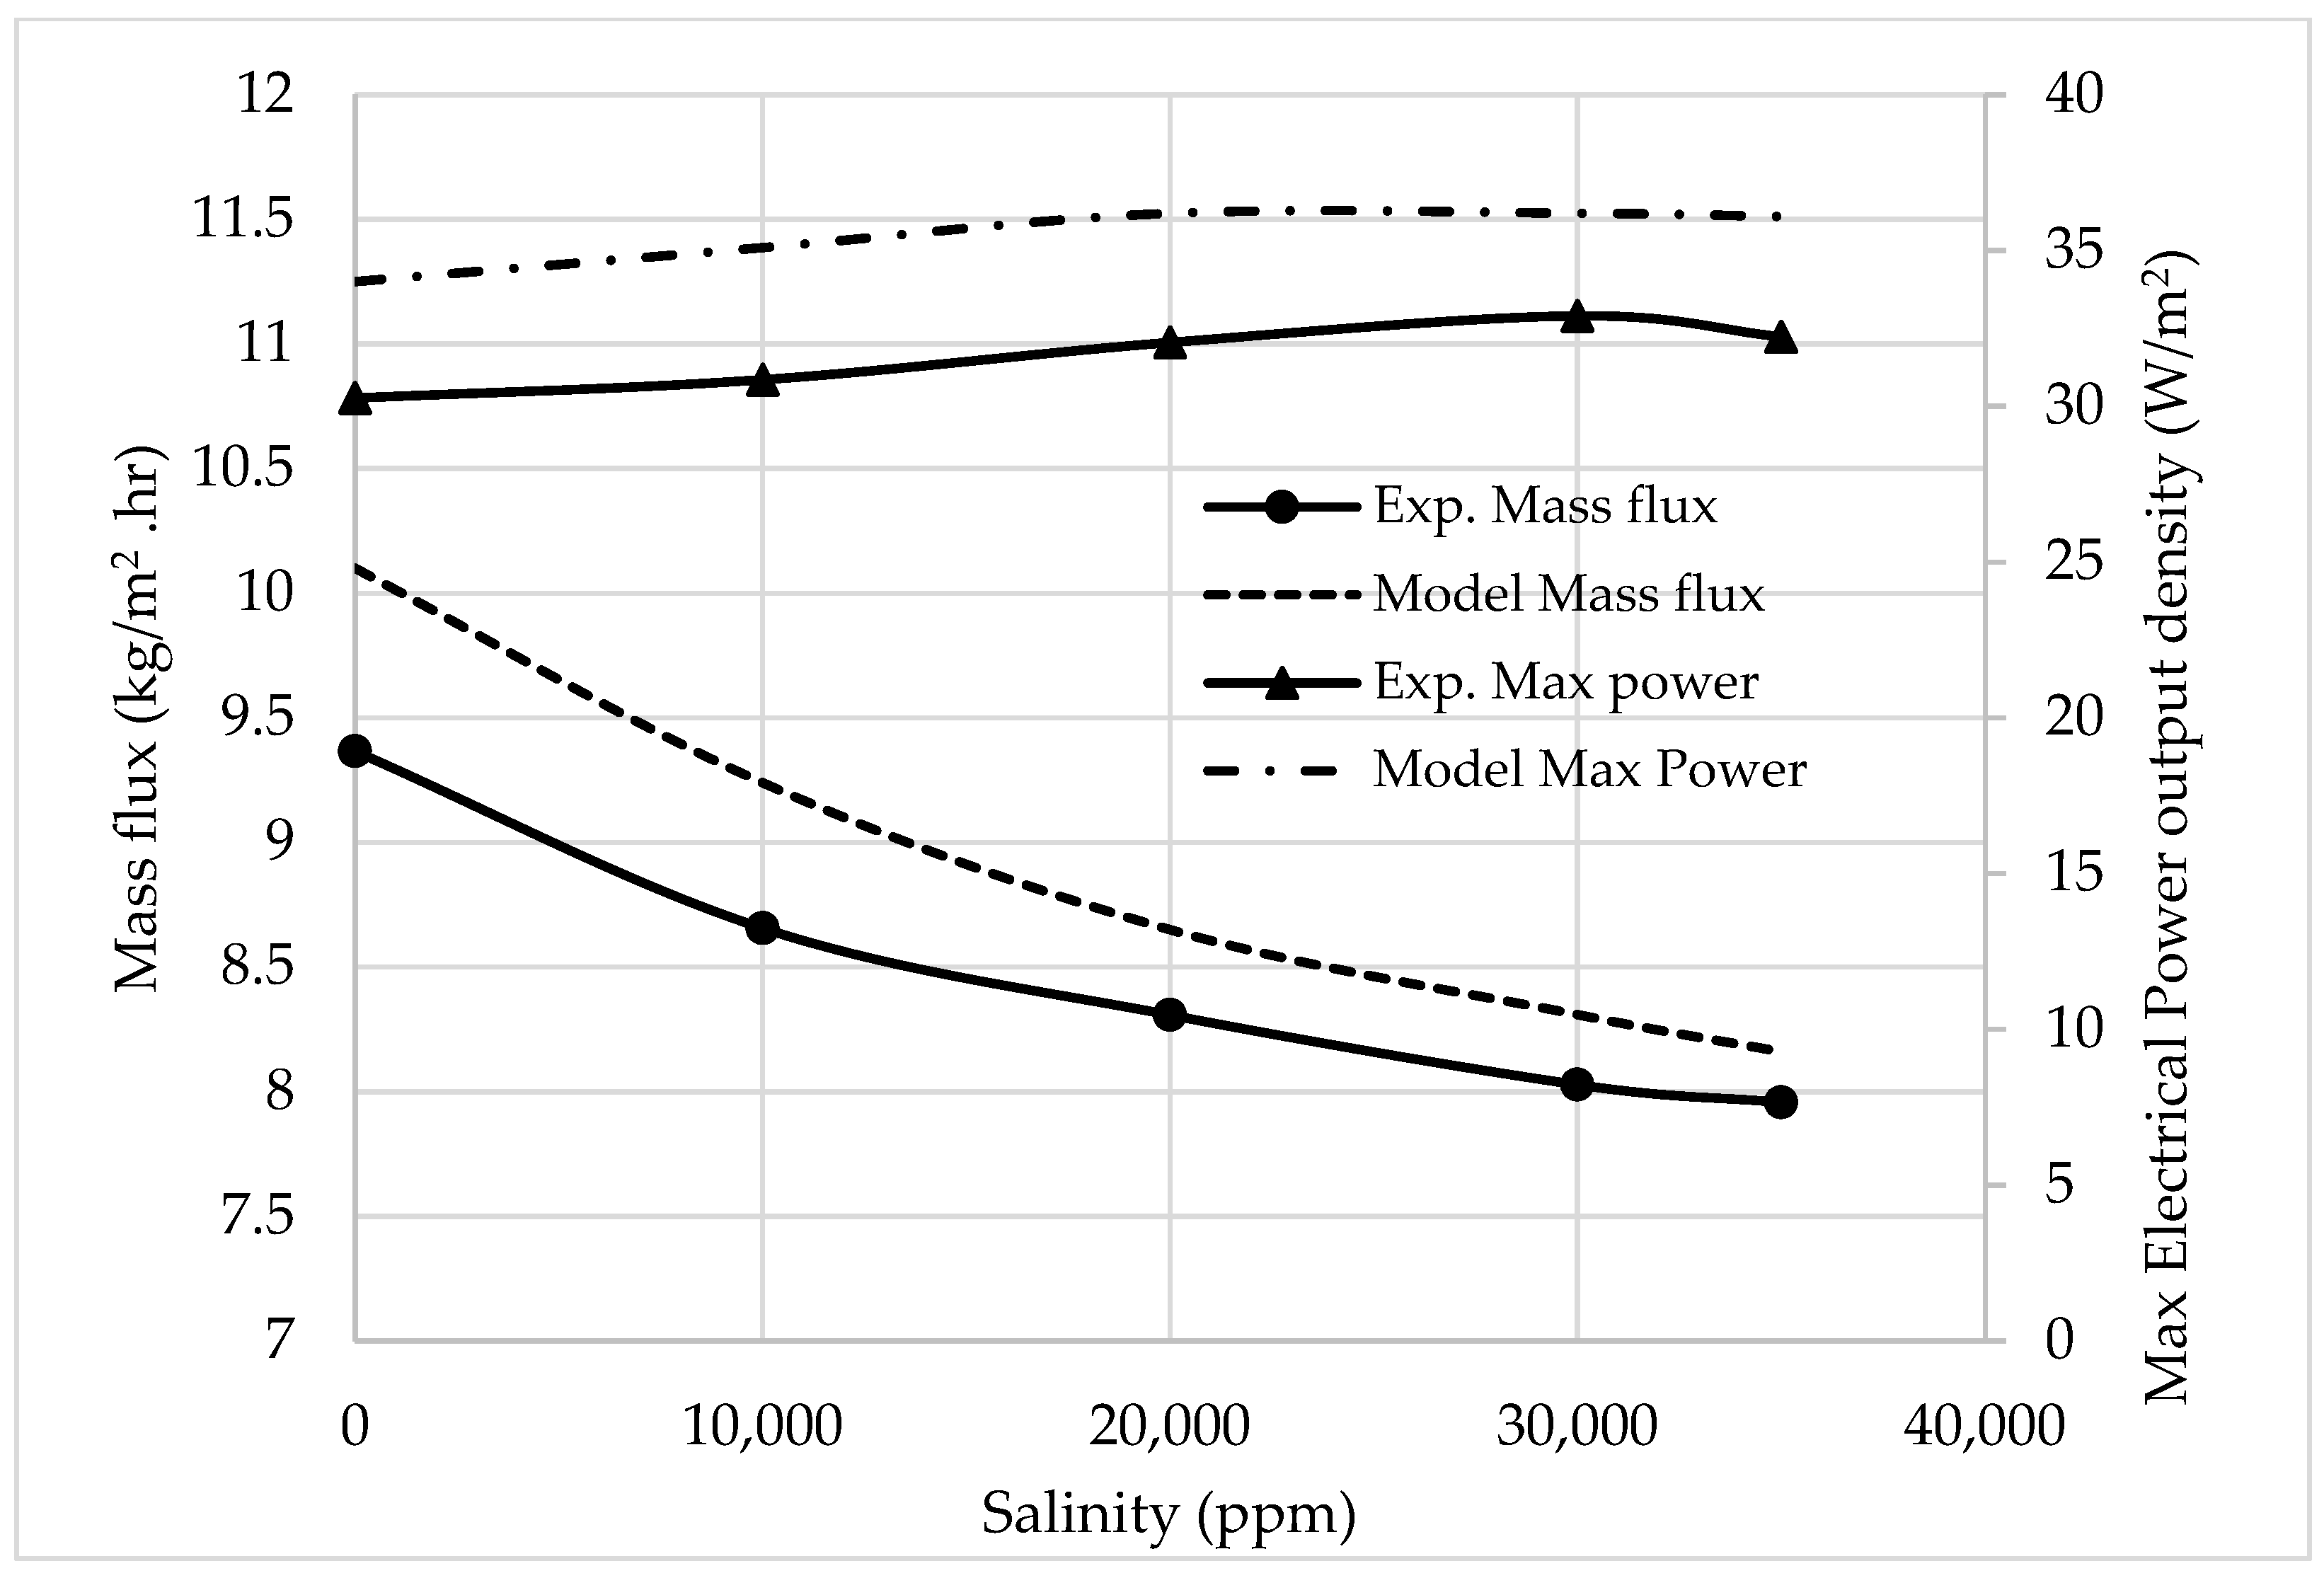
Figure 11 illustrates the coupled effect of feed salinity on the freshwater mass flux and the maximum electrical power density in the integrated TEG–DCMD system. As salinity increases from 0 to 35,000 ppm, the mass flux decreases from 9.36 kg/m2.h to 7.96 kg/m2.h. This reduction is primarily attributed to the lowering of water vapour pressure at the membrane interface caused by dissolved salts, which diminishes the effective driving force for membrane distillation. Additionally, increased salinity enhances concentration polarization near the membrane surface, further suppressing evaporation rates. In contrast, the maximum power output generated by the TEG remains relatively insensitive to salinity variations, with fluctuations within experimental uncertainty. When the salinity increases from the 0 to 35,000 ppm, then the max electrical power output density varies from 30.26 to 32.29 W/m2. This behaviour indicates that the electrical performance is governed predominantly by the imposed temperature gradient across the TEG rather than by feed solution properties. The decoupling of electrical generation from the salinity effects highlights a key advantage of the hybrid configuration, whereby stable power production can be maintained even under high-salinity operating conditions.
The quantitative validation of the proposed model was performed using the mean absolute error (MAE) for both the freshwater mass flux and maximum electrical power output density. Across the investigated salinity range of 0–35,000 ppm, the mass flux predictions yielded an MAE of 0.4, corresponding to a relative deviation of approximately 5.2%. For the maximum electrical power output density, the MAE was 3.86 W, resulting in a relative deviation of approximately 12.2%. The higher deviation observed in power prediction is attributed to idealized assumptions regarding thermoelectric module performance and thermal contact resistance, while the model successfully captures the experimental trends.
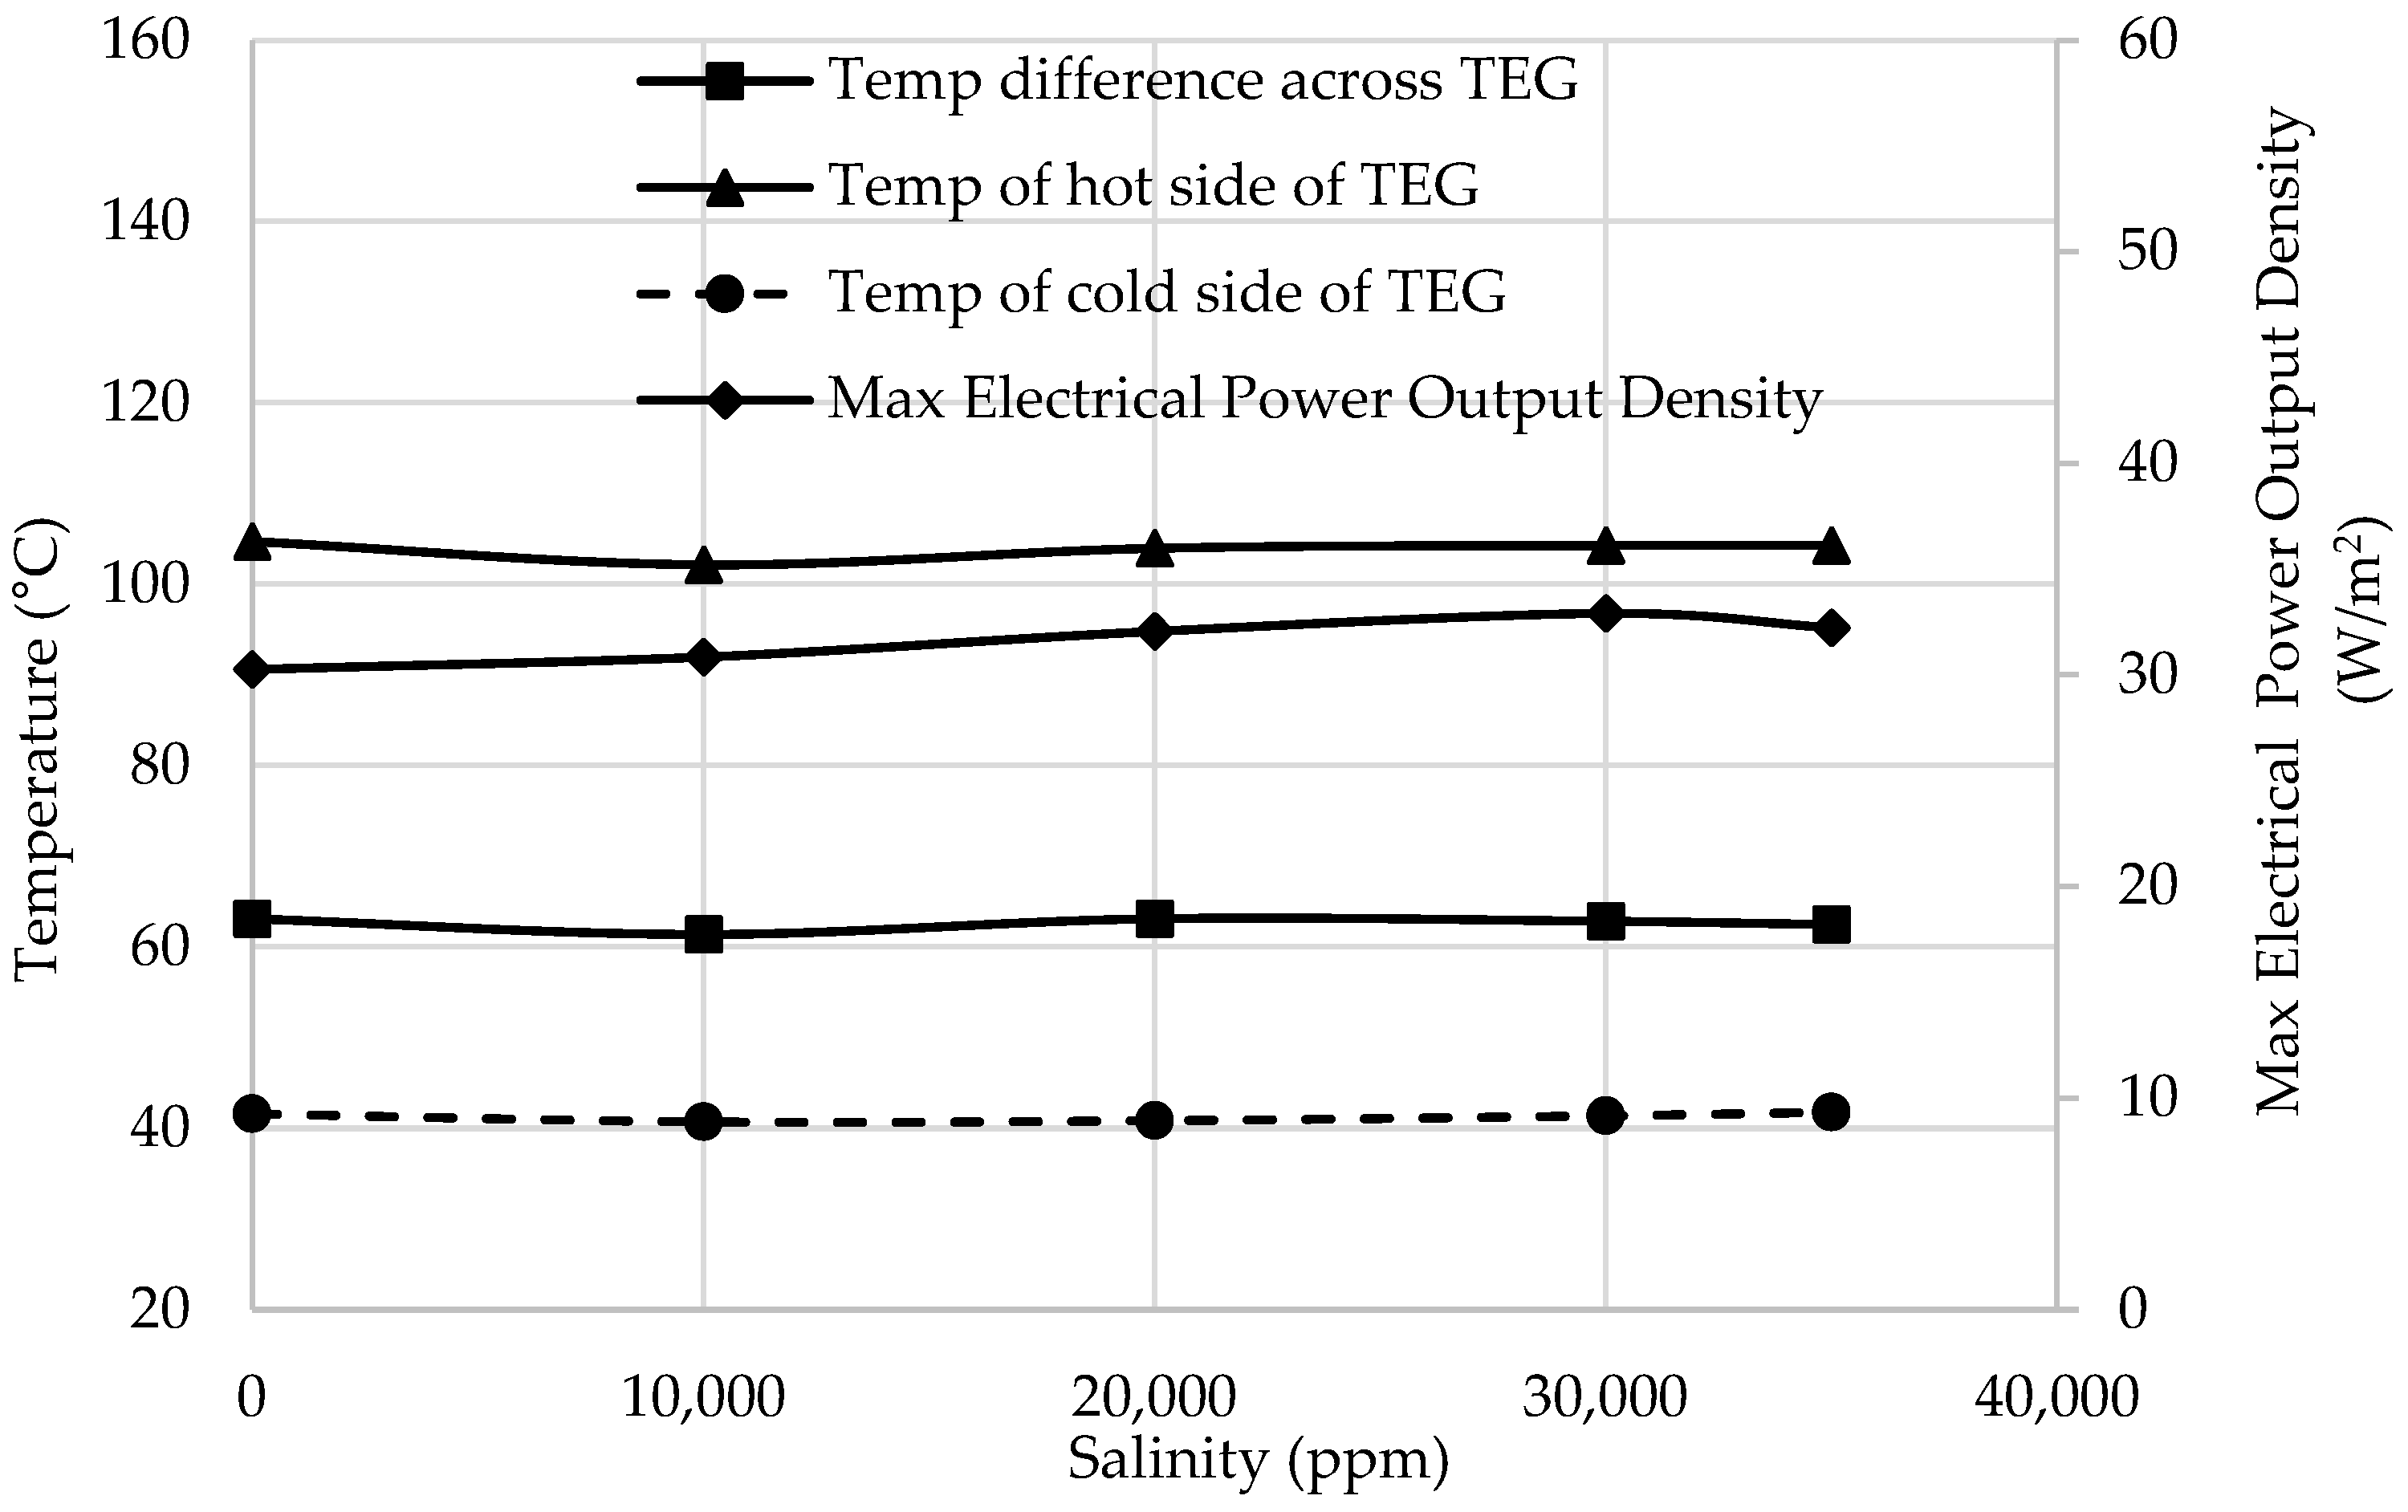
Figure 12 focuses exclusively on the relationship between feed salinity and the maximum electrical power output density of the TEG module. The results demonstrate that increasing salinity does not introduce a systematic trend in power generation. This confirms that the thermoelectric performance is largely independent of feed water composition and instead is controlled by the temperature difference across the TEG and its internal electrical resistance. The minor variations in the power output can be attributed to experimental uncertainties in temperature measurement, contact resistance between the TEG and heat spreaders, and transient thermal fluctuations during steady-state operation. Importantly, the absence of performance degradation under high-salinity conditions confirms the robustness of the TEG subsystem when integrated with DCMD. This finding is particularly relevant for the desalination of hypersaline streams, where conventional thermal systems often suffer from efficiency losses. The results validate that the proposed hybrid system can sustain reliable electricity generation while treating saline waters without electrical performance penalties.
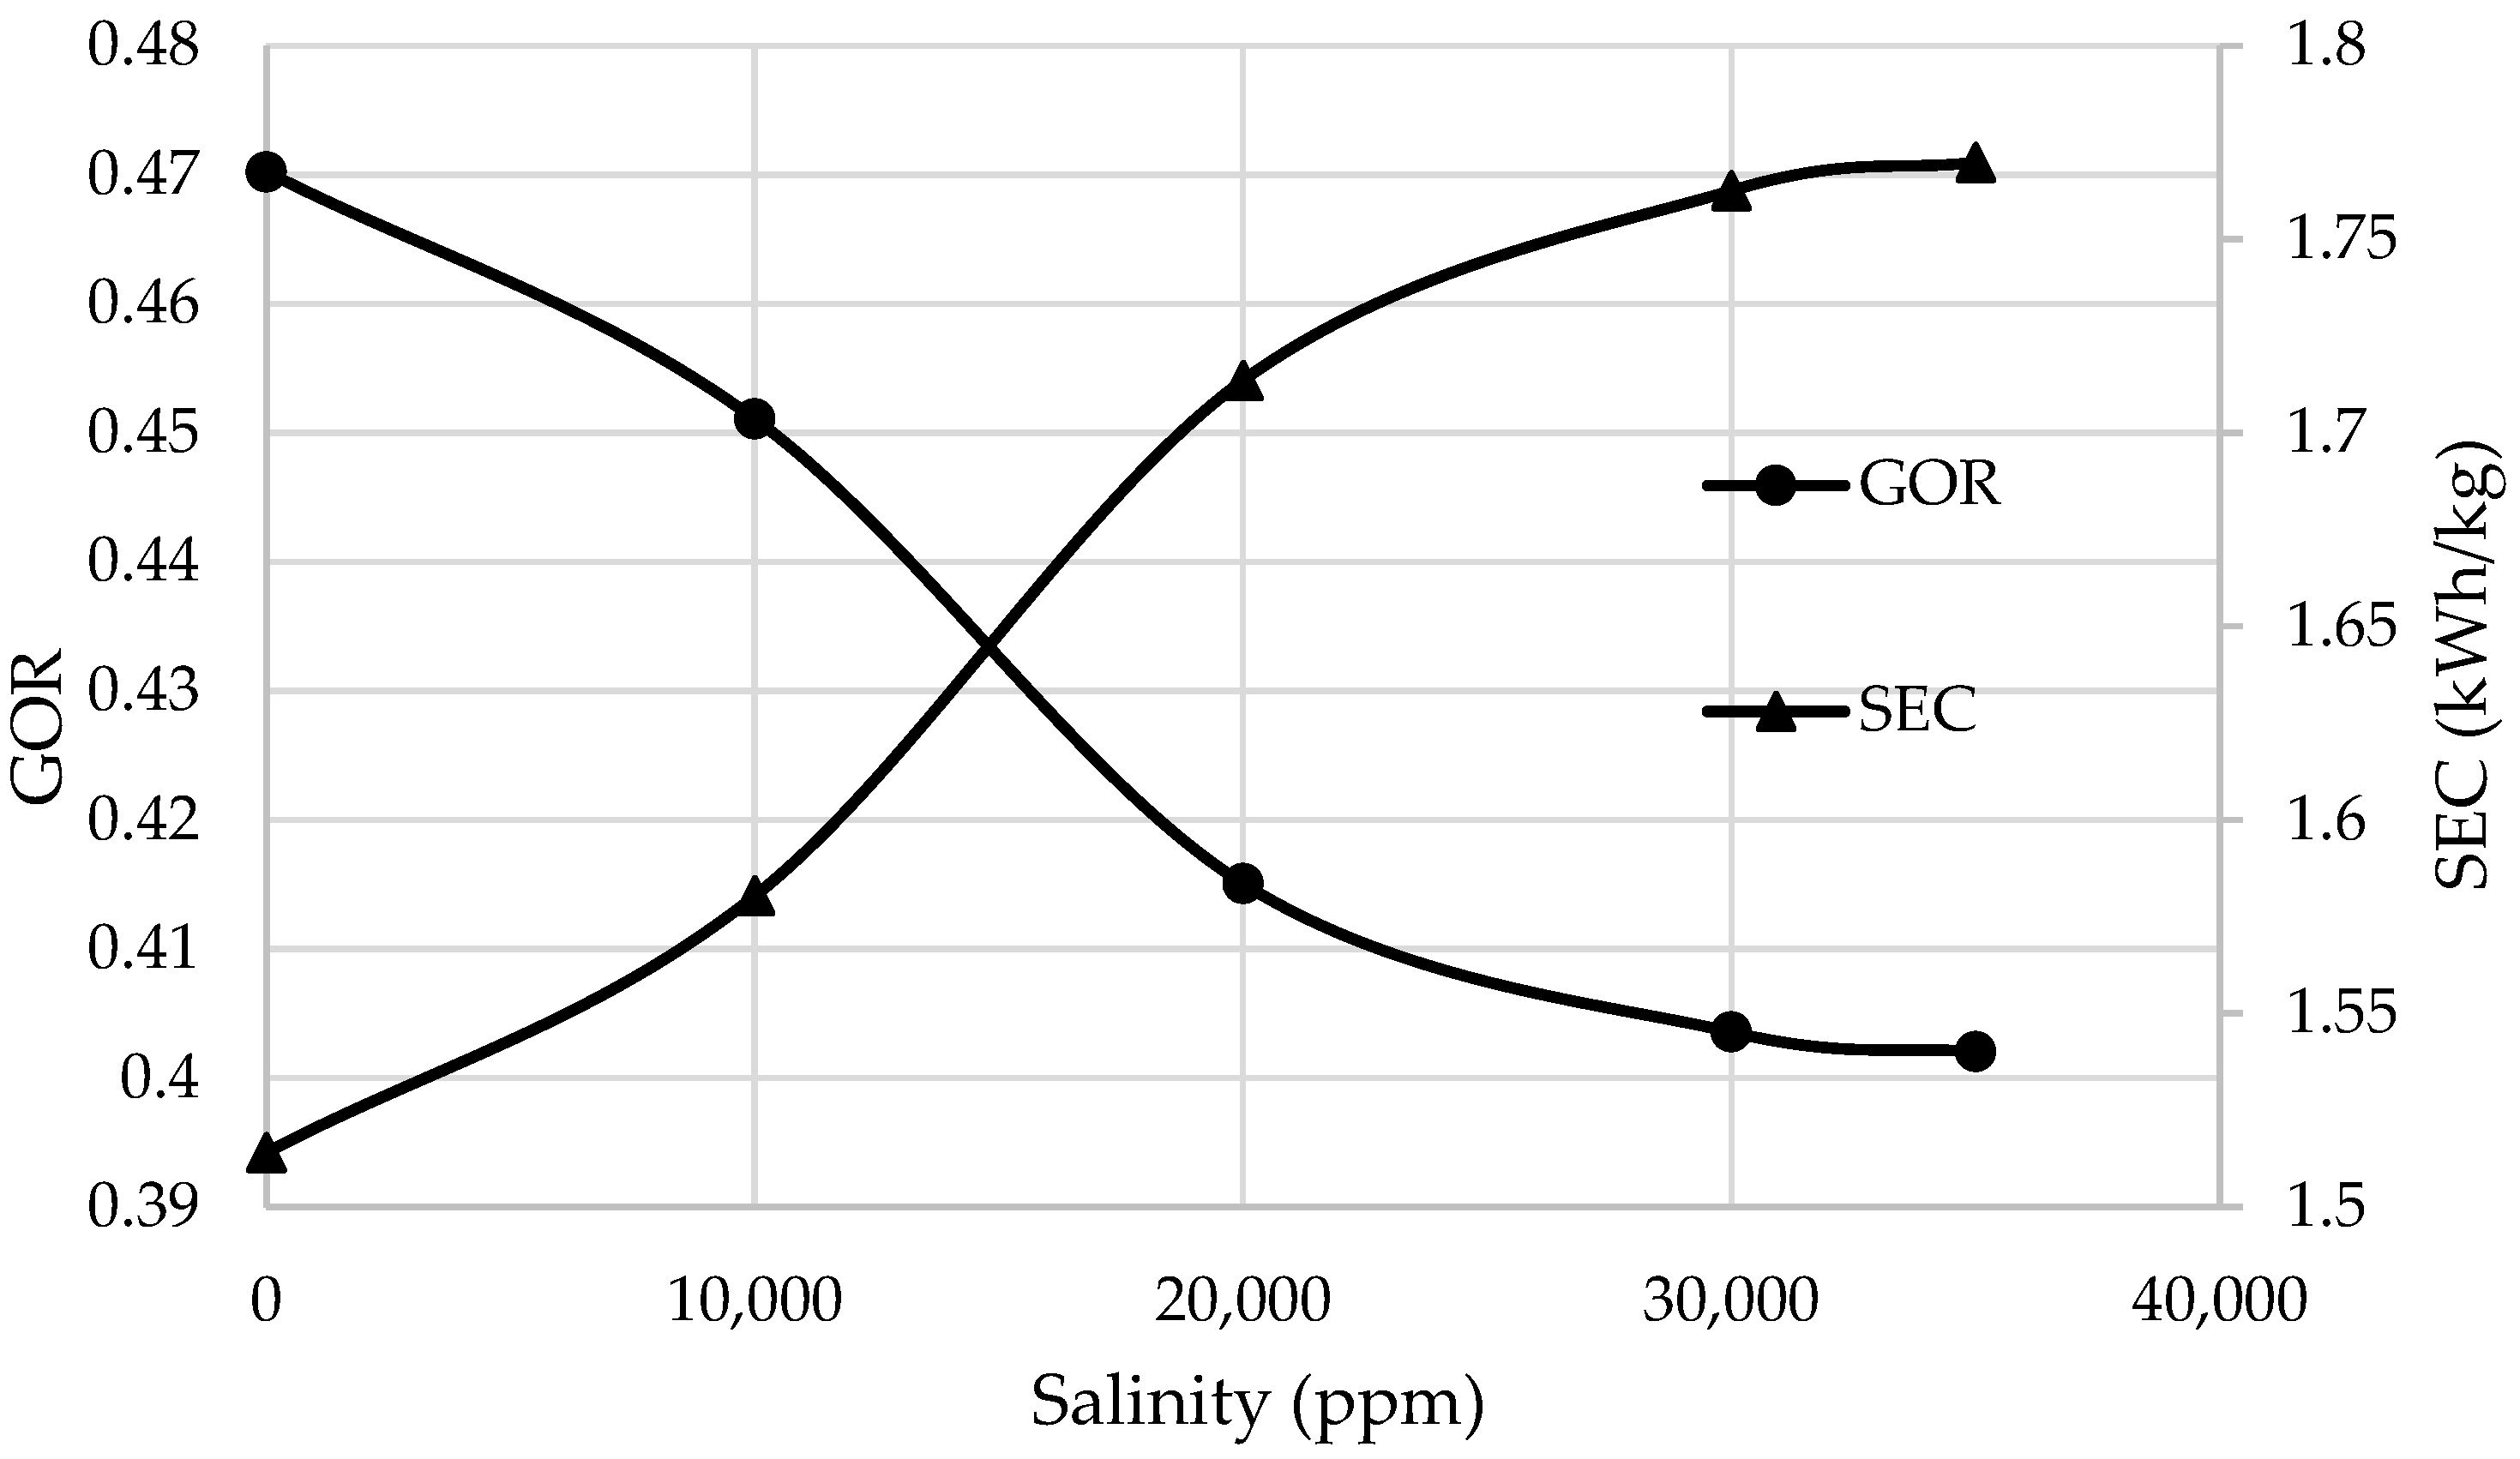
Figure 13 presents the impact of salinity on the thermal efficiency metrics of the DCMD subsystem, namely the Gain Output Ratio (GOR) and specific thermal energy consumption (SEC). As salinity increases from 0 to 35,000 ppm, SEC exhibits a gradual rise from 1.51 to 1.77 kWh/kg, indicating that more thermal energy is required to produce a unit mass of freshwater. This behaviour is directly linked to the reduction in vapour pressure and mass transfer coefficient at higher salt concentrations, which lowers freshwater productivity for a given heat input. Consequently, GOR shows a slight decreasing trend, i.e., from 0.47 to 0.40, reflecting reduced efficiency in latent heat recovery. Despite this decline, the changes in GOR remain moderate, demonstrating that the system maintains acceptable thermal performance even at elevated salinities. The results suggest that while salinity negatively affects desalination efficiency, the integrated heat recovery through TEGs partially mitigates overall energy losses. This highlights the importance of hybridization in enhancing system-level efficiency under challenging feed conditions.
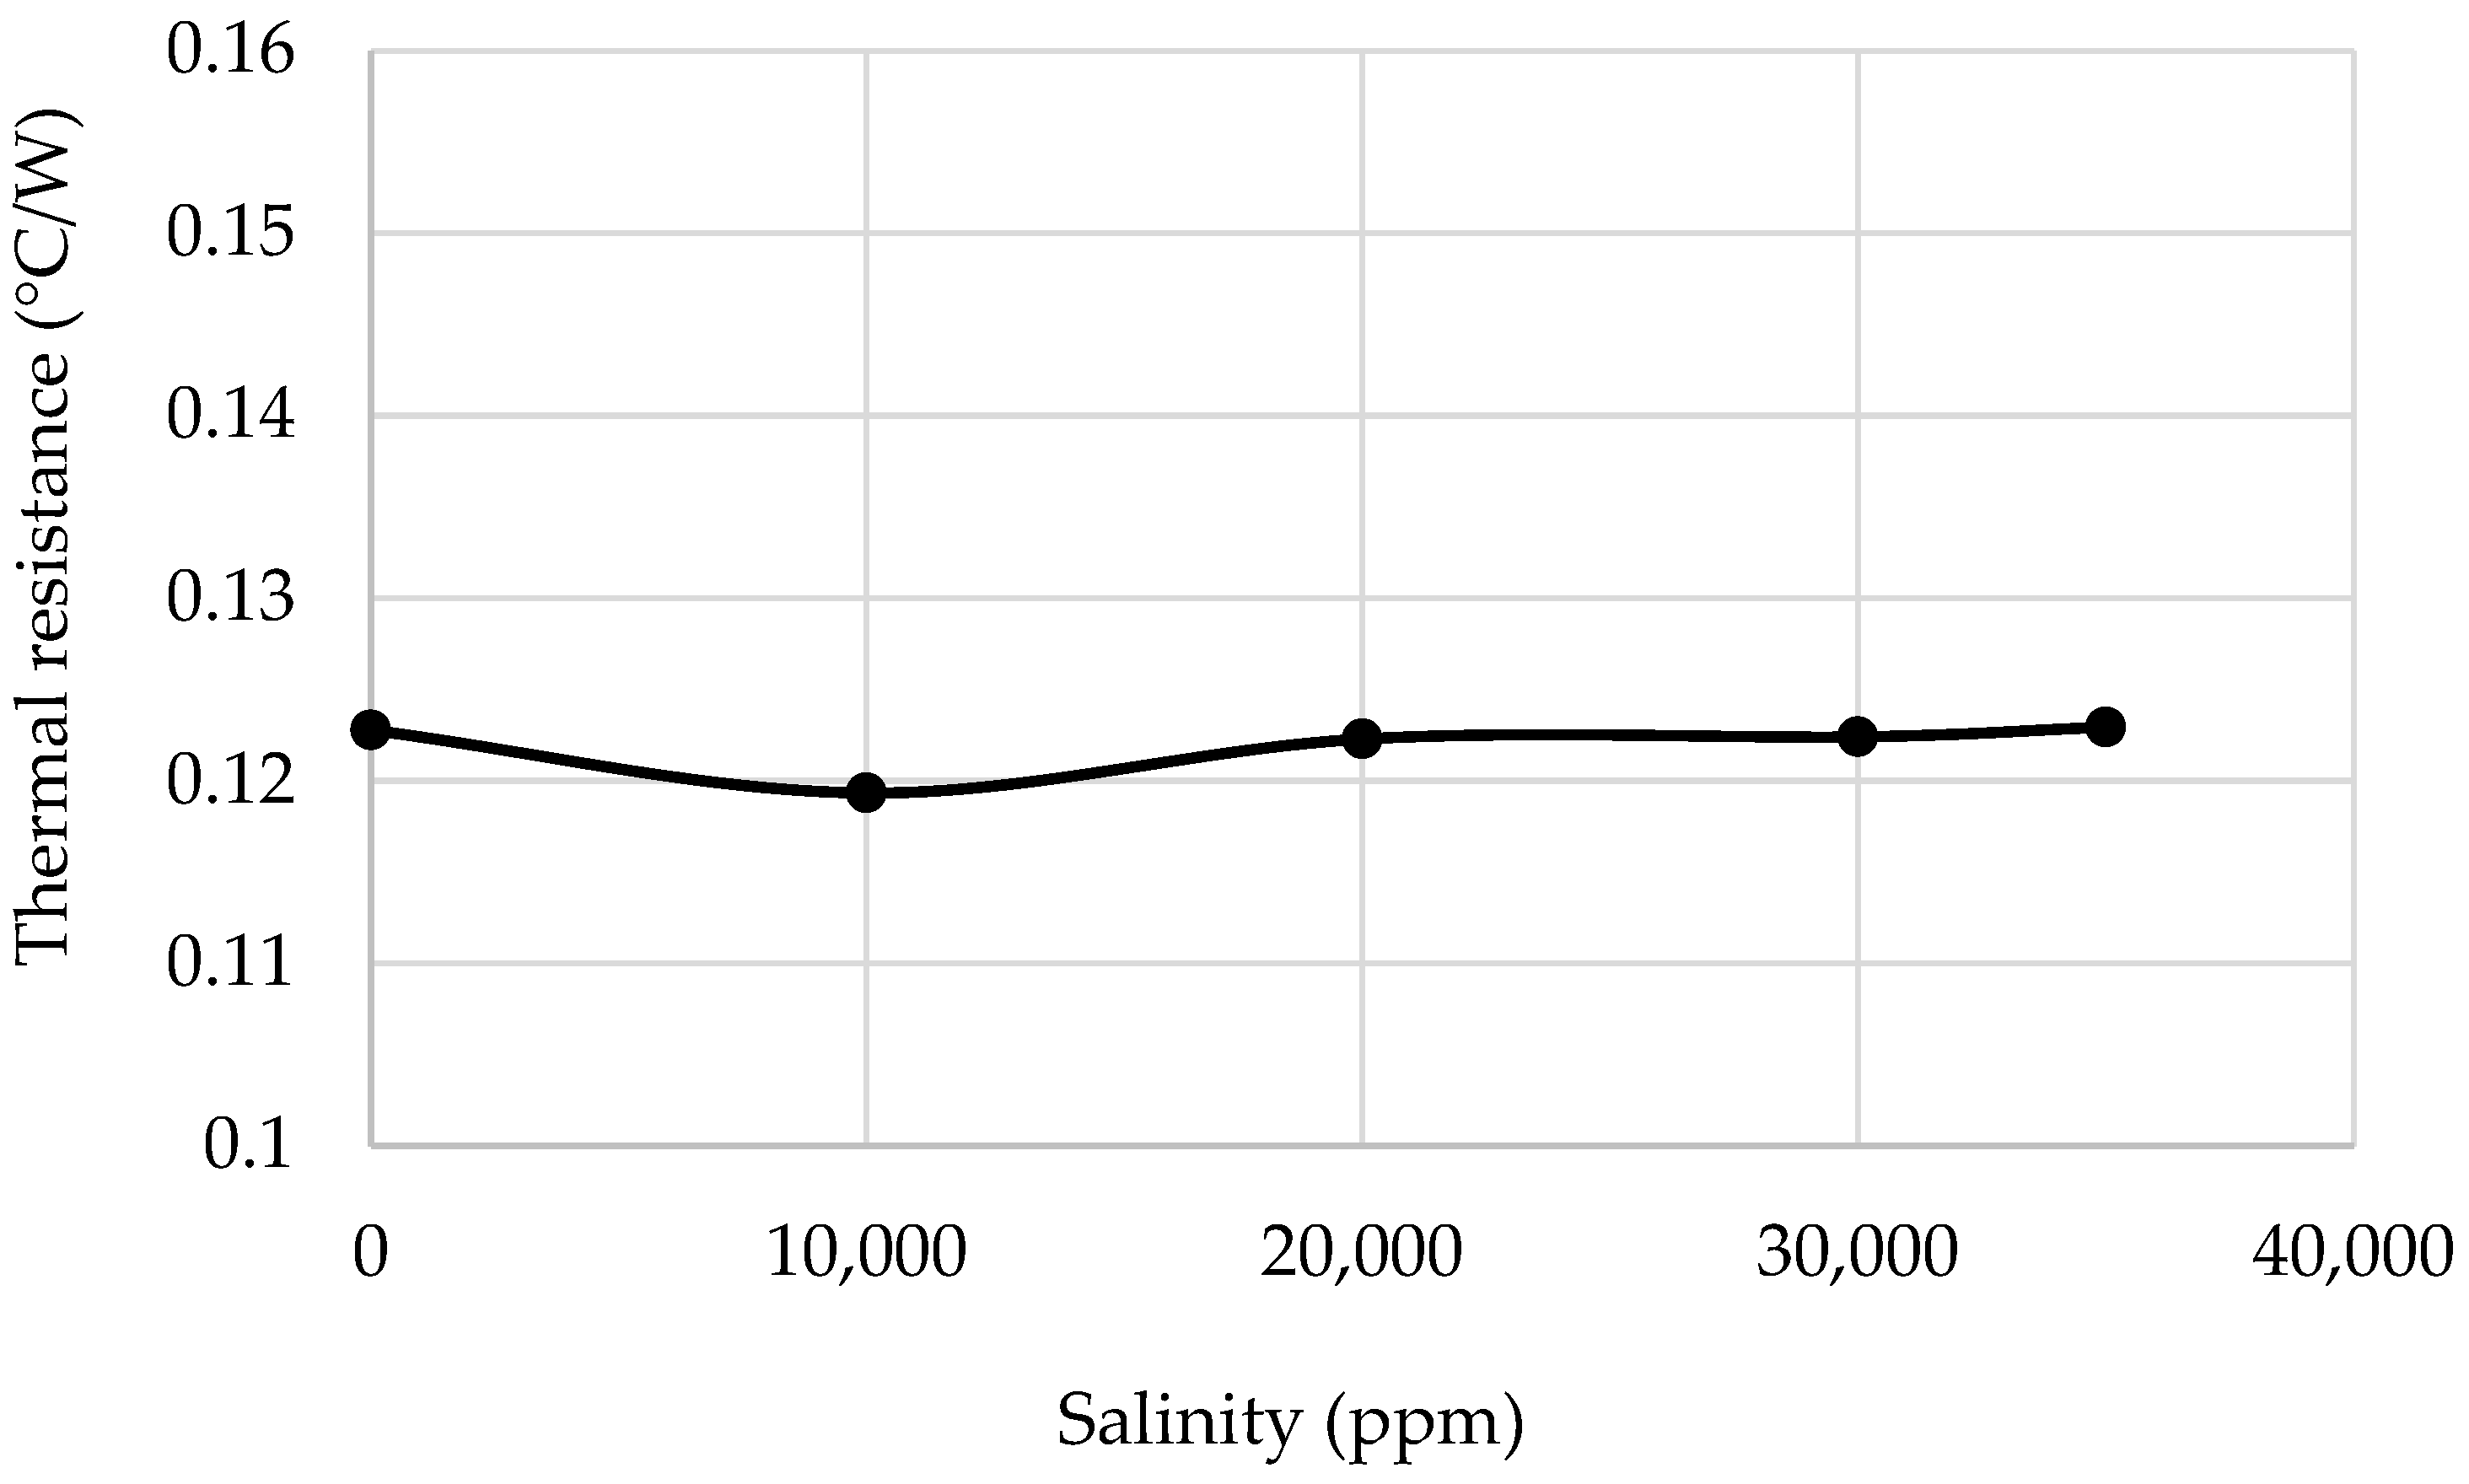
Figure 14 shows that the overall thermal resistance of the TEG–DCMD module remains nearly constant across the investigated salinity range. This observation indicates that salinity does not significantly affect conductive heat transfer through the system components, including the heat spreaders, TEG modules, membrane layers, and supporting structures. Since thermal resistance is primarily governed by material properties and physical contact conditions rather than fluid composition, the observed stability is expected. This result is important because it confirms that variations in the desalination performance with salinity are not caused by changes in heat transfer pathways but rather by mass transfer limitations within the membrane. The constant thermal resistance also implies predictable thermal behaviour, which simplifies system modelling and scale-up. From a design perspective, this finding validates that the hybrid system can operate over a wide salinity range without requiring modifications to the thermal management strategies.
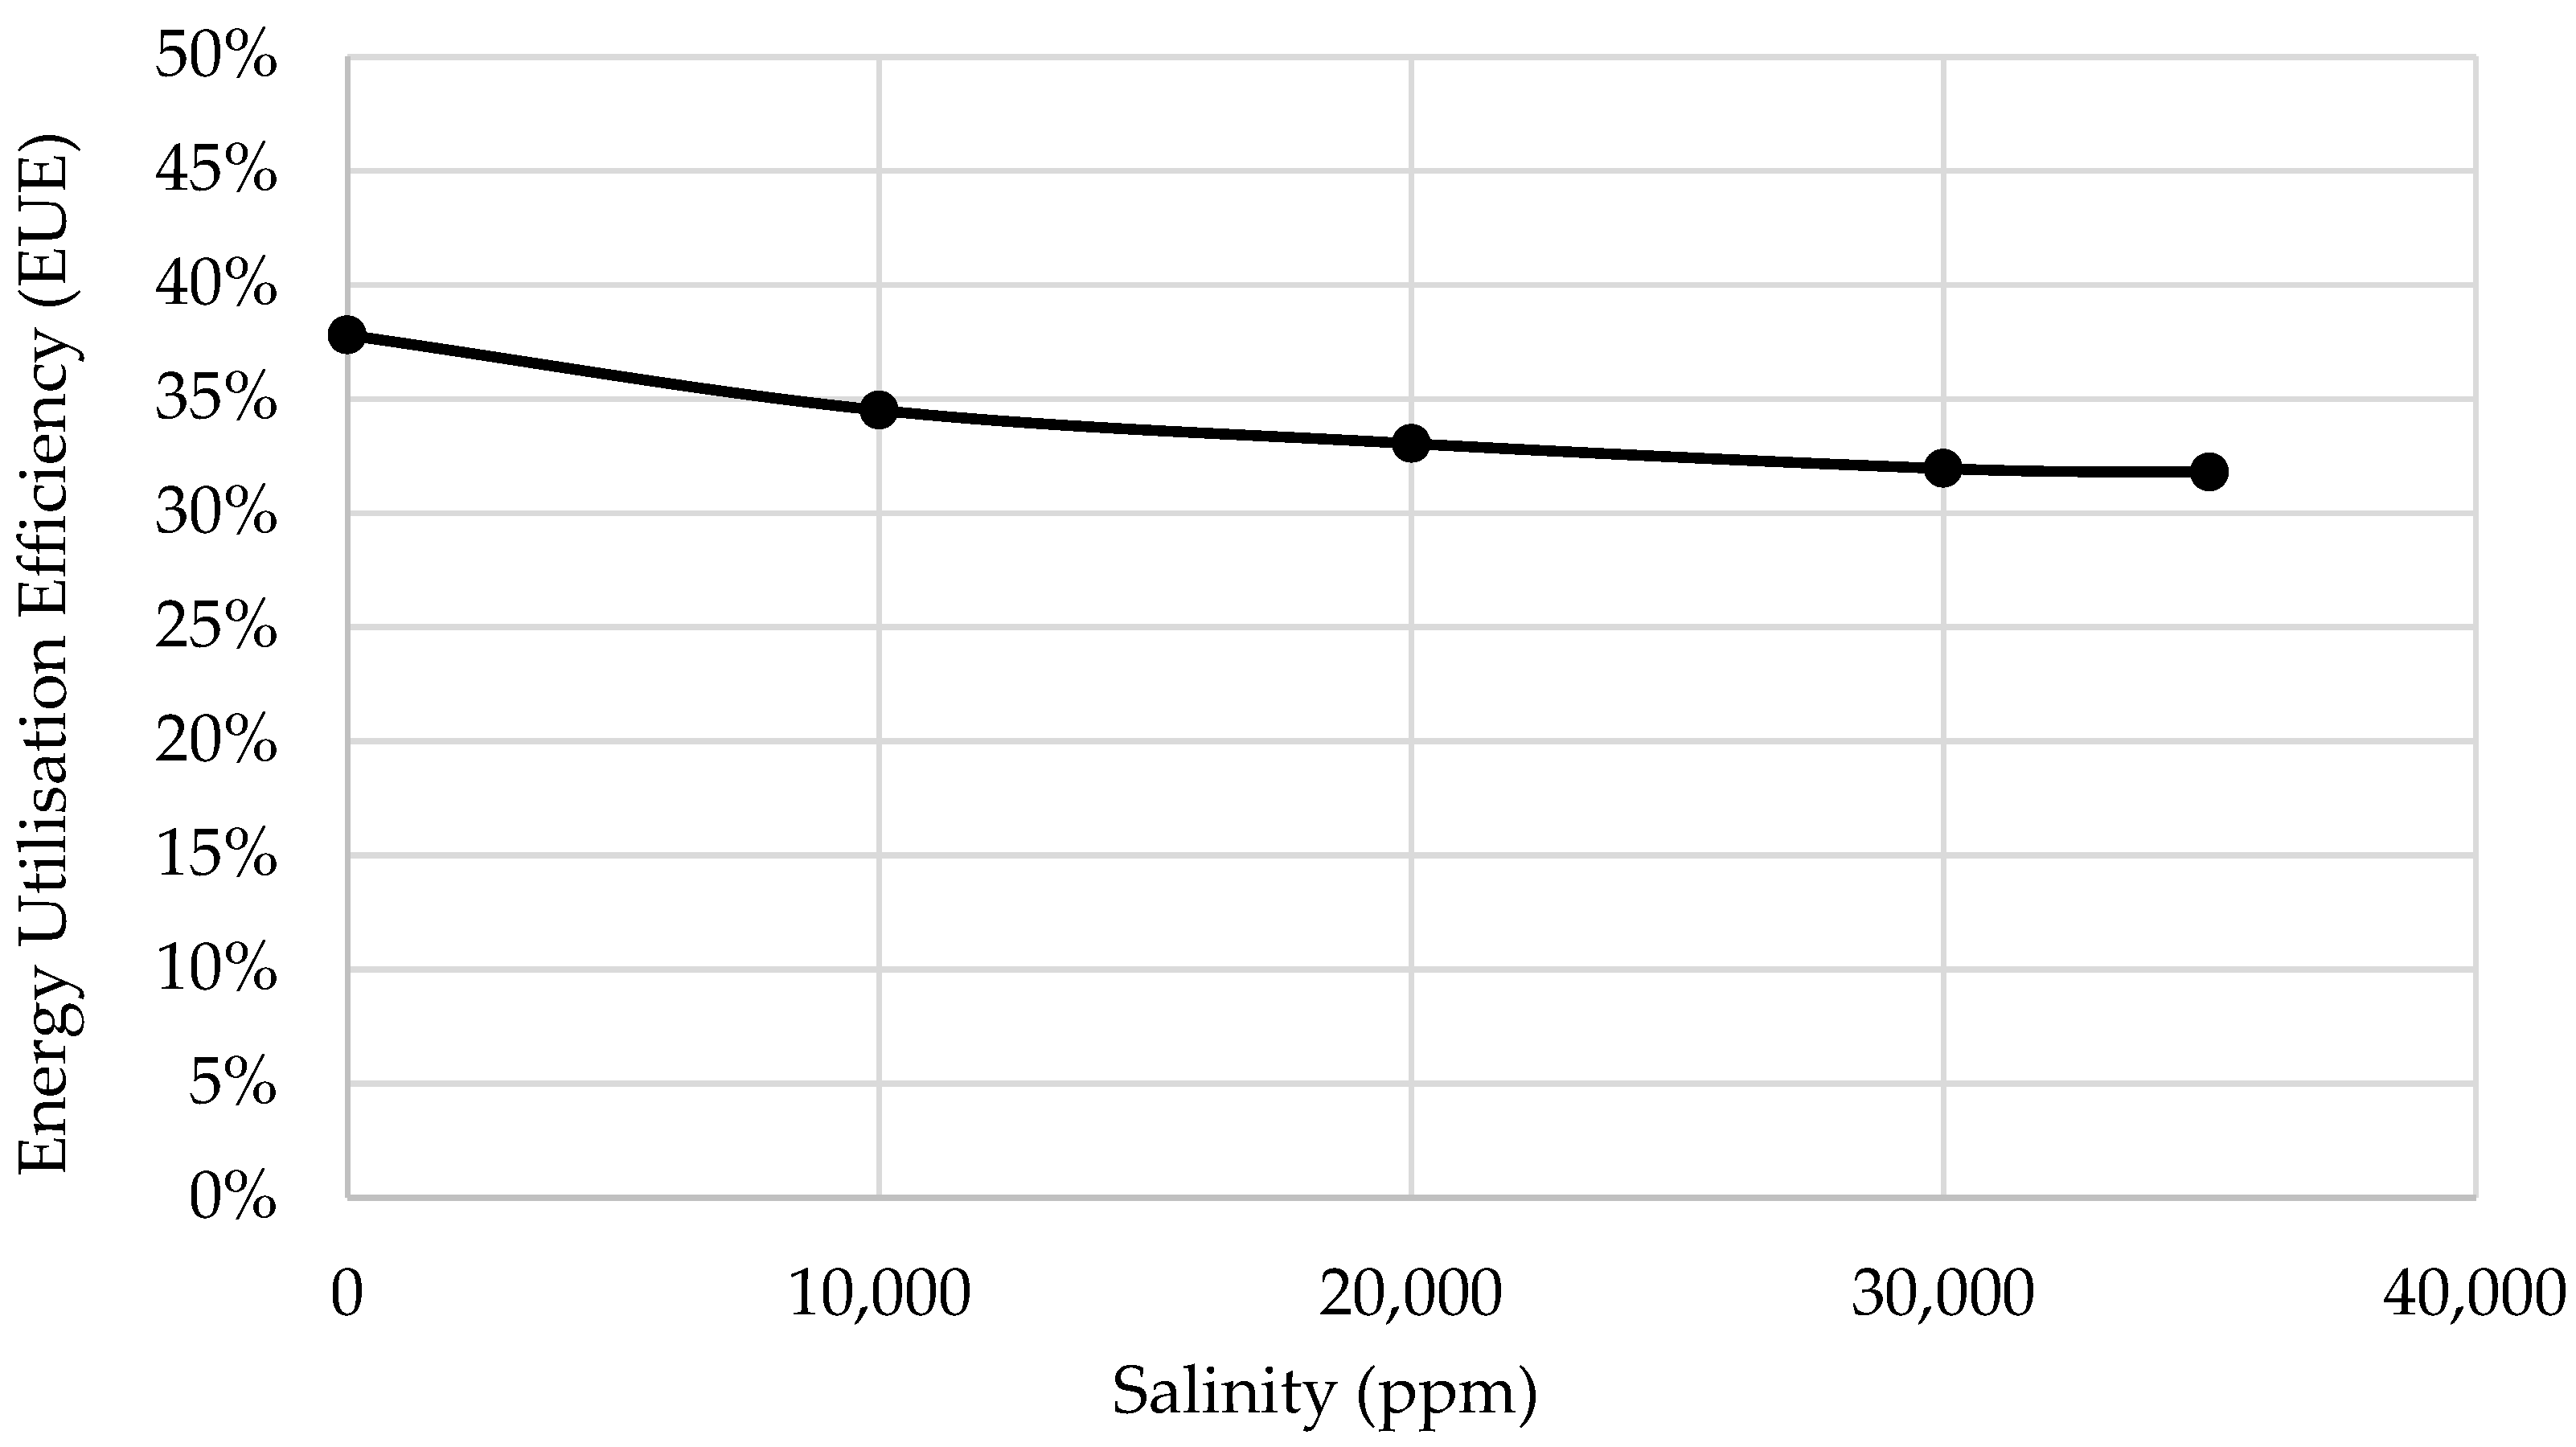
Figure 15 illustrates the variation in energy utilization efficiency with increasing feed salinity. A slight downward trend is observed in the energy utilization efficiency, i.e., from 37.81% to 31.79% as salinity rises from 0 to 35,000 ppm, reflecting the reduced effectiveness of converting the supplied thermal energy into useful outputs, namely freshwater and electricity. This reduction is mainly driven by the decline in freshwater flux at higher salinity, while electrical output remains comparatively stable. As a result, a larger fraction of input heat is dissipated without contributing to productive outputs. Nevertheless, the decrease in energy utilization efficiency is relatively modest, indicating that the system retains a strong performance even under saline conditions representative of seawater and brine streams. The results demonstrate that integrating thermoelectric power generation with DCMD enhances the overall energy utilization by extracting electrical work from thermal gradients that would otherwise be lost. This reinforces the system’s suitability for industrial waste heat recovery applications involving saline effluents.
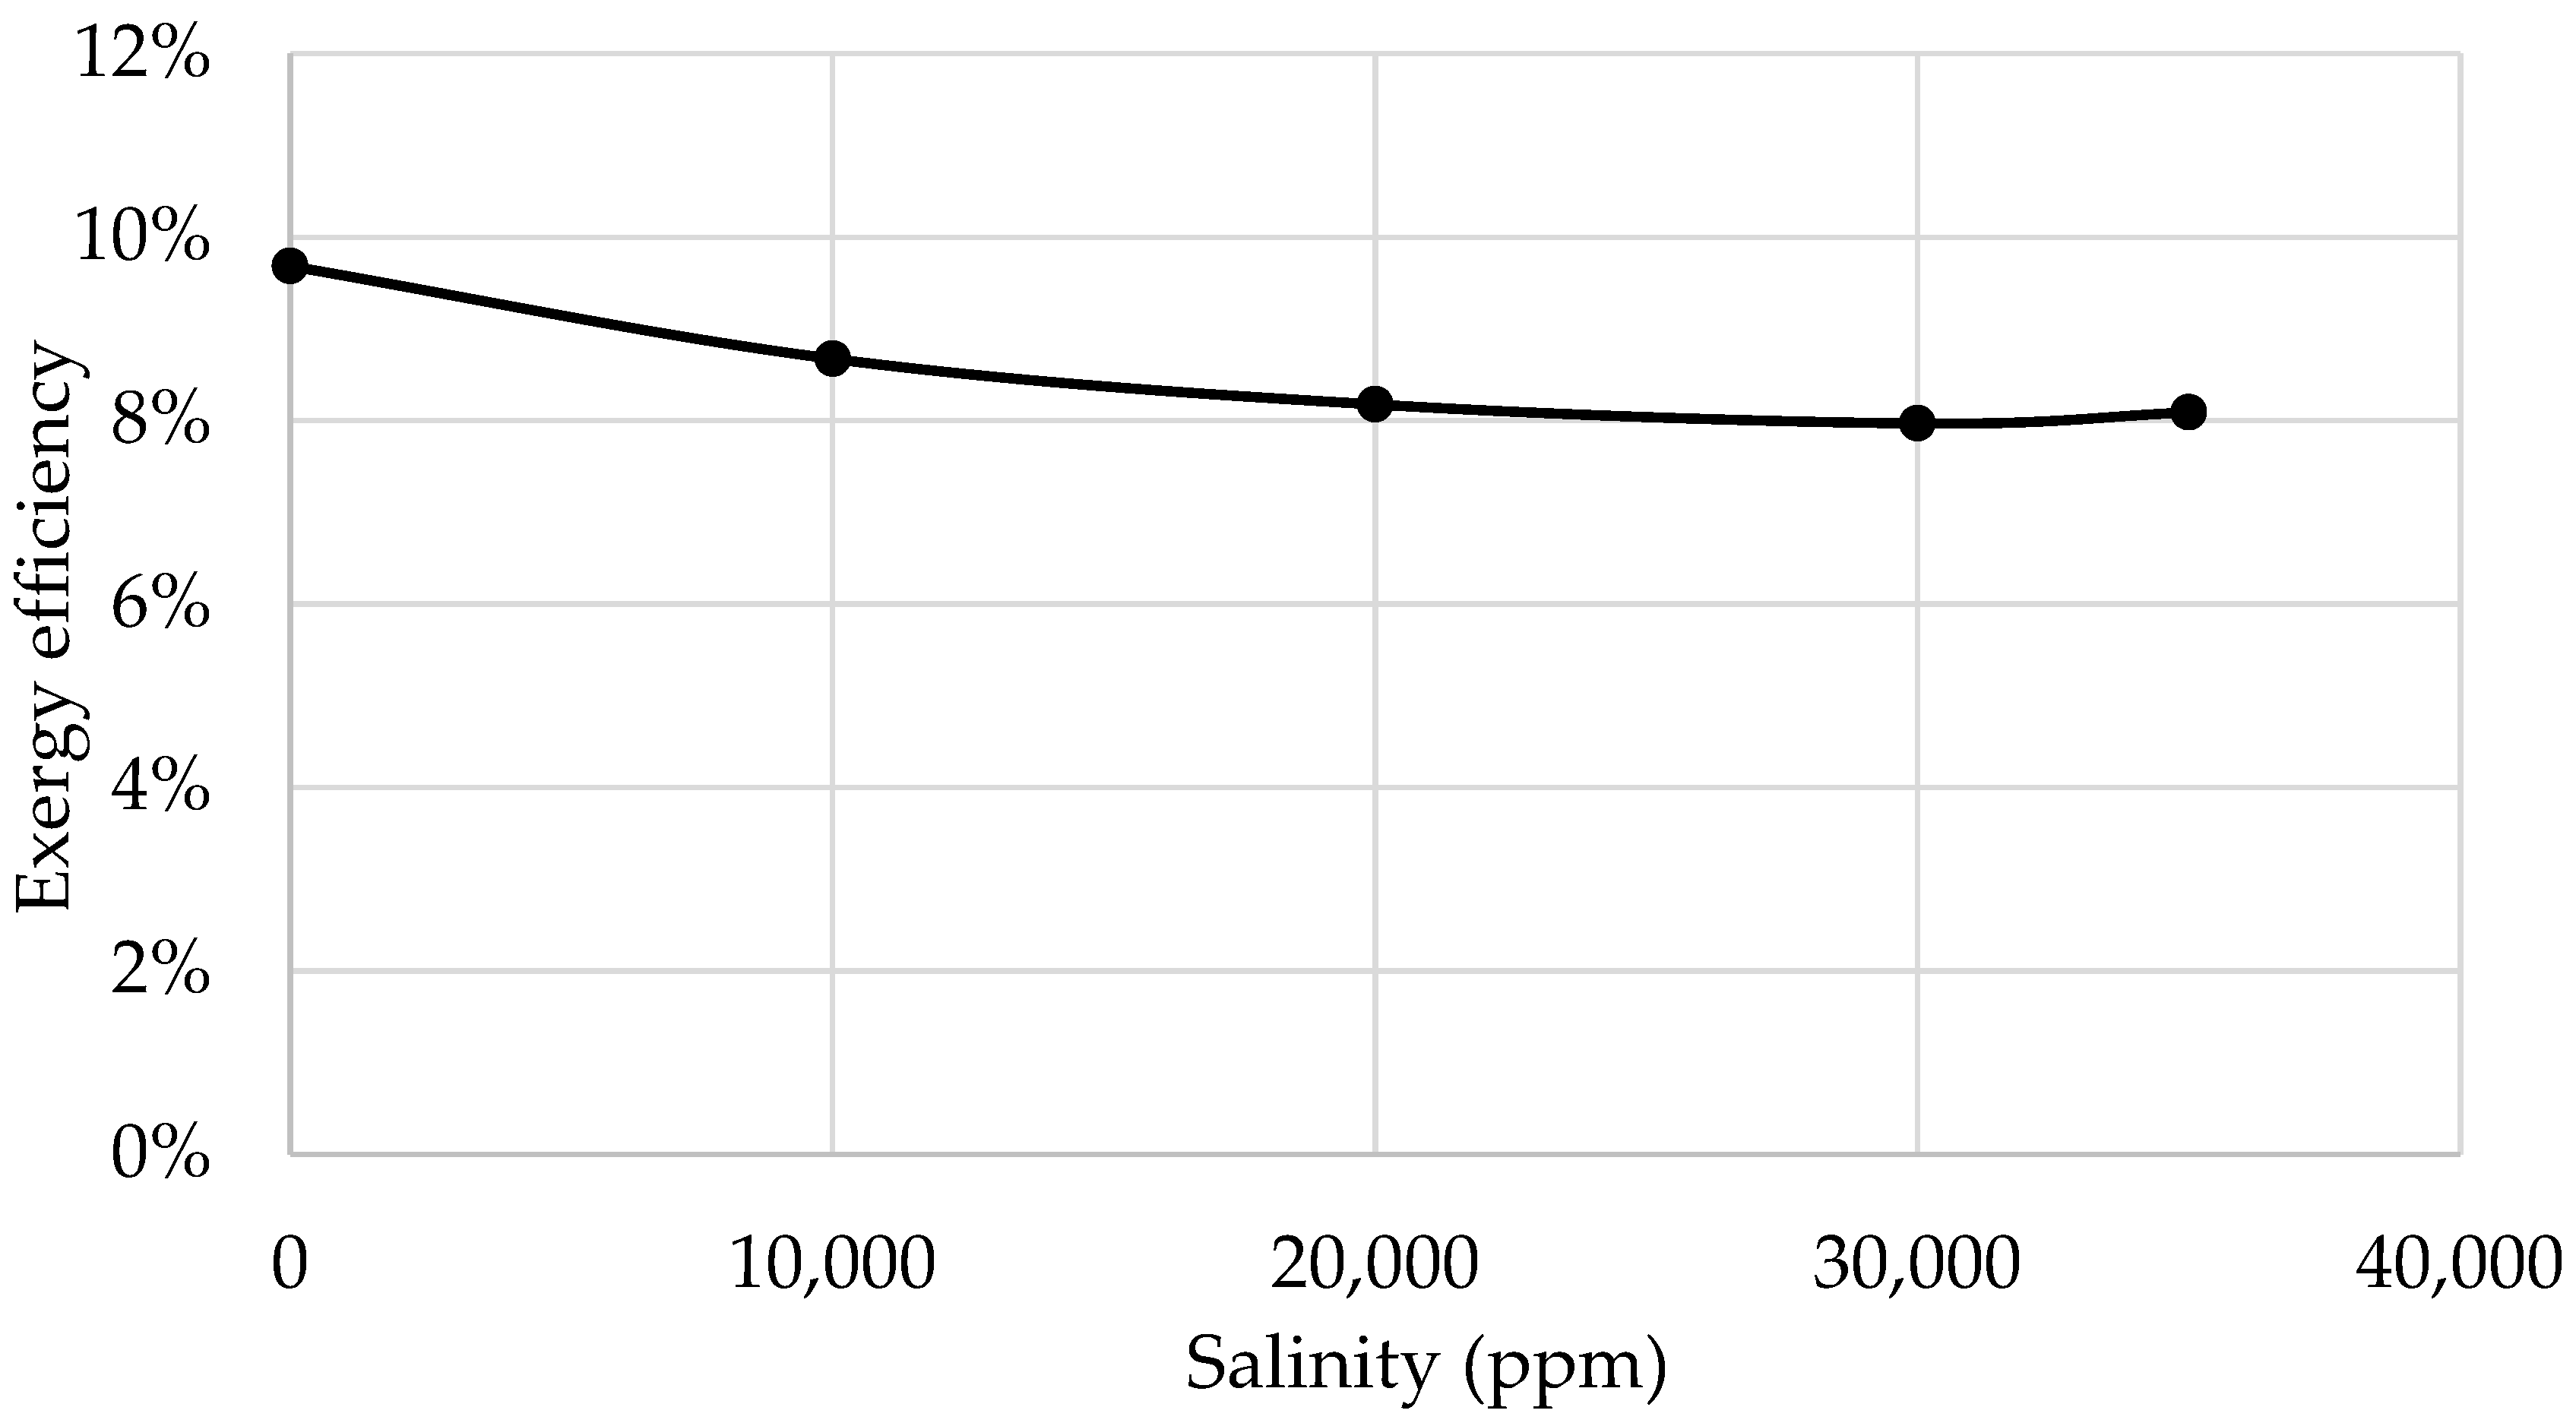
Figure 16 presents the effect of salinity on the exergy efficiency of the integrated system. A gradual reduction in the exergy efficiency, from 9.69% to 8.09%, is observed with increasing salinity from 0 to 35,000 ppm, indicating higher irreversibilities associated with mass transfer limitations in the DCMD process. Elevated salinity reduces vapour pressure and increases entropy generation during phase change, thereby lowering the fraction of available energy converted into useful work and freshwater production. Despite this decline, the exergy efficiency remains within a narrow range, suggesting that the dominant sources of irreversibility are inherent to membrane desalination process. The relatively stable electrical contribution from the TEG subsystem helps offset the exergy losses associated with desalination. These findings highlight the thermodynamic advantage of hybrid systems, where multiple outputs are generated from a single heat source, improving the overall exergy utilization even when individual subsystems face performance constraints.
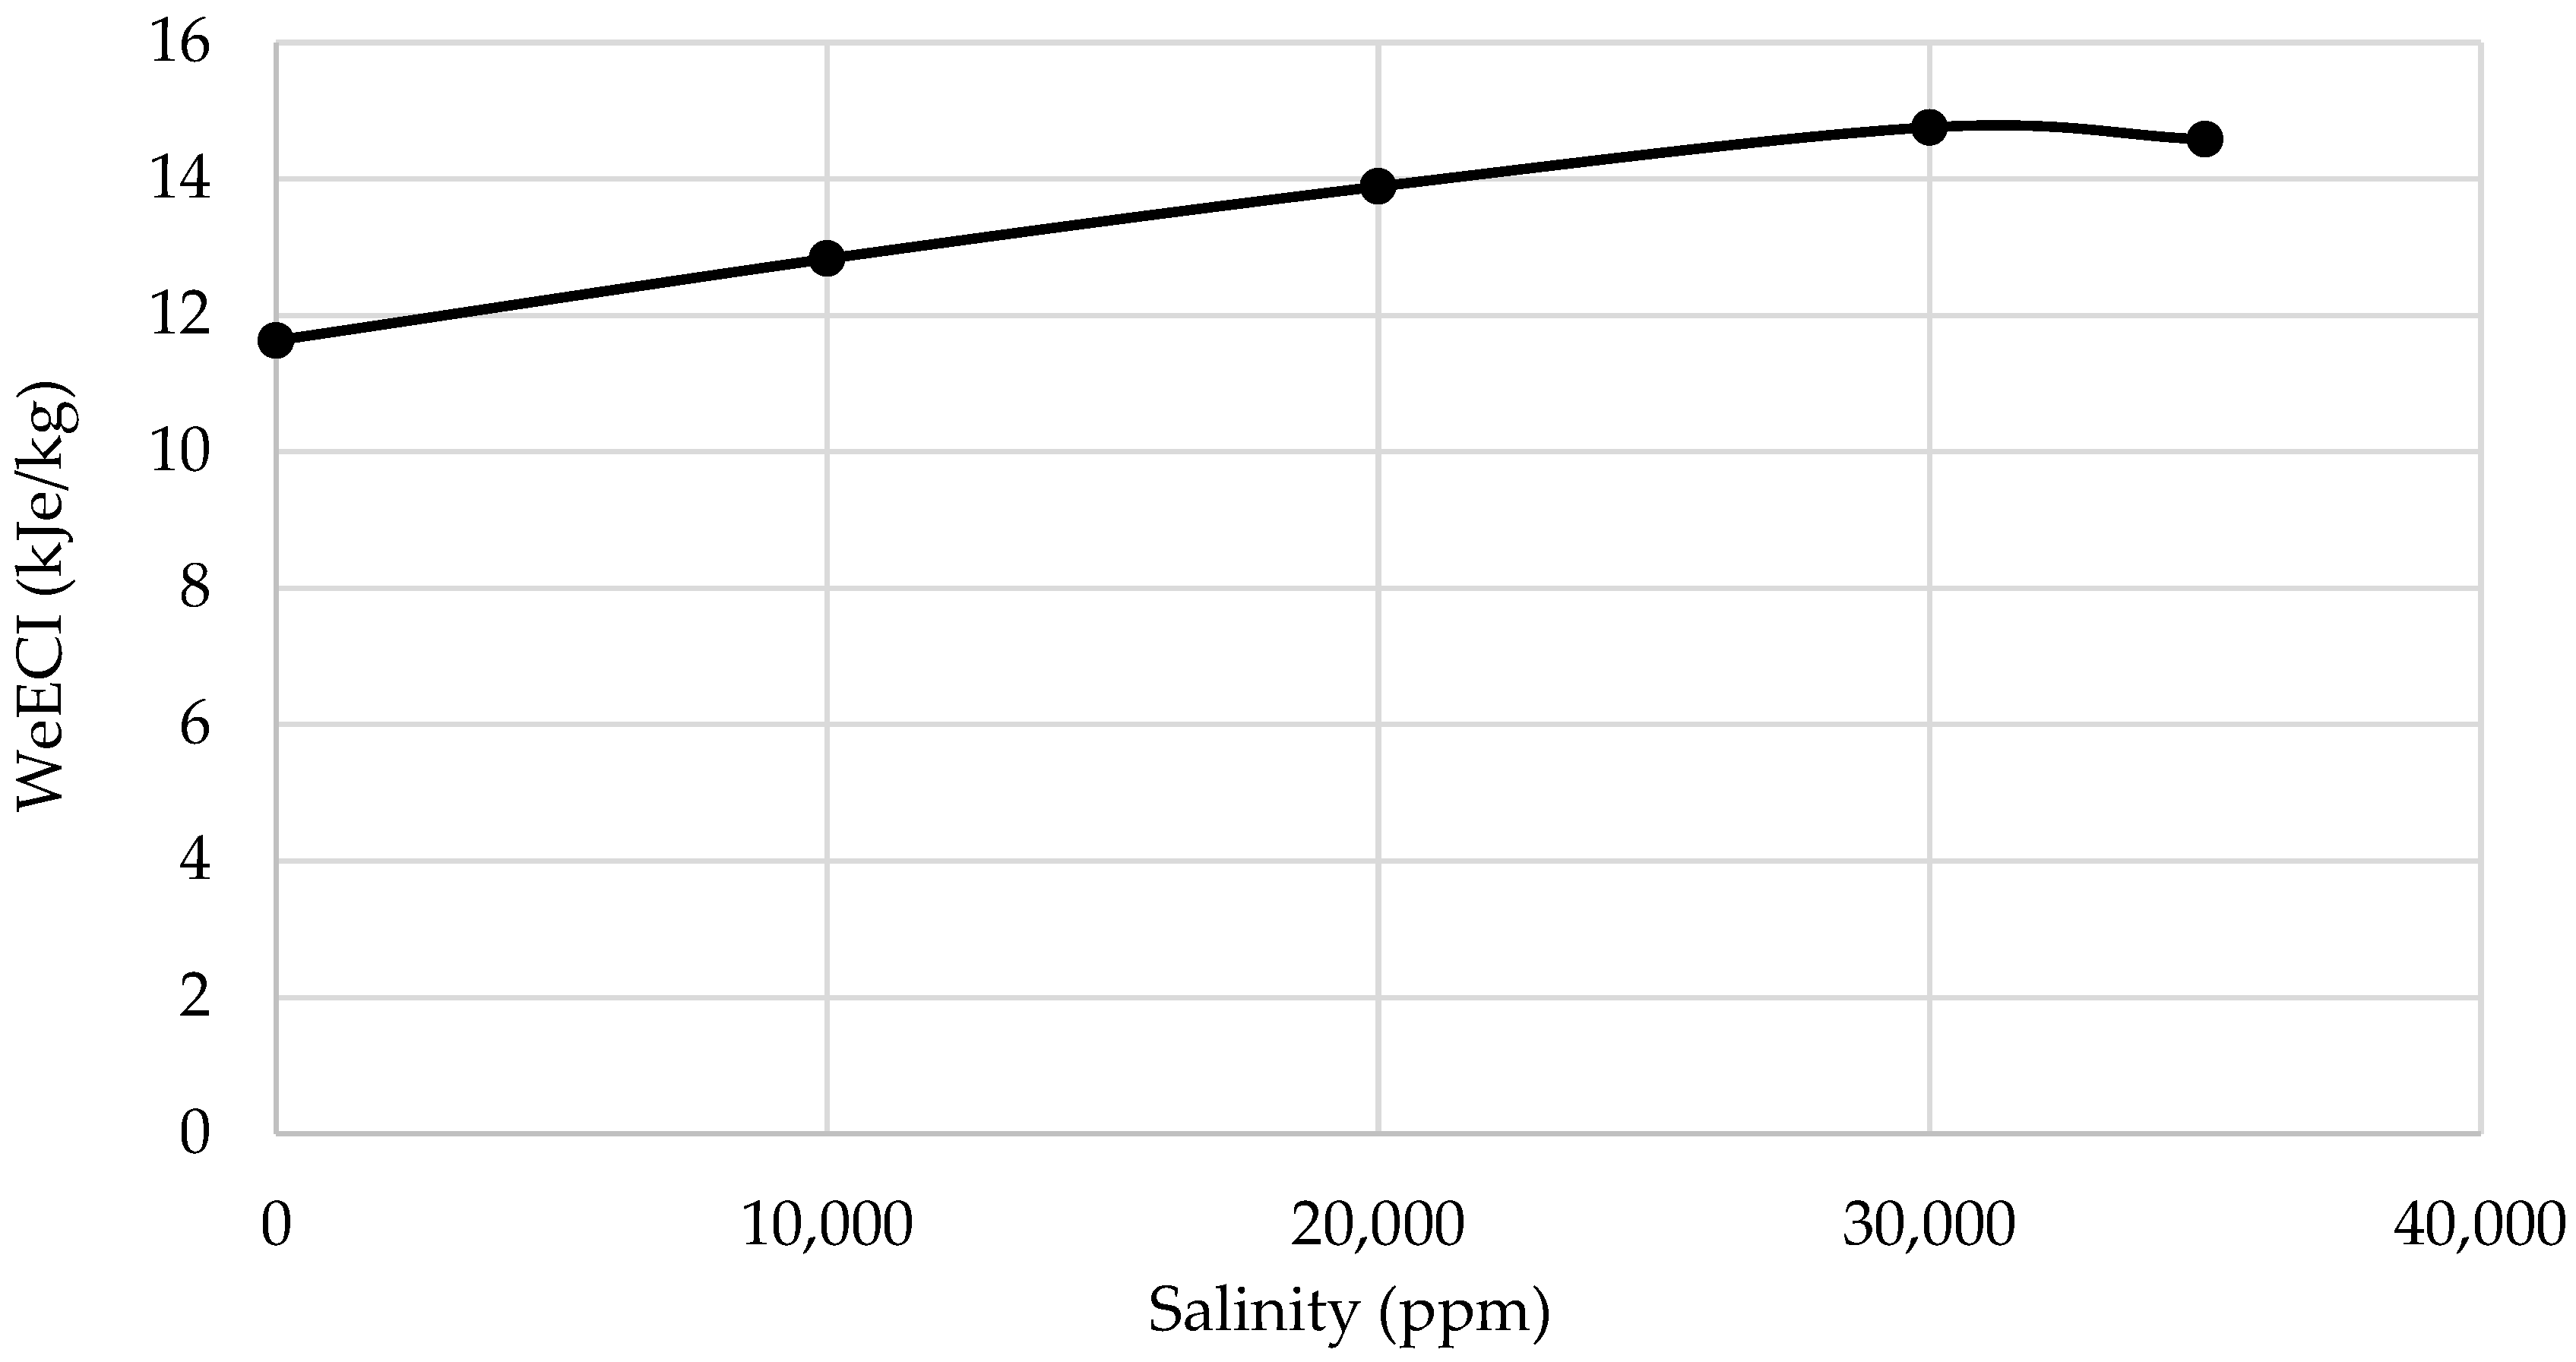
Figure 17 shows the variation in the Water–Electrical Energy Cogeneration Index (WeECI) with salinity. An increasing trend in WeECI from 11.63 kJe/kg to 14.58 kJe/kg is observed as salinity rises from 0 to 35,000 ppm, indicating a higher electrical energy contribution per unit mass of freshwater produced. This behaviour arises because freshwater production decreases more rapidly than electrical output at higher salinity levels. Since the TEG’s performance remains largely unaffected by feed salinity, the relative weighting of electrical generation increases under saline conditions. This result underscores a key advantage of the hybrid system: when the desalination performance is thermodynamically constrained, the system compensates by maintaining electricity generation, thereby preserving the overall output value. The WeECI metric effectively captures this trade-off and demonstrates that the proposed configuration is particularly attractive for high-salinity or zero-liquid-discharge applications, where electricity recovery becomes increasingly valuable.

3.2. Influence of Heat Input

This section investigates the effect of heat input on the thermal, electrical, and desalination performance of the integrated TEG–DCMD system. To isolate the influence of heat input, all experiments were conducted at a fixed feed salinity of 20,000 ppm, representative of high-salinity brackish water. The feed and permeate flow rates were maintained within narrow ranges of 1.4–1.6 L/min and 3.2–3.4 L/min, respectively, to minimize hydrodynamic variability. The heat input was varied by adjusting the hot-side temperature of the system between 78 and 106 °C, while the feed-side bulk temperature (35–41 °C) and permeate temperature (21–25 °C) were controlled using a cooling loop. Under these conditions, the impact of thermal input on freshwater production, power generation, and system efficiency metrics was systematically evaluated.
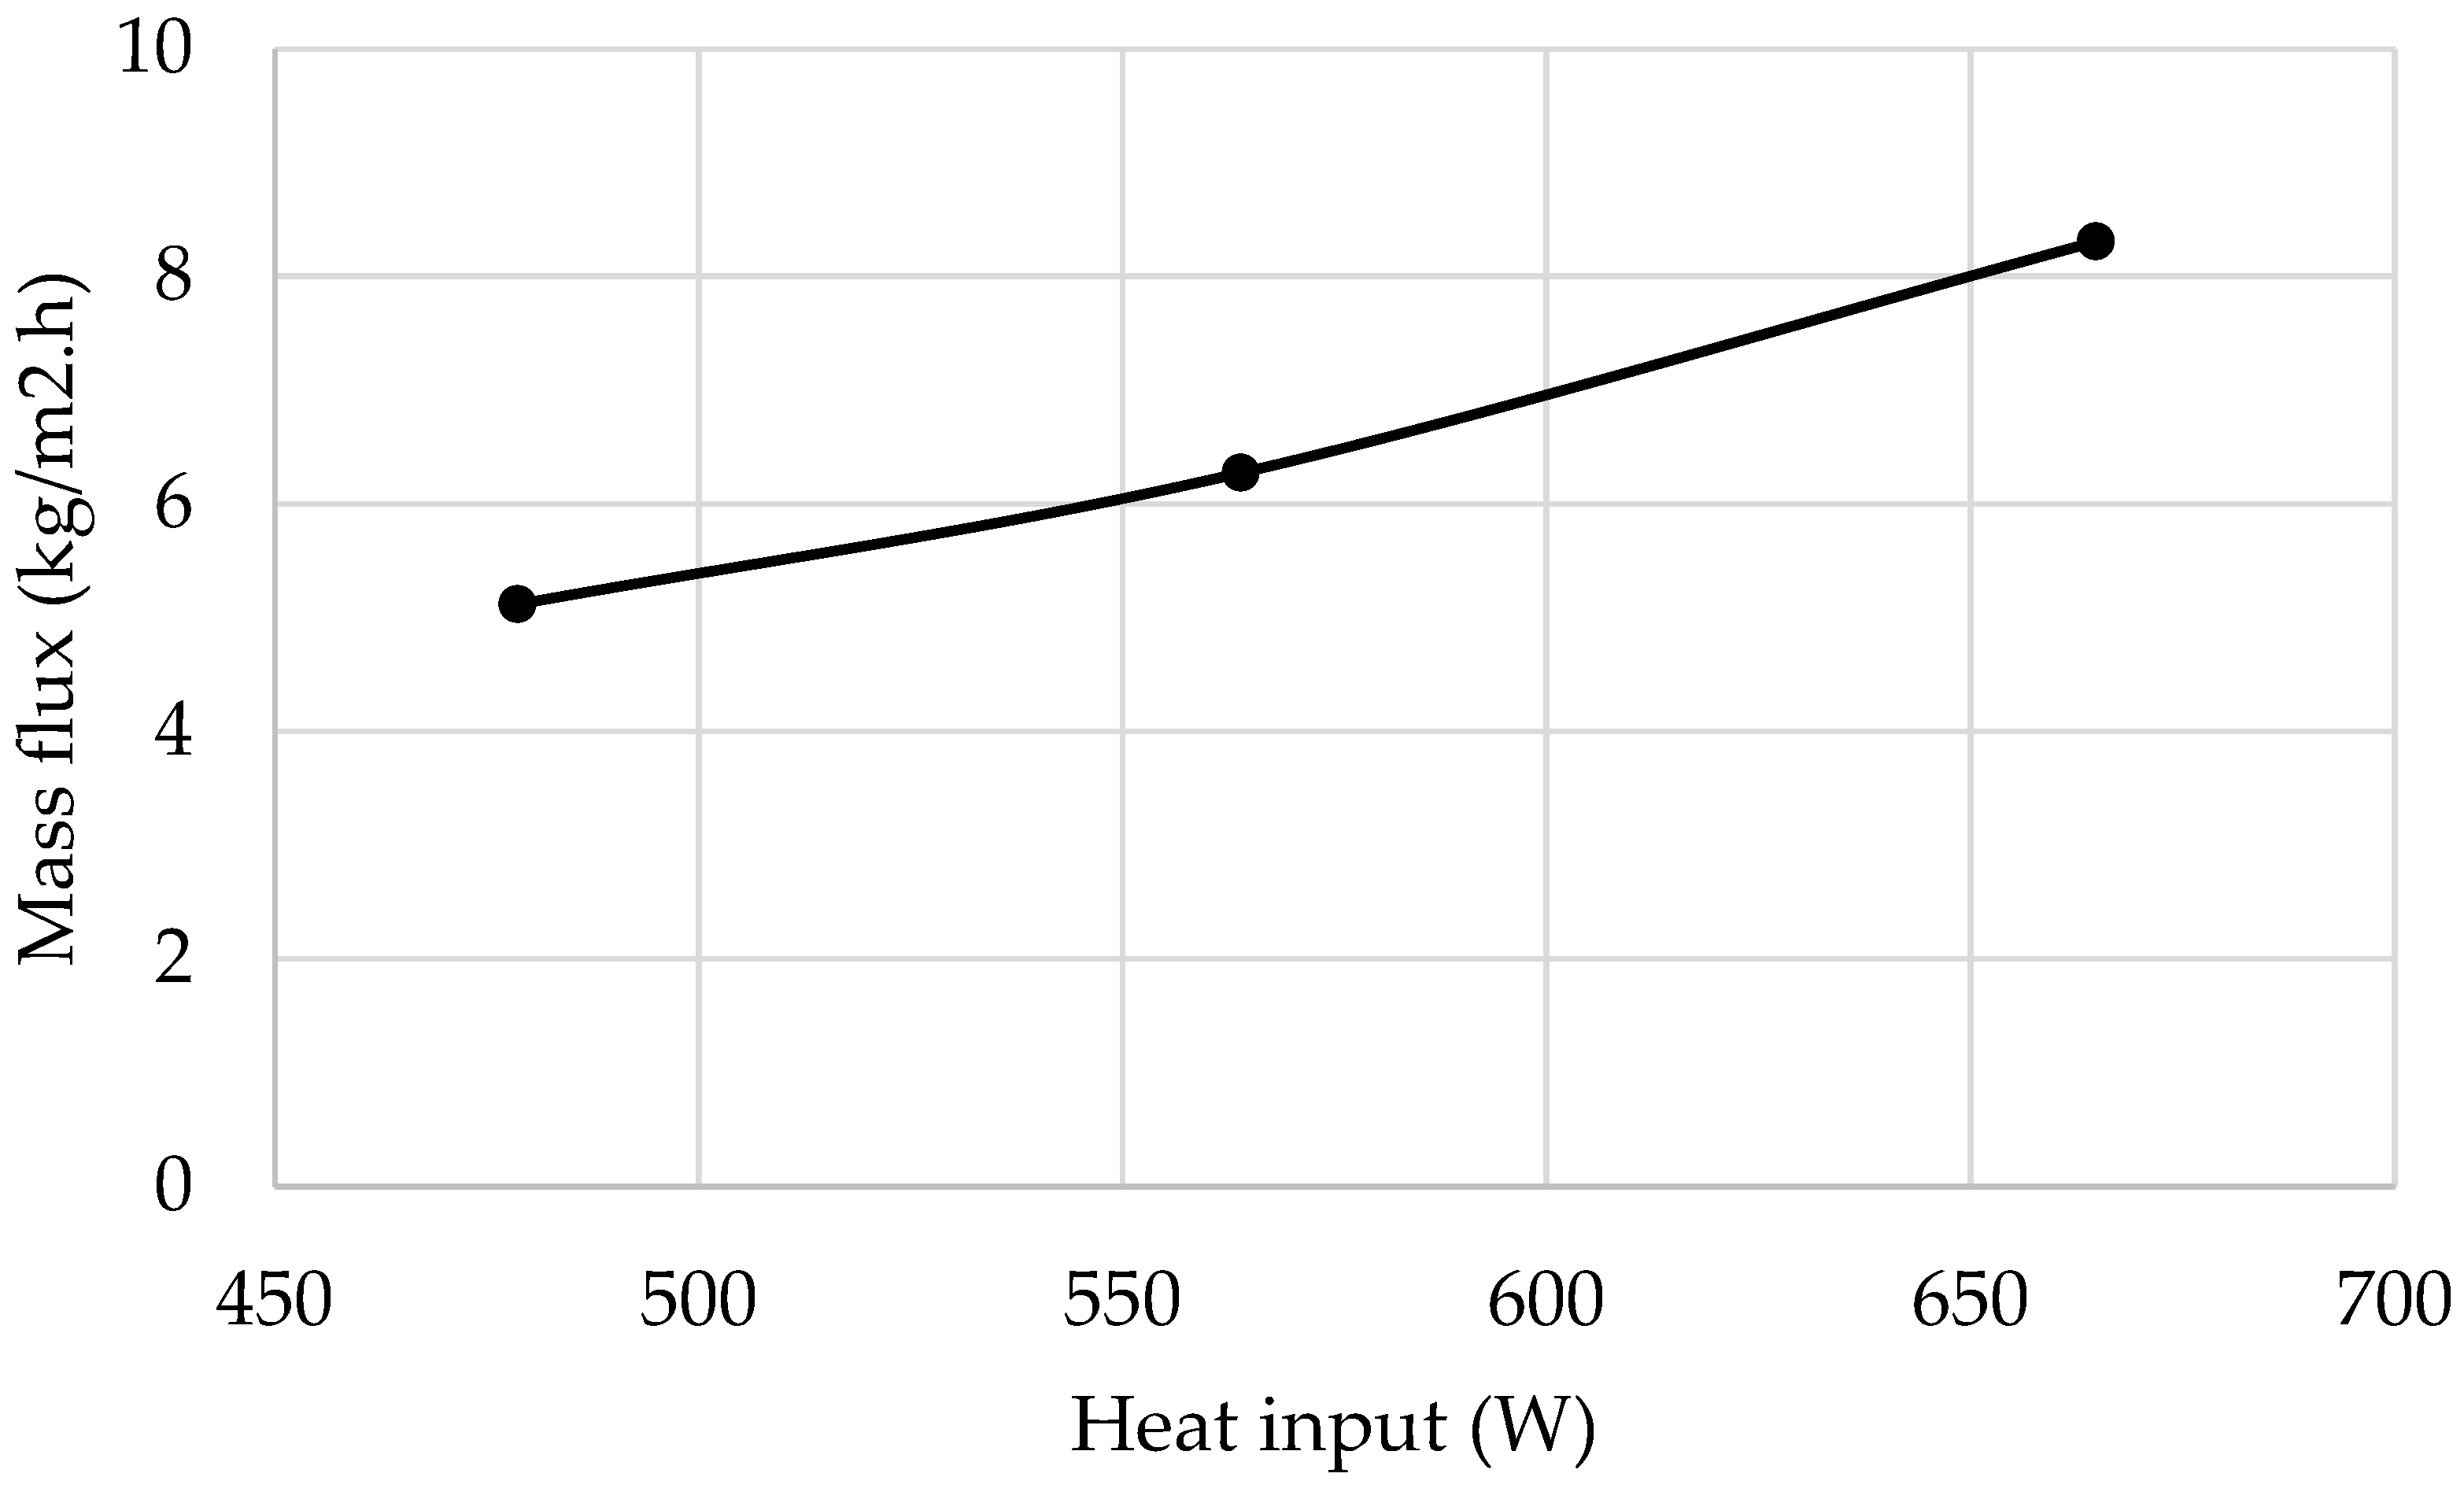
Figure 18 illustrates the effect of heat input on freshwater mass flux in the DCMD subsystem. A clear increase in mass flux is observed, from 5.12 kg/m2.h to 8.31 kg/m2.h, with rising heat input from 479 W to 665 W, which is primarily due to the enhanced temperature difference between the feed and permeate sides of the membrane. Higher feed temperatures increase the vapour pressure exponentially, strengthening the driving force for evaporation and transmembrane vapour transport. Since the permeate temperature is maintained as nearly constant by the cooling system, the temperature gradient across the membrane increases proportionally with the heat input. This result confirms that the system effectively converts additional thermal energy into increased water production without encountering early saturation effects. The findings highlight the strong dependence of DCMD performance on the thermal driving force and demonstrate that the integrated system can exploit higher waste heat availability to enhance desalination productivity.
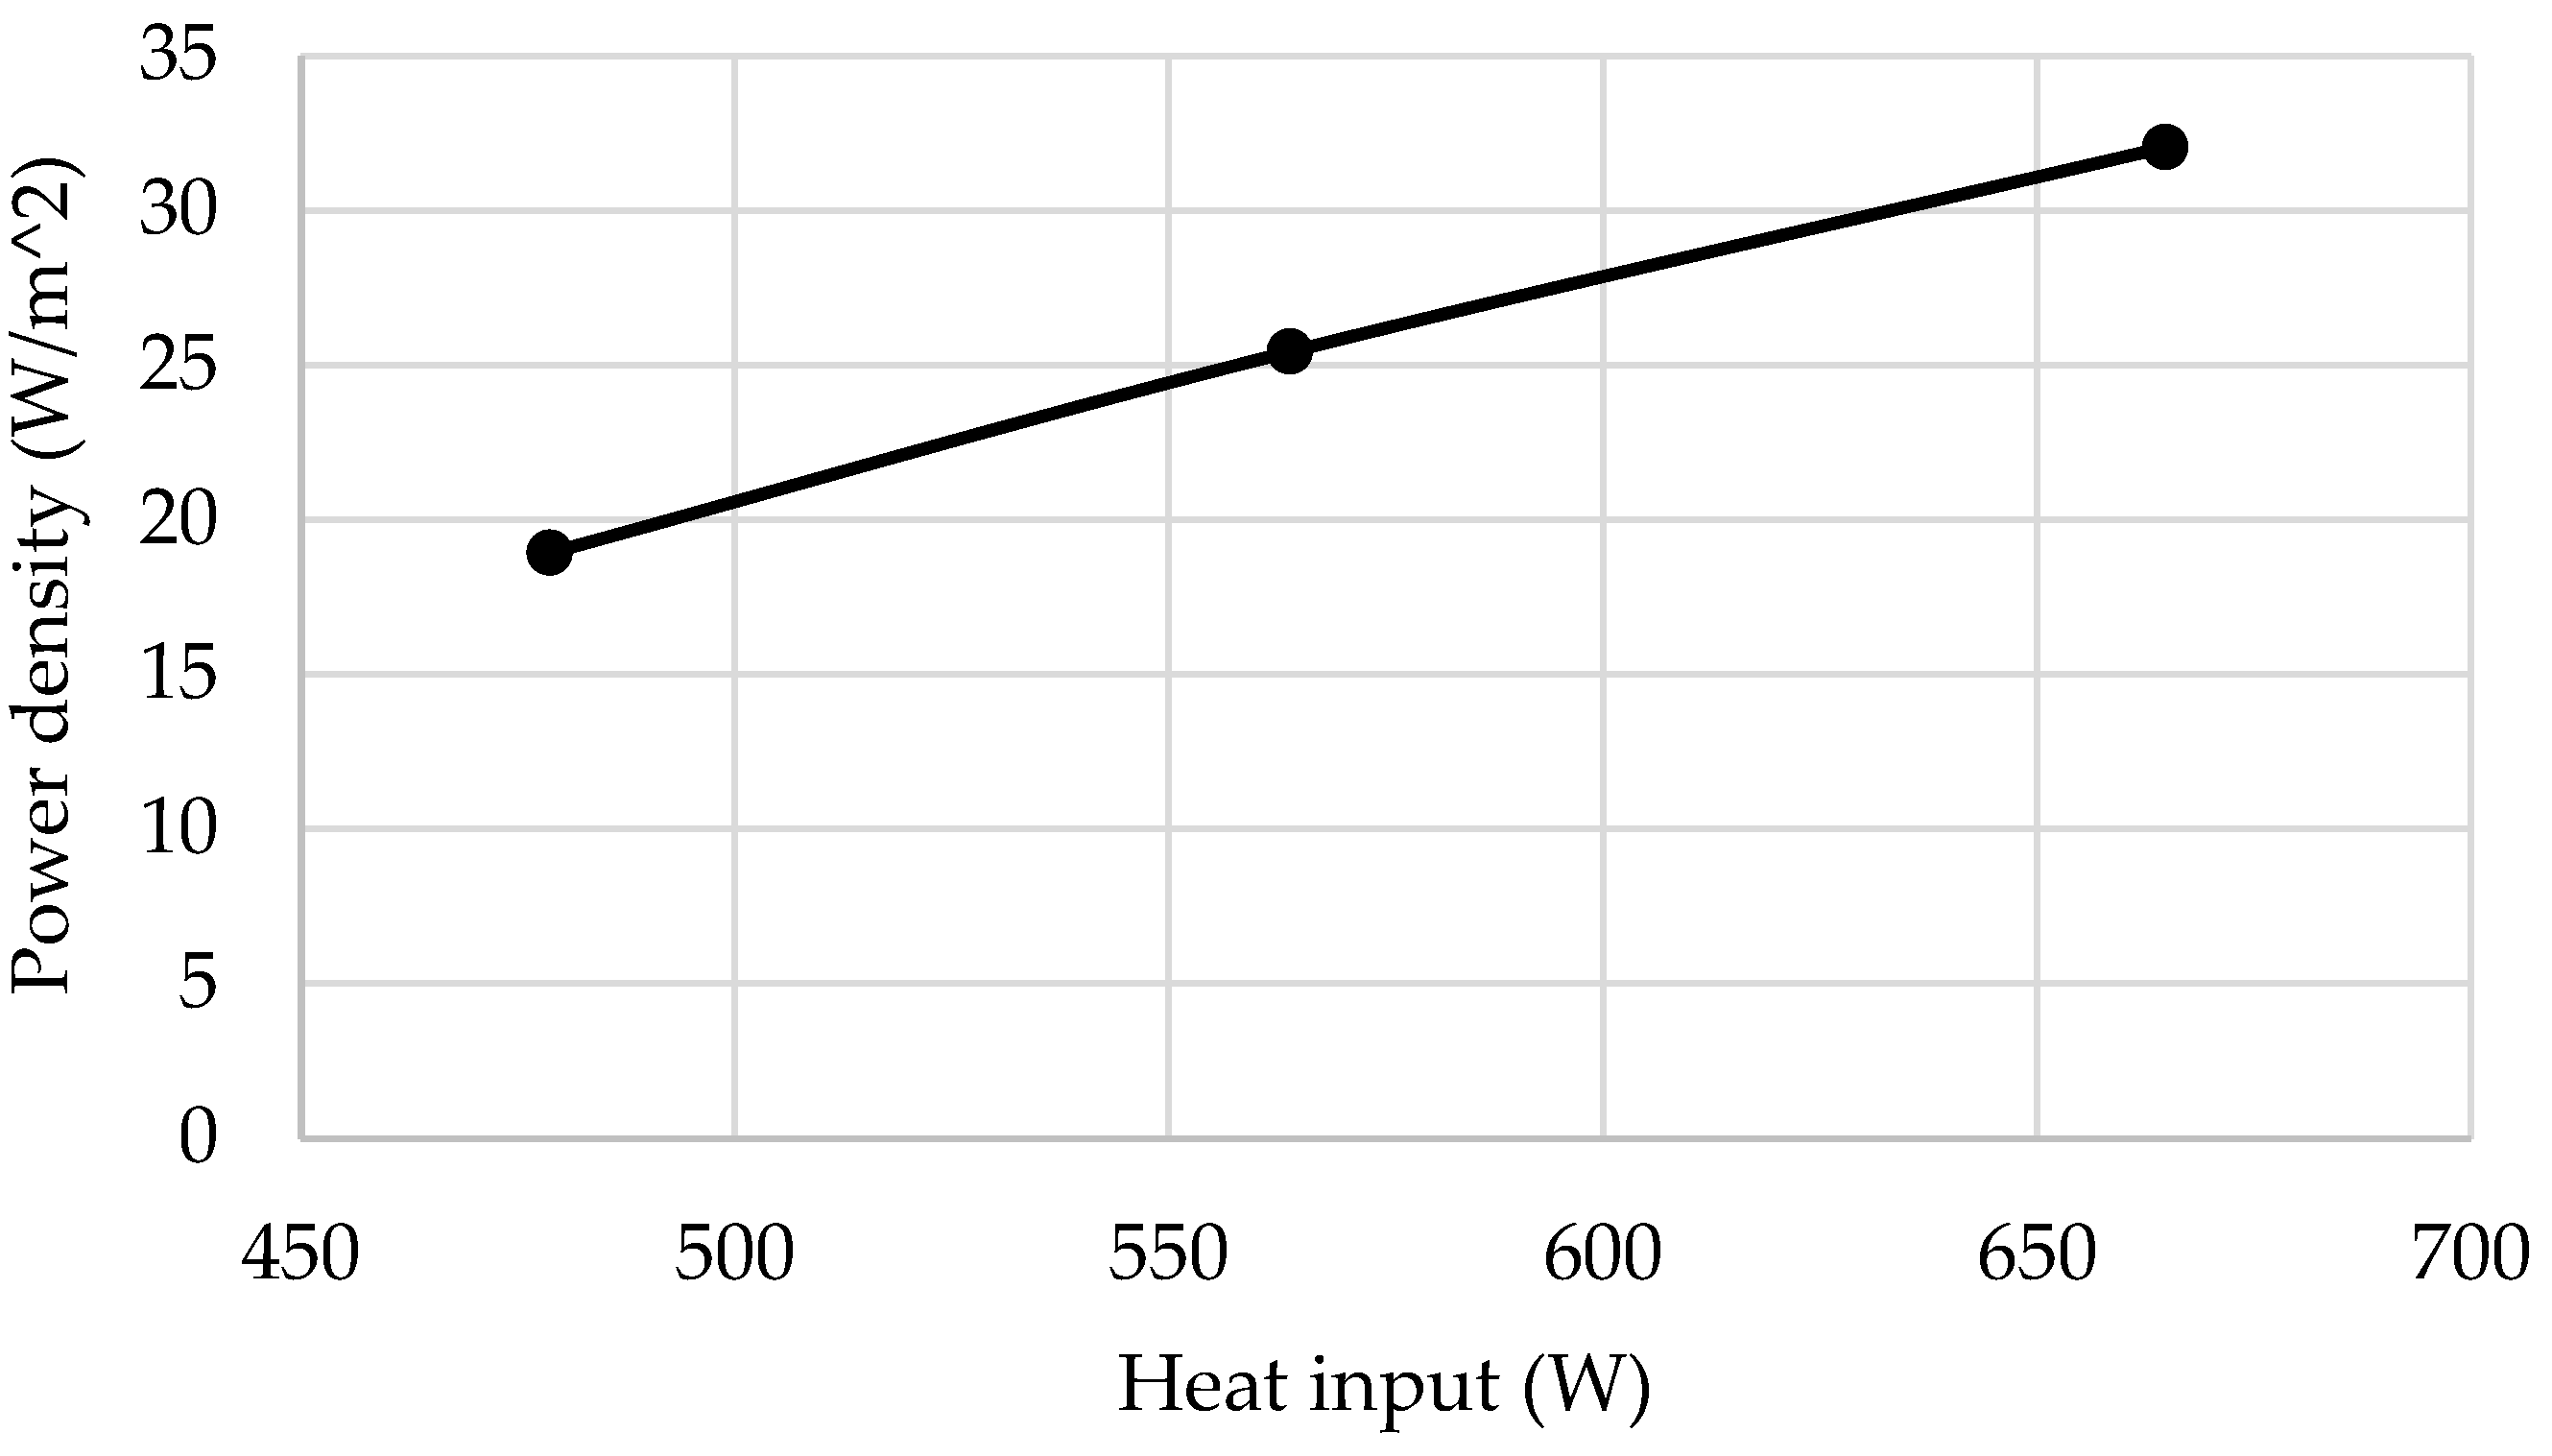
Figure 19 shows that the electrical power generation increases steadily with a rising heat input. This trend is directly linked to the increase in temperature difference across the TEG modules as more thermal energy is supplied. A higher heat input elevates the hot-side temperature while the cold side remains effectively cooled, resulting in an enhanced Seebeck voltage and increased electrical output. The linear-to-slightly-nonlinear increase in power density suggests efficient thermal coupling between the heat source, heat spreaders, and TEGs. Importantly, this result confirms that the hybrid system can simultaneously benefit both desalination and power generation when operating under higher thermal loads. The ability to co-produce electricity while driving membrane distillation strengthens the case for deploying the system in environments where excess low-grade heat is available.
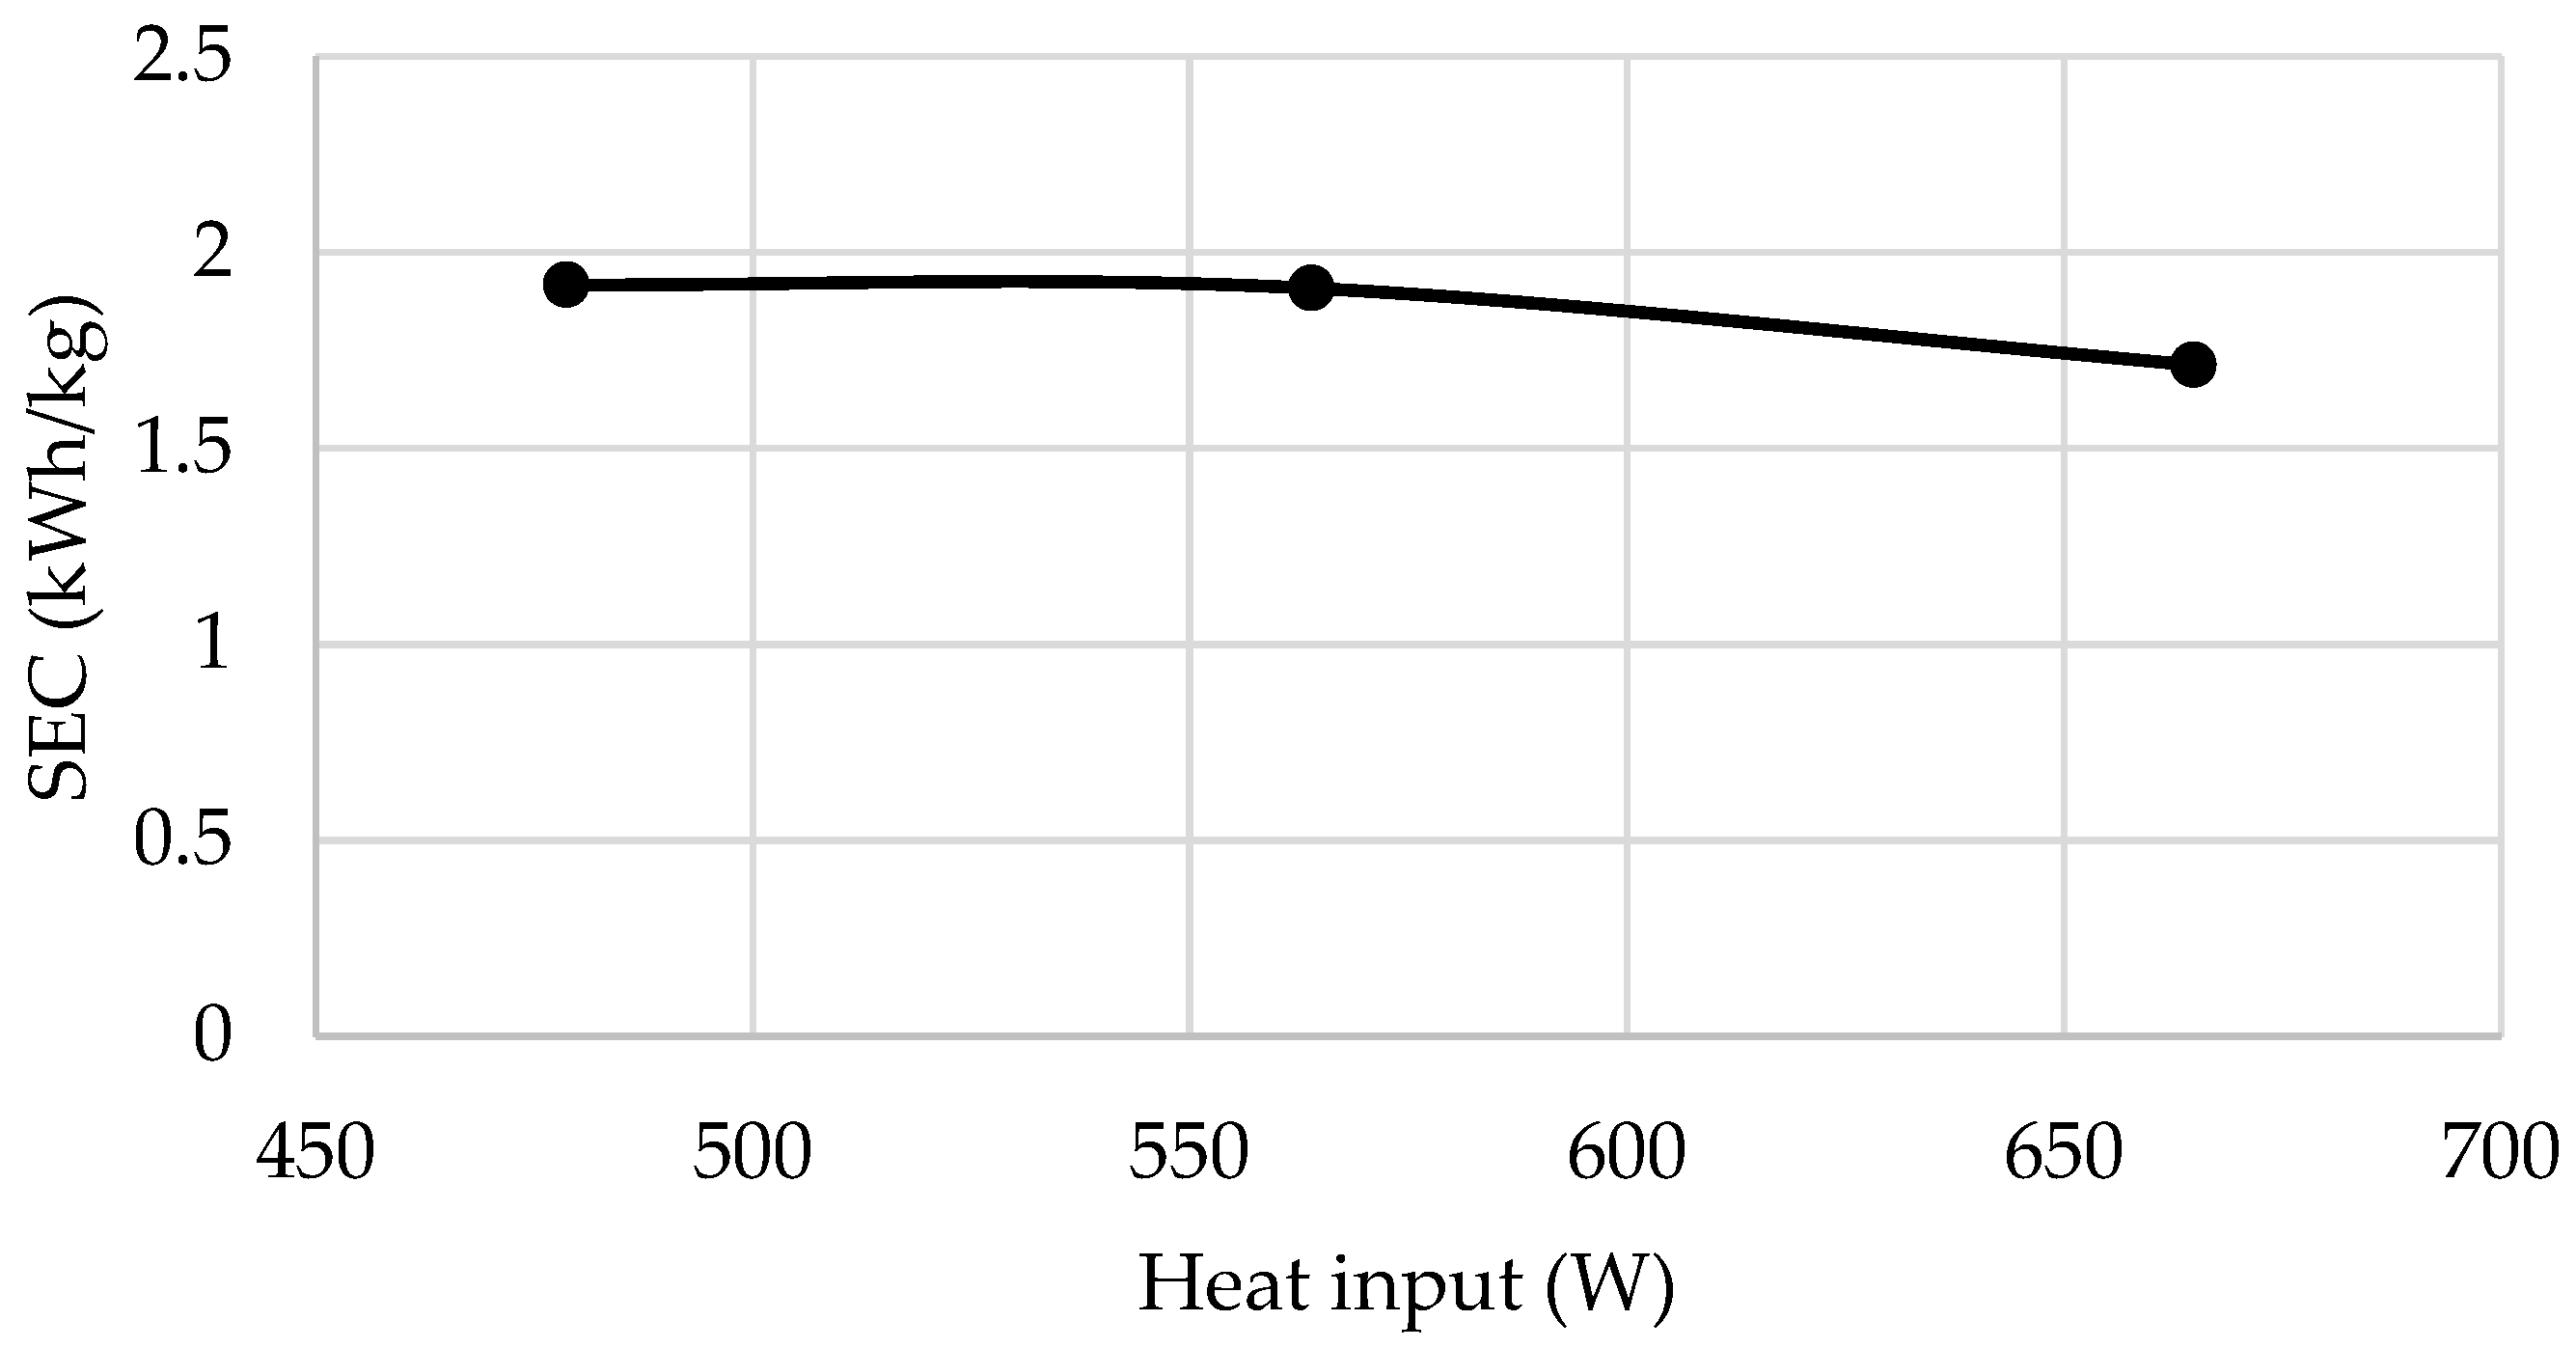
Figure 20 presents the relationship between heat input and Specific Energy Consumption (SEC). The results show that increasing the heat input from 479 W to 665 W leads to a reduction in SEC from 1.92 kWh/kg to 1.71 kWh/kg, indicating improved thermal efficiency in freshwater production. Although more total energy is supplied, the proportional increase in the freshwater flux is greater, resulting in lower energy consumption per unit volume of produced water. This behaviour reflects the more effective utilization of thermal energy at higher operating temperatures, where latent heat transfer dominates over sensible losses. The observed trend demonstrates that operating the system at elevated heat input levels can be energetically advantageous, particularly when waste heat is freely available. These findings support the feasibility of scaling the system for industrial applications where higher heat fluxes are accessible.
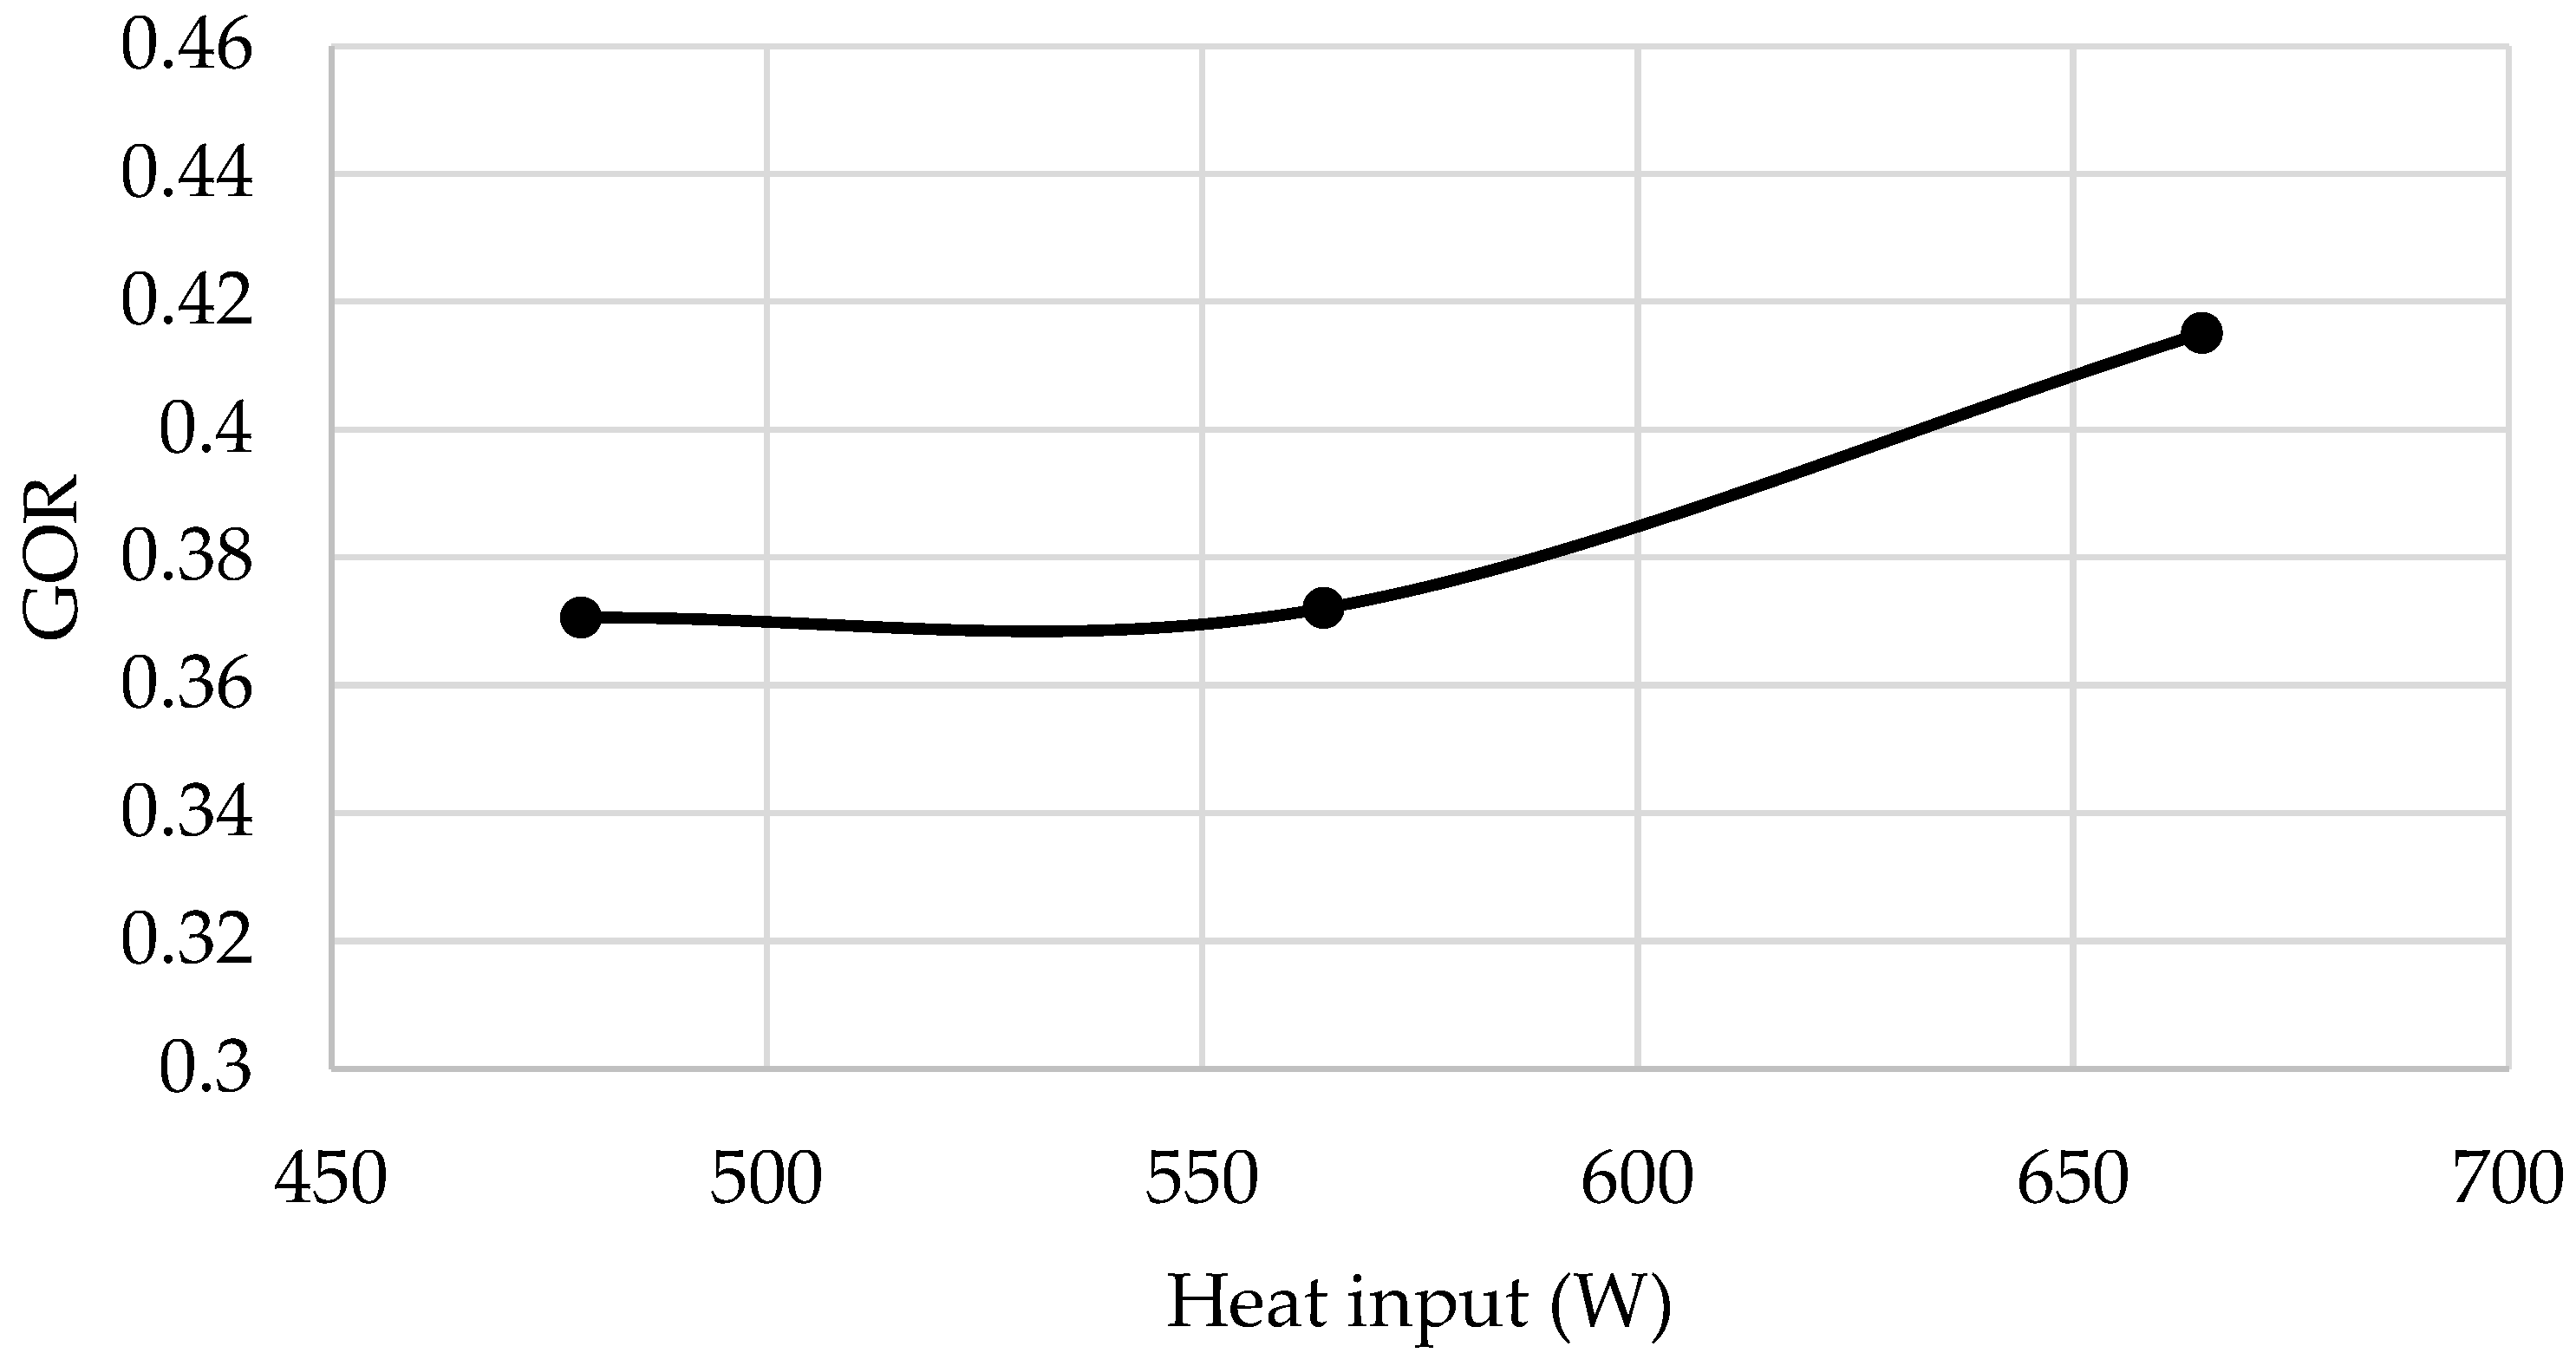
Figure 21 shows a positive correlation between heat input and the Gain Output Ratio (GOR). As the heat input increases from 479 W to 665 W, the GOR rises from 0.37 to 0.415, indicating the improved recovery of latent heat for freshwater production. Higher operating temperatures enhance evaporation rates while maintaining similar heat losses, thereby increasing the fraction of useful energy utilized for desalination. This trend confirms that the DCMD process becomes more thermally efficient at higher driving temperatures. Additionally, the presence of the TEG subsystem does not hinder the GOR improvement, demonstrating successful thermal integration. The results suggest that optimal system performance can be achieved by operating at the upper range of allowable membrane temperatures, provided material stability is maintained.
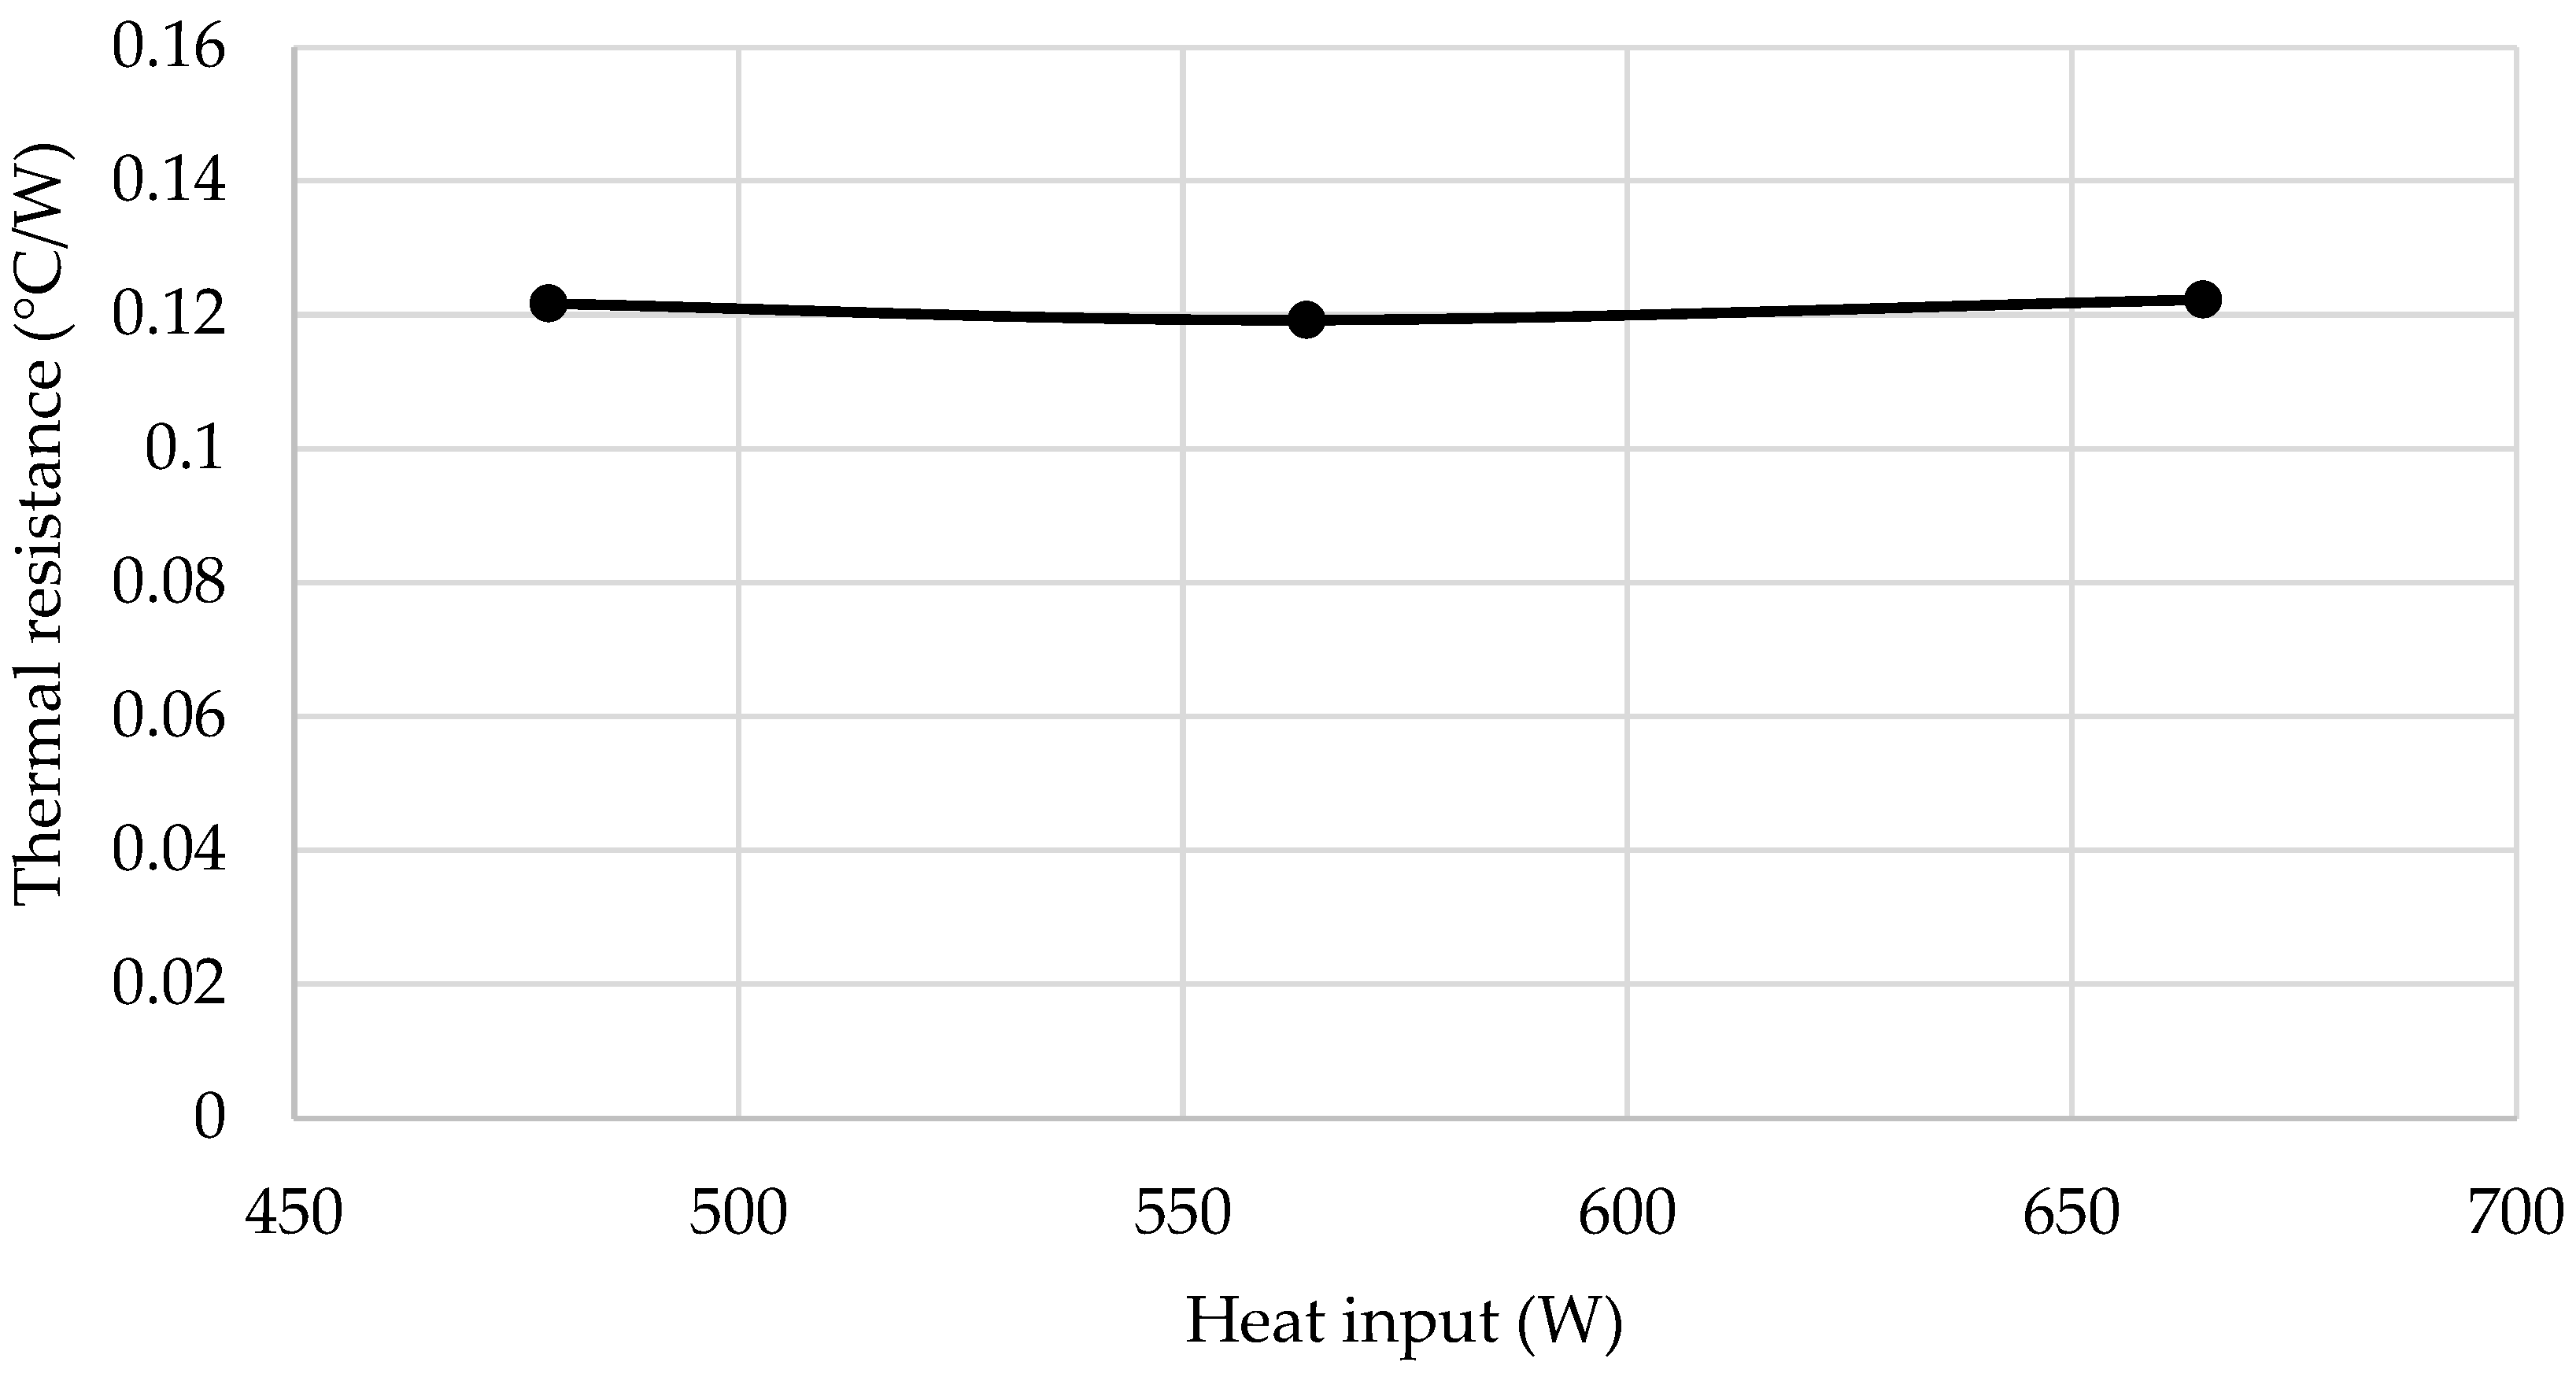
Figure 22 indicates that the overall thermal resistance of the system remains largely constant across varying heat input levels. This stability confirms that increasing heat input does not alter the intrinsic heat transfer characteristics of the system components. The result implies that the observed improvements in mass flux and power output are driven by higher temperature gradients rather than by changes in the conductive resistance. This predictable thermal behaviour is advantageous for system design and modelling, as performance can be reliably extrapolated across different operating conditions.
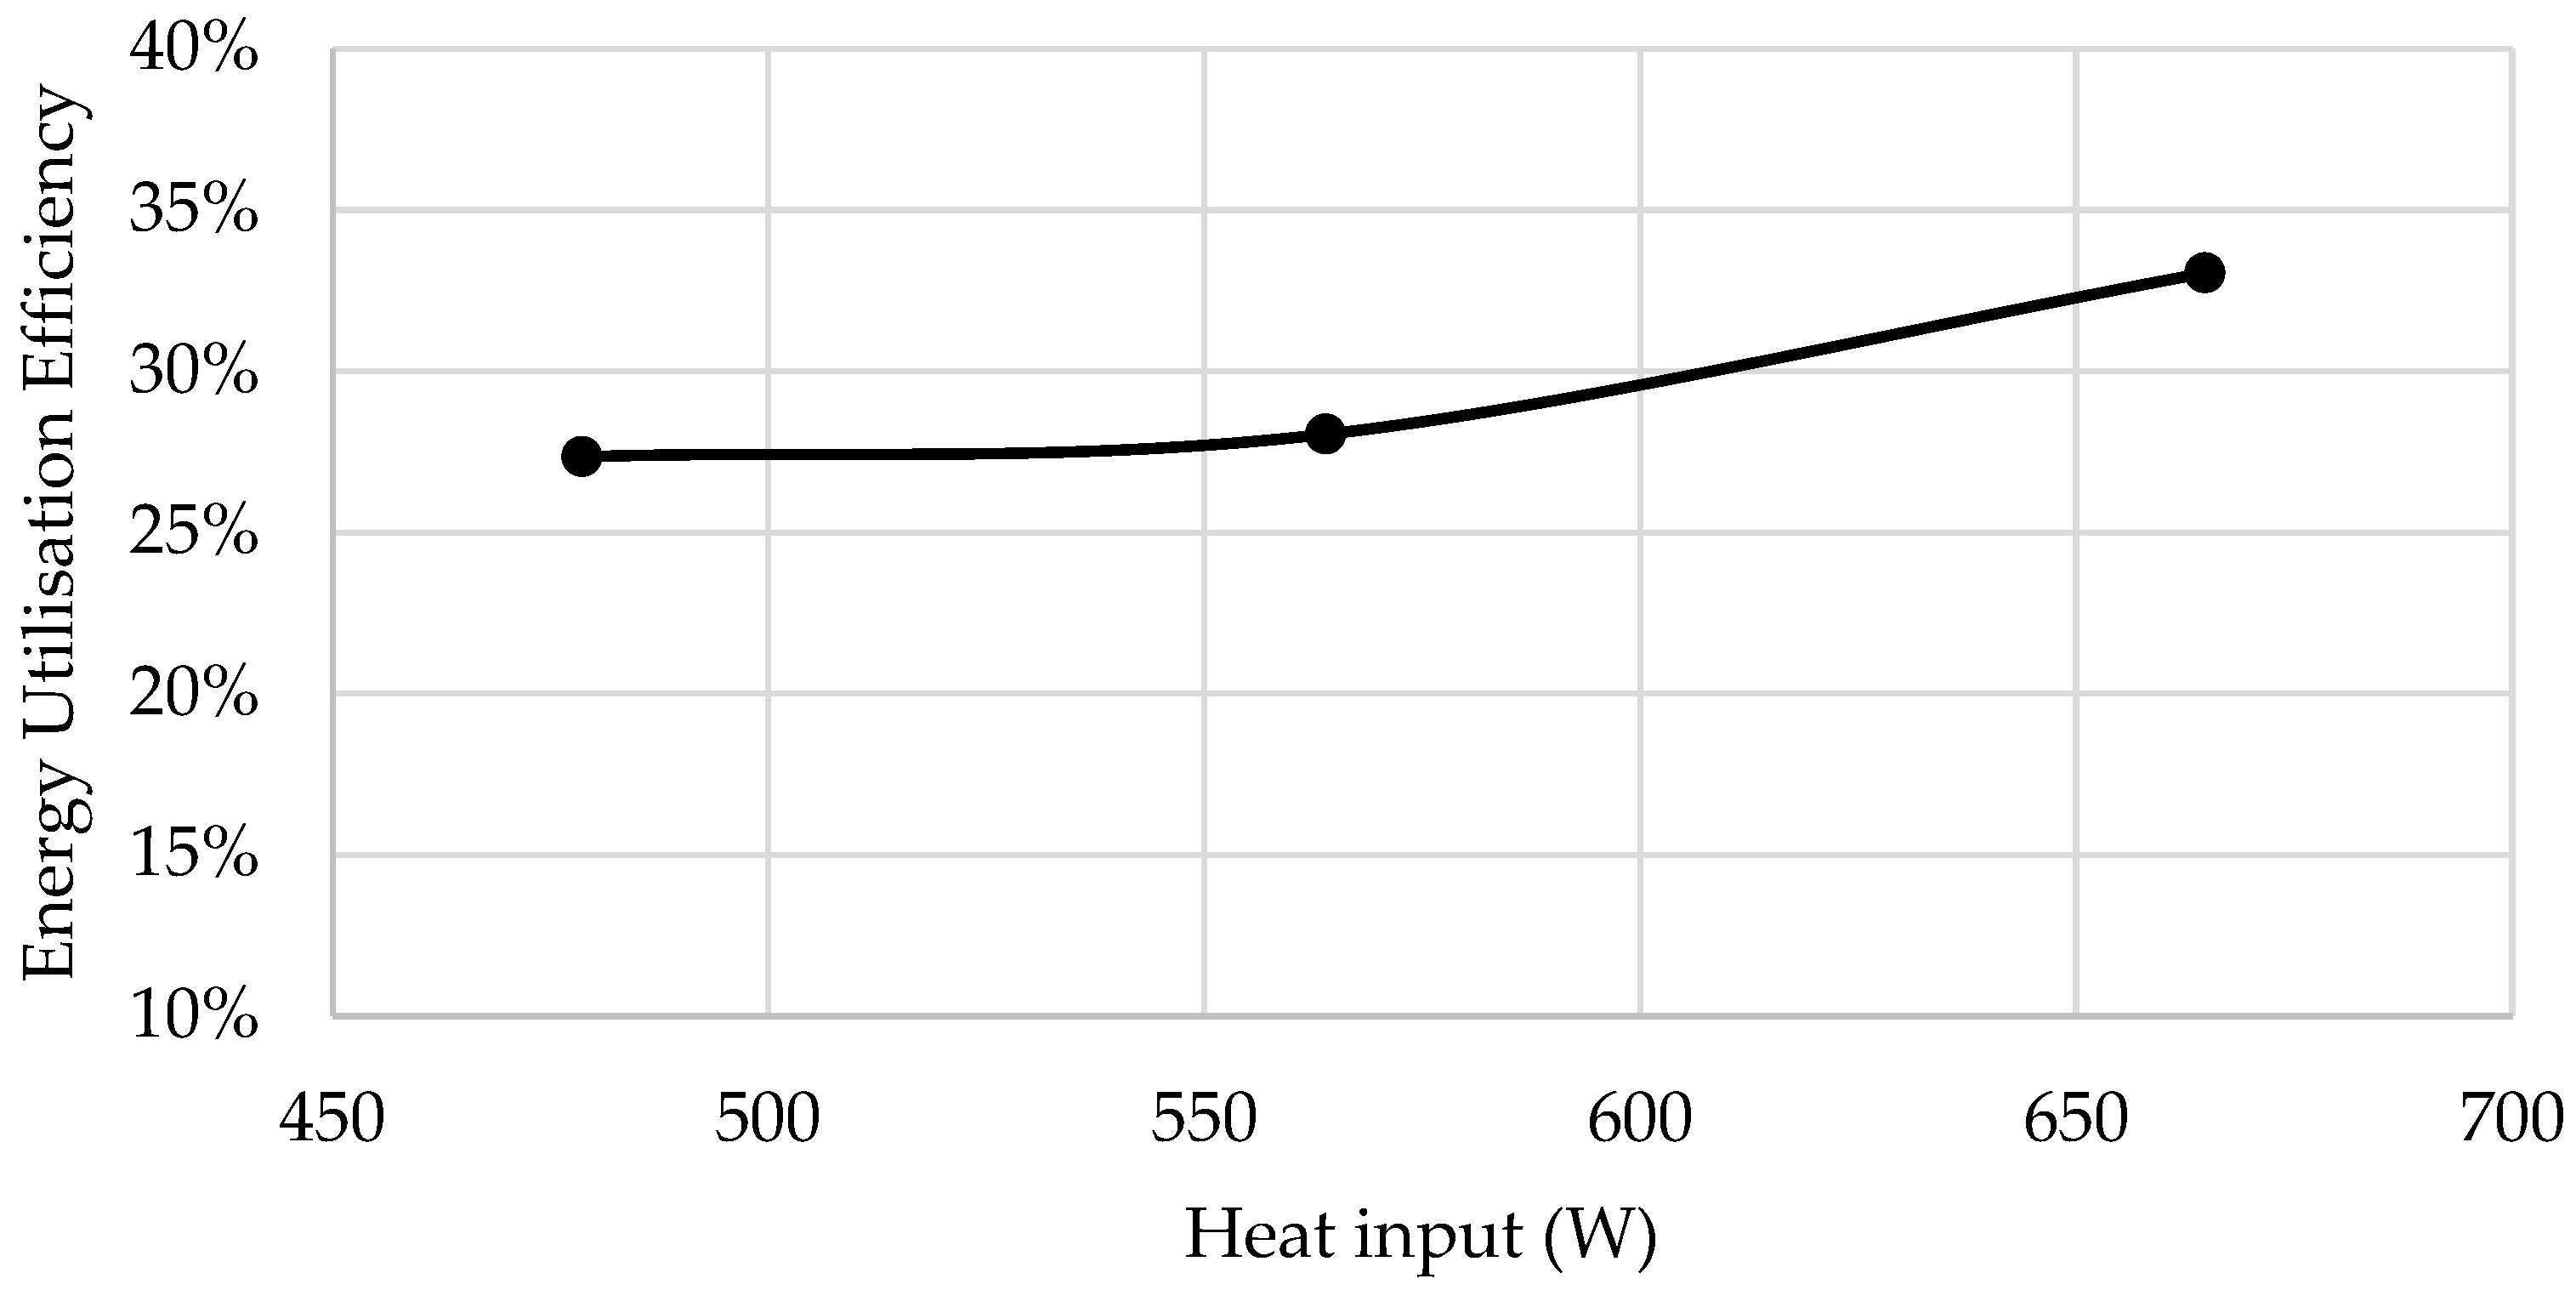
Figure 23 shows that the energy utilization efficiency increases with the heat input. This improvement reflects the system’s enhanced ability to convert supplied thermal energy into useful outputs at higher operating temperatures. Both freshwater production and electrical generation increase with the heat input, reducing the proportion of wasted heat. The result highlights the synergistic effect of integrating TEGs with DCMD, where additional heat contributes simultaneously to multiple outputs, improving the overall system’s efficiency.
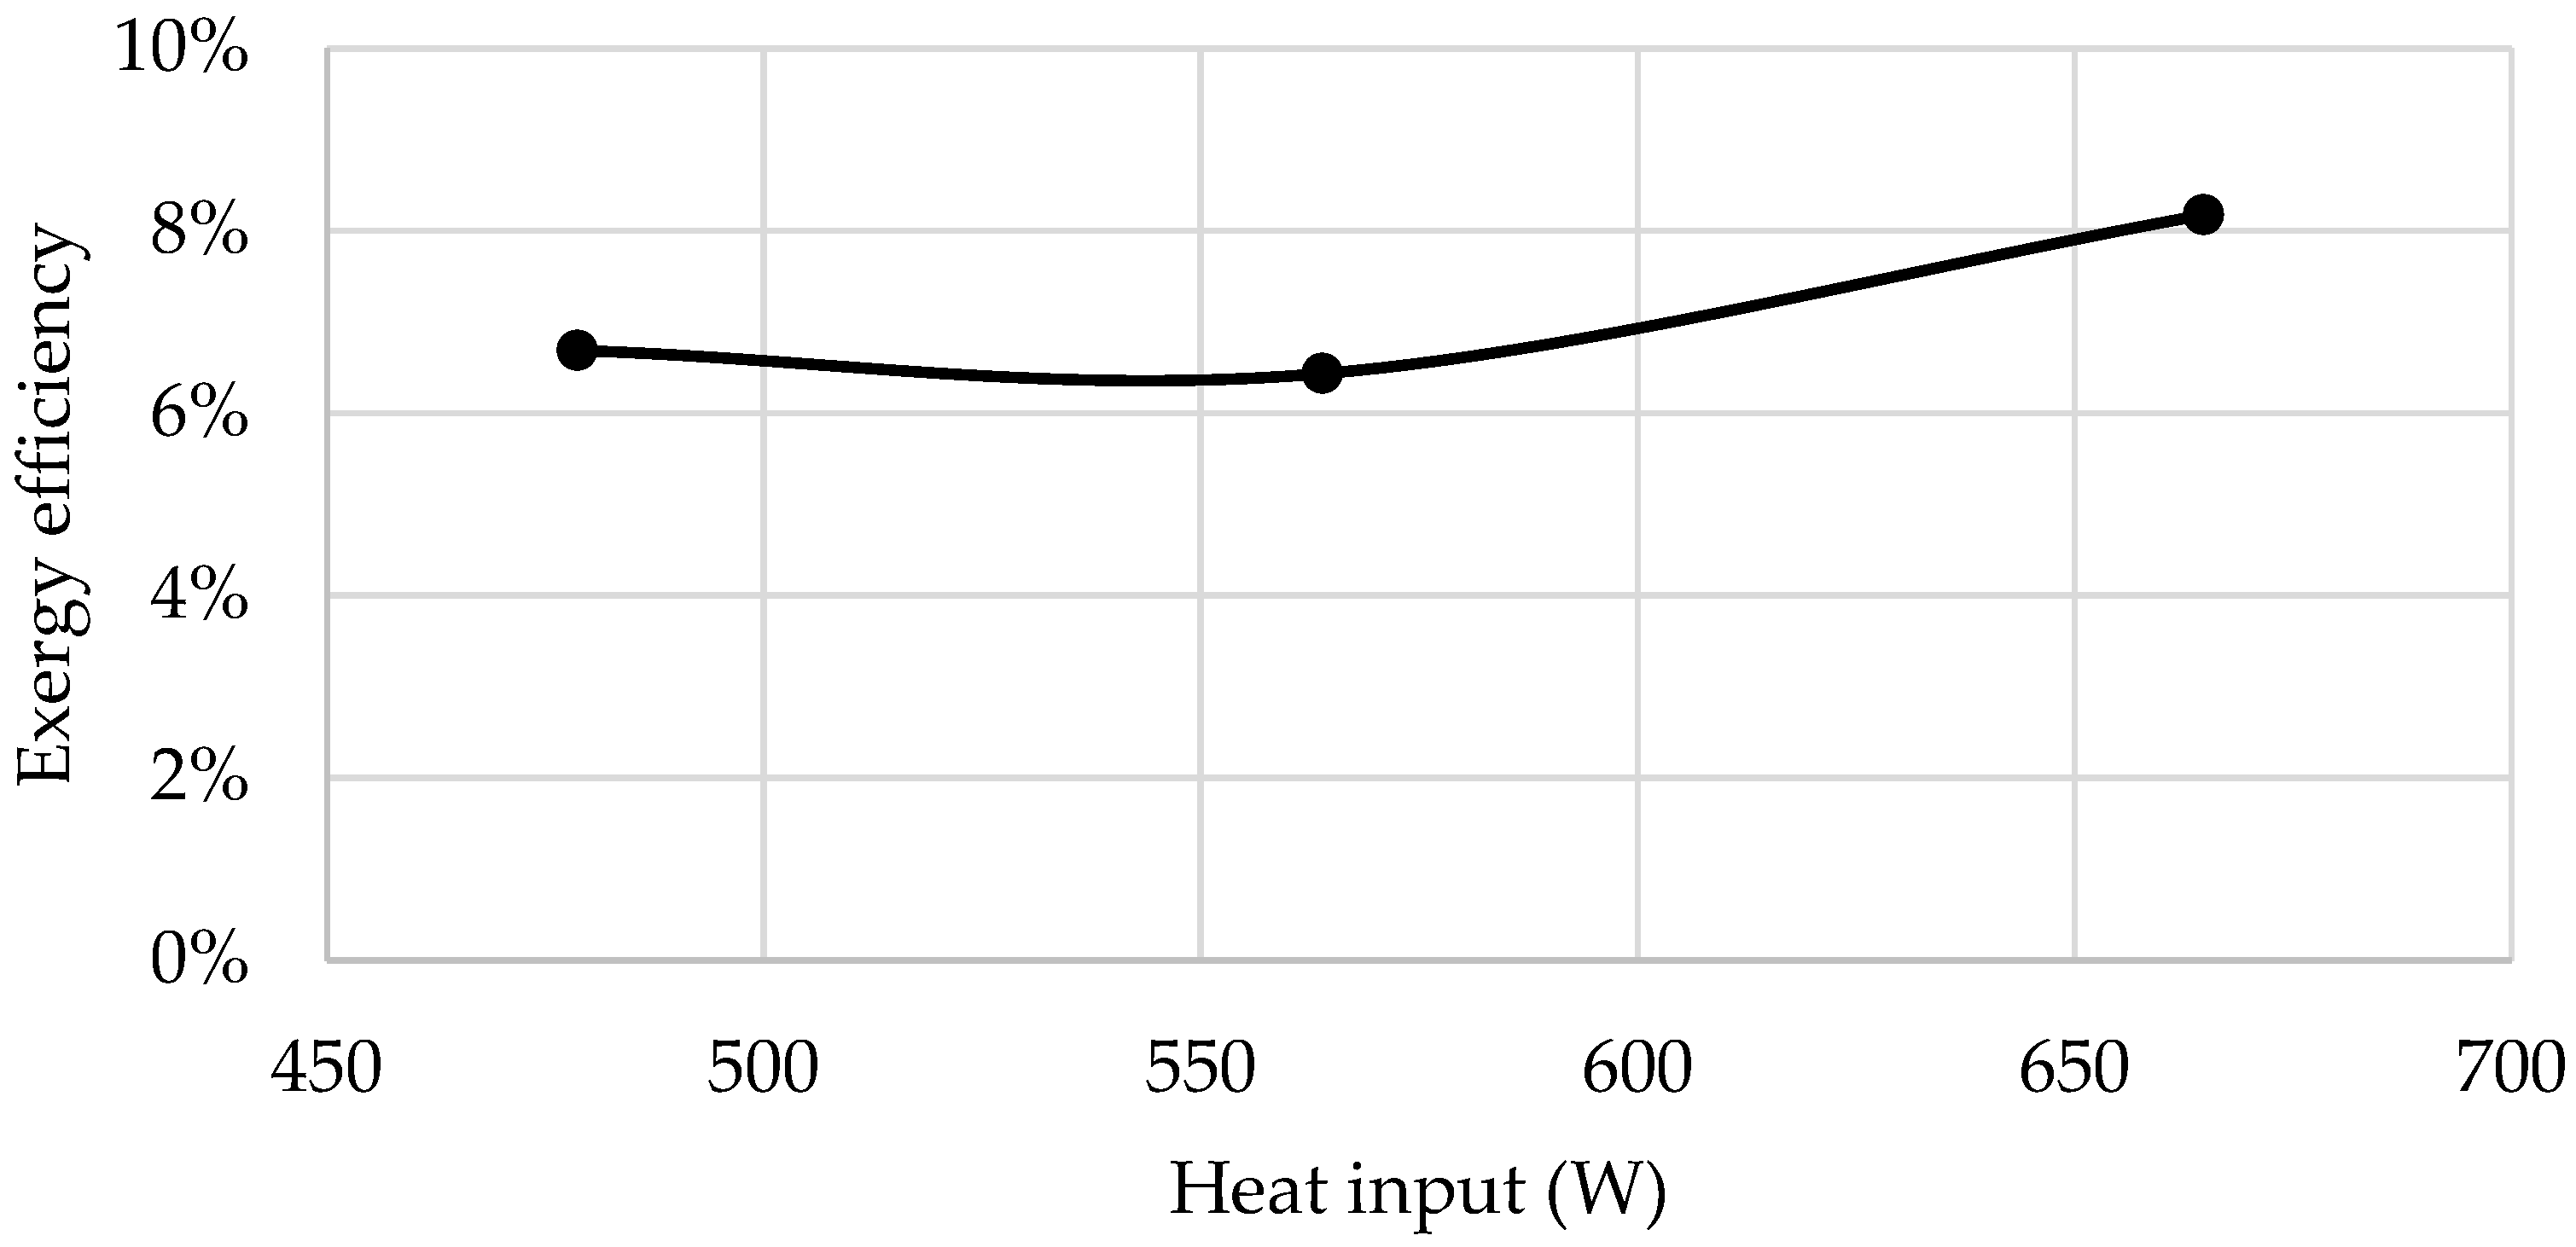
Figure 24 presents a slight increase in exergy efficiency with a rising heat input. Although the improvement is modest, it indicates reduced relative irreversibilities at higher operating temperatures. Enhanced temperature gradients improve the quality of energy conversion in both thermoelectric and membrane distillation processes. The limited sensitivity suggests that exergy losses are dominated by inherent process constraints rather than operating conditions.
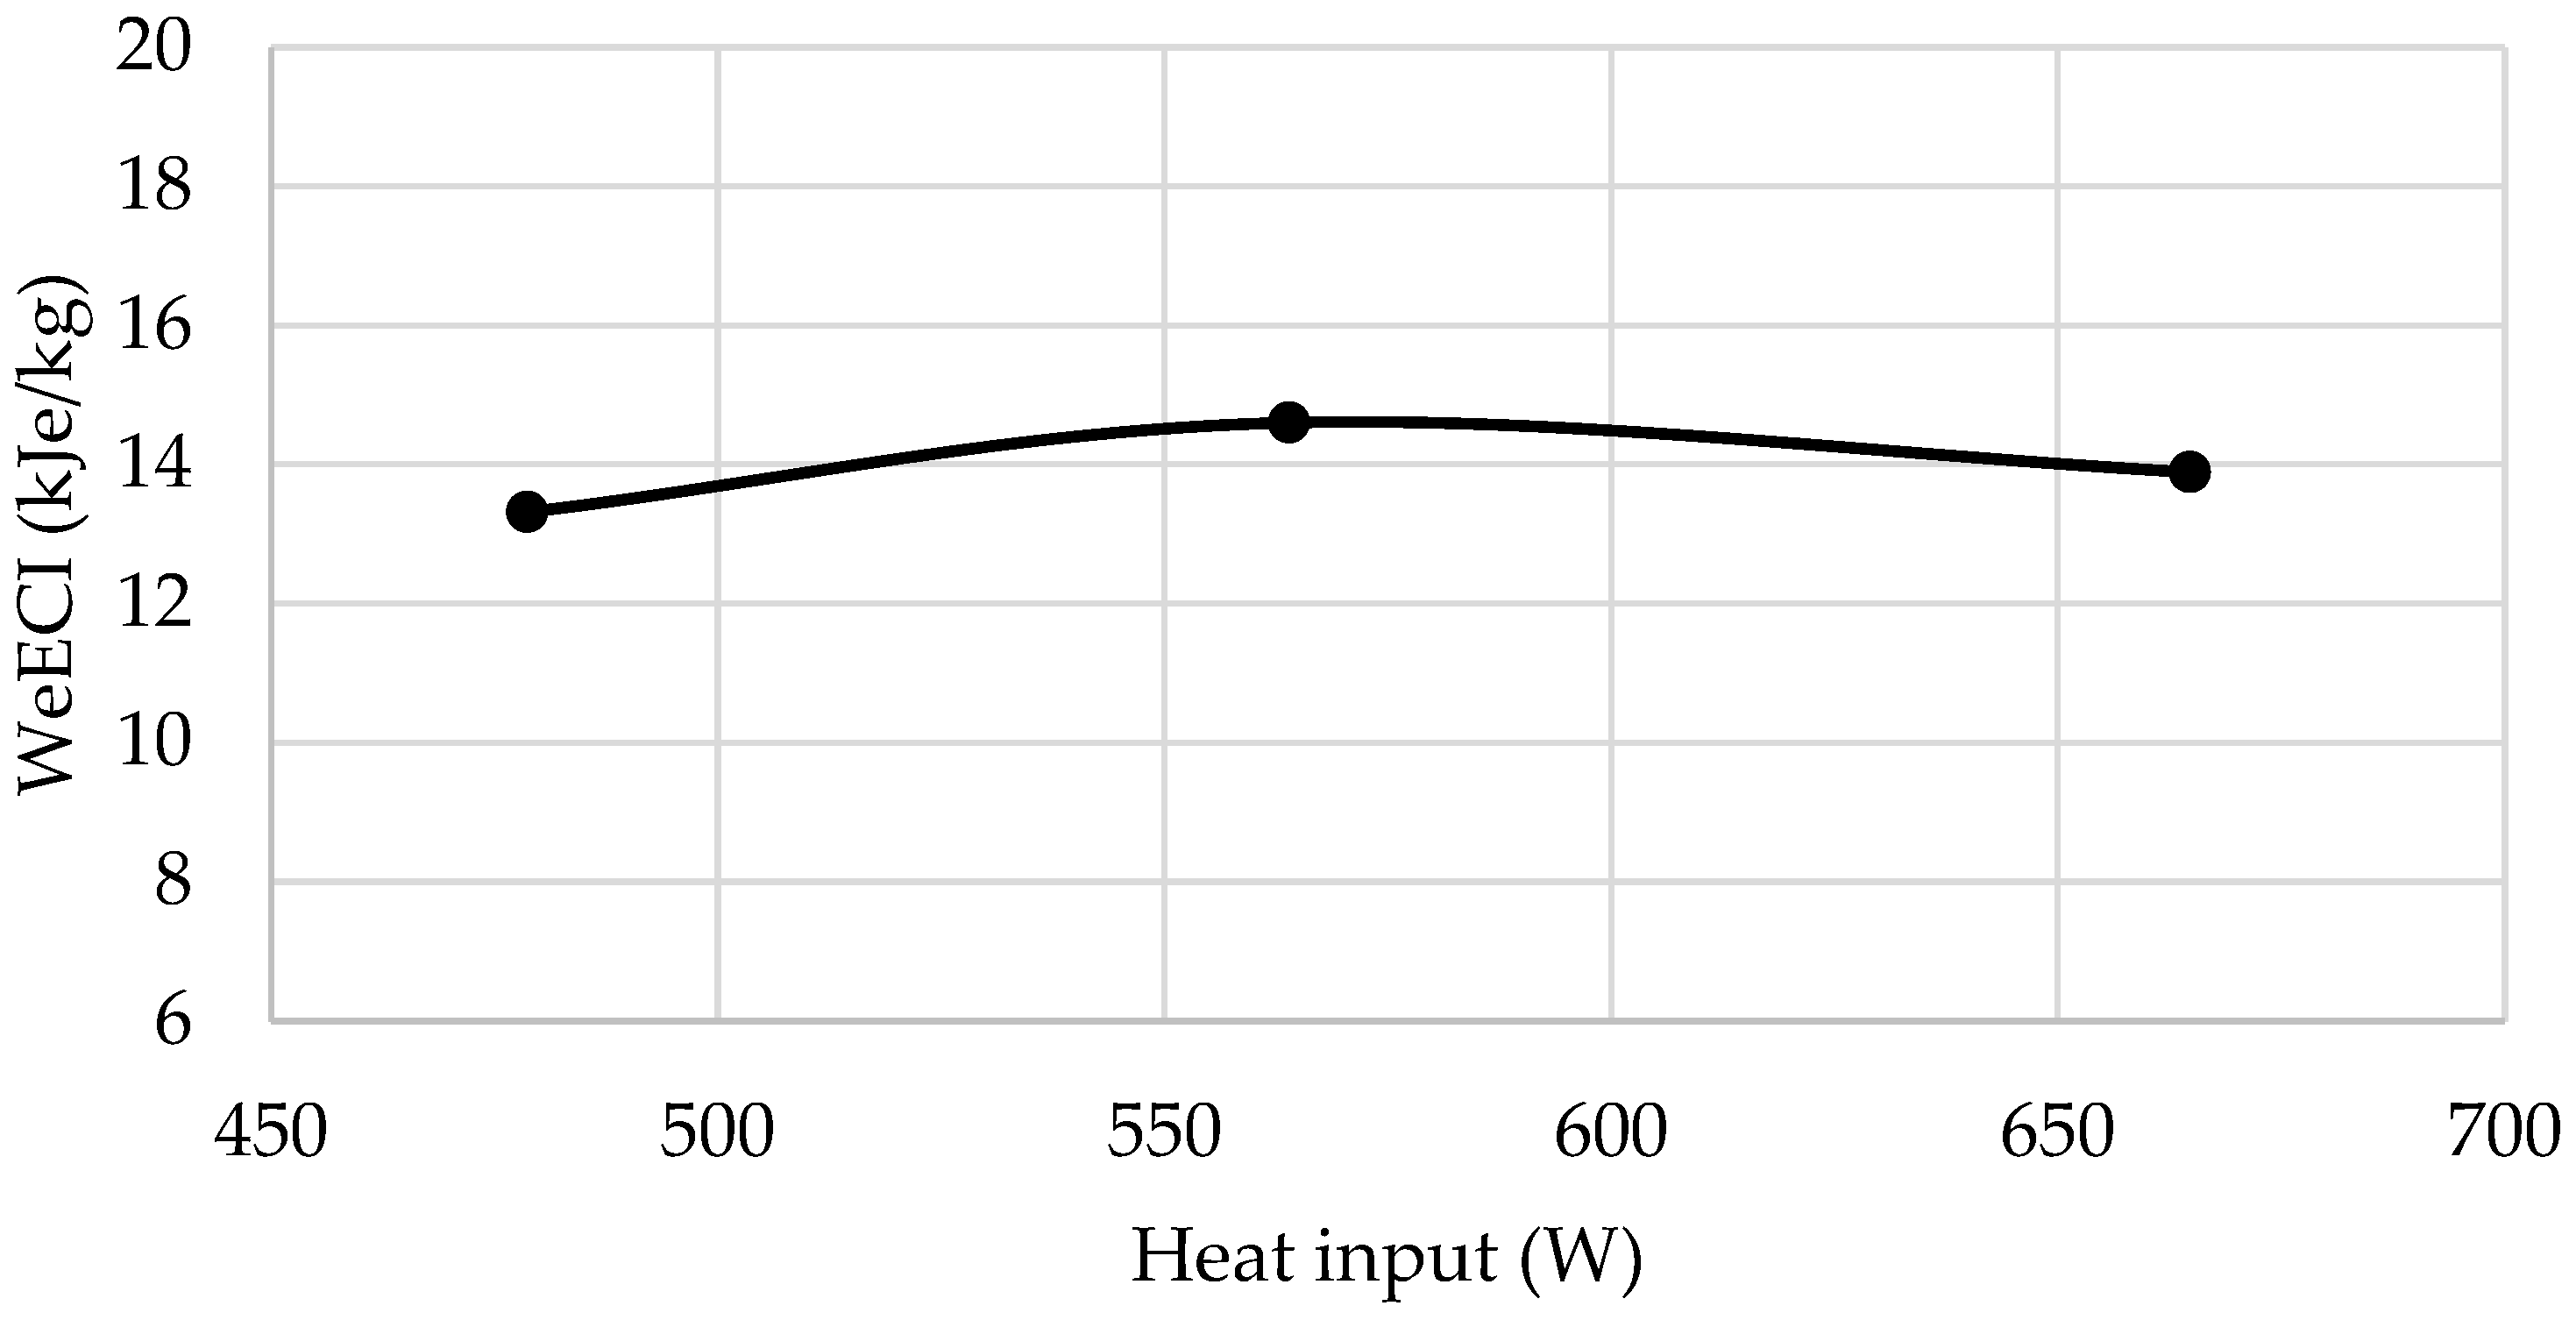
Figure 25 shows that the Water–Electrical Energy Cogeneration Index remains approximately constant with an increasing heat input. This indicates the proportional scaling of freshwater and electricity production as the thermal energy increases. The balanced response demonstrates that the hybrid system maintains a consistent co-generation performance across a wide range of heat inputs, reinforcing its suitability for variable waste heat sources.
Table 2 presents a comparative performance analysis that reveals that the proposed TEG+DCMD system significantly outperforms the existing literature in terms of both freshwater yield and power density. While previous solar driven configurations such as solar stills and hydrophobic membranes report water generation rates between 0.97 and 1.82 kg/m2/h, the current system achieves an exceptional 5–9 kg/m2/h.
By leveraging high-grade waste heat (140–150 °C), the study yields a power density of 30 W/m2, exceeding recent benchmarks (0.47–1.65 W/m2) by over an order of magnitude. Furthermore, the system maintains a stable Gain Output Ratio (GOR) of 0.35–0.47. Despite these promising results, further investigation is needed to evaluate long-term membrane fouling and the economic scalability of TEG + DCMD integration under varying industrial conditions.
Overall, the experimental results demonstrate that the integrated TEG–DCMD system can effectively convert low-grade thermal energy into simultaneous freshwater and electrical power outputs under a wide range of operating conditions. The heat input was identified as the dominant parameter governing both mass flux and power generation, while salinity primarily influenced desalination performance through vapour pressure depression without significantly affecting thermoelectric behaviour. Flow rate adjustments enhanced heat and mass transfer but did not alter the fundamental thermal resistance of the system. Energy and exergy analyses confirmed that system efficiency improves with increasing thermal input and remains relatively stable under elevated salinity. These findings collectively highlight the robustness of the proposed hybrid configuration and provide a comprehensive understanding of the coupled thermal–electrical–membrane interactions, forming a strong basis for system optimization and scale-up, as discussed in the following section.

4. Conclusions

This study experimentally demonstrated the feasibility and performance of a novel hybrid system integrating thermoelectric generators (TEGs) with a direct contact membrane distillation (DCMD) unit for simultaneous low-grade heat recovery, electricity generation, and water desalination. The system successfully utilized thermal energy from a heat source up to approximately 140 °C, producing freshwater and electrical power concurrently while maintaining stable thermal operation.
The experimental results showed that the freshwater mass flux increased significantly with an increasing heat input and feed temperature, confirming that the DCMD performance is strongly governed by the transmembrane temperature gradient. A higher heat input also enhanced the thermoelectric power generation due to the increased temperature difference across the TEG modules. Importantly, the integration of TEGs did not adversely affect the desalination process, indicating effective thermal coupling and minimal additional thermal resistance.
Salinity was found to reduce freshwater flux and thermal efficiency metrics such as the GOR and SEC, primarily due to vapour pressure depression and concentration polarization effects. However, the electrical power output and overall thermal resistance remained largely insensitive to salinity variations, demonstrating the robustness of the TEG subsystem under high-salinity conditions. Energy utilization and exergy efficiencies showed only moderate sensitivity to salinity, highlighting the advantage of co-generation in mitigating performance degradation in membrane desalination.
From a system-level perspective, the Water–Electricity Co-generation Index (WeECI) serves as an optimization and decision-making metric rather than a standalone performance indicator. In practical deployment, WeECI enables the comparison of operating conditions based on the relative effectiveness of converting low-grade thermal energy into combined freshwater and electrical outputs. Higher WeECI values indicate operating regimes where electrical generation contributes more significantly relative to water production, which is advantageous for high-salinity or energy-constrained applications. On the contrary, lower WeECI values correspond to water-dominant operation, appropriate for moderate salinity feeds where freshwater recovery is prioritized. The primary trade-off revealed by WeECI is between maximizing the water flux and maintaining a strong temperature gradient for thermoelectric power generation. By using WeECI as an objective weighting metric, system operation can be tuned toward water-centric or energy-centric goals, improving the flexibility and deployment relevance of hybrid TEG–DCMD systems.
Overall, the integrated TEG–DCMD system presents a promising pathway for the efficient utilization of industrial waste heat and renewable thermal energy sources, offering a compact, scalable solution for combined water and power production. Future work should focus on the long-term operation of the system to analyze the membrane performance, system optimization, influence of the membrane fouling on flux production and techno-economic assessment under real industrial conditions.

Author Contributions

Conceptualization, O.T. and A.D.; methodology, O.T. and A.D.; software, O.T., P.K., R.K.D. and V.V.; validation, O.T., P.K., R.K.D. and V.V.; formal analysis, O.T., P.K., R.K.D. and A.D.; investigation, O.T., P.K., R.K.D. and V.V.; resources, O.T., S.V., Y.Z. and A.D.; data curation, O.T., P.K. and R.K.D.; writing—original draft preparation, O.T. and P.K.; writing—review and editing, P.K., R.K.D., S.V., Y.Z. and A.D.; visualization, O.T.; supervision, A.D., S.V. and Y.Z.; project administration, A.D. All authors have read and agreed to the published version of the manuscript.

Funding

This research received no external funding.

Data Availability Statement

The original contributions presented in this study are included in the article material. Further inquiries can be directed to the corresponding author.

Conflicts of Interest

The authors declare no conflict of interest.

Abbreviations

A Area (m2)
A b Un-finned area (m2)
A c b Area of copper block (m2)
A f Fin area (m2)
A t Total surface area (m2)
C k m Mass transfer coefficient of Knudsen–molecular diffusion (kg/m2·s·Pa)
C p Specific heat capacity at constant pressure (J/kg·K)
DCMDDirect contact membrane distillation (m)
D h , a Hydraulic diameter of fin (m)
D h , c Hydraulic diameter of spacer (m)
d i Inside diameter of heat pipe (m)
d o Outside diameter of heat pipe (m)
d p Pore diameter of membrane (m)
d v Vapour spacing (m)
d w Wire diameter (m)
E ˙ i n The rate of energy transfer in (W)
E ˙ o u t The rate of energy transfer out (W)
E ˙ s t The rate of energy transfer storage (W)
GORGain Output Ratio
H Total convective heat transfer coefficient (W/m2·K)
h a Convective heat transfer coefficient of air (W/m2·K)
h f Convective heat transfer coefficient of feed solution (W/m2·K)
h p Convective heat transfer coefficient of permeate solution (W/m2·K)
h s w Convective heat transfer coefficient of saline water (W/m2·K)
J Mass flux (kg/m2·h)
k Thermal conductivity (W/m·K)
k a Thermal conductivity of air (W/m·K)
k c Thermal conductivity of saline water (W/m·K)
k e f f Effective thermal conductivity (W/m·K)
k f Thermal conductivity of fin (W/m·K)
k h p Thermal conductivity of heat pipe (W/m·K)
k l Water conductivity (W/m·K)
k m t Thermal conductivity of membrane (W/m·K)
k T E G Thermal conductivity of TEG + heat spreader (W/m·K)
k w Wick/spacer thermal conductivity (W/m·K)
L e , c Length of both evaporator and condenser (m)
l f Fin width (m)
M Molecular weight of water (kg/kmol)
N Number of fins or TEGs
N f Number of fins
N h p Number of heat pipes
N u a The Nusselt number of air
N u c The Nusselt number of saline water
N w Number of mesh
P a Entrapped air pressure (Pa)
P r a The Prandtl number of air (m2/s)
P r c The Prandtl number of saline water (m2/s)
P v , s w Vapour pressure of seawater (Pa)
P v , w Vapour pressure of water (Pa)
Q ˙ Heat transfer rate (W)
Q ˙ c m Conduction heat loss (W)
Q ˙ f Heat transfer rate at feed side of DCMD (W)
Q ˙ m The rate of heat transfer of membrane (W)
Q ˙ p Heat transfer rate at permeate side of DCMD (W)
Q ˙ v Heat transfer of vapour through membrane (W)
r Mean pore size radius (m)
R Thermal resistance (°C/W)
R A 1 Thermal resistance of material A1 (°C/W)
R a i r Thermal resistance of ambient (°C/W)
R B 1 Thermal resistance of material B1 (°C/W)
R c Convective resistance of saline water (°C/W)
R e a The Reynolds number of air
R e c The Reynolds number of saline water
R g Gas constant (J/kg·K)
R h Convective resistance of hot air (°C/W)
R h p Thermal resistance of heat pipe (°C/W)
R p , c Radial resistances of heat pipe wall at condenser (°C/W)
R p , e Radial resistances of the heat pipe wall at evaporator (°C/W)
R T E G Thermal resistance of TEG, contact and spreader plates (°C/W)
R w , c Thermal resistance of liquid wick combination at condenser (°C/W)
R w , e Thermal resistance of liquid wick combination at evaporator (°C/W)
S Salinity (g/kg)
SECSpecific Energy Consumption (thermal) (kWh/kg)
T 0 Dead state temperature of system (°C)
t Thickness of material (m)
t f Fin thickness (m)
TEGThermoelectric generator
T f Average temperature of feed inlet and feed outlet (°C)
T h Temperature of hot side of TEG (°C)
T m Mean membrane surface temperature (°C)
T m p Temperature at current node from current calculation step (°C)
T m p + 1 Temperature at current node from next calculation step (°C)
T m 1 p + 1 Temperature at the previous node from next calculation step (°C)
T m + 1 p + 1 Temperature at the next node from next calculation step (°C)
T m f Surface temperature of membrane at feed side of DCMD (°C)
T m p Surface temperature of membrane at permeate side of DCMD (°C)
T p Average temperature of permeate inlet and permeate outlet (°C)
T Temperature of the fluid moving at free-stream velocity (°C)
u 0 Overall surface efficiency
u f Fin efficiency
WeECIWater–Electrical Energy Cogeneration Index (kJe/kg)
δ m Thickness of membrane (m)
H v , w Vapour enthalpy of water (kJ/kg)
t Time difference (s)
T Temperature difference (°C)
x Distance (m)
ε Wick/spacer porosity
ε m Porosity of membrane
λ Mean free path (m)
ρ Density (kg/m3)
τ Membrane tortuosity

References

  1. Traisak, O.; Kumar, P.; Vahaji, S.; Zhang, Y.; Date, A. Advancements in Integrated Thermoelectric Power Generation and Water Desalination Technologies: A Comprehensive Review. Energies 2025, 18, 1454. [Google Scholar] [CrossRef]
  2. Gu, D.; Andreev, K.; Dupre, M.E. Major trends in population growth around the world. China CDC Wkly. 2021, 3, 604. [Google Scholar] [CrossRef] [PubMed]
  3. Dorling, D. World population prospects at the UN: Our numbers are not our problem? In The Struggle for Social Sustainability; Policy Press: Bristol, UK, 2021; pp. 129–154. [Google Scholar]
  4. Das, R.K.; Date, A. Sustainable water desalination using eductor and waste heat: A review and suggestion for future research. Desalination 2025, 603, 118687. [Google Scholar] [CrossRef]
  5. Hoffman, A.R. Water security: A growing crisis and the link to energy. AIP Conf. Proc. 2008, 1044, 55–63. [Google Scholar] [CrossRef]
  6. Maroo, S.C.; Goswami, D.Y. Theoretical analysis of a single-stage and two-stage solar driven flash desalination system based on passive vacuum generation. Desalination 2009, 249, 635–646. [Google Scholar] [CrossRef]
  7. Kalogirou, S.A. Seawater desalination using renewable energy sources. Prog. Energy Combust. Sci. 2005, 31, 242–281. [Google Scholar] [CrossRef]
  8. Date, A.; Gauci, L.; Chan, R.; Date, A. Performance review of a novel combined thermoelectric power generation and water desalination system. Renew. Energy 2015, 83, 256–269. [Google Scholar] [CrossRef]
  9. Aberuee, M.J.; Baniasadi, E.; Ziaei-Rad, M. Performance analysis of an integrated solar based thermo-electric and desalination system. Appl. Therm. Eng. 2017, 110, 399–411. [Google Scholar] [CrossRef]
  10. Luberti, M.; Gowans, R.; Finn, P.; Santori, G. An estimate of the ultralow waste heat available in the European Union. Energy 2022, 238, 121967. [Google Scholar] [CrossRef]
  11. Kumar, P.; Date, A.; Shabani, B. Towards self-water-sufficient renewable hydrogen power supply systems by utilising electrolyser and fuel cell waste heat. Int. J. Hydrog. Energy 2025, 137, 380–396. [Google Scholar] [CrossRef]
  12. Newell, R.; Raimi, D.; Villanueva, S.; Prest, B. Global energy outlook 2021: Pathways from Paris. Resour. Future 2021, 8, 39. [Google Scholar]
  13. Kumar, P.; Singh, O. Thermodynamic analysis of solid oxide fuel cell-gas turbine-organic Rankine cycle combined system. Int. J. Mater. Sci. Mech. Eng. (JMSME) 2019, 6, 98–102. [Google Scholar]
  14. Ononogbo, C.; Nwosu, E.; Nwakuba, N.; Nwaji, G.; Nwufo, O.; Chukwuezie, O.; Chukwu, M.; Anyanwu, E. Opportunities of waste heat recovery from various sources: Review of technologies and implementation. Heliyon 2023, 9, e13590. [Google Scholar] [CrossRef] [PubMed]
  15. Kumar, P.; Singh, O. Investigations on Integrating SOFC with Gas Turbine for Performance Enhancement and Sustainable Energy. J. Energy Environ. Sustain. 2019, 7, 42–46. [Google Scholar] [CrossRef]
  16. Ghazi, Z.M.; Rizvi, S.W.F.; Shahid, W.M.; Abdulhameed, A.M.; Saleem, H.; Zaidi, S.J. An overview of water desalination systems integrated with renewable energy sources. Desalination 2022, 542, 116063. [Google Scholar] [CrossRef]
  17. Elewa, M.M. Emerging and conventional water desalination technologies powered by renewable energy and energy storage systems toward zero liquid discharge. Separations 2024, 11, 291. [Google Scholar] [CrossRef]
  18. Ahmad, Z.; Shukla, A.K.; Singh, V.; Sharma, M.; Kumar, P. Thermodynamic analysis of solar powered trigeneration arrangement for cooling, power and drinking water generation. Songklanakarin J. Sci. Technol. 2022, 44, 1419–1426. [Google Scholar] [CrossRef]
  19. Karaca, A.E.; Dincer, I.; Nitefor, M. Development of an integrated solar and wind driven energy system for desalination and power generation. Sustain. Energy Technol. Assess. 2022, 52, 102249. [Google Scholar] [CrossRef]
  20. Greco, F.; Heijman, S.G.; Jarquin-Laguna, A. Integration of wind energy and desalination systems: A review study. Processes 2021, 9, 2181. [Google Scholar] [CrossRef]
  21. Chen, W.-H.; Chiou, Y.-B.; Chein, R.-Y.; Uan, J.-Y.; Wang, X.-D. Power generation of thermoelectric generator with plate fins for recovering low-temperature waste heat. Appl. Energy 2022, 306, 118012. [Google Scholar] [CrossRef]
  22. Babu, C.; Ponnambalam, P. The theoretical performance evaluation of hybrid PV-TEG system. Energy Convers. Manag. 2018, 173, 450–460. [Google Scholar] [CrossRef]
  23. Babu, C.; Ponnambalam, P. The role of thermoelectric generators in the hybrid PV/T systems: A review. Energy Convers. Manag. 2017, 151, 368–385. [Google Scholar] [CrossRef]
  24. Nagasri, D.L.S.; Alajingi, R.K.; Pathipooranam, P.; Raja, S.S.; Salleh, M.F.B.; Marimuthu, R. Evaluating the performance and feasibility of integrating thermoelectric generators with solar photovoltaic panels: A case study. Case Stud. Therm. Eng. 2024, 64, 105572. [Google Scholar] [CrossRef]
  25. Ge, M.; Li, Z.; Zhao, Y.; Xuan, Z.; Li, Y.; Zhao, Y. Experimental study of thermoelectric generator with different numbers of modules for waste heat recovery. Appl. Energy 2022, 322, 119523. [Google Scholar] [CrossRef]
  26. Goswami, R.; Das, R.; Ganguly, S.; Markides, C.N.; Luo, K.; Aflatounian, S.; Chettiar, K.; Miljkovic, N. Progress in the design and development of thermoelectric generator heat recovery systems: A comprehensive review. Renew. Sustain. Energy Rev. 2026, 229, 116631. [Google Scholar] [CrossRef]
  27. Shoeibi, S.; Saemian, M.; Parsa, S.M.; Khiadani, M.; Mirjalily, S.A.A.; Kargarsharifabad, H. A novel solar desalination system equipped with thermoelectric generator, reflectors and low-cost sensible energy-storage for co-production of power and drinking water. Desalination 2023, 567, 116955. [Google Scholar] [CrossRef]
  28. Özcan, Y.; Deniz, E. Solar thermal waste heat energy recovery in solar distillation systems by using thermoelectric generators. Eng. Sci. Technol. Int. J. 2023, 40, 101362. [Google Scholar] [CrossRef]
  29. Lawal, D.U.; Alawad, S.M.; Jagaba, A.H.; Abba, S.I.; Usman, J.; Alsalhy, Q.F.; Shah, S.M.H.; Aljundi, I.H. Air gap membrane distillation unit operated by thermoelectric module. Desalination 2025, 593, 118133. [Google Scholar] [CrossRef]
  30. Afaneh, D.; Bahaidarah, H.; Lawal, D.U.; Antar, M.A. Novel integration of thermoelectric distiller with direct contact membrane distillation. Energy Convers. Manag. X 2024, 22, 100575. [Google Scholar] [CrossRef]
  31. Remeli, M.F.B. Simultaneous Industrial Waste Heat Recovery and Power Generation Using Heat Pipe Assisted Thermoelectric Generator. Ph.D. Thesis, RMIT University, Melbourne, Australia, 2015. [Google Scholar]
  32. Incropera, F.P.; Dewitt, D.B. Introduction to Heat Transfer, 5th ed.; Wiley: Hoboken, NJ, USA, 2007. [Google Scholar]
  33. Li, Y.; Shi, Y.; Wang, X.; Luo, D.; Yan, Y. Thermal and electrical contact resistances of thermoelectric generator: Experimental study and artificial neural network modelling. Appl. Therm. Eng. 2023, 225, 120154. [Google Scholar] [CrossRef]
  34. Nayar, K.G.; Sharqawy, M.H.; Banchik, L.D.; Lienhard V, J.H. Thermophysical properties of seawater: A review and new correlations that include pressure dependence. Desalination 2016, 390, 1–24. [Google Scholar] [CrossRef]
  35. Ve, Q.L. Effect of Configuration and Spacer Materials on Yield of Direct Contact Membrane Distillation. Ph.D. Thesis, RMIT University, Melbourne, Australia, 2021. [Google Scholar]
  36. Shafii, M.B.; Shahmohamadi, M.; Faegh, M.; Sadrhosseini, H. Examination of a novel solar still equipped with evacuated tube collectors and thermoelectric modules. Desalination 2016, 382, 21–27. [Google Scholar] [CrossRef]
  37. Bian, T.; Li, C.; Cheng, L.; Chen, Y.; Yan, S.; Dukashin, D.; Wang, L.; Shen, J.; Senin, P. Gradient hydrophobic evaporator based on ODT modified Co3O4/NF enables efficient desalination and thermoelectric power generation. Sep. Purif. Technol. 2025, 358, 130344. [Google Scholar] [CrossRef]
  38. Hu, J.; Huang, J.; Chen, Y.; Xu, L.; Wu, B.; Yue, H.; Ji, H.; Li, H.; Jin, J. Achieving efficient water-electricity ensemble via using easily obtainable hydrovoltaic-thermoelectric hybrid generators. Desalination 2025, 596, 118330. [Google Scholar] [CrossRef]
  39. Jin, B.; Lu, Y.; Zhang, X.; Zhang, X.; Li, D.; Liu, Q.; Deng, B.; Li, H. Iceberg-inspired solar water generator for enhanced thermoelectricity–freshwater synergistic production. Chem. Eng. J. 2023, 469, 143906. [Google Scholar] [CrossRef]
  40. Sun, J.; Xin, Y.; Sun, B.; Yang, Q.; Fan, X. Plasma-assisted synthesis of Janus multifunctional solar evaporator for ultra-long-duration freshwater and thermoelectric co-generation. Chem. Eng. J. 2024, 497, 154621. [Google Scholar] [CrossRef]
Figure 1. Schematic of integrated system.
Energies 19 01054 g001
Figure 2. Experimental setup.
Energies 19 01054 g002
Figure 3. Components of TEG-MD rig.
Energies 19 01054 g003
Figure 4. (a) Cartridge heaters are placed into holes of Plate No.1; (b) Six TEGs are placed in aluminum Plate No.2.
Energies 19 01054 g004
Figure 5. The sequence of components assembly between Plate No.2 and Plate No. 3.
Energies 19 01054 g005
Figure 6. Schematic of fin-TEG-MD system.
Energies 19 01054 g006
Figure 7. Thermal resistance network of the combined system.
Energies 19 01054 g007
Figure 8. Surface node and interior node.
Energies 19 01054 g008
Figure 9. Temperature gradient, and heat and mass transfer.
Energies 19 01054 g009
Figure 10. Calculation steps of integrated system.
Energies 19 01054 g010
Figure 11. Influence of salinity on mass flux and max power.
Energies 19 01054 g011
Figure 12. Influence of salinity on maximum power output density.
Energies 19 01054 g012
Figure 13. Influence of salinity on GOR and SEC.
Energies 19 01054 g013
Figure 14. Influence of salinity on thermal resistance.
Energies 19 01054 g014
Figure 15. Energy utilization efficiency versus salinity.
Energies 19 01054 g015
Figure 16. Exergy efficiency versus salinity.
Energies 19 01054 g016
Figure 17. Water–Electrical Energy Cogeneration Index.
Energies 19 01054 g017
Figure 18. Influence of heat input on mass flux.
Energies 19 01054 g018
Figure 19. Influence of heat input on power generation.
Energies 19 01054 g019
Figure 20. Influence of heat input on specific thermal energy consumption.
Energies 19 01054 g020
Figure 21. Influence of heat input on Gain Output Ratio (GOR).
Energies 19 01054 g021
Figure 22. Influence of heat input on thermal resistance of the system.
Energies 19 01054 g022
Figure 23. Influence of heat input on energy utilization efficiency.
Energies 19 01054 g023
Figure 24. Influence of heat input on exergy efficiency.
Energies 19 01054 g024
Figure 25. Influence of heat input on Water–Electrical Energy Cogeneration Index.
Energies 19 01054 g025
Table 1. TEG and membrane properties used in experimental setup.
TEGNumber of thermoelectric generators6
Length × width × height62 × 62 × 4 mm
Open circuit voltage6.9 V
Matched load output voltage3.45 V
Matched load output current8.2 A
Matched load output power23 W
Matched load output resistance0.42 Ω ± 15%
Maximum operation temperature (Th)250 °C
MembraneMembrane materialPolytetrafluoroethylene (PTFE)
Membrane thickness0.20+/−0.10 mm
Membrane pore size0.22 µm
Maximum Temperature123 °C
Table 2. Performance comparison with previous research from the literature.
Technology (Study Type)Source/
Temperature
Power
Generation
Feed
Salinity
GORFreshwater
Generation
Reference
Solar still
+ TEG
Evacuated tube
solar collectors 80–120 °C
1.4 W per TEG cellN/AN/A0.97 kg/m2/h[36]
Co3O4/NF Hydrophobic membrane + TEGDirect
sun light
0.74 W/m−23.5 wt%
NaCl
N/A1.76 kg/m2/h[37]
CB/PVDF@BFP + TEGDirect
sun light
~1.6 W/m2 under 1 sun0.8–20 wt%N/A~1.41 kg/m2/h[38]
TEG coated by photothermal + Bilayer nonwoven fabric + passive cooling vapour condenserDirect
sun light
0.47 W~102 to 104 mg/LN/A1.02 kg/m2/h[39]
DBD plasma treatment
+ TEG
Direct
sun light
1.65 W/m23.5 wt%
NaCl
N/AUp to 1.82 kg/m2/h[40]
Current system TEG+DCMDWaste heat at
140–150 °C
30 W/m20 to 35,000 ppm NaCl0.35 to 0.475–9 kg/m2/hCurrent study
Disclaimer/Publisher’s Note: The statements, opinions and data contained in all publications are solely those of the individual author(s) and contributor(s) and not of MDPI and/or the editor(s). MDPI and/or the editor(s) disclaim responsibility for any injury to people or property resulting from any ideas, methods, instructions or products referred to in the content.