Abstract
Transportation hubs serve as critical convergence points for traffic, information, and energy flows. However, their energy systems are characterized by high consumption randomness, significant power flow fluctuations, and geographically dispersed source and load nodes. These features pose challenges for integrating distributed renewable energy and often lead to high energy cost issues. Additionally, accommodating distributed photovoltaic (PV) is further complicated by grid corridors and high investment expenditure. To address these issues, this paper proposes a two-stage optimization model for a multi-node interconnected architecture for transportation hubs. In the first stage, a greedy algorithm determines a fixed connection topology, considering distance constraints and connection port limits to ensure engineering feasibility. The second employs linear programming to optimize real-time power allocation. This approach precomputes connection relationships, significantly reducing evaluation time and enabling efficient processing of operational data from multiple nodes. A case study confirms that the proposed method can increase PV consumption by 38.71%, with optimization evaluated on a millisecond scale. By inputting node generation, load, and distance data in prescribed format, the model outputs actionable planning results for flexible interconnection projects.
1. Introduction
The electrification of transport is a promising pathway toward a low-carbon-energy transport system [1]. This trend has spurred the rapid deployment of distributed solar PV at transportation hubs. However, the implementation and effectiveness of conventional distribution network expansion are often constrained by limited power supply corridors and high investment costs [2]. In this context, flexible interconnection technology emerges as a potential solution due to its flexible regulation capabilities [3]. Micro-grids within transportation hubs face problems such as dispersed power nodes and spatiotemporal imbalances between energy generation and load demand. These issues hinder the local consumption of distributed solar PV.
To address the accommodation issue, this paper proposes a two-stage optimization model that jointly optimizes fixed connection topology and real-time power allocation. The first stage utilizes a greedy algorithm to determine connection relationships, while the second stage employs linear programming to optimize real-time power distribution. Key innovations of the model include the incorporation of practical distance constraints and connection port limits, ensuring its engineering feasibility. A case study based on a transportation hub PV project in Shanxi Province proceeds and achieves an average PV consumption rate of 39.15%, representing a 37.80% increase compared to the original system.
2. Literature Review
2.1. Green Energy Supply for Transportation Hubs
Transportation hubs, such as airports, passenger terminals, ports, expressway service areas, etc., are characterized by high energy consumption and carbon emissions, making them key targets for emission reduction efforts [4]. These hubs also possess substantial spatial resources such as rooftops and used land, offering significant potential for renewable energy installations. However, energy demand is typically concentrated in terminal buildings [5], while transportation hubs feature large-scale buildings and diverse functional zones. This diversity results in varied load characteristics and energy demand patterns, complicating energy supply management [6]. Several studies have explored energy supply and management strategies for transportation hubs. Wan analyzed implementation paths combining PV generation and energy storage systems, green electricity trading mechanisms, and grid–PV interactions [7]. Jin & Tian proposed a three-stage carbon emission framework for urban passenger transport and developed a corresponding calculation model [8]. Considering the complex spatial structure, collaborative operation of multiple entities, and multifunctional integrated design of transportation hub buildings, Huang proposed a power supply and distribution system design scheme for transportation hubs [9].
2.2. Integration of Renewable Energy and Micro-Grids
Integrating distributed PV systems into micro-grids intensifies the challenge of balancing supply–demand dynamics while maintaining grid stability [10]. Micro-grids, as localized energy networks, offer a solution by enhancing grid resilience, reducing reliance on fossil fuels, and improving electricity access in remote areas [11]. Abantao et al. presented a utility-scale grid-connected micro-grid planning framework for sustainable renewable energy integration, addressing both operational modes of grid-connected and isolated micro-grids [12]. Li & Han addressed the strong uncertainty of renewable energy for multi-microgrid systems by proposing a distributed robust collaborative scheduling model on an improved conditional generative adversarial network [13].
2.3. Micro-Grid Interconnection
The large-scale integration of distributed renewable energy into grid clusters has become an inevitable trend in the development of new power systems. Micro-grid clusters can significantly mitigate issues such as insufficient energy utilization, high energy storage costs, and inadequate anti-interference capabilities caused by the intermittent feature of renewable energy [14]. Existing studies on micro-grid interconnection primarily focus on either topology design or real-time dispatch in isolation. Lou et al. provided an overview of key technologies for multi-micro-grid systems, including networking methods and collaborative control strategies [15]. Federico et al. evaluated flexible connection agreements and curtailment rules to manage connection queues in distribution networks [16]. Xu et al. proposed a cooperative operation optimization model for multi-micro-grids based on the green certificate and carbon trading mechanisms [17]. Ge et al. introduced the concept of robust hosting capacity and constructed an assessment model for distributed generators in flexibly interconnected distribution networks [18].
2.4. Limitations on Current Studies
Despite these advancements, existing research has not fully addressed the need for autonomous source–load balancing in micro-grids with multiple distributed generation access points. There is a lack of integrated optimization approaches that simultaneously consider the dual constraints of PV accommodation and transmission distance while being suitable for engineering practice and offering fast-solving capabilities. To bridge this gap, this paper establishes, discusses, and analyzes a two-stage optimization model designed to address the accommodation issue and achieve source–load equilibrium in multi-node systems, thereby supplementing prior research.
3. Methodology
3.1. Analysis on Different Types of Nodes
It is considered that every node in each time zone t∈T has PV power output PPV,t (in kW) and load power Pload,t (in kW). The load power of each node is satisfied by the PV generated in this node with priority in order to achieve maximum PV consumption and minimum power transmission. Therefore, for a node i, if PPV,t ≥ Pload,t, load can be fully satisfied by PV power output at this node in time zone t, and net PV power output can be calculated as:
If PPV,t < Pload,t, load cannot be fully satisfied by PV power output at this node in time zone t, and net load power can be calculated as:
Nodes in the source–PV interconnected system are classified into the following three types: load nodes, PV nodes, and neutral nodes. There will be power output considered only for a source node and power input only for a load node, while there will be both power output and input for a neutral node. A neutral node is considered as both a PV node and a load node in the computation. The node type is identified according to the PV output coefficient at node i, ci, and can be calculated by:
ci describes the proportion of net PV power output over overall power transmission at node i. The larger the value of ci is, the more PV output power the node provides relative to its load power consumption. Therefore, node i is classified as a PV node if ci ≥ cPV, a load node if ci ≤ cload, and a neutral node if cload < ci < cPV, where cPV and cload are node classification thresholds.
3.2. Stage 1—Topological Interconnection Optimization
3.2.1. Stage 1 Objective Function
The aim of the project is to maximize local PV consumption while minimizing transmission distance and construction expenditure. Therefore, the objective function can be illustrated as:
where xi,j is the amount of transmitted electric energy from PV node i to load node j; di,j is the distance penalty; qi,j is the interconnection construction expenditure penalty; α and β are the distance and expenditure penalty weight coefficients, respectively; P is the set of PV nodes; and L is the set of load nodes.
Interconnection costs are related to interconnection lines and equipment, including materials, installation, and construction. These costs are generally proportional to the line capacity. To simplify the analysis, this paper approximates the total construction cost as being proportional to the line capacity. Therefore, the cost penalty qi,j is formulated as:
3.2.2. Stage 1 Constraints and Boundary Conditions
The limitation of the number of ports of the interconnection devices is considered. Therefore, the constraints for connection port numbers for PV and load nodes are formulated as:
where KPV and KLoad are the maximum node ports for PV nodes and load nodes, respectively. Moreover, the transmission distance between two nodes is constructed as:
where Dmax is the maximum transmission distance available.
3.2.3. Score Function for Nodes Connection
Based on the objective function introduced in Section 3.2.2, a score function scorei,j is established for each connectioni,j. This formula is used to evaluate the “benefit score” of establishing a connection between PV node i and load node j. A higher score indicates that the connection is more favorable. The objective function incorporates the following three distinct targets: consumption capacity, transmission distance, and construction cost.
To enable fair weighting and comparison among these multi-objective components, a normalization procedure is applied to scale each indicator—originally with different dimensions—into a unified range of [0, 1], thereby eliminating discrepancies in magnitude. The specific definitions are as follows:
where ΣPPV is the total power generation at PV node i and ΣPLoad is the total power consumption at load node j. The minimum value is taken because the maximum transmission capacity of a connection line is limited by the transmitted power of the smaller side. maxFlowi,j is the potential maximum power transmission within the system.
3.2.4. Greedy Algorithm and Optimal Solutions
Feasible connection topology solutions will be determined in the required first-stage optimization, where computational precision requirements are modest but data volume is substantial. Therefore, a greedy algorithm is applied as a simple and efficient approach for solving the optimization problem [19]. By making locally optimal choices at each stage based on a given optimization criterion, without considering the global picture, the greedy algorithm significantly reduces computational time by avoiding the need to exhaustively explore all possible solutions. Figure 1 illustrates the general process of the algorithm for the topological interconnection optimization problem. A combined strategy of distance screening, score sorting, and greedy selection is generated to establish the prioritization of high-potential short-distance connections while satisfying connectivity constraints. It represents an efficient heuristic method for the optimization.
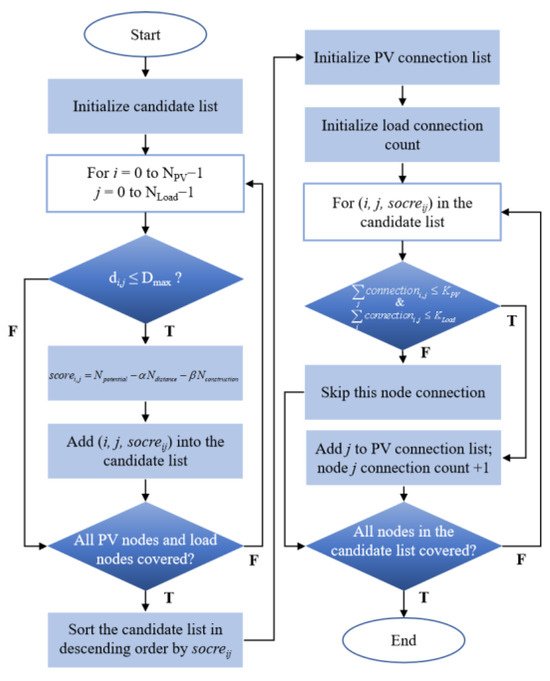
Figure 1.
Greedy algorithm for topological interconnection optimization.
According to the algorithm above, a set of available connection nodes, E, can be generated in stage 1.
3.3. Stage 2—Power Distribution Optimization
3.3.1. Decision Variables
Define xi,j,t as distributed power transit from PV node i to load node j in time zone t. The connected nodes group (i, j) should be within set E generated in stage 1. Hence,
3.3.2. Stage 2 Objective Function
The overall aim of the project is to maximize local PV consumption while minimizing the transmission distance and construction cost. Therefore, the objective function is illustrated as:
3.3.3. Stage 2 Constraints and Boundary Conditions
For a PV node i, the power output should be no larger than the net PV power available at this node. Similarly, for a load node j, the load power consumed should be no larger than the net load power available at this node. Therefore, constraints are formulated as:
3.3.4. Hybrid Optimization Strategy and Optimal Solutions
Building on the fixed connection topology established in the first stage, a hybrid optimization strategy is applied in stage 2—a power distribution optimization algorithm—which combines linear programming with heuristic algorithms that perform real-time power distribution optimization in each time zone. Figure 2 illustrates a general overview of the hybrid algorithm. The algorithm is designed to establish a linear programming problem and is solved by the linprog solver in MATLAB (version: 9.4.0.813654, R2018a) with priority. On the other hand, the heuristic algorithm is established as a redundant strategy and generated when the linear programming solver fails to achieve the result.
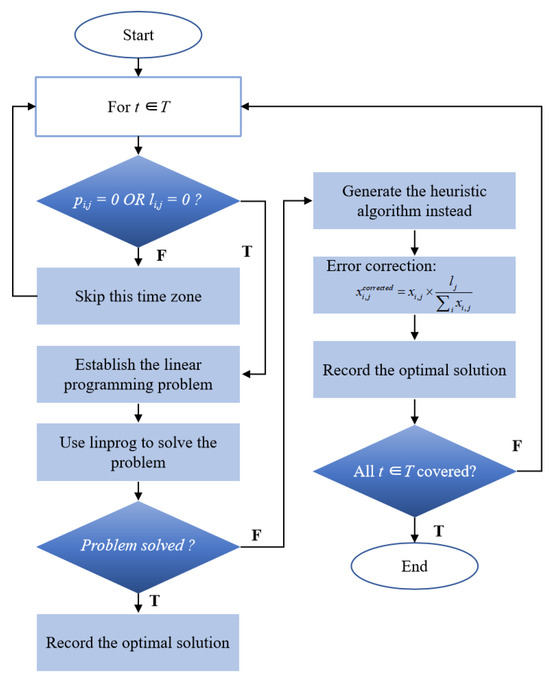
Figure 2.
Power distribution optimization hybrid algorithm.
A heuristic algorithm is established as a redundant strategy, which will be generated when linear programming fails. Figure 3 shows the flow chart of the heuristic algorithm in the hybrid algorithm. The heuristic algorithm adheres to the following principles.
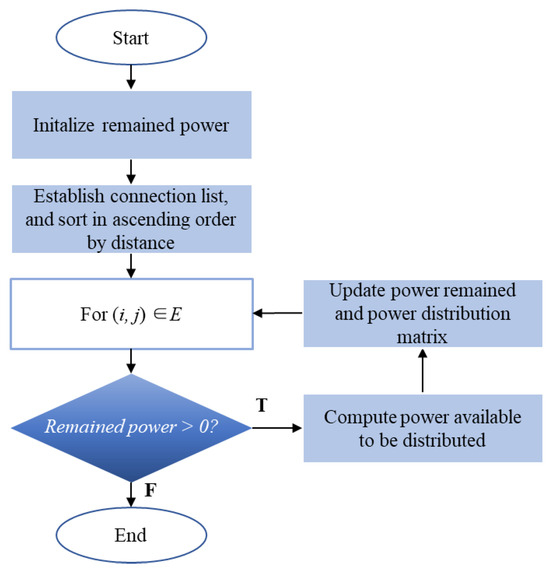
Figure 3.
Redundant strategy of heuristic algorithm.
Firstly, the distance principle is implemented by prioritizing short-distance connections for power transmission to effectively reduce transmission line losses. Secondly, the instantaneous balance principle is enforced through dynamically updating surplus PV generation and load demand, ensuring real-time supply–demand equilibrium. Finally, a feasible solution guarantee is achieved by providing allocation schemes that satisfy both PV generation capacity constraints and load demand requirements under all operating conditions. The designed process not only aligns with the economic operation requirements of power systems, but also ensures maximum PV accommodation while satisfying all constraints.
Moreover, minor constraint violations may occur due to floating-point computations and strategy defects of the heuristic algorithm. In order to eliminate results conflicting with the constraints, error correction is performed, which should be able to maintain the allocation proportion of each generation source unchanged while ensuring total power supply exactly equals demand, as shown below.
where is the original result and is the corrected result.
4. A Case Study on the Intelligent Zero-Carbon Transportation Hub in Shanxi
4.1. Case Overview
The feasibility of the two-stage model and algorithm established above is verified via a case on the Intelligent Zero-carbon Transportation Hub (IZT) project in Shanxi, China. The IZT expansion project currently under construction covers approximately 589 hectares and is expected to handle an annual passenger throughput of 40 million passengers and an annual cargo throughput of 300,000 tons upon completion.
The area enjoys abundant sunlight, with sunshine duration of 2407 h and global horizontal irradiation of approximately 1200 kW/m2 on average annually. It is planned to build a 109 MW distributed solar PV generation system, with an estimated annual renewable energy generation of approximately 100 million kWh.
However, challenges occur due to the power nodes, including their large quantity, geographically dispersed locations, and source–load imbalance issues, resulting in inadequate local consumption of PV power. Based on local solar radiation resources and the load characteristics of each node, annual PV output and load forecasts are assessed for all nodes, showing a PV consumption rate of about 24.35%. Therefore, feasible interconnection technology is applied, and the node source–load balance methodology proposed in this paper is applied for optimization, thereby improving local PV consumption, ensuring stable grid operation, and reducing user electricity costs.
Figure 4 shows the node distribution of the IZT, where green spots represent PV nodes, blue spots represent load nodes, and yellow spots represent neutral nodes. The code names of each node are labeled in the corresponding spots. There are eight PV nodes, seven load nodes, and two neutral nodes in total. The larger the spot shown in the figure, the more net PV power remaining for PV nodes or net load power required for load nodes. As shown in Figure 4, load nodes and neutral nodes are gathered to the north of the IZT, where the terminals, parking lots, and offices are located, while PV nodes are scattered both north and south of the IZT.
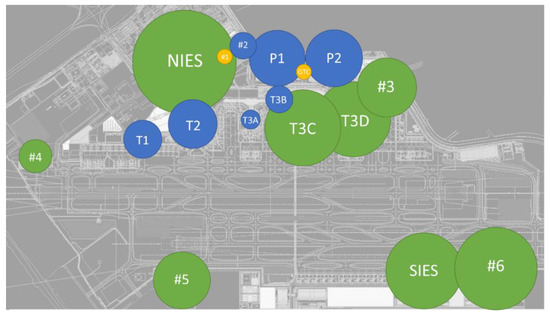
Figure 4.
Node distribution in IZT.
4.2. Optimization Results
Considering the construction feasibility and user requirements, the following parameters listed in Table 1 are applied for the evaluation.

Table 1.
Parameters list.
In the case study, the distance and cost factors were assigned small values to prioritize the maximization of PV consumption over transmission expenses. Furthermore, the maximum number of connections per node and the maximum allowable transmission distance were constrained based on the typical physical and engineering limitations of existing interconnection devices and site layout. Moreover, the PV output coefficients for each node are listed in Table 2. In this case, PV nodes and load nodes are generally clearly distinguishable. Therefore, classification thresholds of cPV = 0.6 and cLoad = 0.4 were adopted.
Table 2.
Node PV output coefficient.
Predicted annual PV power generation and load data is applied to imitate general operation circumstance, and the use of MATLAB to generate the algorithm and results for the power transmission scheme for each node per hour, including target transmission nodes and power, can be evaluated.
Figure 5 illustrates the evaluated connection strategy. The thicker lines indicate the greater power transmitted between the nodes, where the annual power transferred in MWh is shown in Table 2. Generally, each PV node is connected to two load nodes nearby. For example, PV nodes T3C and T3D are connected to load nodes P1 and P2. PV nodes #3 and #5 are connected to load nodes T1 and T2. Although PV node #6, SIES, and #5 have redundant green power output, little energy is transferred via these nodes, as they are located far from load nodes.
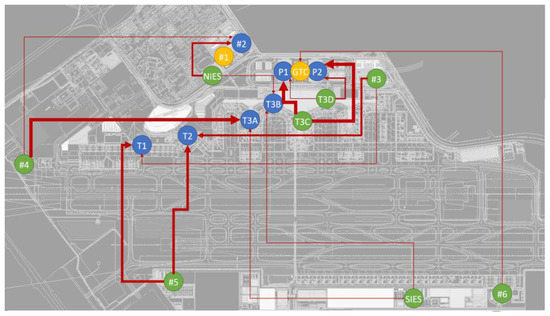
Figure 5.
Optimal power connection and transmission strategy.
Typical operation days are selected for different seasons to address the benefits of the optimization. Typical daily operation strategies before and after optimization for four seasons throughout the year are illustrated in Figure 6, where negative values refer to the quantity loads that grid power requires while positive values refer to the unconsumed solar power generated by the system. The figures on the left show operation conditions before optimization and the figures on the right show optimized operation strategies. As shown in Figure 6, after optimization, the majority of load power in daytime can be satisfied by solar power generated from the system.
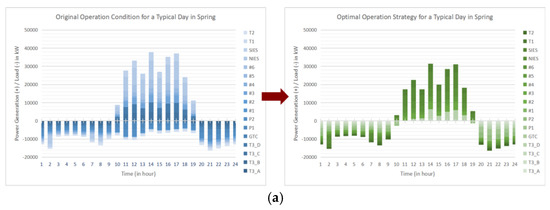
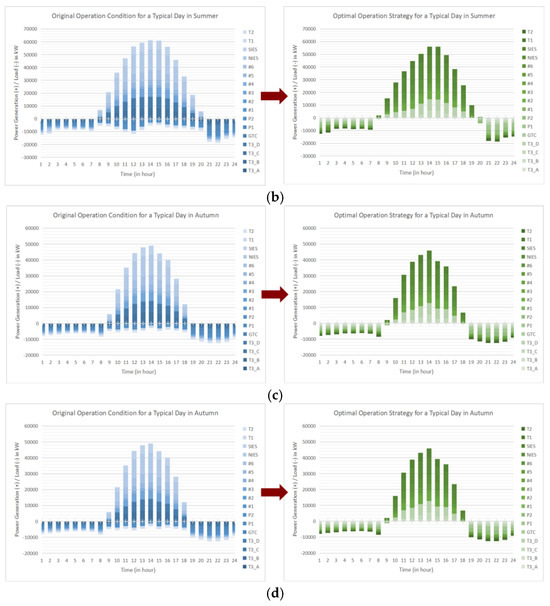
Figure 6.
Typical daily operation strategy before and after optimization in: (a) spring; (b) summer; (c) autumn; and (d) winter.
The optimal annual power transmission results are listed in Table 3. And a summary of the annual solar consumption results is listed in Table 4. An average PV consumption rate of 38.71% can be achieved, which has increased by 37.10% compared with the original system. Considering the local average commercial electricity price of approximately 0.57 CNY/kWh, the interconnection strategy is able to save approximately CNY 10.11 million on average annually. The statistically average carbon emission coefficient for the power grid in Shanxi is around 0.9608 kgCO2/kWh, which results in over 17 thousand tons of CO2 emission being eliminated compared to the original system.
Table 3.
Optimal annual power transmission (MWh).
Table 4.
Result summary.
4.3. Comparative and Sensitivity Analysis
A dedicated sensitivity analysis is performed to provide a more thorough performance evaluation. This analysis evaluates the impact of two critical model parameters, distance weight factor () and cost weight factor (). The findings are intended to verify the stability of the reported performance, elucidate parameter influence, and offer practical insights for parameter calibration in similar applications. The system performance is evaluated based on the following three key metrics: construction cost, transmission distance, and PV consumption. Among these, the cost is assessed using a defined cost index (), which quantitatively reflects the system’s construction expenditure. A comparative analysis of these metrics under different scenarios is presented as follows.
As shown in the sensitivity analysis results in Table 5 and Table 6, variations in α and β exert only a minor influence on cost, distance, and PV accommodation.
Table 5.
Sensitivity analysis on distance weight factor ().
Table 6.
Sensitivity analysis on cost weight factor ().
5. Advantages and Future Works
5.1. Algorithm Advantages and Discussion
The model established in this article effectively addresses distributed PV accommodation challenges through several core innovations, including engineering practicality, computational efficiency, robustness design, multi-objective collaborative optimization, and information transparency.
- Engineering Practicality: A fixed connection topology is adopted to strictly comply with grid constraints. Technical feasibility is ensured via setting distance thresholds and preventing system overload through limitations for connection ports.
- Computational Efficiency: Precomputation of connection relationships significantly reduces real-time complexity; time-point-independent optimization enables parallel computing; and combinatorial optimization problems are efficiently handled via greedy algorithms. The optimization evaluation can be solved within seconds.
- Robustness Design: A backup allocation strategy guarantees solution feasibility at all times; post-processing of load constraints ensures secure operation; and automatic handling of unconnected nodes eliminates system collapse risks.
- Multi-objective Collaborative Optimization: Accommodation volume is maximized as a primary objective and transmission costs are minimized as a secondary objective, with flexible adjustment through weighting factor α. Accommodation dominance is ensured when α is sufficiently small.
- Information Transparency: PV curtailment is precisely quantified; connection relationships are comprehensively recorded; and distance costs are visualized, providing complete data support for decision-making.
5.2. Future Works
Interconnection among nodes, as addressed in this article, represents one of the essential solutions for achieving a zero-carbon airport. Although the proposed optimization algorithm can greatly improve the solar power consumption rate via interconnection, it currently considers power transmission within the same time period only. However, PV generation is usually intermittent and hard to precisely predict. Also, daytime load is often insufficient to absorb all the solar power generated, while a substantial amount of load demand remains unmet at night. Therefore, an extended model incorporating an energy storage scenario can be developed to enable power transfer optimization across both spatial and temporal dimensions. To further advance toward a zero-carbon airport, additional measures and technologies can be considered, including carbon sink, participation in the local carbon trading market, carbon capture and storage, etc.
On the other hand, further studies should be carried out on the financial behavior of the system. With the development of local electricity and carbon emission markets, dynamic electricity price factors, carbon price factors, and carbon emission factors, etc., can be supplemented into the objective function to describe the financial behavior of the system, hence supporting decision-making regarding business strategies.
6. Conclusions
Focusing on multi-node micro-grid systems facing source–load imbalance, a two-stage multi-objective collaborative optimization model is established. By the precomputation of connection relationships, the evaluation time is significantly reduced, enabling efficient processing and generation of operational data across multiple nodes. The efficiency of this model is demonstrated through a case study on the IZT project, which achieves a 38.71% increase in solar power consumption rate, with optimization evaluated within seconds. This model can be widely applied to multi-node interconnection cases: by inputting node generation, load, and distance data in a prescribed format, optimization results can be obtained, enabling broad application in construction planning for flexibly interconnected projects. On the other hand, further research is necessary for extended application scenarios, including energy storage strategies and financial performance.
Author Contributions
Conceptualization, Y.M. and Z.Z.; methodology, Y.M. and J.M.; validation, Z.L. and H.L.; formal analysis, Y.M. and Z.Z.; investigation, F.Y.; resources, J.M. and F.Y.; software, Y.M. and H.L.; data curation, J.M. and F.Y.; writing—original draft preparation, Y.M.; writing—review and editing, Z.Z. and D.X.; supervision, Z.L. and D.X.; project administration, Z.L., H.L. and G.G.; funding acquisition, Z.L. and G.G. All authors have read and agreed to the published version of the manuscript.
Funding
This research was funded by National Key Research and Development Program of China, “Key technologies for coordinated multi-energy flow operation and control in transportation hubs”, grant number 2024YFB2606300.
Data Availability Statement
The raw data supporting the conclusions of this article will be made available by the authors on request. The data are not publicly available due to restrictions from the third-party data provider, as the data pertain to airport operations and may contain sensitive information, specifying use only for specific research projects.
Conflicts of Interest
Authors Yunting Ma, Zhihui Zhang, Hao Li, Zhipeng Lv, Fei Yang and Jiacheng Ma were employed by the company State Grid Shanghai Energy Interconnection Research Institute Co., Ltd. The remaining authors declare that the research was conducted in the absence of any commercial or financial relationships that could be construed as a potential conflict of interest.
Abbreviations
The following abbreviations are used in this manuscript:
| PV | Photovoltaic |
| DSO | Distribution system operator |
| DC | Direct current |
| IZT | Intelligent zero-carbon transportation hub |
References
- Eising, J.; Onna, T.; Feng, S.; Alkemade, T. Towards smart grids: Identifying the risks that arise from the integration of energy and transport supply chains. Appl. Energy 2014, 123, 448–455. [Google Scholar] [CrossRef]
- Xiao, J.; Gang, F.; Jiang, X.; Huang, R.; Wei, T.; Zhang, W. Flexible distribution network: Definition, morphology and operation mode. Power Syst. Technol. 2017, 41, 1435–1446. [Google Scholar] [CrossRef]
- Tang, W.; Zhang, Q.; Zhang, L.; Zhang, B.; Zhang, Y. Concept, key technologies and development direction of multilevel AC/DC interconnection in new distribution system. Autom. Electr. Power Syst. 2023, 47, 2–17. [Google Scholar] [CrossRef]
- Wan, X. Exploration of the Path for Distributed Photovoltaic Assisted Transportation Hubs to Achieve Carbon Neutrality Goals. People’s Public Transp. 2025, 12, 26–28. [Google Scholar] [CrossRef]
- Chen, L.; Xu, Z.; Xu, F.; Wang, Y.; Zhang, K. Research on the Development Path of Energy-Traffic Integration Systems in Transportation Hub Nodes. Low Carbon World 2022, 130–132. [Google Scholar] [CrossRef]
- Li, X.; Yu, H. Thinking and Suggestions on Low-carbon Development Path of Road Transportation under Carbon Peak Target. Transp. Energy Conserv. Environ. Prot. 2021, 1–3+13. [Google Scholar] [CrossRef]
- Xiao, W. Exploration of Smart Energy Management System for Comprehensive Transportation Hub Engineering. Electr. Technol. Intell. Build. 2024, 18, 165–168+172. [Google Scholar] [CrossRef]
- Jin, Y.; Tian, T. Carbon Reduction Strategies for Passenger Transport in Shanghai Based on Spatial and Transport Integration. Urban Transp. China 2025, 23, 1. [Google Scholar] [CrossRef]
- Huang, W. Analysis of Power Supply and Distribution Design for Integrated Transport Hubs. Build. Electr. 2025, 44, 17–21. [Google Scholar] [CrossRef]
- Bruno, C.; Fábio, C.; Vitor, S.; Zita, V. A logic-based flexibility services tool to support a rich renewable distribution network operation. Sustain. Energy Grids Netw. 2025, 43, 101746. [Google Scholar] [CrossRef]
- Pablo, A.; Cristina, G.; Manuel, C.; Maria, F.; Luigi, M.; Danilo, S. Efficient Energy Management in Smart Micro-Grids: ZERO Grid Impact Buildings. IEEE Trans. Smart Grid 2015, 6, 1055–1063. [Google Scholar] [CrossRef]
- Abantao, G.A.; Ibañez, J.A.; Bundoc, P.E.D.; Blas, L.L.F.; Penisa, X.N.; Esparcia, E.A., Jr.; Castro, M.T.; Pilario, K.E.; Tio, A.E.D.; Cruz, I.B.N.C.; et al. Utility-Scale Grid-Connected Microgrid Planning Framework for Sustainable Renewable Energy Integration. Energies 2024, 17, 5206. [Google Scholar] [CrossRef]
- Li, H.; Han, Y. Coordinated Optimization Scheduling of Distribution Networks and Multiple Microgrids Considering the Uncertainty of New Energy. Trans. China Electrotech. Soc. 2025, 40, 5571–5588. [Google Scholar] [CrossRef]
- Guo, L.; Zhao, J.; Jing, B.; Wang, S.; Zhang, X.; Han, Y.; Wan, X. Research on flexible chain architecture and control strategy for new energy microgrid group. China Energy Environ. Prot. 2025, 47, 197–203. [Google Scholar] [CrossRef]
- Lou, G.; Wang, L.; Du, Y. Review on key technologies for coordinated operation of microgrid cluster. Zhejiang Electr. Power 2025, 44, 3–19. [Google Scholar] [CrossRef]
- Federico De, S.; Leonardo, M.; Ellen, B.; Erik, D.; Silvia, V. Managing connection queues in distribution networks with flexible connection agreements. Appl. Energy 2025, 396, 126260. [Google Scholar] [CrossRef]
- Xu, X.; Xia, J.; Hong, C.; Sun, P.; Xi, P.; Li, J. Optimization of Cooperative Operation of Multiple Microgrids Considering Green Certificates and Carbon Trading. Energies 2025, 18, 4083. [Google Scholar] [CrossRef]
- Ge, S.; Hou, T.; Wu, M.; Zhu, Y.; Liu, H.; Li, J. Distributionally robust optimization model of hosting capability for distributed generators in flexible interconnected distribution network. Autom. Electr. Syst. 2023, 47, 140–148. [Google Scholar] [CrossRef]
- Tsai, C.; Chiang, M. Chapter Four—Metaheuristic algorithms. In Uncertainty, Computational Techniques, and Decision Intelligence, Handbook of Metaheuristic Algorithms; Tsai, C., Chiang, M., Eds.; Academic Press: Kaohsiung, Taiwan, 2023; pp. 71–78. [Google Scholar] [CrossRef]


Disclaimer/Publisher’s Note: The statements, opinions and data contained in all publications are solely those of the individual author(s) and contributor(s) and not of MDPI and/or the editor(s). MDPI and/or the editor(s) disclaim responsibility for any injury to people or property resulting from any ideas, methods, instructions or products referred to in the content. |
© 2026 by the authors. Licensee MDPI, Basel, Switzerland. This article is an open access article distributed under the terms and conditions of the Creative Commons Attribution (CC BY) license.