Article

Towards a Positive Energy District: Energy Efficiency Strategies for an Existing University Campus


by
Hamed Mohseni Pahlavan
* and
Natasa Nord
Department of Energy and Process Technology, Norwegian University of Science and Technology (NTNU), Kolbjørn Hejes vei 1 B, 7491 Trondheim, Norway
*
Author to whom correspondence should be addressed.
Energies 2026, 19(3), 604; https://doi.org/10.3390/en19030604
Submission received: 23 November 2025 / Revised: 2 January 2026 / Accepted: 21 January 2026 / Published: 23 January 2026

Abstract

Developing positive energy districts (PEDs) is a key strategy in the global energy transition to reduce the high energy use and greenhouse gas emissions from the built environment. While the creation of new, energy-efficient urban areas as PEDs is essential, transforming existing districts is even more challenging, as they contain buildings of different types, ages, and energy performance levels. This study investigated energy efficiency improvements to facilitate the transition of an existing university campus toward PED operation. The NTNU Gløshaugen campus in Trondheim, Norway, was analyzed using a calibrated multi-building energy model (MBEM) developed using the URBANopt tool. Buildings were clustered into four age-based cohorts to assess the impact of targeted energy conservation measures (ECMs) on different construction periods. In addition, three energy efficiency scenarios were evaluated over the period 2025–2030 to capture the combined effects of new construction and renovation of existing buildings. Results showed that applying envelope improvement ECMs was more effective in older buildings, where lower baseline energy performance allowed for higher relative reductions in energy use. By the end of the simulation period, the specific energy use of the entire campus decreased from 252.2 kWh/m2 in 2025 to 161.7 kWh/m2 under moderate and 85.9 kWh/m2 under deep retrofit conditions. These improvements create more favorable conditions for meeting the remaining energy demand through renewable sources, achieving an overall renewable coverage of 97%, and moving the campus closer to meeting PED targets.

1. Introduction

With the world’s increasing effort to combat climate change and achieve decarbonization, the built environment has become a key area of sustainability initiatives [1]. Buildings are responsible for a significant portion of global energy use and greenhouse gas (GHG) emissions. In the European Union, 40% of energy use and 36% of energy-related GHG emissions are from the building sector [2]. To combat this, the EU aims to substantially reduce GHG emissions and final energy use in the building sector by 2030, with a vision of a climate-neutral building sector by 2050. Achieving this goal requires increasing the rate and depth of energy-efficient building renovations, ensuring all new buildings meet “zero emission building” standards, and aligning all buildings with the 2050 climate neutrality requirements [3]. In Norway, the building sector accounts for 34% of total final use (TFC). To improve energy efficiency, Norway has set a target to reduce 10 TWh of energy use in existing buildings by 2030 relative to 2015 levels, and the country employs stricter energy requirements for buildings, aiming to reduce overall energy use [4].
In recent years, the focus of energy transition strategies has shifted from single buildings to the scale of districts, introducing concepts such as net-zero energy or emission districts and positive energy districts (PEDs). These approaches emphasize planning for energy efficiency, renewable generation, and storage across multiple buildings rather than individual buildings [5]. A net-zero district aims to balance its annual energy demand or emissions, while a PED goes a step further by producing more renewable energy than it consumes and supplying the surplus to surrounding areas [6]. These concepts are increasingly promoted in European policy frameworks as they enable more systemic efficiency improvements and greater carbon reductions than building-level measures alone [7].
Achieving PED targets is particularly difficult in existing urban areas, where most of the buildings have low energy performance. Approximately 75% of the EU building stock is considered inefficient, mostly comprising buildings older than 50 years [8]. These existing urban districts usually have higher energy demand, different types of energy users and potential for expanding and developing the infrastructure that is already in place, which is effective in implementing integrated district energy plans [9]. In PED development, the plan is moving from the isolated view of individual net-zero energy buildings (NZEBs) to the integrated, district-scale approach, which is essential for wide-scale urban decarbonization [10].
A key element in the transition toward PED status is the energy efficiency strategy, which, alongside renewable energy generation and energy flexibility, forms the three core aspects of a PED [6]. Energy efficient individual buildings create the foundation for successful PED implementation, because their lower energy demand can be more effectively by local renewable energy sources (RES) [11]. First step in energy efficiency measures typically involves passive retrofit actions, such as the installation of thermal insulation on external walls and roofs, and the replacement of windows [12]. Subsequently, efficient technical systems, such as optimized heating, ventilation, and air conditioning (HVAC) and advanced lighting systems, are implemented, followed by on-site RES integration [13].
Efforts aimed at transitioning existing urban settings toward PEDs are documented across Europe, often utilizing advanced modeling tools such as urban building energy models (UBEMs) to evaluate efficiency scenarios at a large scale [14]. UBEM refers to the process of predicting urban energy use using computer simulations. UBEM is an essential tool for predicting energy use and evaluating energy efficiency strategies in urban policy [15]. Several types of energy models have been proposed for modeling urban building energy use over the past few decades, each with their own strengths and weaknesses [16]. Physics-based, bottom-up models are one of the most common types, used for this purpose. These models rely on detailed physical data, such as the building’s geometry, construction materials, and HVAC system, to generate a comprehensive model of the building’s energy use [16]. Another approach to modeling urban building energy use involves coupling bottom-up physics-based models with GIS techniques. This approach involves using GIS to integrate the physical data of the building with the spatial data of the urban area to create a more comprehensive model. Physics-based, bottom-up models are supported by several widely used tools such as EnergyPlus, TRNSYS, ESP-r, IDA ICE, and eQUEST, which enable detailed simulations of building energy performance based on geometry, construction, and HVAC data. For urban-scale applications, these models can be coupled with GIS techniques to capture the spatial and morphological characteristics of entire districts. Notable GIS-integrated tools include URBANOpt, CitySim, the Urban Modeling Interface (UMI), SimStadt, and CityBES, all of which facilitate the large-scale modeling of building stocks by linking physical building data with spatial information [17].

1.1. Related Work

Deep energy retrofits have demonstrated considerable potential in existing districts, leading to substantial reductions in energy use. For instance, a study conducted in a residential area in Odense, Denmark (Søhus), explored retrofitting strategies aimed at transforming existing structures built primarily in the 1980s and 1990s to higher energy performance [18]. This effort involved deep energy performance enhancement, where improving the building envelope alone reduced the total heating demand by approximately 35% and combining optimization of indoor thermal comfort settings resulted in an additional 12% reduction in heating demand. Results of this study showed that integrating retrofits with heating system upgrades, photovoltaic-thermal (PVT) units, heat pumps, and seasonal energy storage had the potential to turn the area into a PED, producing surplus heat and electricity. Similarly, renovation scenarios evaluated at the University of Palermo (UniPa) campus in Italy, a non-residential existing district, involved implementing effective retrofit measures such as envelope insulation, window replacement, relamping, and HVAC enhancements [19]. These efforts achieved a 40% reduction in annual energy demand. When these retrofits coupled with renewable energy integration such as roof-mounted PV panels, the system covered up to 80% of the district’s overall annual energy use. In Licata, Italy, the retrofitting of an existing cluster of commercial and office buildings with efficiency measures like thermal insulation of the building envelope, reduced air conditioning needs by approximately 50%. This efficiency effort, combined with solar energy plants and energy flexibility activation via advanced control algorithms for the HVAC system, enabled the district to achieve PED status. In some cases, PED projects in dense, existing urban areas face serious challenges. A housing complex in Bucharest, Romania, was used as a case study of PED project where deep energy retrofits focusing on external walls reduced heating demand by 24% [20]. In the same study, high-density morphology and limited roof area constrained PV generation to only 13.8% coverage of the electricity demand, which made PED status difficult to reach. Another study in Eordaia, Greece, analyzed renovation strategies for a neighborhood of 105 mixed-use buildings with the goal of achieving PED status [21]. Energy efficiency measures in this study included insulation upgrades, window replacement, LED lighting, predictive thermostats, and nanotechnology-coated windows, while renewable production and flexibility options involved PV systems, solar thermal, and battery storage. Results demonstrated surplus electricity generation and a self-supply potential above 55% in the case study. Generally, these examples highlight that deep energy efficiency measures are foundational to successful PED transformation in existing areas, but achieving net-positive status often depends on the effective combination of these measures with renewable energy production and smart flexibility strategies.
Recent studies further emphasize the significant potential of deep energy retrofits in existing university campuses and institutional buildings, highlighting their role as representative and complex urban districts. Several campus-scale investigations demonstrate that substantial energy reductions can be achieved through combinations of envelope upgrades, ventilation system improvements, HVAC optimization, and operational control strategies, particularly in buildings constructed before modern energy regulations. For example, detailed retrofit analyses of existing educational buildings in Italy [22], the United Kingdom [23], United States [24], Turkey [25], and South Korea [26] show that comprehensive retrofit packages can reduce total energy demand by 50–60% or more, with ventilation-related measures and system optimization often delivering the highest relative savings. Studies on historic and regulated campus buildings further reveal that, even under architectural and conservation constraints, demand-side measures such as internal insulation, window upgrades, and efficient HVAC systems can achieve heating and cooling load reductions of 40–55%, although limitations on renewable integration may constrain full PED achievement [26]. Comparative assessments between retrofit and new construction strategies on university campuses also indicate that deep renovation of existing buildings offers a more immediately scalable and environmentally favorable pathway, avoiding demolition-related emissions while delivering meaningful operational energy and carbon reductions. Across these studies, a common conclusion is that retrofit effectiveness strongly depends on building age, construction period, and system configuration, and generic, uniform renovation strategies are insufficient for heterogeneous campus environments.

1.2. Outline of the Study

Despite these clear advancements, a significant literature gap remains in the detailed application of energy efficiency strategies for optimal outcomes in diverse existing building stock. Current research often relies on simplified renovations, where generic measures are calculated and then scaled up to the entire urban area. This limits the ability to identify and adapt efficiency measures specifically to the unique needs of different building types within a district. Many studies focus primarily on new or hypothetical developments, where buildings are designed to meet high performance standards from the outset, while the challenges associated with retrofitting existing and heterogeneous building stocks are less frequently addressed. In addition, a large share of urban building energy modeling studies rely on archetype-based or statistically driven UBEM approaches, which often lack calibration against measured data and therefore provide limited insight into real operational performance. The diversity of building ages, construction standards, and system configurations typically found in existing districts is often simplified, reducing the ability to assess cohort-specific retrofit potential. Therefore, this paper aimed to address this need by investigating and detailing optimal energy efficiency strategies for transforming an existing non-residential university campus into a PED. The study introduced a dynamic modeling framework for assessing the transformation of an existing university campus toward a PED by using real energy use data for calibration and scenario definitions. By applying a multi-building energy model (MBEM) over a 5-year period, the work captured both the current building stock, and the planned campus development, allowing for a realistic simulation of evolving energy performance. A distinctive feature of the approach was the use of building-age cohorts, which enabled a detailed analysis of how retrofit strategies affect buildings constructed under different codes and standards. Detailed data from building energy audits, together with measured energy use from the online monitoring system, were used to ensure that the reference model reflects the most realistic operating conditions. This cohort-based evaluation provided valuable insights into the varying retrofit potential and cost-effectiveness across the campus. Therefore, the originality of this work lies in the combination of a calibrated, cohort-based multi-building energy modeling framework with a long-term, scenario-driven analysis of an existing non-residential university campus. In contrast to many existing PED studies that primarily focus on renewable generation, this research emphasizes a demand-side perspective, examining how reductions in heating and electricity demand through efficiency measures form the foundation for achieving energy-positive operation. Finally, potential to achieve a PED by use of PV was estimated by using real electricity generation from the PV installed at the campus. Together, these elements provide a novel and transferable methodology for planning energy-efficient transitions toward PEDs in existing urban districts.

2. Materials and Methods

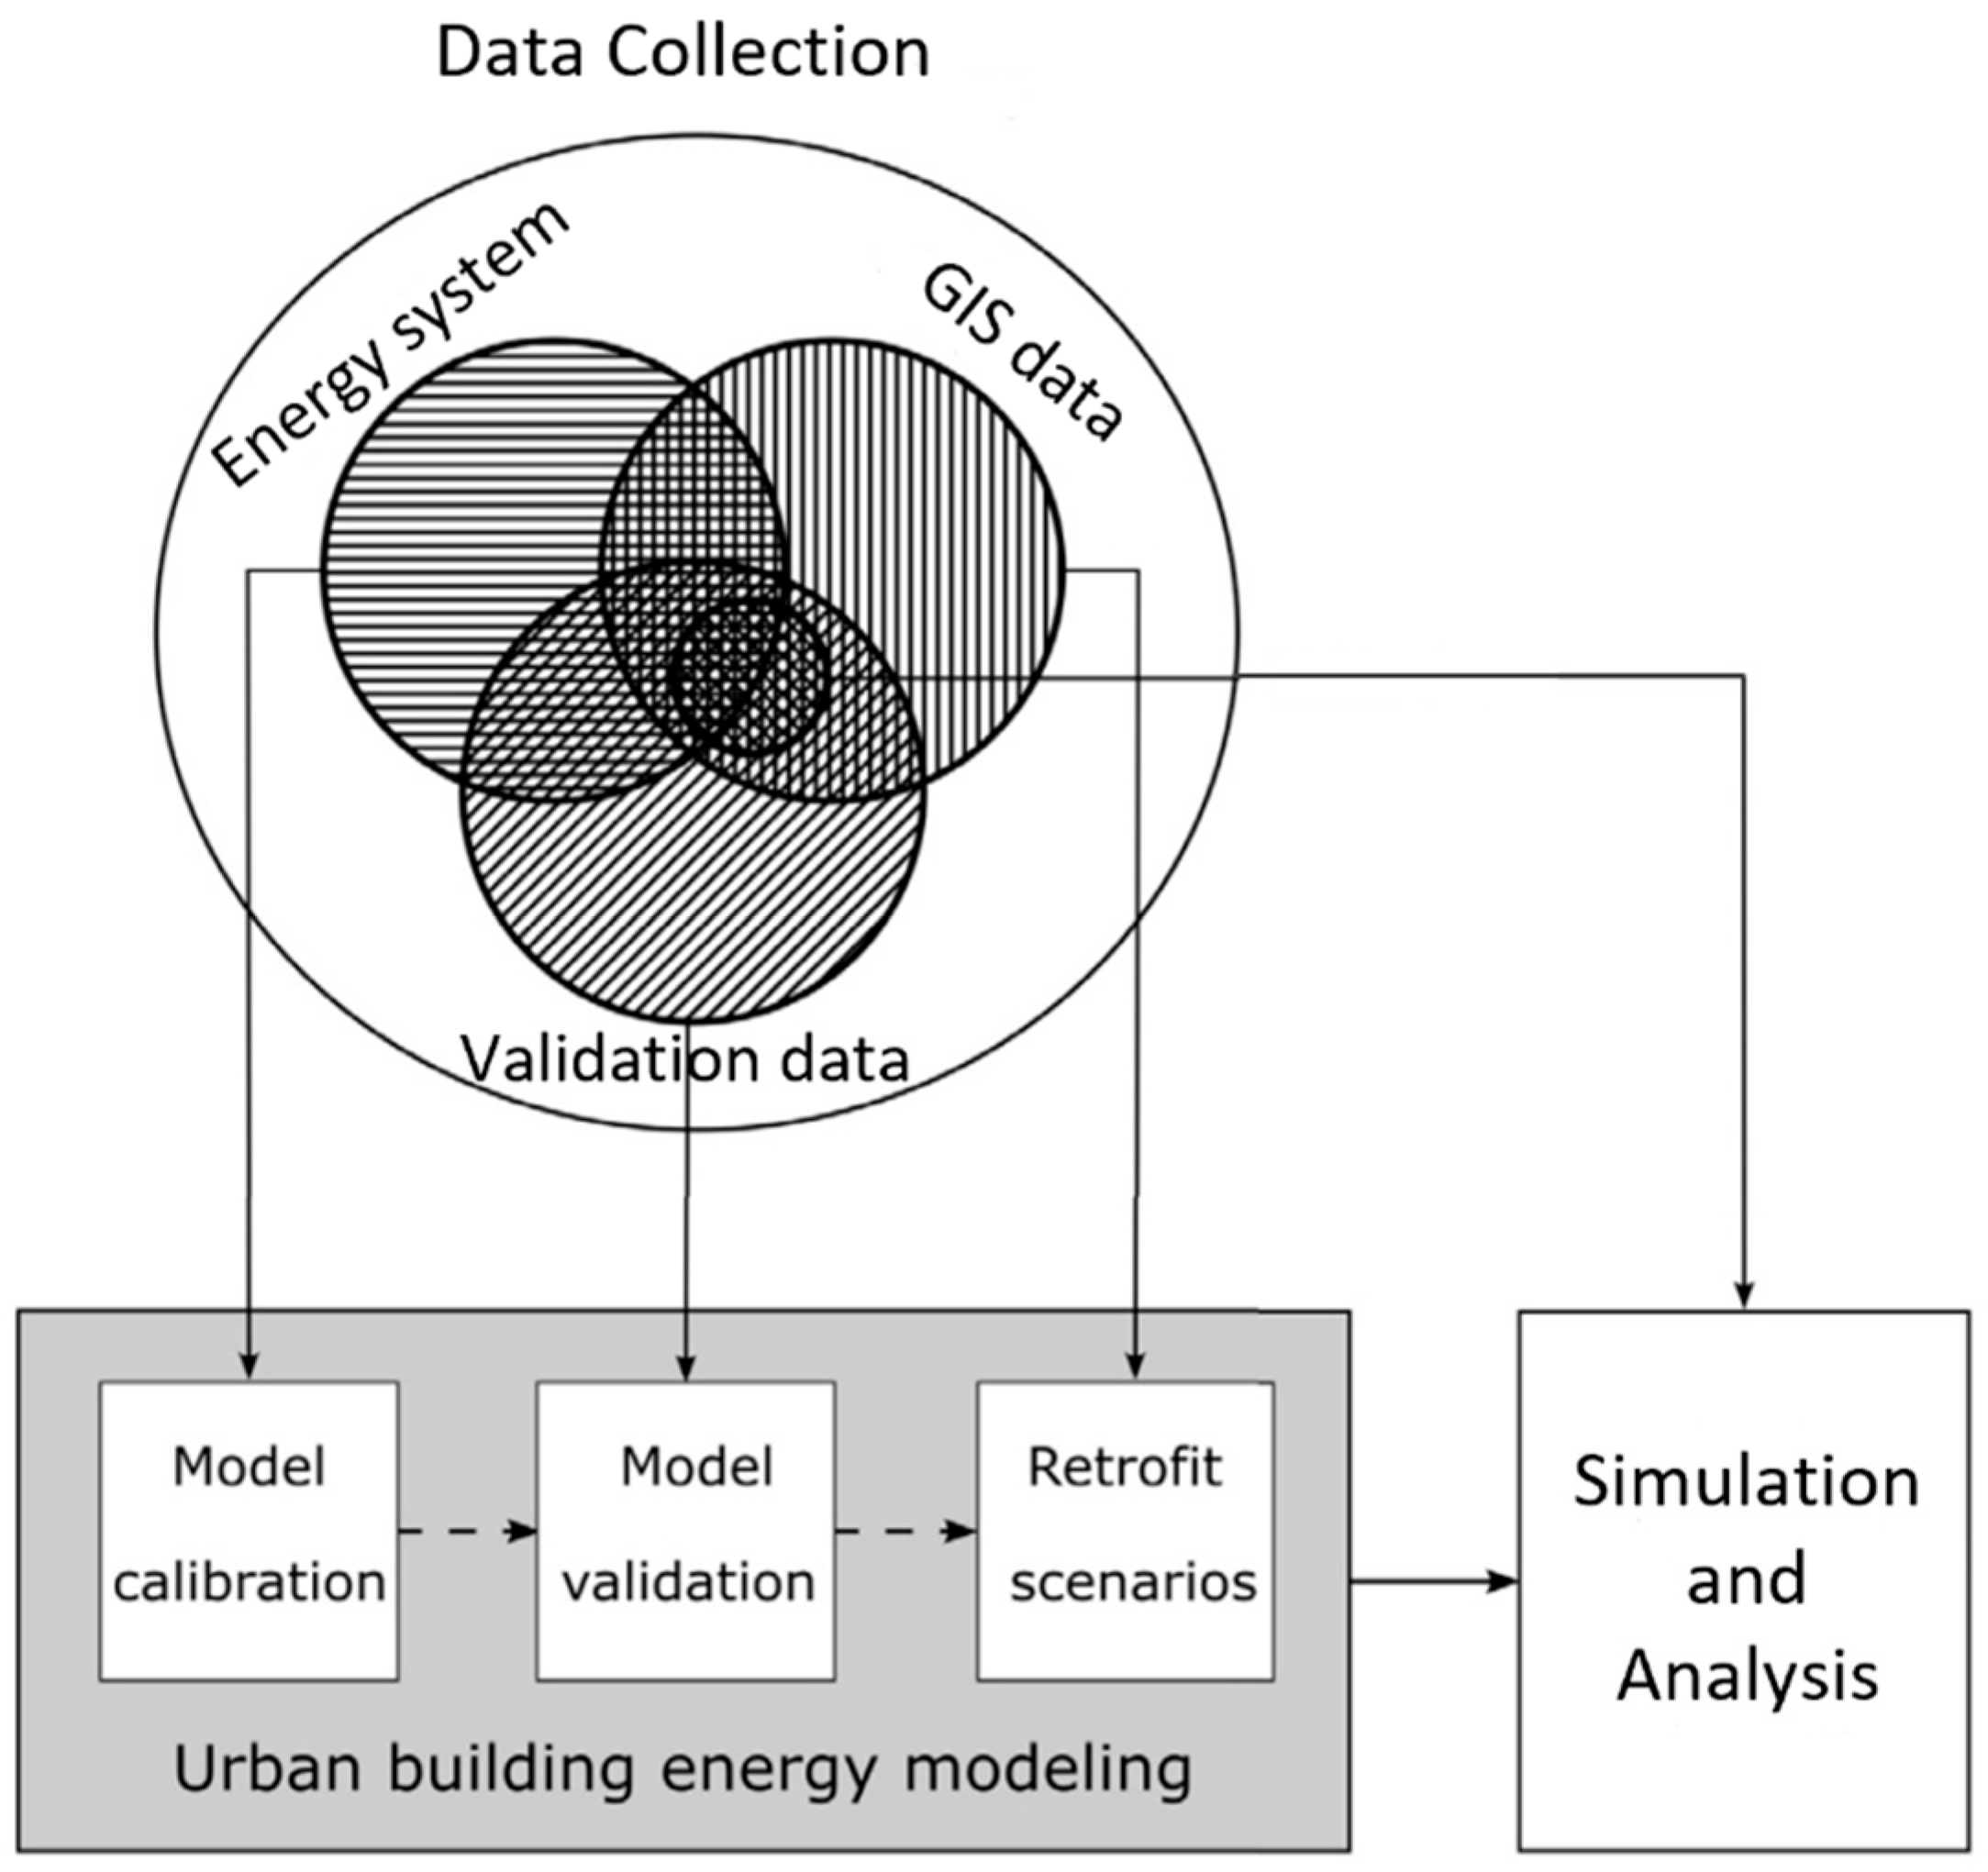
In alignment with the objectives of this study, the methodology was organized into four main steps. First, a comprehensive data collection phase was conducted to gather detailed information on the buildings within the case study area, along with planned future developments to ensure that both current conditions and expected changes were represented. Second, a model of the district was developed using the URBANopt v0.10.0 tool, providing a robust framework for simulating building energy performance. This step also included model calibration and validation, where simulated results were systematically compared with measured energy data at multiple temporal scales to ensure accuracy and reliability. Third, a series of energy efficiency scenarios were designed, incorporating a range of deep retrofit strategies to explore their potential for reducing demand and improving performance. Finally, a PED evaluation was conducted, assessing the combined effects of efficiency measures, renewable integration, and system interactions on the district’s progress toward achieving a net-positive energy balance. The methodological approach is illustrated in Figure 1, which summarizes the sequential implementation of the MBEM, highlighting how data collection, calibration, validation, scenario definition, and simulation are integrated within a unified modeling workflow.

2.1. Data Collection

The input data for modeling and validation of the building stock and energy use were collected from various sources for the case study in Trondheim, Norway. Further details are provided below.

2.1.1. Case Study

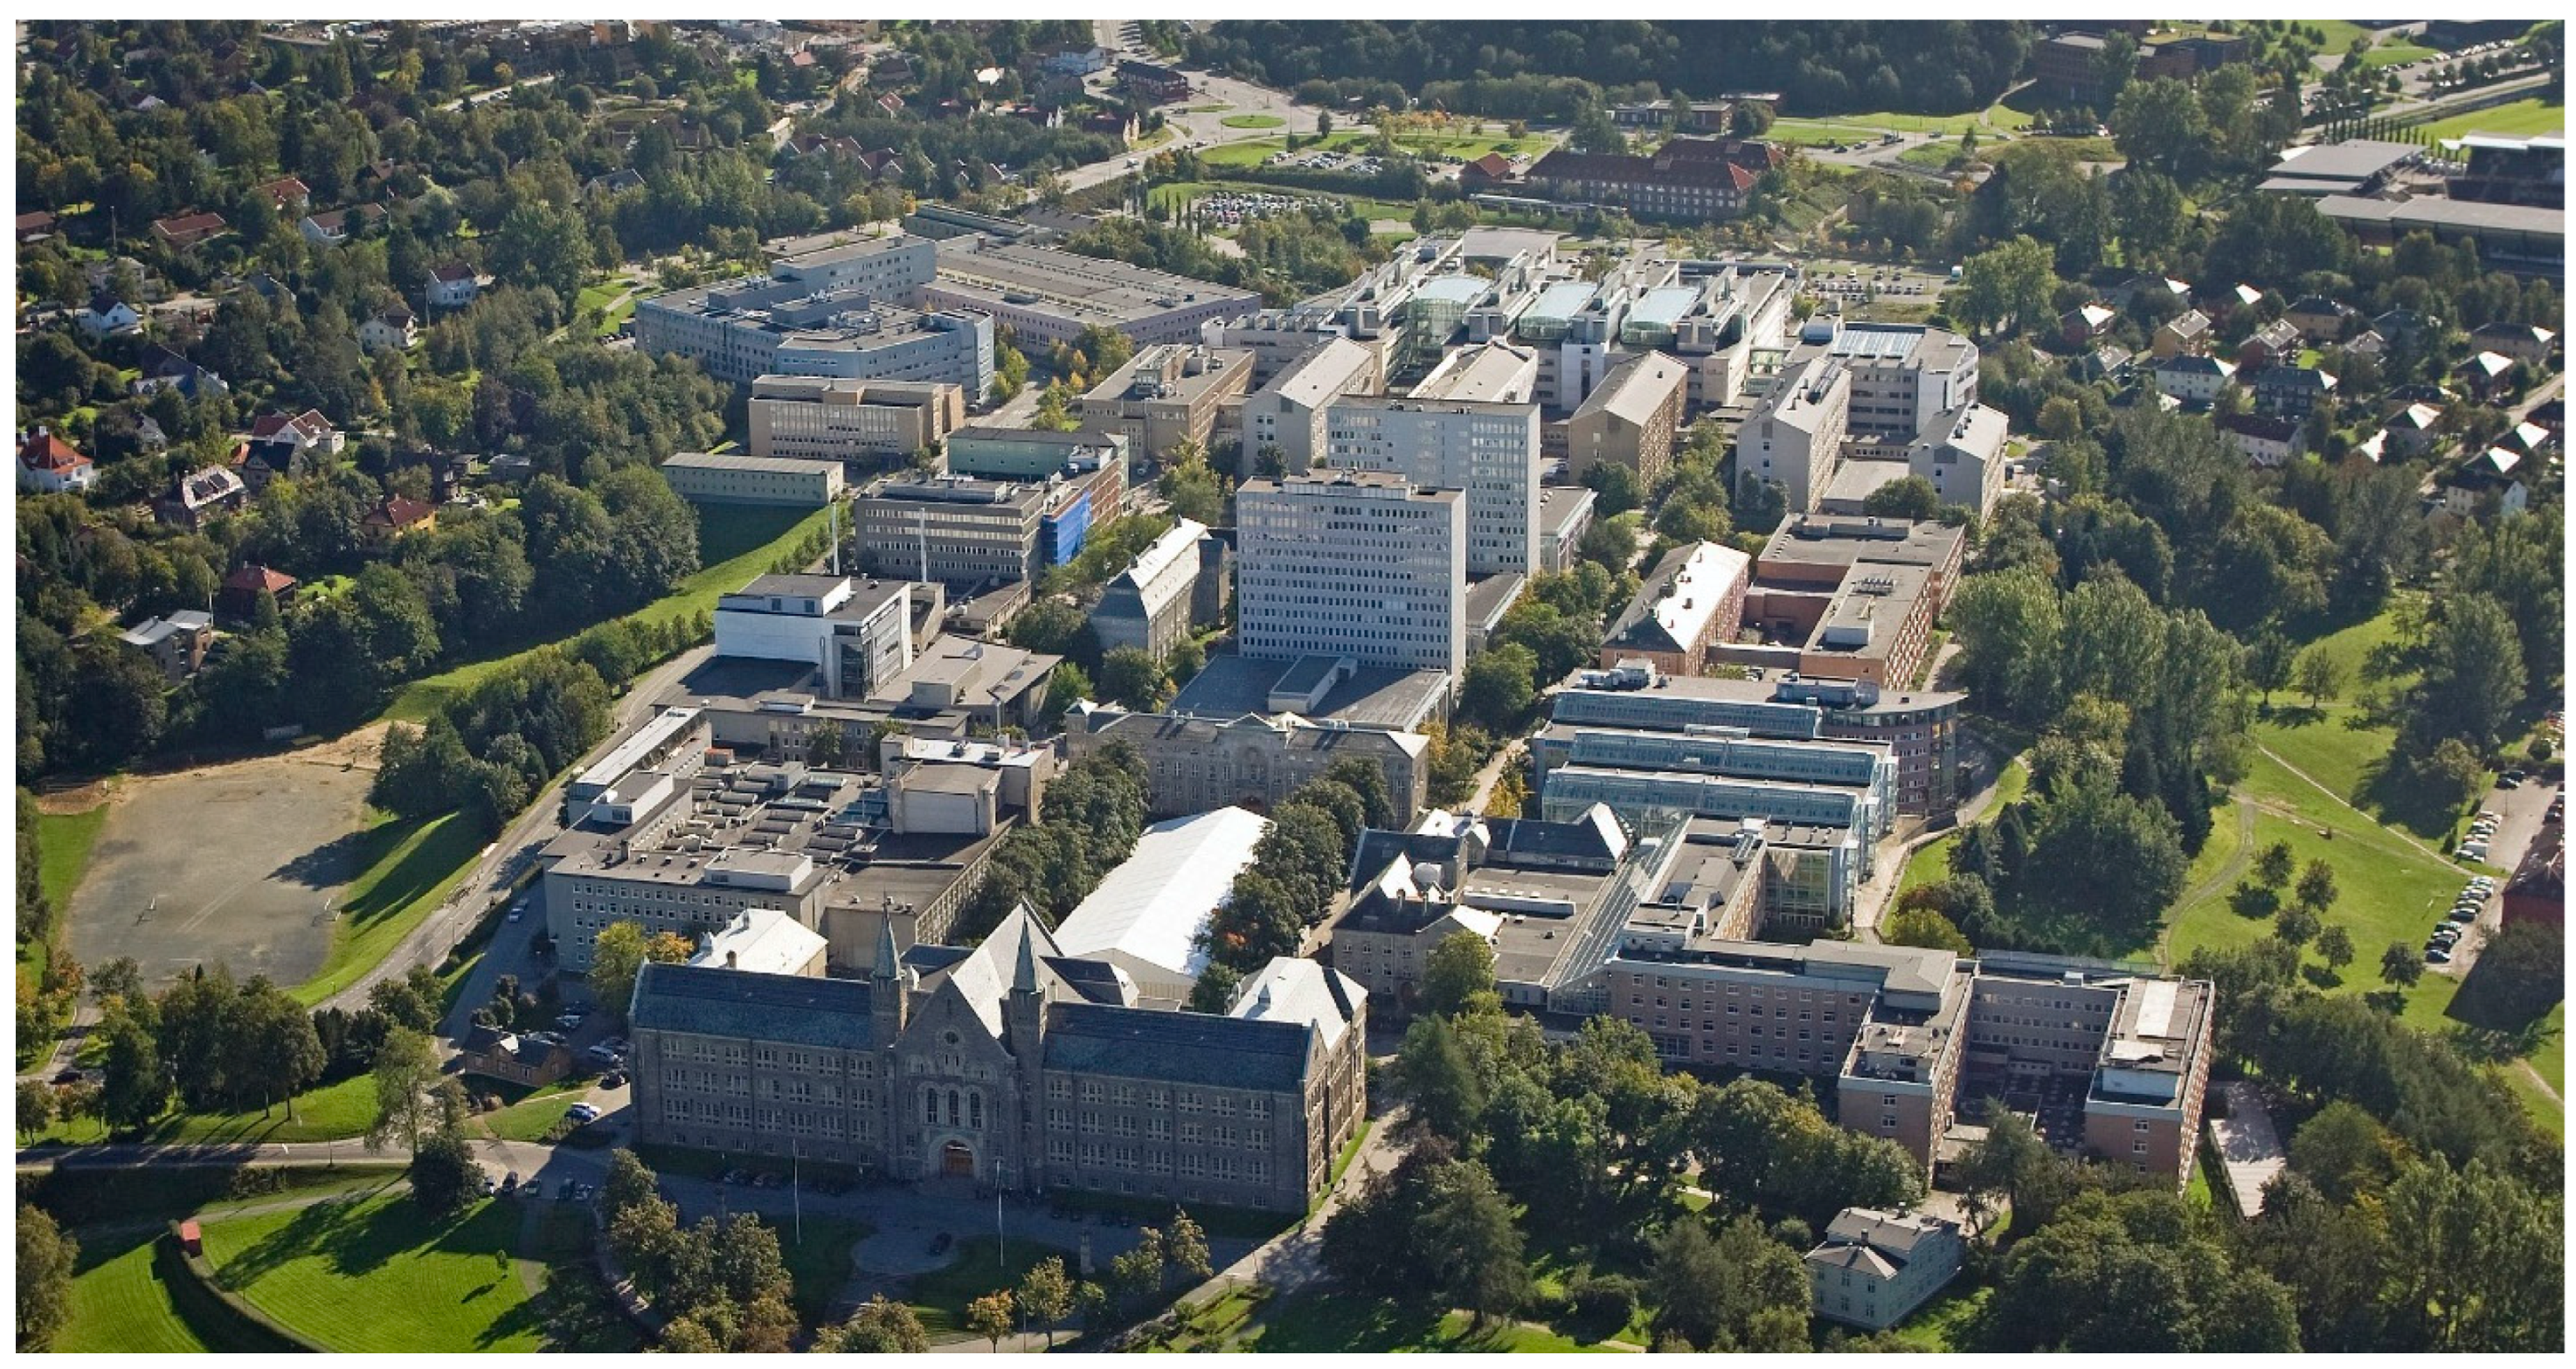
This research used the Gløshaugen campus, located in Trondheim, Norway (shown in Figure 2), as the case study. The campus currently covers approximately 300,000 m2 and comprises a diverse mix of educational buildings, offices, laboratories, and sports facilities. Besides the existing built environment, NTNU is undertaking a major campus development project comprising six distinct areas, five of which are included within the scope of this study [27]. The project encompasses approximately 86,000 m2 of building gross area and is planned for completion by 2030. It combines new buildings with the renovation of existing ones under the latest Norwegian building codes, which affects the overall energy performance of the campus. This ongoing development will therefore have a substantial impact on the district’s future energy profile and serves as an important component of the PED evaluation in this research.
The current energy system of the campus depends on a centralized district heating (DH) system and grid electricity. The campus DH system is connected to the city DH system through the main substation (MS) [28]. According to the measurements in 2024, the total heat supply for the campus DH system was 30 GWh. The total electricity use on the campus was 58 GWh for the same period [29].

2.1.2. Building Data

In this study, multiple data sources were used to build and comprehensive database of campus buildings. The building geometry, including shape, footprint, and location, was derived from GIS data, and information related to the building envelope, such as U-values, external surface area, and floor area were obtained from building energy certification. The operation of technical systems was defined in accordance with national standards, including NS 3031 [30] and the Norwegian building code TEK17 [31]. This database was used to develop an initial MBEM of the campus buildings and also to calibrate the developed model.
Sufficient data were available for 31 buildings within the case study area. The buildings on the campus were constructed over a broad time span, from 1910 to 2002, resulting in a wide range of physical and technical characteristics [32]. Moreover, campus development project provides data on planned construction on campus, scheduled for 2025 to 2030. As buildings were constructed during different periods, typically adhered to the technical regulations in effect at the time, the construction year served as a useful basis for classification. In this study, construction period, combined with available building data, enabled the identification of five distinct clusters of buildings with similar characteristics, including planned construction under latest building code [33]. These clusters, referred to as cohorts in this work, facilitated the development of a more accurate district-level energy model. The defined cohorts (C) with their corresponding applicable building codes are presented in Table 1.
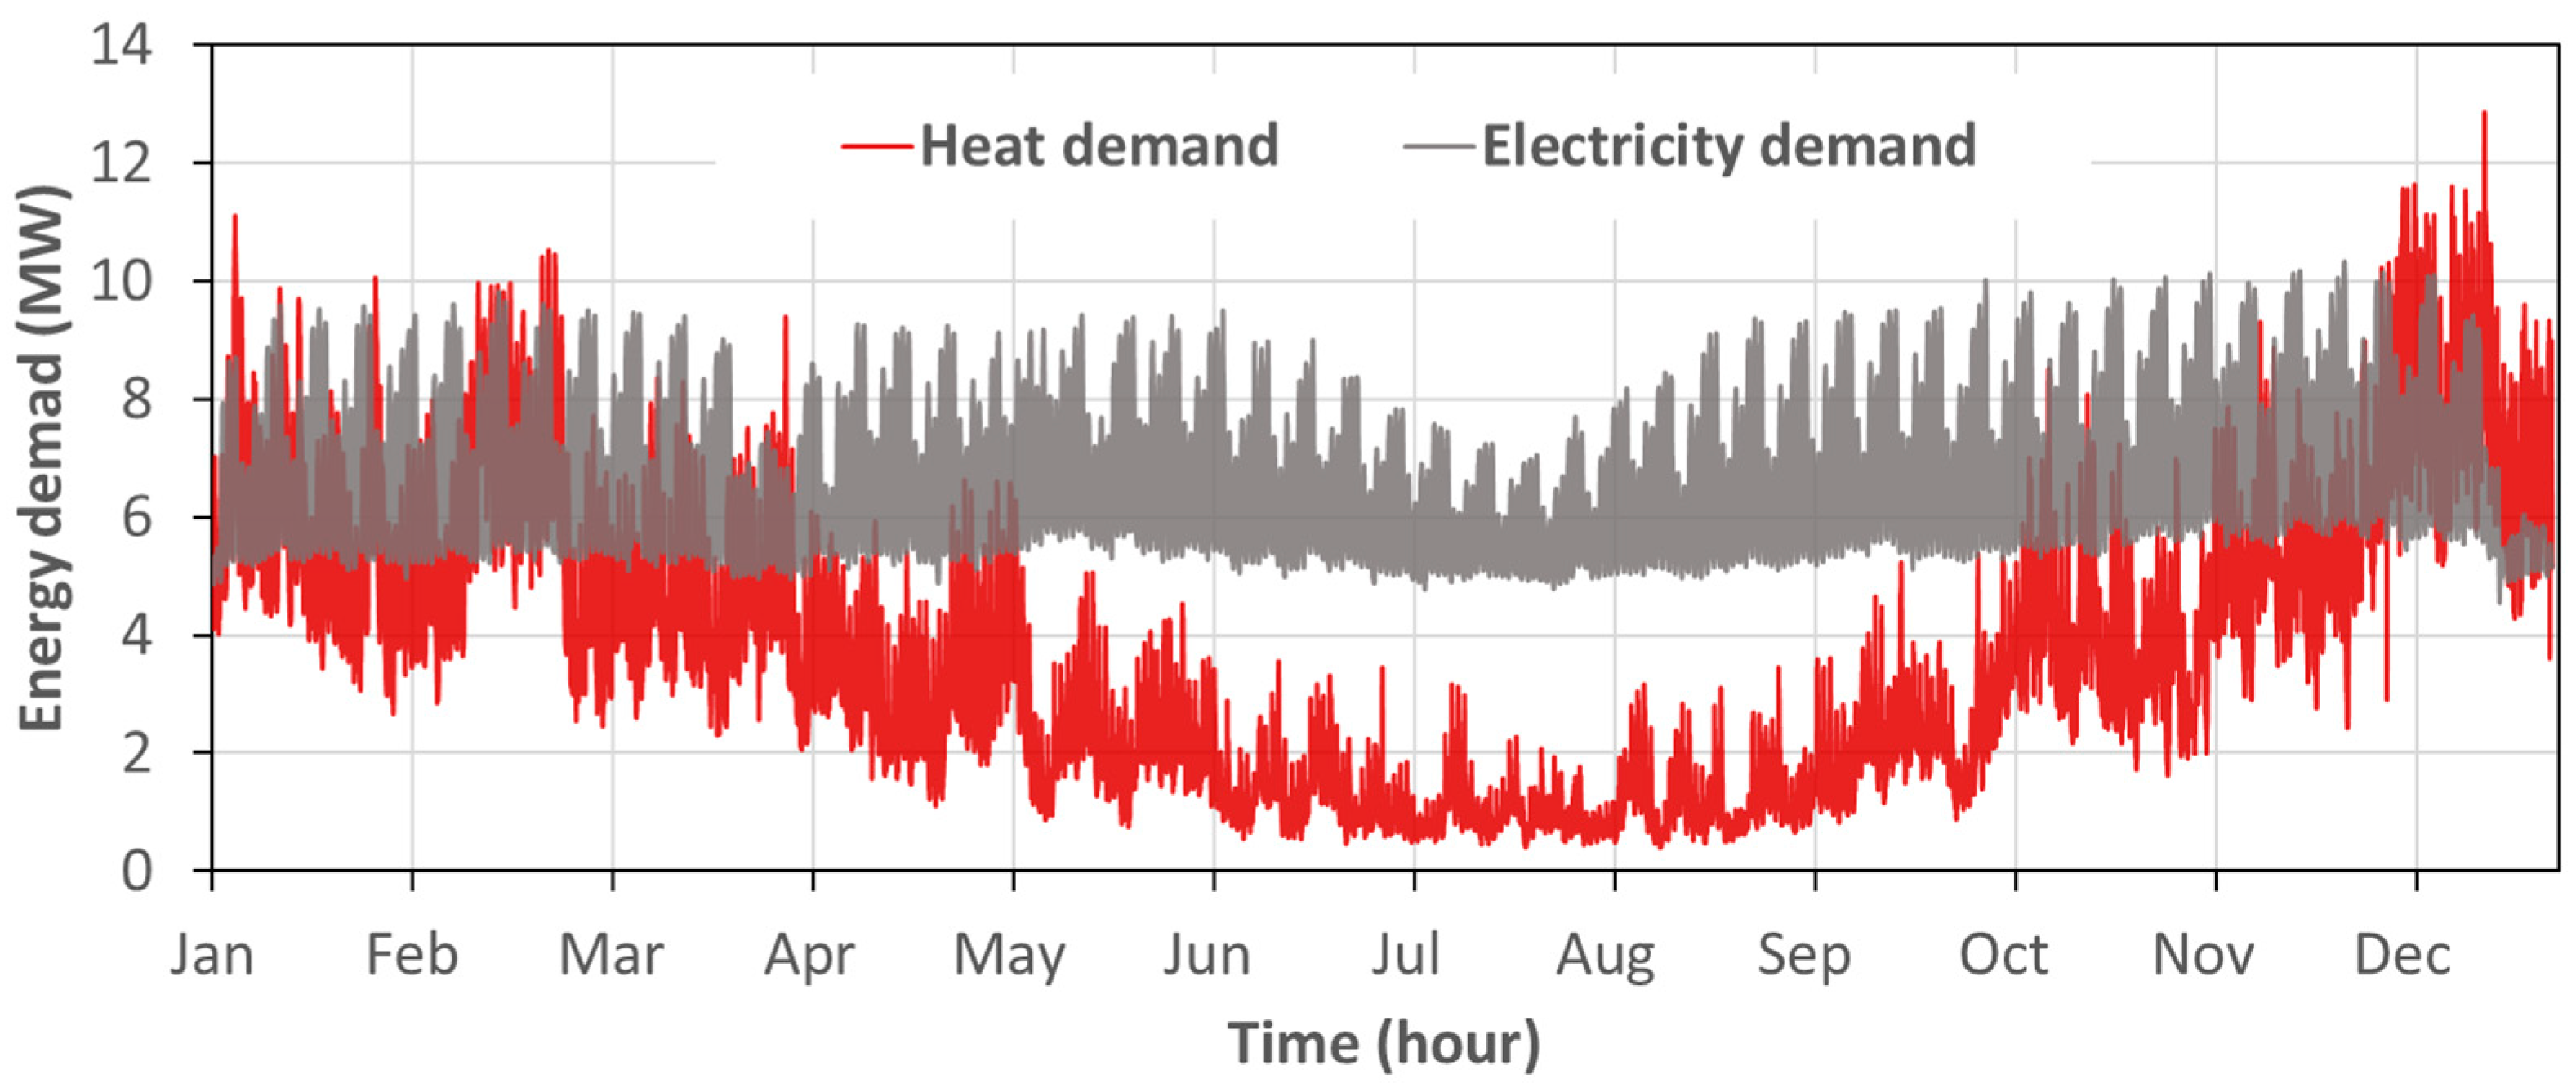
Energy use data for the NTNU Gløshaugen campus at the building level were collected via an energy monitoring system to validate the performance of the MBEM. This included measurements for heat and electricity use, along with other relevant performance indicators, which were exported for further analysis. To evaluate the performance of the MBEM across various temporal aggregation levels, hourly energy use data for the entire year of 2024, shown in Figure 3, were selected for analysis.

2.2. Energy Model

First step in evaluating current and future energy performance at the district scale is the development of the MBEM. In this study, the previously developed MBEM by the authors was used to simulate the energy use of buildings across NTNU’s Gløshaugen campus, capturing the diversity of construction period, functions, and energy systems [34]. The MBEM adopted in this study represents a more recent and detailed implementation within the UBEM framework, in which individual buildings are explicitly modeled and simulated as part of an interconnected district system. The MBEM approach allows building-specific geometry, construction characteristics, operational schedules, and energy systems to be incorporated, while also accounting for shared boundary conditions such as climate, infrastructure, and development scenarios. Compared to conventional UBEM approaches, the MBEM used here emphasizes cohort-based parameterization, calibration with measured energy data, and scenario-driven retrofit analysis, providing greater resolution and flexibility for evaluating energy efficiency measures in heterogeneous existing building stocks. By representing each building as part of a connected urban system, the MBEM enabled assessment of baseline performance and the impacts of different energy conservation measures (ECMs) and development scenarios. Furthermore, the model provided a framework for forecasting campus-wide energy performance over the next 5 years, accounting for both ongoing construction and retrofit activities.
The campus energy model was developed using the URBANopt platform, which supports multi-building energy analysis and district-scale simulation [35]. This tool provided the necessary framework to model the diverse building stock of the Gløshaugen campus and assess multiple retrofit scenarios. Its ability to manage geospatial data and automate the generation of detailed baseline and performance models was essential for the development of MBEM.
All input data were structured into a GeoJSON file containing simplified geometric representations of each building (“shoebox” models) and cluster-specific inputs reflecting construction characteristics and performance parameters. These parameters were based on the previously defined building cohorts and associated Norwegian building codes (see Section 2.1.2). Detailed input data used for developing the MBEM with their respective data sources are presented in Table 2. DH was modeled as the primary heating source, while balanced mechanical ventilation systems were applied in accordance with national technical standards. In addition, internal loads, and operational schedules were assigned using standard templates from NS 3031 [30].
To capture the temporal evolution of the campus, the model was extended into a dynamic 5-year simulation framework (2026–2030). This framework was integrated into NTNU’s ongoing campus development project. Each simulation year incorporated new buildings as they were constructed and updated existing buildings according to the selected retrofit scenarios. This approach allowed the MBEM to reflect both the physical expansion of the campus and the gradual improvement of existing buildings through energy efficiency upgrades. Consequently, the model generated annual energy profiles, across multiple future scenarios, providing insight into how the campus may progress toward PED status over time.
In the initial modeling stage, all buildings were treated as mixed-use facilities, applying average proportions of the defined building types across the entire stock. The initial simulation outputs included annual energy use for each building and a range of other performance indicators, forming the basis for subsequent calibration and scenario analyses.

Calibration and Validation

Calibration was conducted to align model parameters with actual data and characteristics of each building group. As detailed in Section 2.1.2, clustering of buildings by construction period provided a basis for representing time-dependent features such as envelope performance and ventilation systems. Calibration was performed primarily at the individual building level, rather than at the aggregated campus level, to better capture the heterogeneity of the building stock. This targeted calibration procedure was applied focusing on parameters with the greatest influence on energy demand and with sufficient data availability. More refinements were made through three key adjustments:
  • Conditioned floor area: modeled conditioned areas were corrected to match actual values obtained from building certification data, ensuring realistic scaling of energy demand.
  • Building type: each building was reclassified based on its dominant function (educational, office, laboratory, or sports), producing more accurate internal loads and occupancy patterns.
  • Window-to-wall ratio (WWR): real campus data indicated WWRs ranging from 15% to 89%. Adjusting these ratios in the model improved the representation of solar gains, daylighting, and thermal losses.
Together, these steps improved the model’s ability to reproduce observed energy behavior, providing a robust baseline for long-term simulation and scenario analyses. Other parameters, including envelope thermal properties, ventilation heat recovery efficiency, and system characteristics, were assigned at the cohort level according to construction period and relevant TEK requirements and were not individually calibrated to avoid over-parameterization.
Validation of the calibrated MBEM was conducted using independent datasets and simulation outputs, following ASHRAE Guideline 14. Two statistical indicators were employed: the coefficient of variation in the root mean square error (CV(RMSE)) and the normalized mean bias error (NMBE) [36]. CV(RMSE) quantifies the variability of errors relative to the mean measured values, while NMBE indicates the average bias between simulated and observed data:
C V R M S E = i = 1 n ( M i S i ) 2 n 1 M ¯ × 100  
N M B E = i = 1 n ( M i S i ) ( n 1 ) · M ¯ × 100
where M i is measured (observed) value, S i is simulated (predicted) value, M ¯ is the mean of the measured values, and n is the number of data points.
According to ASHRAE, acceptable thresholds for model validation are ±30% for CV(RMSE) and ±10% for NMBE using hourly data, or ±15% and ±5%, respectively, for monthly data. These benchmarks were applied to ensure that the calibrated MBEM accurately represents both current and projected energy performance of the Gløshaugen campus.

2.3. Energy Retrofit Scenarios

Two retrofit strategies were developed for the campus to explore its energy performance evolution over the next five years. These strategies were designed in combination with the ongoing campus development plan and created three different scenarios in total. To define the retrofit pathways, a set of ECMs was selected based on their suitability for the Norwegian climate, compatibility with existing infrastructure, and demonstrated effectiveness in similar contexts. The ECMs included improvements to the building envelope, replacement of existing windows, enhanced heat recovery in ventilation systems, and optimization of specific fan power (SFP).
The base scenario, Scenario 1, followed NTNU’s current campus development plan, which includes the construction of new buildings, demolition of outdated structures, and limited renovation of selected facilities.
The moderate retrofit scenario, Scenario 2, built on the base scenario by incorporating basic and broadly feasible retrofit measures for the existing building stock, reflecting a realistic improvement pathway since it is not practical to renovate all existing buildings to fully meet current building code standards, particularly in older structures. Structural constraints, heritage preservation requirements, and economic limitations often restrict the extent of achievable upgrades. As studies of the Norwegian building stock show, the potential for energy improvement is strongly linked to construction age [37]. To reflect this variation, predefined buildings cohorts used to form retrofit scenarios. These cohorts were categorized according to construction period and the prevailing technical regulations at the time of construction.
The deep retrofit scenario, Scenario 3, assumed a more ambitious approach, applying comprehensive energy upgrades across the existing campus besides the planned new developments. Deep renovation can substantially improve energy performance. Evidence from different references shows that typically 60–85% of total floor area in district renovation projects can achieve efficient performance, with the rest constrained by structural or functional limitations [38,39,40].
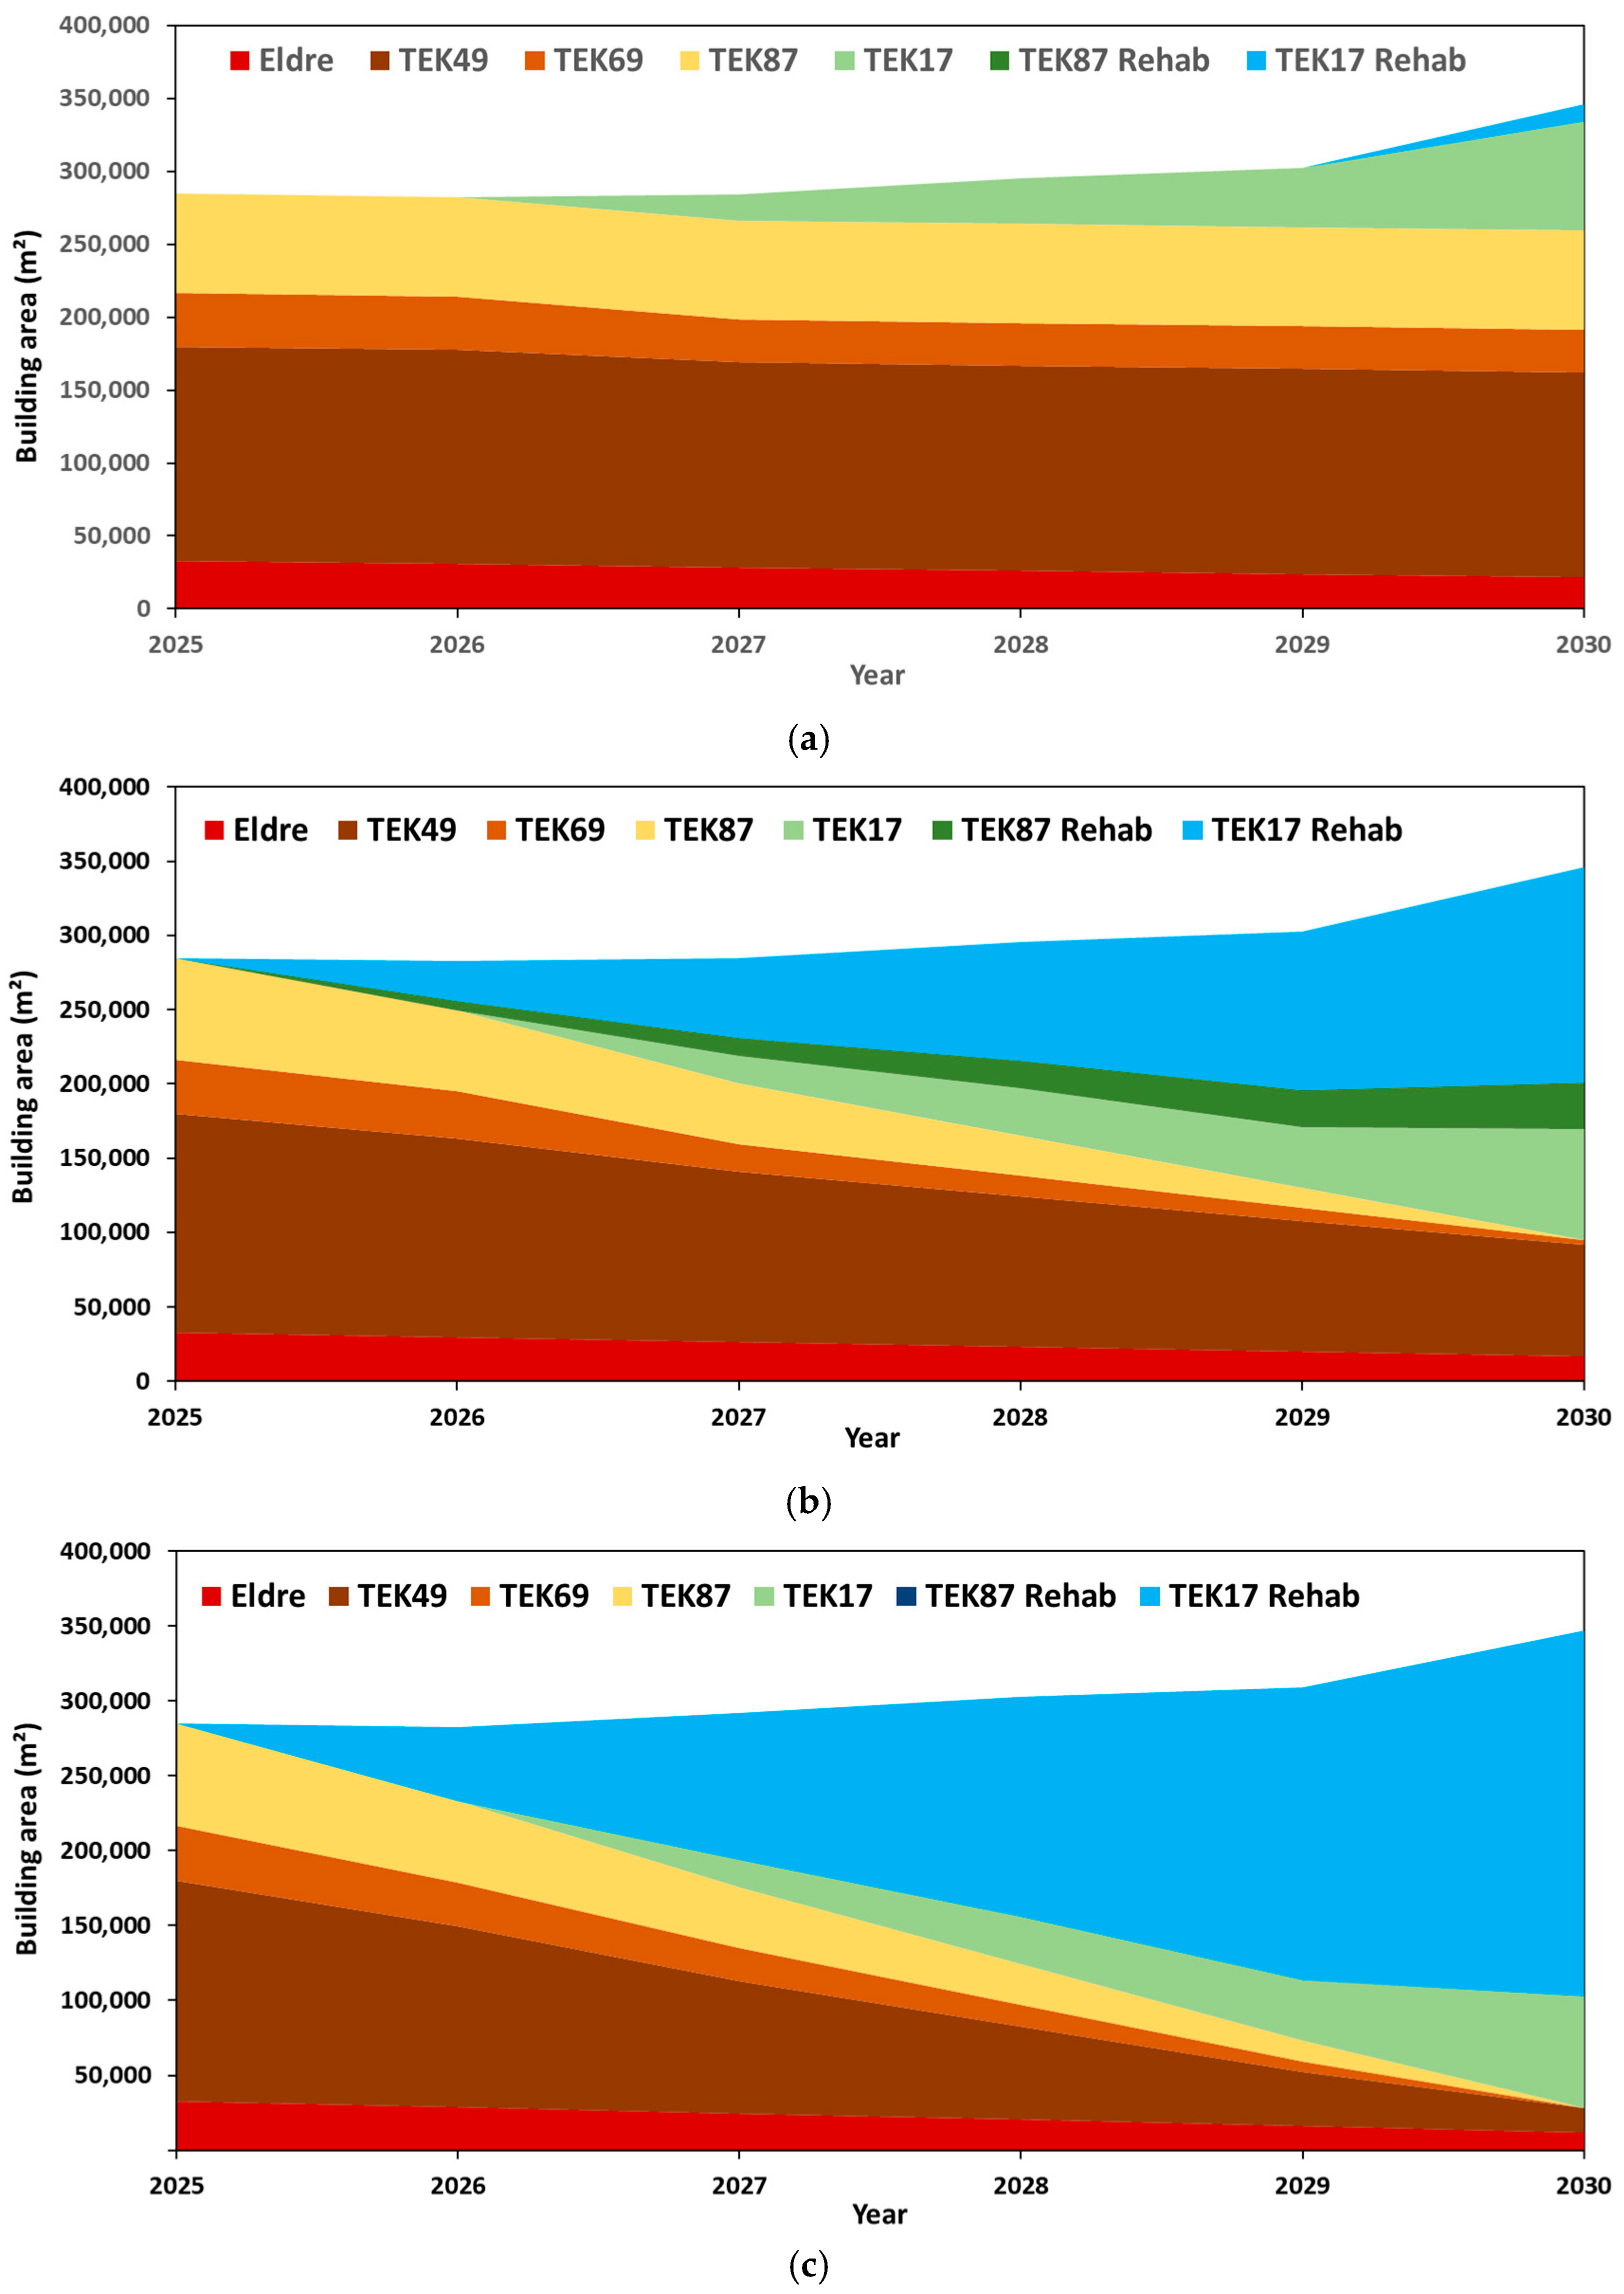
In this study, as summarized in Table 3, each cohort was assigned a set of six ECMs, forming distinct retrofit scenarios (Scenario 2 and 3). Together, these three scenarios allowed for a comparative assessment of how varying renovation depths influence the long-term energy path of the Gløshaugen campus and its progress toward becoming a PED. Implementing each of the proposed scenarios over a five-year period will gradually transform the energy performance of the campus, which currently reflects the building age distribution and the building codes in effect at the time of construction. Figure 4 illustrates how the composition of campus building typologies evolved under each energy efficiency strategy, showing the shift toward newer, higher-performance code levels achieved through renovation and new construction. The categories TEK87 Rehab and TEK17 Rehab indicate buildings that have undergone renovation to reach performance levels comparable to these later standards. In this context, TEK87 Rehab represents moderate retrofit interventions, where selected envelopes and system upgrades improve performance without fully meeting current code requirements. In contrast, TEK17 Rehab denotes deep renovation, where buildings are upgraded to align with the latest regulatory standards in terms of energy efficiency.
Table 4 presents typical thermal and ventilation performance values corresponding to various Norwegian building codes and historical construction periods [41]. These values were used in the modeling process where actual building-specific data were unavailable and served as reference parameters for upgrading buildings under different retrofit scenarios. The TEK regulations define Norway’s building performance requirements, including standards for insulation, ventilation, airtightness, and energy use. Although TEK covers many technical aspects, its increasingly strict energy requirements have been particularly influential in shaping the energy demand and efficiency of the national building stock [41].

2.4. Positive Energy District Evaluation

The PED evaluation in this study focused on assessing the heating and electricity demand of the Gløshaugen campus under each scenario introduced in Table 3. The analysis examined how different energy efficiency strategies transformed the total energy demand over time. The aim was to identify the conditions under which the campus could feasibly achieve a positive annual energy balance if supplied by locally available renewable resources. The evaluation was based on the annual energy outputs from the calibrated MBEM, aggregated for each scenario across the 5-year simulation horizon. To assess the campus’s potential to operate as a PED, several indicators were used. These indicators quantified changes in thermal and electrical demand and evaluated the gap with renewable production potential. These indicators are as follows:
Delivered energy: The total annual energy supplied to campus buildings, separated into electricity ( E e l ) and heating ( E h ). It represents the baseline metric for demand comparison between scenarios.
Specific energy use (SEU): The total annual delivered energy normalized by conditioned floor area ( A c o n )
S E U = E e l + E h A c o n
Potential renewable coverage index (PRCI): Represents the theoretical share of total energy demand that could be supplied by feasible on-site renewables ( E r e s ).
P R C I = E r e s E e l + E h
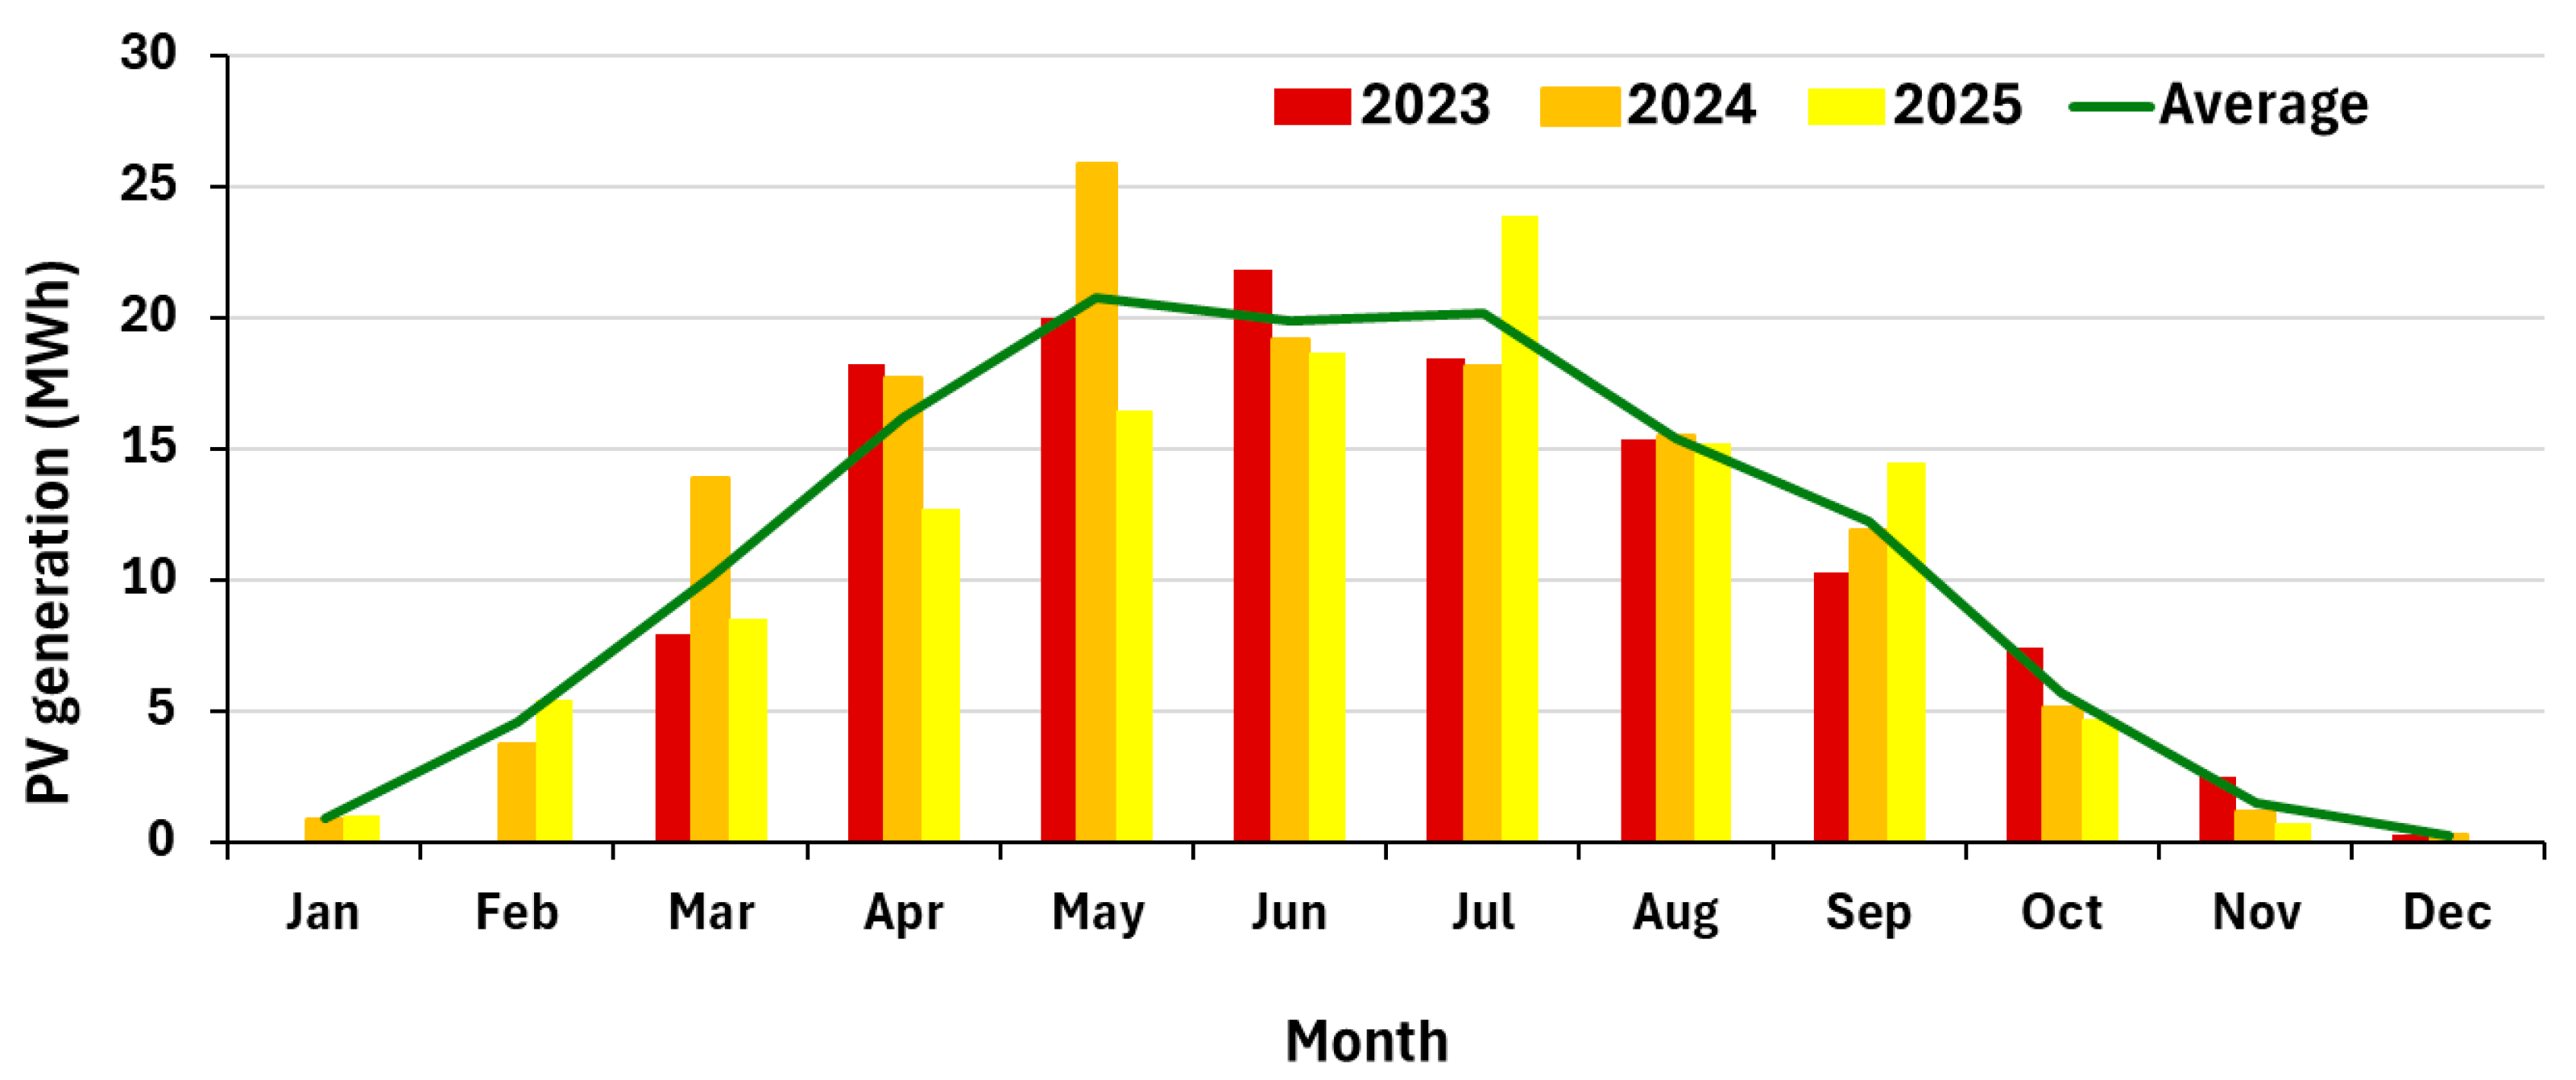
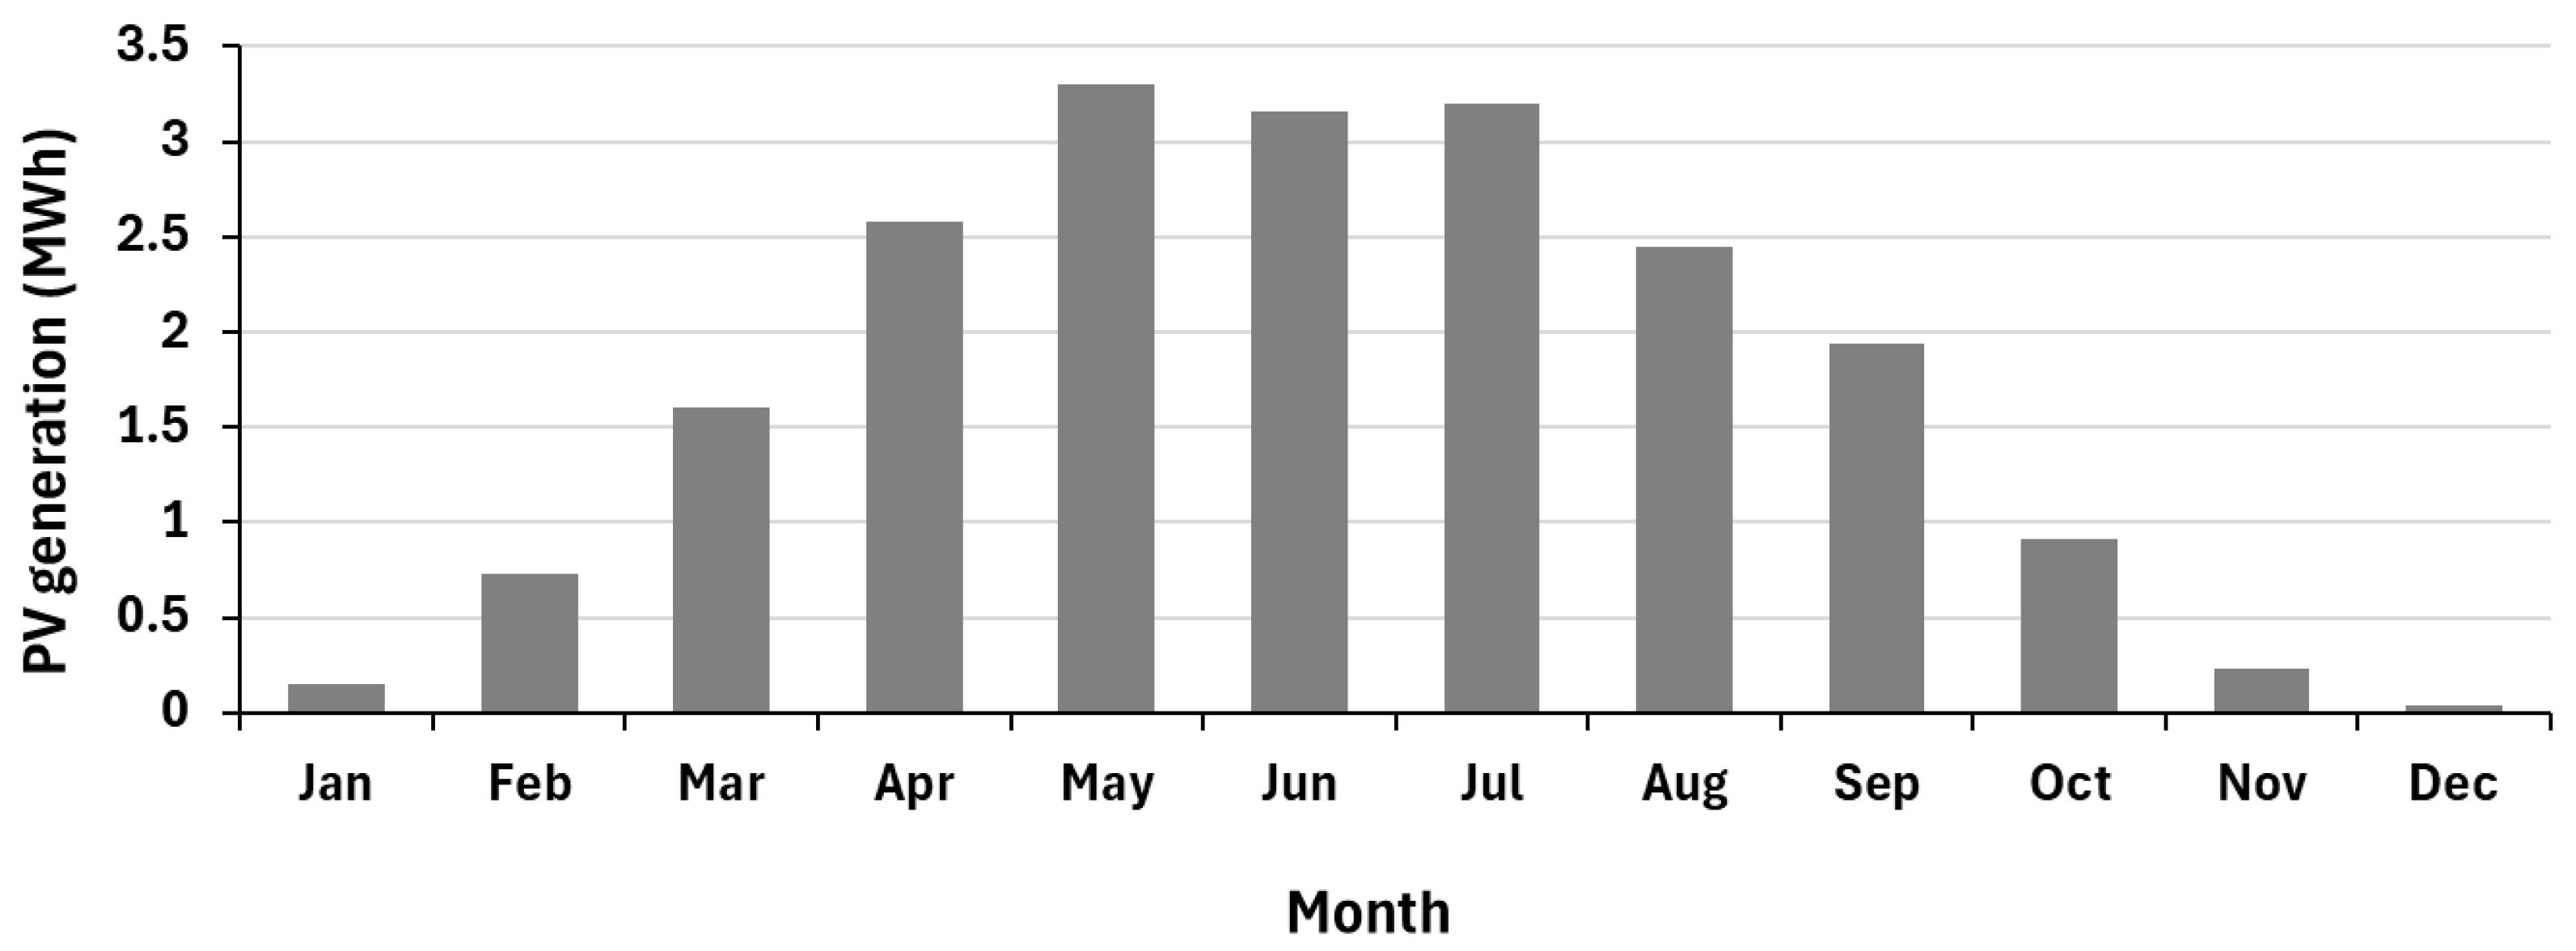
To estimate the potential for on-site renewable electricity generation, data from an existing campus case study was used as a reference for the entire area. The ZEB Laboratory building, located on the Gløshaugen campus, is equipped with a photovoltaic (PV) system comprising 456 m2 of roof-mounted panels, 433 m2 of façade-integrated vertical panels, and 74 m2 of ground-mounted panels, with a total installed capacity of 184 kWp [42]. Figure 5 presents the monthly electricity production of this system for the period 2023–2025. The average annual generation over these three years was used in this study to estimate the potential PV electricity production for the entire campus.
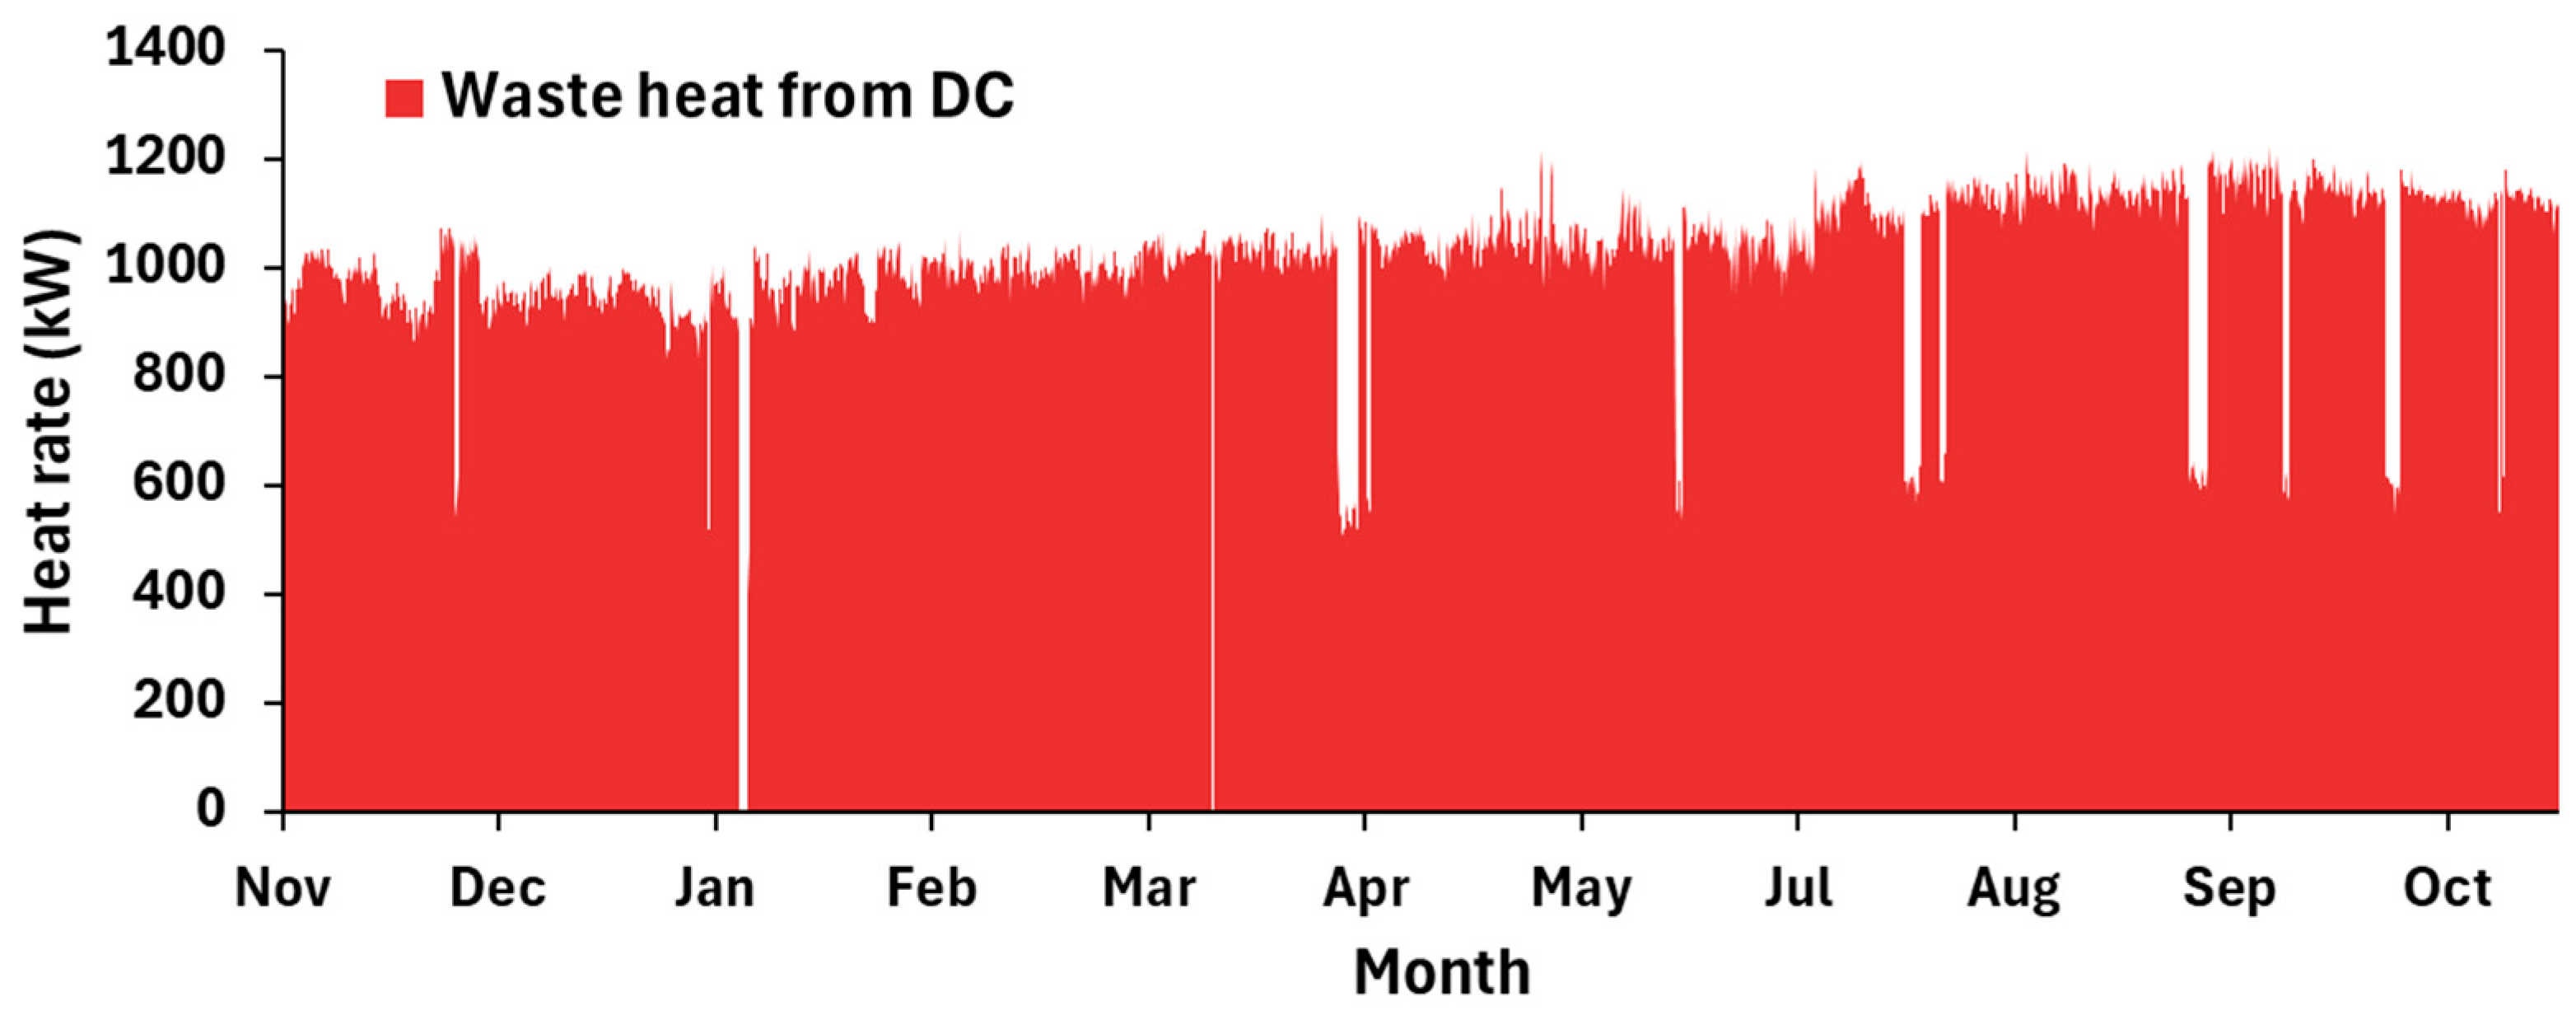
Waste heat from the campus data center (DC) also represents a valuable local energy source that can contribute to meeting a portion of the campus heating demand. As illustrated in Figure 6, DC provided a nearly constant thermal output of approximately 1 MW, corresponding to an annual heat recovery potential of about 8.51 GWh. This recovered heat can be integrated into the campus heating network, reducing the need for externally supplied energy and supporting future PED operation.

3. Results

This section presents the results obtained from the calibration and validation of the MBEM for buildings on the Gløshaugen campus case study. Additionally, it includes the outcomes of the energy retrofit scenarios and their impact on the building’s energy performance. First, the energy demand of individual building cohorts was analyzed to evaluate the impact of specific ECMs under moderate and deep retrofit scenarios. The results were then aggregated at the campus level to examine changes in total energy use and ESU across the three defined scenarios. Finally, the potential contribution of local and renewable energy sources was assessed to explore the campus’s progression toward PED conditions.

3.1. Model Validation

The performance of the MBEM was evaluated by comparing simulated results with measured historical energy data obtained from the campus online monitoring system and utility records. The validation dataset covered a representative historical period of operation, including both heating and electricity use, and was analyzed at hourly and monthly temporal resolutions. Two standard statistical indicators were applied, NMBE and CV(RMSE). The evaluation was performed for all four building cohorts at both hourly and monthly temporal resolutions, as summarized in Table 5 and Table 6. These measured datasets were not used during the calibration process and therefore provided an independent basis for evaluating model performance. The results demonstrated that the calibrated model provided a reliable representation of actual energy use patterns. The calculated values of NMBE and CV(RMSE) fall within the acceptable thresholds specified by ASHRAE Guideline 14, namely ±5% and 15% for monthly data and ±10% and 30% for hourly data, respectively. At the monthly level, the model showed strong agreement with the measured data for both electricity and heat demand, indicating that the key characteristics of building performance were well captured. While some deviations were observed at the hourly resolution, reflecting the natural variability in short-term energy dynamics, the model still replicated overall trends and patterns with reasonable accuracy.
Overall, the validation confirmed that the calibration process improved the model’s ability to represent real-world performance across a diverse building stock. The MBEM is therefore considered sufficiently accurate to serve as a foundation for the analysis of energy retrofit scenarios and broader energy planning at the district level.

3.2. Energy Retrofit Scenarios

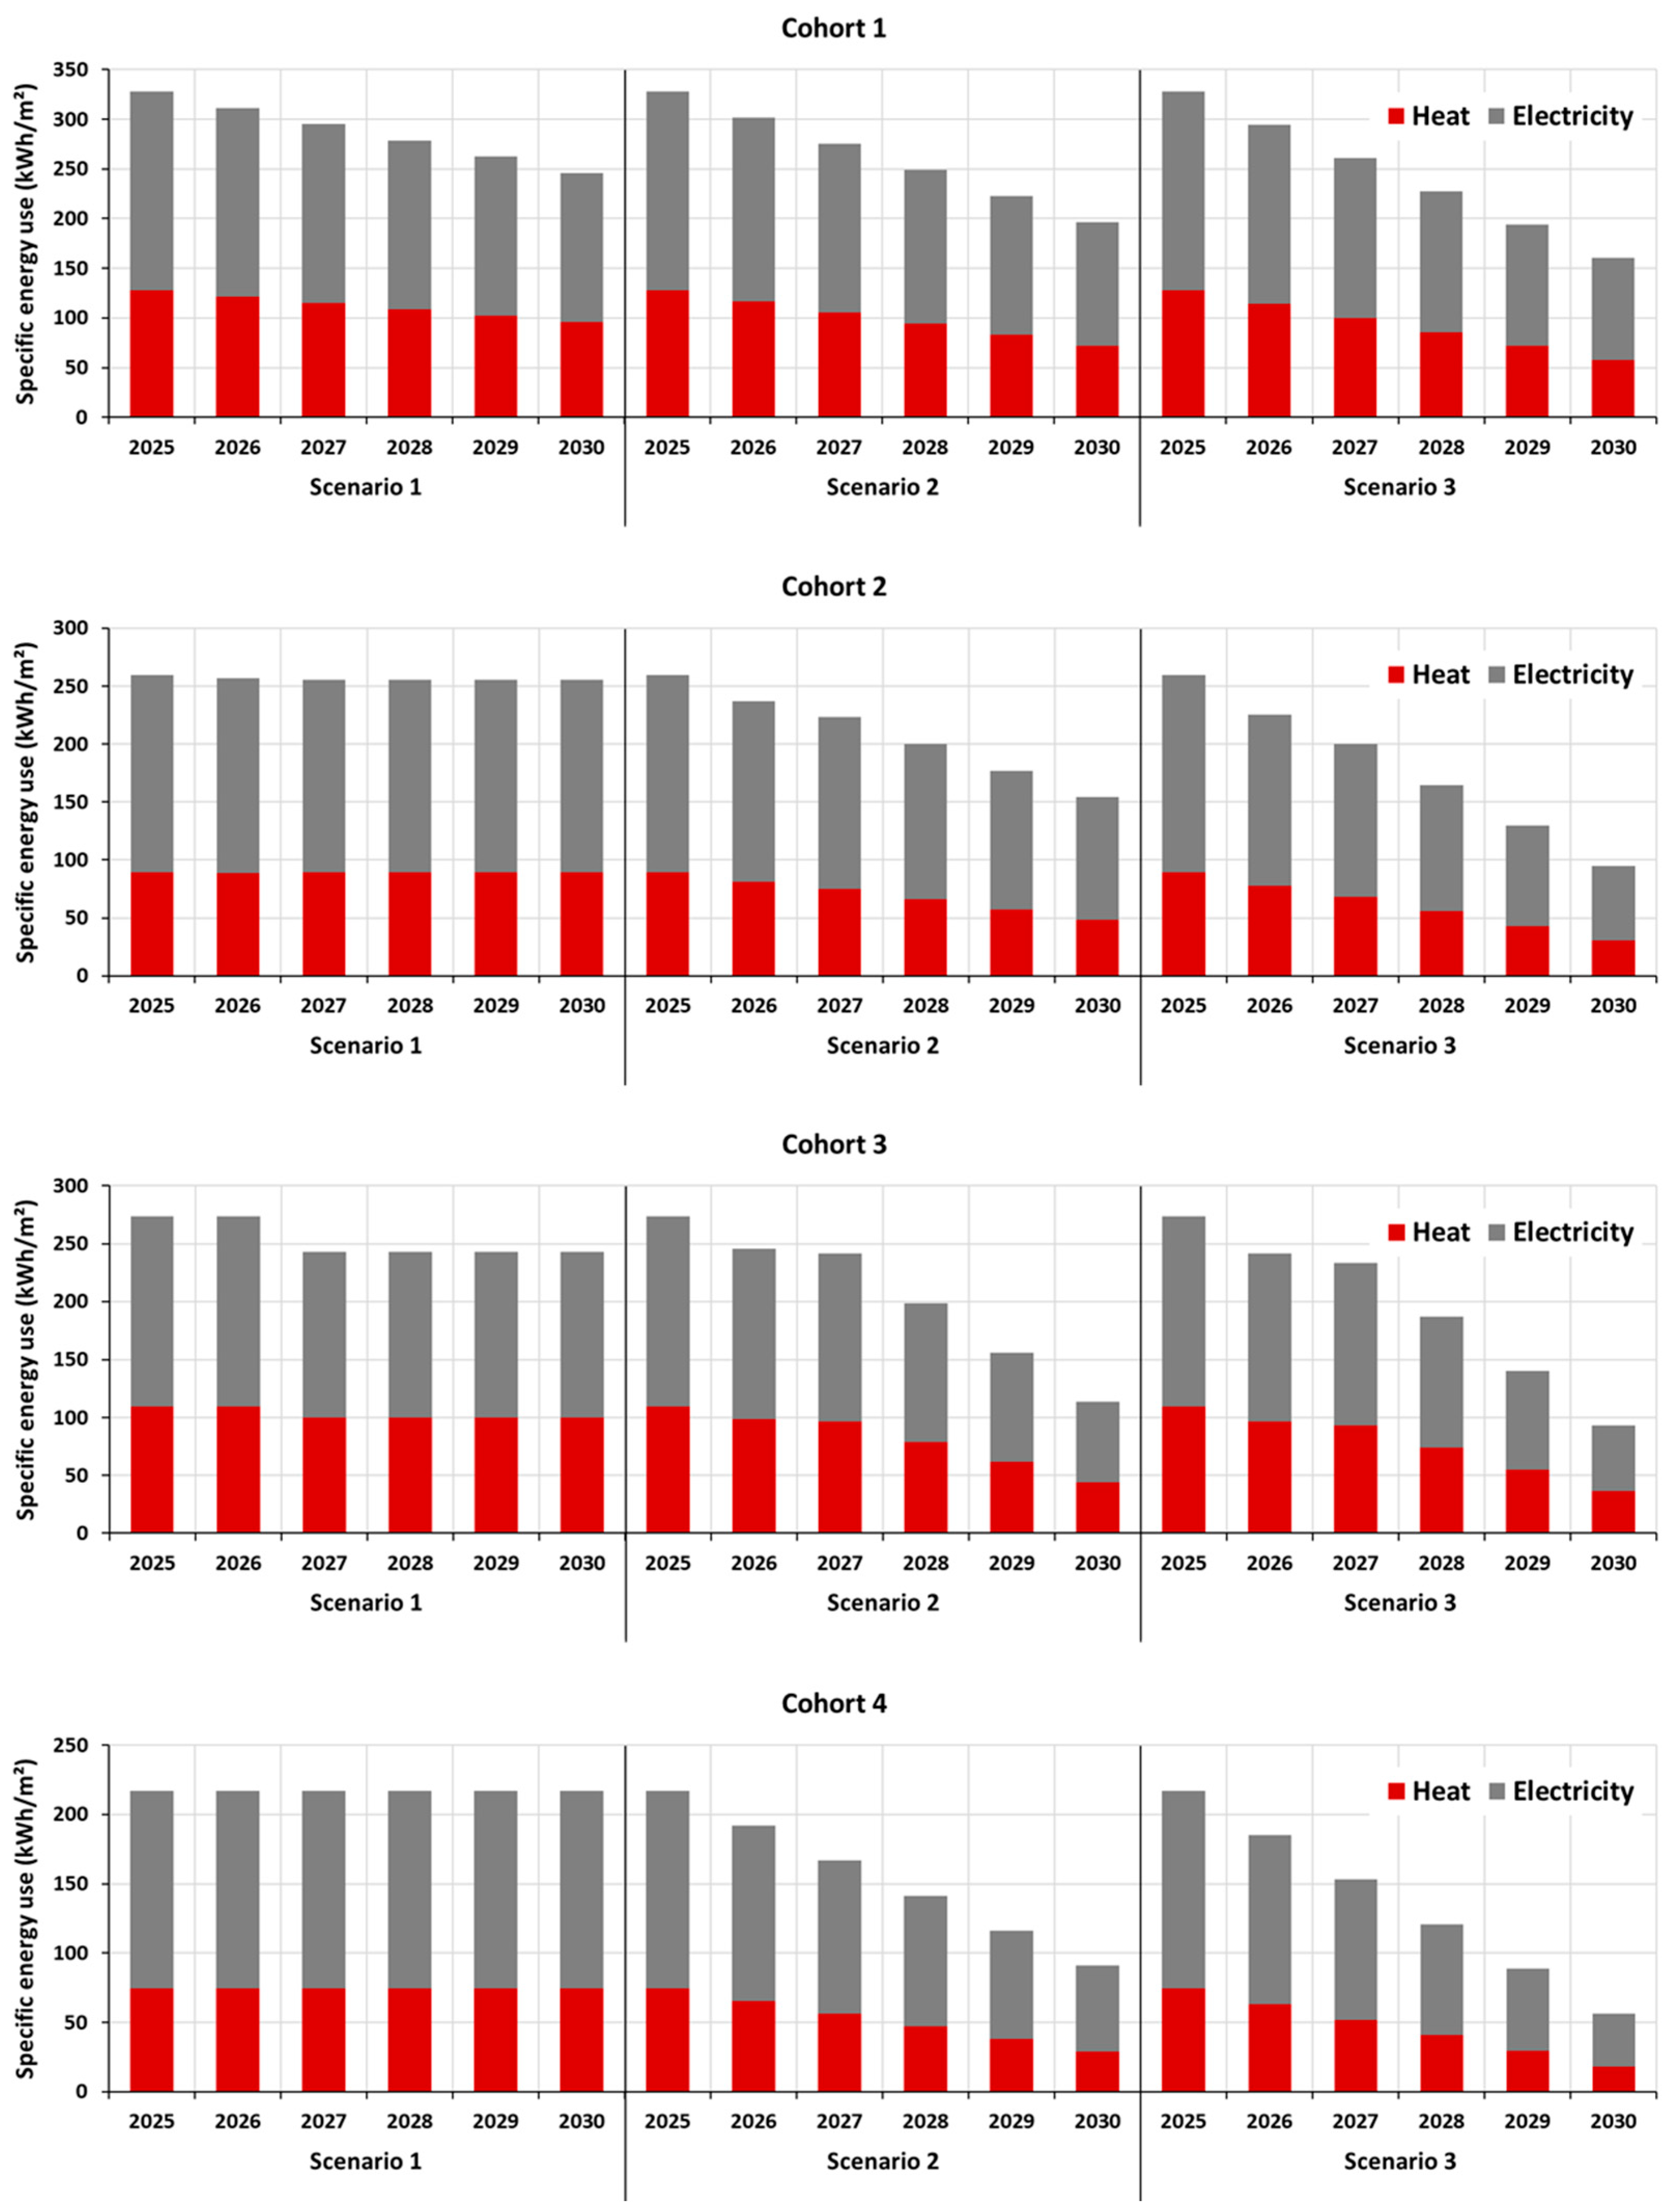
For the evaluation of the energy retrofit scenarios, the MBEM was applied over a six-year period, using 2025 as the baseline and 2026–2030 as the implementation phase. The analysis was conducted separately for each building cohort to highlight the energy saving potential of different construction groups under the defined efficiency scenarios. Figure 7 presents the annual specific heating and electricity use (kWh/m2) for each cohort across the three developed scenarios, illustrating the impact of the proposed retrofit strategies.
From Figure 7, the results showed a decrease in total energy use across all cohorts as efficiency measures were introduced. In Scenario 1, changes were limited to actions already included in the campus development plan which were mainly the demolition of few buildings in Cohort 3 and the partial renovation of Cohort 1. These modifications explained the slight reductions in energy use for these cohorts over time, while energy demand in the others remained mostly unchanged. In Scenario 2, moderate retrofits led to gradual decreases in both heating and electricity use across all cohorts. The largest reductions occurred in Scenario 3, where deep retrofit measures produced a considerable drop in energy demand. As expected, older buildings (Cohorts 1 and 2) showed the greatest improvement potential, while newer ones (Cohort 4) displayed smaller but still meaningful reductions.
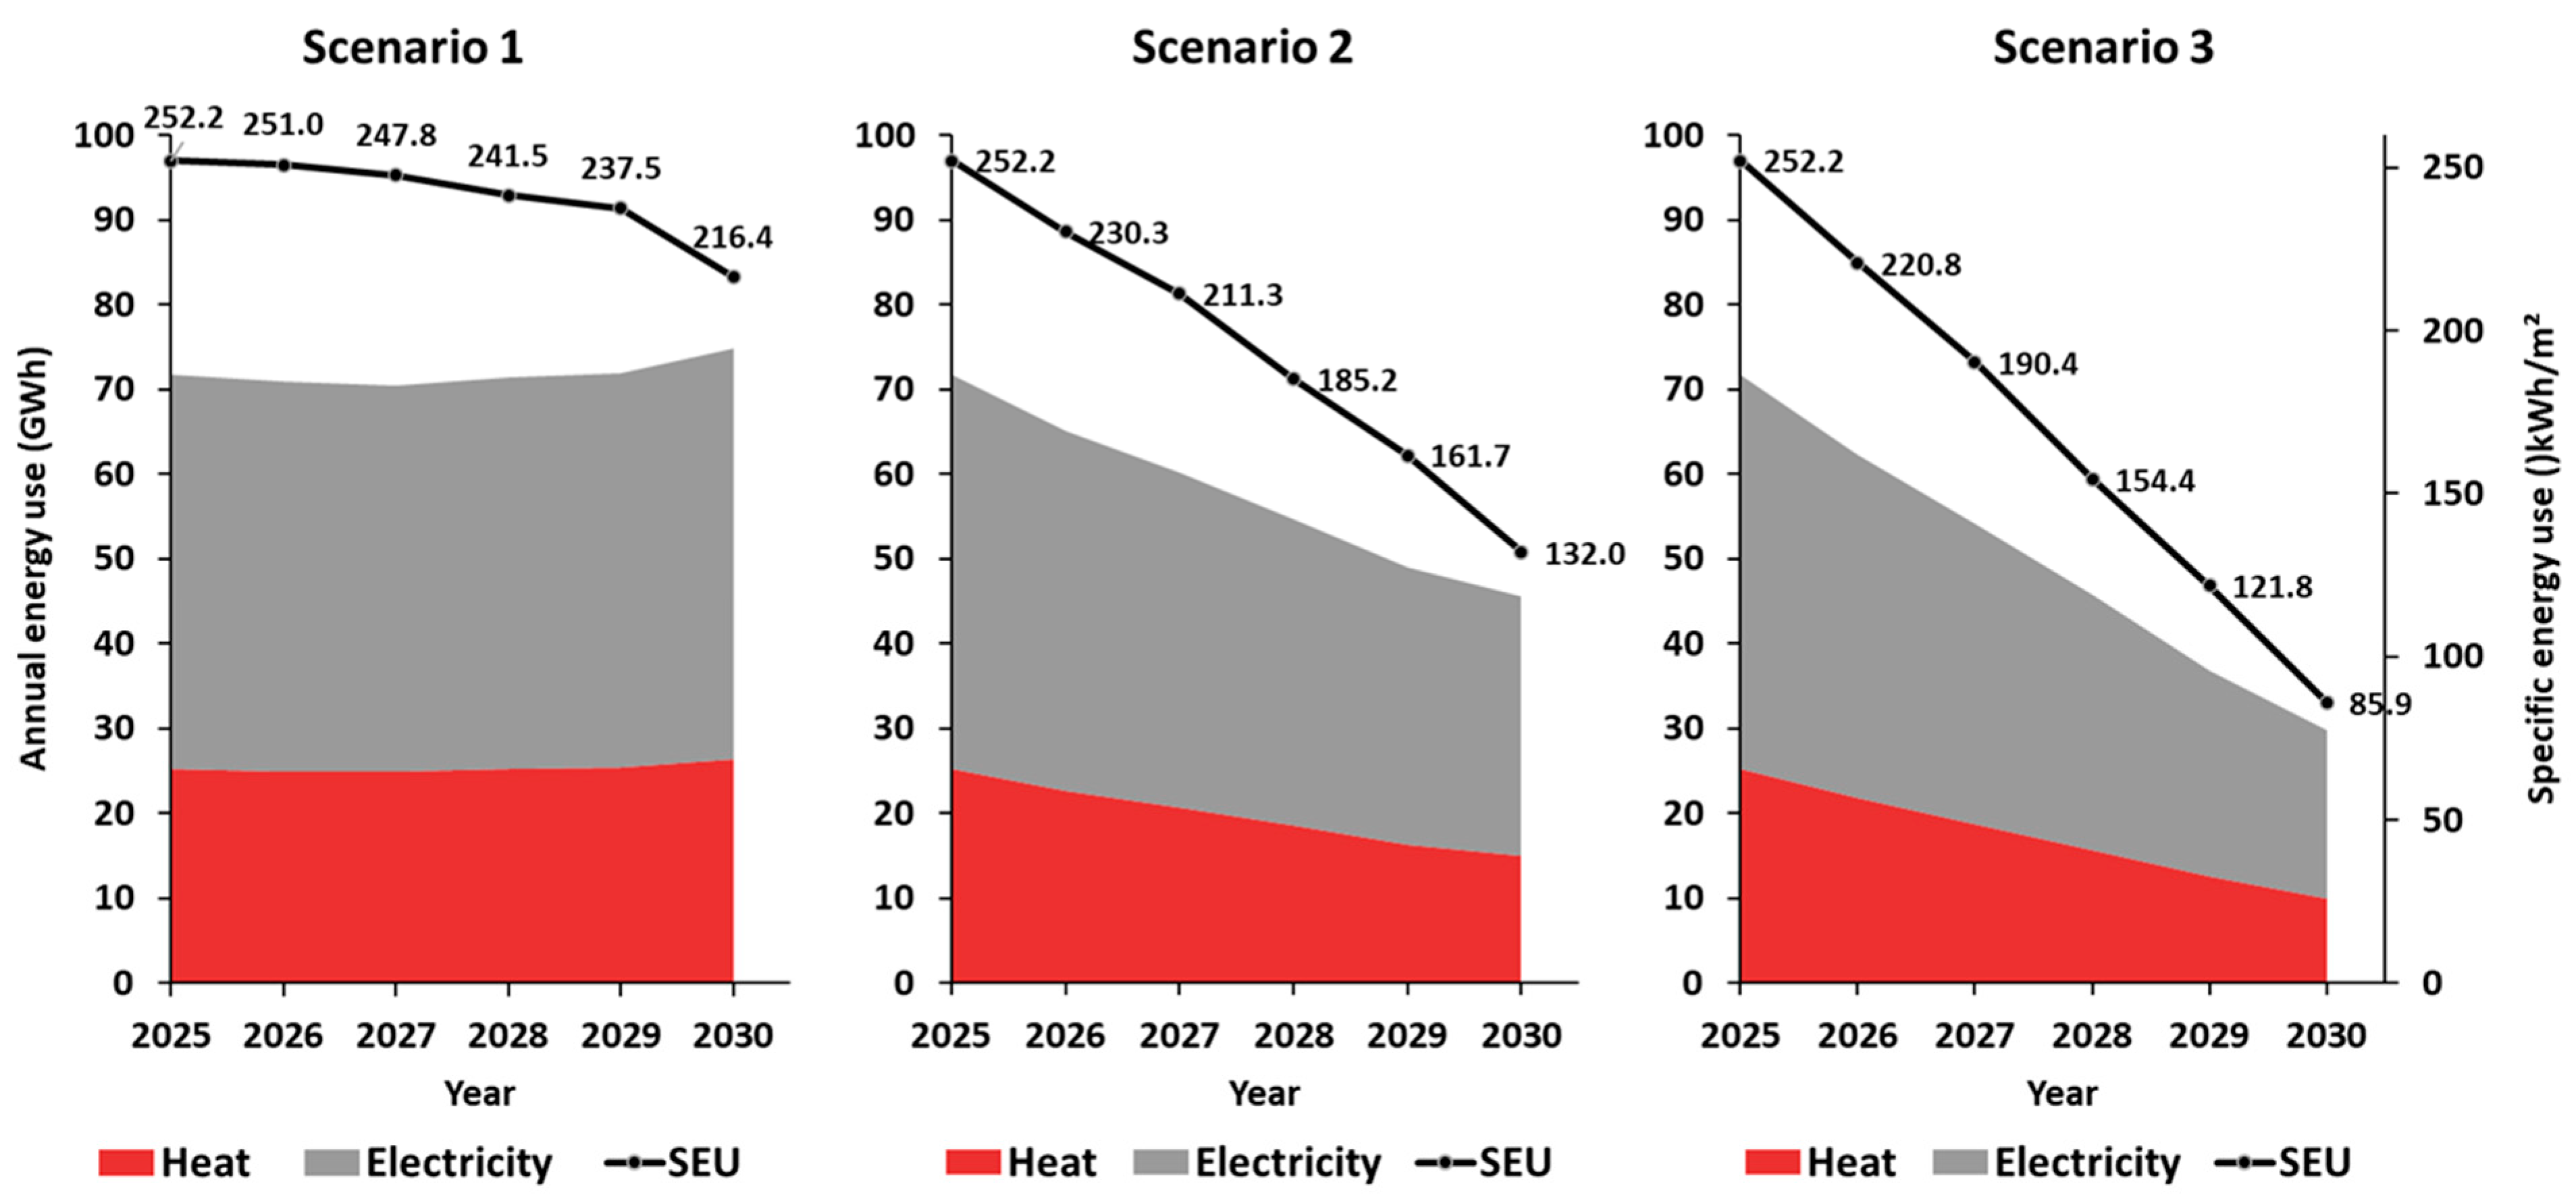
Figure 8 presents the results for the entire campus, including the new constructions introduced through the campus development plan, represented as Cohort 5, see Figure 4. In Scenario 1, where no major retrofits were applied, total campus energy use gradually increased toward 2030 because of the addition of new buildings. However, the SEU decreased from 252.2 kWh/m2 in 2025 to 216.4 kWh/m2 in 2030, reflecting the positive effect of energy-efficient new constructions built to the latest building codes. In Scenario 2, which included moderate retrofit measures, both heating and electricity demand declined steadily across the campus. As a result, SEU dropped from 252.2 kWh/m2 to 161.7 kWh/m2, corresponding to a 36% reduction by 2030. The most significant improvement occurred in Scenario 3, where deep retrofit measures are implemented. Here, the combined effect of envelope upgrades, window replacement, and system optimization led to a sharp decrease in total energy use, with SEU falling from 252.2 kWh/m2 in 2025 to just 85.9 kWh/m2 in 2030 with a 66% overall reduction. These results revealed the progressive impact of retrofit depth on improving campus-wide energy performance and moving the district closer to PED conditions.
The evaluation of individual ECMs was conducted for building cohorts 1, 2, 3, and 4 under the moderate and deep retrofit strategies (Scenarios 2 and 3) is shown in Table 7 and Table 8, respectively. For each scenario, the SEU of each cohort was first calculated for the year 2025, establishing a baseline for comparison. The SEU after full implementation of each ECM was then determined for the year 2030. This comparison illustrated the impact of each measure on energy savings across the different building cohorts. These energy savings, derived from reductions in both heat and electricity demand, were used to evaluate the relative effectiveness of each individual measure.
Baseline SEU varied much between the cohorts, reflecting differences in construction period, building envelope quality, and ventilation systems. Cohort 1, which represents the oldest buildings, had the highest baseline energy use at 327.9 kWh/m2, while Cohort 4, representing the most recent constructions, had the lowest at 217.1 kWh/m2. These variations were consistent with expectations, as older buildings generally indicate poorer insulation, lower heat recovery efficiency, and higher infiltration rates.
As shown in Table 7 for Scenario 2, among the evaluated measures, ECM 4 consistently achieved the highest energy savings across all the building cohorts, with relative reductions ranging from approximately 11% to 15%. This indicated that the window replacement (ECM 4) addressed core inefficiencies, and it was particularly effective regardless of building age. ECMs 1 and 6 also had a notable impact, contributing savings between 6% and 13% in most buildings.
Table 8 shows the results for scenario 3, and similarly across all cohorts, ECM 4 (window replacement) achieved the highest energy savings, with reductions ranging from 23% to 35%. Overall, measures targeting building envelopes proved most effective in reducing SEU, particularly in older cohorts with lower baseline efficiency.
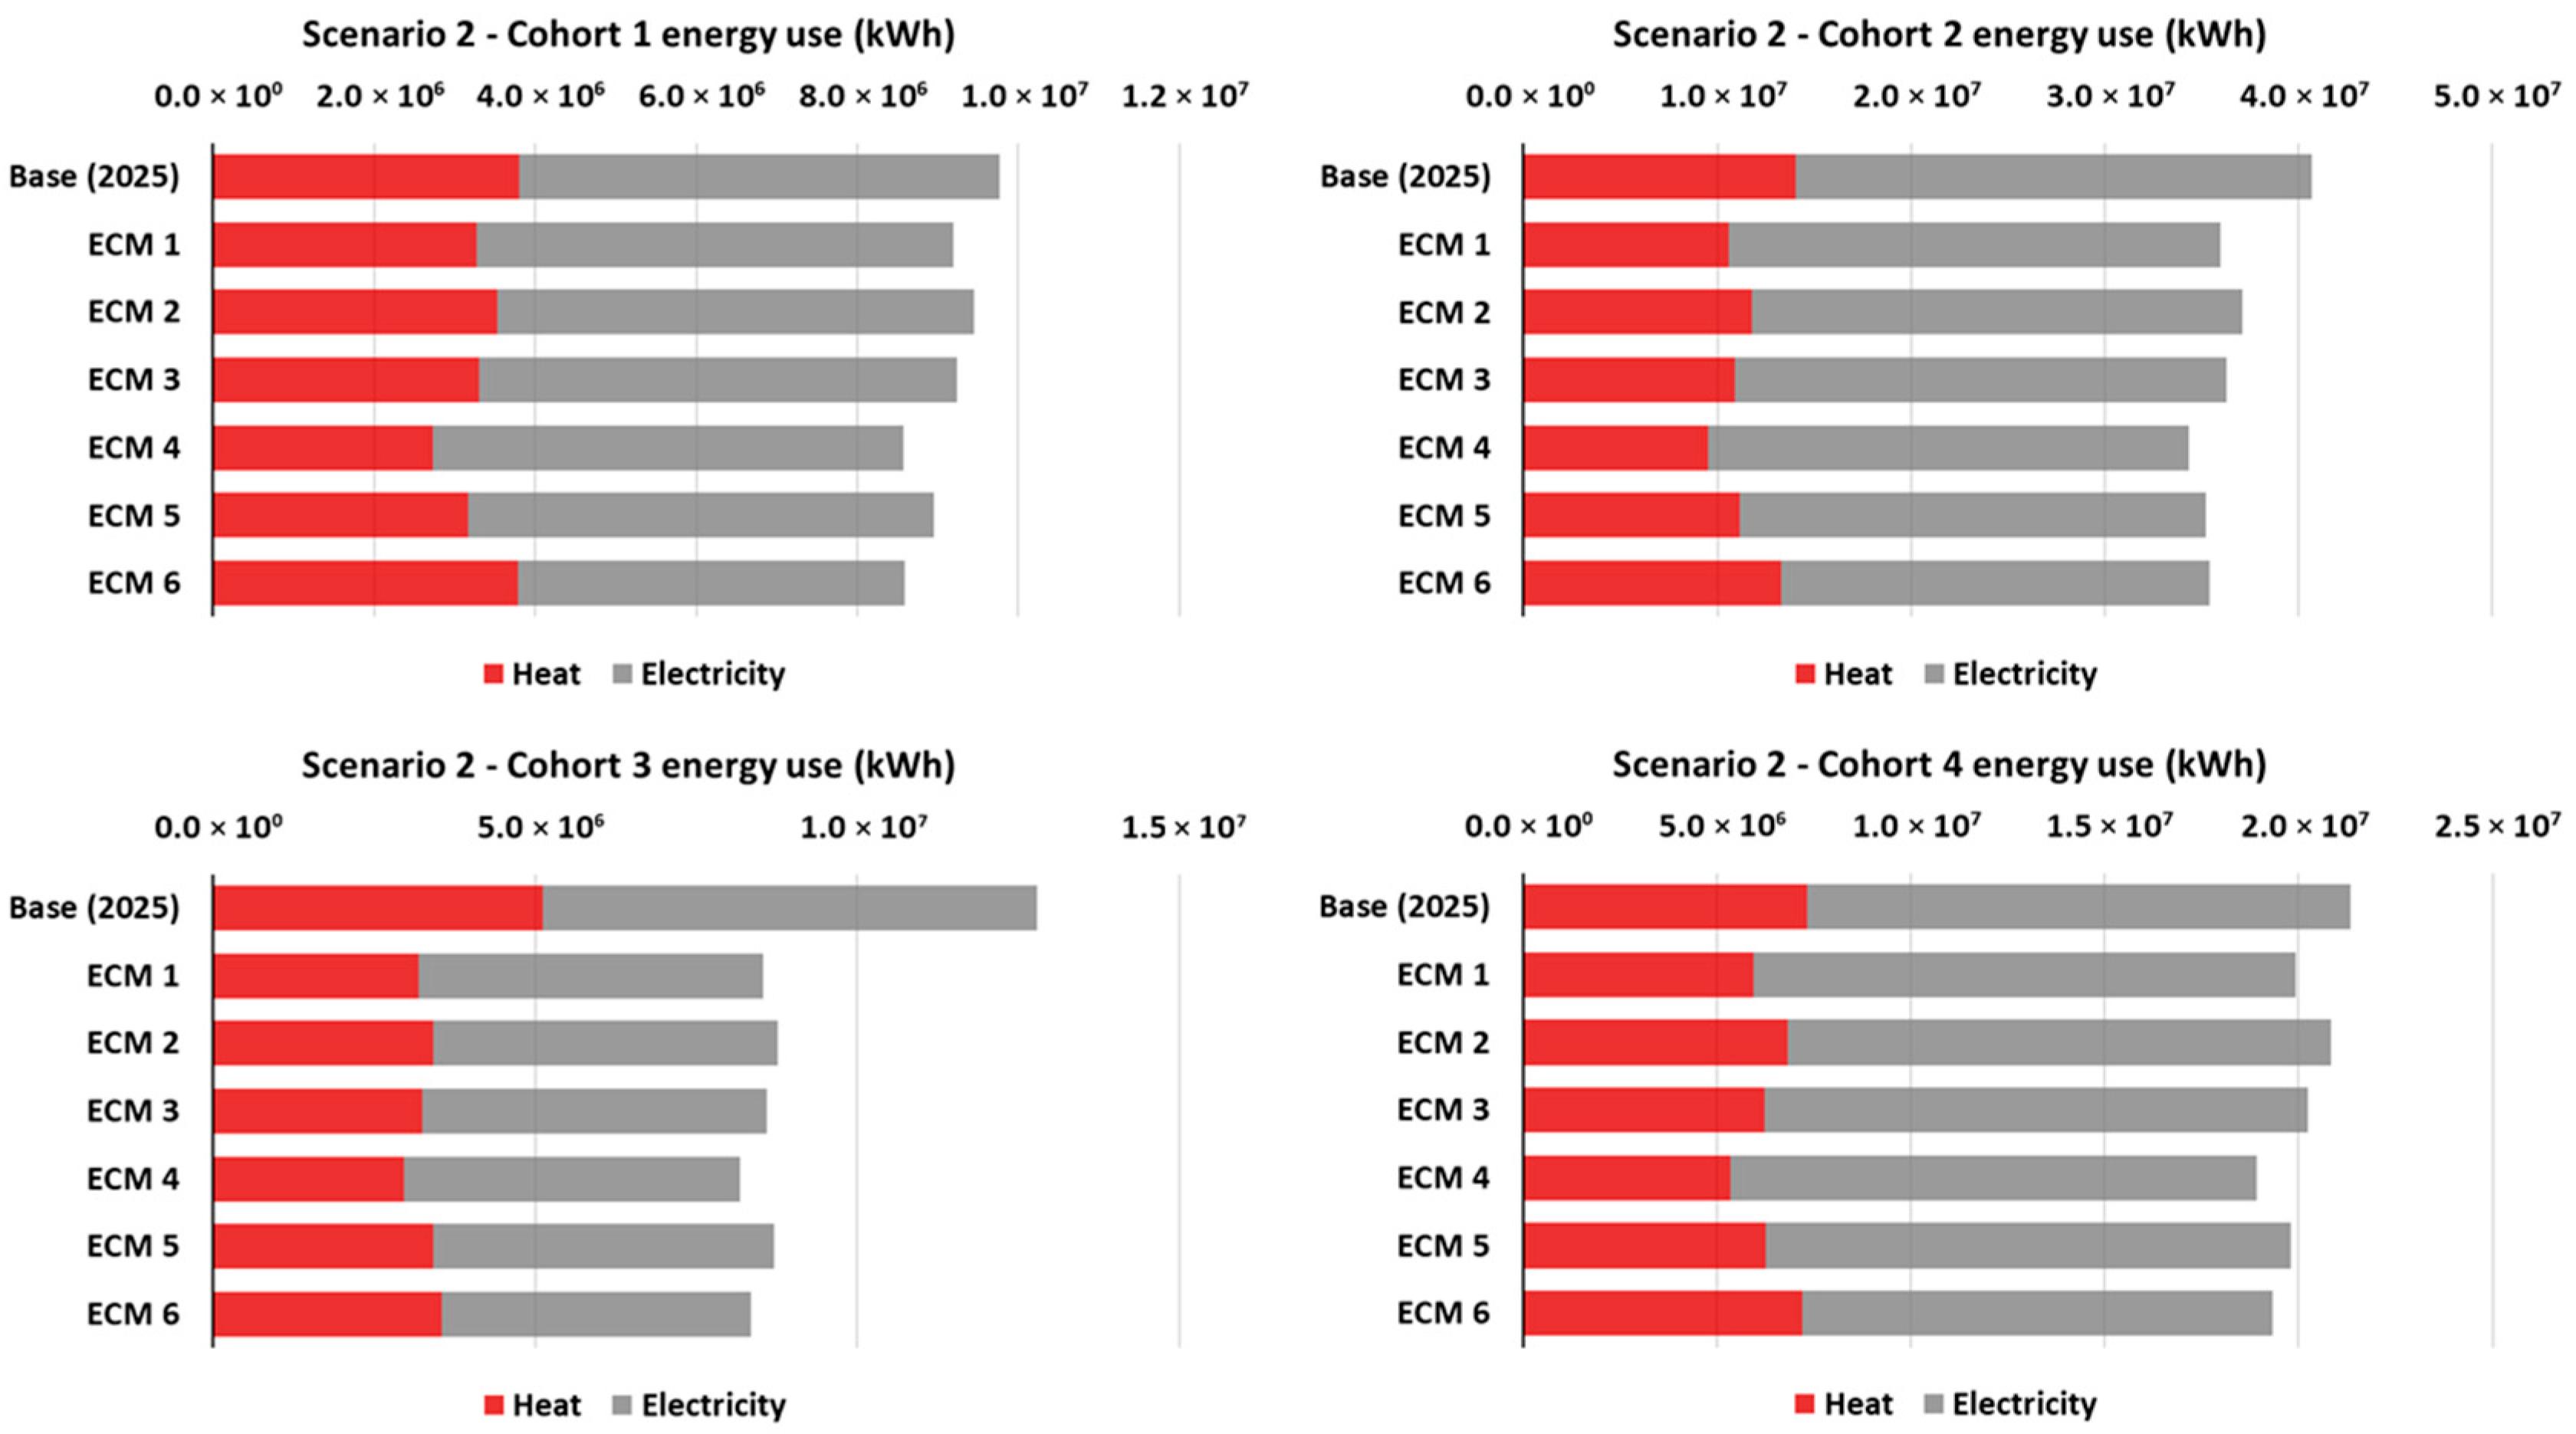
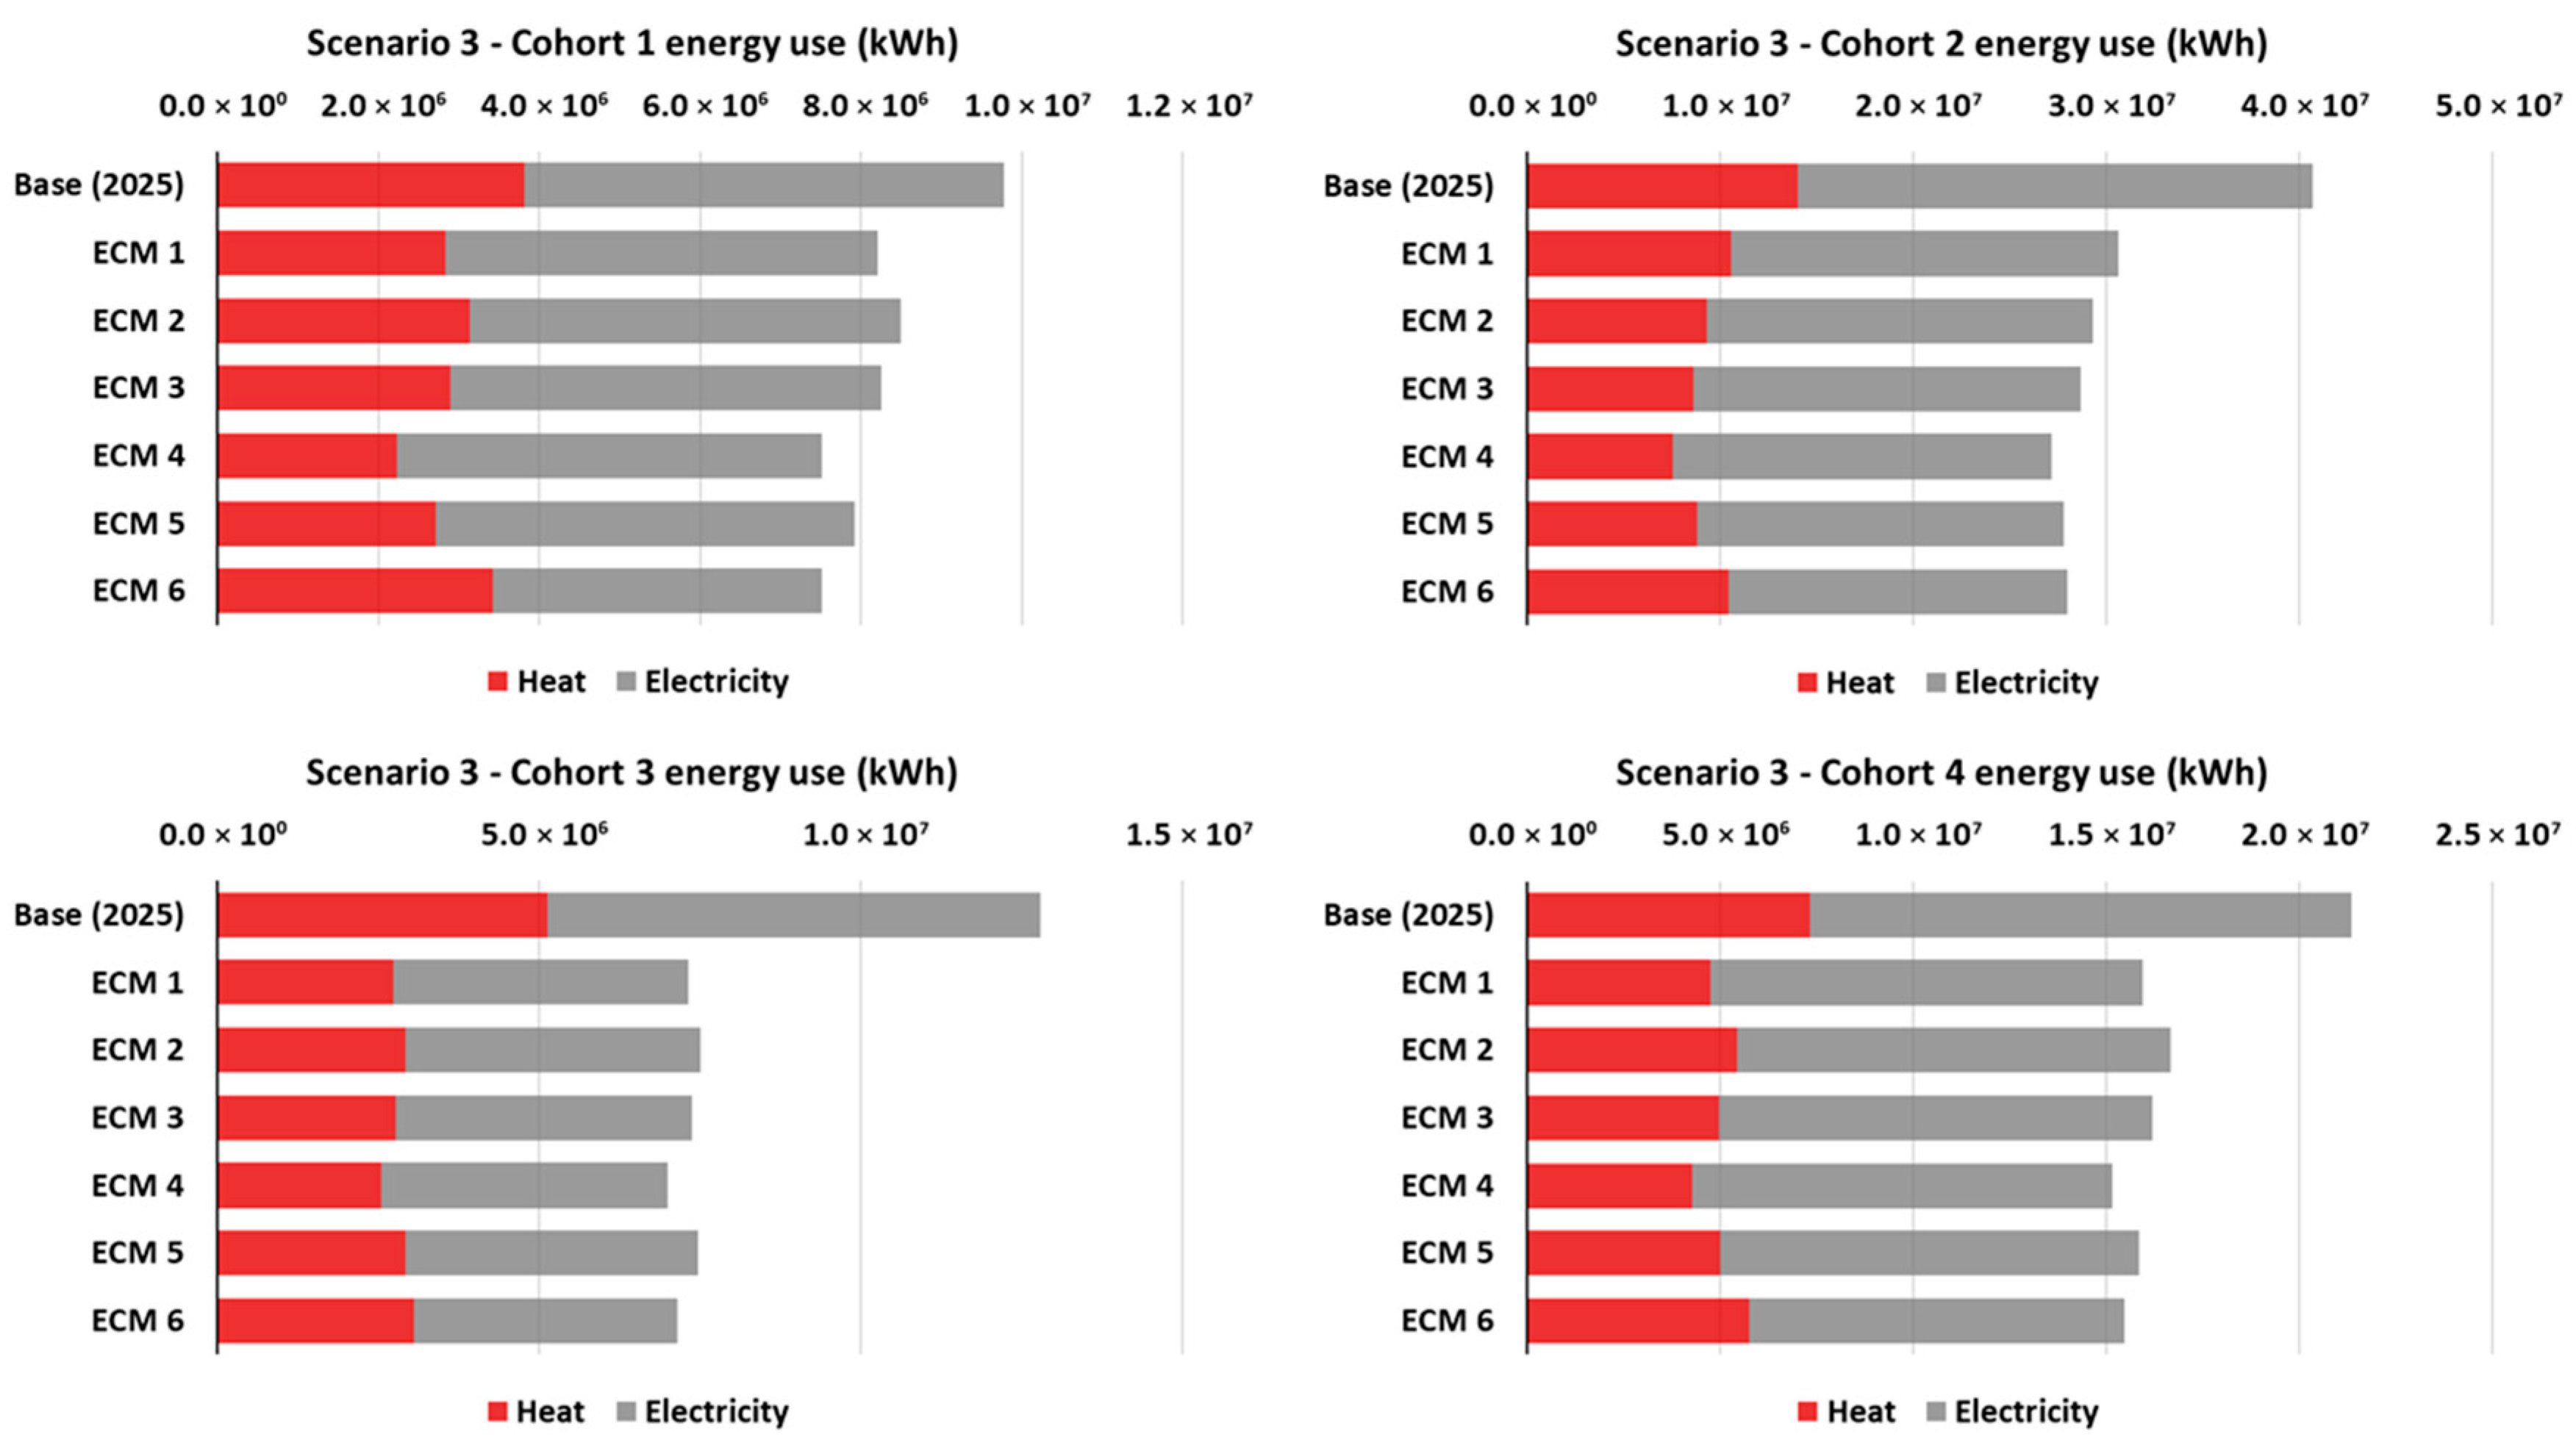
Figure 9 and Figure 10 illustrate the heat and electricity use for each building cohort in the base case and under two retrofit strategies after the implementation period. The results showed a consistent reduction in total energy use across both scenarios, with varying impacts depending on the specific ECM and cohort. ECMs 1 to 5 primarily contributed to a reduction in heat demand, since these measures targeted thermal properties of the building envelope and heating system efficiency. In contrast, electricity demand reductions were more strongly associated with ECMs 4 to 6, because these measures influenced ventilation systems. A notable difference was observed between the baseline and ECM results for Cohort 3 in both scenarios. This significant reduction in energy use was partly attributed to the demolition of few buildings within this cohort during the renovation process, in addition to the effects of the implemented ECMs.
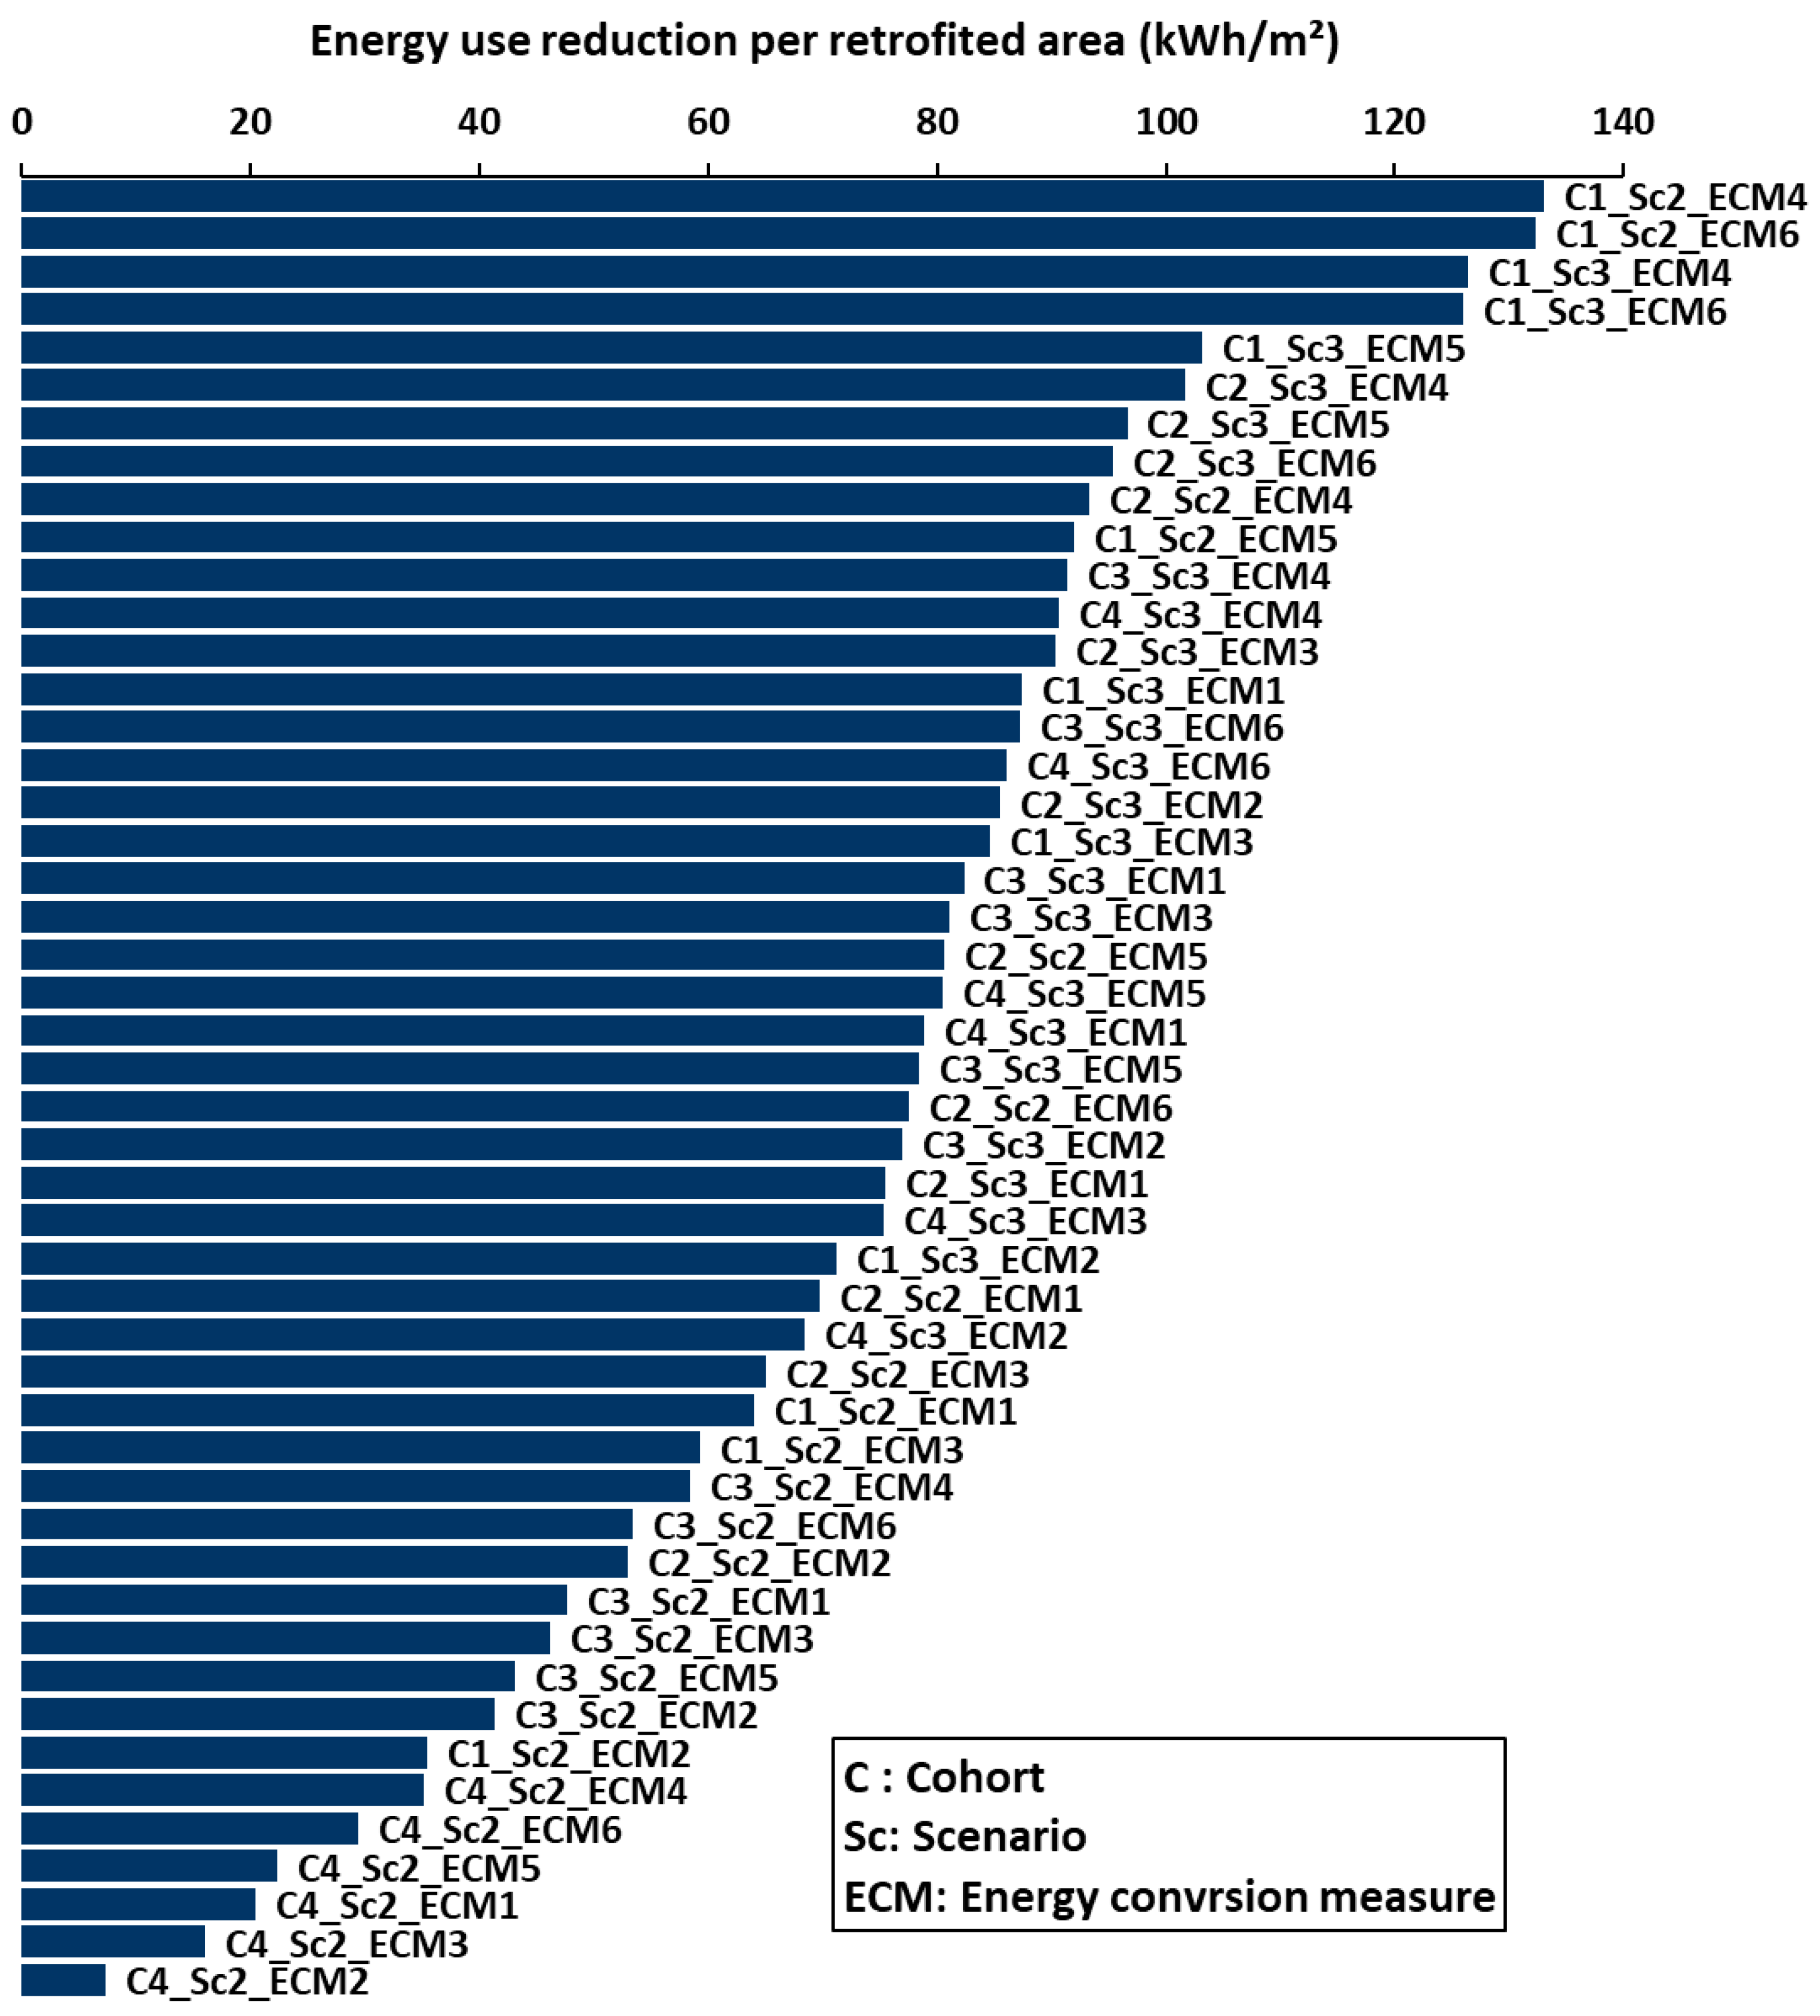
To provide a clearer understanding of each ECM effectiveness across different building cohorts, the energy use reduction per m2 of retrofitted floor area was used as a comparative indicator. This approach enabled direct comparison of energy savings between cohorts and retrofit strategies, regardless of building size. Figure 11 presents the results, showing that Cohort 1, comprising older buildings, achieved the highest energy reduction potential, exceeding 130 kWh/m2 for ECM 4 (window replacement) and ECM 6 (SFP improvement). Cohort 2 also demonstrates considerable savings, particularly under the deep retrofit scenario, while Cohorts 3 and 4 showed more moderate reductions consistent with their higher baseline efficiency.
From a policy and planning perspective, the indicator of energy-use reduction per retrofitted floor area provides a practical basis for decision support. Unlike absolute energy savings, this metric enables a normalized comparison of retrofit effectiveness across building cohorts with different sizes and baseline performance levels. It therefore supports prioritization of renovation actions under capacity-constrained conditions, such as limited annual renovation rates or phased implementation strategies commonly encountered in public sector and campus-scale projects. The results shown in Figure 11 indicate that retrofits applied to older cohorts yield substantially higher energy reductions per unit of renovated area, suggesting that targeting these buildings first can accelerate progress toward energy-efficiency and PED-related policy objectives.

3.3. Positive Energy District Evaluation

In evaluating the potential of the Gløshaugen campus to operate as a PED, heating and electricity demand analyzed under different retrofit scenarios to determine how energy efficiency improvements influence the overall energy balance and the feasibility of achieving PED conditions. In this study, instead of directly modeling of the renewable generation, the analysis emphasized the demand side, identifying the extent to which reductions in energy use could allow future renewable systems to offset remaining loads. The evaluation also used key performance indicators, including SEU and PRCI, to quantify the district’s progress toward energy positivity. These indicators provide a consistent basis for comparing scenarios, and new developments on the campus’s long-term transition toward a PED.
To estimate the campus’s potential for on-site electricity generation, the average PV output provided in Section 2.4 was extrapolated to represent all campus buildings. It was assumed that 90% of available roof area and 60% of façade area could be equipped with PV panels. This approach provided an estimate of the overall solar generation capacity across the campus. Figure 12 illustrates the monthly electricity production potential.
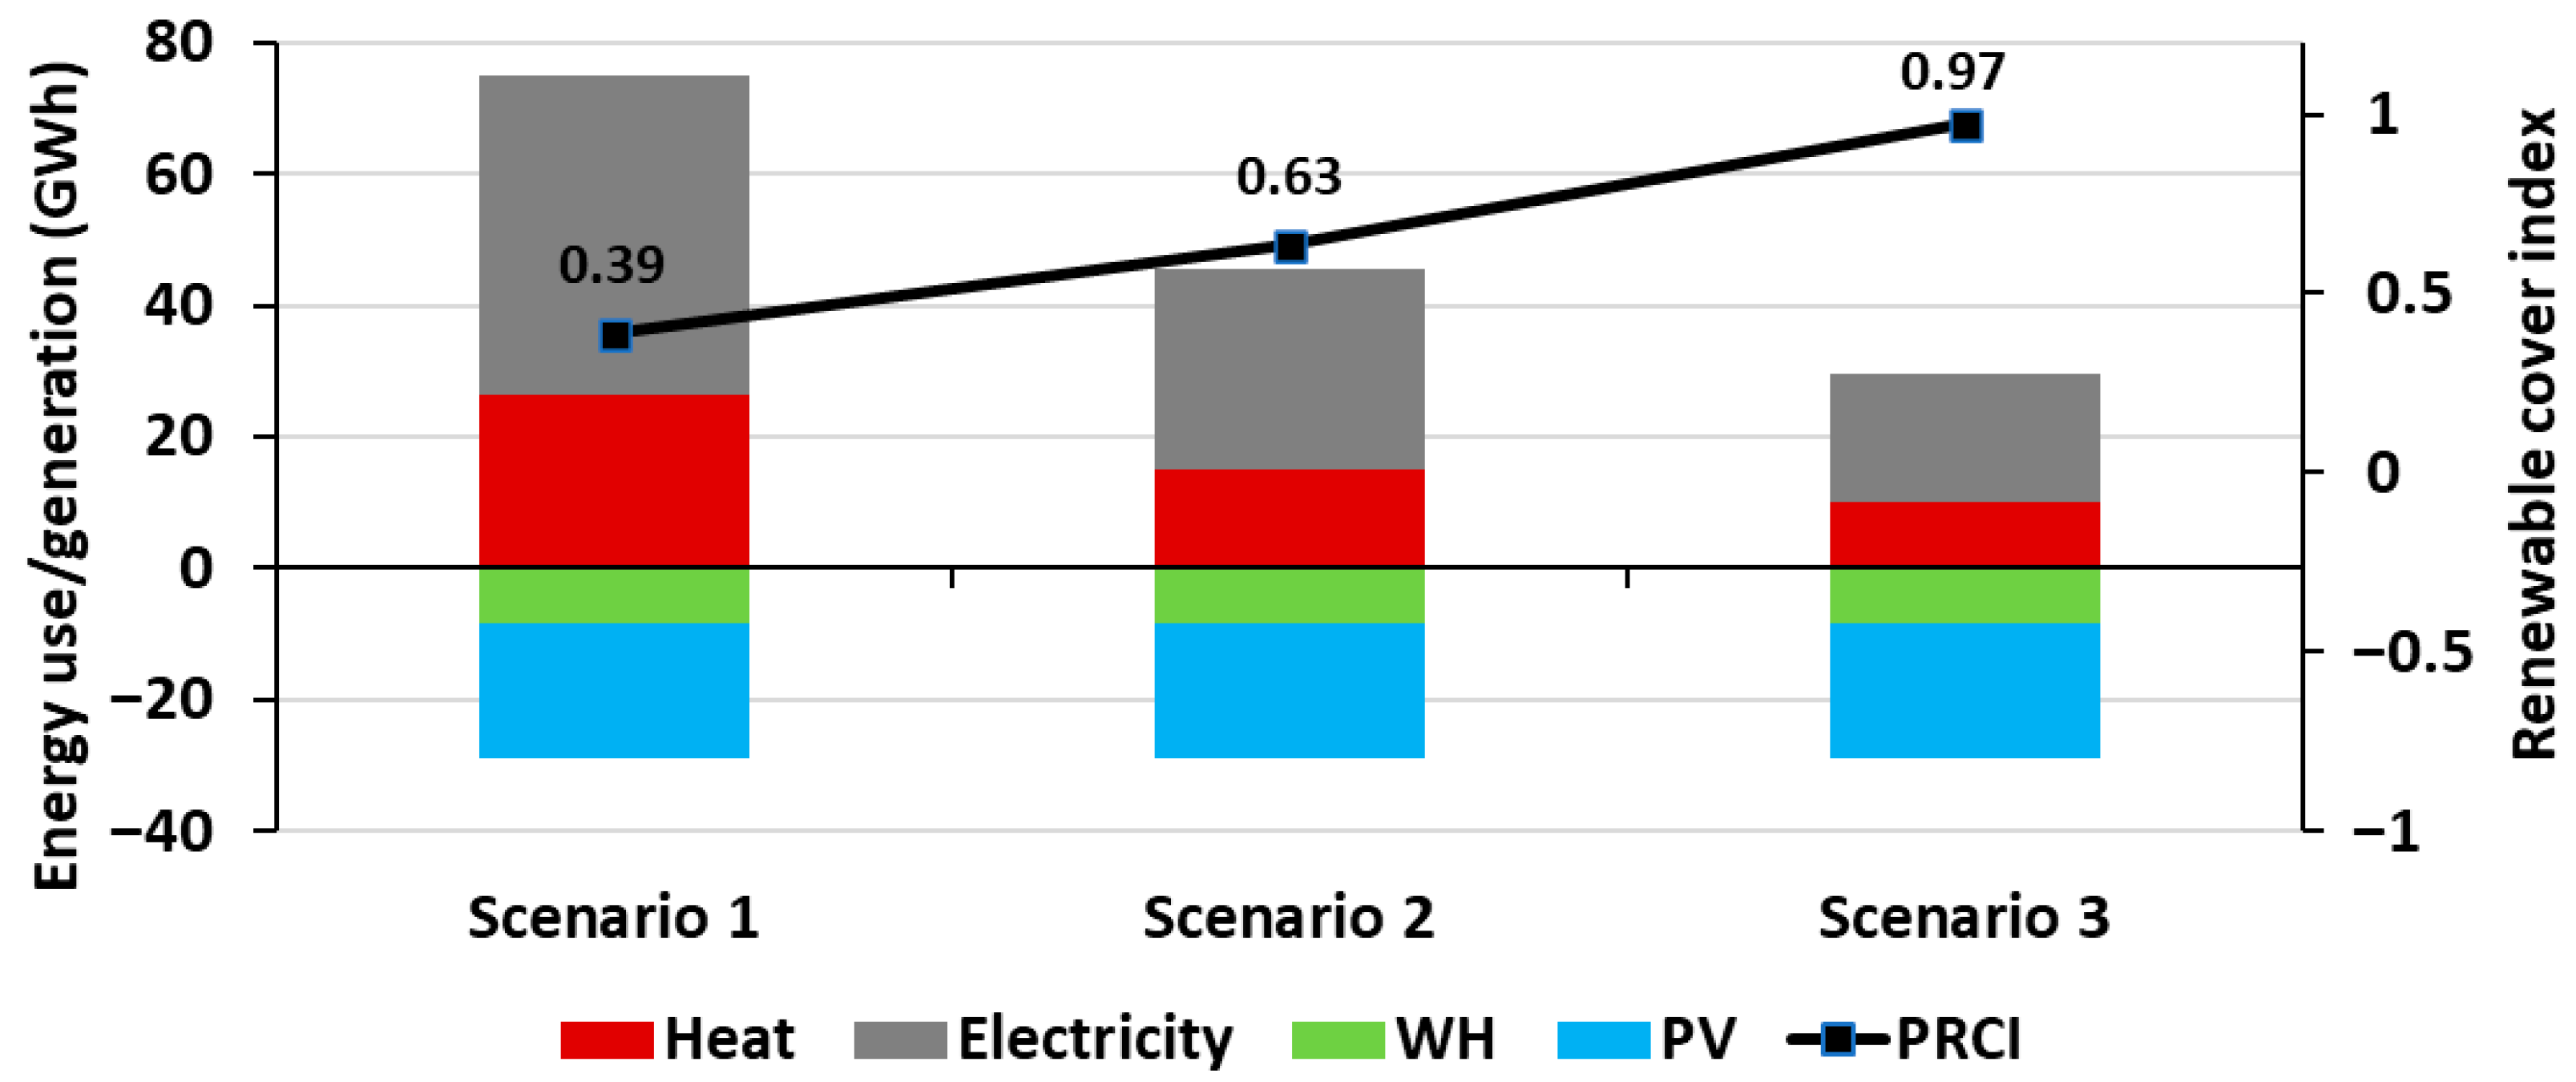
Figure 13 illustrates the campus energy demand and the potential contribution from renewable and local energy sources by 2030, following implementing each energy-efficiency scenario. Based on these results, the PRCI was calculated to evaluate the share of total energy demand that could be supplied through on-site PV generation and recovered waste heat. The PRCI was 0.97 in Scenario 3, indicating that under deep retrofit conditions, the campus could nearly achieve full renewable energy coverage. The waste heat amount from the data center in Figure 13, was assumed to be the same as given in Figure 6. These results suggested that with continued improvements in building efficiency and integration of local renewable systems, the Gløshaugen campus has the potential to operate as a PED, meeting or exceeding its own annual energy demand. Limitation of the results in Figure 13 is that the hourly matching of the heating and electricity demand with the local generation of the respective sources was not done in the current study.

4. Conclusions

The study investigated the potential for transforming an existing university campus in Norway toward achieving PED status through a combination of energy-efficiency strategies, building retrofits, and integration of local energy sources. The analysis was based on a cohort-based MBEM, which clustered campus buildings by construction period to account for differences in energy performance and retrofit potential.
The results demonstrated that substantial reductions in energy demand can be achieved through implementing targeted ECMs alongside planned new constructions defined in the campus development plan. Among the evaluated measures, window replacement, and ventilation system optimization proved to be the most effective, with older cohorts achieving the highest relative savings due to their lower baseline efficiency. By the end of the simulation period, the specific energy use of the campus decreased from 252.2 kWh/m2 in 2025 to 161.7 kWh/m2 under moderate retrofit conditions and 85.9 kWh/m2 under deep retrofit conditions, corresponding to reductions of 36% and 66%, respectively. These improvements created favorable conditions for covering the remaining energy demand with renewable sources and achieving PED objectives.
When combined with on-site PV generation and waste-heat recovery from the campus DC, the PRCI reached 0.97, indicating that near-complete renewable coverage is technically achievable. The findings confirmed that a demand-led, cohort-based approach provides valuable insight into how building age and typology influence energy performance and retrofit effectiveness. This approach offers a scalable and replicable framework for transitioning existing mixed-use campuses into PEDs.

Future Work and Outlook

While this study focused on annual energy balances to assess the feasibility of achieving PED targets, future work will extend the analysis to incorporate high resolution temporal matching between energy demand and renewable generation. This includes the integration and optimization of electrical and thermal energy storage systems, as well as demand side flexibility strategies, to evaluate self-consumption rates, peak load shifting, and grid interaction. Such extensions will enhance the operational realism of the PED assessment and support more practical implementation pathways for campus scale and district scale energy systems.

Author Contributions

Conceptualization, H.M.P. and N.N.; Methodology, H.M.P. and N.N.; Software, H.M.P.; Validation, H.M.P.; Formal analysis, H.M.P.; Investigation, H.M.P. and N.N.; Resources, H.M.P. and N.N.; Data curation, H.M.P. and N.N.; Writing—original draft, H.M.P.; Writing—review & editing, H.M.P. and N.N.; Visualization, H.M.P.; Supervision, N.N.; Project administration, N.N.; Funding acquisition, N.N. All authors have read and agreed to the published version of the manuscript.

Funding

This research was funded by the Faculty of Engineering (IV) at the Norwegian University of Science and Technology (NTNU) grant number 2651892, and the APC was funded by the Norwegian University of Science and Technology (NTNU).

Data Availability Statement

The original contributions presented in this study are included in the article. Further inquiries can be directed to the corresponding author.

Acknowledgments

This work has been written with the LifeLine-2050 project, funded by the Faculty of Engineering (IV) at the Norwegian University of Science and Technology (NTNU). The Life-Line-2050 project is a flagship project with the NTNU’s Center for Green Shift in the Built Environment (Green2050). The authors gratefully acknowledge the support of Green2050’s partners and the encouragement of the innovation committee of IV faculty at NTNU.

Conflicts of Interest

The authors declare no conflict of interest.

References

  1. Ürge-Vorsatz, D.; Khosla, R.; Bernhardt, R.; Chan, Y.C.; Vérez, D.; Hu, S.; Cabeza, L.F. Advances Toward a Net-Zero Global Building Sector. Annu. Rev. Environ. Resour. 2020, 45, 227–269. [Google Scholar] [CrossRef]
  2. Maduta, C.; D’Agostino, D.; Tsemekidi-Tzeiranaki, S.; Castellazzi, L.; Melica, G.; Bertoldi, P. Towards climate neutrality within the European Union: Assessment of the Energy Performance of Buildings Directive implementation in Member States. Energy Build. 2023, 301, 113716. [Google Scholar] [CrossRef]
  3. International Energy Agency. Norway 2022, Energy Policy Review; International Energy Agency: Paris, France, 2022. [Google Scholar]
  4. Dulian, M. Energy Performance of Buildings Directive; EU Legislation in Progress: Brussels, Belgium, 2024. [Google Scholar]
  5. Derkenbaeva, E.; Halleck Vega, S.; Hofstede, G.J.; van Leeuwen, E. Positive energy districts: Mainstreaming energy transition in urban areas. Renew. Sustain. Energy Rev. 2022, 153, 111782. [Google Scholar] [CrossRef]
  6. JPI Urban Europe. White Paper on PED Reference Framework for Positive Energy Districts and Neighbourhoods; JPI Urban Europe: Vienna, Austria, 2020. [Google Scholar]
  7. Brozovsky, J.; Gustavsen, A.; Gaitani, N. Zero emission neighbourhoods and positive energy districts—A state-of-the-art review. Sustain. Cities Soc. 2021, 72, 103013. [Google Scholar] [CrossRef]
  8. Erba, S.; Pagliano, L. Combining Sufficiency, Efficiency and Flexibility to Achieve Positive Energy Districts Targets. Energies 2021, 14, 4697. [Google Scholar] [CrossRef]
  9. Lerbinger, A.; Petkov, I.; Mavromatidis, G.; Knoeri, C. Optimal decarbonization strategies for existing districts considering energy systems and retrofits. Appl. Energy 2023, 352, 121863. [Google Scholar] [CrossRef]
  10. Natanian, J.; Guarino, F.; Manapragada, N.; Magyari, A.; Naboni, E.; De Luca, F.; Cellura, S.; Brunetti, A.; Reith, A. Ten questions on tools and methods for positive energy districts. Build. Environ. 2024, 255, 111429. [Google Scholar] [CrossRef]
  11. Healey Trulsrud, T.; van der Leer, J. Towards a positive energy balance: A comparative analysis of the planning and design of four positive energy districts and neighbourhoods in Norway and Sweden. Energy Build. 2024, 318, 114429. [Google Scholar] [CrossRef]
  12. Bruck, A.; Diaz Ruano, S.; Auer, H. Values and implications of building envelope retrofitting for residential Positive Energy Districts. Energy Build. 2022, 275, 112493. [Google Scholar] [CrossRef]
  13. Chen, X.; Vand, B.; Baldi, S. Challenges and Strategies for Achieving High Energy Efficiency in Building Districts. Buildings 2024, 14, 1839. [Google Scholar] [CrossRef]
  14. Johari, F.; Peronato, G.; Sadeghian, P.; Zhao, X.; Widén, J. Urban building energy modeling: State of the art and future prospects. Renew. Sustain. Energy Rev. 2020, 128, 109902. [Google Scholar] [CrossRef]
  15. Wang, C.; Ferrando, M.; Causone, F.; Jin, X.; Zhou, X.; Shi, X. Data acquisition for urban building energy modeling: A review. Build. Environ. 2022, 217, 109056. [Google Scholar] [CrossRef]
  16. Li, W.; Zhou, Y.; Cetin, K.; Eom, J.; Wang, Y.; Chen, G.; Zhang, X. Modeling urban building energy use: A review of modeling approaches and procedures. Energy 2017, 141, 2445–2457. [Google Scholar] [CrossRef]
  17. Todeschi, V.; Boghetti, R.; Kämpf, J.H.; Mutani, G. Evaluation of Urban-Scale Building Energy-Use Models and Tools—Application for the City of Fribourg, Switzerland. Sustainability 2021, 13, 1595. [Google Scholar] [CrossRef]
  18. Jradi, M.; Nielsen, E.W.; Lund, M. A Comprehensive Technical Analysis of Retrofitting a Danish Residential Area into a Positive Energy District. Future Cities Environ. 2023, 9, 18. [Google Scholar] [CrossRef]
  19. Di Pilla, L.; Cellura, M.; Franzitta, V.; Guarino, F.; Longo, S.; Curto, D.; Ilardi, L.; Panno, D. Fostering the energy transition in a neighbourhood perspective: Towards Positive Energy Districts’ application for a university case study. Energy Rep. 2025, 13, 5628–5652. [Google Scholar] [CrossRef]
  20. Sessa, E.; Brunetti, A.; Ciulla, G.; Guarino, F.; Longo, S.; Cellura, M.; Dragomir, A.; Papina, C. Towards positive energy district assessment: The case study of Bucharest. Energy 2025, 325, 136208. [Google Scholar] [CrossRef]
  21. Martinopoulos, G.; Tsimpoukis, A.; Sougkakis, V.; Dallas, P.; Angelakoglou, K.; Giourka, P.; Nikolopoulos, N. A Comprehensive Approach to Nearly Zero Energy Buildings and Districts: Analysis of a Region Undergoing Energy Transition. Energies 2024, 17, 5581. [Google Scholar] [CrossRef]
  22. Sesana, M.M.; Grecchi, M.; Salvalai, G.; Rasica, C. Methodology of energy efficient building refurbishment: Application on two university campus-building case studies in Italy with engineering students. J. Build. Eng. 2016, 6, 54–64. [Google Scholar] [CrossRef]
  23. Ahmed, A.; Mateo-Garcia, M.; Arewa, A.; Caratella, K. Integrated Performance Optimization of Higher Education Buildings Using Low-Energy Renovation Process and User Engagement. Energies 2021, 14, 1475. [Google Scholar] [CrossRef]
  24. Del Borghi, A.; Spiegelhalter, T.; Moreschi, L.; Gallo, M. Carbon-Neutral-Campus Building: Design Versus Retrofitting of Two University Zero Energy Buildings in Europe and in the United States. Sustainability 2021, 13, 9023. [Google Scholar] [CrossRef]
  25. Oraz, E.; Sözer, H. Critical Saving Exposed by Investigating Energy Efficiency Performance and Retrofitting Measures in University Campus Buildings: A Comprehensive Case Study. ASME J. Eng. Sustain. Build. Cities 2025, 6, 021005. [Google Scholar] [CrossRef]
  26. Cho, H.M.; Yun, B.Y.; Yang, S.; Wi, S.; Chang, S.J.; Kim, S. Optimal energy retrofit plan for conservation and sustainable use of historic campus building: Case of cultural property building. Appl. Energy 2020, 275, 115313. [Google Scholar] [CrossRef]
  27. NTNU Unified Campus. Available online: https://www.ntnu.edu/campusdevelopment/unified-campus#ressurserdokumenter (accessed on 1 November 2025).
  28. Li, H.; Hou, J.; Hong, T.; Ding, Y.; Nord, N. Energy, economic, and environmental analysis of integration of thermal energy storage into district heating systems using waste heat from data centres. Energy 2021, 219, 119582. [Google Scholar] [CrossRef]
  29. Bjelland, D.; Lausselet, C.; Wiik, M.K.; Delgado, B.M.; Rokseth, L.S. NTNU Campus Gløshaugen, Presentation of a Selection of ZEN KPIs in a Pilot Project; ZEN MEMO No. 61: Trondheim, Norway, 2024. [Google Scholar]
  30. Standard NS 3031; Energy Performance of Buildings Calculation of Energy Needs and Energy Supply. Standards Norway: Oslo, Norway, 2021.
  31. Standard TEK17; Building Technical Regulations with Guidance. Norwegian Directorate for Building Quality: Oslo, Norway, 2017.
  32. Guan, J.; Nord, N.; Chen, S. Energy planning of university campus building complex: Energy usage and coincidental analysis of individual buildings with a case study. Energy Build. 2016, 124, 99–111. [Google Scholar] [CrossRef]
  33. Nord, N.; Tereshchenko, T.; Woszczek, A.; Næss, J.S.; Sandberg, N.H.; Pahlavan, H.M.; Brattebø, H. A dynamic modelling approach to explore zero emission building stock opportunities towards 2050—Case study of a university campus. Energy Build. 2024, 325, 115024. [Google Scholar] [CrossRef]
  34. Pahlavan, H.M.; Nord, N. Scenario-Based Analysis of Energy Retrofit Strategies and Their Impacts on Building Energy Demand Using a Validated Multi-Building Energy Model: A University Campus Case Study. Energy Build. 2026, 354. [Google Scholar] [CrossRef]
  35. Kontar, R.E.; Polly, B.; Charan, T.; Fleming, K.; Moore, N.; Long, N.; Goldwasser, D. URBANopt: An Open-Source Software Development Kit for Community and Urban District Energy Modeling. In Proceedings of the Building Performance Analysis Conference and SimBuild (BPAC), Virtual, 29 September–1 October 2020. [Google Scholar]
  36. ASHRAE Guideline 14: Measurement of Energy, Demand, and Water Savings; American Society of Heating, Refrigerating and Air-Conditioning Engineers: Peachtree Corners, GA, USA, 2014.
  37. Fjellheim, K.; Lien, S.K.; Walnum, H.T.; Sandberg, N.H.; Cheng, C.; Fjellheim, Ø. Potensial-og Barrierestudie Energitjenester i Næringsbygg; SINTEF Community: Oslo, Norway, 2020. [Google Scholar]
  38. Erwin Mlecnik, J.M.H.-B. Policy Instruments for Cost-Effective Building Renovation at District Level Combining Energy Efficiency & Renewables; International Energy Agency: Paris, France, 2023. [Google Scholar]
  39. Artola, I.; Rademaekers, K.; Williams, R.; Yearwood, J. Boosting Building Renovation: What Potential and Value for Europe? European Parliament: Strasbourg, France, 2016. [Google Scholar]
  40. de Groote, M.; Lefever, M.; Reinaud, J. Scaling Up Deep Energy Renovations; Buildings Performance Institute Europe: Brussels, Belgium, 2016. [Google Scholar]
  41. Thyholt, M.; Pettersen, T.D.; Haavik, T.; Wachenfeldt, B.J. Energy Analysis of the Norwegian Dwelling Stock; International Energy Agency: Paris, France, 2009. [Google Scholar]
  42. Nocente, A.; Time, B.; Kvande, T.; Mathisen, H.M.; Gustavsen, A. BIPV in Nordic climate: The ZEB Laboratory. REHVA J. 2022. Available online: https://www.rehva.eu/rehva-journal/chapter/bipv-in-nordic-climate-the-zeb-laboratory (accessed on 1 November 2025).
Figure 1. An overview of the methodology used in this study.
Energies 19 00604 g001
Figure 2. Aerial image and building cluster for the Gløshaugen campus. Photo: Erik Børseth, Synlig design og foto as/NTNU.
Energies 19 00604 g002
Figure 3. Hourly heat and electricity demand of Gløshaugen campus for 2024.
Energies 19 00604 g003
Figure 4. Change in campus building typologies and corresponding energy-code levels. (a) Scenario 1: current campus development plan. (b) Scenario 2: moderate retrofit combined with the campus development plan. (c) Scenario 3: deep retrofit integrated with the campus development plan.
Energies 19 00604 g004
Figure 5. Monthly electricity production of the ZEB Laboratory PV system.
Energies 19 00604 g005
Figure 6. Waste heat recovery potential from the campus DC.
Energies 19 00604 g006
Figure 7. Annual specific heating and electricity use for each building cohort under the three energy efficiency scenarios.
Energies 19 00604 g007
Figure 8. Annual campus heating and electricity use and SEU for the baseline, moderate retrofit, and deep retrofit scenarios from 2025 to 2030.
Energies 19 00604 g008
Figure 9. Energy use for building cohorts in base case and under energy efficiency measures for Scenario 2.
Energies 19 00604 g009
Figure 10. Energy use for building cohorts in base case and under energy efficiency measures for Scenario 3.
Energies 19 00604 g010
Figure 11. Energy-use reduction per retrofitted area for each ECM.
Energies 19 00604 g011
Figure 12. Estimated monthly electricity production potential for the entire campus.
Energies 19 00604 g012
Figure 13. Campus energy demand and potential renewable and local energy sources by 2030.
Energies 19 00604 g013
Table 1. Identified building clusters and their main properties.
Constriction YearIDNo. of BuildingsArea [m2]Building Code
Before 1950 C1415,536-
1951–1970 C220146,991TEK49
1971–1990 C3436,693TEK69
1991–2010 C4368,218TEK87
2020–2030 C5475,000TEK17
Table 2. Main input parameter groups used for MBEM development and corresponding data sources.
Parameter GroupInput ParametersDescription/Role in MBEMPrimary Data Sources
Geometric parametersBuilding footprint, height, number of floors, floor area, orientationDefine the basic building geometry and spatial representation used to generate simplified “shoebox” models within URBANoptCampus GIS database, municipal GIS data
Structural/envelope parametersWall, roof, and floor U-values; window U-values; window-to-wall ratio (WWR); thermal massRepresent thermal characteristics of the building envelope and heat transfer behaviorBuilding energy certificates, construction-period cohorts, national standards (TEK versions)
Operational parametersOccupancy density, schedules, internal gains (lighting and equipment), setpoint temperaturesDescribe building use patterns and internal loads affecting heating and electricity demandNS 3031 building use libraries, Campus online monitoring system
Ventilation and HVAC parametersVentilation type, air change rates, heat recovery efficiency, SFP-factor, heating system typeDefine mechanical system performance and energy consumption for heating and ventilationTechnical documentation, Campus online monitoring system
Utility system parametersDistrict heating connection, electricity supply, energy carrier efficienciesSpecify how buildings are supplied with heating and electricity at the district scaleCampus utility data, district heating provider information
Calibration and validation dataAnnual, monthly, and hourly energy useUsed to calibrate and validate the MBEM against measured performanceCampus online monitoring system
Table 3. Summary of ECMs applied in each scenario by the end of implementation period (2030).
C1 RetrofitC2 RetrofitC3 RetrofitC4 RetrofitECM
Scenario 1----No ECM
Scenario 210% to TEK87
20% to TEK17
15% to TEK87
30% to TEK17
20% to TEK87
50% to TEK17
100%
to TEK17
ECM 1—Improving external wall U-value
ECM 2—Improving floor U-value
ECM 3—Improving roof U-value
ECM 4—Window replacement
ECM 5—Improving heat recovery ventilation
ECM 6—Improving SFP-factor
Scenario 360%
to TEK17
85%
to TEK17
100%
to TEK17
100%
to TEK17
Table 4. Typical thermal and ventilation values based on historical Norwegian building regulations.
Performance ParameterTEK17TEK10TEK07TEK97TEK87TEK69TEK49Older
U-value External wall [W/m2K]0.180.180.180.220.301.001.051.30
U-value Floor [W/m2K]0.100.150.150.150.300.460.600.60
U-value Roof [W/m2K]0.130.130.130.150.200.580.811.00
U-value Window/Door [W/m2K]0.801.201.202.002.402.802.802.80
Normalized Thermal Bridge [W/m2K]0.05/
0.07
0.03/
0.06
0.03/
0.06
0.03/
0.06
0.05/
0.12
0.05/
0.12
0.04/
0.08
0.03/
0.06
Infiltration N50 [1/50]0.601.501.501.50/31.50/32.50/32.50/32.50/3
Heat Recovery Ventilation [%]808070656025--
SFP-Factor [kW/(m3/s)]1.502.002.003.504.004.00--
Table 5. NMBE of the simulated electricity and heat demand from the measurements data for different building clusters and time resolutions.
Time ResolutionCohort 1 [%]Cohort 2 [%]Cohort 3 [%]Cohort 4 [%]
HeatHourly−4.71.48.5−1
Monthly−10.13.7−0.03
ElectricityHourly7.19.46.15.3
Monthly2.44.531.9
Table 6. CV(RMSE) of the simulated electricity and heat demand from the measurements data for different building clusters and time resolutions.
Time ResolutionCohort 1 [%]Cohort 2 [%]Cohort 3 [%]Cohort 4 [%]
HeatHourly28.527.331.338.1
Monthly13.411.814.115.6
ElectricityHourly2015.221.822.1
Monthly8.15.49.58.9
Table 7. SEU for the building cohorts and resulting energy savings effect through moderate retrofit strategy (Scenario 2).
Cohort 1Base (2025)ECM 1ECM 2ECM 3ECM 4ECM 5ECM 6
Energy (kWh/m2)327.9308.7317.3310.1288.0300.3288.2
Savings (kWh/m2) 19.210.617.839.927.639.7
Savings (%) 5.93.25.412.28.412.1
Cohort 2
Energy (kWh/m2)259.3238.5246.0240.6227.9233.6234.9
Savings (kWh/m2) 20.813.218.731.425.724.3
Savings (%) 8.05.17.212.19.99.4
Cohort 3
Energy (kWh/m2)273.7243.6249.9245.1232.9248.2237.9
Savings (kWh/m2) 30.123.828.640.825.635.9
Savings (%) 11.08.710.514.99.313.1
Cohort 4
Energy (kWh/m2)217.1202.9212.0206.0192.8201.6196.7
Savings (kWh/m2) 14.25.211.224.415.620.4
Savings (%) 6.52.45.111.27.29.4
Table 8. SEU for the building cohorts and resulting energy savings effect through deep retrofit strategy (scenario 3).
Cohort 1Base (2025)ECM 1ECM 2ECM 3ECM 4ECM 5ECM 6
Energy (kWh/m2)327.9275.5285.2277.1252.0266.0252.3
Savings (kWh/m2) 52.442.750.875.961.975.6
Savings (%) 16.013.015.523.118.923.1
Cohort 2
Energy (kWh/m2)259.3203.1194.2189.9179.9184.4185.5
Savings (kWh/m2) 56.265.069.379.374.973.8
Savings (%) 21.725.126.730.628.928.5
Cohort 3
Energy (kWh/m2)273.7187.4192.3188.6179.2190.9183.0
Savings (kWh/m2) 86.381.485.194.582.890.7
Savings (%) 31.529.731.134.530.233.1
Cohort 4
Energy (kWh/m2)217.1162.4169.6164.8154.2161.2157.4
Savings (kWh/m2) 54.847.652.462.955.959.8
Savings (%) 25.221.924.129.025.727.5
Disclaimer/Publisher’s Note: The statements, opinions and data contained in all publications are solely those of the individual author(s) and contributor(s) and not of MDPI and/or the editor(s). MDPI and/or the editor(s) disclaim responsibility for any injury to people or property resulting from any ideas, methods, instructions or products referred to in the content.