


Abstract
Accurate estimation of internal temperature is essential for safe operation and state estimation of lithium-ion batteries, yet it usually cannot be measured directly and requires physically grounded electro-thermal models. High fidelity 3D simulations capture geometry-dependent heat transfer behavior but are too computationally intensive for real-time use, whereas common lumped models cannot represent internal gradients. This work presents an integrated geometry-resolved workflow that combines detailed 3D finite volume thermal modeling with systematic reduction to a compact multi-node thermal network and its coupling with an equivalent circuit electrical model. A realistic 3D model of the Panasonic NCR18650B cell was reconstructed from computed tomography data and literature parameters and validated against published axial and radial thermal conductivity measurements. The automated reduction yields a five-node thermal network preserving radial temperature distribution, which was coupled with five parallel Battery Table-Based blocks in MATLAB/Simulink R2024b to capture spatially distributed heat generation. Experimental validation under dynamic loading is performed using measured surface temperature and terminal voltage, showing strong agreement (surface temperature MAE ≈ 0.43 °C, terminal voltage MAE ≈ 16 mV). The resulting model enables physically informed estimation of internal thermal behavior, is interpretable, computationally efficient, and suitable for digital twin development.
1. Introduction
1.1. Background and Motivation
Lithium-ion batteries used in electric mobility and stationary storage rely on internal states that cannot be measured directly, such as the state of charge (SOC), state of health (SOH), and state of power (SOP). These quantities are strongly affected by temperature, which influences electrical parameters, degradation mechanisms and overall safety limits. Since practical systems cannot access the internal temperature of a cell, state estimation must rely on models capable of reconstructing internal thermal behavior from externally measurable variables [1].
High-power operation, fast charging, or insufficient cooling often lead to significant axial and radial temperature gradients, which cannot be captured by surface sensors alone. Accurate estimation of internal temperature therefore becomes essential for improved degradation prediction, detection of abnormal thermal events, and safer operation. Electro-thermal models fulfill this role by linking electrical and thermal dynamics in a physically consistent way, and they can act as digital shadows or digital twins of battery cells for real-time monitoring and prediction [2].
1.2. Electro-Thermal Modeling of Li-Ion Cells
Electrical models based on equivalent circuits (ECM) are widely used in battery management applications due to their simplicity and low computational load. Their accuracy, however, is limited without explicit temperature dependence, and a standalone ECM is insufficient for precise estimation of internal thermal states.
Electrochemical models (e.g., the pseudo-two-dimensional (P2D)/Doyle–Fuller–Newman (DFN) models [3]) offer higher physical fidelity but require extensive parametrization and are too computationally demanding for real-time use. They are often used for detailed temperature simulation, such as [4], as they explicitly resolve heat-generation mechanisms including reaction heat, ohmic losses, and entropic effects. These models are particularly valuable for analyzing internal temperature gradients, degradation phenomena, and coupled electrochemical–thermal interactions at the cell level. However, their high computational cost and extensive parameterization requirements generally restrict their use to offline analysis, cell design, and diagnostic studies rather than real-time estimation or digital twin applications.
In recent years, neural network-based and data-driven approaches have also been widely investigated for battery temperature prediction. When trained on representative datasets, these methods can achieve high accuracy under specific operating conditions and are attractive for fast inference. Nevertheless, their dependence on large training datasets, limited extrapolation capability beyond the trained domain, and reduced physical interpretability remain significant challenges. For applications involving new cell designs, varying thermal boundary conditions, or geometry-dependent effects, purely data-driven temperature estimators are therefore often used as complementary tools rather than as standalone physics-based thermal models [5].
Physics-based thermal modeling addresses these limitations by providing spatial temperature information. Detailed 3D finite element or finite volume models (FEM/FVM) are commonly used during cell and module design because they can capture complex anisotropic material properties and realistic temperature gradients [6]. For cylindrical cells, accurate representation of anisotropic thermal conduction is critical, and simplified models frequently underestimate radial gradients [5]. Computational cost of 3D models, however, prevents direct use during operation of a battery system.
Reduced 0D/1D models—typically formulated as lumped thermal networks—offer a practical compromise between accuracy and computational efficiency and therefore have potential to be used for onboard estimation or digital twin implementations. A good example of such an approach is [7], where authors create a lumped thermal-network model to estimate internal temperature of an electric motor. Other recent reviews emphasize that model-order reduction is essential for enabling real-time electro-thermal modeling, with reduced thermal networks identified as one of the most effective approaches for preserving essential heat-transfer behavior while maintaining low computational cost [5]. Several reduction methodologies have been published, ranging from classical 1D electrochemical–thermal coupling for prismatic and pouch cells [8,9], through large-format cylindrical distributed electro-thermal (DET) models that combine reduced electrochemistry with low-dimensional radial thermal models [10,11], canonical 1D thermal reduction for cylindrical cells [12], to ECM-based approaches where reduced-order or lumped-capacitance thermal descriptions are directly coupled to simplified heat-generation formulations [13,14,15]. Reduced thermal-network concepts have also been applied at the pack level, where conduction-dominated lumped models were shown to reproduce experimentally measured temperature distributions for different pack geometries, demonstrating the practicality of internal thermal-network modeling for multi-cell systems [16]. For cylindrical cells, coupled ECM–thermal frameworks using multi-dimensional thermal domains demonstrate that reduced models can still reproduce spatial temperature distributions and aging behavior with acceptable accuracy while significantly lowering computational cost [4,17]. In parallel, thermal network reduction techniques derived from 3D FEM references have been explored in several works, e.g., [18,19], including direct 3D→1D reductions based on spatial averaging of full 3D thermal fields for cell-level electro-thermal simulations [20]. Related studies also use 3D simulations to parameterize simplified 1D thermal models in battery thermal-management applications [21], confirming the broader relevance of geometry-resolved model simplification. This need for reduced-order models is consistent with broader digital twin research, where even general mechanical-system reviews show that real-time synchronization is infeasible without reduced-order model (ROM) techniques, e.g., [22], and thermal-system digital twin studies confirm that multi-stage reduction is required to maintain real-time performance while preserving essential physics [23]. An example of various approaches to creating a battery cell thermal network is shown in Figure 1.
Figure 1.
Illustrative principle of thermal network modeling: (a) modeled cylindrical cell with bottom-mounted cold plate for liquid thermal management, reproduced from [24]; (b) most simplified way of creating the thermal network, with one cell thermal node (temperature point) in core, one on the surface; (c) more advanced way of cell thermal network with multiple thermal masses in cell, to represent temperature distribution.
Recent reviews categorize coupled electro-thermal approaches into fully coupled DFN-based models, simplified electrochemical formulations, ECM-based electro-thermal models, data-driven estimators, and hybrid schemes [5].
1.3. Research Gap
Although numerous works address electrical, thermal, and electro-thermal modeling of lithium-ion cells, most studies focus only on individual parts of the modelling chain. A unified, physics-based workflow that bridges detailed 3D simulation and real-time suitable electro-thermal modelling is still largely missing. Recent EV-focused reviews also emphasize that real-time battery management system (BMS) modelling still relies almost entirely on ECMs and lumped thermal descriptions, with high-fidelity physics-based models remaining impractical for onboard use [2].
First, high-fidelity 3D thermal models are commonly used for design and cooling analysis, but they are rarely integrated into a systematic reduction process. Reduced models often rely on simplified geometries or empirical fitting rather than on a direct mapping from a geometry-resolved 3D reference. This trend is visible both in detailed 3D pouch-cell models, which remain computationally intensive and unreduced [25], and in recent data-driven thermal approaches that depend on parameter fitting rather than physics-based reduction [26].
Second, thermal-network reduction approaches exist (e.g., [18,21]), but they typically focus on identification or optimization and not on generating a domain-based network where each node corresponds to a specific physical component of the cell. As a result, reduced models may behave as black-box approximations without a clear physical interpretation. Earlier lumped electro-thermal models for cylindrical cells, such as [27], also follow this simplified structure without linking the network to a geometry-resolved 3D reference, further illustrating the absence of a systematic 3D→1D reduction.
Third, integration of reduced thermal models with electrical ECMs remains limited. Most electro-thermal models rely on empirical parameter tuning or simplified thermal descriptions, while detailed 3D models are not suitable for real-time use. Hybrid approaches that combine simplified electrochemical models, lumped thermal states, and neural networks—such as [28]—further demonstrate that existing methods depend heavily on empirical correction rather than on a physics-based reduction linked to cell geometry. A consistent workflow that links 3D geometry, physics-based thermal reduction and an ECM-based electrical model for internal-state estimation is still largely absent from existing literature. Compared to data-driven approaches such as neural networks, a geometry-resolved reduction ensures physical interpretability, robustness outside calibrated conditions and natural applicability to digital twin concepts.
While electrochemical and neural network-based approaches provide valuable insights into battery temperature behavior, a systematic, geometry-resolved workflow that bridges high-fidelity 3D thermal simulation and real-time suitable electro-thermal models remains largely unexplored.
1.4. Aim and Contributions
The aim of this work is to develop and validate a complete, geometry-resolved electro-thermal modeling workflow for cylindrical lithium-ion cells, suitable for real-time digital twin applications and internal-state estimation. The electrical behavior is represented using an existing equivalent-circuit model (ECM) adopted from prior work, whose structure and parameters are described in the Appendix A. This ECM is used as a baseline electrical representation, and its known limitations are acknowledged. Accordingly, the focus of the present study is on the development, systematic reduction and integration of a physically grounded thermal model that complements the electrical part and enables real-time electro-thermal coupling. The proposed workflow is modular by design and can directly accommodate more advanced electrical models as they become available, without changes to the thermal reduction methodology.
The main contributions are as follows:
- A detailed 3D FVM model of a cylindrical Li-ion cell using anisotropic material properties and realistic internal geometry;
- Approach to automated reduction methodology that converts the 3D model into a structured thermal network with physically meaningful thermal masses and conductive paths;
- Integration of the reduced thermal network with an existing baseline equivalent-circuit electrical model, forming a compact electro-thermal model suitable for system-level simulation environments such as MATLAB/Simulink;
- Experimental validation of the electro-thermal model under dynamic loading in real-time, demonstrating its ability to reproduce internal temperature behavior relevant for improved SOC and SOH estimation.
2. Materials and Methods
2.1. Overview of the Proposed Modeling Workflow
Several approaches can be used to construct an electro-thermal model of a lithium-ion cell. The most rigorous option is to begin with a fully coupled electrochemical–thermal model, where the internal structure, material distribution, and electrochemical reactions are modeled in detail. While such a bottom-up approach offers high physical fidelity, it requires comprehensive knowledge of the cell’s internal composition, transport properties, and reaction parameters. These data are generally unavailable for commercial cells without destructive characterization and extensive parameter identification, making this approach impractical for most applications.
An alternative is to propose a simplified model structure directly and identify its parameters from measurements. In this case, the model is partly data-driven but still guided by physically motivated structure rather than a black-box formulation. Such models may be identified as a whole, using broad datasets and global optimization methods, though this often results in high parameter dimensionality and risks of nonphysical parameter combinations that may fit one dataset but fail elsewhere. Recent works on data-driven identification of electrochemical models also highlight that large parameter dimensionality, low identifiability and nonphysical parameter interactions remain major challenges, even with advanced artificial intelligence (AI)-based optimization frameworks [29]. A more robust approach is to build the model in separate, physically interpretable parts, using measurement and literature data while minimizing the number of empirically fitted parameters.
The methodology adopted in this work follows the latter philosophy and can be viewed as a hybrid, physics-guided approach. It combines analytically or literature-derived components, geometry-resolved thermal modeling and reduced-order representations, followed by targeted parameter adjustment where necessary. This ensures physical interpretability while limiting the need for broad empirical fitting. The proposed workflow consists of four main steps:
- Electrical modeling: An ECM with explicit temperature dependence is identified independently using electrical measurements across multiple temperatures. This component is considered known from previous work and is not studied in detail in this paper, but is briefly described in Appendix A;
- Geometry-resolved 3D thermal modeling: A realistic yet simplified internal geometry of the cylindrical cell is reconstructed and used to build a 3D finite element/volume thermal model. The 3D model is validated independently using measured temperature responses or literature data;
- Thermal-network reduction: The 3D thermal model is reduced to a 0D/1D thermal network through a structured, domain-based procedure. The reduced model is validated against the 3D reference to ensure preservation of relevant thermal dynamics;
- Electro-thermal integration and validation: The ECM and the reduced thermal network are combined into a complete electro-thermal model. Remaining uncertain parameters are refined using targeted experiments, and the full model is validated against measured electrical and thermal responses under dynamic loading.
Each component can be used independently, e.g., the ECM for simplified electrical simulations, or the detailed 3D FVM model for thermal-management design and sensor-placement analysis, but together they form a compact, physically grounded electro-thermal model suited for digital twin and real-time applications. Unlike fully empirical models, the proposed workflow retains clear links to geometry, material properties, and heat-transfer mechanisms, enabling interpretation of quantities such as heat fluxes between cell components and temperature gradients not directly observable in experiments.
2.2. Cell Parameters Literature Survey
The proposed novel approach has been studied and tested on the Panasonic NCR18650B (Panasonic Corporation, Osaka, Japan), a Li-Ion cell with NCA chemistry (Nickel-Cobalt-Aluminum Oxide), chosen due to its wide availability of public thermal and structural data, making it suitable for literature-based parameter consolidation and model validation.
Accurate thermal modeling of a lithium-ion cell requires knowledge of the fundamental material properties of its constituent layers, including thermal conductivity, specific heat capacity and density. Direct measurement of these properties would require disassembling the cell and performing laboratory characterization on each layer of the jelly roll, current collectors, separator, mandrel, and the steel can. Such experiments are time-consuming, technically demanding, and not always feasible for commercially available cells.
To avoid the need for destructive testing, a comprehensive literature survey was carried out to collect material parameters reported for cells with similar chemistry and geometry. The NCR18650B is one of the most widely studied cylindrical cells, and many authors have published measurements or experimentally validated estimates of its thermal properties, enabling reliable consolidation of data from multiple sources. Studies providing values for radial and axial thermal conductivity, heat capacity, effective density, and other parameters were reviewed and compared. Where necessary, ranges from several publications were combined to obtain representative values suitable for use in the 3D thermal model and the reduced thermal network. The final set of material parameters selected for the modeling workflow, compared to literature values, is summarized in Table 1.
Table 1.
Overview of literature survey for material properties of Panasonic NCR18650B.
In this work, the cell part called “active material” (therefore jelly roll) is treated as a homogenized representation of the electrode stack, including both electrodes and electrolyte, with effective anisotropic thermal properties derived from the literature, rather than as individually resolved cathode, anode, and separator layers.
2.3. Cell Geometry and CAD Reconstruction
As the next step, a detailed geometric representation of the NCR18650B cell was required to support the high-fidelity thermal modeling described later in this work. The reconstruction followed a structured bottom-up approach, combining information from computed tomography (CT) imaging, teardown analyses, and literature-based material parameters. The modeling procedure is summarized below.
The primary geometric references were high-resolution CT scans published in [40], which provide a complete 3D reconstruction of the internal jelly roll and the upper safety structures (Current Interrupt Device—CID and Positive Temperature Coefficient device—PTC). These scans are shown in Figure 2. Additional structural details—particularly the composition, volume and weight of the components—were taken from the teardown presented in [34], reproduced in Figure 3.
Figure 2.
CT scan and 3D reconstruction of the positive terminal components, used as the reference for the model-geometry creation. Adapted from [40].
Figure 3.
Disassembled NCR18650B battery cell showing individual components, including the positive terminal assembly (CID, PTC, gasket), insulating disk, negative pole, steel can, current collectors, anode material, separator, mandrel, and cathode with welded contact. Reproduced from [34].
The CT slice from Figure 2 was imported into Autodesk Inventor 2025, where the internal components were traced and extruded into a coherent CAD model (Figure 4). Due to the expected standalone validation of the thermal model (convective cooling of an isolated cell), the jelly roll itself was represented by a simplified but physically meaningful structure. Instead of modeling the full electrode/separator winding, the active material region was modeled as a solid cylinder subdivided into five concentric tubular bodies. This region represents a homogenized electrode stack comprising both electrodes and electrolyte, characterized by effective anisotropic thermal properties. Such homogenization avoids the need for detailed layer-resolved material data, which are typically unavailable for commercial cells and would contradict the objective of developing a broadly applicable, system-level modeling approach.
Figure 4.
Simplified reconstruction of the internal structure of the NCR18650B cell by tracing CT-scan contours from [40] inside Autodesk Inventor. Dimensions are given in millimeters.
The choice of five concentric domains reflects a compromise between spatial resolution and model complexity. This subdivision preserves the dominant radial structure of the jelly roll while maintaining manageable geometric complexity for meshing and for subsequent reduction to a 1D thermal network. In particular, it enables explicit representation of an internal core region, which is critical from both thermal and safety perspectives, as the core typically exhibits the highest temperatures under load.
This subdivision is essential for enabling anisotropic modeling. In the 3D FVM simulations, anisotropic material properties can be applied directly to each concentric body, allowing directional heat conduction to be represented. In the reduced 1D thermal network, each concentric domain is mapped to a separate thermal node, allowing the radial temperature structure to be retained even though 1D thermal blocks cannot natively represent anisotropy.
While detailed layer-resolved thermal models are commonly used in cell design studies, system-level electro-thermal models for BMS and digital twin applications typically rely on one or two thermal nodes per cell; the proposed approach, which resolves multiple internal thermal nodes, already exceeds this level of fidelity while remaining computationally efficient. The full reconstructed geometry of the cell is shown in Figure 5.
Figure 5.
Visualization of the reconstructed cell geometry showing the concentric active-material bodies, casing, inactive top region, central mandrel, and terminal connections for the positive and negative poles.
Special attention was given to the region near the positive terminal, which contains several thin, highly conductive components—CID, PTC, current collector tabs, and the steel cap—forming one of the most thermally heterogeneous areas of the cell. Full geometric fidelity in this region would significantly complicate meshing and simulation; therefore, the non-active region near the cap was modeled as a few simplified bodies with adjusted properties to provide equivalent bulk behavior. This level of geometric detail nevertheless exceeds what is typically included in earlier modeling studies of the NCR18650B cell [30,33].
Several careful but necessary simplifications were applied to maintain numerical tractability of the three-dimensional model while preserving its energetic consistency. As a result of geometric homogenization, selected material parameters—namely the casing steel density, and the mandrel nickel density and thermal conductivity—were assigned effective equivalent values. These parameters do not represent intrinsic material properties, but they were introduced to preserve mass, thermal capacity, and realistic heat transfer behavior within the reduced-order geometric representation.
The stainless-steel casing was assigned a slightly increased thickness (0.2 mm instead of 0.14 mm reported by [33,34]) to ensure sufficient mesh resolution across the thickness and acceptable element quality. To compensate for this geometric modification, an equivalent density was introduced such that the total mass of the casing remained consistent with experimentally reported values ([34]), as summarized in Table 1 and Table 2. This approach preserves the thermal capacity of the casing while avoiding numerical artifacts associated with excessively thin shell representations.
Table 2.
Verification calculation of mass and heat capacity of cell internal components.
A similar homogenization strategy was applied to the mandrel. In reality, the mandrel consists of a thin, wound nickel foil with a partially hollow structure, as reported by [34]. Explicit modeling of this geometry would be computationally inefficient and numerically fragile; therefore, it was replaced by a solid cylindrical domain. Its density was adjusted to match the reported mandrel mass of 0.56 g ([34]), ensuring conservation of thermal mass. The thermal conductivity of this equivalent domain was reduced proportionally to avoid unrealistically low thermal resistance that would otherwise result from the increased effective volume. Given the minor role of the mandrel in radial heat transfer from the active material toward the casing, this approximation does not significantly influence the macroscopic temperature evolution of the cell.
As an initial verification step, the volumes, masses, and thermal capacities of all internal components were computed manually and cross-checked against available experimental data. The results are summarized in Table 2, confirming that the assembled geometry closely matches the realistic total cell mass (approximately 47 g). The resulting equivalent specific heat capacity of the complete cell is approximately 1031 J/(kg∙K), which lies well within the broad range of values reported for cylindrical lithium-ion cells (750–1969 J/(kg∙K)) [30,42,43,44].
Overall, the reconstructed geometry provides a realistic and computation-friendly representation of the NCR18650B cell, retaining all features necessary for accurate 3D thermal analysis and enabling a direct, physics-based transition to the reduced 1D thermal network developed in the following sections.
2.4. Three-Dimensional FVM Thermal Model
A 3D finite volume thermal model of the NCR18650B cell was developed to establish a high-fidelity thermal reference for validating the material parameters and for generating the reduced thermal network. All simulations were carried out in AVL FIRE M R2024.1, selected for its availability through the AVL University Partnership Program, its strong suitability for battery-focused multiphysics modeling, combining automotive-oriented capabilities, user-friendly operation even for non-expert FVM/FEM users, and an integrated tool for automated thermal-network generation [18,45]. This software uses finite volume solver (FVM), although the simulations were without flow, only in the solid domain. The goal of the 3D model at this stage was not to simulate electrochemical heat generation, but to reproduce pure heat conduction through the reconstructed cell geometry under controlled boundary conditions.
The 3D model directly incorporates the geometry created in Section 2.3 and the material properties summarized in Section 2.2. By isolating conduction from electrochemical effects, the model enables direct comparison with published axial and radial thermal conductivity measurements. For this purpose, the experimental work of Jiang et al. [31] was selected as the primary validation reference, because the authors measured the thermal conductivity of the NCR18650B under no-load conditions, using carefully designed apparatuses to isolate axial and radial conduction. This makes their data ideal for validating geometry-resolved thermal models.
2.4.1. Modeling Assumptions and Setup
At this stage of the workflow, only the thermal behavior of the cell was modeled. No electrochemical reactions, heat-generation mechanisms, or internal current flows were included. This also meant that no specific state of charge (SOC) of the cell could be defined in these simulations, and the resulting axial and radial thermal conductivity analyses are independent of SOC. Instead, the model examined how heat propagates through individual cell components and how it interacts with the external environment under steady-state or transient conditions.
The CAD model was imported into the AVL FAME M preprocessor and discretized into a solid mesh consisting of the concentric active-material domains, the mandrel, the current collector tabs, and the steel can. First, a surface mesh, then a volume mesh was generated to ensure uniform resolution across thin and curved features. Visualization of the mesh is shown in Figure 6.
Figure 6.
Surface and polyhedral volume mesh of the cell model generated in AVL FIRE M, including detailed views of the active-material layers, casing, inactive region and positive-tab interface. Volume mesh contains 1,873,908 nodes and 518,751 cells.
At the material configuration stage, all five concentric active-material domains were assigned directional anisotropic thermal conductance properties derived from the literature, while other components were modeled with isotropic material properties. No internal volumetric heat source was activated; instead, the model reproduced the experimental setups of Jiang et al. [31], where heat was applied externally and propagated through the cell.
Two validation scenarios were modeled:
- Axial conductivity experiment
Heat conducted from the plus pole surface toward the minus pole surface, and the boundary conditions reproduced the brass-cylinder setup used in Jiang’s experiment [31], with fixed opposing temperatures on cell poles.
- 2.
- Radial conductivity experiment
Heat entered through a quarter-cylindrical brass block on one side and exited through another on the opposite side (which had to be added to the mesh, see Figure 7), while the axial boundaries were set as adiabatic to enforce predominantly radial conduction.
Figure 7.
(a) FVM model of the NCR18650B cell in AVL FIRE M with added curved brass blocks, reflecting the real experimental configuration used in the radial thermal-conductivity measurements of [31]; (b) Half-cell schematic from [31] illustrating the symmetry simplification applied in their numerical study.
These experimental conditions were reproduced as closely as possible in the FVM domain. The resulting boundary conditions setup is illustrated in Figure 8 for axial and Figure 9 for radial simulation.
Figure 8.
Boundary conditions used for the axial thermal conductivity simulations in AVL FIRE M: fixed temperatures on the positive and negative tabs (first case 25/50 °C, second case 50/80 °C) and adiabatic conditions on all other surfaces.
Figure 9.
Boundary conditions used in the radial thermal-conductivity simulations: constant heat flux on the upper surface, constant temperature on the lower surface, and adiabatic conditions on all remaining boundaries.
2.4.2. Validation with Measurements from the Literature
- Axial conductivity scenario
Jiang et al. [31] measured axial thermal conductivity by clamping the cell between two brass cylinders, applying heat from the plus pole, and monitoring the steady-state temperature distribution along both brass blocks and the cell surface. To ensure the reproducibility of the simulation setup, the applied boundary conditions are defined as follows:
- The top of the cell was assigned a fixed temperature, applied on positive pole and casing surfaces, as seen on Figure 8;
- The bottom of the cell was also assigned a fixed temperature on negative pole surface;
- Side surfaces were considered adiabatic.
A summary of full simulation setup and solver configuration is listed in Table 3.
Table 3.
Configuration of AVL FIRE M simulation for validation of axial thermal conductivity.
Representative 3D results are shown in Figure 10, including axial-slice temperature contours and the corresponding heat-flux distribution, with scalar values summarized in Table 4. The effective axial thermal conductivity was calculated using the one-dimensional Fourier relation , based on the simulated heat flow , the axial temperature difference , the effective cross-sectional area , and the cell length . The simulated temperature field exhibited a nearly linear axial gradient consistent with experimental observations, and the resulting conductivity closely matched the values reported by Jiang (≈10–14 W/m·K, depending on SOC and temperature) [31].
Figure 10.
Heat flux (top) and temperature (bottom) fields from the axial thermal conductivity simulation performed in AVL FIRE M.
Table 4.
Comparison of effective axial thermal conductivity for two simulated cases and literature values [31].
- 2.
- Radial conductivity scenario
For the radial case, Jiang et al. used two brass blocks contacting the cell over a 90° arc to drive heat laterally through the jelly roll [31]. Because this boundary configuration leads to a non-trivial heat-conduction geometry, an analytical evaluation of radial conductivity was not feasible. Instead, the authors performed a computational fluid dynamics (CFD) simulation and iteratively adjusted the radial conductivity until the computed temperatures matched their measurements. This yielded values in the range of 2.1–2.9 W/(m·K), which are higher than our final estimates (Table 1) and typical literature values. We attribute this discrepancy to their geometric simplification in the axial direction, where the entire cell was modeled as a single homogeneous material. In contrast, our model explicitly resolves the active material with its higher intrinsic axial conductivity (20 W/(m·K), compared to Jiang’s reported 10–14 W/(m·K)), while also capturing the thermal bottleneck created by the positive-terminal assembly. This bottleneck reduces the effective axial conduction of the full cell, resulting in overall values comparable to those reported by Jiang et al. (Table 4). Because this effect is absent in Jiang’s simplified geometry, their model compensates by requiring a higher radial conductivity. For this reason, we do not take their fitted conductivity values as direct reference data; instead, we compare our simulations directly against their raw measured temperature fields.
To ensure the reproducibility of the simulation setup, the applied boundary conditions and material properties are defined as follows:
- A quarter-cylindrical contact surface was modeled between the brass block and the cell;
- The upper brass block’s contacting surface was assigned the applied heat flux derived from Jiang’s experiment;
- The opposing, lower contact surface was set to the measured cooling-block temperature;
- Other boundaries were treated as adiabatic, which is consistent with Jiang’s simplified CFD domain.
Simulation setup for radial thermal conductivity was analogic to the previous scenario, seen in Table 3. Three-dimensional results, in the form of visualization of simulated heat flux and temperature distributions are presented in Figure 11; the scalar results are in Table 5.
Figure 11.
Heat flux (top) and temperature (bottom) fields from the radial thermal conductivity simulation performed in AVL FIRE M.
Table 5.
Comparison of temperature differences between the upper and lower cell surfaces (planes T4 and T5 in [31]) for two simulated cases and literature measurements, used as an indicator of radial thermal conductivity.
Summary
The 3D FVM model successfully reproduced both the axial and radial heat-transfer behavior reported in controlled literature experiments, thereby validating the reconstructed cell geometry, the consolidated material properties, and the suitability of the 3D model as a reference for generating the reduced thermal network. The validated 3D model thus forms the foundation for the reduction described in Section 2.5.
2.5. Reduction to a Thermal Network
The validated 3D finite volume model provides a high-fidelity representation of heat transfer inside the cell but remains computationally unsuitable for real-time applications such as BMS-level estimation. To bridge this gap, the 3D model was systematically reduced to a 1D thermal network, preserving the essential heat-transfer behavior while reducing computational requirements by several orders of magnitude. The reduction followed a structured, automated approach based on AVL’s Thermal Network Generator [18] and a custom MATLAB post-processing tool. MATLAB version R2024b was used for all the activities presented in this article.
2.5.1. Rationale and Challenges of Reduction
Transitioning from a detailed 3D thermal model to a low-order model suitable for battery-management applications requires careful balancing of accuracy and computational cost. The core challenge lies in selecting an appropriate network structure—specifically, determining how many thermal masses are required and how the conductive links between them should be defined. In addition, identifying the lumped or effective parameters is non-trivial and can be approached in several ways, ranging from multi-parameter optimization, as demonstrated in [7], to analytical extraction from a 3D reference model, as adopted in this work. For cylindrical cells, several factors complicate this process:
- Complex internal geometries: Non-uniform shapes such as the mandrel, current-collector tabs and terminal structures create conduction paths that are difficult to approximate analytically.
- Poorly defined thermal contacts: Interfaces between components (e.g., active material to steel can, active material to negative terminal) do not behave as ideal planar contacts and therefore are hard to represent by simple analytical conductances.
- Thermal anisotropy: Cylindrical jelly rolls exhibit strong directional conductivity, with axial conductivity often an order of magnitude higher than radial conductivity.
While anisotropy can be assigned directly in 3D, 1D thermal networks cannot represent anisotropic materials. Instead, the anisotropy must emerge from the structure of the network itself. For this reason, the active material was divided into five concentric bodies during geometry reconstruction. Each body becomes an individual thermal mass in the 1D model, allowing conduction resistances between them to capture the inherently poorer radial heat transfer. This structural representation of anisotropy proved essential for achieving good agreement with the 3D model.
2.5.2. Automated Reduction Methodology
The reduction process consisted of two automated stages:
AVL Thermal Network Generator
AVL FIRE M includes a built-in Thermal Network Generator that analyzes a complete 3D thermal simulation and automatically extracts the thermal network, identifying all thermal domains (solid bodies) as thermal masses and determining the conductive links between each pair of domains together with their equivalent conductances. Each converged simulation step produces a .dat file containing a full description of the corresponding 1D thermal network, if this function is enabled.
Emphasizing this automation is important: the generator performs the complete 3D→1D reduction algorithmically, but its accuracy depends strongly on how the geometry is partitioned and how boundary conditions are applied. For this reason, the process cannot be considered fully automatic in a strict sense—the quality and suitability of the resulting network still rely on expert choices regarding the domain partitioning, as well as on iterative testing, similar to a mesh-sensitivity study in 3D simulations to identify an appropriate balance between network complexity and accuracy.
Custom MATLAB/Simulink Conversion Tool
Because the target environment for the electro-thermal model was MATLAB/Simulink, a custom parser was developed to automatically translate the .dat files generated by AVL FIRE M into a Simscape-based thermal network. Each thermal body was converted into a Thermal Mass block, and each conductive interface into two Conductive Heat Transfer blocks. Although the extracted thermal network is originally intended for import into AVL CRUISE M, we verified that the MATLAB/Simulink implementation reproduces its behavior with an error approx. 1% (verification details beyond the scope of this work).
Key Technical Considerations
Several important aspects were identified during the reduction:
- Domain selection defines the network topology. The split into concentric active-material regions, a separate mandrel, casing, and terminal structures directly determined the number of thermal nodes and the network’s spatial resolution.
- Treatment of anisotropy. After several tests, we found that the most consistent way to capture the directional conductivity was to temporarily assign isotropic properties to the active-material domains in the 3D simulations, setting them equal to the axial thermal conductivity. Anisotropy was then reintroduced in the 1D network by manually reducing the conductance between the concentric active-material bodies (i.e., along the radial paths). This hybrid approach proved both effective and physically consistent.
- Single-case extraction requires multi-case verification. Because FIRE M generates the network from a single steady-state snapshot, its robustness cannot be guaranteed without additional testing. For this reason, a parametric study of 27 steady-state 3D simulations with varying heat generation, convection coefficient and ambient temperature was evaluated. The resulting networks were the same in structure and highly consistent in the parameters, confirming that the reduction procedure is stable over realistic operating conditions. Detailed results are beyond the scope of this work. The final thermal network structure selected for electro-thermal integration is shown in Figure 12.
Figure 12.
Thermal network generated in MATLAB Simulink from the AVL FIRE M .dat file. Additional solver, boundary, sensing, and source blocks were later added to make the network functional and comparable to the 3D FVM simulation setup.
2.5.3. Validation of the Thermal Network Against the 3D Model
To confirm the equivalence between the reduced thermal network model and the high-fidelity 3D reference for full spectrum of considered conditions, a transient validation scenario was created. In it, ambient temperature, convection coefficient and volumetric heat generation varied dynamically over time, as shown in Figure 13. The thermal network in Simulink was extended with controlled boundary-condition blocks to impose these time-varying conditions into the network.
Figure 13.
Time evolution of the volumetric heat generation, ambient temperature and convection coefficient used for validating the equivalence of the 3D FVM and thermal network models.
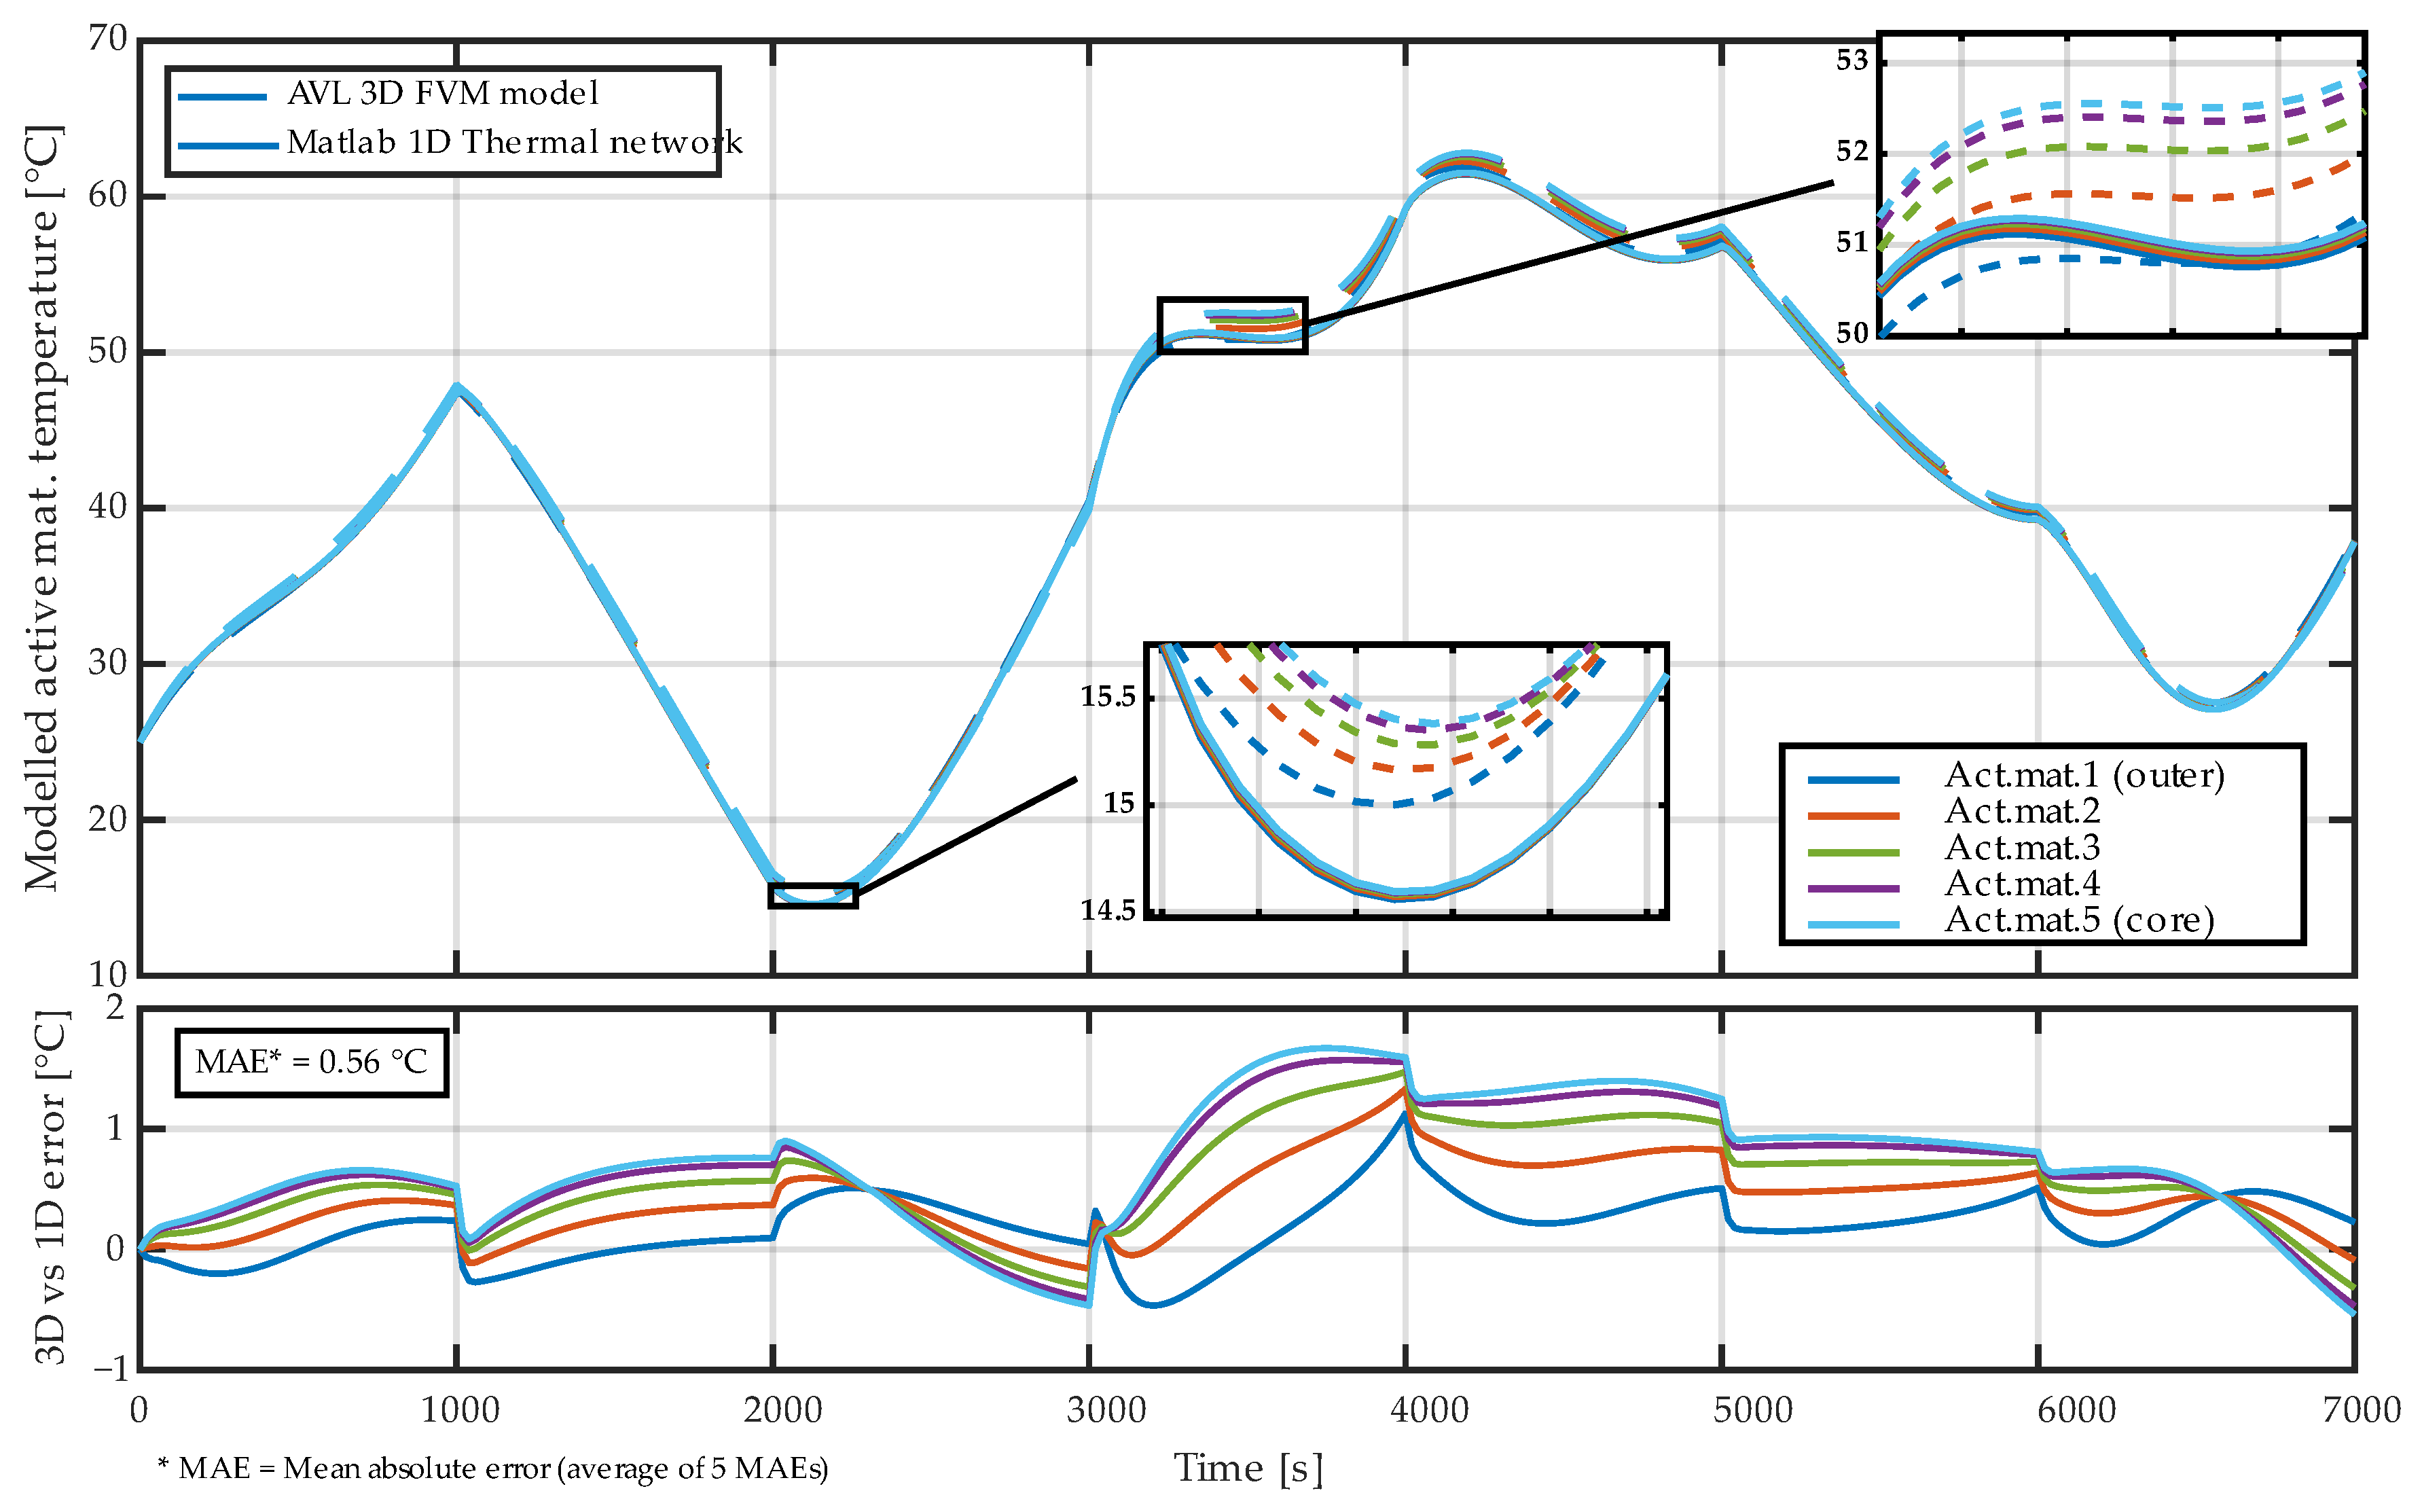
Initial comparisons showed that the unmodified thermal network model did not fully capture the behavior of the 3D model due to the absence of anisotropy, as expected. After applying the anisotropy adjustment strategy described earlier—reducing conductance between active material bodies and between the outer active material layer and the steel casing—the matching improved substantially. The reduction factor was computed analytically as the ratio of axial to radial conductivity (20/1.5 = 13.3), with an empirically tuned factor (≈2.5) applied specifically at the casing interface. As a result, the reduced network effectively reproduces the anisotropic heat-transfer behavior of the full 3D model. The influence of the anisotropy correction strategy on the accuracy of the reduced thermal model is further analyzed in Appendix B, where isotropic and uniformly corrected reductions are compared against the adopted interface-specific correction.
The temperatures of all five active-material bodies were extracted from both models (volume-averaged values from the 3D model vs. node temperatures from the thermal network), as the active material is the primary region of interest for electro-thermal behavior and internal-state estimation, and therefore provides the most relevant basis for comparing the two models. As shown in Figure 14, the reduced model accurately reproduced both the magnitude and dynamics of the 3D temperatures, with deviations typically less than 0.5 °C.
Figure 14.
Comparison of the simulated temperatures of the five active-material bodies obtained from the 3D FVM model in AVL FIRE M and the thermal network model in MATLAB Simulink during the dynamic validation cycle shown in Figure 13. The lower panel shows the temperature difference between the 3D and 1D models for each domain.
This confirms that the reduced thermal network captures the essential conduction behavior of the detailed FVM model and can serve as a reliable building block for constructing the full electro-thermal model.
With respect to the selected number of thermal nodes, the five-domain discretization was found to be sufficient for the operating conditions considered. The 3D reference simulations indicate that radial temperature gradients within the NCR18650B cell remain relatively modest, on the order of approximately 2 °C under the applied load profile. For such gradient magnitudes, the adopted discretization captures the essential internal temperature structure while avoiding unnecessary model complexity.
It is acknowledged that the number of thermal domains is not a fixed or universal choice. Reducing the number of nodes would further limit the ability to resolve internal gradients, whereas increasing the number of domains would gradually approach a layer-resolved representation of the jelly roll, which constitutes an upper bound in terms of meaningful spatial resolution. A systematic sensitivity study of the optimal number of thermal nodes could be performed in future work; however, without direct measurements of internal temperature, it is not possible to define an unambiguous optimal discretization. From a practical perspective, the critical requirement is the explicit representation of an internal cell core volume, which is most relevant from a thermal safety and degradation standpoint and is directly addressed by the adopted modeling approach.
2.6. Electro-Thermal Model Construction
2.6.1. Electro-Thermal Integration
The reduced 1D thermal network was combined with an electrical model to form a full electro-thermal representation of the NCR18650B cell in MATLAB/Simulink. The electrical subsystem was implemented using the Simscape Battery Table-Based blocks, parametrized using previously identified ECM with 2RC (2 resistor–capacitor pairs) structure and SOC + temperature dependent parameters for 5–45 °C range (details in Appendix A).
Direct coupling of the Table-Based block with the thermal network was not possible, because the block internally contains its own lumped thermal mass and a simplified electro-thermal structure. It does not support multiple internal thermal bodies or spatial temperature distribution. To overcome this limitation, five parallel Table-Based blocks were created, each representing one concentric active-material domain used in the reduced thermal network. This design choice is rarely reported in the literature and provides an effective workaround for commercial blocks lacking multi-node thermal coupling capabilities.
Each block was modified as follows:
- Capacity scaling:
- Each block’s capacity was set proportional to the volume of the corresponding active-material domain.
- Internal electrical resistance scaling:
All ECM resistances were increased proportionally to the volume fraction, ensuring that the total electrical resistance of the five blocks in parallel matched the full model.
- RC time-constant adjustment:
Time constants of both RC branches were reduced proportionally, with additional manual tuning of their influence.
Irreversible heat generation in this model is computed internally by the Battery Table-Based blocks based on current and terminal voltage and directly internally tied to the respective thermal masses. These masses then interact with the rest of the generated thermal network. A schematic of the important parts of resulting electro-thermal model structure is shown in Figure 15 and Figure 16.
Figure 15.
Lower part of the extended thermal network showing the PVC shrink-wrap, heat transfer to the casing, and the ambient-convection boundaries acting on the exposed cell surfaces.
Figure 16.
Upper section of the completed electro-thermal model, showing the five Battery Table-Based blocks connected to the imported thermal network instead of the original act. mat. thermal masses, together with the electrical excitation circuitry and temperature sensors for the internal act. mat. domains.
2.6.2. External Thermal Influences and Model Completion
To allow realistic comparison with laboratory measurements, these additional thermal influences were incorporated into the model (see Figure 15). These influences represent environment-specific boundary conditions rather than intrinsic cell properties:
- Convective heat transfer:
Because the real cell was tested in a standalone setup, just with convection in the thermal chamber (as can be seen later), the influence of the convection was modeled with Temperature source and Convection blocks to all outer parts of the cell. An initial estimate of the convective heat transfer coefficient (h = 30 W/(m2∙K)) was selected based on the presence of forced air circulation inside the chamber, and this value was later refined through numerical calibration.
- PVC heat-shrink layer:
A thin polyvinyl chloride (PVC) sleeve was added as an additional outer thermal body, because initial surface-temperature comparisons indicated that neglecting this layer leads to an underestimation of temperature. The surface area (A = 4000 mm2) was taken from the geometry model, thickness from [34] (t = 0.065 mm), thermal conductivity (λ = 0.5 W/(m∙K)), and heat capacity (C = 0.403 J/K, calculated from mass m = 0.31 g [34] and specific heat capacity c = 1300 J/(kg∙K)) were initially taken from literature, later identified by numerical optimization.
These additions complete the electro-thermal model by enabling realistic representation of heat exchange with the environment, while keeping the internal thermal network and electrical model unchanged.
3. Results
A dedicated validation experiment was carried out to evaluate the performance of the complete electro-thermal model. A single NCR18650B cell was mounted in a four-wire test fixture and placed inside a thermal chamber (Weiss Technik, Reiskirchen-Lindenstruth, Germany), as shown in Figure 17. Voltage and current were measured using a four-wire configuration.
Figure 17.
Experimental configuration with the cell mounted in a four-wire holder inside the thermal chamber, equipped with three surface temperature sensors (for redundancy) and one ambient temperature sensor.
The applied dynamic load profile—shown in Figure 18—consisted of pulse-discharge cycles spanning the full SOC range from 100% down to 0%. The discharge current pulses had an amplitude of −5 A, corresponding to approximately 1.56 C based on the nominal cell capacity of 3.2 Ah, while the charging current was limited to 1.6 A (0.5 C). This profile was selected to represent moderate dynamic operating conditions suitable for validation of the electro-thermal workflow rather than extreme operating regimes.
Figure 18.
Final validation cycle with current, voltage, SOC, and temperature measurements compared to the simulated responses, including voltage and surface-temperature modeling errors.
To ensure robustness of surface temperature measurement, three temperature sensors were installed on the cell surface to mitigate potential errors caused by imperfect thermal contact (1× PT100 sensor (TEWA Temperature Sensors Sp. z o.o., Lublin, Poland) and 2× thin-film PT1000 sensors (TE Connectivity, Galway, Ireland)). Based on signal quality and consistency, one of the PT1000 sensors was selected and used as the representative surface temperature for model validation.
The ambient temperature inside the thermal chamber varied according to a predefined trajectory designed to repeatedly traverse the temperature window for which the ECM parameters were identified (5 to 45 °C), thereby exposing the cell to multiple combinations of SOC and temperature. Current, voltage, surface temperature and environmental temperature were recorded continuously with a Keysight DAQ970A system (Keysight Technologies, Santa Rosa, CA, USA), with 5 s. sampling period.
After the initial comparison of simulation and measurement, a limited calibration of external boundary parameters was performed. Specifically, the convective heat transfer coefficient and the effective thermal properties of the PVC sleeve were refined using numerical optimization with the Simulink Design Optimization (Parameter Estimator) tool. This calibration was intentionally restricted to a small set of environment-specific parameters governing heat exchange with the surroundings, while the internal thermal network and the temperature-dependent electrical model parameters remained unchanged. The stepwise impact of this calibration, including baseline and intermediate configurations, is documented in Appendix C.
After these refinements, final simulated and measured quantities of this model compared to the experiment, including terminal voltage, SOC, surface temperature and internal active-material temperatures, are shown in Figure 18. The model demonstrates the following:
- Very good agreement in temperature dynamics, with surface-temperature mean absolute error (MAE) ≈ 0.43 °C.
- Estimation of internal active-material temperatures, illustrating the benefit of the multi-node thermal network (as shown in Figure 19).
- High electrical-model fidelity, with voltage MAE ≈ 16 mV across the entire dynamic load cycle.
- Real-time computational capability, with simulation time significantly shorter than real elapsed time.
Figure 19.
Cell surface temperature validation with measured and simulated values, complemented by the simulated temperatures of the active material bodies for the final validation cycle. Darker green corresponds to the inner (core) active-material body, while lighter green represents bodies closer to the cell surface.
The computational performance of the reduced electro-thermal model was evaluated using the Simulink Solver Profiler. A dynamic validation cycle of 10,000 s simulated time was completed in 74.7 s on a standard laptop CPU (AMD Ryzen 9 6900HS, 24 GB DDR5 RAM), corresponding to a run-to-simulation time ratio of 0.0075 (approximately 134× faster than real time). This confirms that the proposed model comfortably meets real-time requirements for digital-twin and online estimation applications. Overall, these results confirm that the electro-thermal model is accurate, computationally efficient, and suitable for digital twin or real-time state-estimation applications.
4. Discussion
4.1. Interpretation of Results
The results confirm that the proposed workflow—combining geometry-resolved 3D thermal modeling, semi-automated 1D reduction, and multi-domain electrical coupling—produces an electro-thermal model capable of accurately capturing both internal and surface temperature dynamics, as well as match the voltage dynamics. The multi-node structure of the thermal network proved essential for representing radial temperature gradients, which would be impossible to reproduce using a single node lumped model. The good agreement with literature-based axial and radial thermal conductivity measurements, followed by successful validation against the climatic-chamber experiment, demonstrates that the reduced model preserves the key heat-transfer behavior of the detailed FVM reference.
The electrical part, implemented using five parallel Table-Based blocks, also performed consistently. Despite the inherent simplifications of the Table-Based architecture, the adjusted capacities, electrical resistances, and resistance–capacitance (RC) time constants allowed the electrical response to match dynamic voltage behavior with high accuracy. Together, these results confirm that the combined model provides a reliable representation of the NCR18650B cell under realistic operating conditions.
4.2. Comparison with Existing Approaches
Compared with electrochemical–thermal models based on P2D/DFN formulations, the present approach offers a substantially lower computational cost while maintaining physically meaningful structure. Fully coupled models remain impractical for real-time use or BMS-level estimation due to high dimensionality and extensive parameter requirements. Data-driven thermal models provide fast prediction but lack interpretability, generally require large datasets, and often extrapolate poorly beyond trained conditions [5]. Simple analytical lumped parameter models usually cannot capture anisotropy or spatial gradients.
Existing reduction approaches (e.g., [18,19]) demonstrate how thermal networks can approximate detailed FVM behavior, but they typically focus on reduction alone. The present work extends these methods by integrating the reduced network directly with an electrical ECM, forming a complete electro-thermal model suitable for real-time digital twin applications. This direct integration, including the multi-domain electrical structure, is a key distinction from the previous literature.
4.3. Limitations
Several limitations of the present results should be acknowledged. This study does not aim to produce an exhaustively calibrated model of a specific battery cell; rather, its objective is to develop and demonstrate a methodology for constructing such a model. For this reason, some individual steps were intentionally kept pragmatic rather than optimized to their theoretical limits. The focus is on establishing and validating the overall workflow, which the results show to be both feasible and promising.
A primary limitation of the present study lies in the electrical equivalent-circuit model (ECM) used for electro-thermal coupling (briefly described in Appendix A). The ECM was adopted from prior work and identified only over a temperature range of 5 °C to 45 °C, and it represents a baseline electrical description without explicit consideration of extreme operating conditions such as sub-zero temperatures or high C-rate charge and discharge. Under such conditions, lithium-ion cell behavior is dominated by electrochemical effects, including strong temperature and current dependence of internal resistance, polarization, and heat-generation mechanisms. In addition, heat generation in the present study considers only irreversible (Joule) losses, while reversible (entropic) heat contributions—which can become more relevant at certain charge–discharge rates and operating regimes—are not explicitly modeled.
From a thermal modeling perspective, however, the proposed framework remains applicable beyond the validated operating range. Heat-conduction mechanisms within the cell do not fundamentally change under sub-zero conditions or higher C-rates, and more complex operating scenarios can be addressed through improved electrical modeling and the introduction of temperature- and state-dependent material properties and heat-generation terms. The modular structure of the proposed workflow allows such extensions without changes to the underlying reduction methodology, enabling progressive refinement of the electrical model and heat-generation description once the overall electro-thermal workflow has been established and validated. Regarding the specific limitations of the thermal model reduction approach, the 3D model employs an axisymmetric representation of the jelly roll, which is a practical and widely used approximation but does not capture localized geometric effects near the tabs. The positive terminal assembly, although modeled with higher fidelity than in earlier studies, also remains simplified relative to its full geometric complexity. Validation was restricted to single-cell conditions, and material properties were treated as temperature-independent. Furthermore, the applied boundary conditions reflect controlled laboratory settings rather than real module-level environments.
Another limitation of the present study is that no fully coupled transient 3D electro-thermal simulation was constructed for direct accuracy and runtime comparison with the reduced model. In this work, the 3D simulations were intentionally restricted to geometry-resolved thermal conduction analyses required for material validation and thermal-network extraction. While fully coupled 3D electro-thermal models can provide additional insight, they are computationally demanding, require careful multiphysics convergence tuning, and are typically very time-consuming for transient analyses and iterative parameter optimization on standard computational resources. The chosen scope therefore reflects a deliberate methodological decision to balance model fidelity and computational practicality and demonstrates results achievable without constructing a fully coupled 3D electro-thermal model.
Finally, direct validation of internal temperatures was not possible; however, the strong agreement in surface temperature dynamics and electrical behavior suggests that the predicted internal thermal states are physically consistent. In this sense, the model demonstrates the capability of the proposed methodology to estimate internal temperatures, with the understanding that dedicated internal measurements would further refine and quantify the absolute accuracy.
However, these limitations do not affect the goals of the present work, as the model is intended primarily as a methodological demonstrator that can be extended and experimentally supported in future applications.
4.4. Future Applications and Development
The reduced electro-thermal model created in this work can serve as a reusable unit for scaling toward module-level and system-level modeling. The same workflow—geometry-resolved 3D modeling, reduction into thermal domains and electro-thermal coupling—can be applied to a cell together with its surrounding thermal management components, such as cooling plates or conductive pads. In the future work, this can enable constructing a repeatable “cell-plus-cold plate” building block that reflects real module architecture. Because the reduced model is computationally inexpensive, it can be replicated across many cells to form a pack-level digital twin, capable of capturing non-uniform cooling, spatial temperature gradients, or imbalanced aging. By providing multi-node thermal state estimation, such a model has the potential (after internal temperature validation) to support advanced SOC/SOH estimation, thermal-runaway risk analysis, or real-time BMS functions, particularly in applications where internal temperature gradients cannot be measured directly.
The approach can also be expanded toward multi-domain twins by linking the thermal model with degradation, mechanical or cooling system models, forming a more comprehensive system-level representation.
5. Conclusions
A complete geometry-resolved electro-thermal modeling workflow for the NCR18650B cell was developed, combining detailed 3D thermal simulation, automated reduction to a multi-node thermal network, and electrical integration using five parallel Battery Table-Based blocks. The resulting model accurately reproduces surface temperature dynamics as well as terminal voltage behavior under realistic operating conditions and estimates internal temperature. Validation against the literature measurements and a dedicated thermal chamber experiment demonstrated low temperature and voltage errors, confirming the physical fidelity of the reduced model. The approach retains clear interpretability, computational efficiency and direct compatibility with simulation and control environments. This makes the workflow suitable for digital twin development, internal state estimation and future extension toward degradation and module-level modeling. The methodology presented here will be further applied, extended, and independently validated within the HORIZON EU FreeTwinEV project, where it will also be compared against alternative electro-thermal and digital twin modeling approaches to assess its robustness and general applicability across different cell formats and operating conditions.
Author Contributions
Conceptualization, M.B. and M.S.; Methodology, M.B., M.S., M.M.U., G.G. and A.Ü.; Software, M.B., M.P. and A.Ü.; Validation, M.B. and M.P.; Formal analysis, M.B. and G.G.; Investigation, M.B., M.P., Š.B. and A.Ü.; Resources, Š.B.; Data curation, M.B. and M.P.; Writing—original draft preparation, M.B.; Writing—review and editing, M.M.U., G.G., M.S. and D.R.; Visualization, M.B. and M.M.U.; Supervision, D.R.; Project administration, M.B. and G.G.; Funding acquisition, M.B. and G.G. All authors have read and agreed to the published version of the manuscript.
Funding
This work was supported by HORIZON EU “FreeTwinEV” project no. 101159989 and by the national project “FreeMatch” (project No. 09I01-03-V04-00112), funded through the Slovak Recovery and Resilience Plan.
Data Availability Statement
The original contributions presented in this study are included in the article. Further inquiries can be directed at the corresponding author.
Acknowledgments
The authors would like to thank AVL List GmbH for providing access to their simulation solutions through the AVL University Partnership Program, which were used in this work and in other modeling activities at the Slovak University of Technology in Bratislava. The paper was also supported by the Slovak Scientific Grant Agency grant No. VEGA 1/0637/23. During the preparation of this manuscript, the authors used ChatGPT (OpenAI, GPT-5.1) for the purposes of translations, language editing, text refinement, and consistency checking. The authors have reviewed and edited the output and take full responsibility for the content of this publication.
Conflicts of Interest
Author Markus Schörgenhumer was employed by the company Linz Center of Mechatronics GmbH. The remaining authors declare that the research was conducted in the absence of any commercial or financial relationships that could be construed as a potential conflict of interest.
Abbreviations
The following abbreviations are used in this manuscript:
| ECM | Equivalent Circuit Model |
| DFN | Doyle–Fuller–Newman (electrochemical model) |
| P2D | Pseudo-two-dimensional (electrochemical model) |
| DET | Distributed electro-thermal model |
| FVM | Finite Volume Method |
| FEM | Finite Element Method |
| ROM | Reduced-order model |
| CAD | Computer-Aided Design |
| CT | Computed Tomography |
| PTC | Positive Temperature Coefficient device |
| CID | Current Interrupt Device |
| PVC | Polyvinyl chloride |
| SOC | State of Charge |
| SOH | State of Health |
| SOP | State of Power |
| NCA | Nickel Cobalt Aluminum Oxide |
| CFD | Computational Fluid Dynamics |
| RC | Resistor–Capacitor (branch in ECM) |
| EV | Electric Vehicle |
| BMS | Battery Management System |
| MAE | Mean Absolute Error |
| AI | Artificial Intelligence |
Appendix A. Used Electrical Equivalent-Circuit Model (ECM)
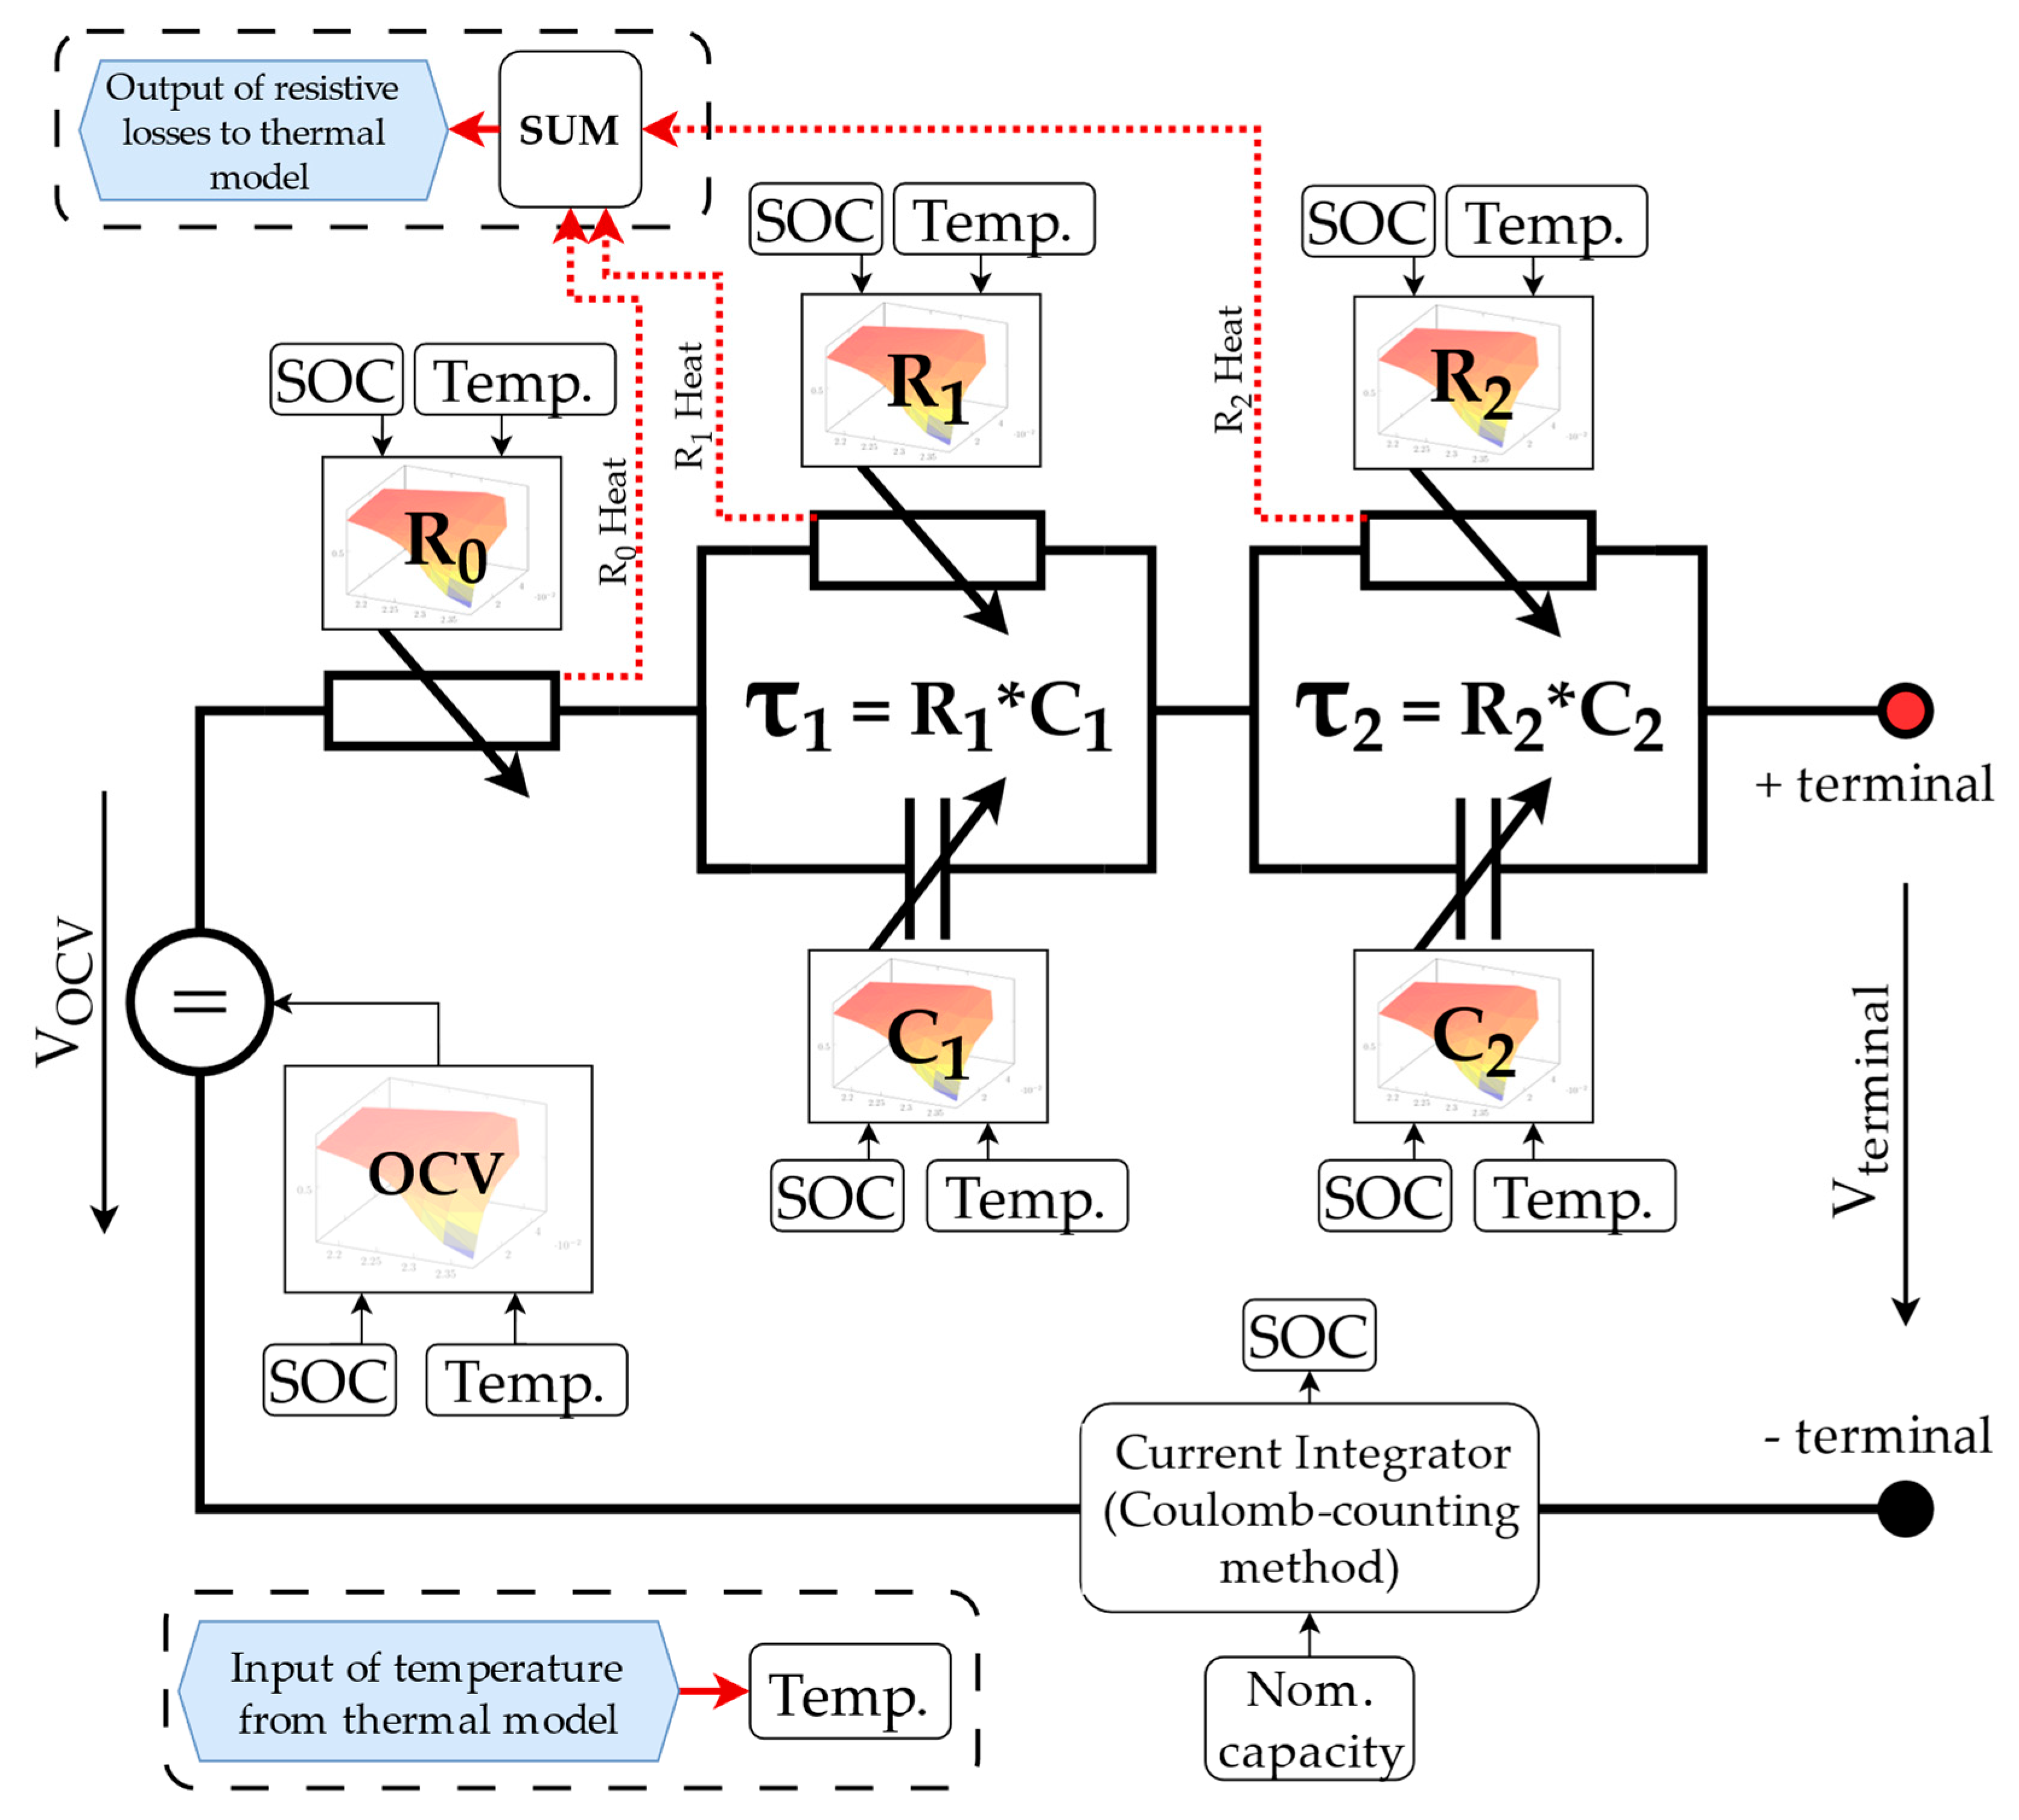
The electrical behavior of the NCR18650B lithium-ion cell was represented using a second-order equivalent-circuit model (2RC ECM), adopted from prior work and used as a baseline electrical description for electro-thermal coupling. The model structure is shown schematically in Figure A1. It consists of an open-circuit voltage source (OCV) connected in series with an ohmic resistance R0 and two parallel RC polarization branches (R1, C1) and (R2, C2), capturing the dominant short- and mid-time-scale voltage dynamics under load.
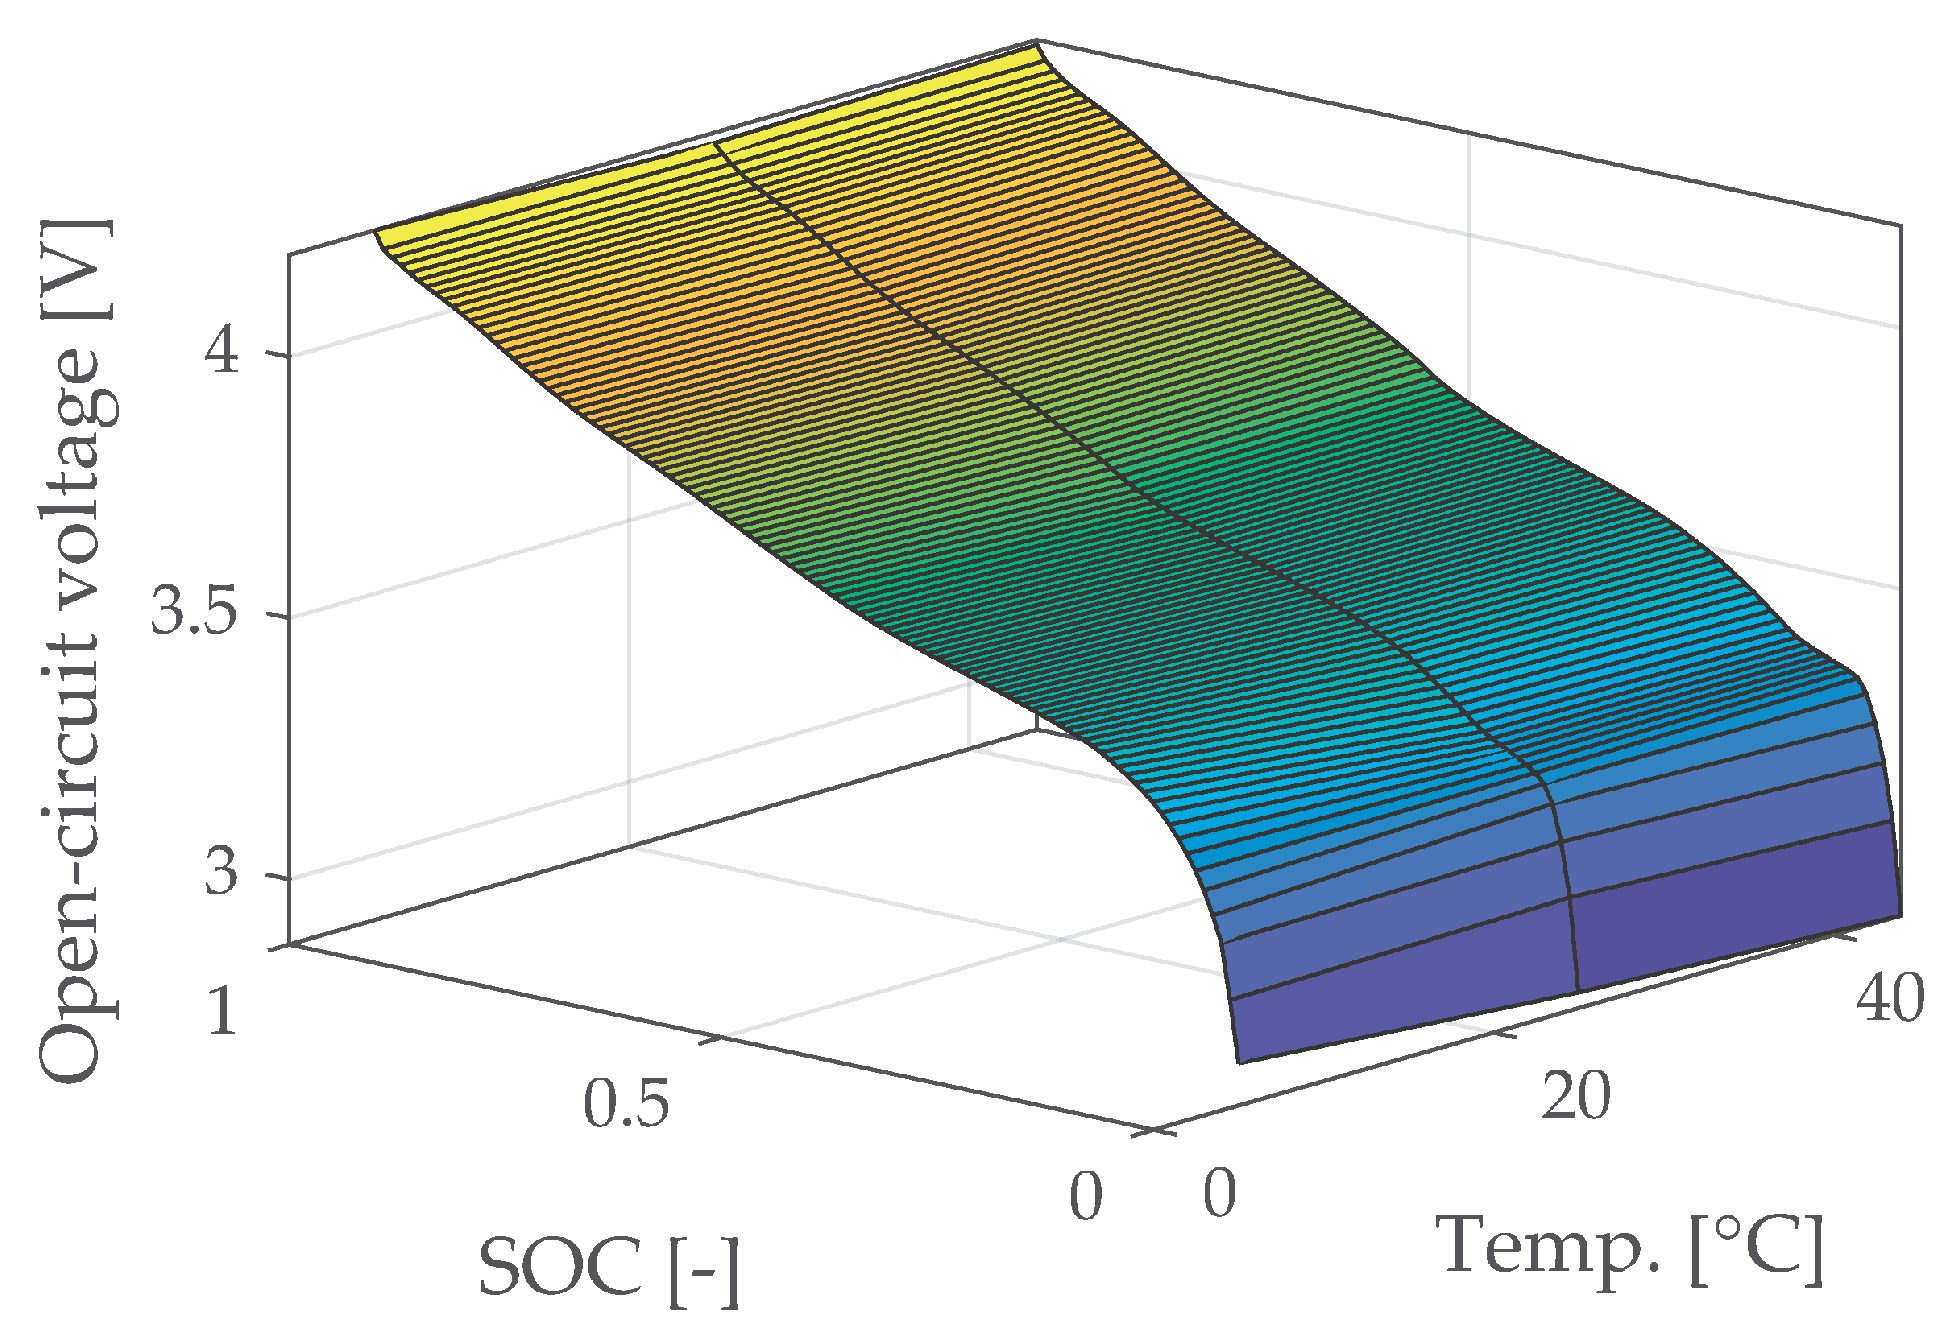
All ECM parameters—including the OCV–SOC relationship, ohmic resistance, polarization resistances, and capacitances—are defined as functions of the state of charge (SOC) and temperature. Parameter identification was performed in thermal chamber over the full SOC range from 0% to 100% and for three ambient/cell temperatures (5 °C, 25 °C, and 45 °C), which define the validated operating window of the electrical model. Outside this temperature range, the ECM is not considered validated and was therefore not applied to sub-zero or high-temperature operating conditions.
Figure A1.
Structure of the second-order equivalent-circuit model (2RC ECM) used for electro-thermal coupling, including the OCV source, ohmic resistance R0, and two RC polarization branches. Thermal model is coupled by temperature input and resistive losses output.
Representative parameter maps of the ECM are shown in Figure A2 and Figure A3. Figure A2 presents the SOC–temperature dependence of the dynamic parameters, while Figure A3 shows the interpolated OCV–SOC characteristics for the three identification temperatures and the resulting temperature-dependent OCV characteristics. These parameter maps form the lookup tables used in the system-level implementation of the electro-thermal model.
For electro-thermal coupling, the ECM implementation based on the Battery Table-Based block provides heat generation associated with internal resistive losses. The block includes an internal thermal mass to capture heat accumulation, while reversible (entropic) heat effects are not explicitly parameterized and would require additional electrochemical inputs beyond the scope of this work. The temperature of the internal thermal mass is used as an input to the temperature-dependent lookup tables of the electrical model, thereby influencing the electrical behavior. The ECM therefore serves as a pragmatic baseline electrical representation for validating the proposed geometry-resolved thermal modeling and reduction workflow.
Figure A2.
SOC–temperature dependent parameter maps of the 2RC ECM, including R0, R1, C1, R2 and C2, identified for temperatures of 5 °C, 25 °C, and 45 °C.
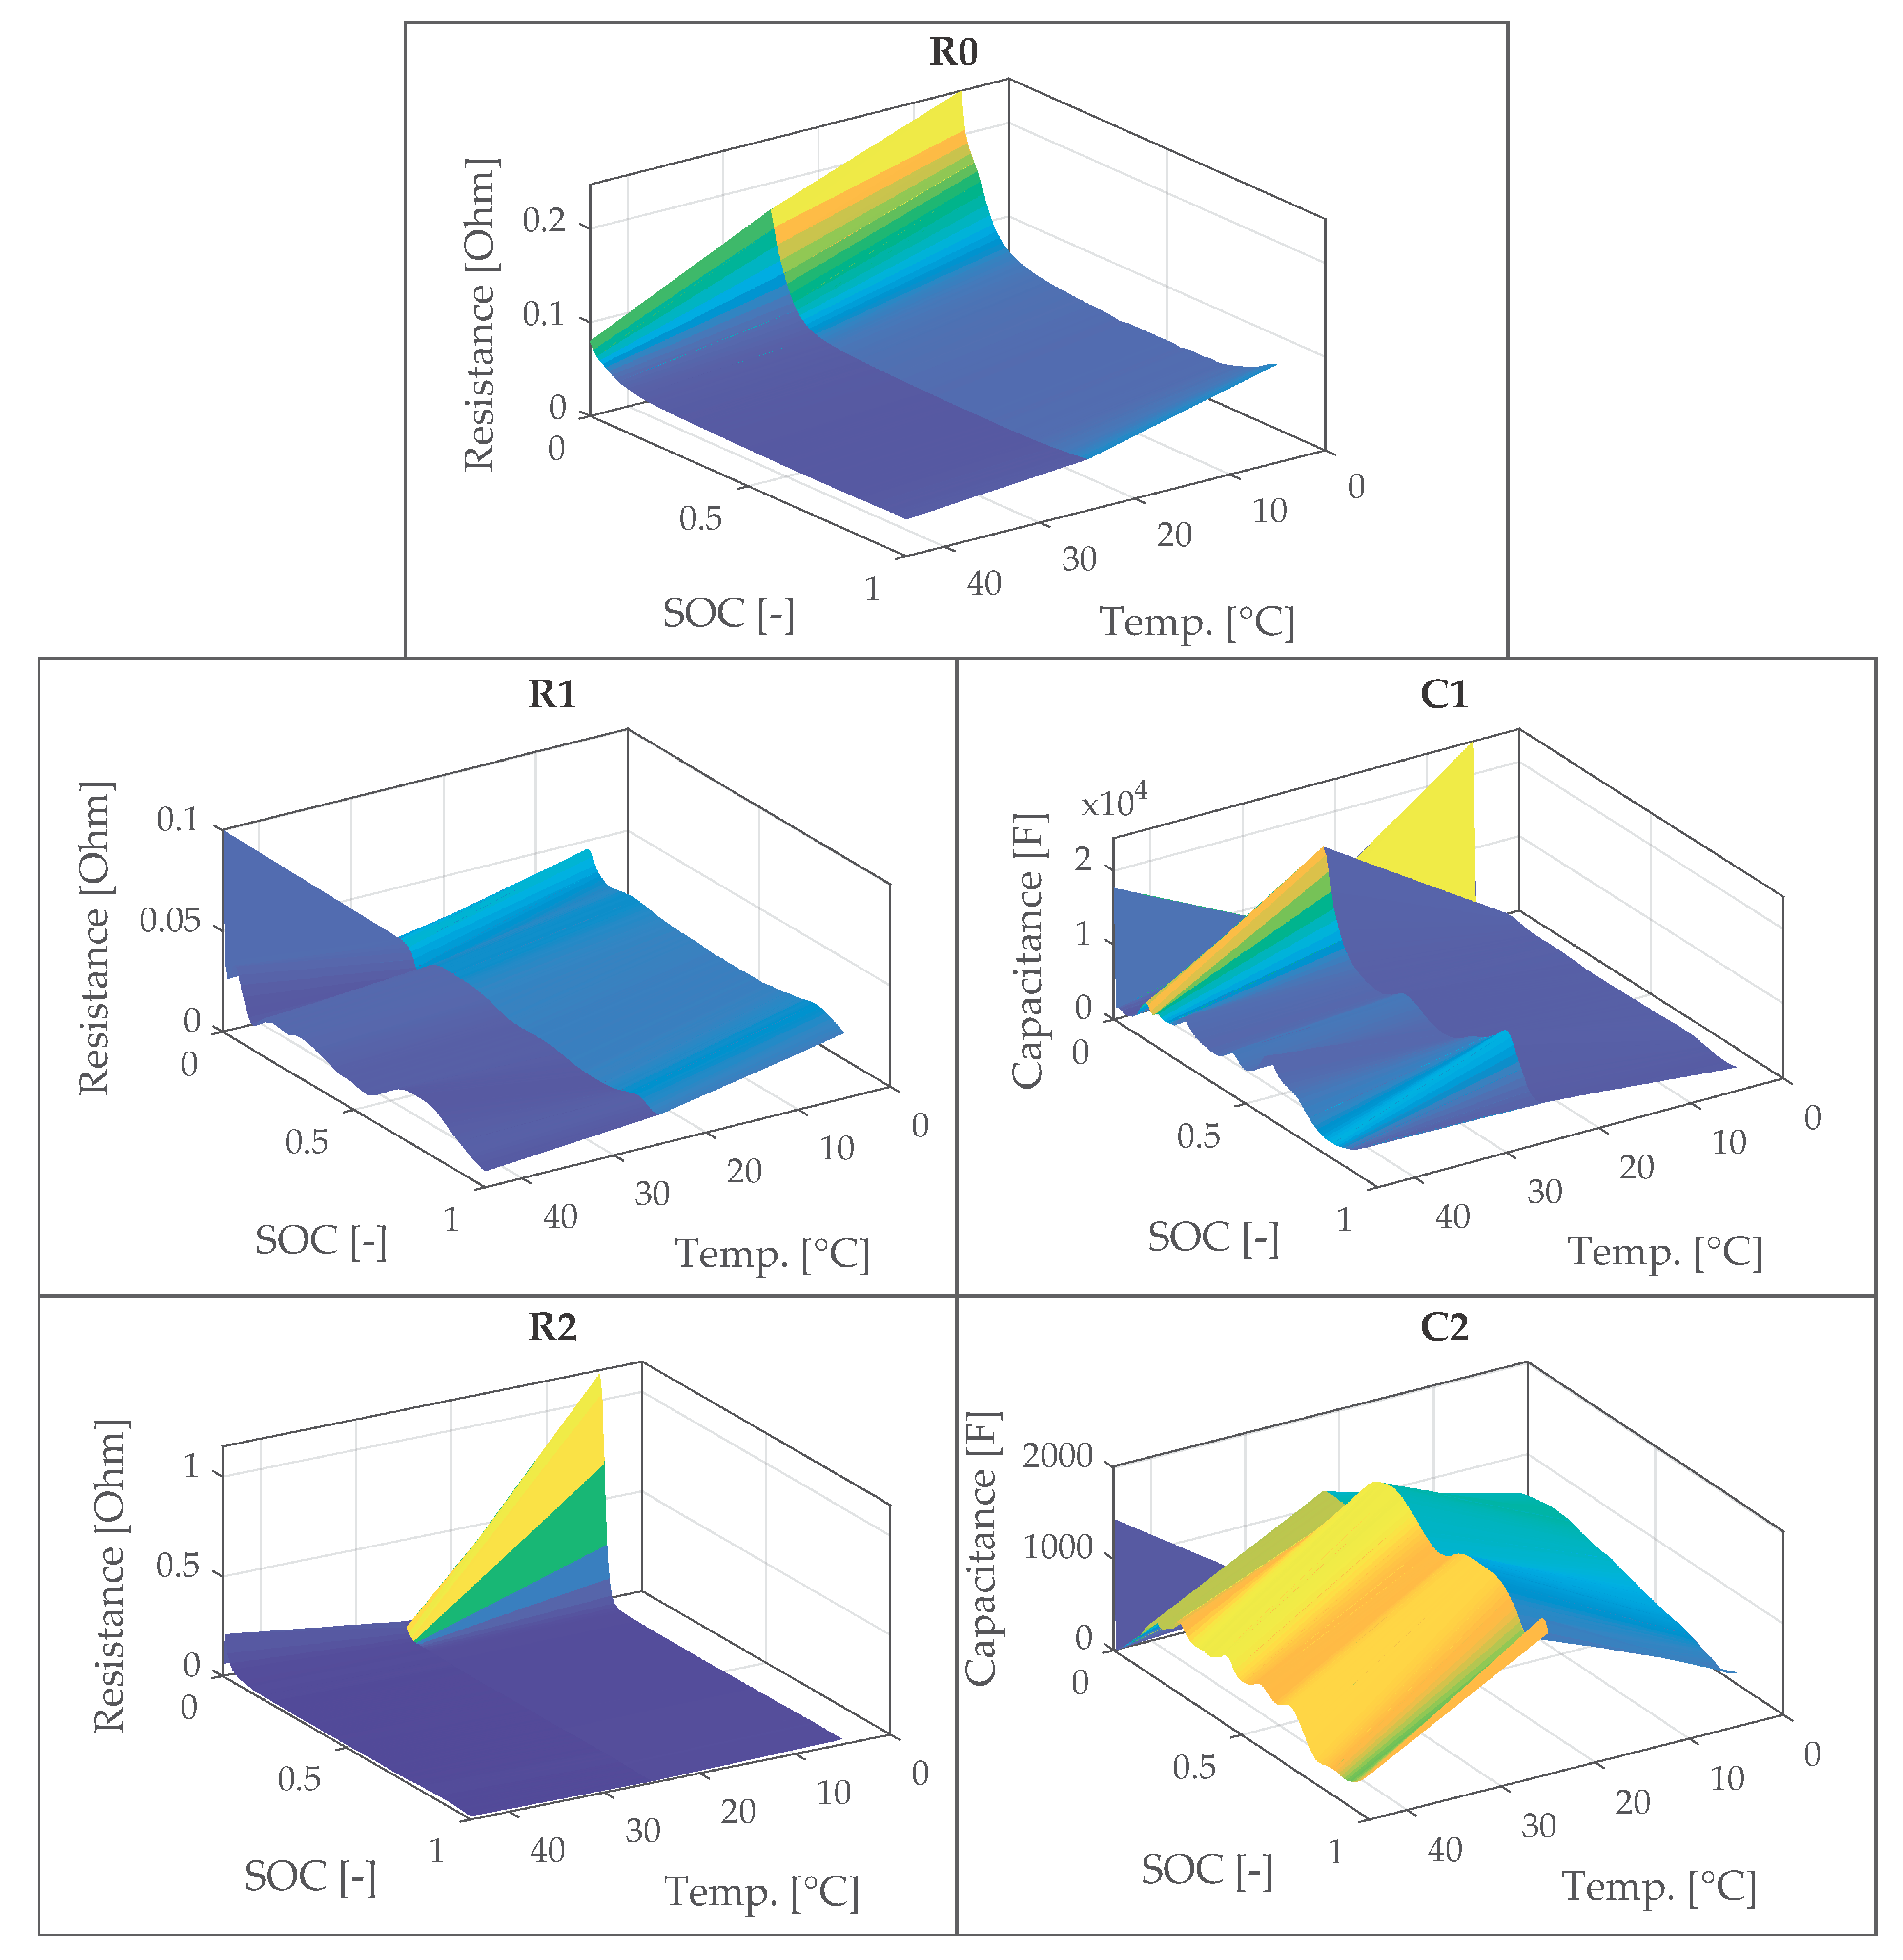
Figure A3.
Temperature-dependent OCV–SOC characteristics of the NCR18650B cell, included in the ECM implementation.
Appendix B. Influence of Anisotropy Correction Strategy on Reduced Thermal Model Accuracy
This appendix illustrates the influence of the anisotropy correction strategy applied during the reduction in the 3D thermal model to a 1D thermal network. The reduced model was initially generated assuming isotropic thermal conductivity of 20 W/(m·K) in all directions, as mentioned in Section 2.5.3.
Figure A4 shows a different case, created in the process of model tuning, in which the analytically derived reduction factor of 13.3 was applied uniformly to all radial interfaces, including both interfaces between the active material domains and the interface between the outermost active material and the cell casing. While this approach improves relative differences in act. mat. temperatures compared to a fully isotropic reduction, it leads to a noticeable absolute error of temperatures, resulting in an increased mean absolute error (MAE ≈ 1.12 °C).
Figure A4.
Error of modeled active material temperatures between AVL 3D model and MATLAB 1D model in case of applying the same reduction factor of 13.3 to all the radial interfaces between the five active materials, as well as outer active material and cell casing.
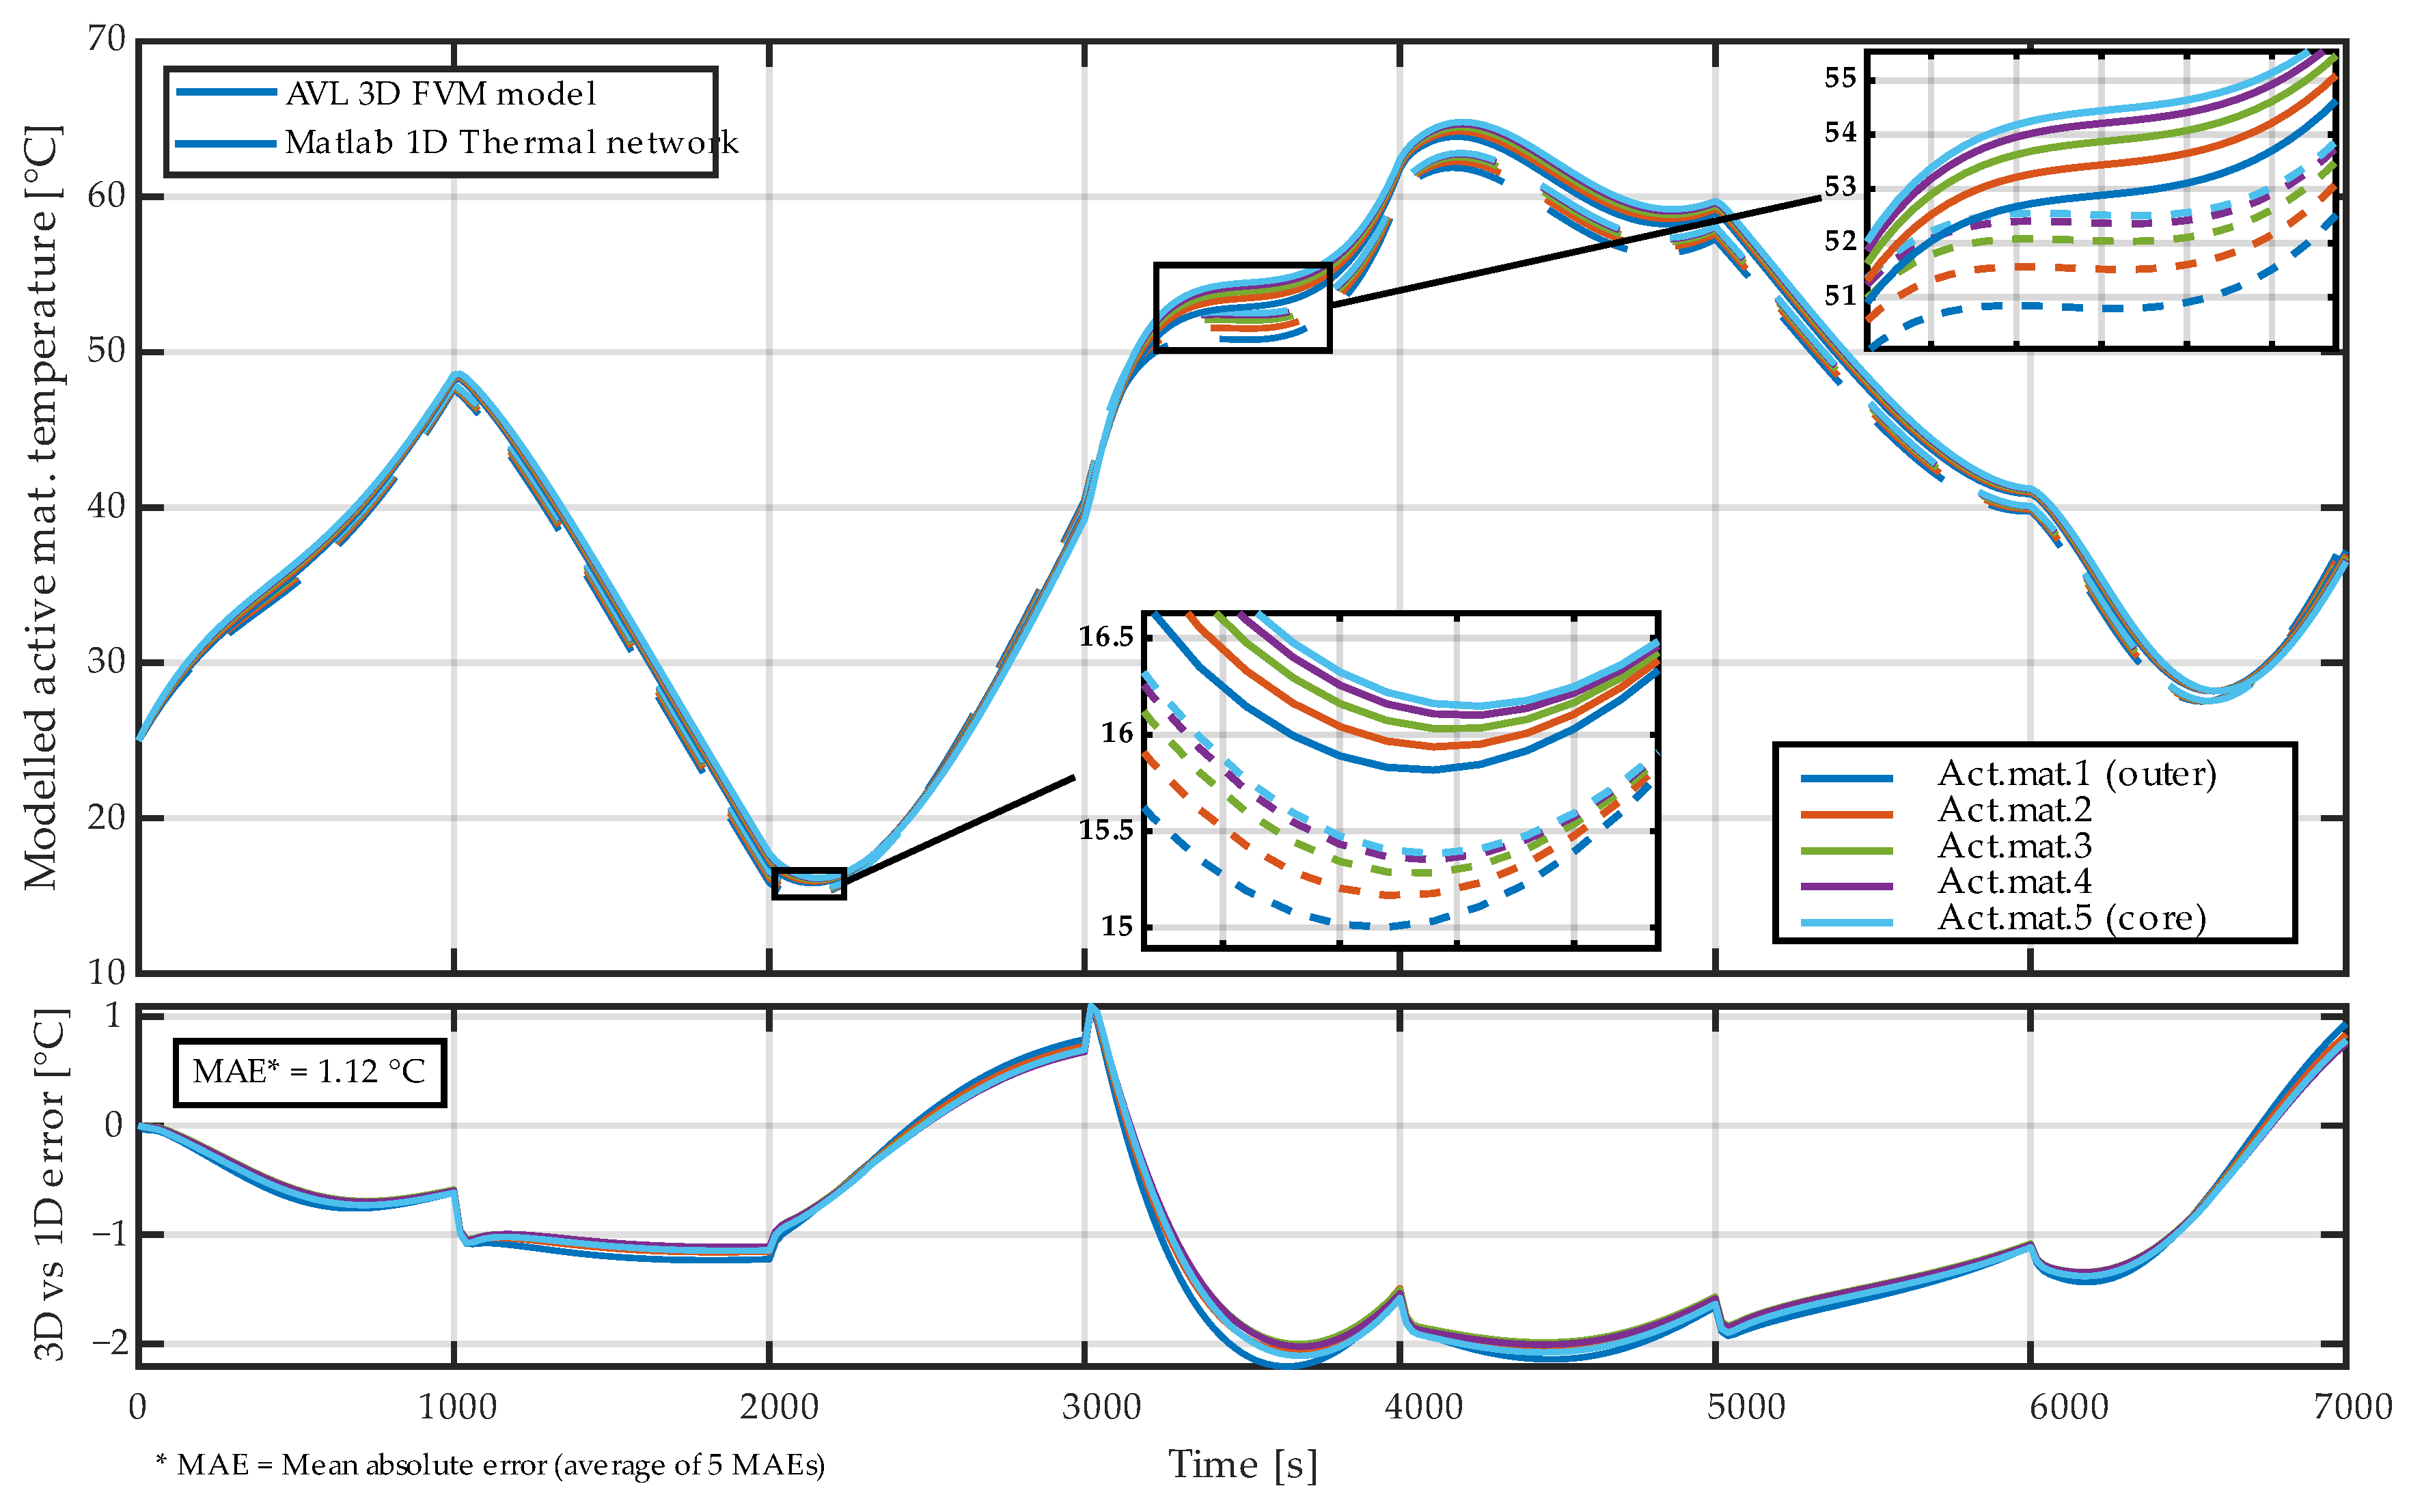
Figure A5 shows the fully isotropic case without applying any reduction factor, which systematically underestimates radial temperature gradients and exhibits a comparable deviation from the 3D reference model (MAE ≈ 0.56 °C).
In contrast, the final anisotropy strategy adopted in this work (Section 2.5.3.) applies the analytically derived reduction factor only between the active material domains, while a separate empirically calibrated factor is used for the interface between the outermost active material and the cell casing. This distinction reflects the fundamentally different physical nature of heat transfer within the jelly roll and across the active material–casing interface, where contact conditions, material layering, and geometric uncertainties dominate. The empirically selected interface factor was determined by minimizing the deviation from the 3D reference model and resulted in a substantially lower overall error (MAE ≈ 0.12 °C), as reported in the main results.
Figure A5.
Error of modeled active material temperatures between AVL 3D model and MATLAB 1D model in case of not applying any reduction factor to all the radial interfaces between the five active materials, as well as outer active material and cell casing—keeping the relations isotropic.
Appendix C. Calibration of Thermal Boundary Conditions
This appendix illustrates the calibration process of the thermal boundary conditions and its influence on the electro-thermal model accuracy. The calibration was intentionally limited to a small set of environment-specific parameters governing heat exchange with the surroundings, while the large set of internal parameters—spanning the complete reduced thermal network as well as the temperature-dependent electrical model—remained unchanged. This separation reflects the intent to validate the internal electro-thermal modeling workflow without changing its core structure and parameters.
Scenario 1 (Figure A6) represents the baseline electro-thermal model obtained immediately after coupling the electrical and thermal submodels. In this configuration, the anisotropy correction derived from an independent 3D–1D virtual experiment was already applied, while the convective heat transfer coefficient was set to an initial estimate of 30 W/(m2·K) and the PVC sleeve was not included. No numerical optimization was performed in this case.
Scenario 2 (Figure A7) isolates the effect of convection by optimizing only the convective heat transfer coefficient. A substantial reduction in surface temperature error is observed, indicating that the overall heat rejection to the environment is primarily governed by this parameter.
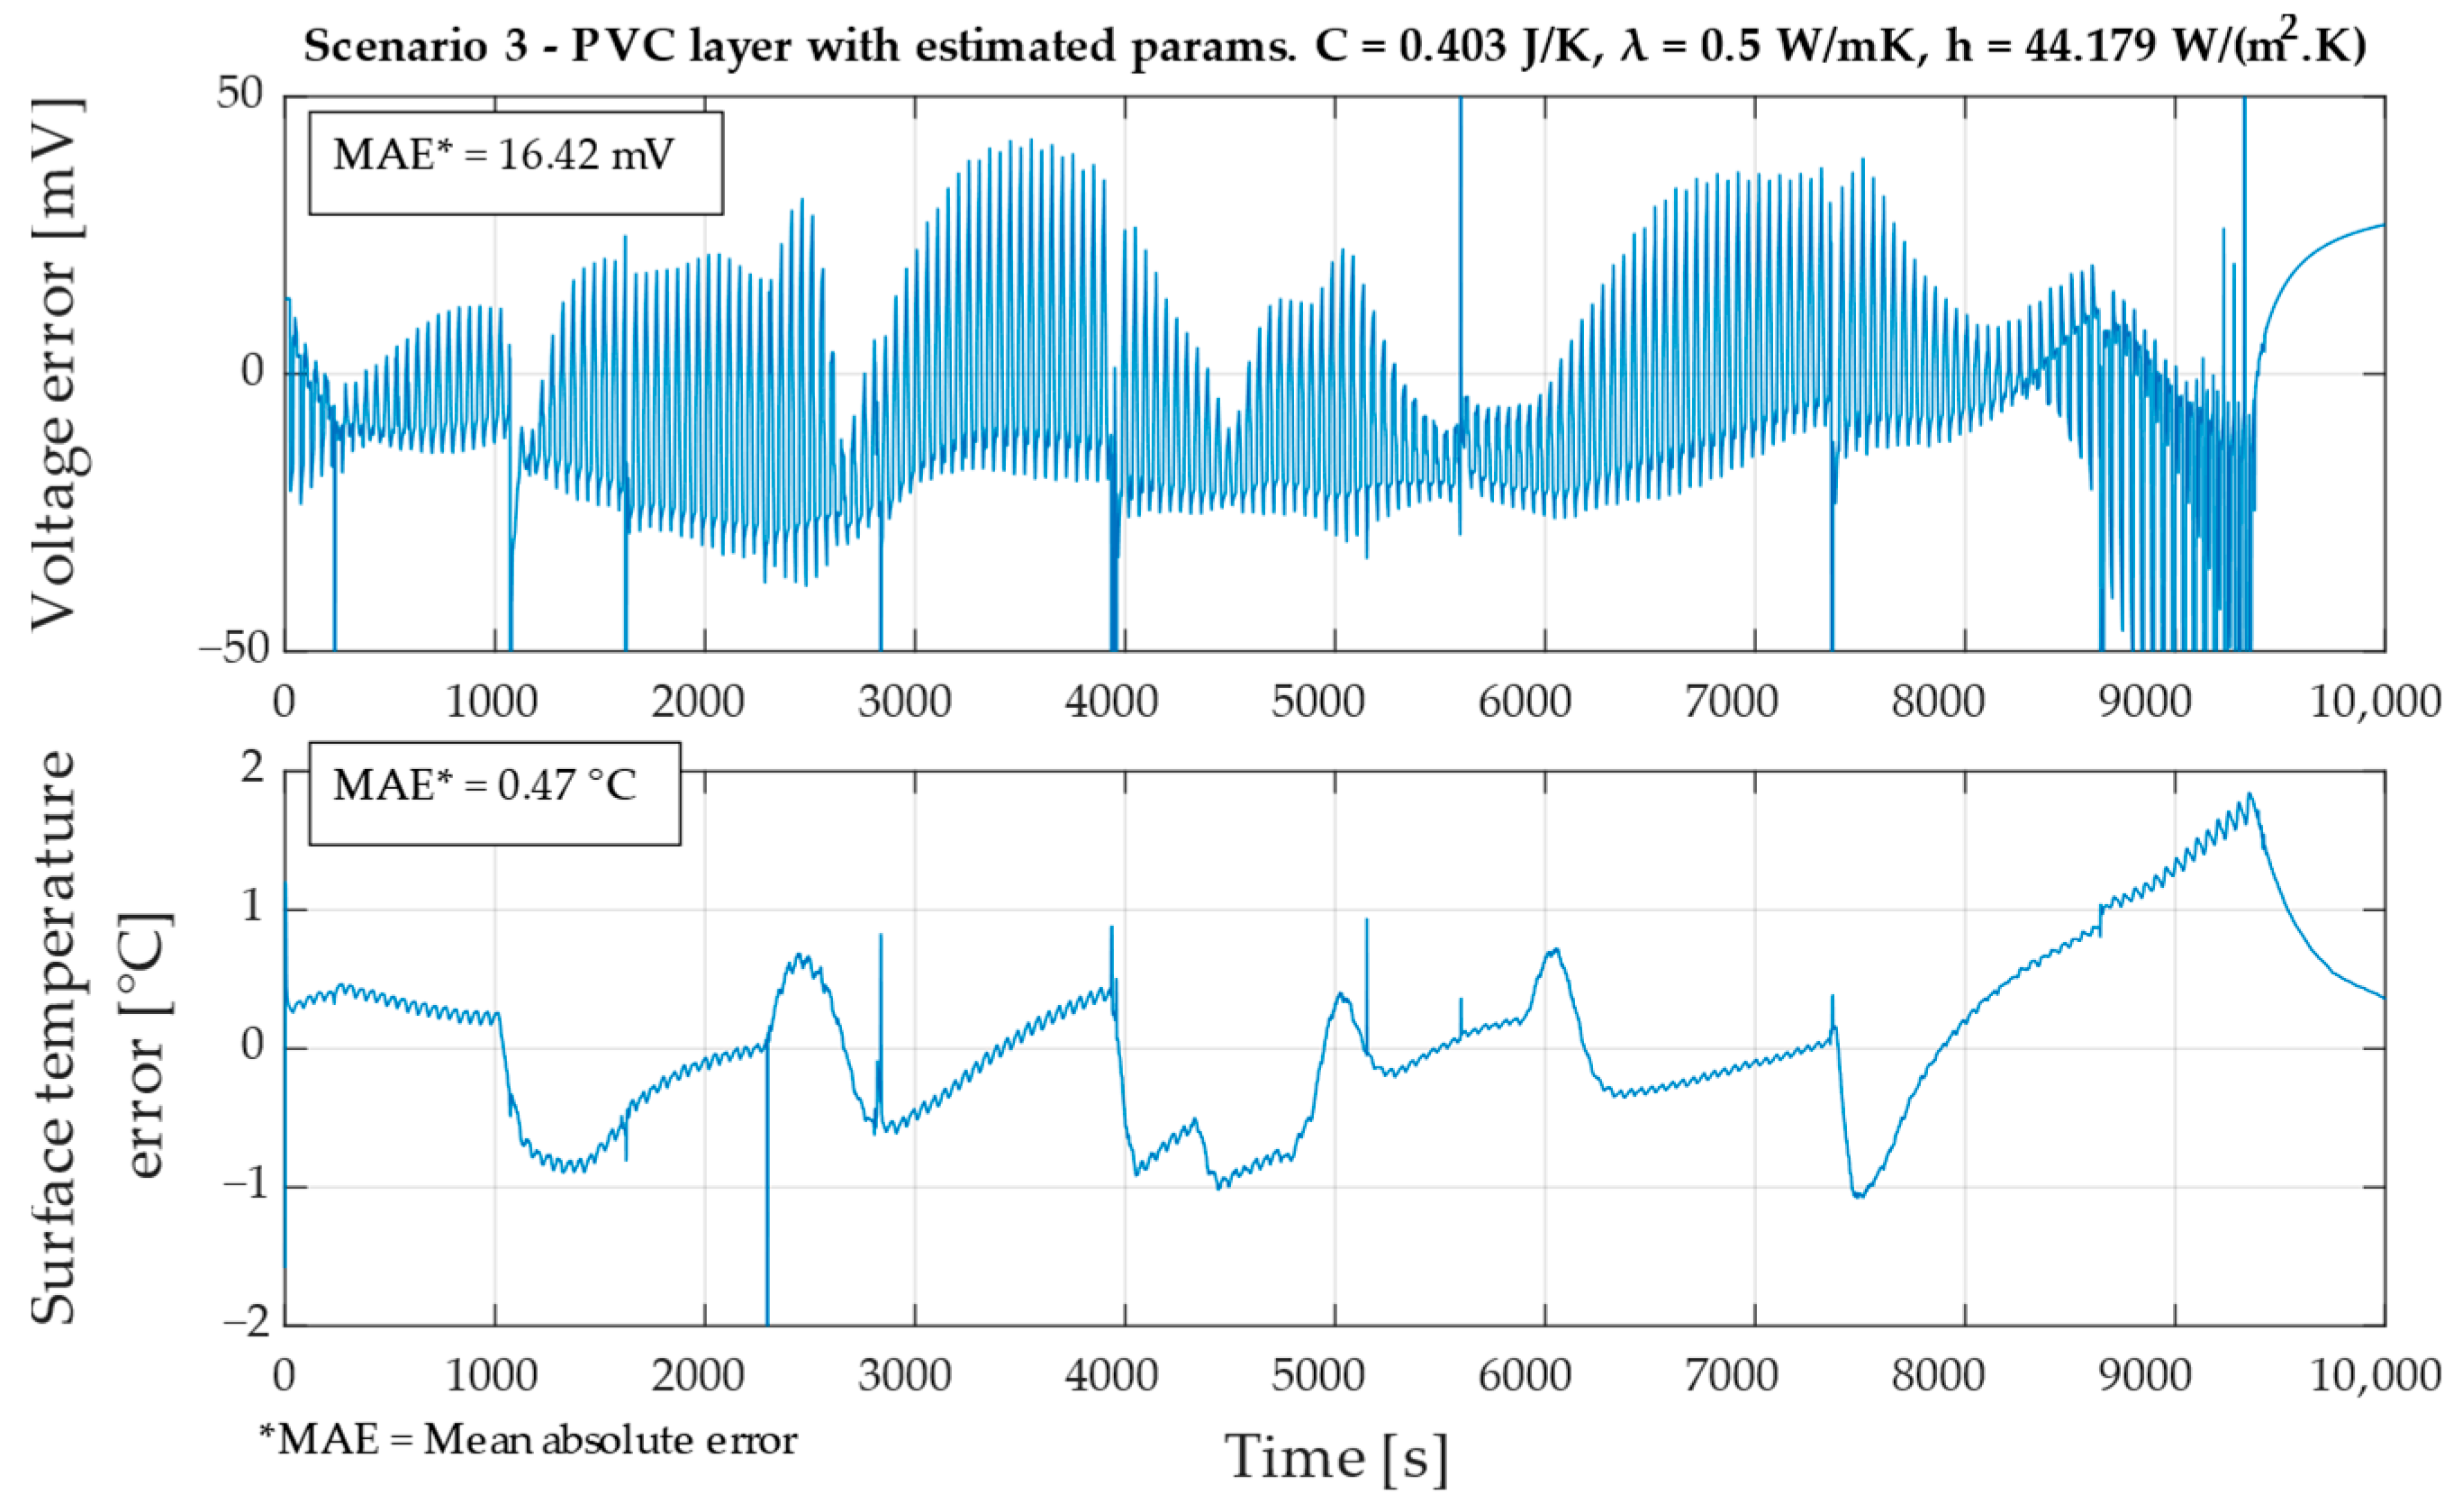
Scenario 3 (Figure A8) further introduces the PVC sleeve with estimated effective thermal properties, resulting in an additional refinement of surface temperature dynamics.
The final validated model, presented in the Section 3, combines the optimized boundary parameters with the unchanged internal thermal network and electrical model. Overall, the comparison shows that the dominant improvement in model accuracy is achieved through calibration of the convective heat transfer coefficient, while the PVC sleeve provides a smaller, secondary correction.
Figure A6.
Voltage and surface temperature errors of the baseline electro-thermal model using estimated convective boundary conditions and without PVC sleeve (Scenario 1).
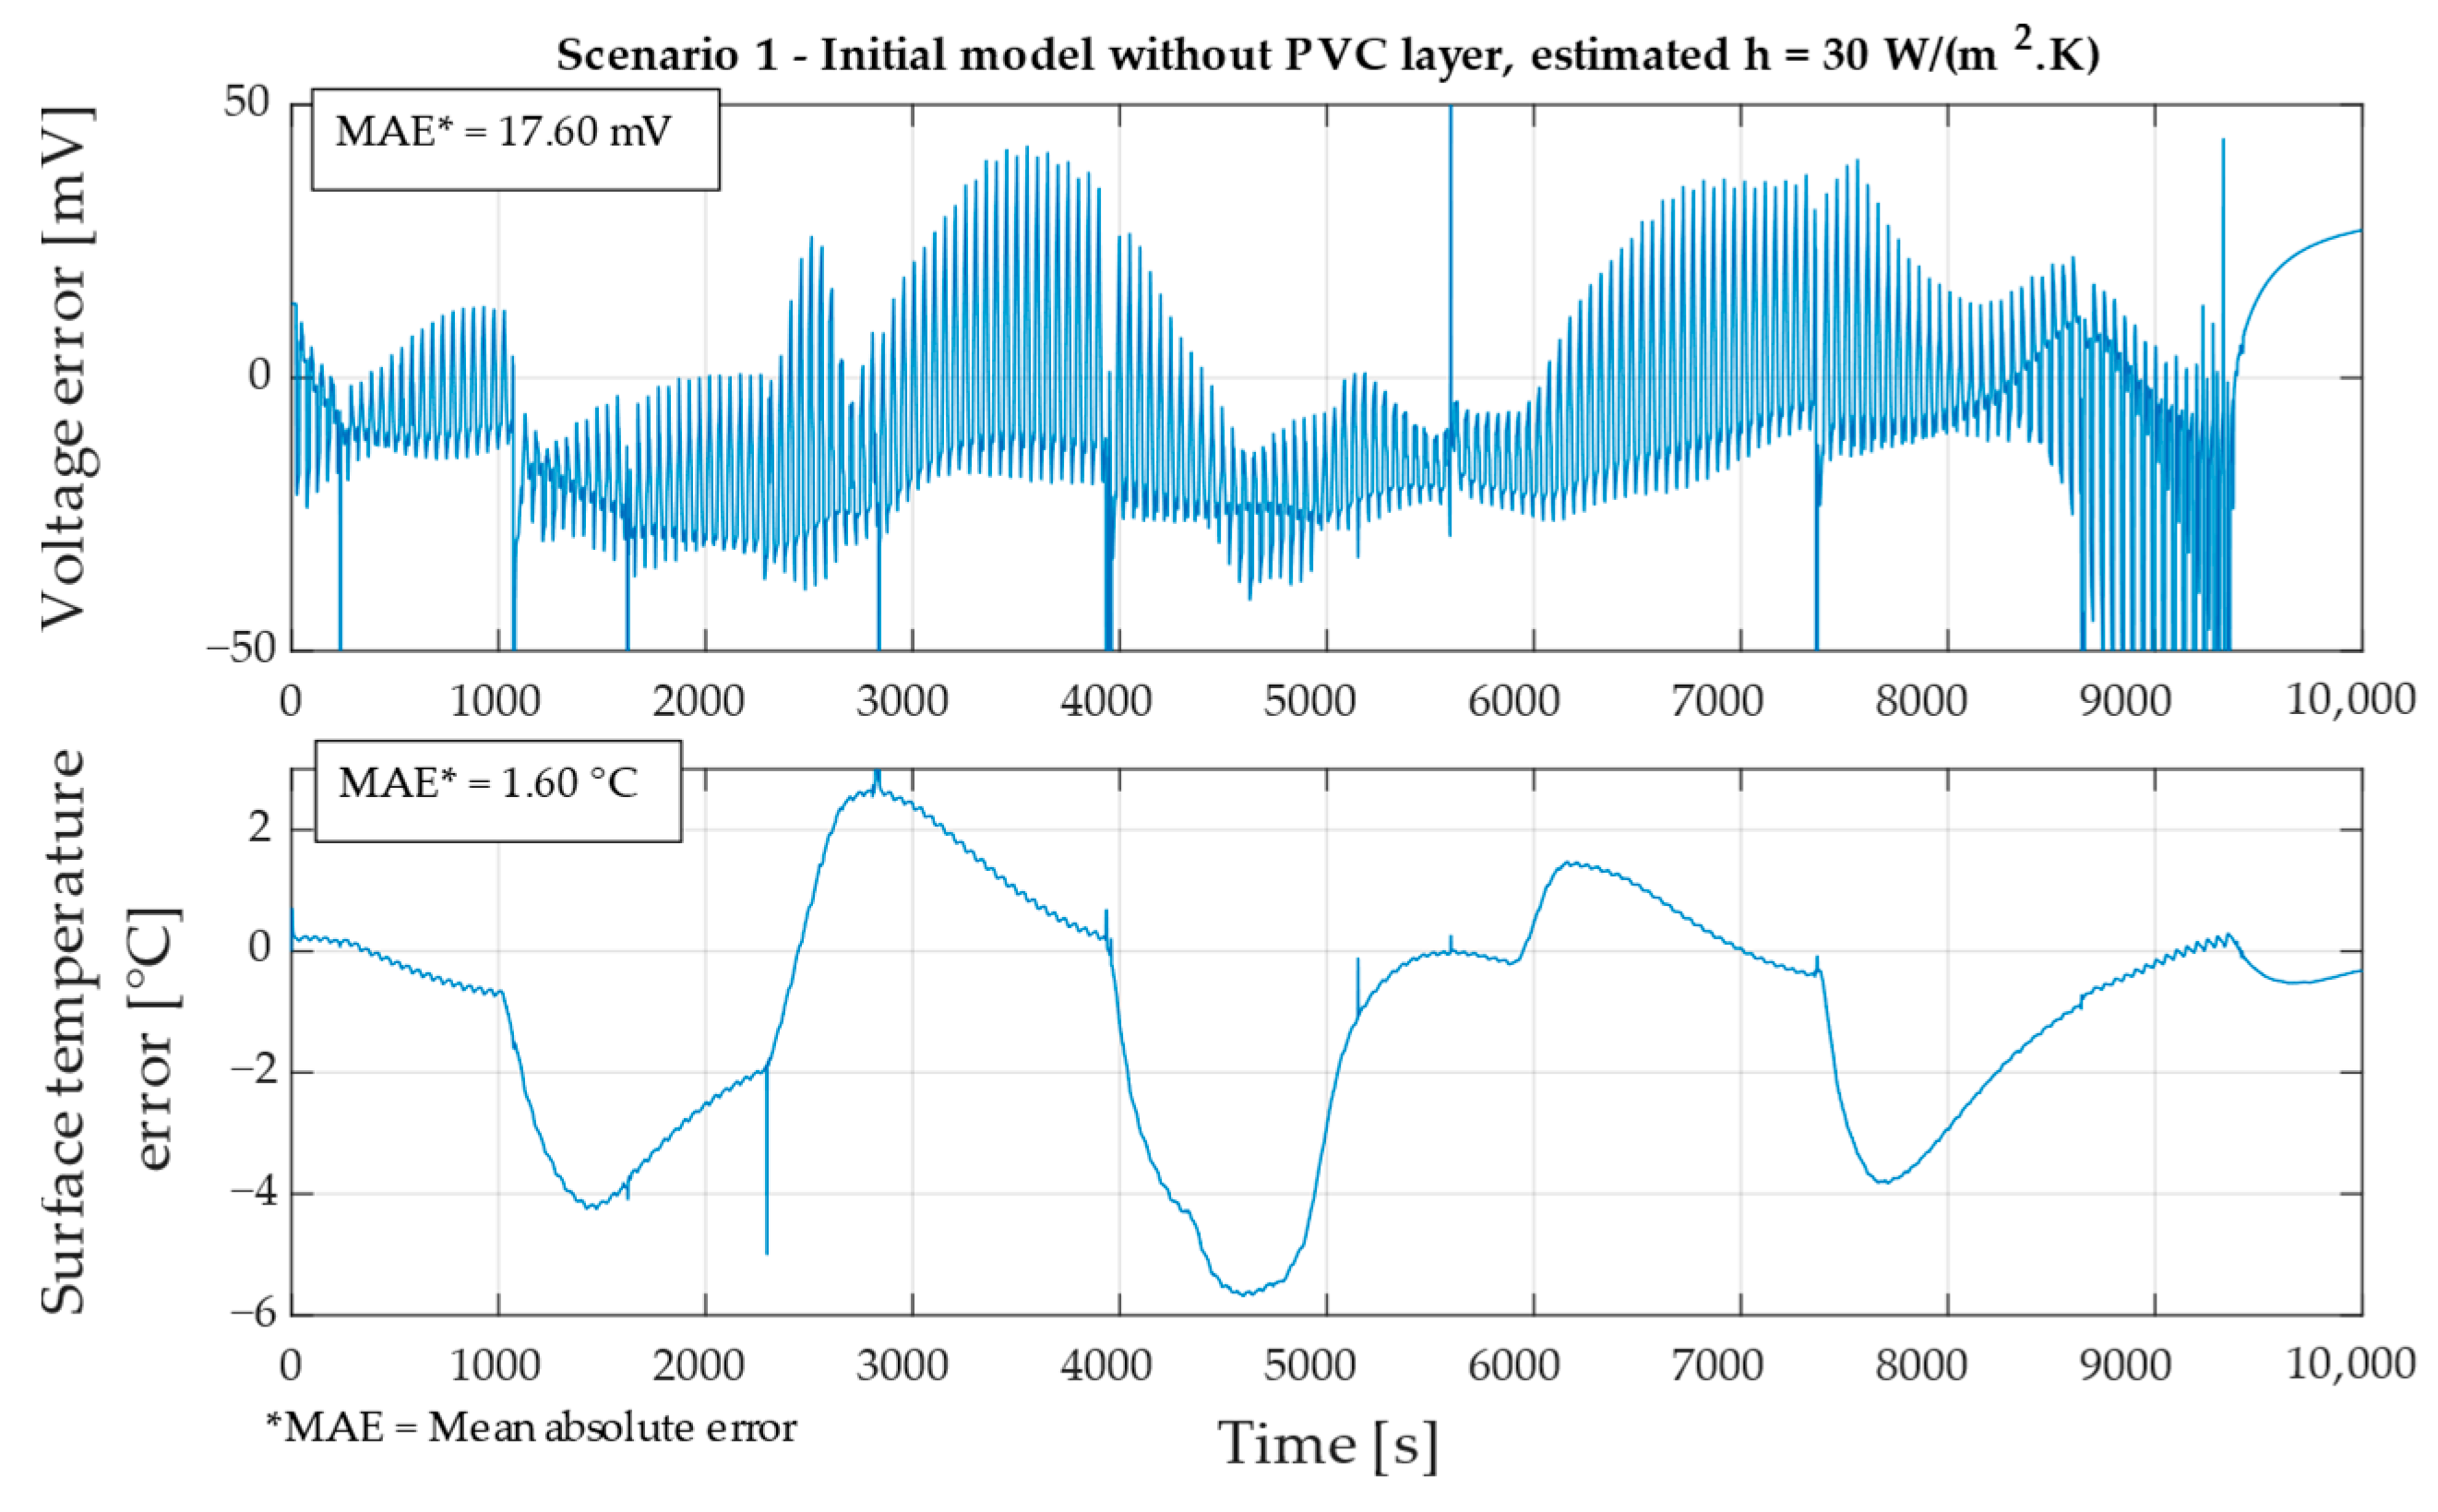
Figure A7.
Effect of optimizing the convective heat transfer coefficient on voltage and surface temperature errors, with unchanged internal model structure (Scenario 2).
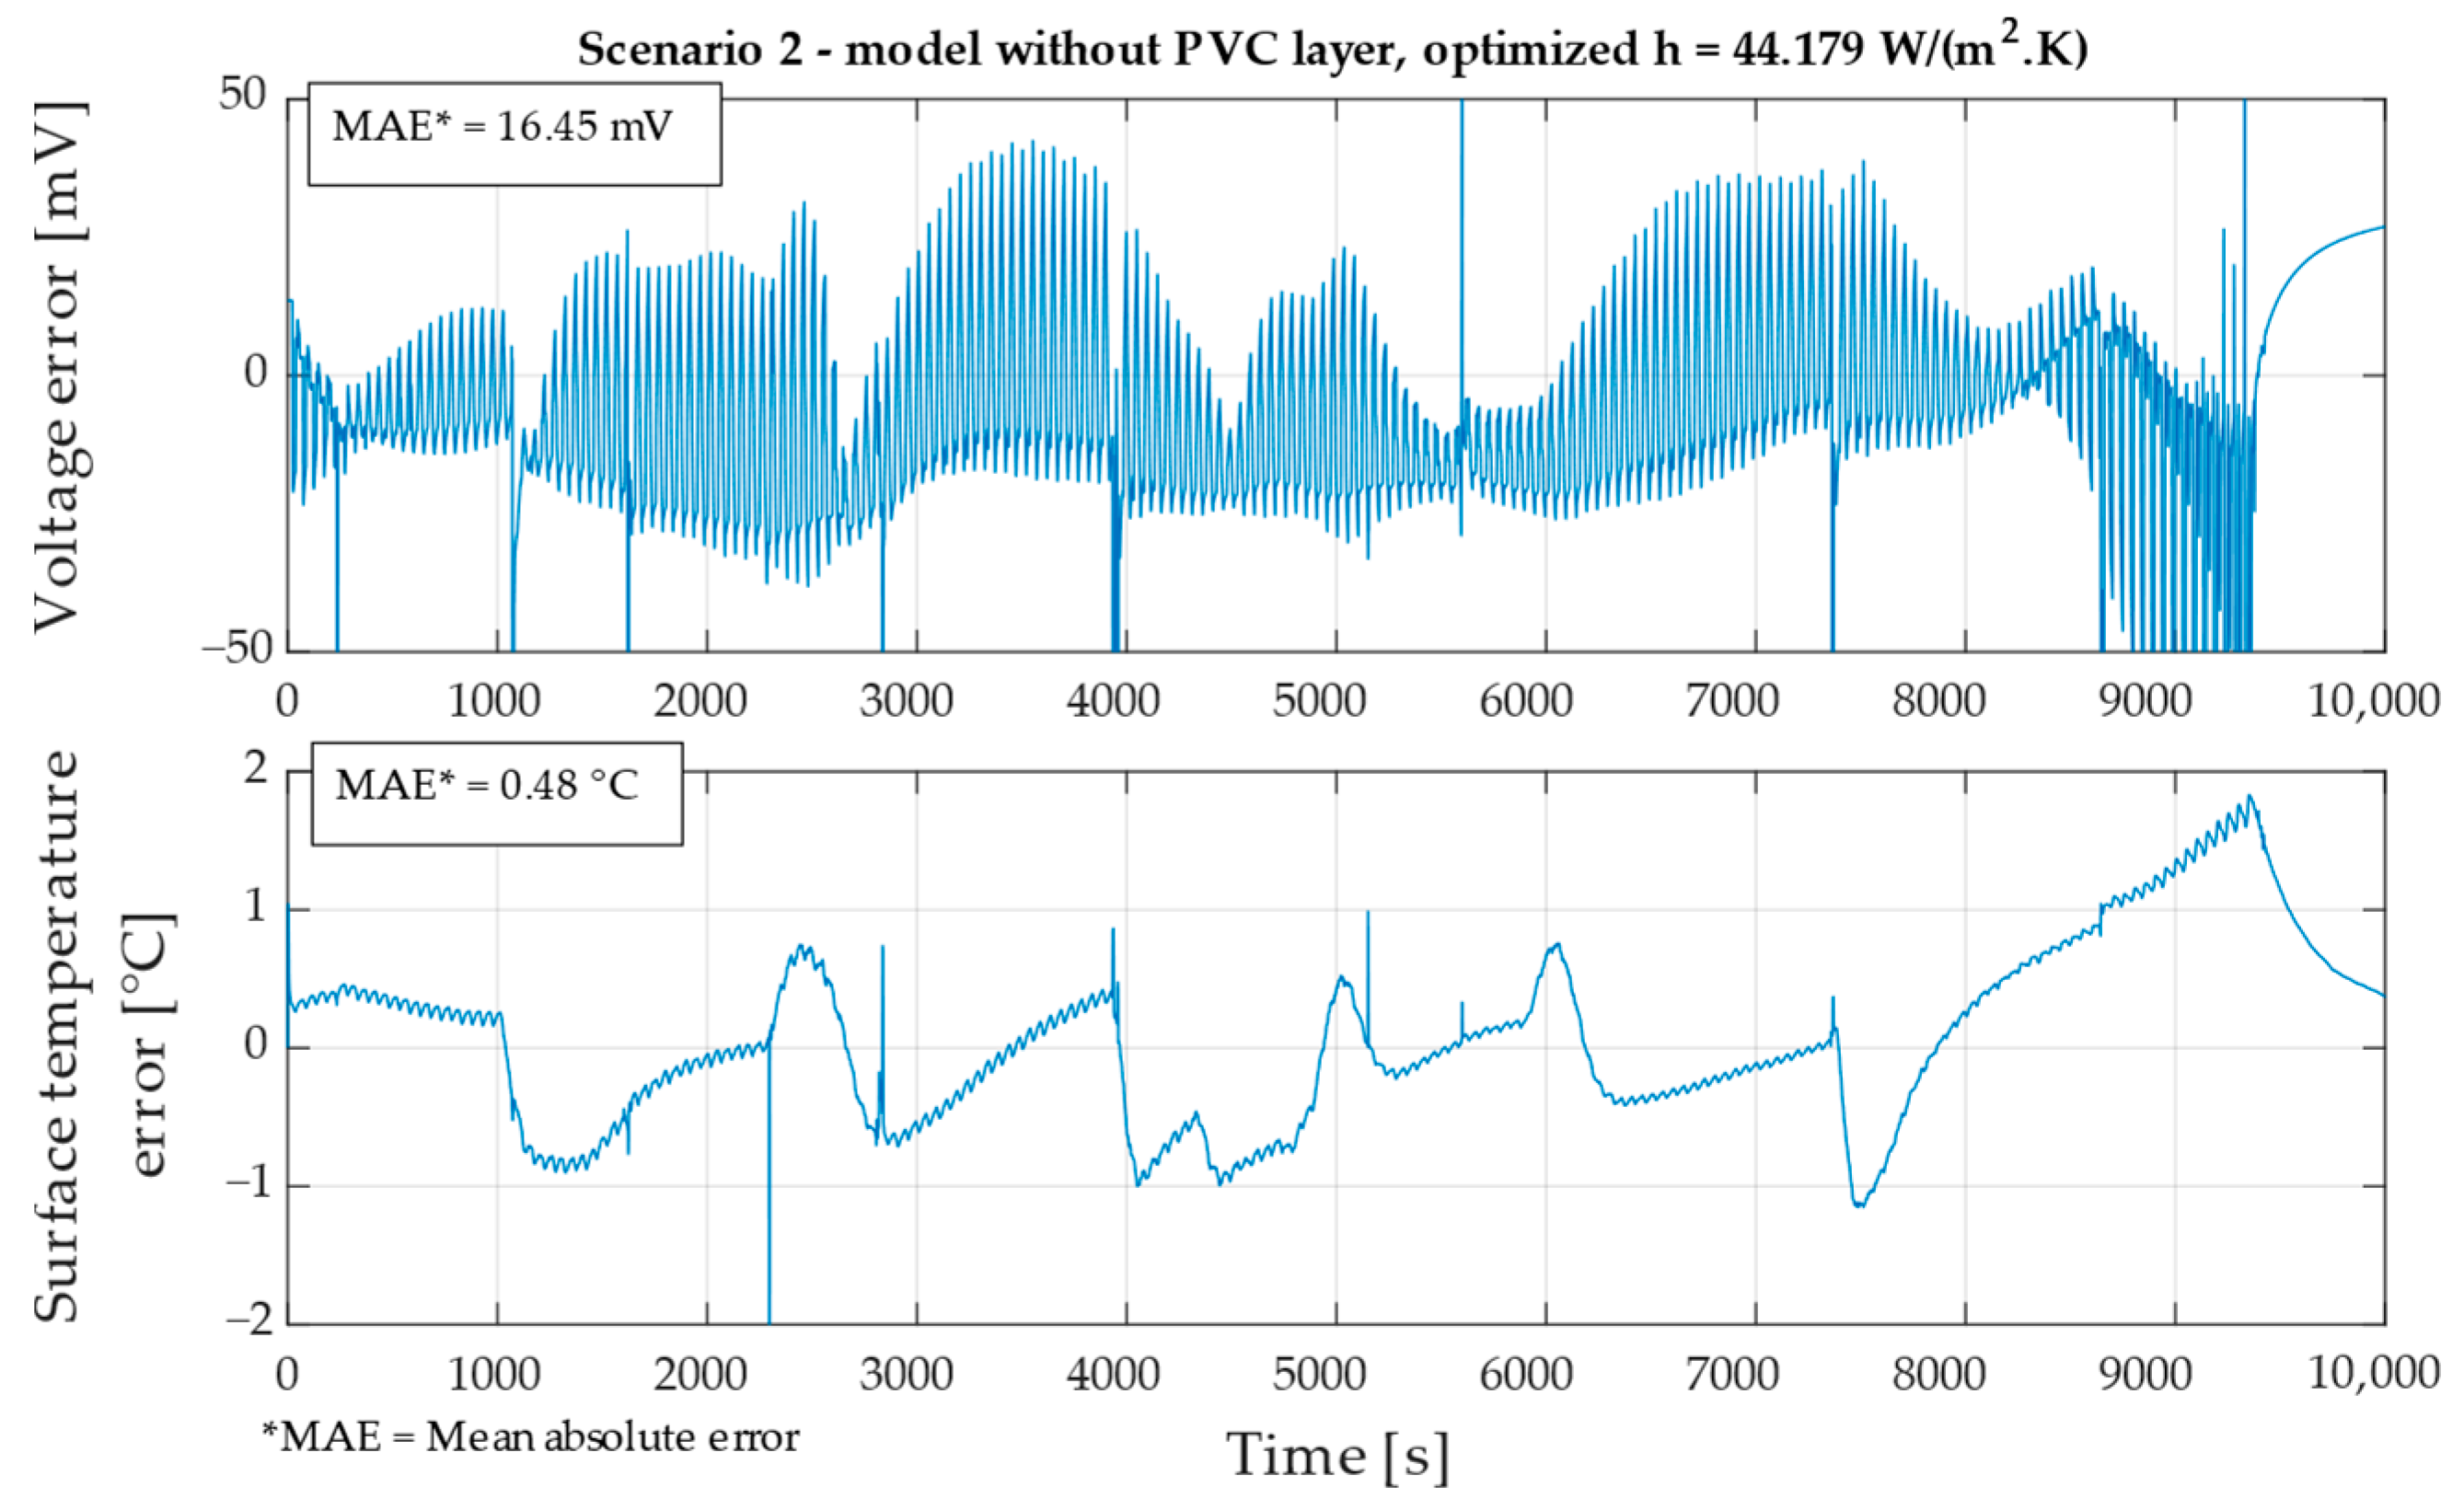
Figure A8.
Influence of including the PVC sleeve (with initial guess of parameters) and already calibrated convection coefficient on surface temperature and voltage errors (Scenario 3).
References
- Xiong, R.; Shen, W. Advanced Battery Management Technologies for Electric Vehicles, 1st ed.; John Wiley & Sons, Inc.: Hoboken, NJ, USA, 2018; ISBN 978-1-119-48164-5. [Google Scholar]
- Liu, W.; Placke, T.; Chau, K.T. Overview of Batteries and Battery Management for Electric Vehicles. Energy Rep. 2022, 8, 4058–4084. [Google Scholar] [CrossRef] [Scilit]
- Doyle, M.; Fuller, T.F.; Newman, J. Modeling of Galvanostatic Charge and Discharge of the Lithium/Polymer/Insertion Cell. J. Electrochem. Soc. 1993, 140, 1526. [Google Scholar] [CrossRef] [Scilit]
- O’Regan, K.; Brosa Planella, F.; Widanage, W.D.; Kendrick, E. Thermal-Electrochemical Parameters of a High Energy Lithium-Ion Cylindrical Battery. Electrochim. Acta 2022, 425, 140700. [Google Scholar] [CrossRef] [Scilit]
- Alkhedher, M.; Al Tahhan, A.B.; Yousaf, J.; Ghazal, M.; Shahbazian-Yassar, R.; Ramadan, M. Electrochemical and Thermal Modeling of Lithium-Ion Batteries: A Review of Coupled Approaches for Improved Thermal Performance and Safety Lithium-Ion Batteries. J. Energy Storage 2024, 86, 111172. [Google Scholar] [CrossRef] [Scilit]
- Gümüşsu, E.; Ekici, Ö.; Köksal, M. 3-D CFD Modeling and Experimental Testing of Thermal Behavior of a Li-Ion Battery. Appl. Therm. Eng. 2017, 120, 484–495. [Google Scholar] [CrossRef] [Scilit]
- Wöckinger, D.; Bramerdorfer, G.; Vaschetto, S.; Cavagnino, A.; Tenconi, A.; Amrhein, W.; Jeskey, F. Approaches for Improving Lumped Parameter Thermal Networks for Outer Rotor SPM Machines. In Proceedings of the 2021 IEEE Energy Conversion Congress and Exposition (ECCE), Vancouver, BC, Canada, 10–14 October 2021; pp. 3821–3828. [Google Scholar]
- Song, L.; Evans, J.W. Electrochemical-Thermal Model of Lithium Polymer Batteries. J. Electrochem. Soc. 2000, 147, 2086. [Google Scholar] [CrossRef] [Scilit]
- Tang, Y.; Wu, L.; Wei, W.; Wen, D.; Guo, Q.; Liang, W.; Xiao, L. Study of the Thermal Properties during the Cyclic Process of Lithium Ion Power Batteries Using the Electrochemical-Thermal Coupling Model. Appl. Therm. Eng. 2018, 137, 11–22. [Google Scholar] [CrossRef] [Scilit]
- Tran, N.T.; Farrell, T.; Vilathgamuwa, M.; Choi, S.S.; Li, Y. A Computationally Efficient Coupled Electrochemical-Thermal Model for Large Format Cylindrical Lithium Ion Batteries. J. Electrochem. Soc. 2019, 166, A3059. [Google Scholar] [CrossRef] [Scilit]
- Wang, D.; Zhang, Q.; Huang, H.; Yang, B.; Dong, H.; Zhang, J. An Electrochemical–Thermal Model of Lithium-Ion Battery and State of Health Estimation. J. Energy Storage 2022, 47, 103528. [Google Scholar] [CrossRef] [Scilit]
- Chen, S.C.; Wan, C.C.; Wang, Y.Y. Thermal Analysis of Lithium-Ion Batteries. J. Power Sources 2005, 140, 111–124. [Google Scholar] [CrossRef] [Scilit]
- Farag, M.; Sweity, H.; Fleckenstein, M.; Habibi, S. Combined Electrochemical, Heat Generation, and Thermal Model for Large Prismatic Lithium-Ion Batteries in Real-Time Applications. J. Power Sources 2017, 360, 618–633. [Google Scholar] [CrossRef] [Scilit]
- Prada, E.; Domenico, D.D.; Creff, Y.; Bernard, J.; Sauvant-Moynot, V.; Huet, F. Simplified Electrochemical and Thermal Model of LiFePO4-Graphite Li-Ion Batteries for Fast Charge Applications. J. Electrochem. Soc. 2012, 159, A1508. [Google Scholar] [CrossRef] [Scilit]
- Ai, W.; Kraft, L.; Sturm, J.; Jossen, A.; Wu, B. Electrochemical Thermal-Mechanical Modelling of Stress Inhomogeneity in Lithium-Ion Pouch Cells. J. Electrochem. Soc. 2019, 167, 013512. [Google Scholar] [CrossRef] [Scilit]
- Kang, D.; Lee, P.-Y.; Yoo, K.; Kim, J. Internal Thermal Network Model-Based Inner Temperature Distribution of High-Power Lithium-Ion Battery Packs with Different Shapes for Thermal Management. J. Energy Storage 2020, 27, 101017. [Google Scholar] [CrossRef] [Scilit]
- Yin, L.; Björneklett, A.; Söderlund, E.; Brandell, D. Analyzing and Mitigating Battery Ageing by Self-Heating through a Coupled Thermal-Electrochemical Model of Cylindrical Li-Ion Cells. J. Energy Storage 2021, 39, 102648. [Google Scholar] [CrossRef] [Scilit]
- Salvador-Iborra, J.; Schneider, J.; Tatschl, R. Automatic Conversion of a 3D Thermal Model of a Battery Cell into a 1D Lumped-Element Network: Paper for Special Session 8—Multi-Level Models for Simulation of Electrified Vehicles. In Proceedings of the 2020 IEEE Vehicle Power and Propulsion Conference (VPPC), Gijón, Spain, 18 November 2020; pp. 1–6. [Google Scholar]
- Pirooz, A.; Van Mierlo, J.; Berecibar, M. 3D Thermal and 1D Electro-Thermal Model Coupling Framework for Lithium-Ion Battery Cells in Automotive Industry Platforms. In Proceedings of the 2021 IEEE Vehicle Power and Propulsion Conference (VPPC), Gijón, Spain, 25 October 2021; pp. 1–6. [Google Scholar]
- Gökmen, Y.; Gül, T.; Gediz Ilis, G. Comparison of 1D and 3D Electrochemical-Thermal Model of Lithium-Ion Battery. In Proceedings of the 8th World Congress on Momentum, Heat and Mass Transfer (MHMT’23), Lisbon, Portugal, 26–28 March 2023. [Google Scholar]
- Gonzalez-Aguirre, E.; Aranburu, I.; Gastelurrutia, J.; Diaz, L.; Patil, M.S.; del Portillo-Valdes, L. 1D Dynamic Thermal Model Development for a Battery Hybrid Thermal Management System. In Proceedings of the 2021 IEEE Vehicle Power and Propulsion Conference (VPPC), Gijón, Spain, 25 October 2021; pp. 1–6. [Google Scholar]
- Nezzi, C.; Gufler, V.; Vidoni, R.; Rauch, E. Kinematic and Dynamic Modeling of Mechanical Systems towards Digital Twins. Results Eng. 2025, 26, 104874. [Google Scholar] [CrossRef] [Scilit]
- Qingzhi, L.; Yujie, B.; Lanqing, Q.; Haoran, F.; Jianyu, T.; Wei, Z.; Chunxiao, Z. Development of a Virtual Twin Model and Digital Twin System for Thermal Systems Based on Multi-Reduced Order Method. Results Eng. 2025, 27, 106695. [Google Scholar] [CrossRef] [Scilit]
- Nigel. Base vs. Side Cooling Cylindrical Cells; Battery Design: Warwickshire, UK, 2023. [Google Scholar]
- Xie, Y.; He, X.; Hu, X.; Li, W.; Zhang, Y.; Liu, B.; Sun, Y. An Improved Resistance-Based Thermal Model for a Pouch Lithium-Ion Battery Considering Heat Generation of Posts. Appl. Therm. Eng. 2020, 164, 114455. [Google Scholar] [CrossRef] [Scilit]
- Boumous, Z.; Boumous, S.; Fellah, M.; Guesmi, A.; Khezami, L. A Hybrid Pulse Power Characterization-Elastic Net Framework for Accurate State-of-Health Estimation in Lithium-Ion Batteries under Thermal Aging Conditions. J. Energy Storage 2025, 139, 118911. [Google Scholar] [CrossRef] [Scilit]
- Lin, X.; Perez, H.E.; Mohan, S.; Siegel, J.B.; Stefanopoulou, A.G.; Ding, Y.; Castanier, M.P. A Lumped-Parameter Electro-Thermal Model for Cylindrical Batteries. J. Power Sources 2014, 257, 1–11. [Google Scholar] [CrossRef] [Scilit]
- Feng, F.; Teng, S.; Liu, K.; Xie, J.; Xie, Y.; Liu, B.; Li, K. Co-Estimation of Lithium-Ion Battery State of Charge and State of Temperature Based on a Hybrid Electrochemical-Thermal-Neural-Network Model. J. Power Sources 2020, 455, 227935. [Google Scholar] [CrossRef] [Scilit]
- Li, W.; Demir, I.; Cao, D.; Jöst, D.; Ringbeck, F.; Junker, M.; Sauer, D.U. Data-Driven Systematic Parameter Identification of an Electrochemical Model for Lithium-Ion Batteries with Artificial Intelligence. Energy Storage Mater. 2022, 44, 557–570. [Google Scholar] [CrossRef] [Scilit]
- Özdemir, T.; Ekici, Ö.; Köksal, M. Numerical and Experimental Investigation of the Thermal and Electrical Characteristics of a Lithium Ion Cell. E3S Web Conf. 2021, 321, 03007. [Google Scholar] [CrossRef] [Scilit]
- Jiang, Y.; Huang, J.; Xu, P.; Wang, P. Axial and Radial Thermal Conductivity Measurement of 18,650 Lithium-Ion Battery. J. Energy Storage 2023, 72, 108516. [Google Scholar] [CrossRef] [Scilit]
- Pang, Y.; Wang, Y.; Niu, Z. Deep Learning from Three-Dimensional Lithium-Ion Battery Multiphysics Model Part I: Data Development. Energy AI 2024, 18, 100428. [Google Scholar] [CrossRef] [Scilit]
- Xie, Y.; Li, W.; Yang, Y.; Feng, F. A Novel Resistance-Based Thermal Model for Lithium-Ion Batteries. Int. J. Energy Res. 2018, 42, 4481–4498. [Google Scholar] [CrossRef] [Scilit]
- Hagen, M.; Hanselmann, D.; Ahlbrecht, K.; Maça, R.; Gerber, D.; Tübke, J. Lithium–Sulfur Cells: The Gap between the State-of-the-Art and the Requirements for High Energy Battery Cells. Adv. Energy Mater. 2015, 5, 1401986. [Google Scholar] [CrossRef] [Scilit]
- Bolsinger, C.; Zorn, M.; Birke, K.P. Electrical Contact Resistance Measurements of Clamped Battery Cell Connectors for Cylindrical 18650 Battery Cells. J. Energy Storage 2017, 12, 29–36. [Google Scholar] [CrossRef] [Scilit]
- Lazarenko, O.; Pazen, O.; Velykyi, Y.; Parkhomenko, R.; Stepaniak, Y. Determination of Thermal Physical Characteristics of the Panasonic NCR18650b Lithium-Ion Power Supply Element. Proc. Latv. Acad. Sciences. Sect. B 2024, 78, 372–379. [Google Scholar] [CrossRef] [Scilit]
- Lee, H. Stainless Steel AISI 321 Technical Sheet 2021; Atlas Steel: Melbourne, Australia, 2021. [Google Scholar]
- Smiths Metal Centres. Stainless Steel 316/316L Technical Sheet 2023; Smiths Metal Centres: Bedfordshire, UK, 2023. [Google Scholar]
- The Engineering ToolBox. Stainless Steel—Specific Heat and Thermal Conductivities vs. Temperatures; The Engineering ToolBox: Greensboro, NC, USA, 2023. [Google Scholar]
- Finegan, D.P. X-Ray Imaging of Failure and Degradation Mechanisms of Lithium-Ion Batteries. Ph.D. Thesis, University College London, London, UK, 2016. [Google Scholar]
- Engineers Edge, LLC. Specific Heat Capacity of Metals Table Chart 2025; Engineers Edge, LLC: Monroe, GA, USA, 2025. [Google Scholar]
- Ilies, A.I.; Jánó, R. Characterizing Thermal Properties of 18650 Lithium-Ion Battery Cells: Experimental Approaches to Thermal Conductivity and Specific Heat Capacity Measurements. In Proceedings of the 2024 IEEE 30th International Symposium for Design and Technology in Electronic Packaging (SIITME), Sibiu, Romania, 16–19 October 2024; pp. 163–167. [Google Scholar]
- Spinner, N.S.; Mazurick, R.; Brandon, A.; Rose-Pehrsson, S.L.; Tuttle, S.G. Analytical, Numerical and Experimental Determination of Thermophysical Properties of Commercial 18650 LiCoO2 Lithium-Ion Battery. J. Electrochem. Soc. 2015, 162, A2789. [Google Scholar] [CrossRef] [Scilit]
- Drake, S.J.; Wetz, D.A.; Ostanek, J.K.; Miller, S.P.; Heinzel, J.M.; Jain, A. Measurement of Anisotropic Thermophysical Properties of Cylindrical Li-Ion Cells. J. Power Sources 2014, 252, 298–304. [Google Scholar] [CrossRef] [Scilit]
- AVL FIRETM M | AVL. Available online: https://www.avl.com/en/simulation-solutions/simulation-software/avl-fire-m (accessed on 30 November 2025).
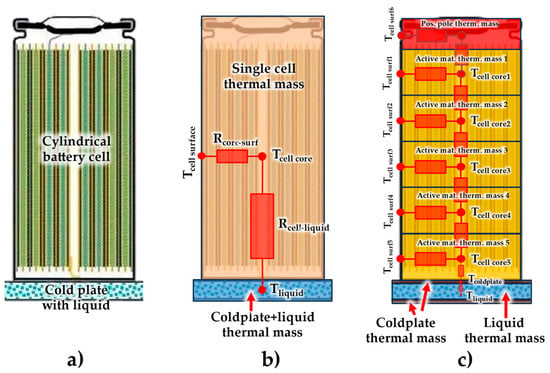
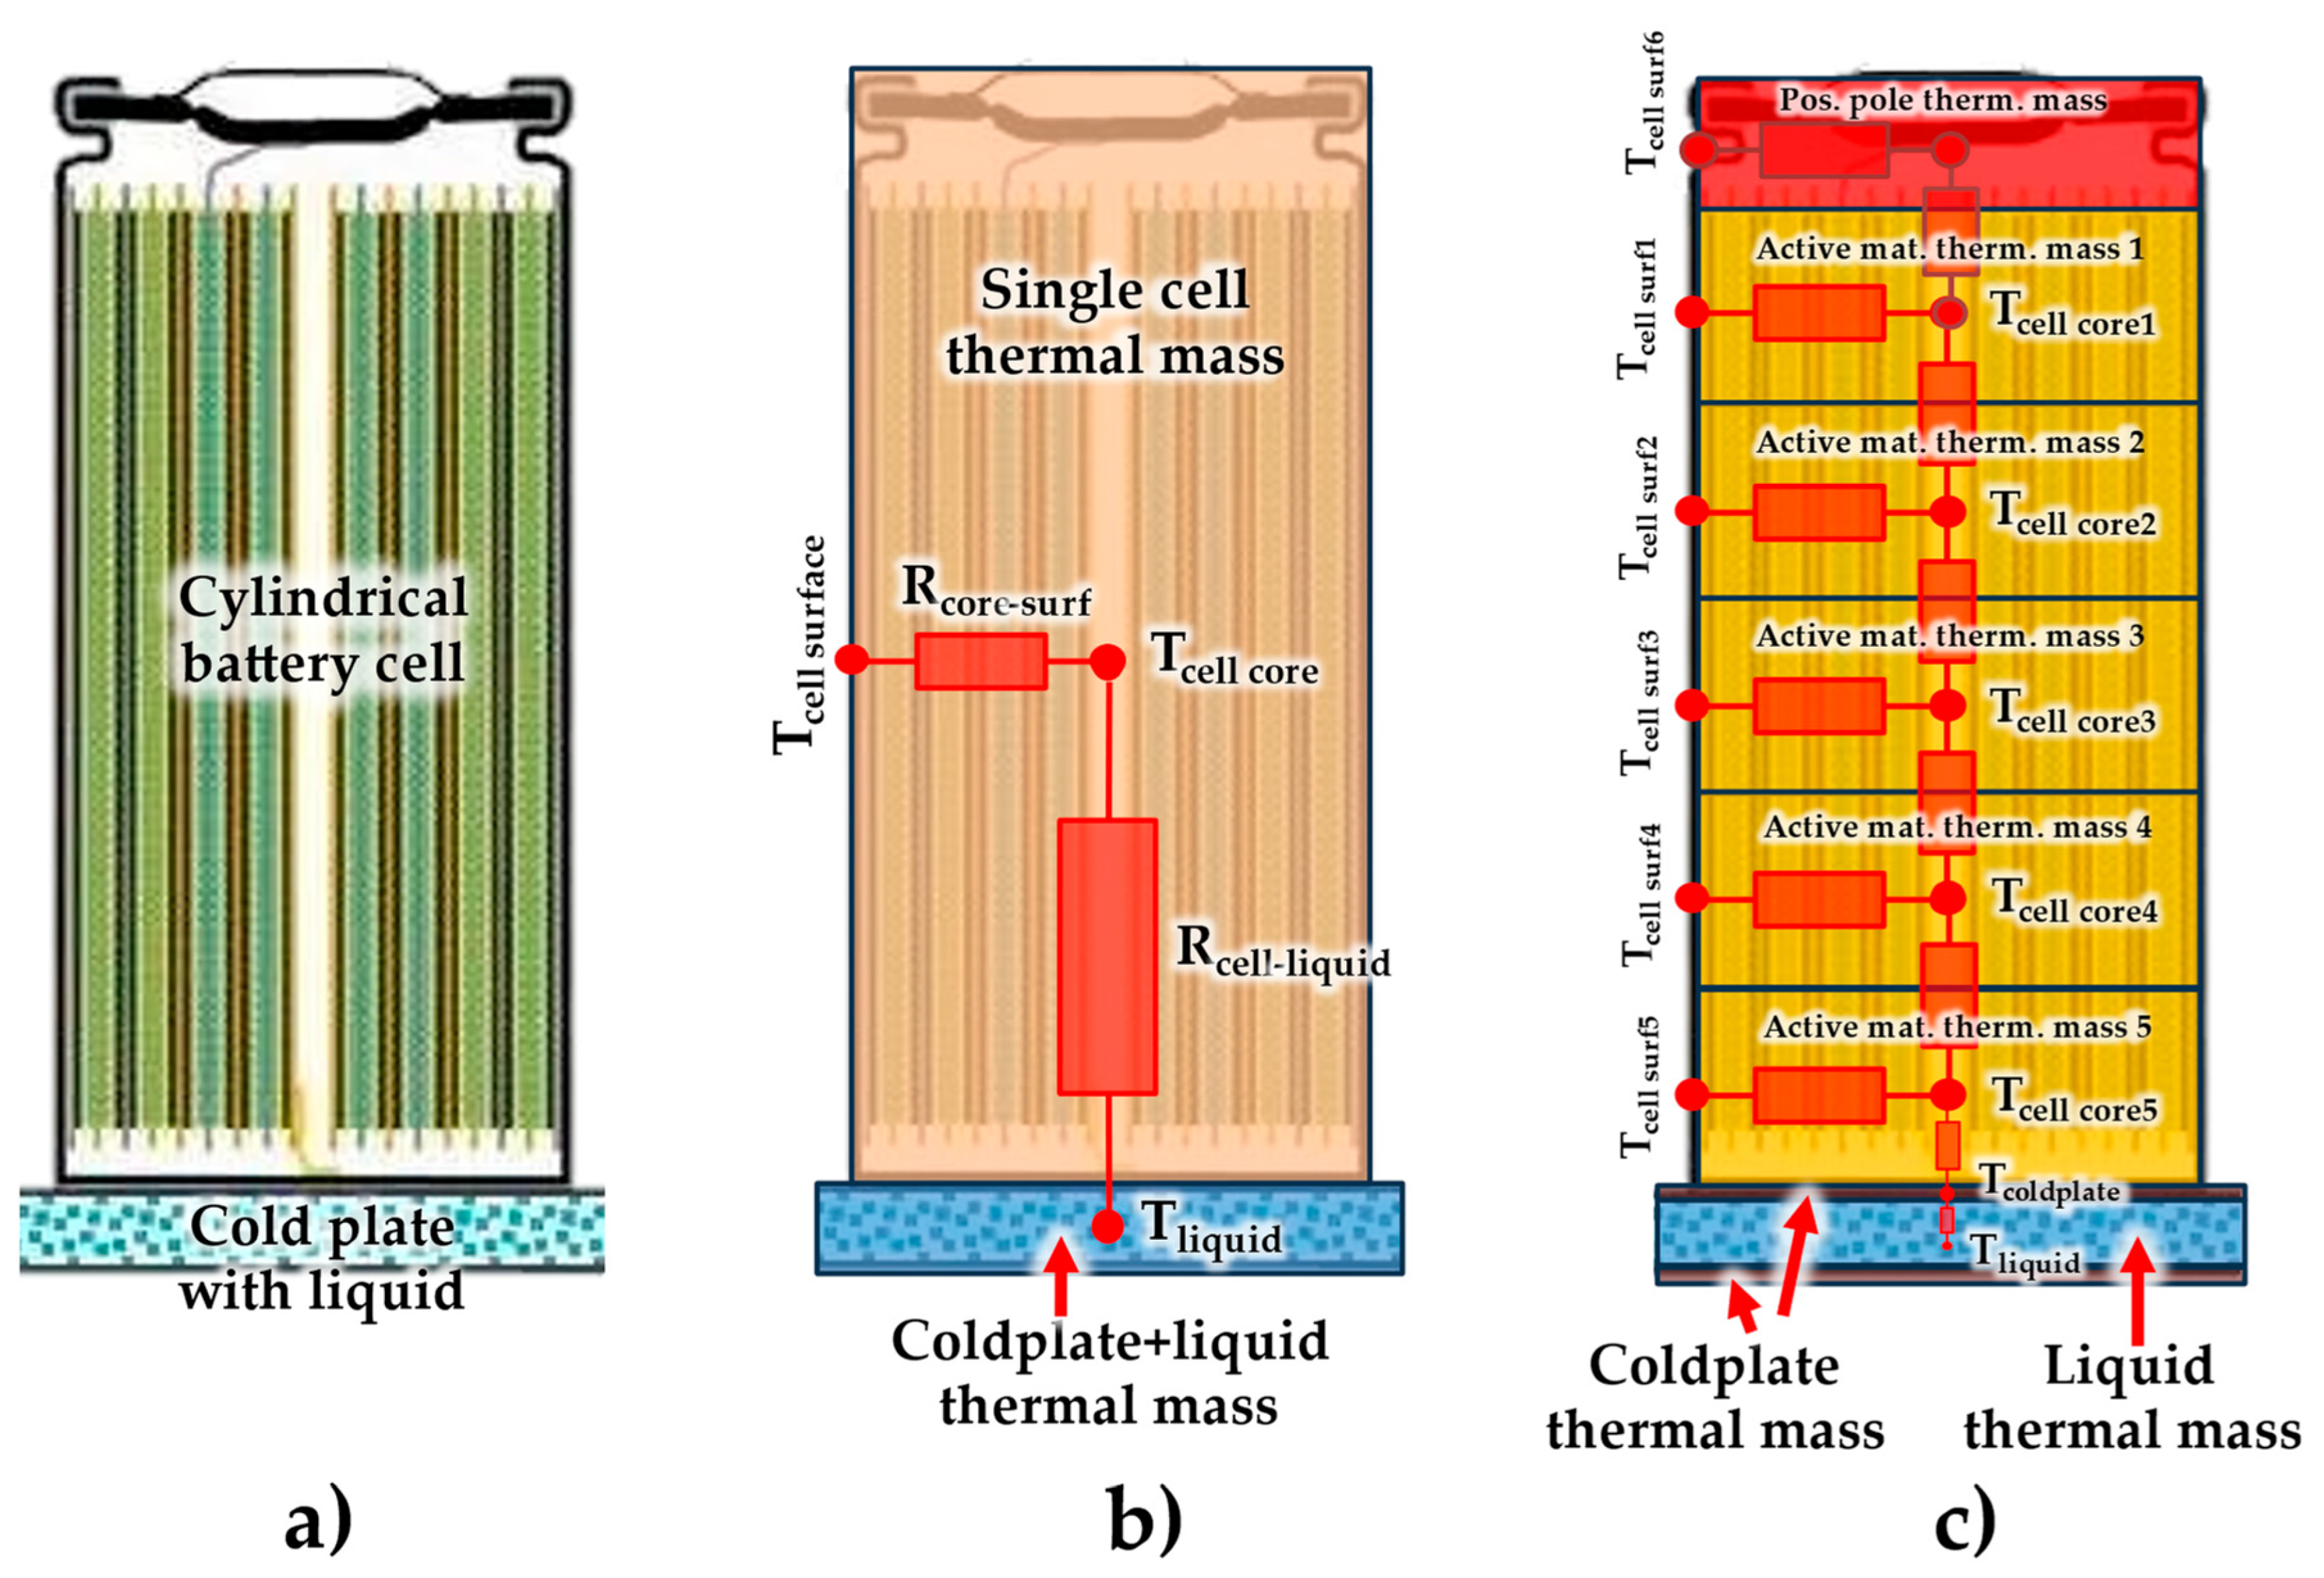
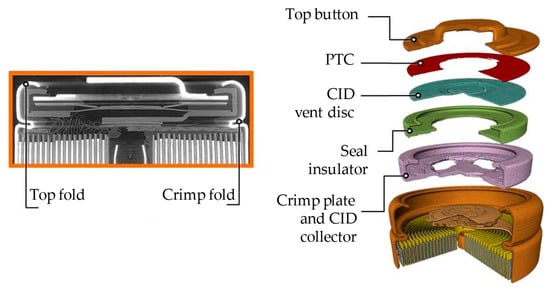
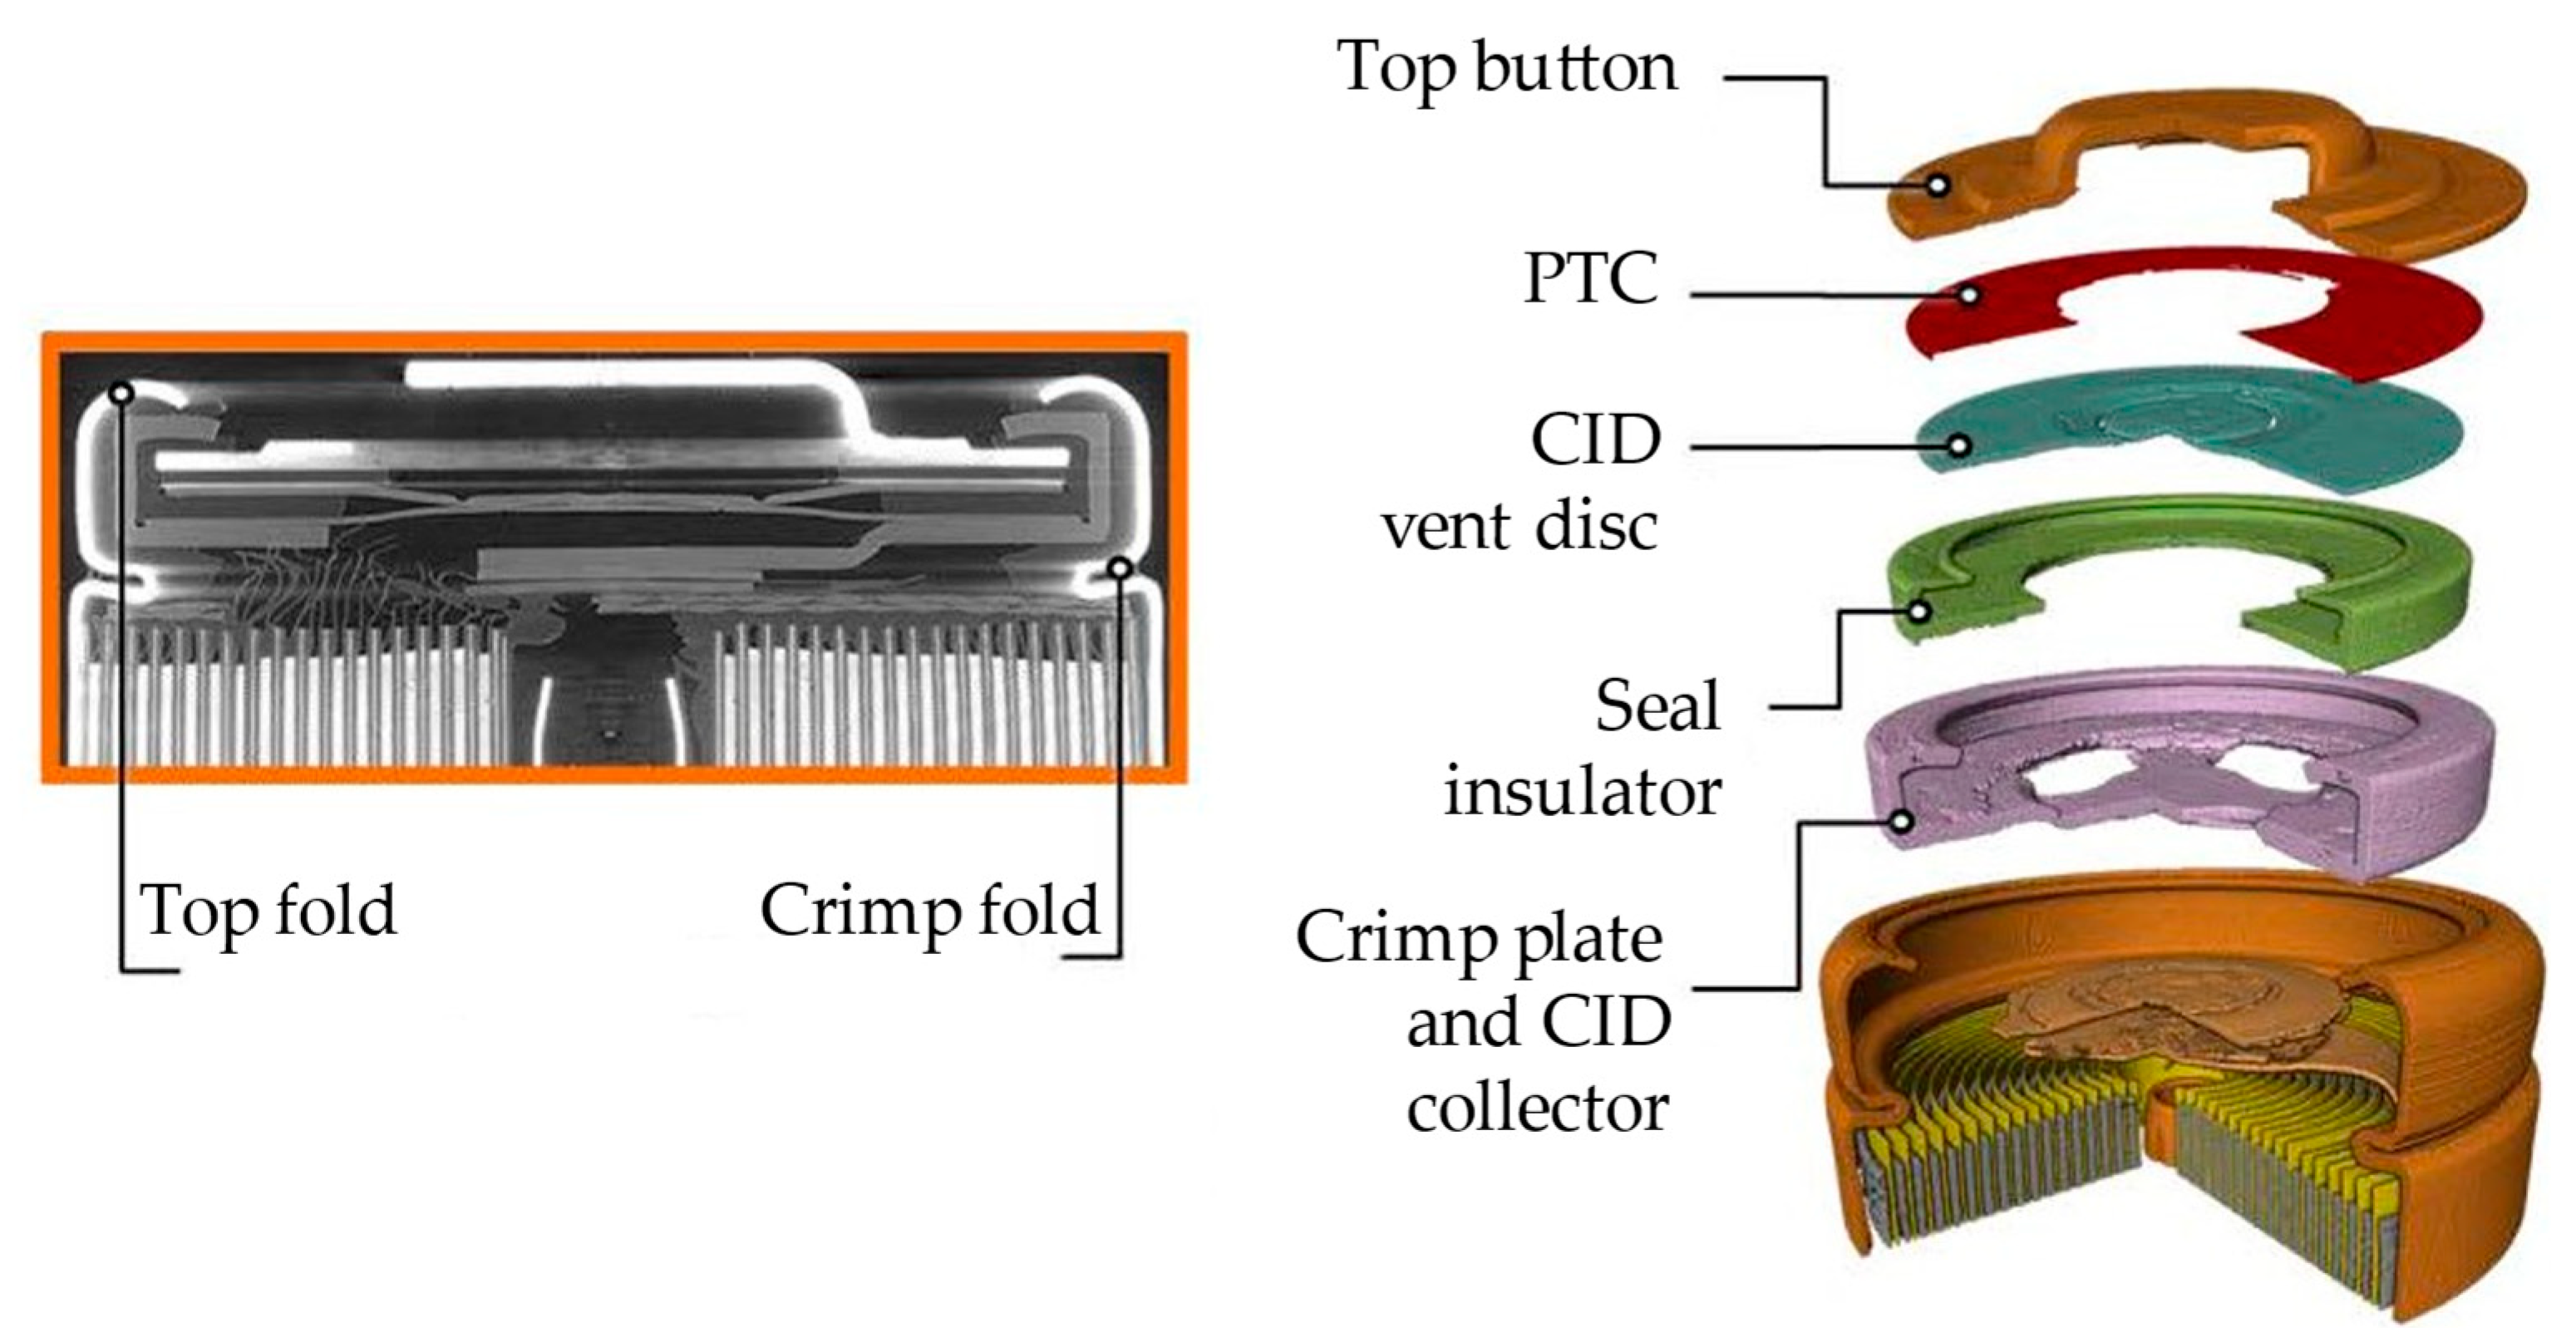
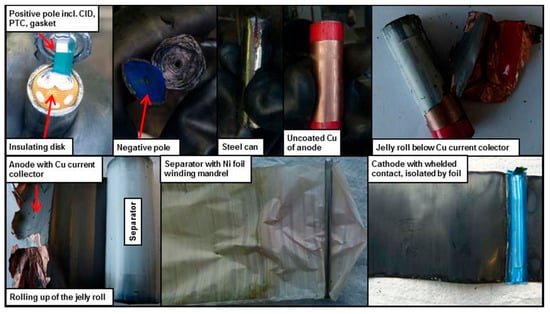
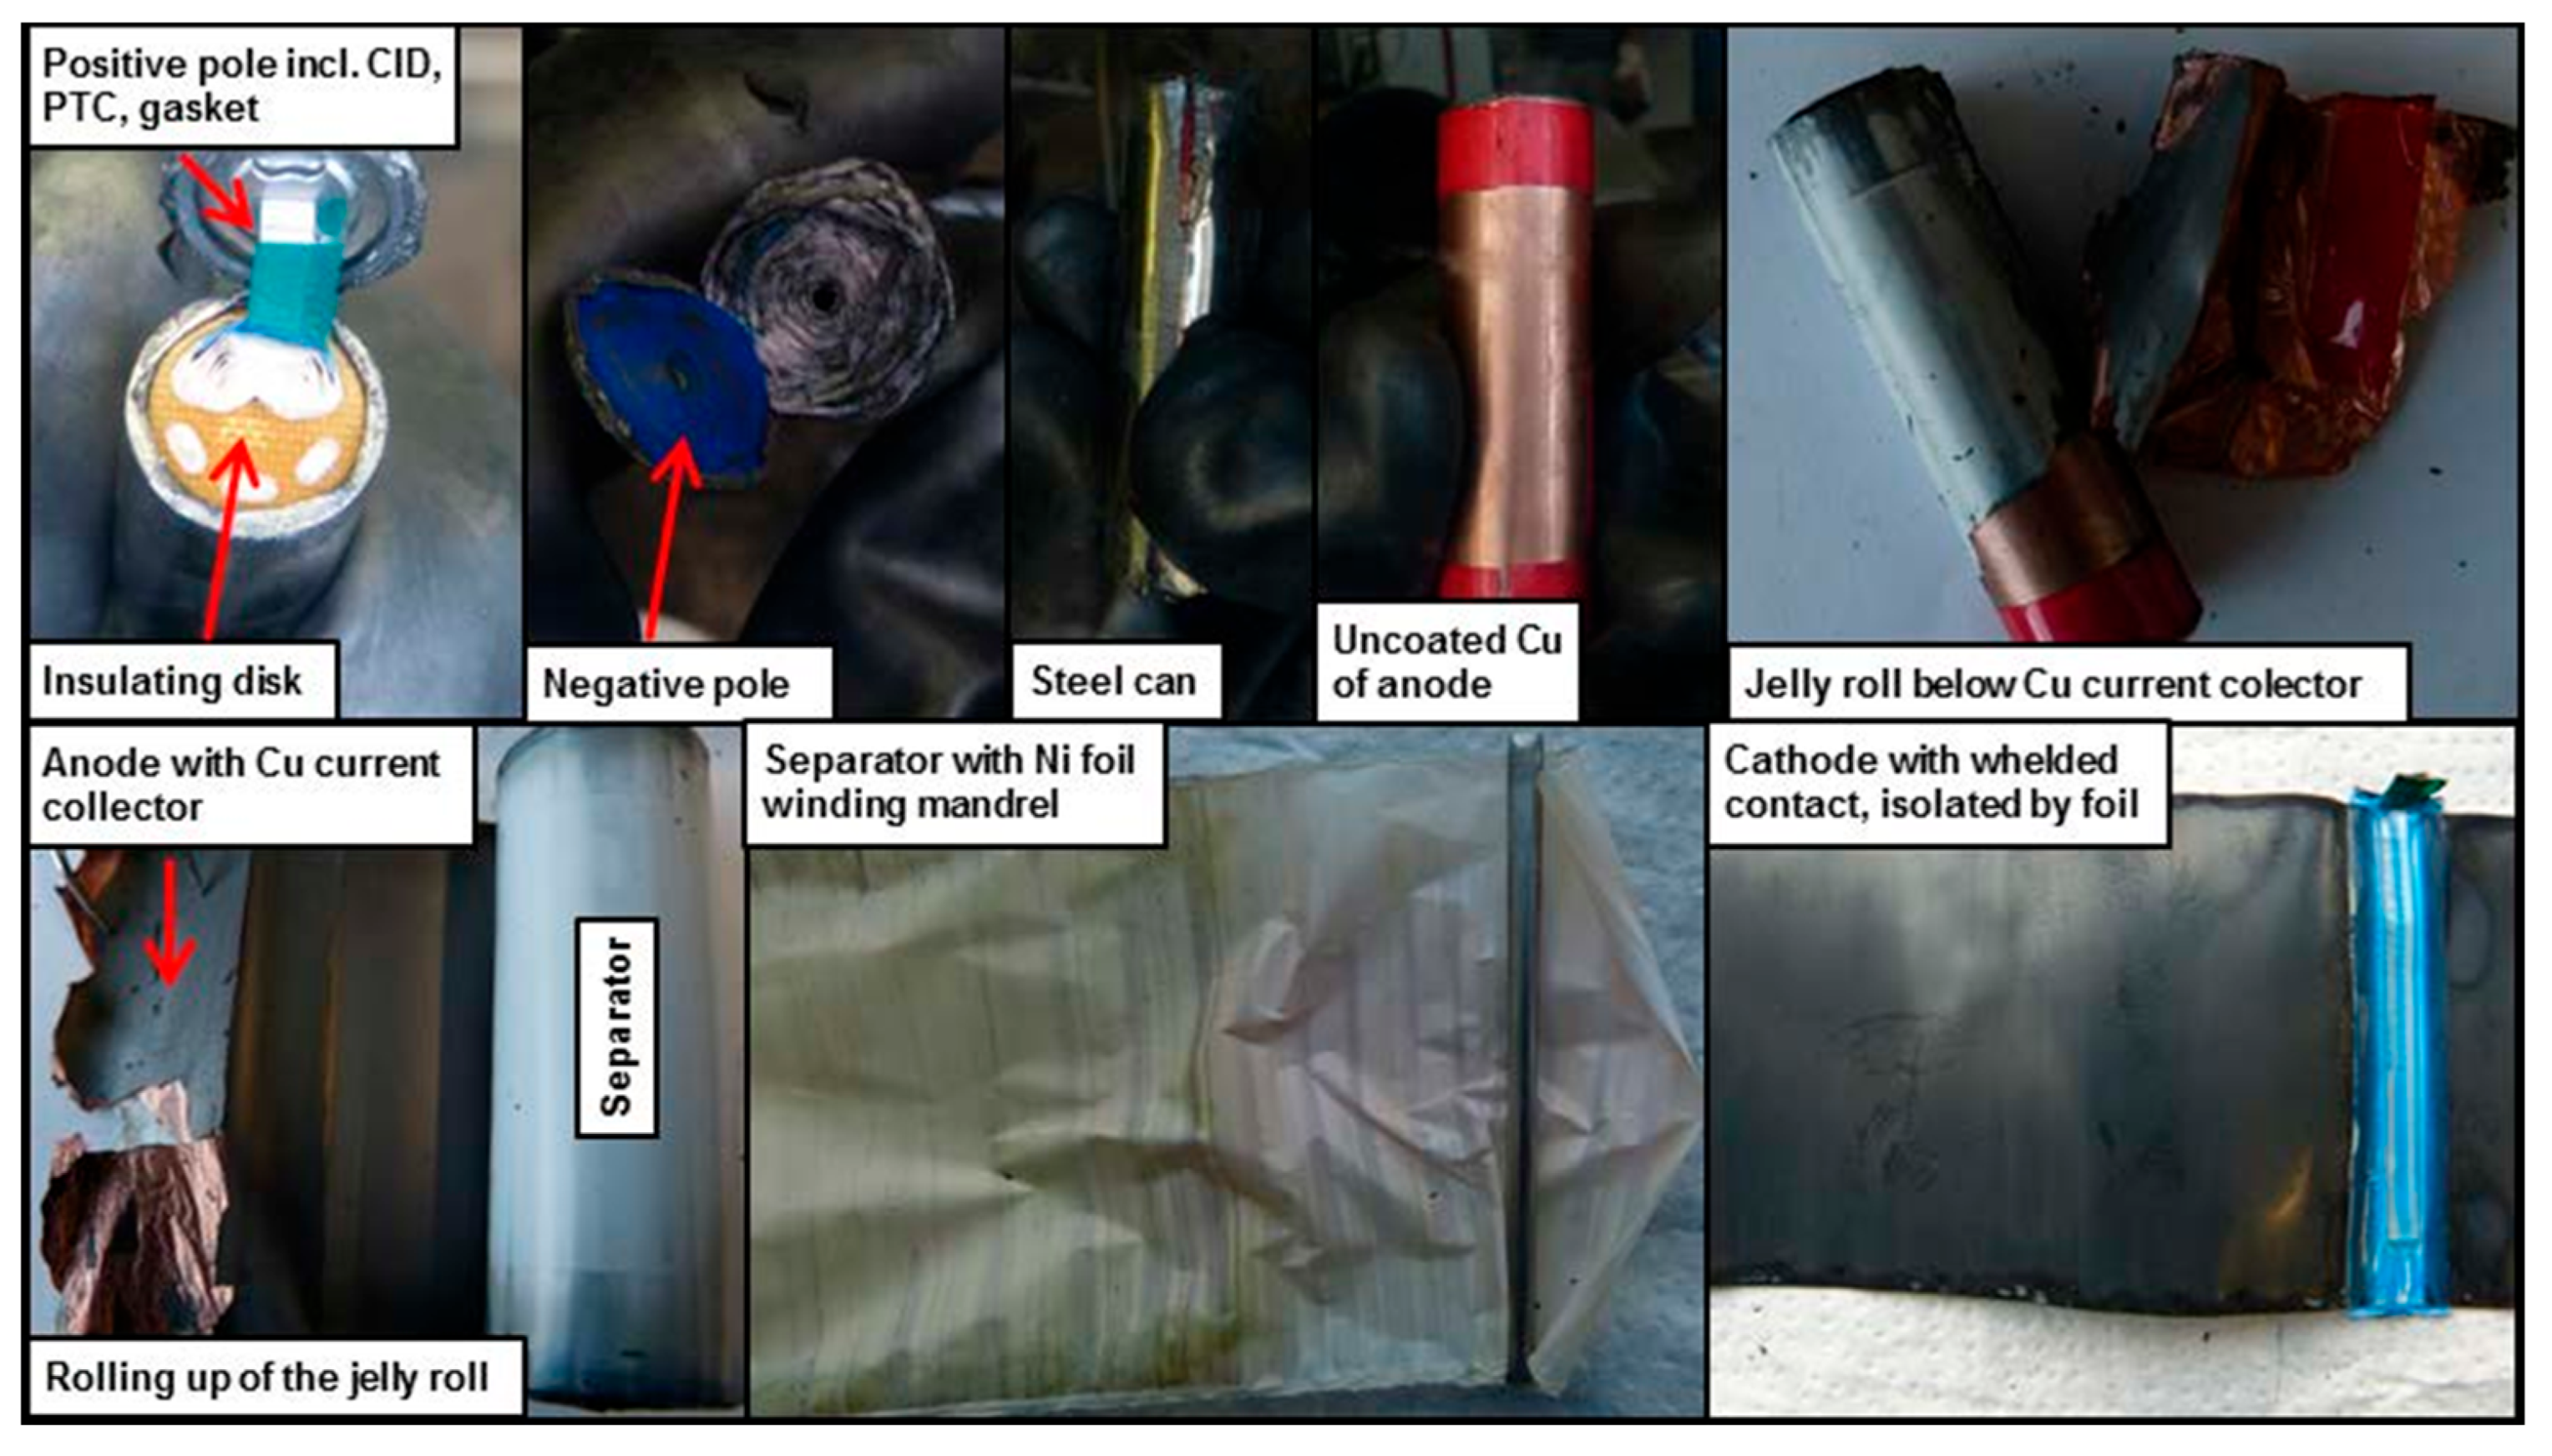
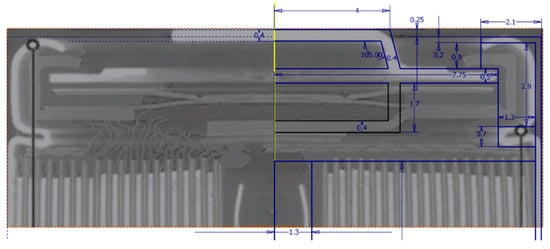
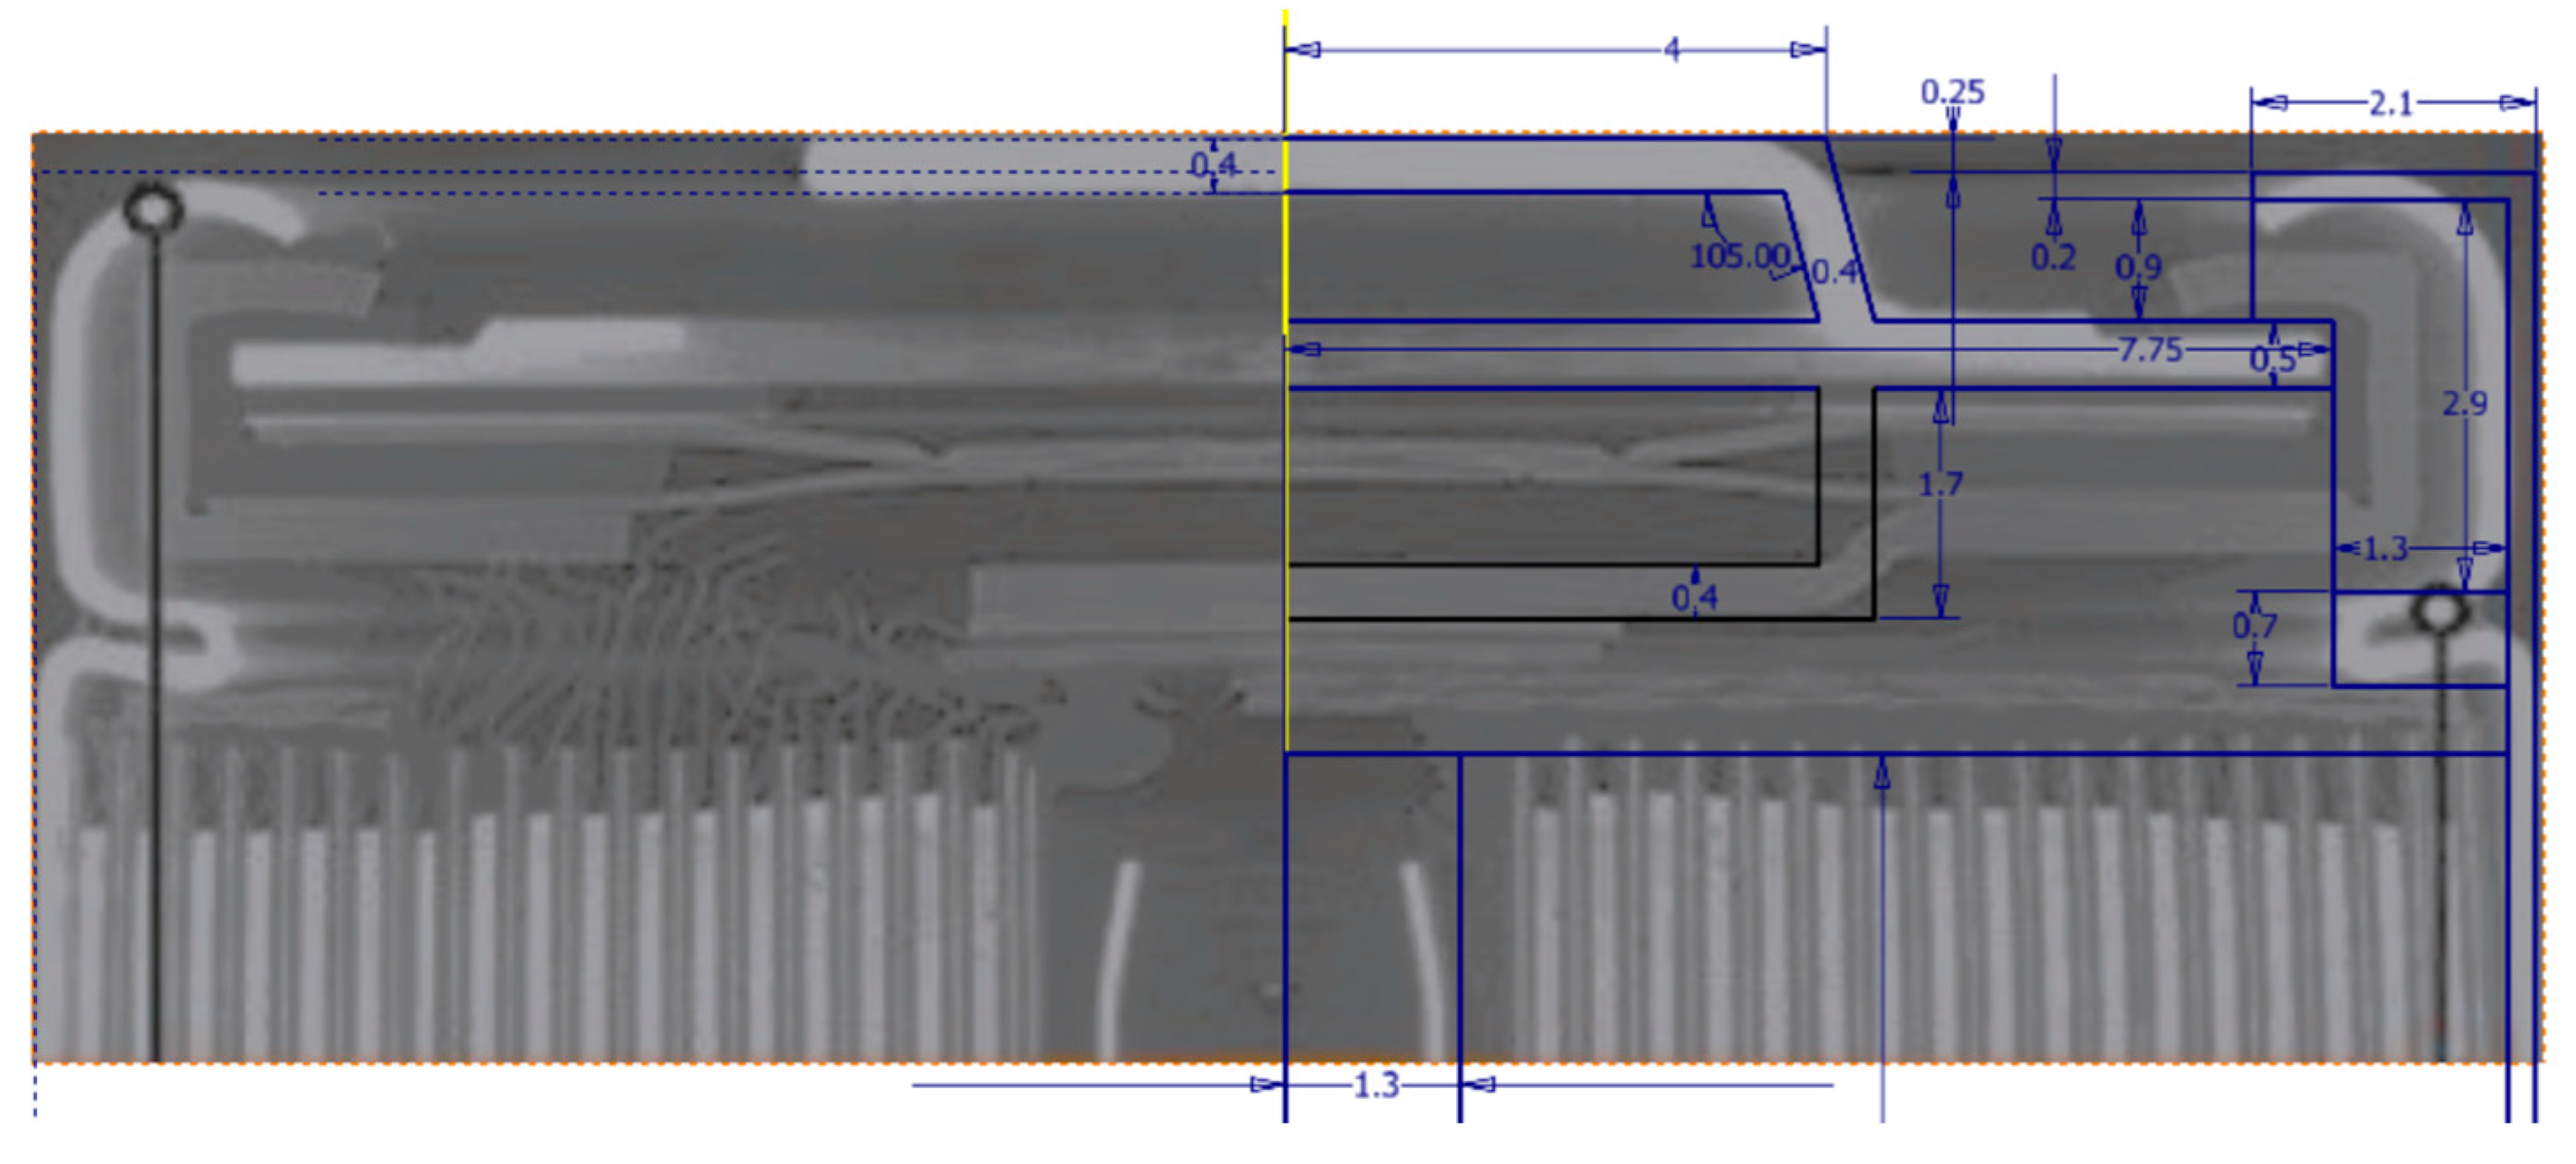
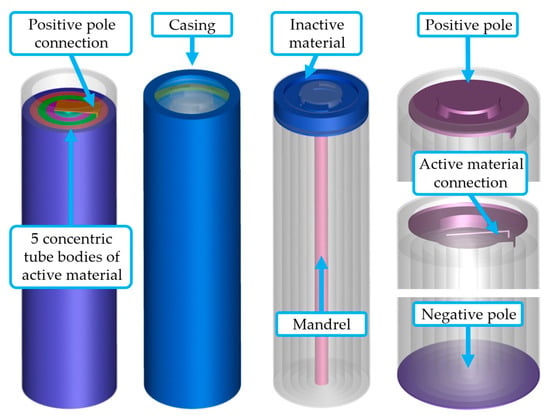
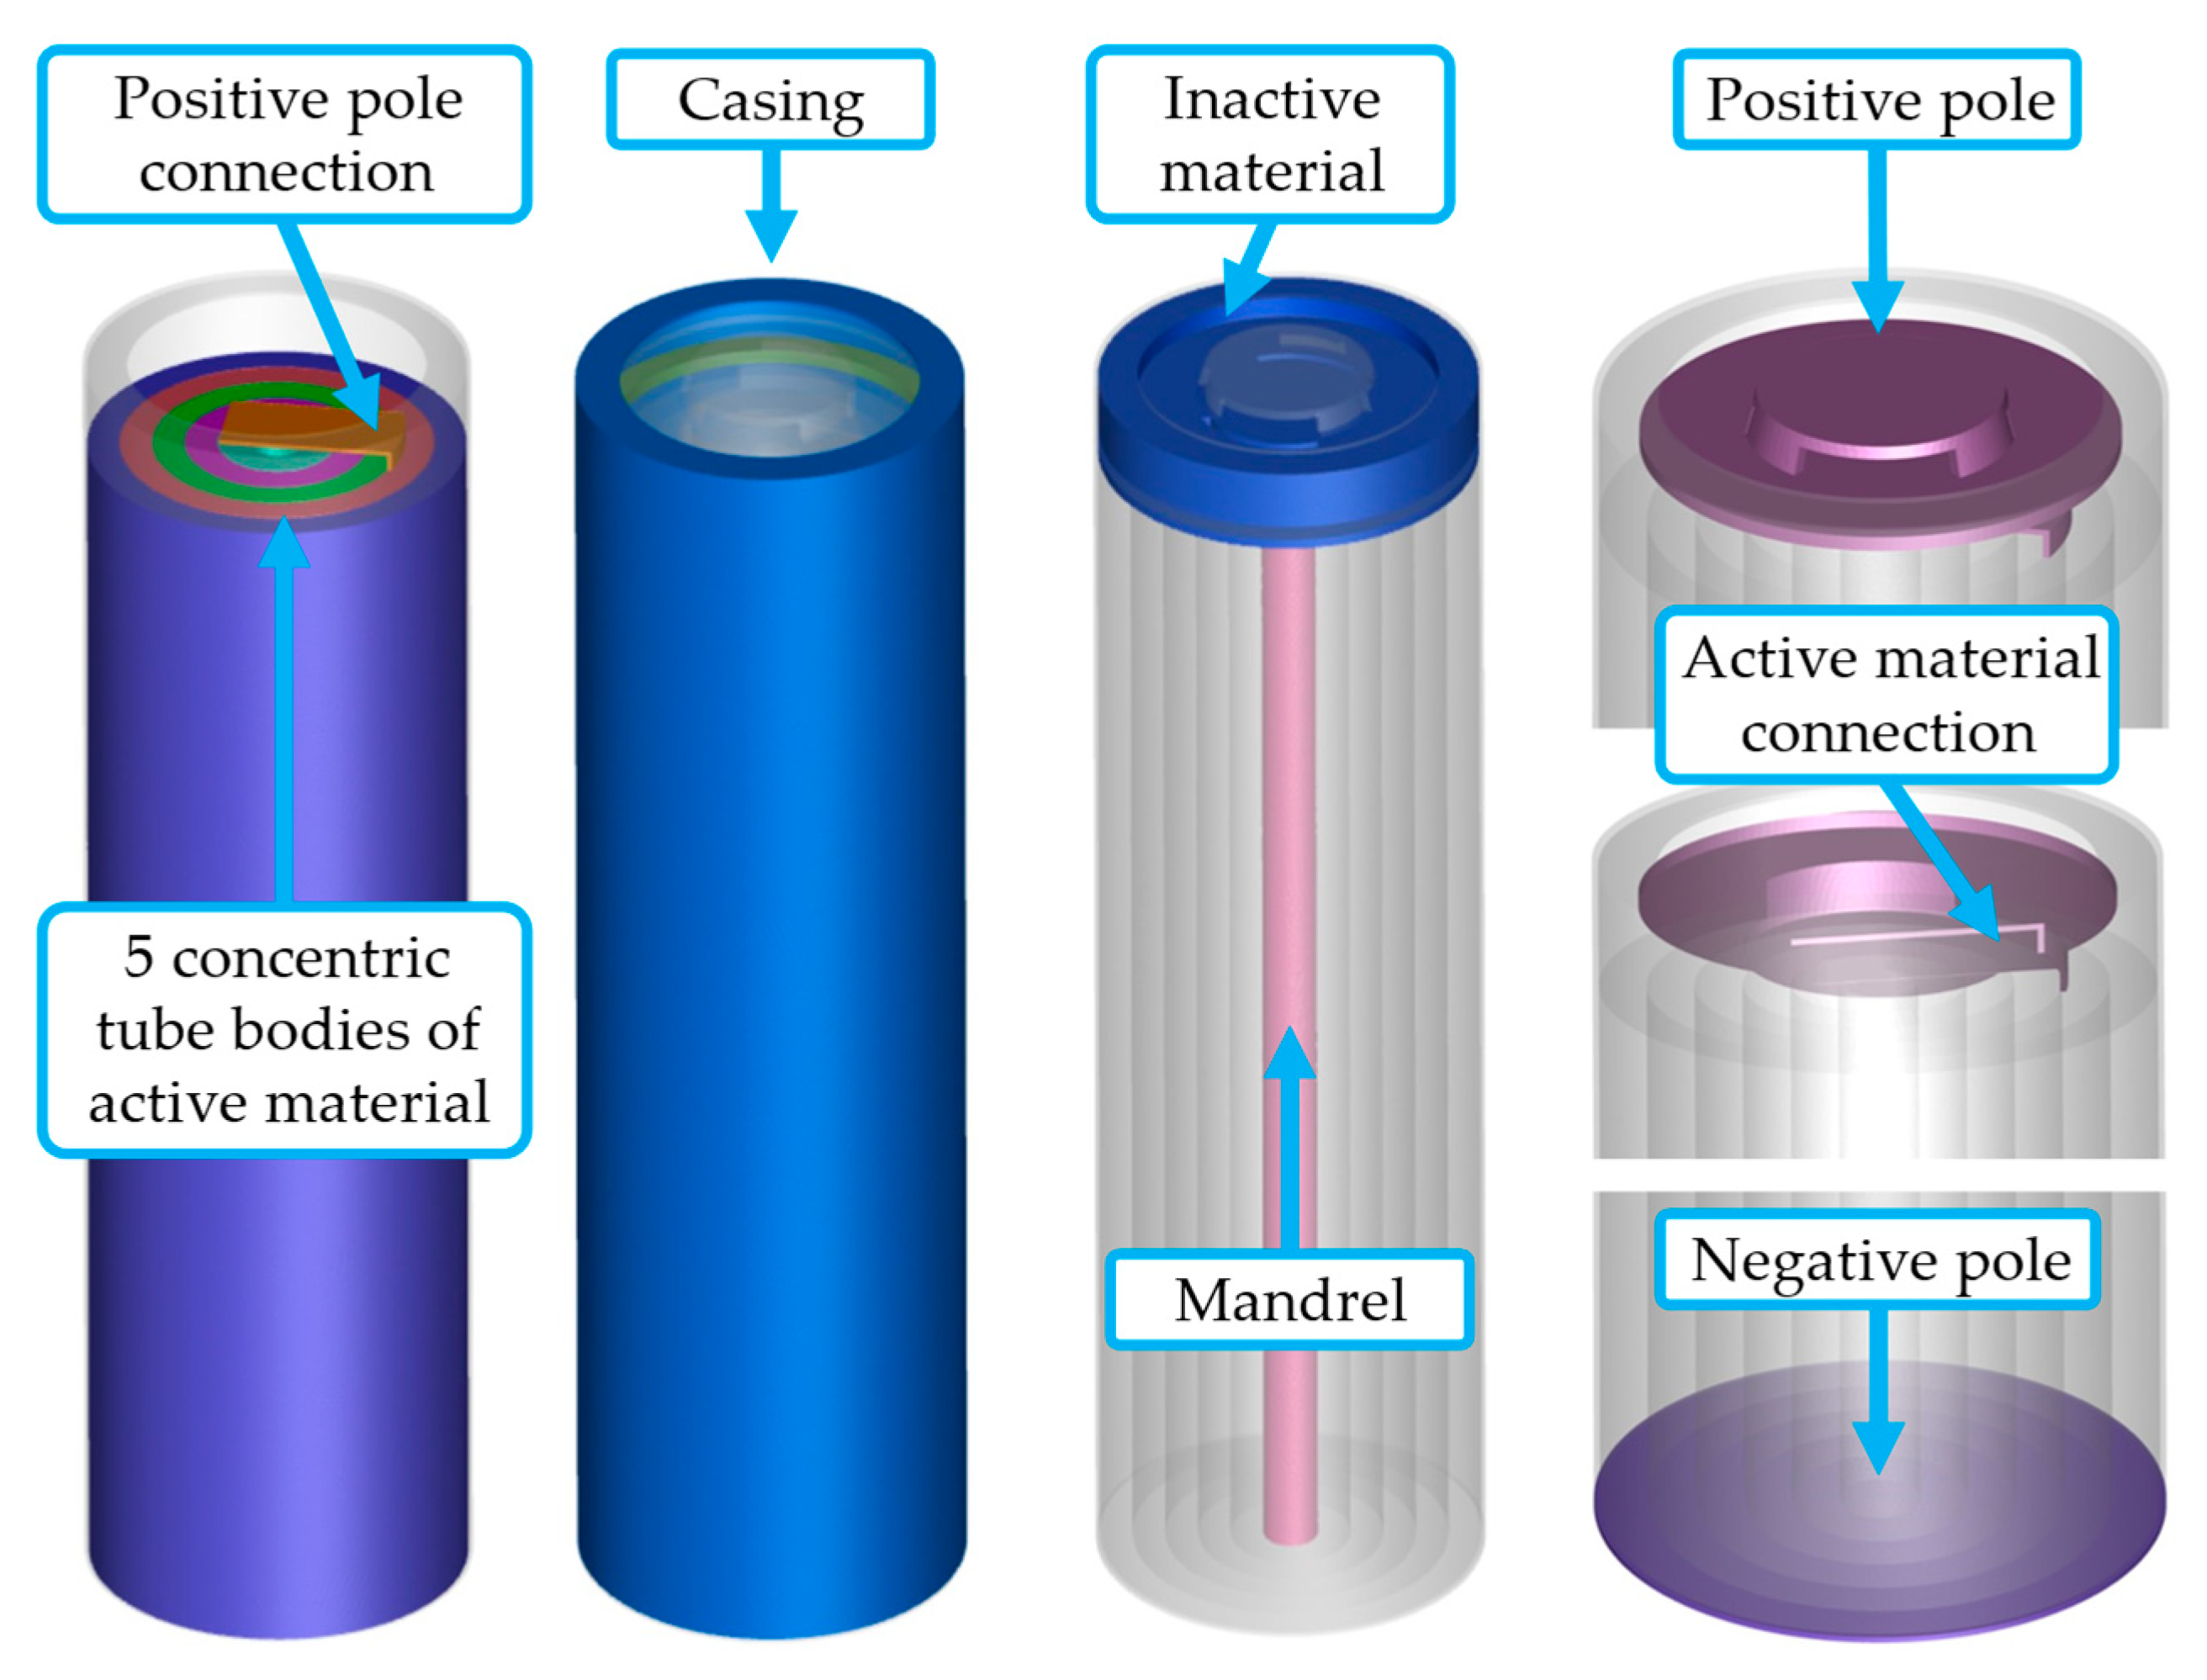
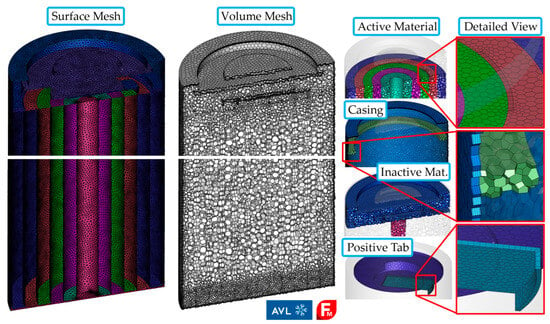
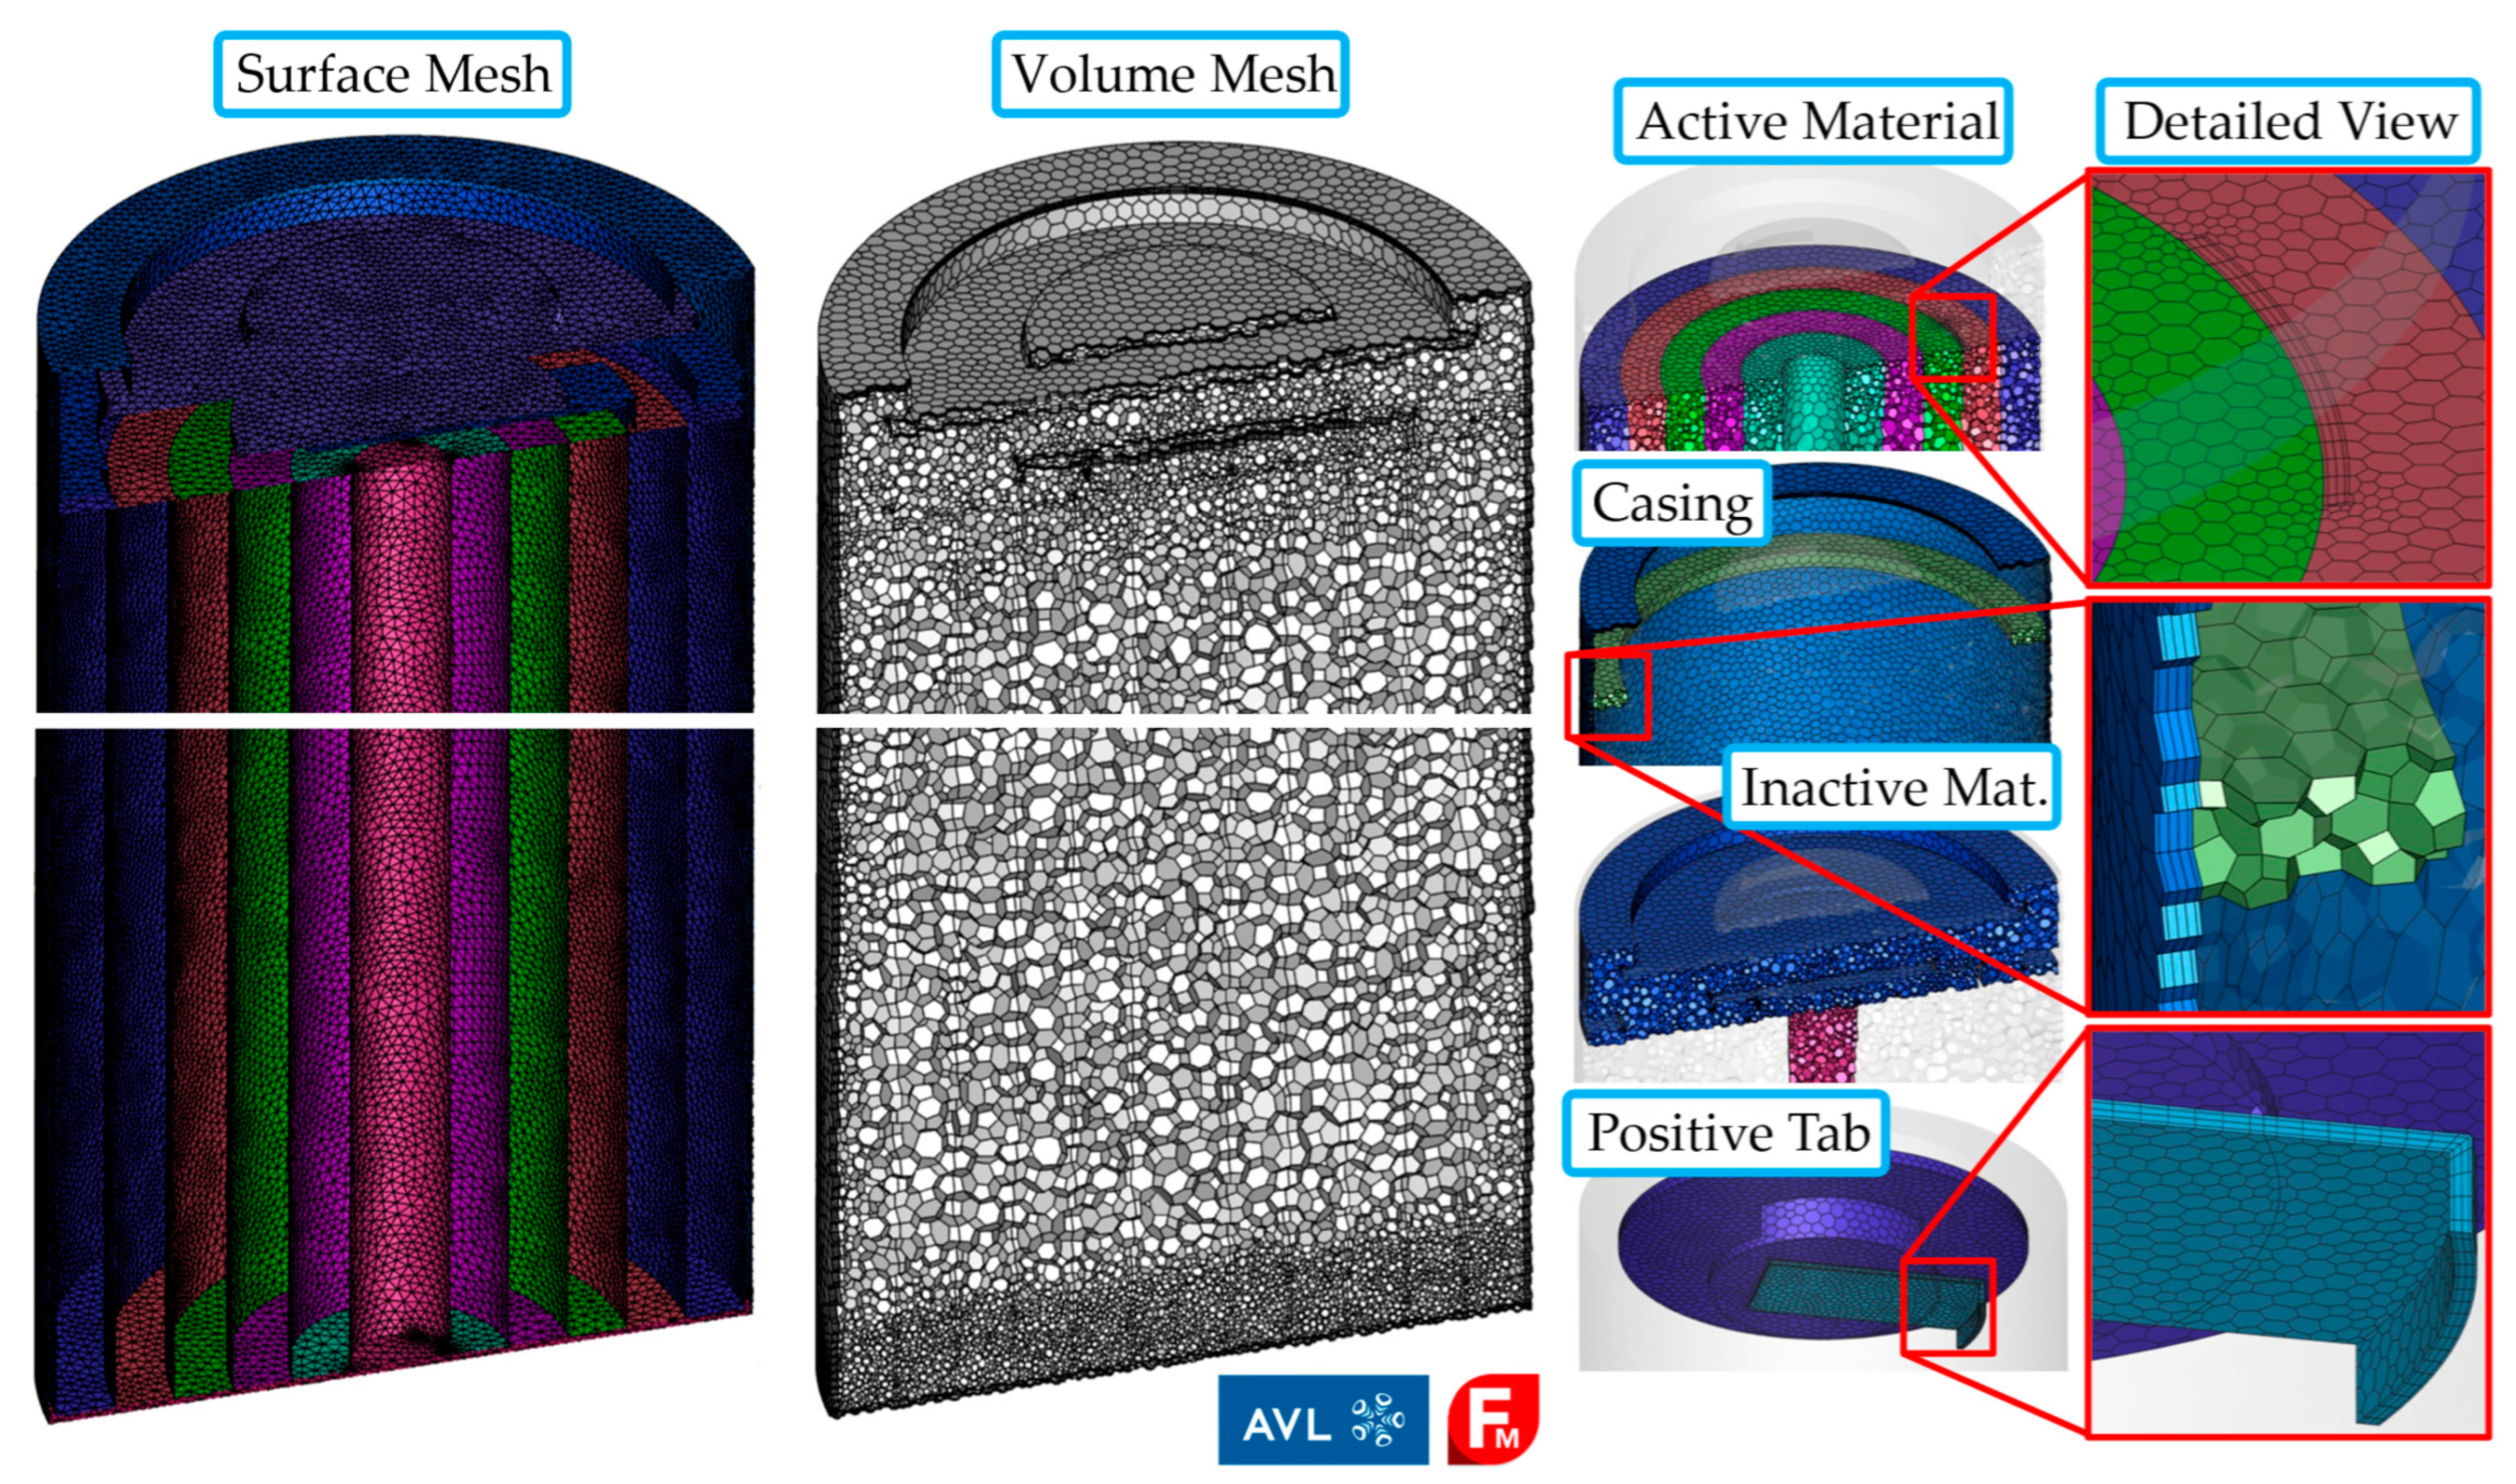
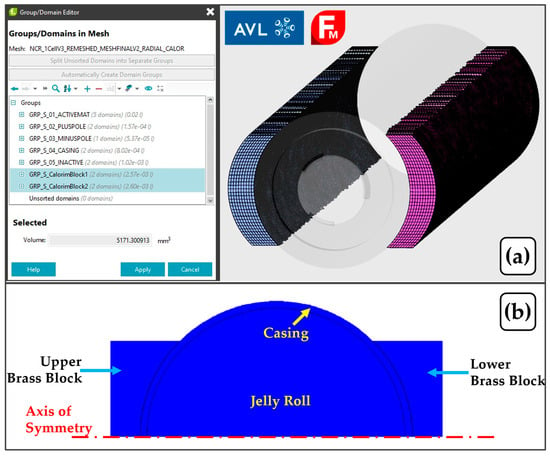
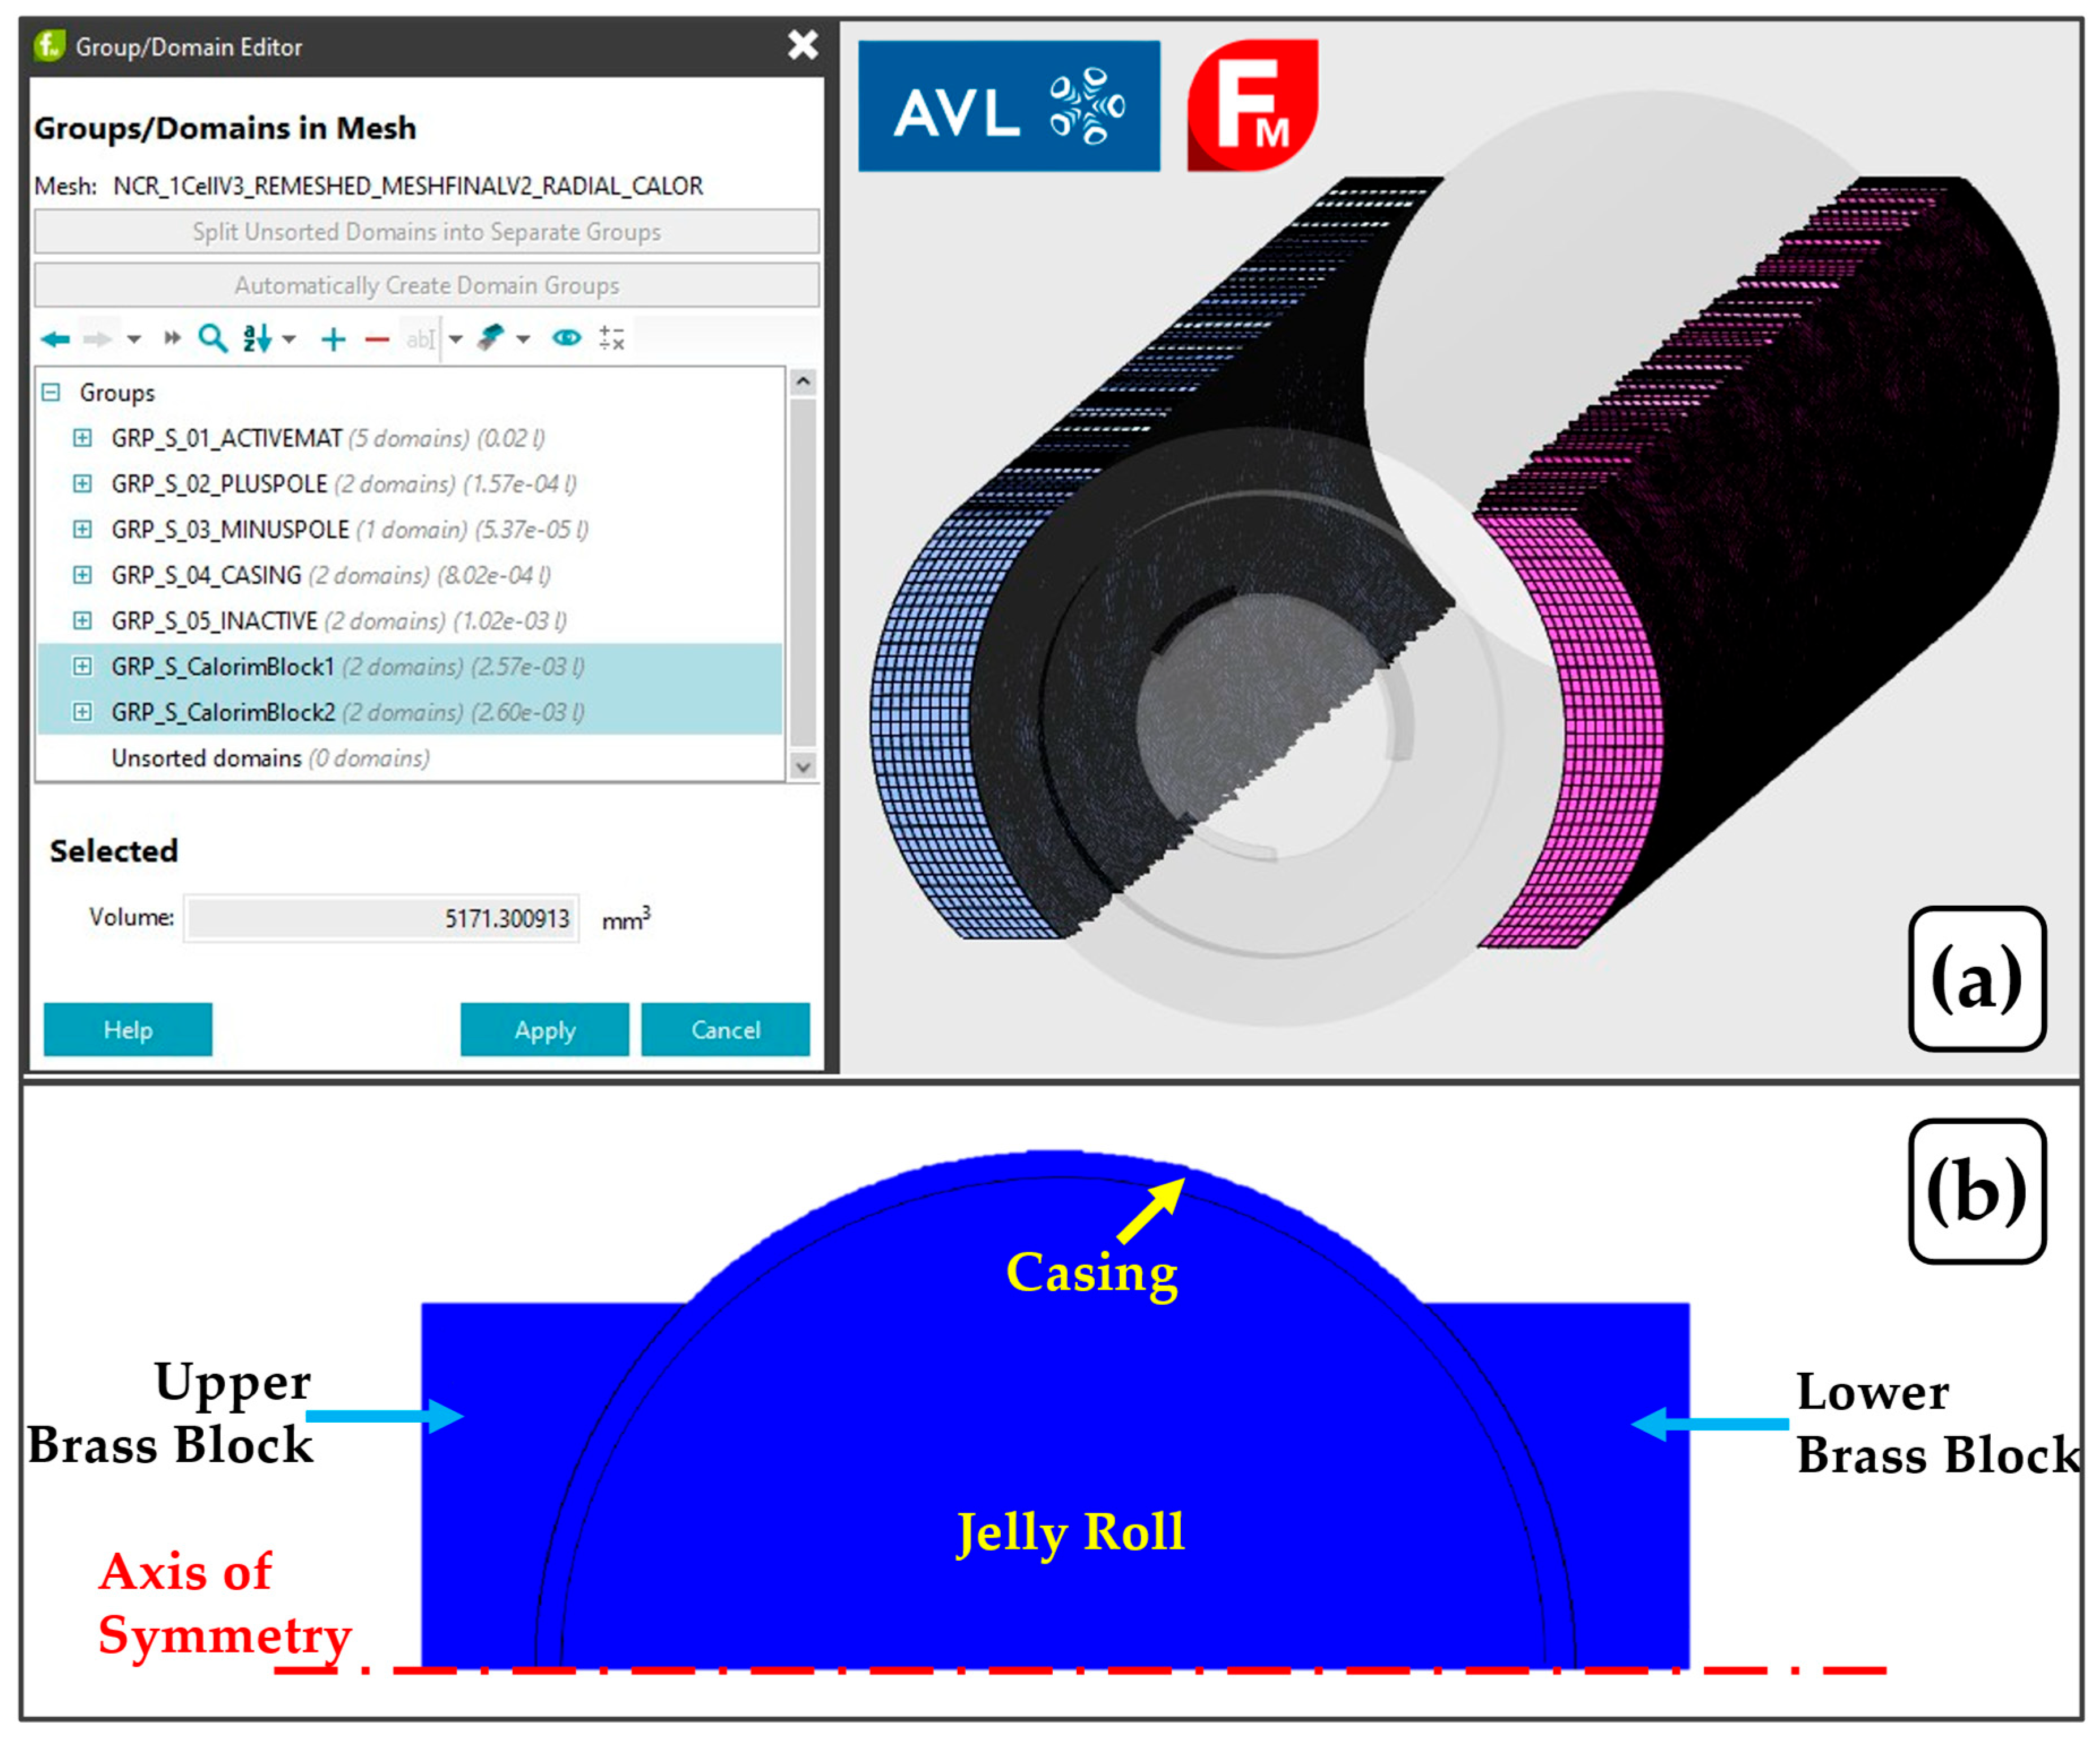
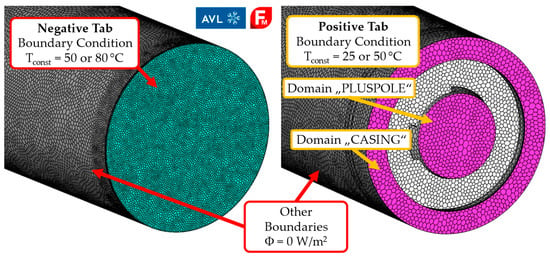
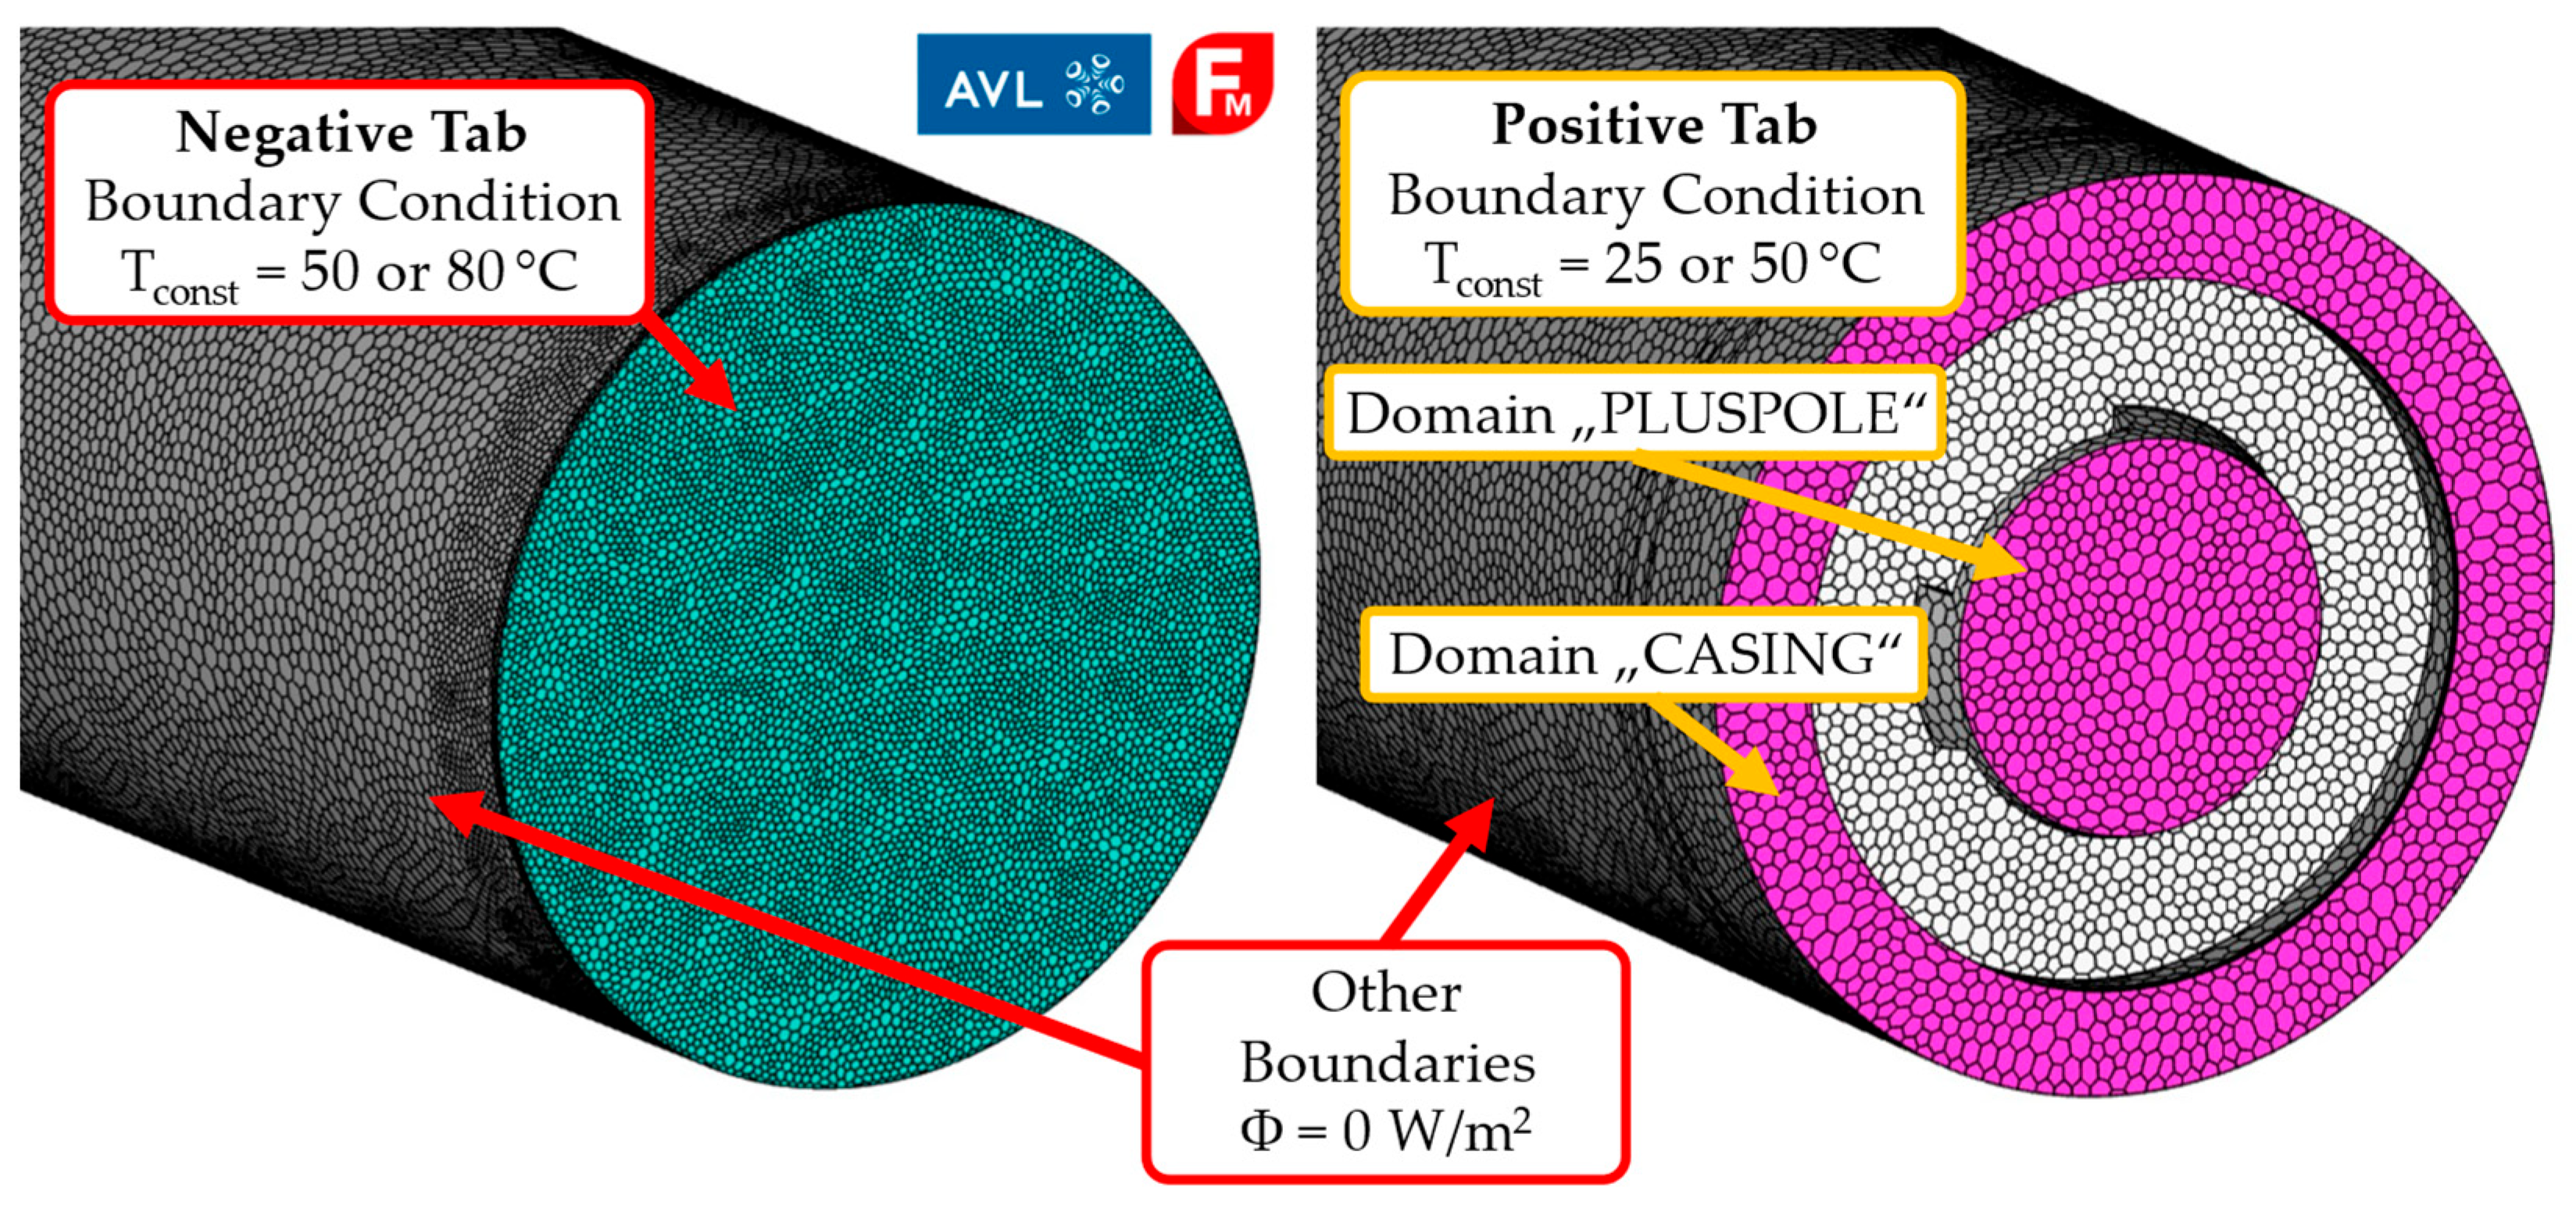
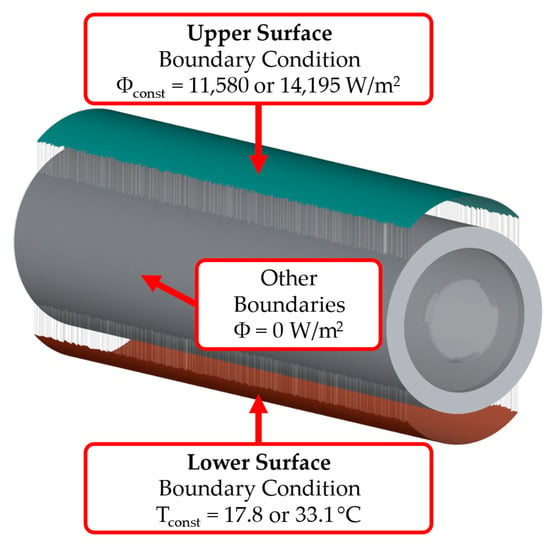
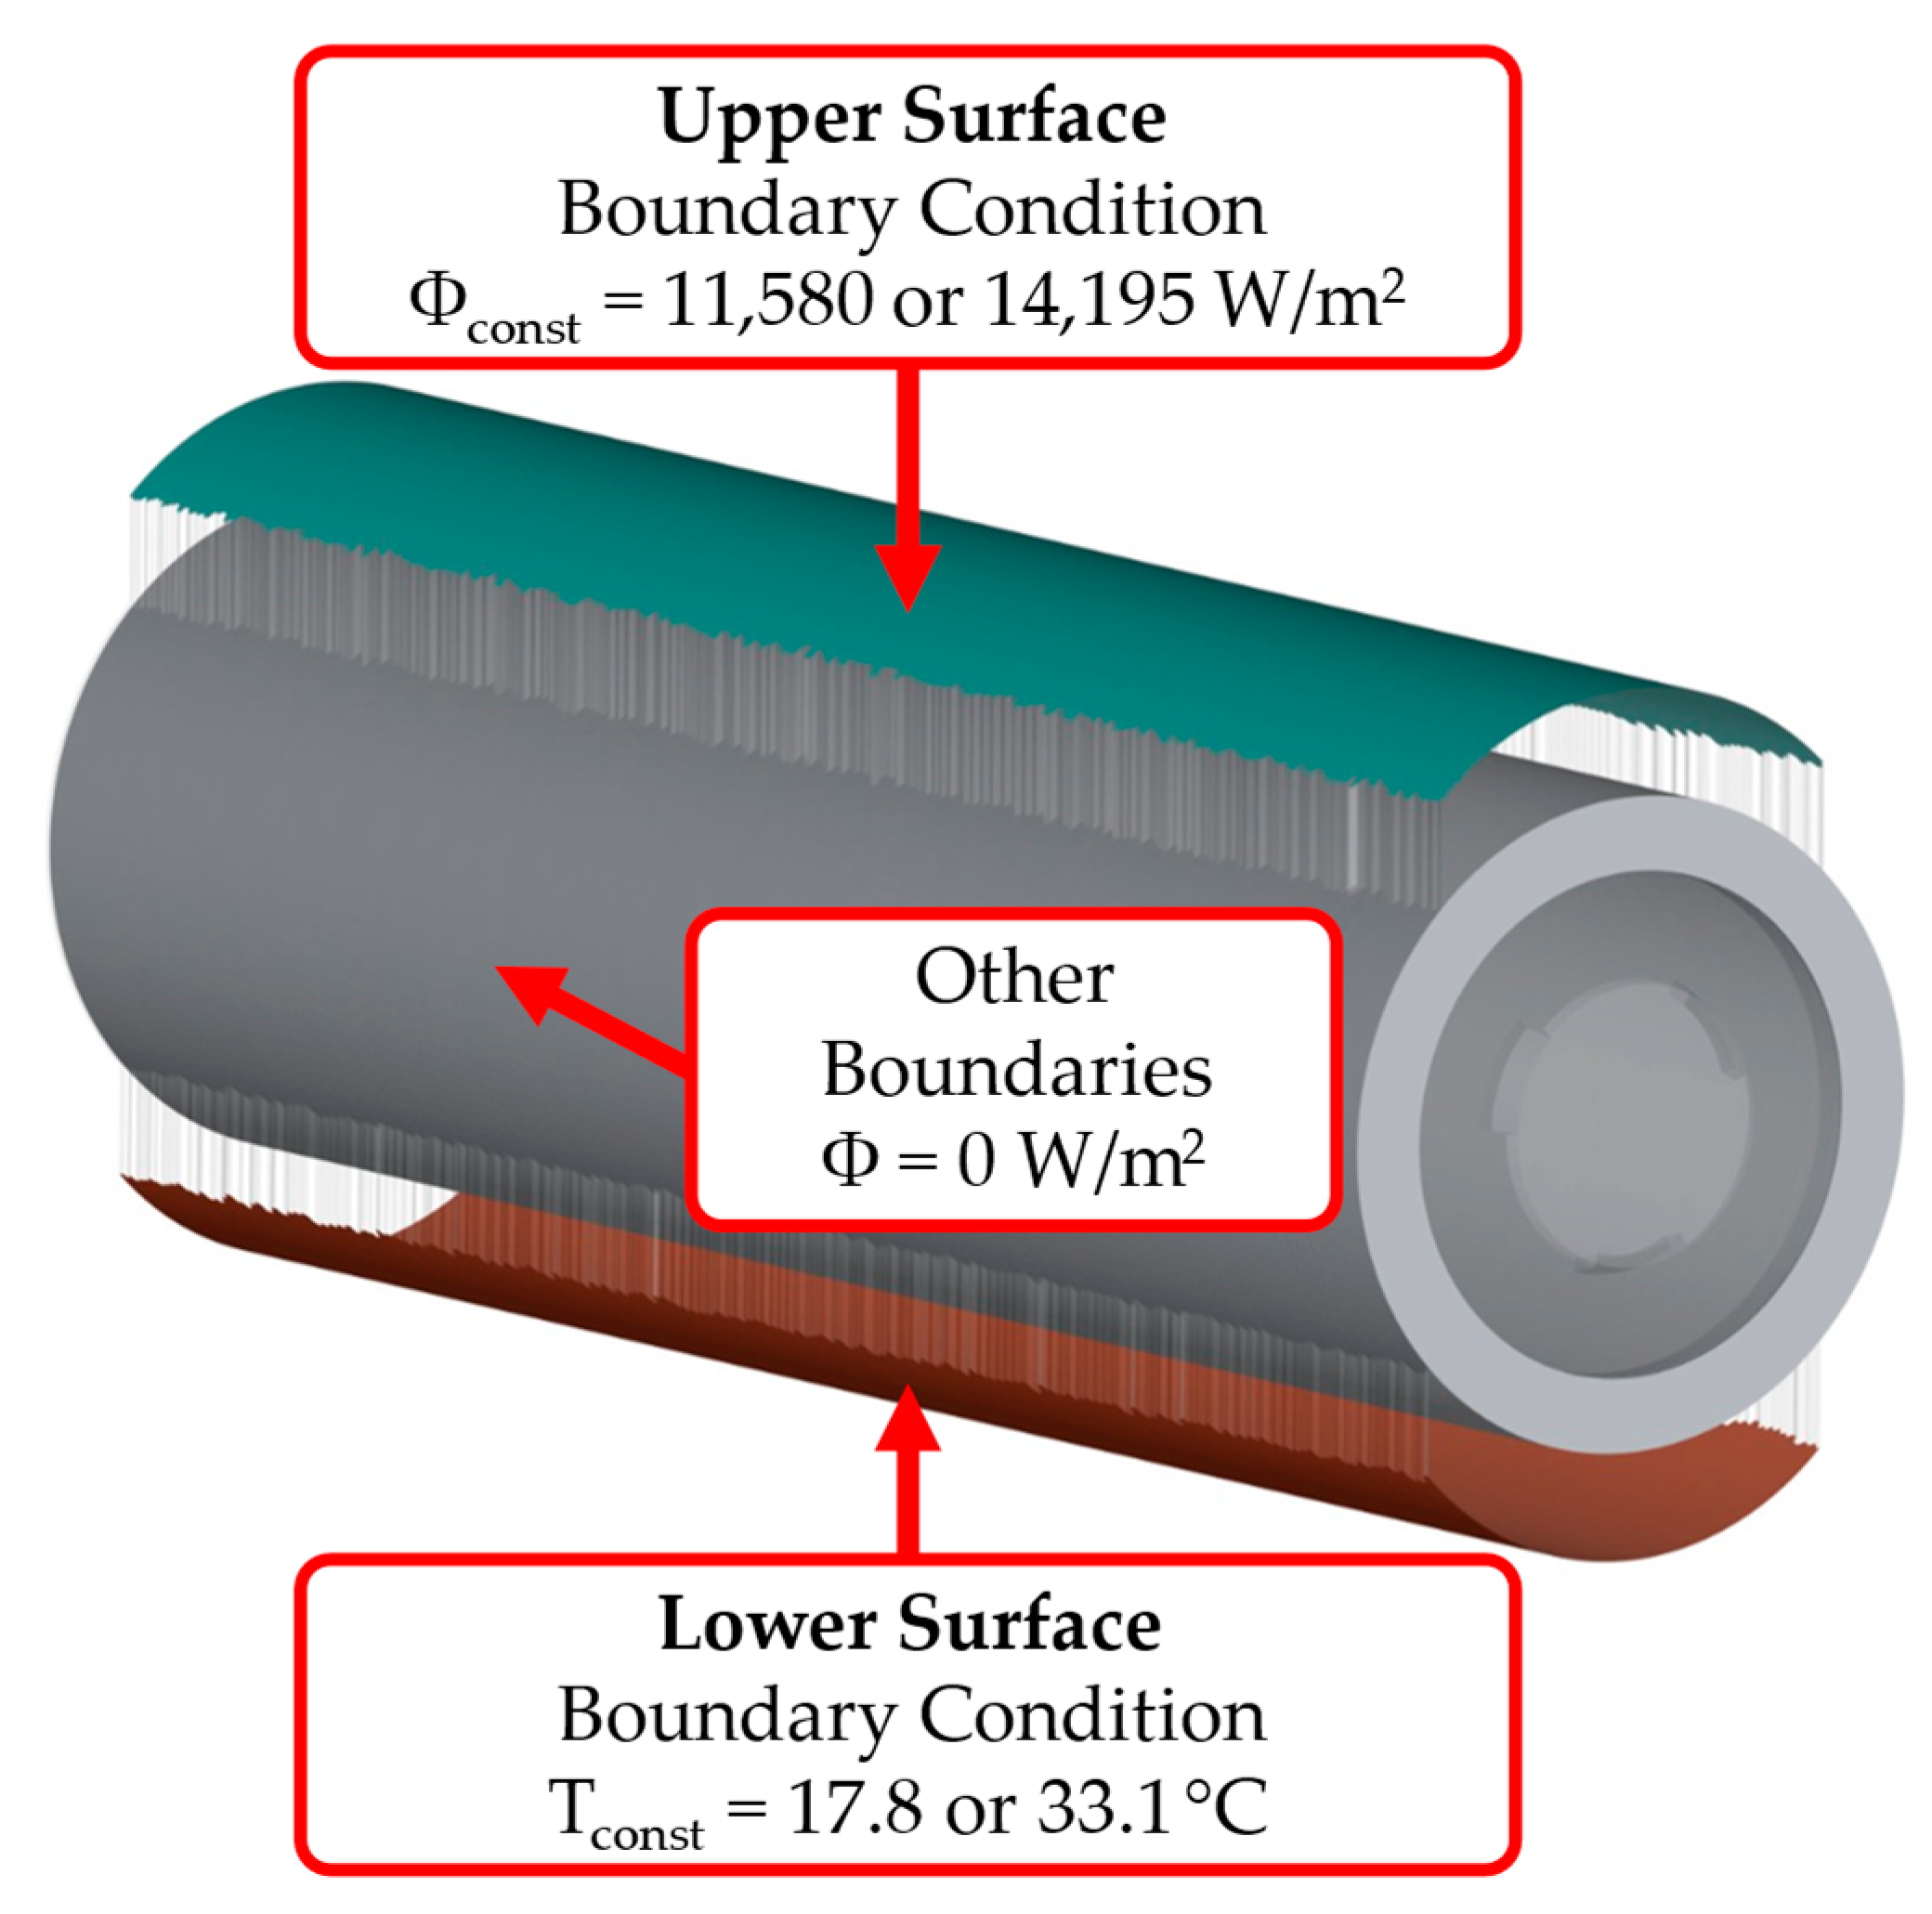
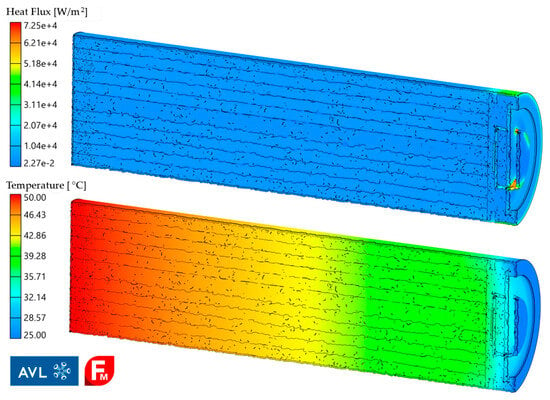
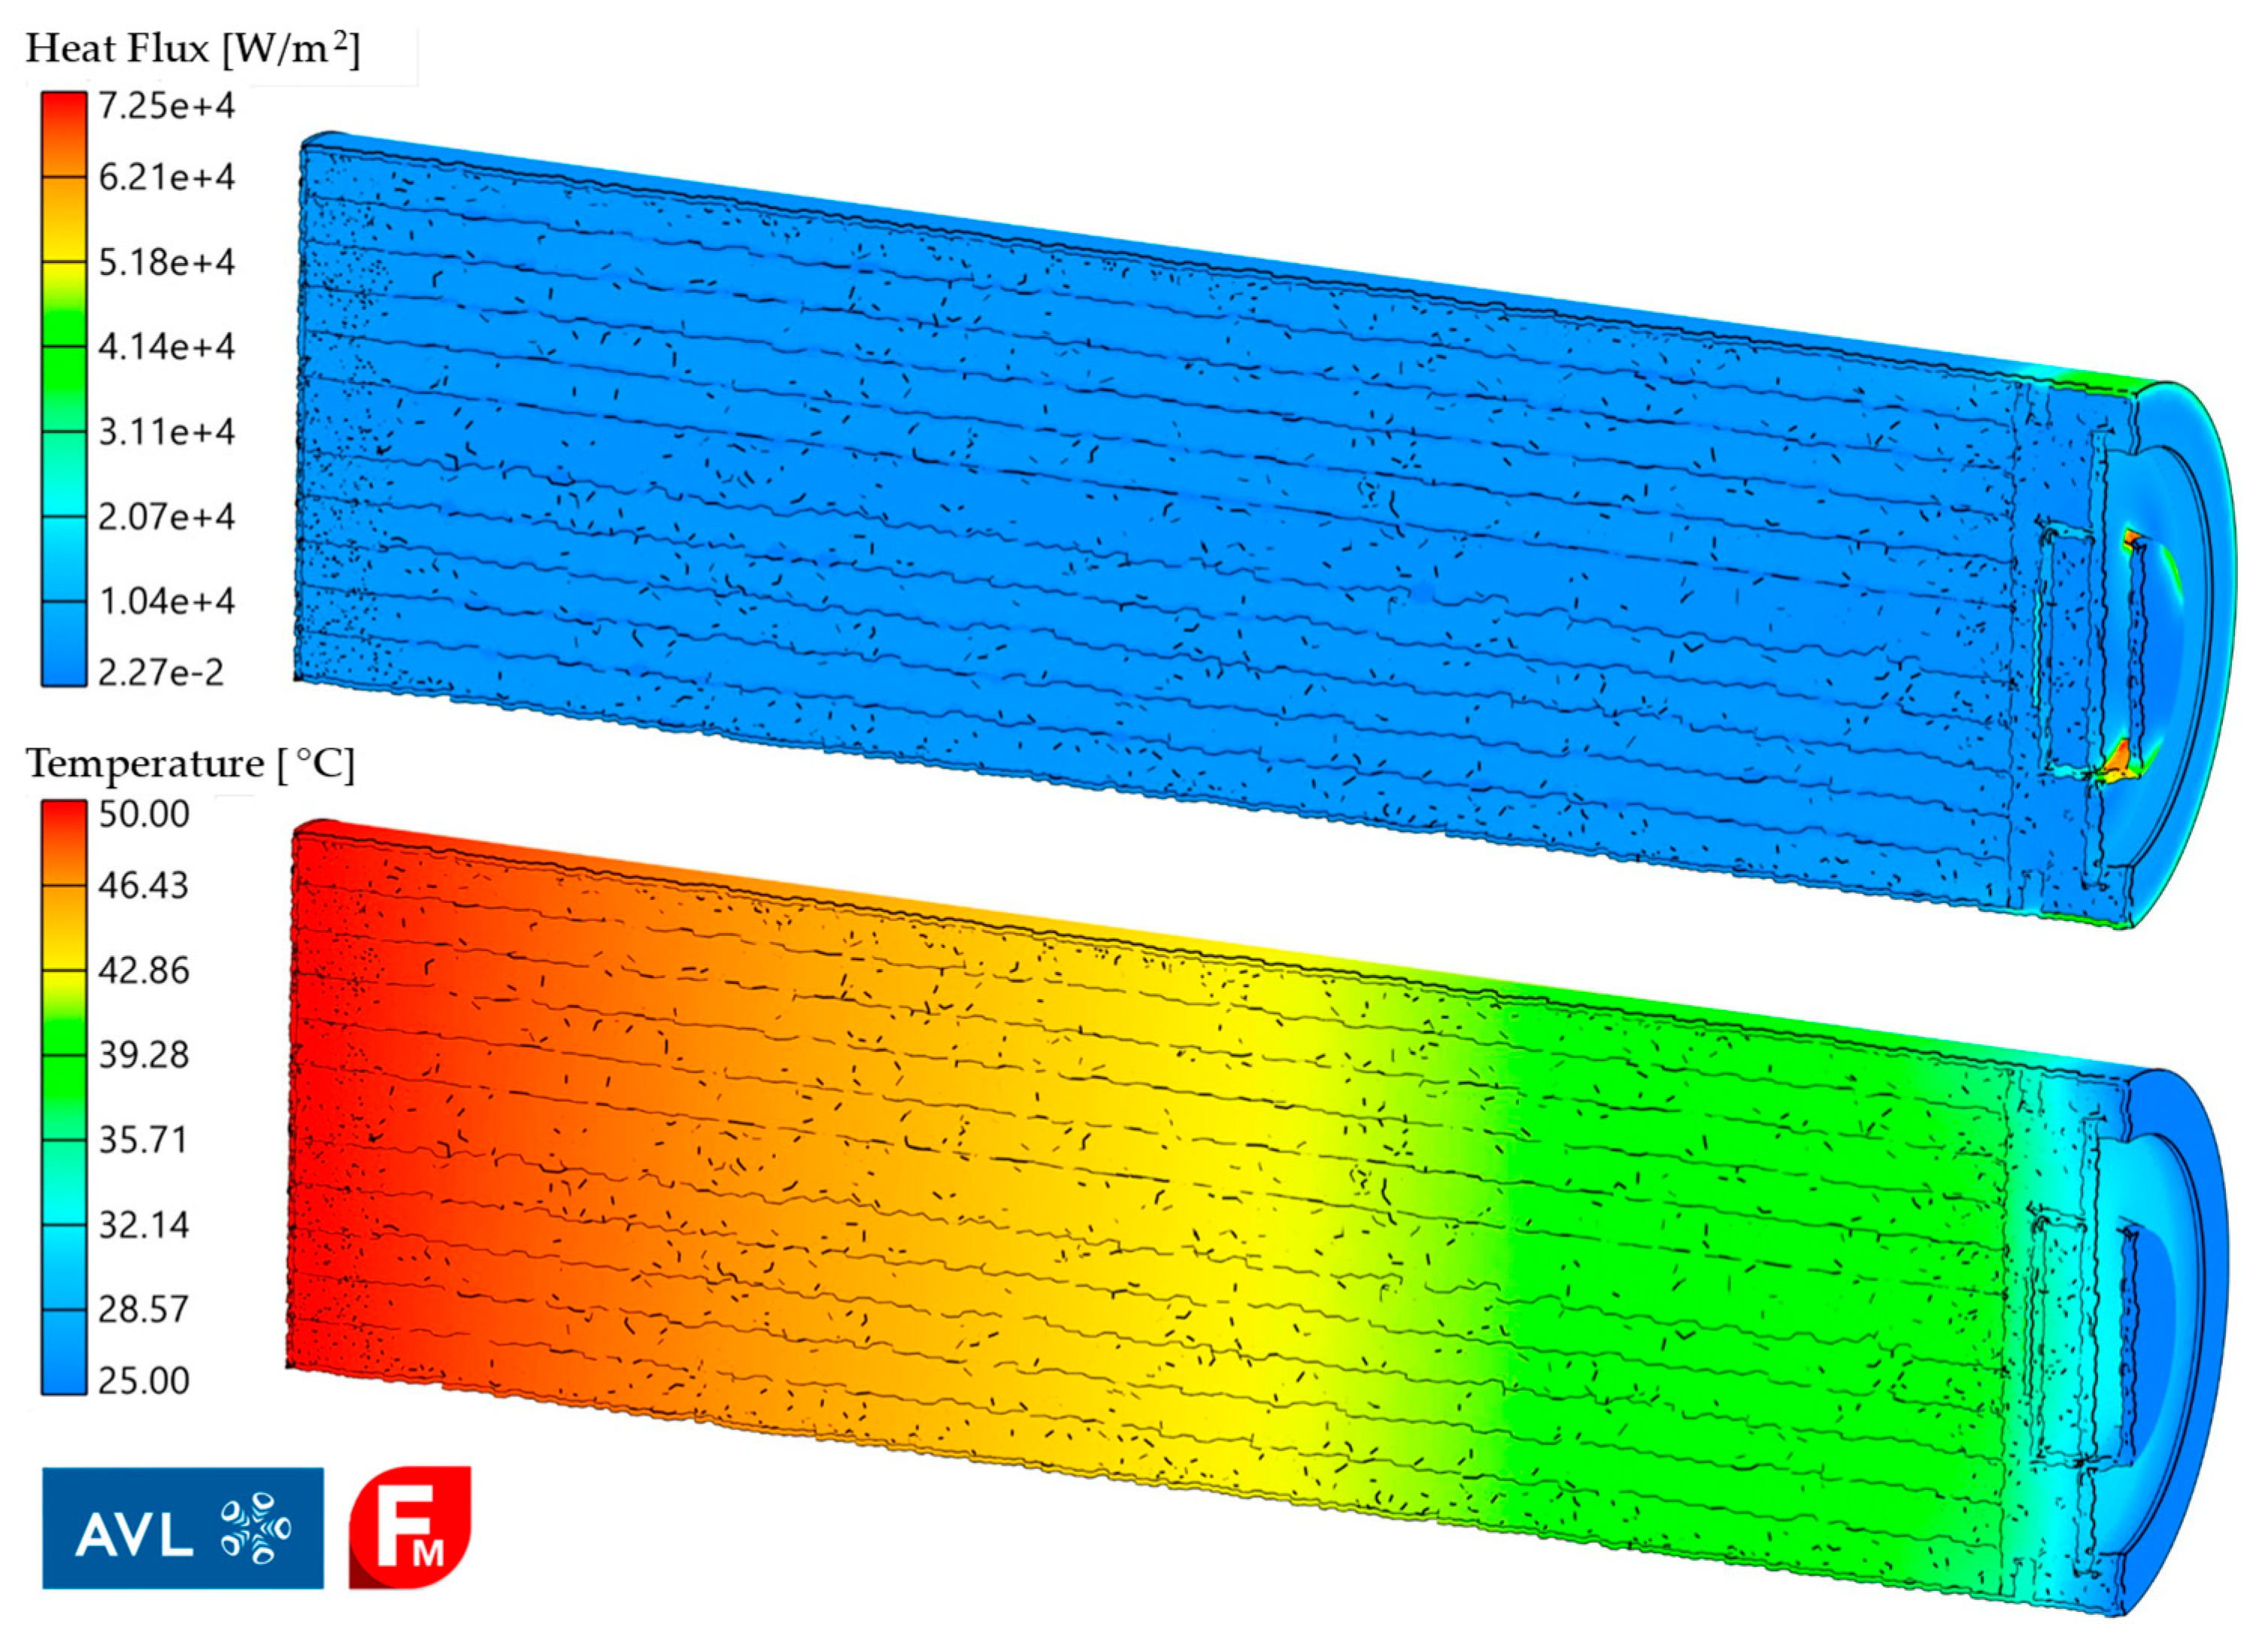
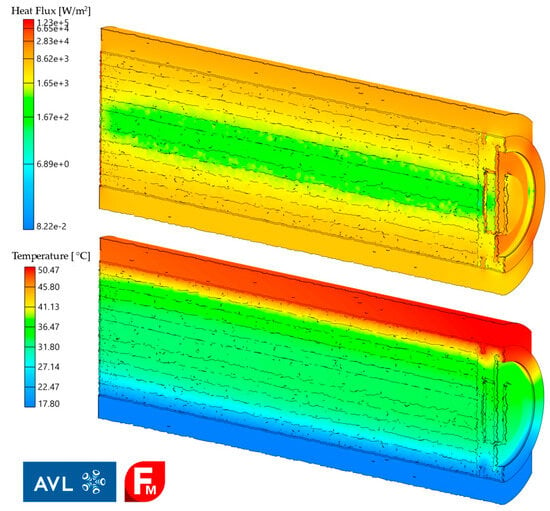
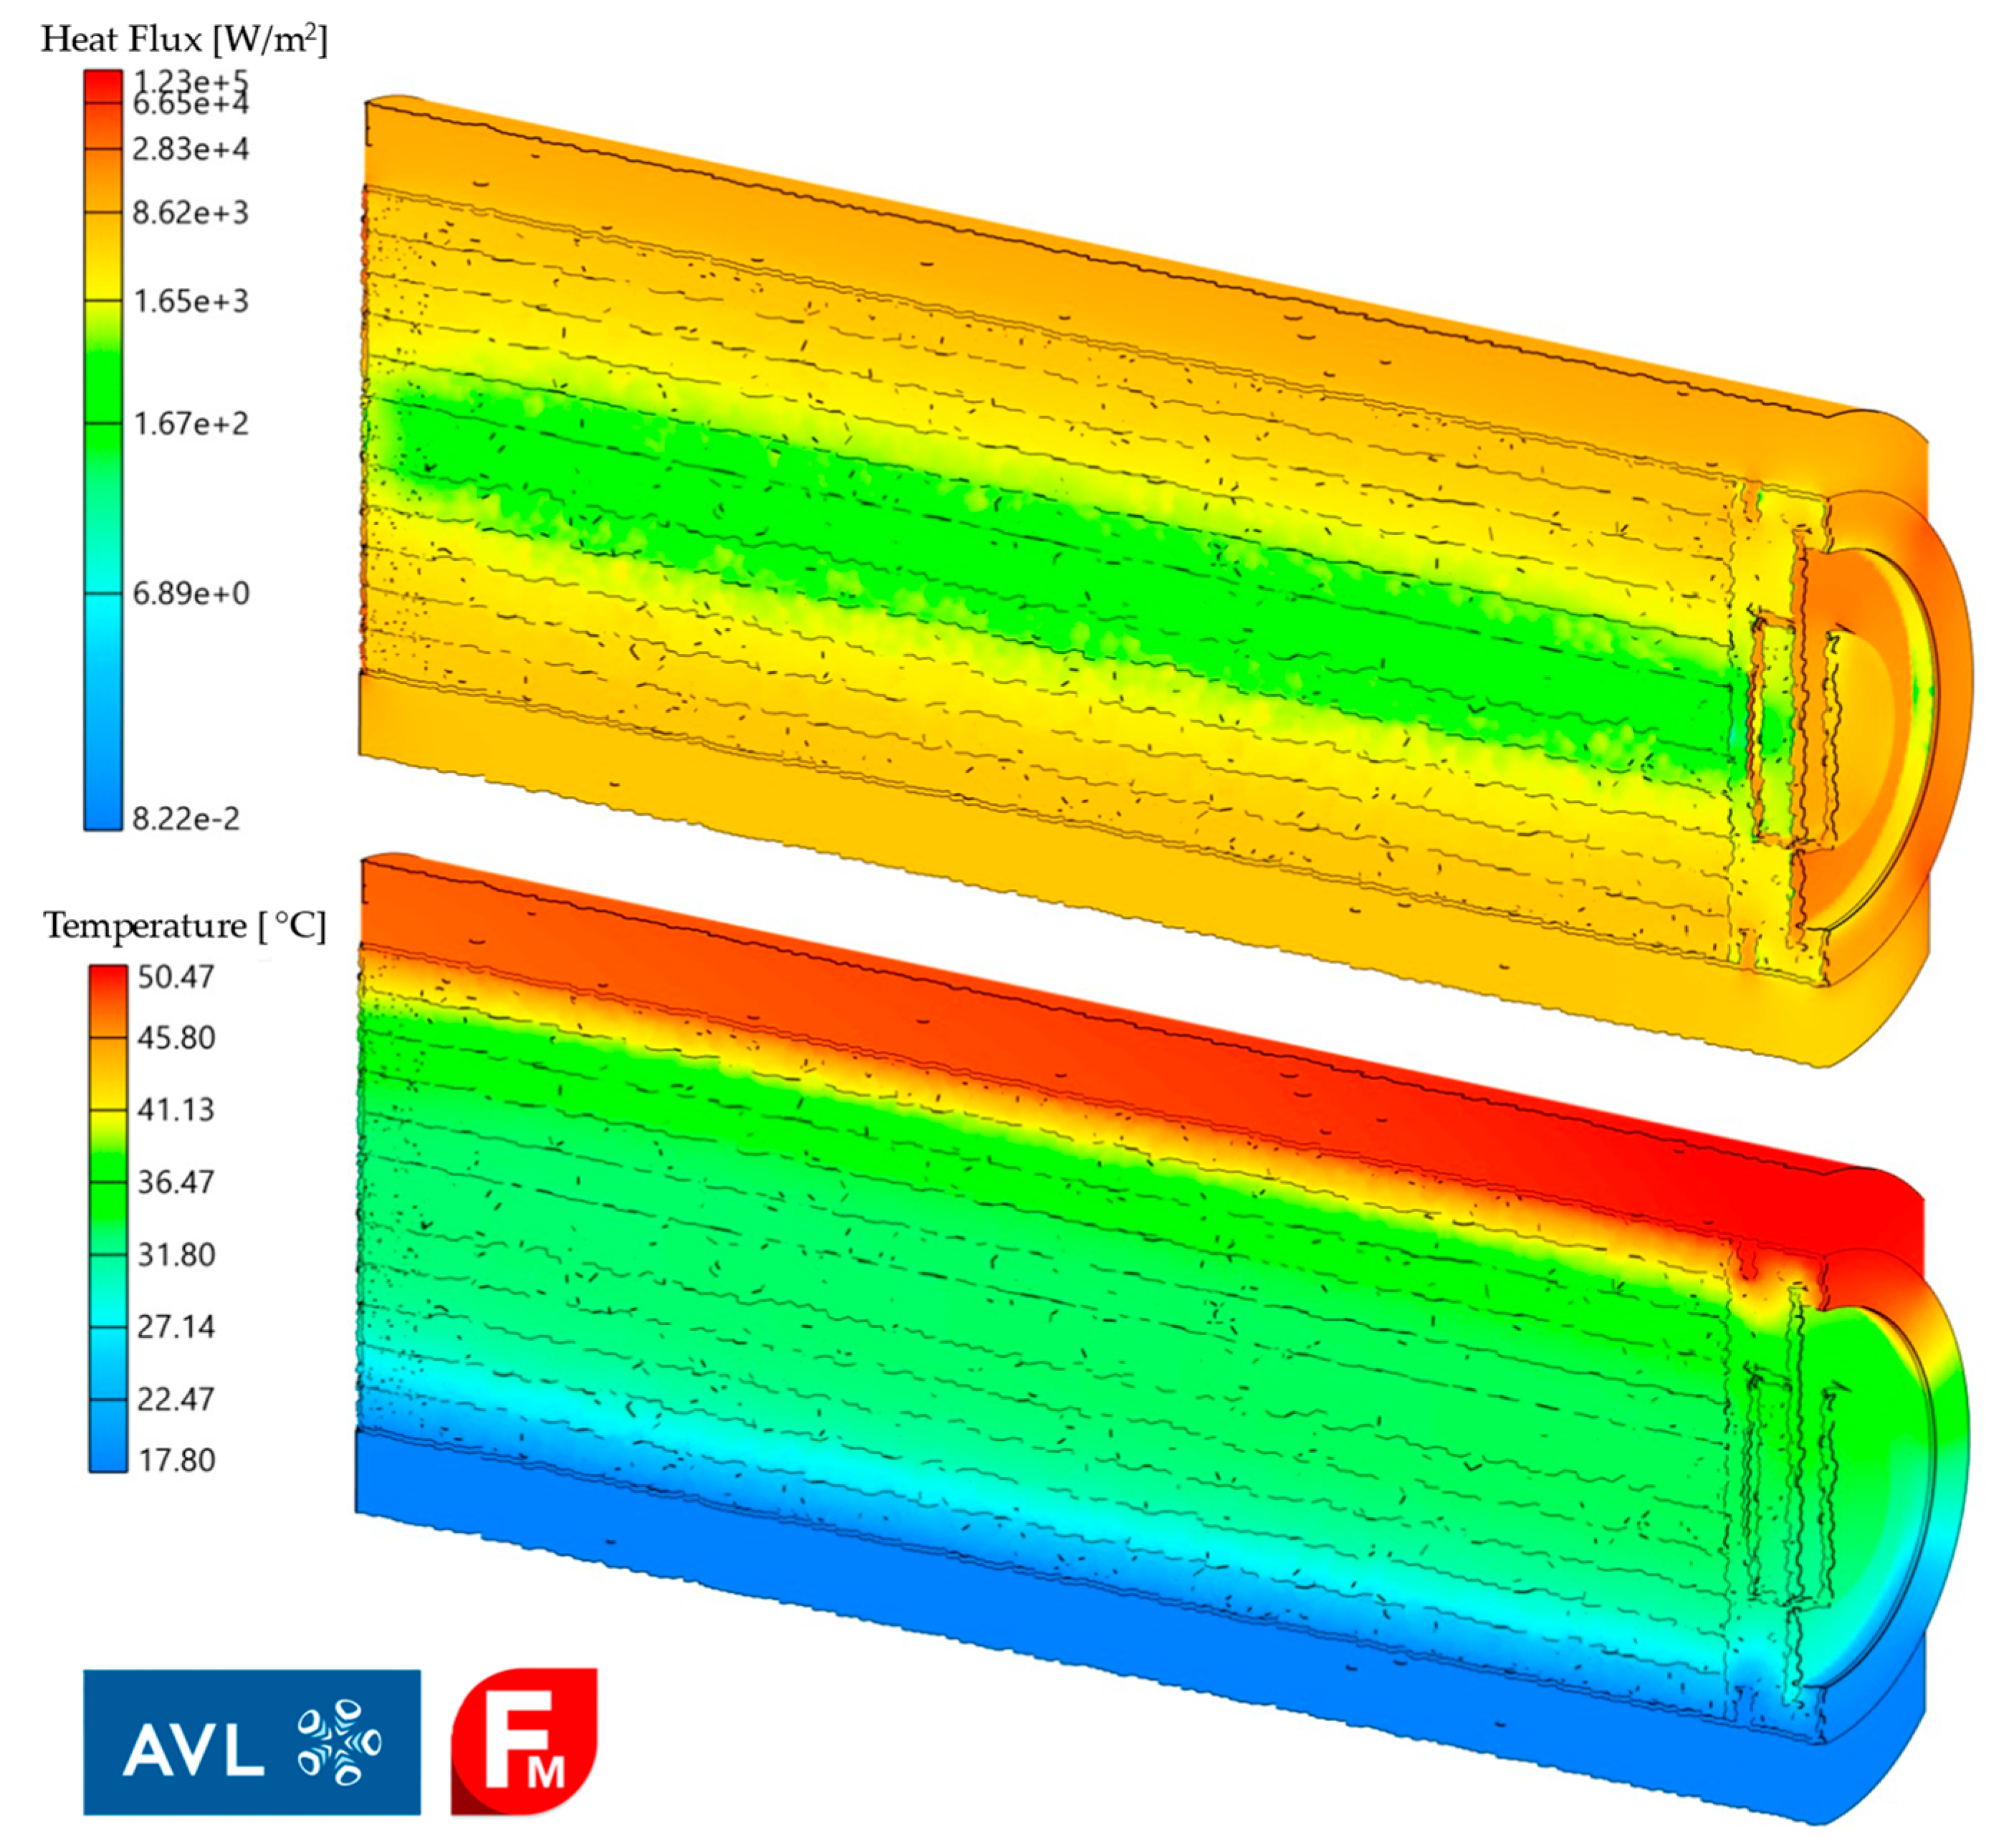
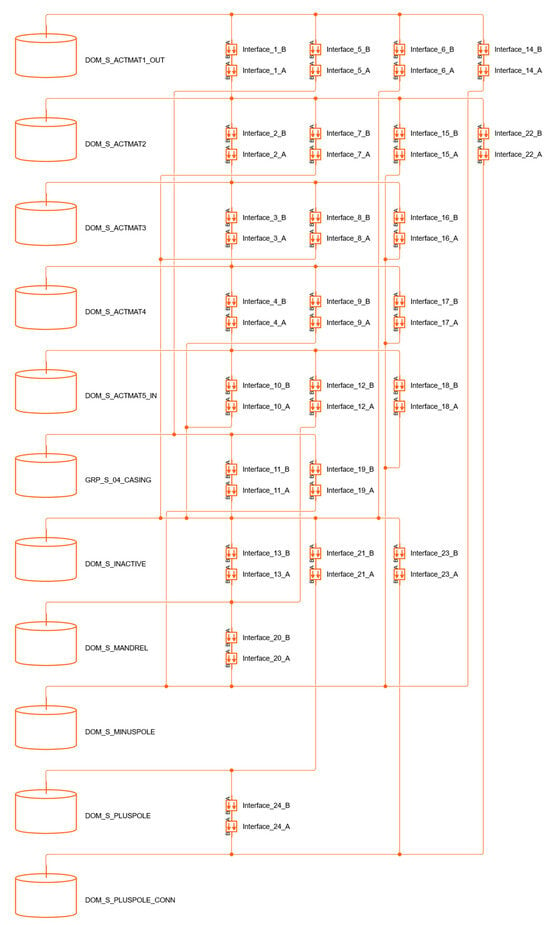
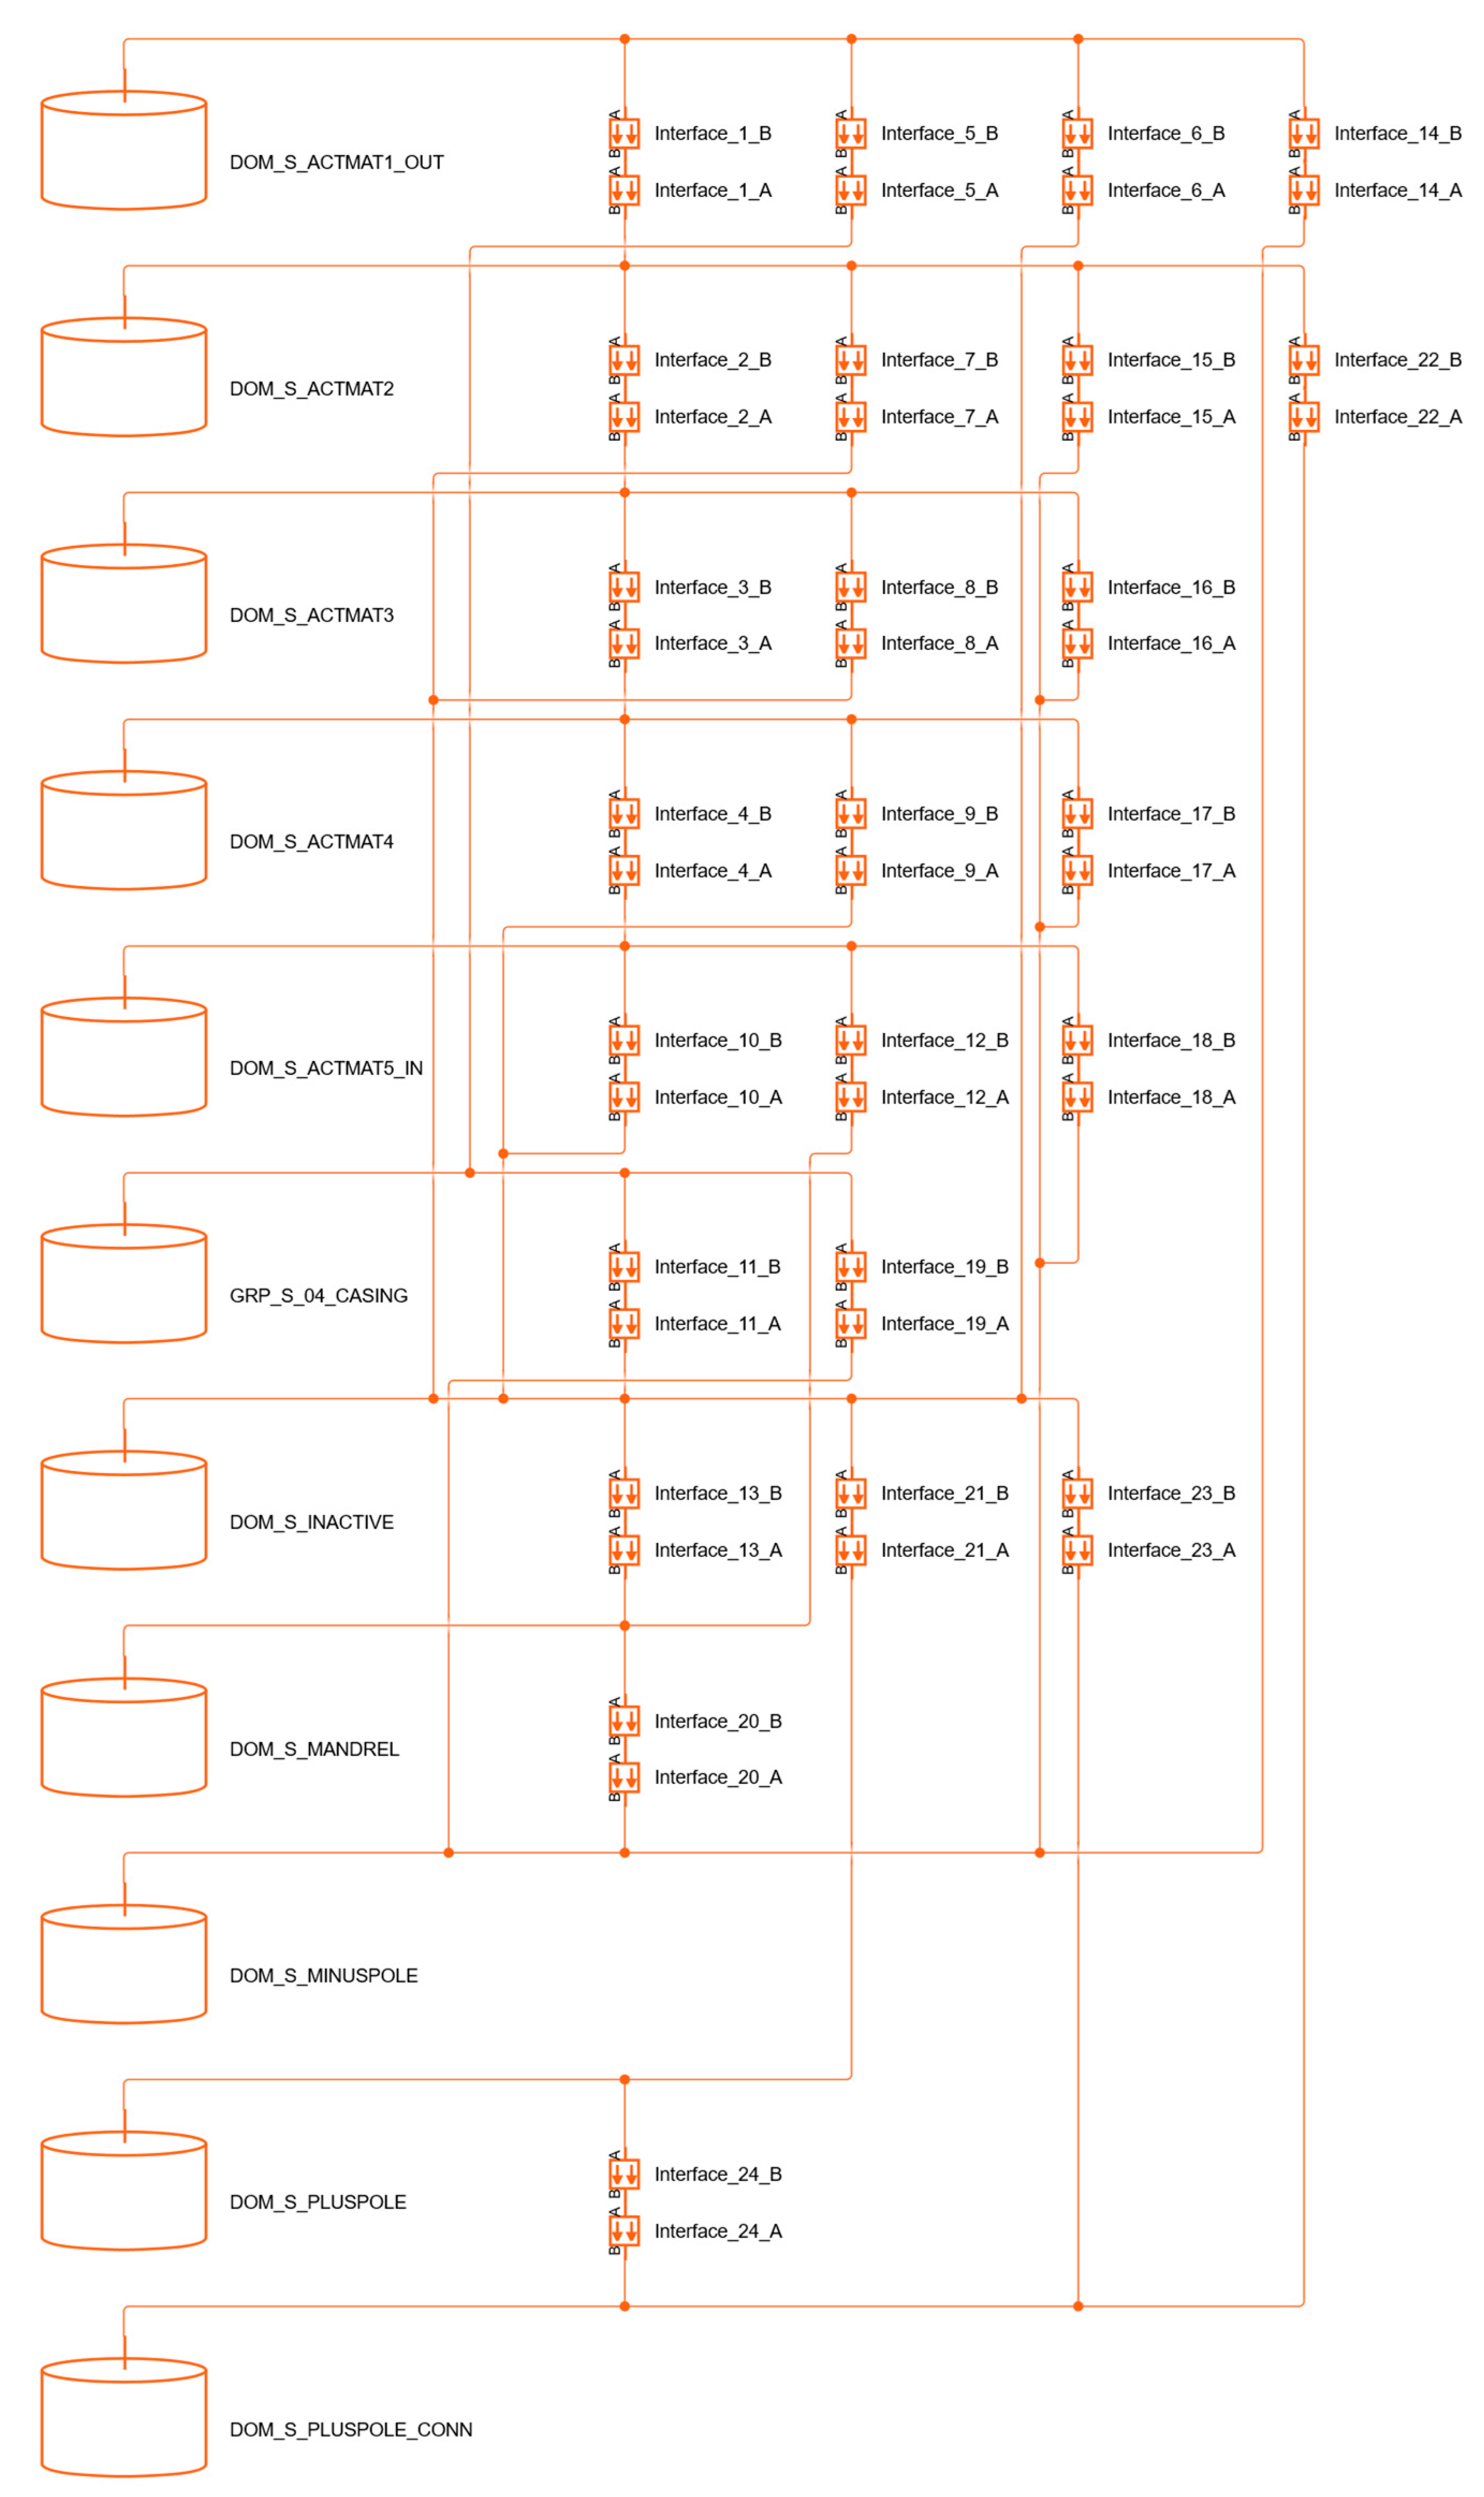
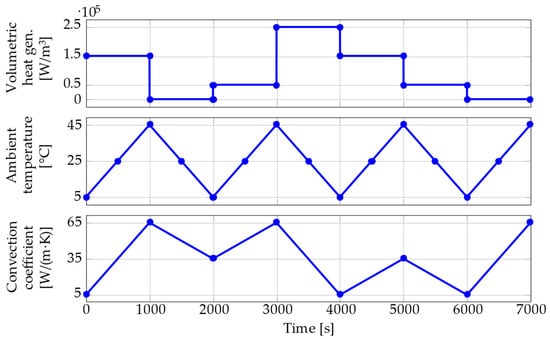
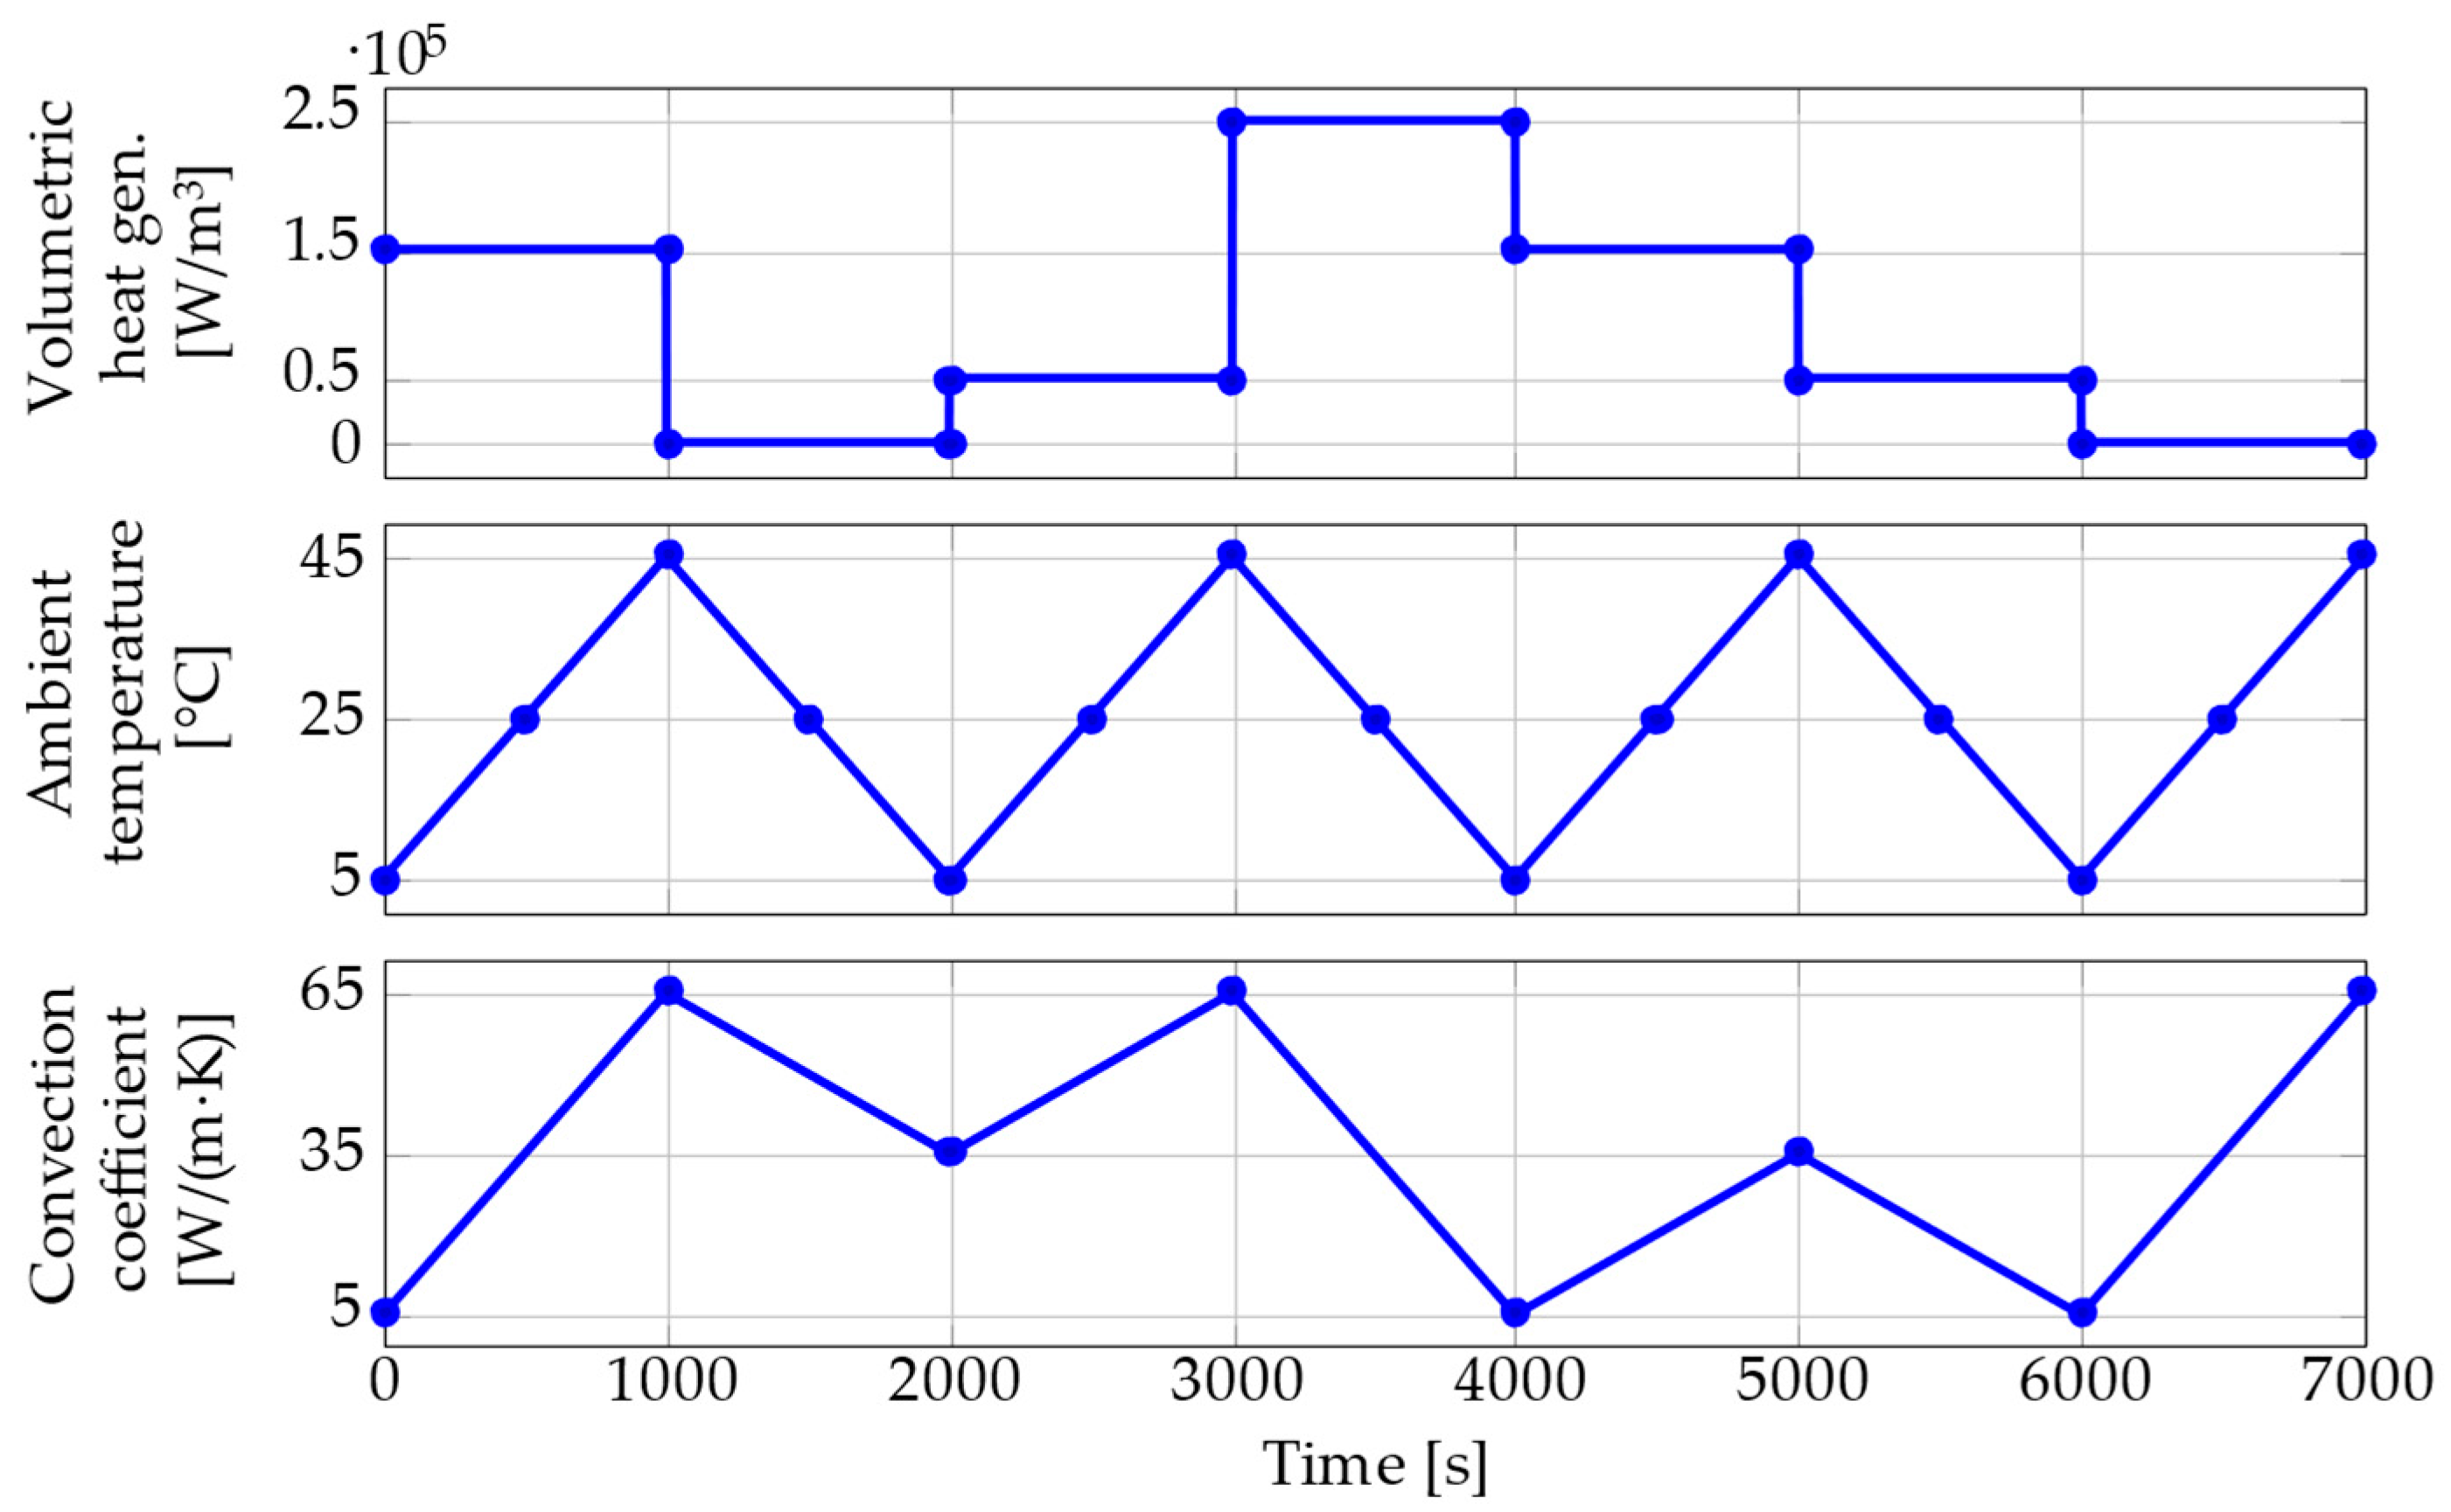
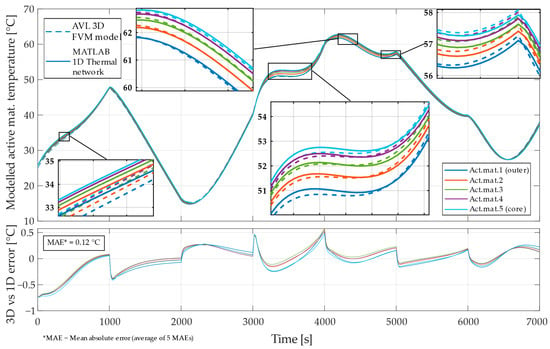
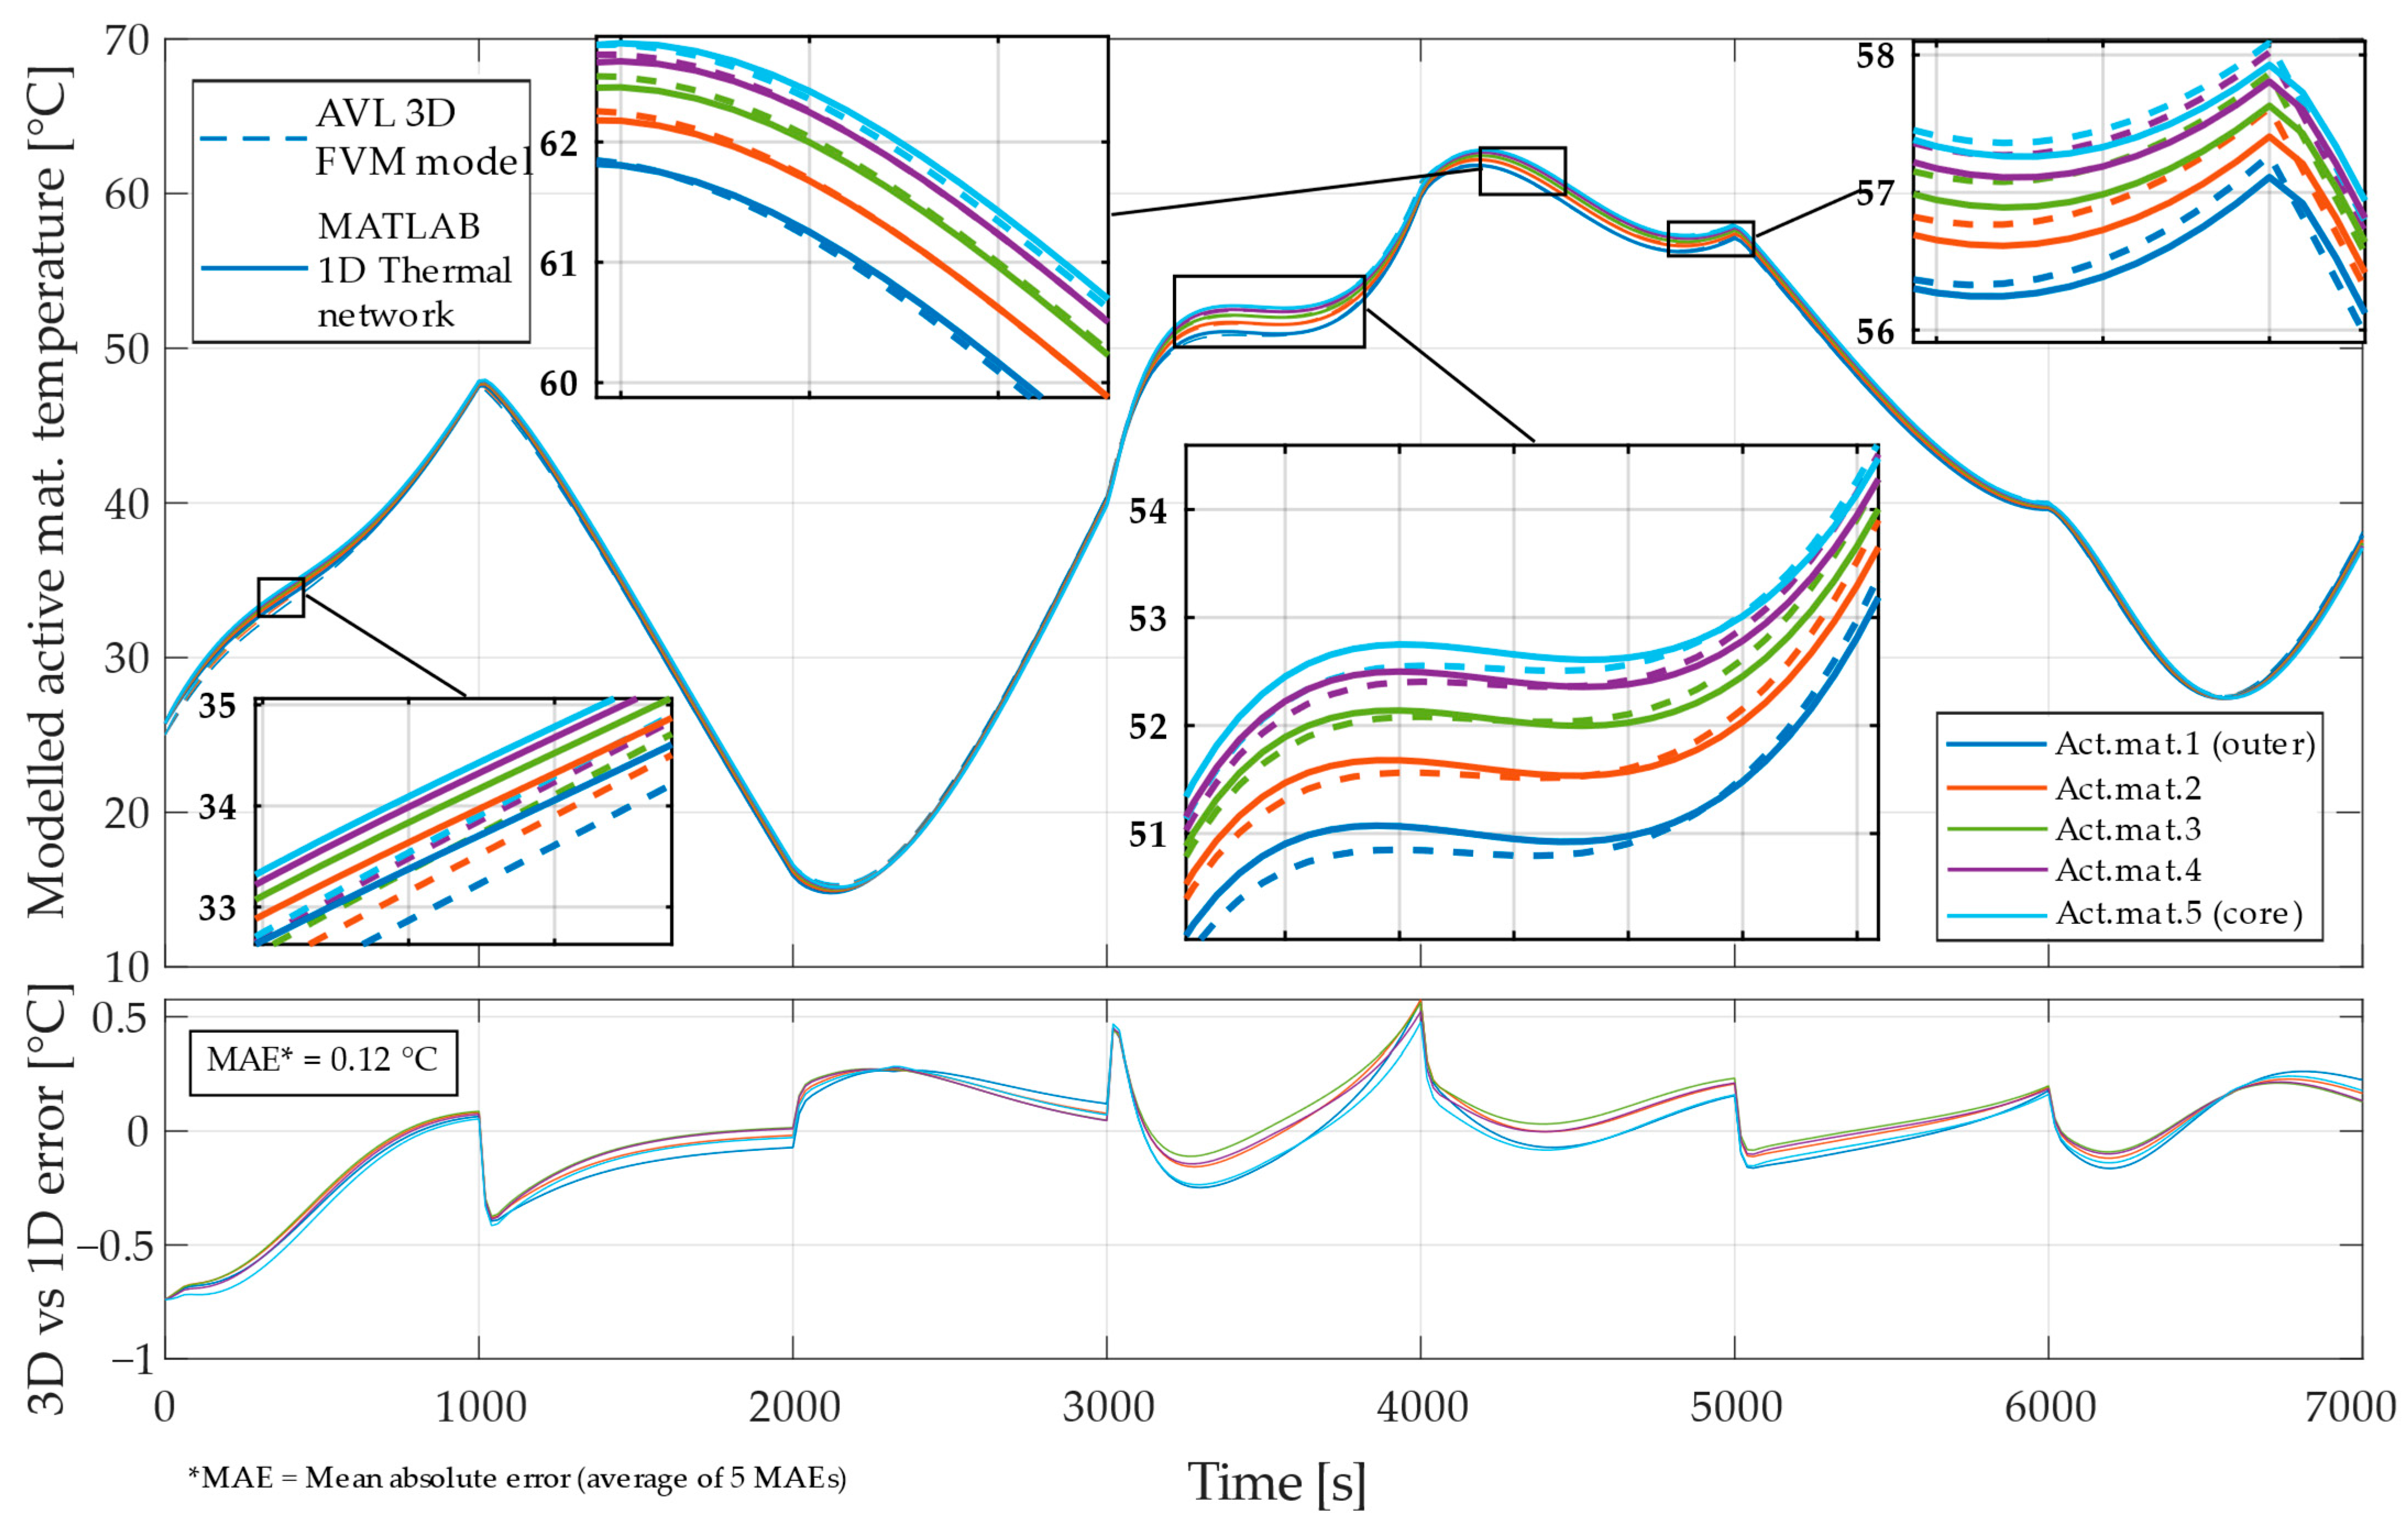
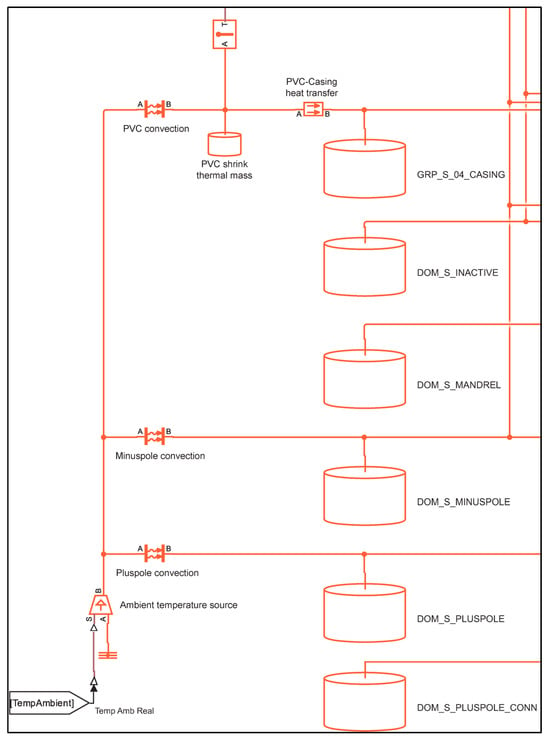
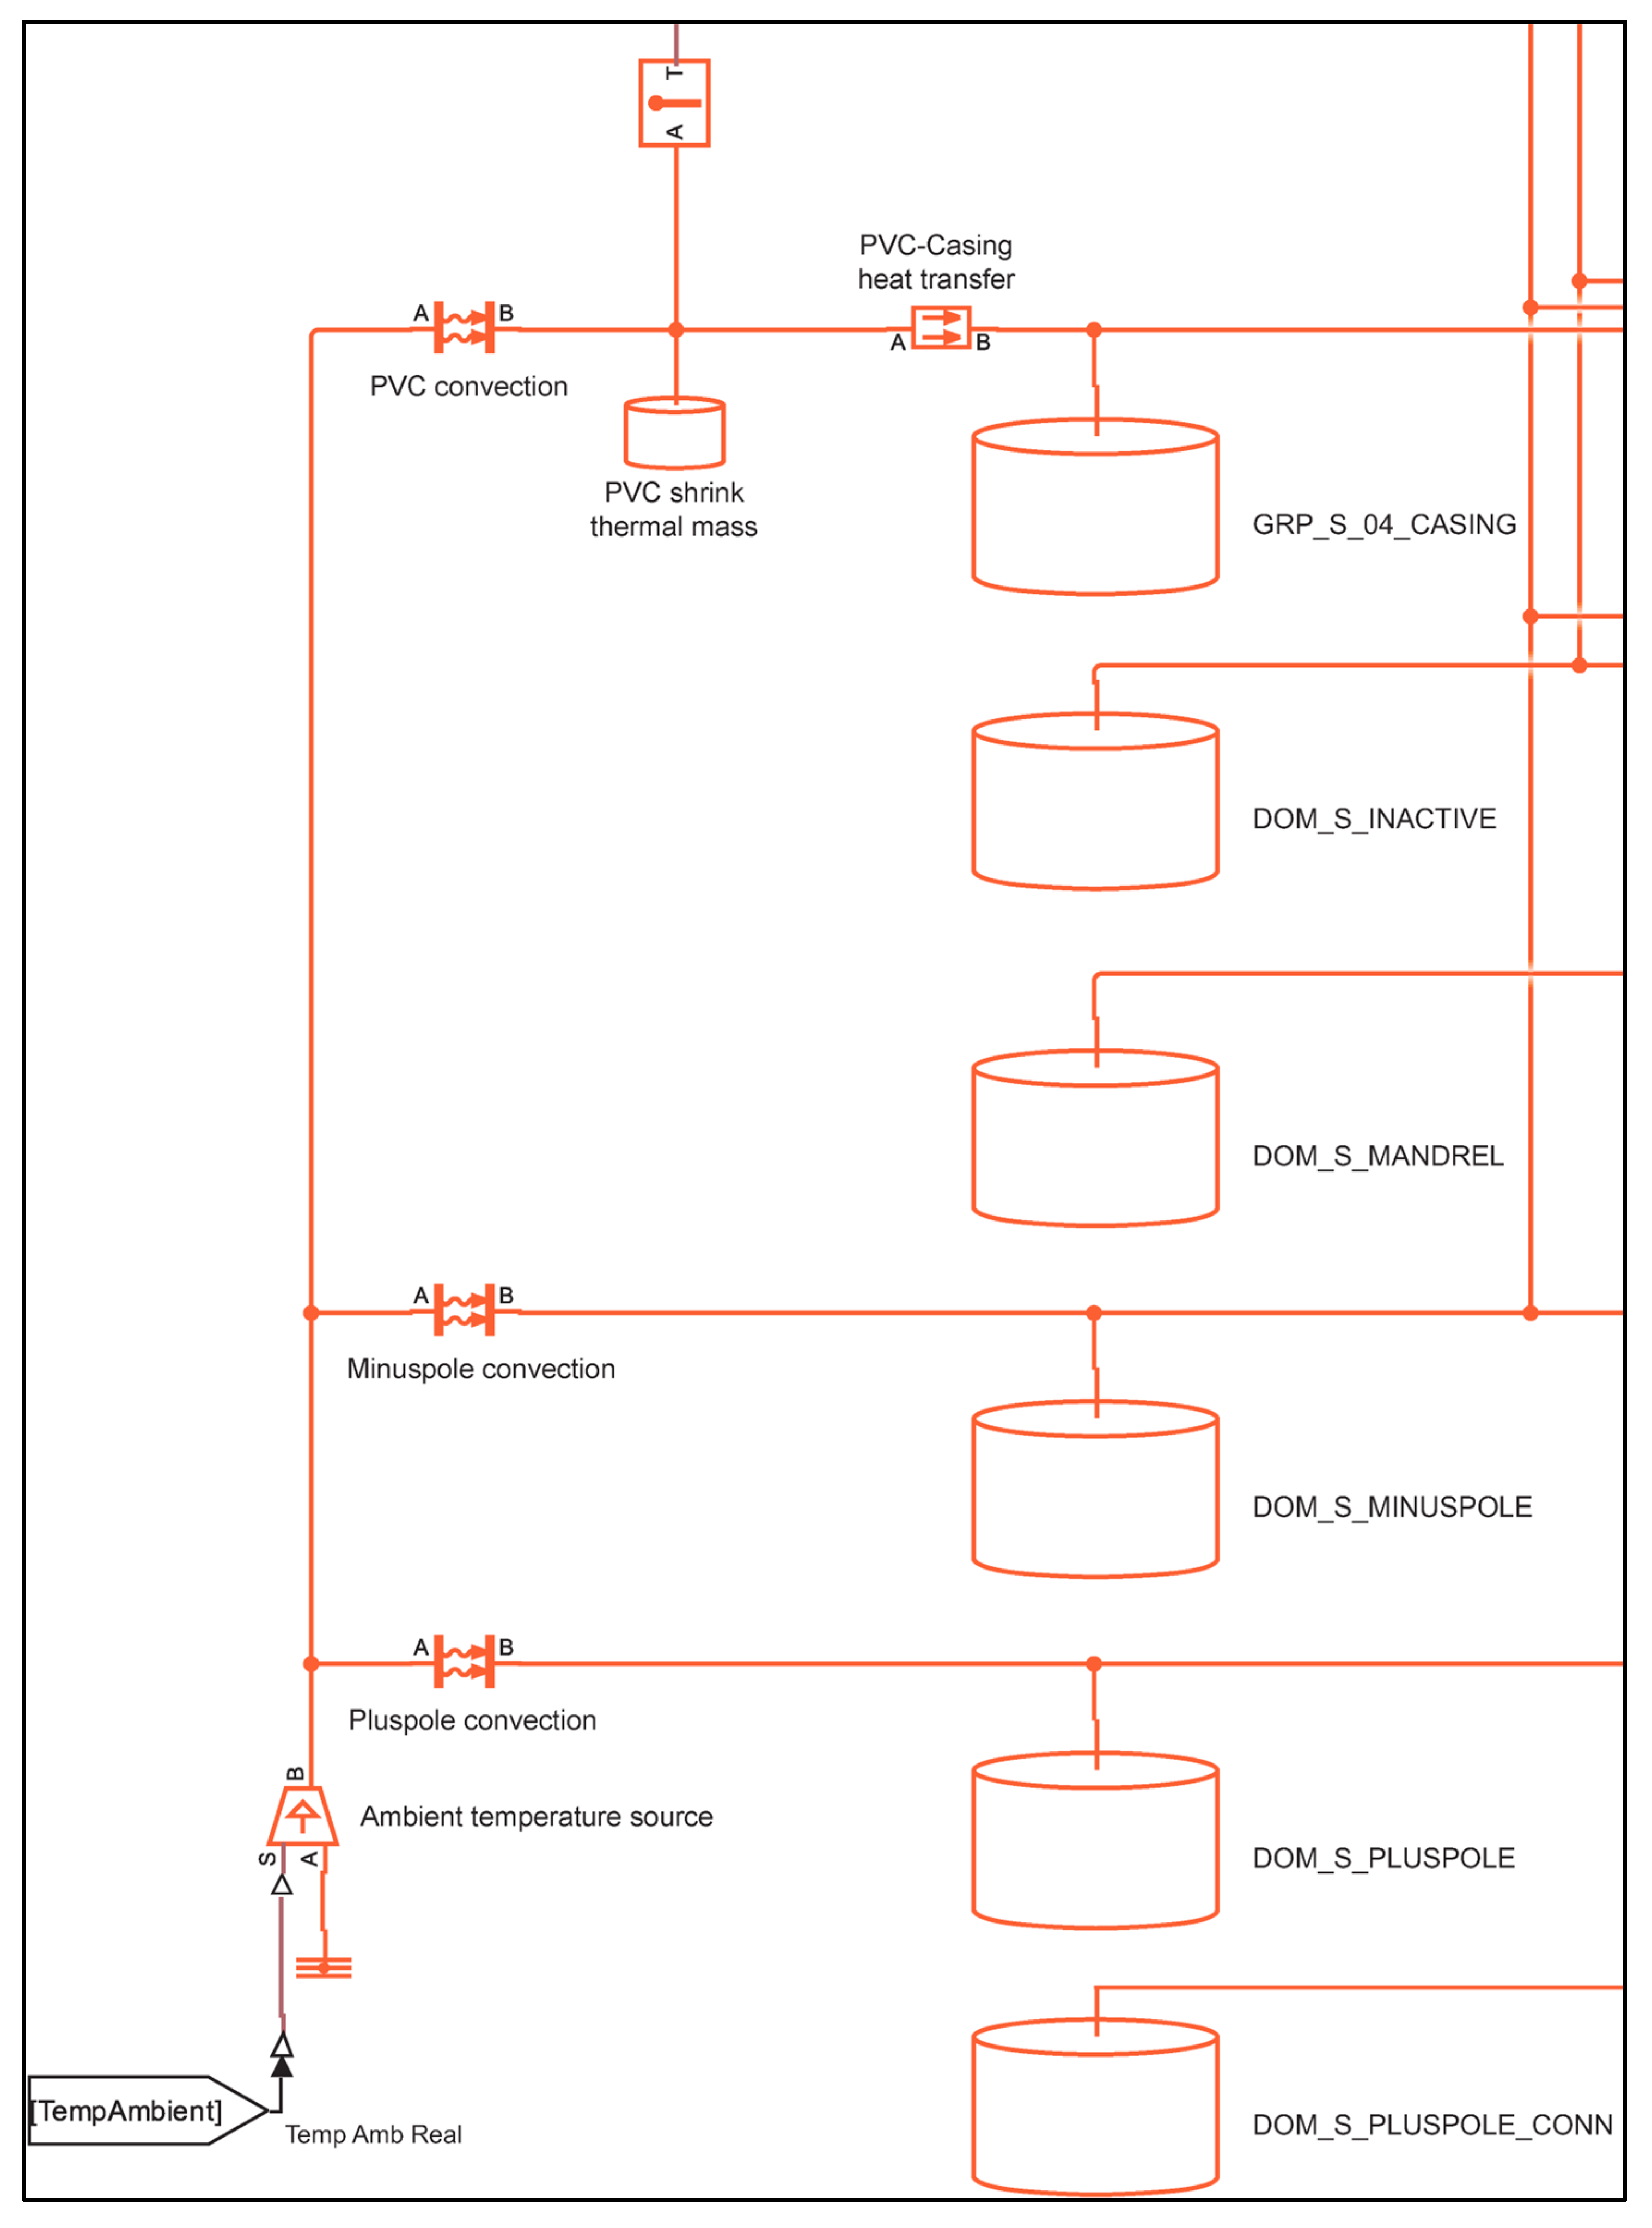
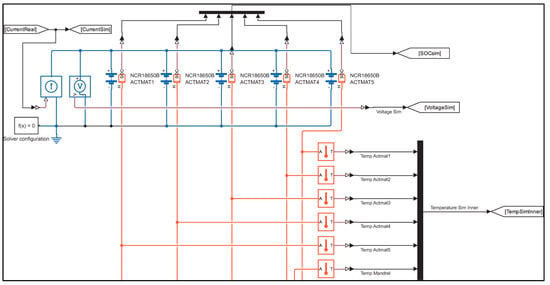
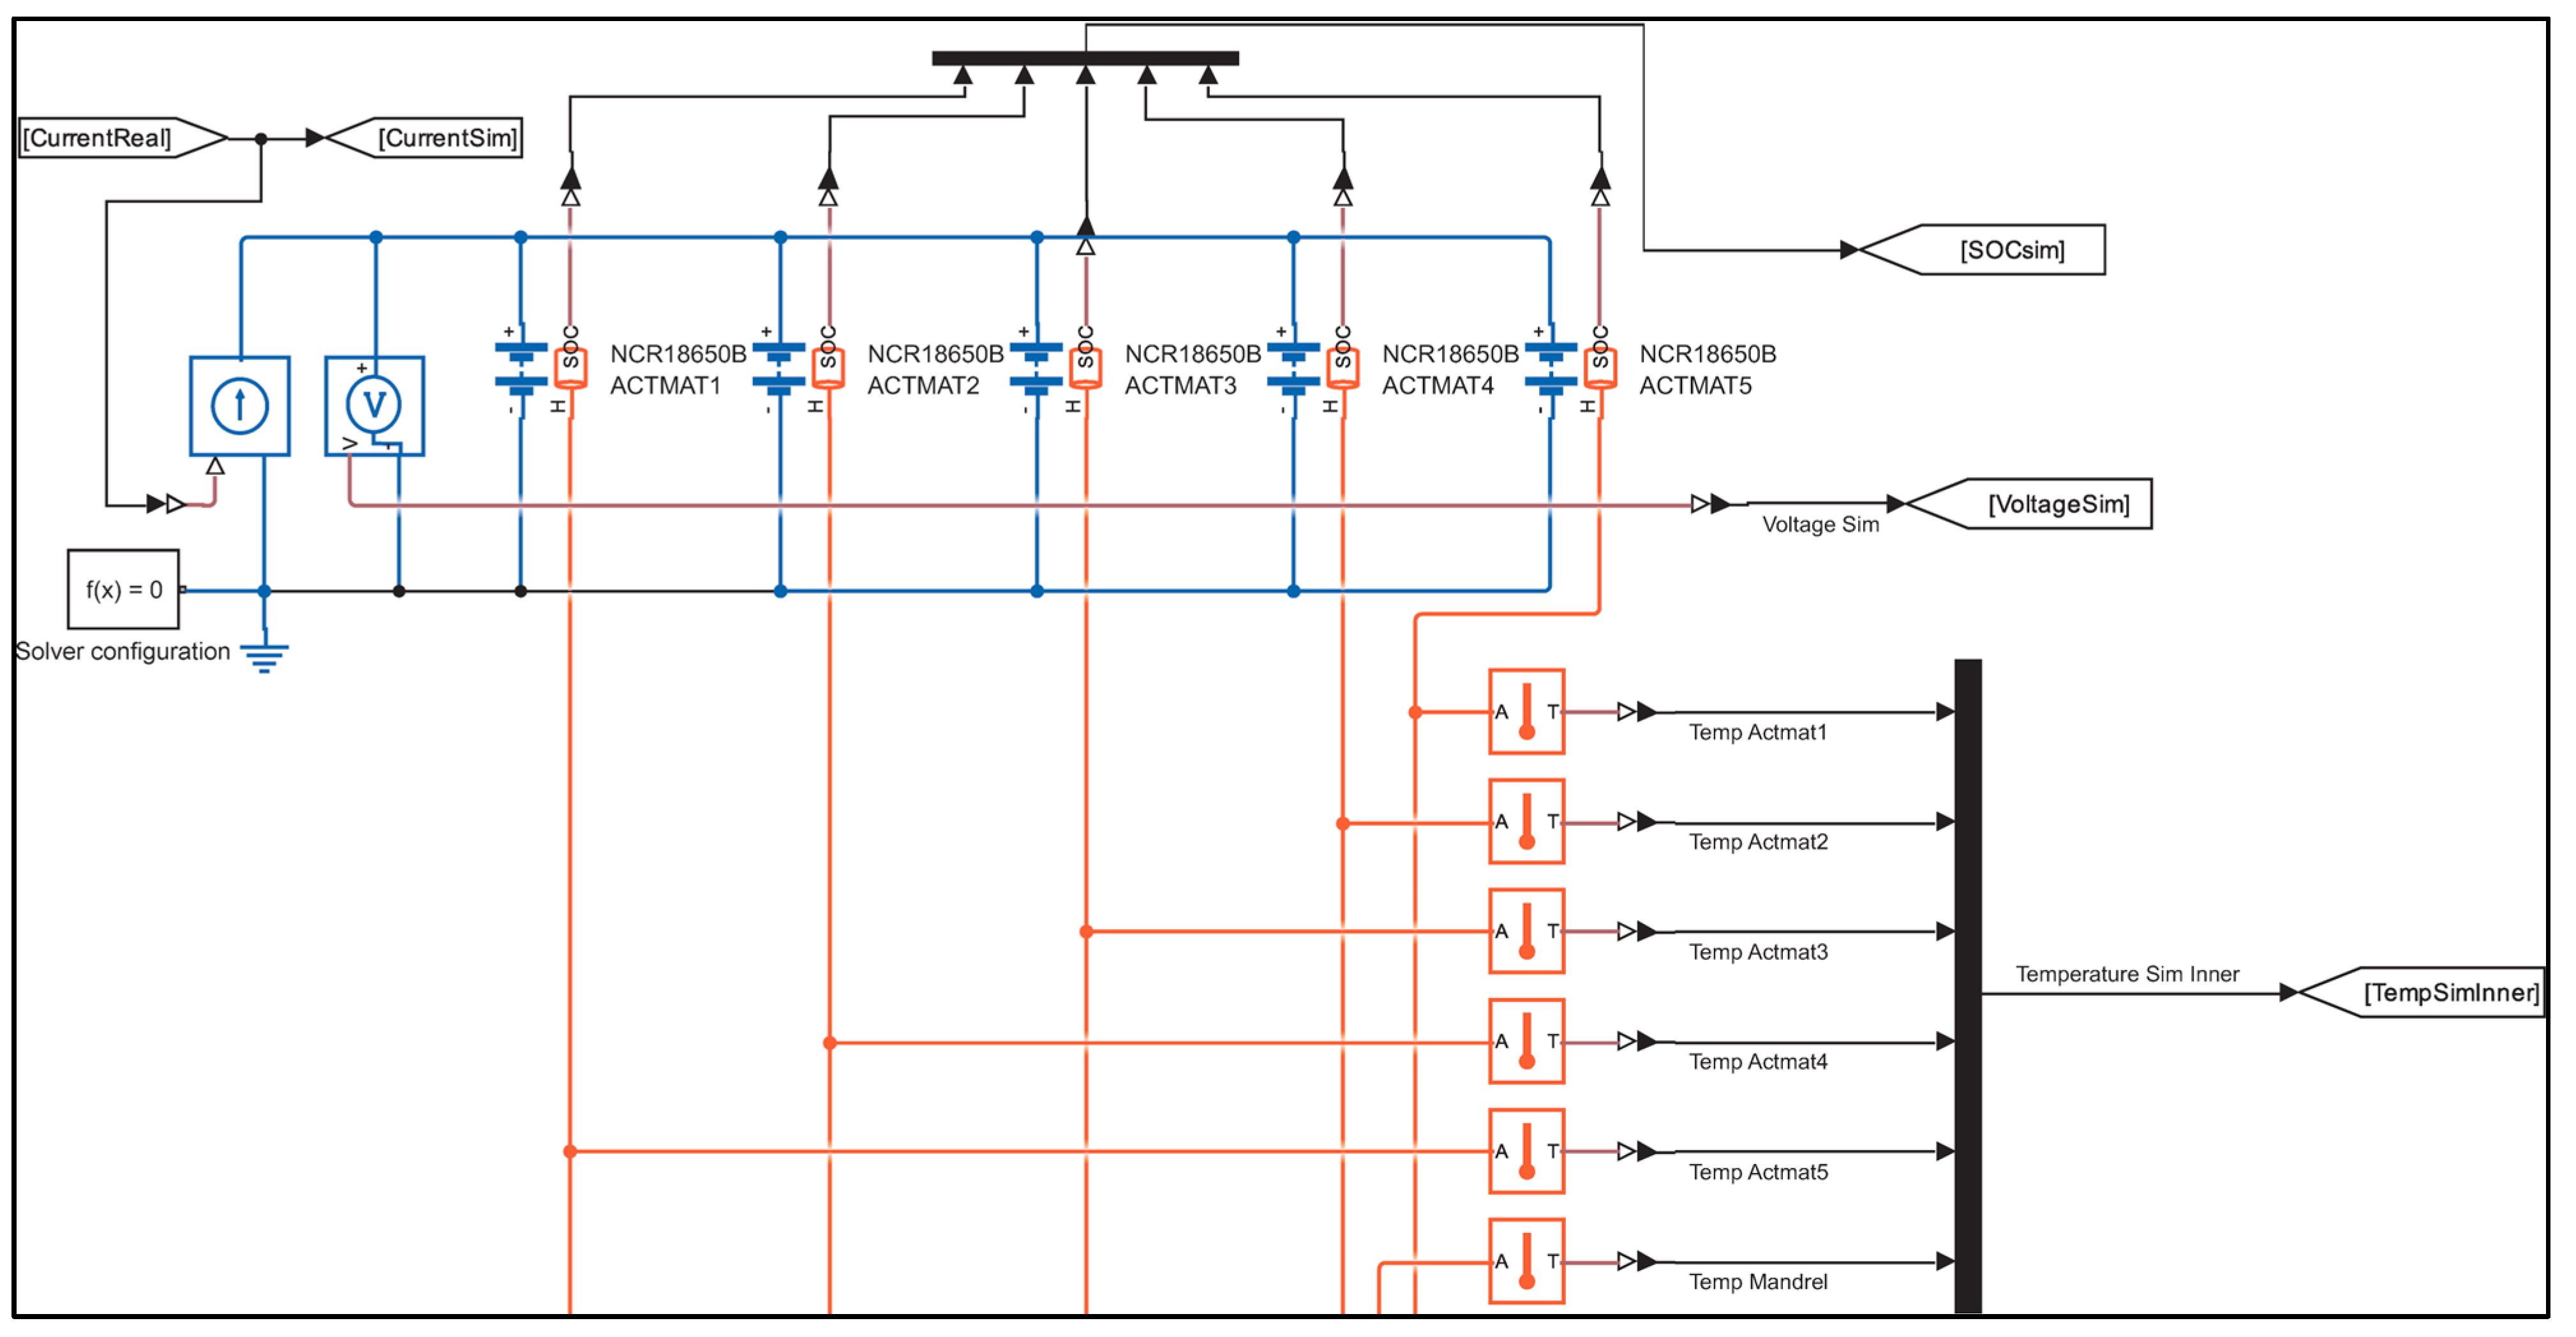
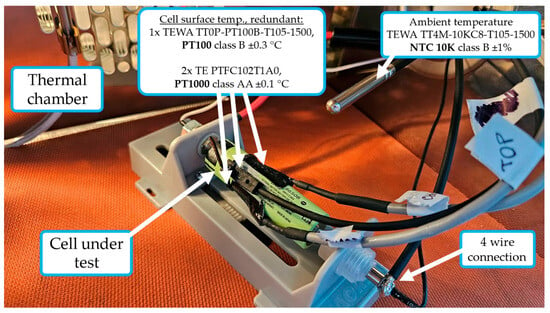
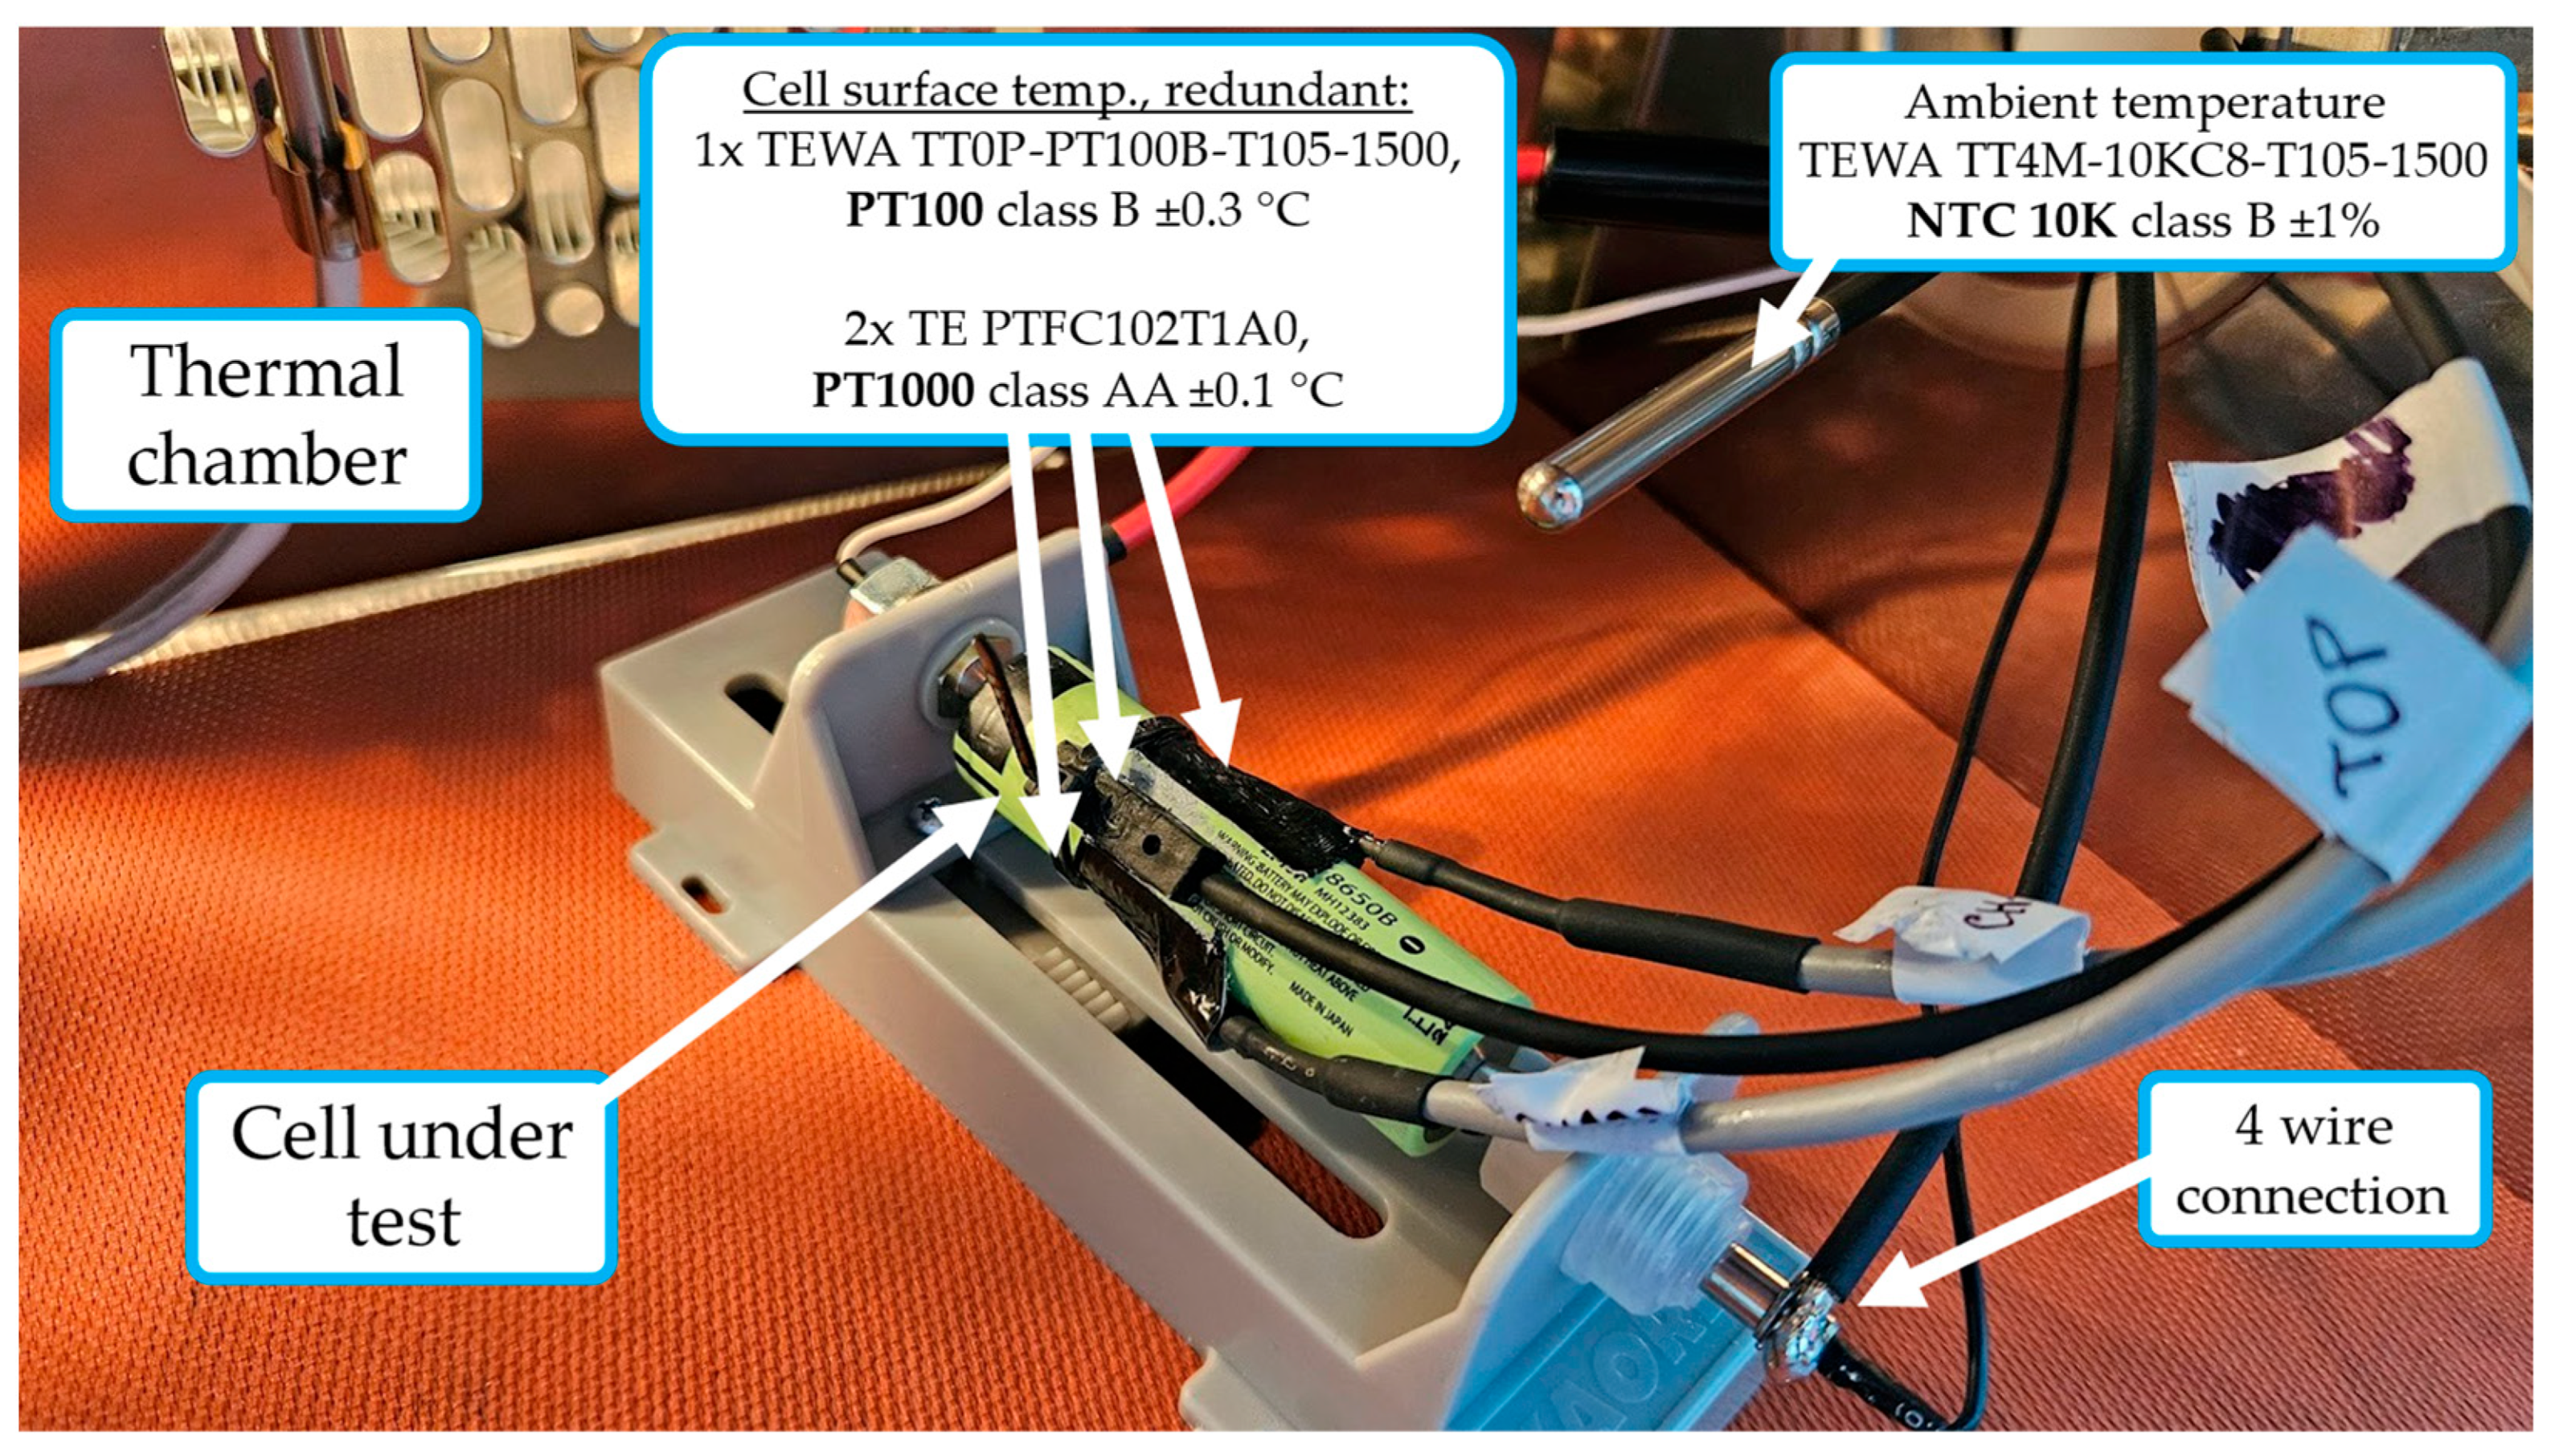
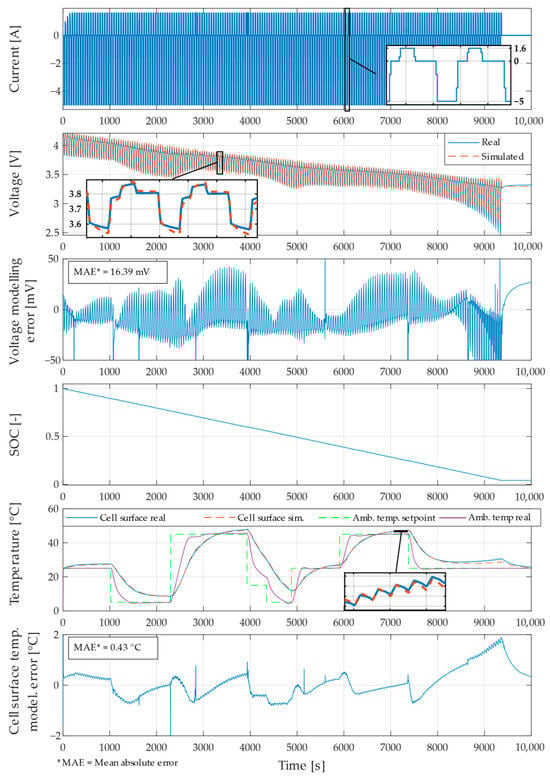
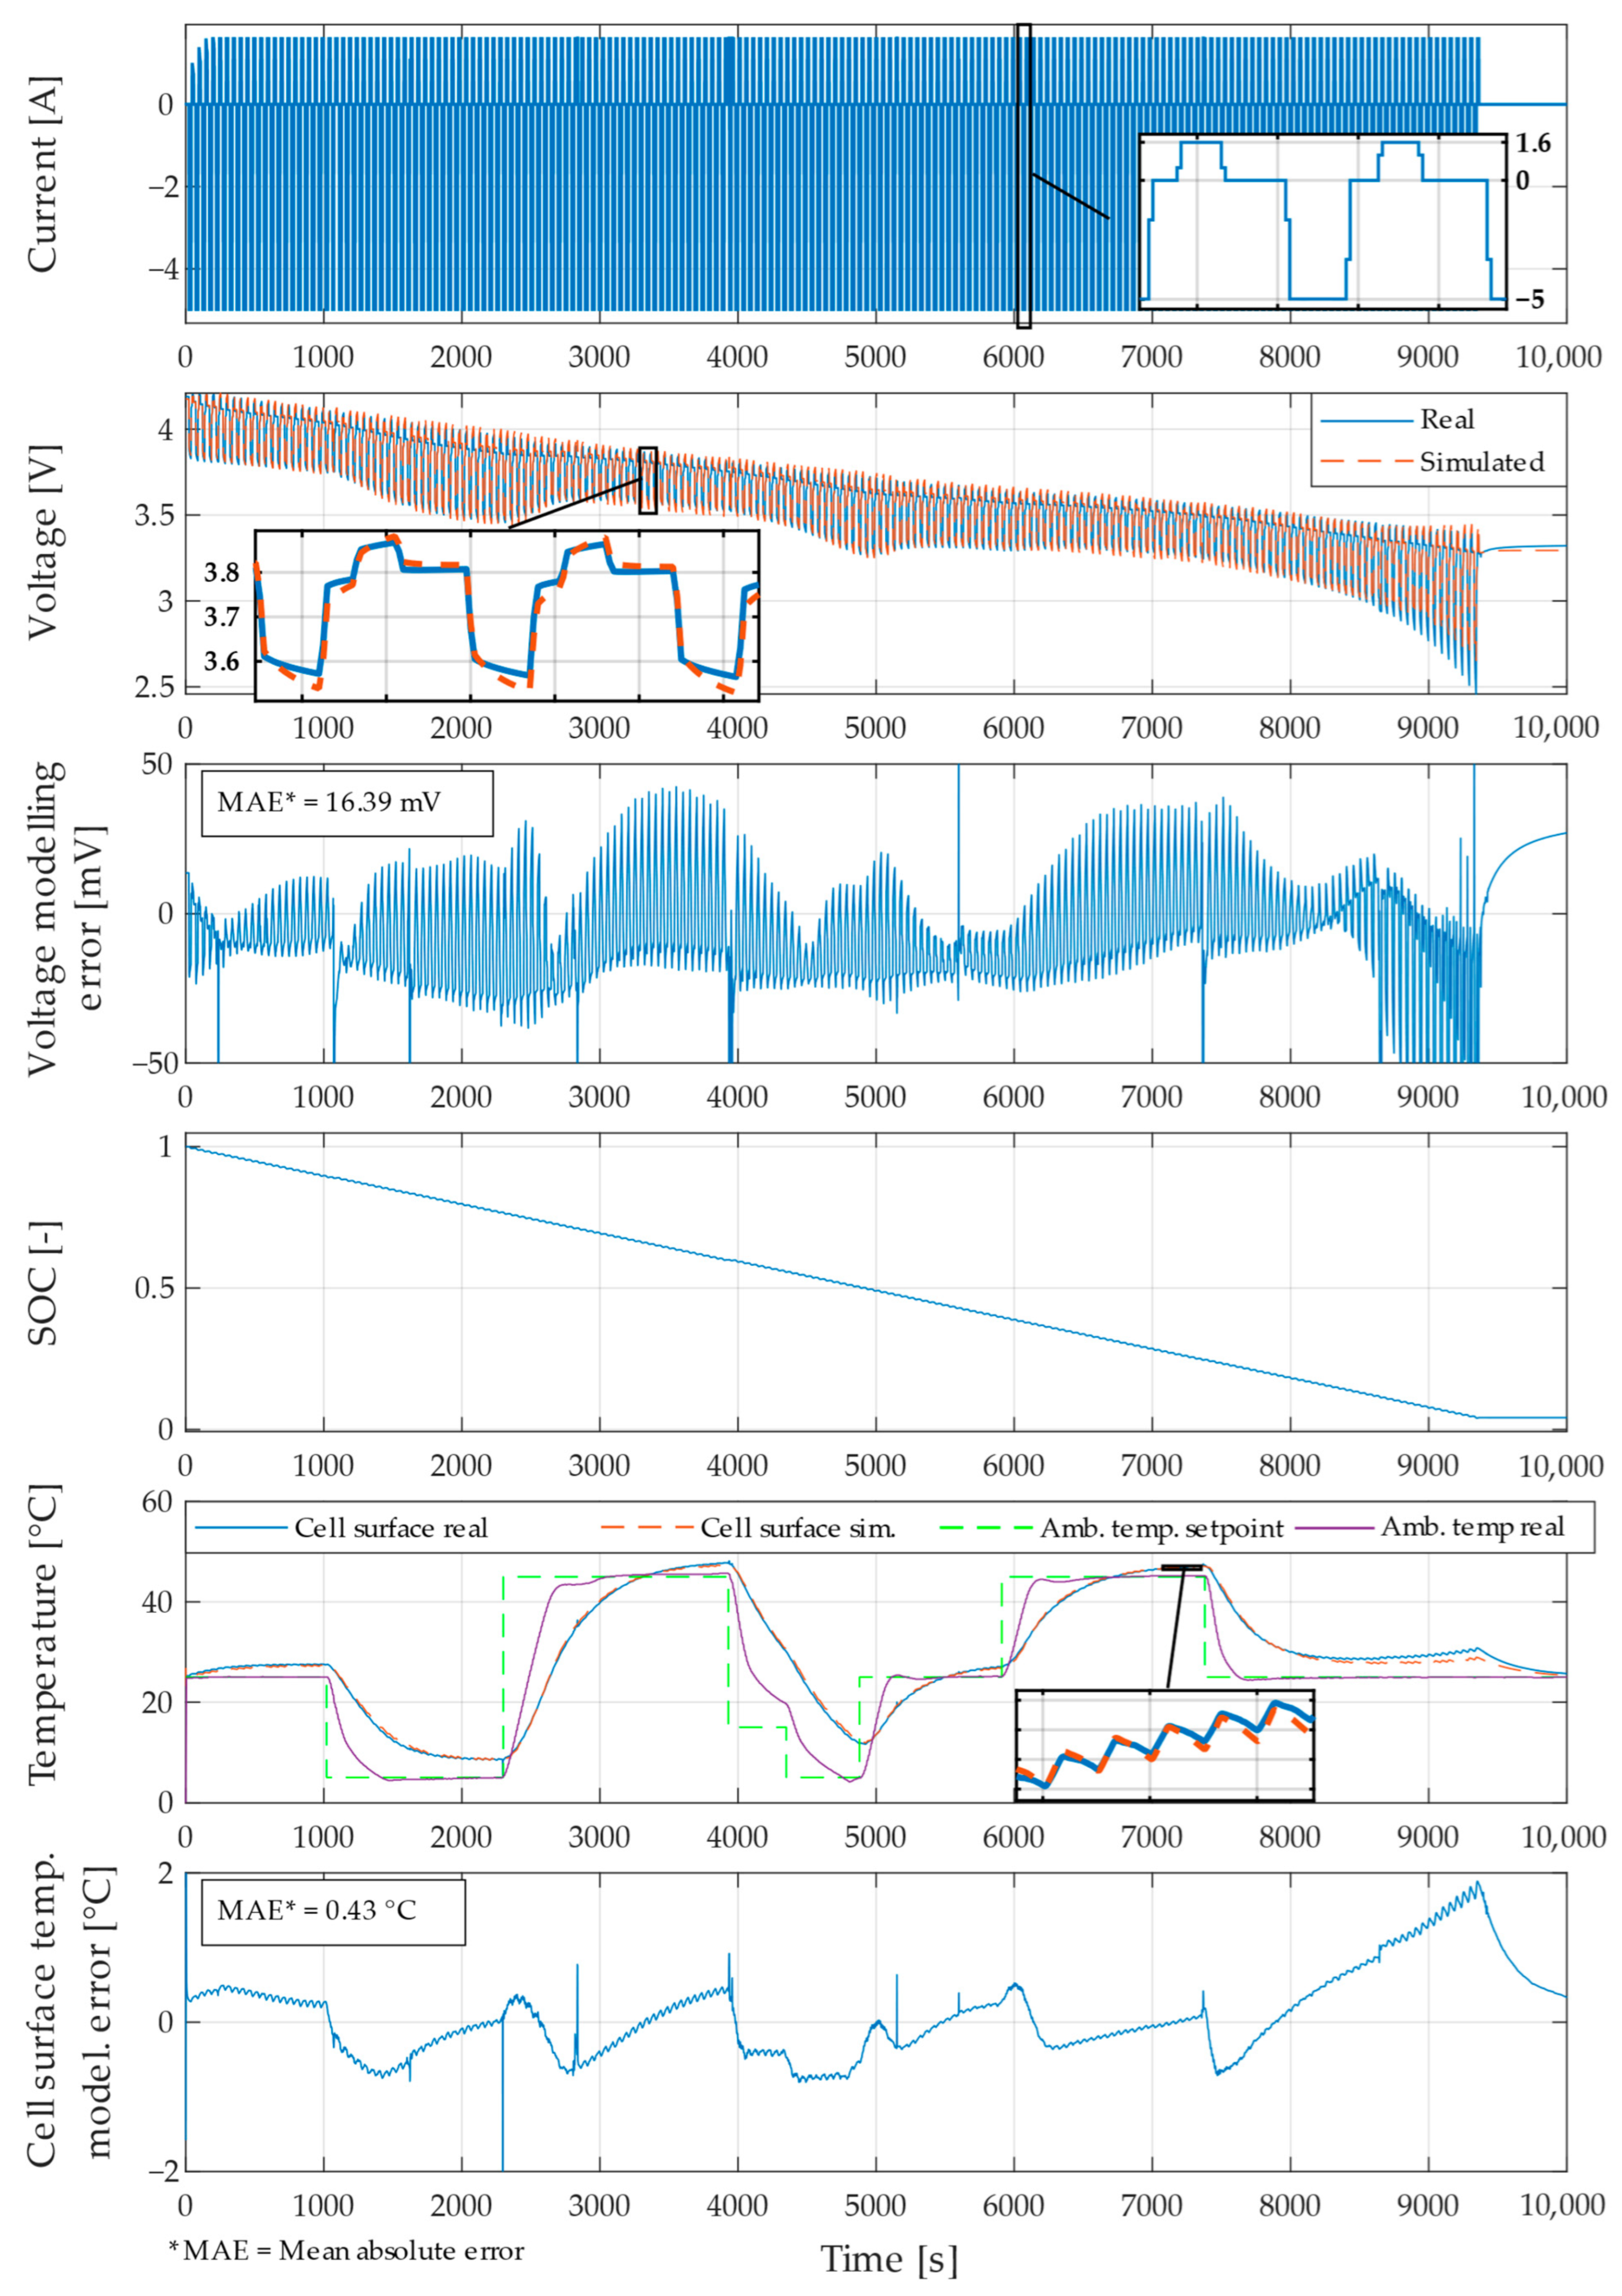
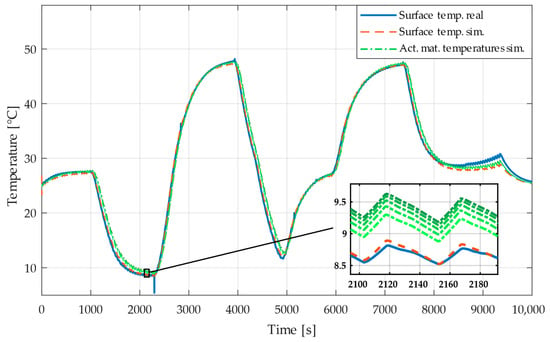
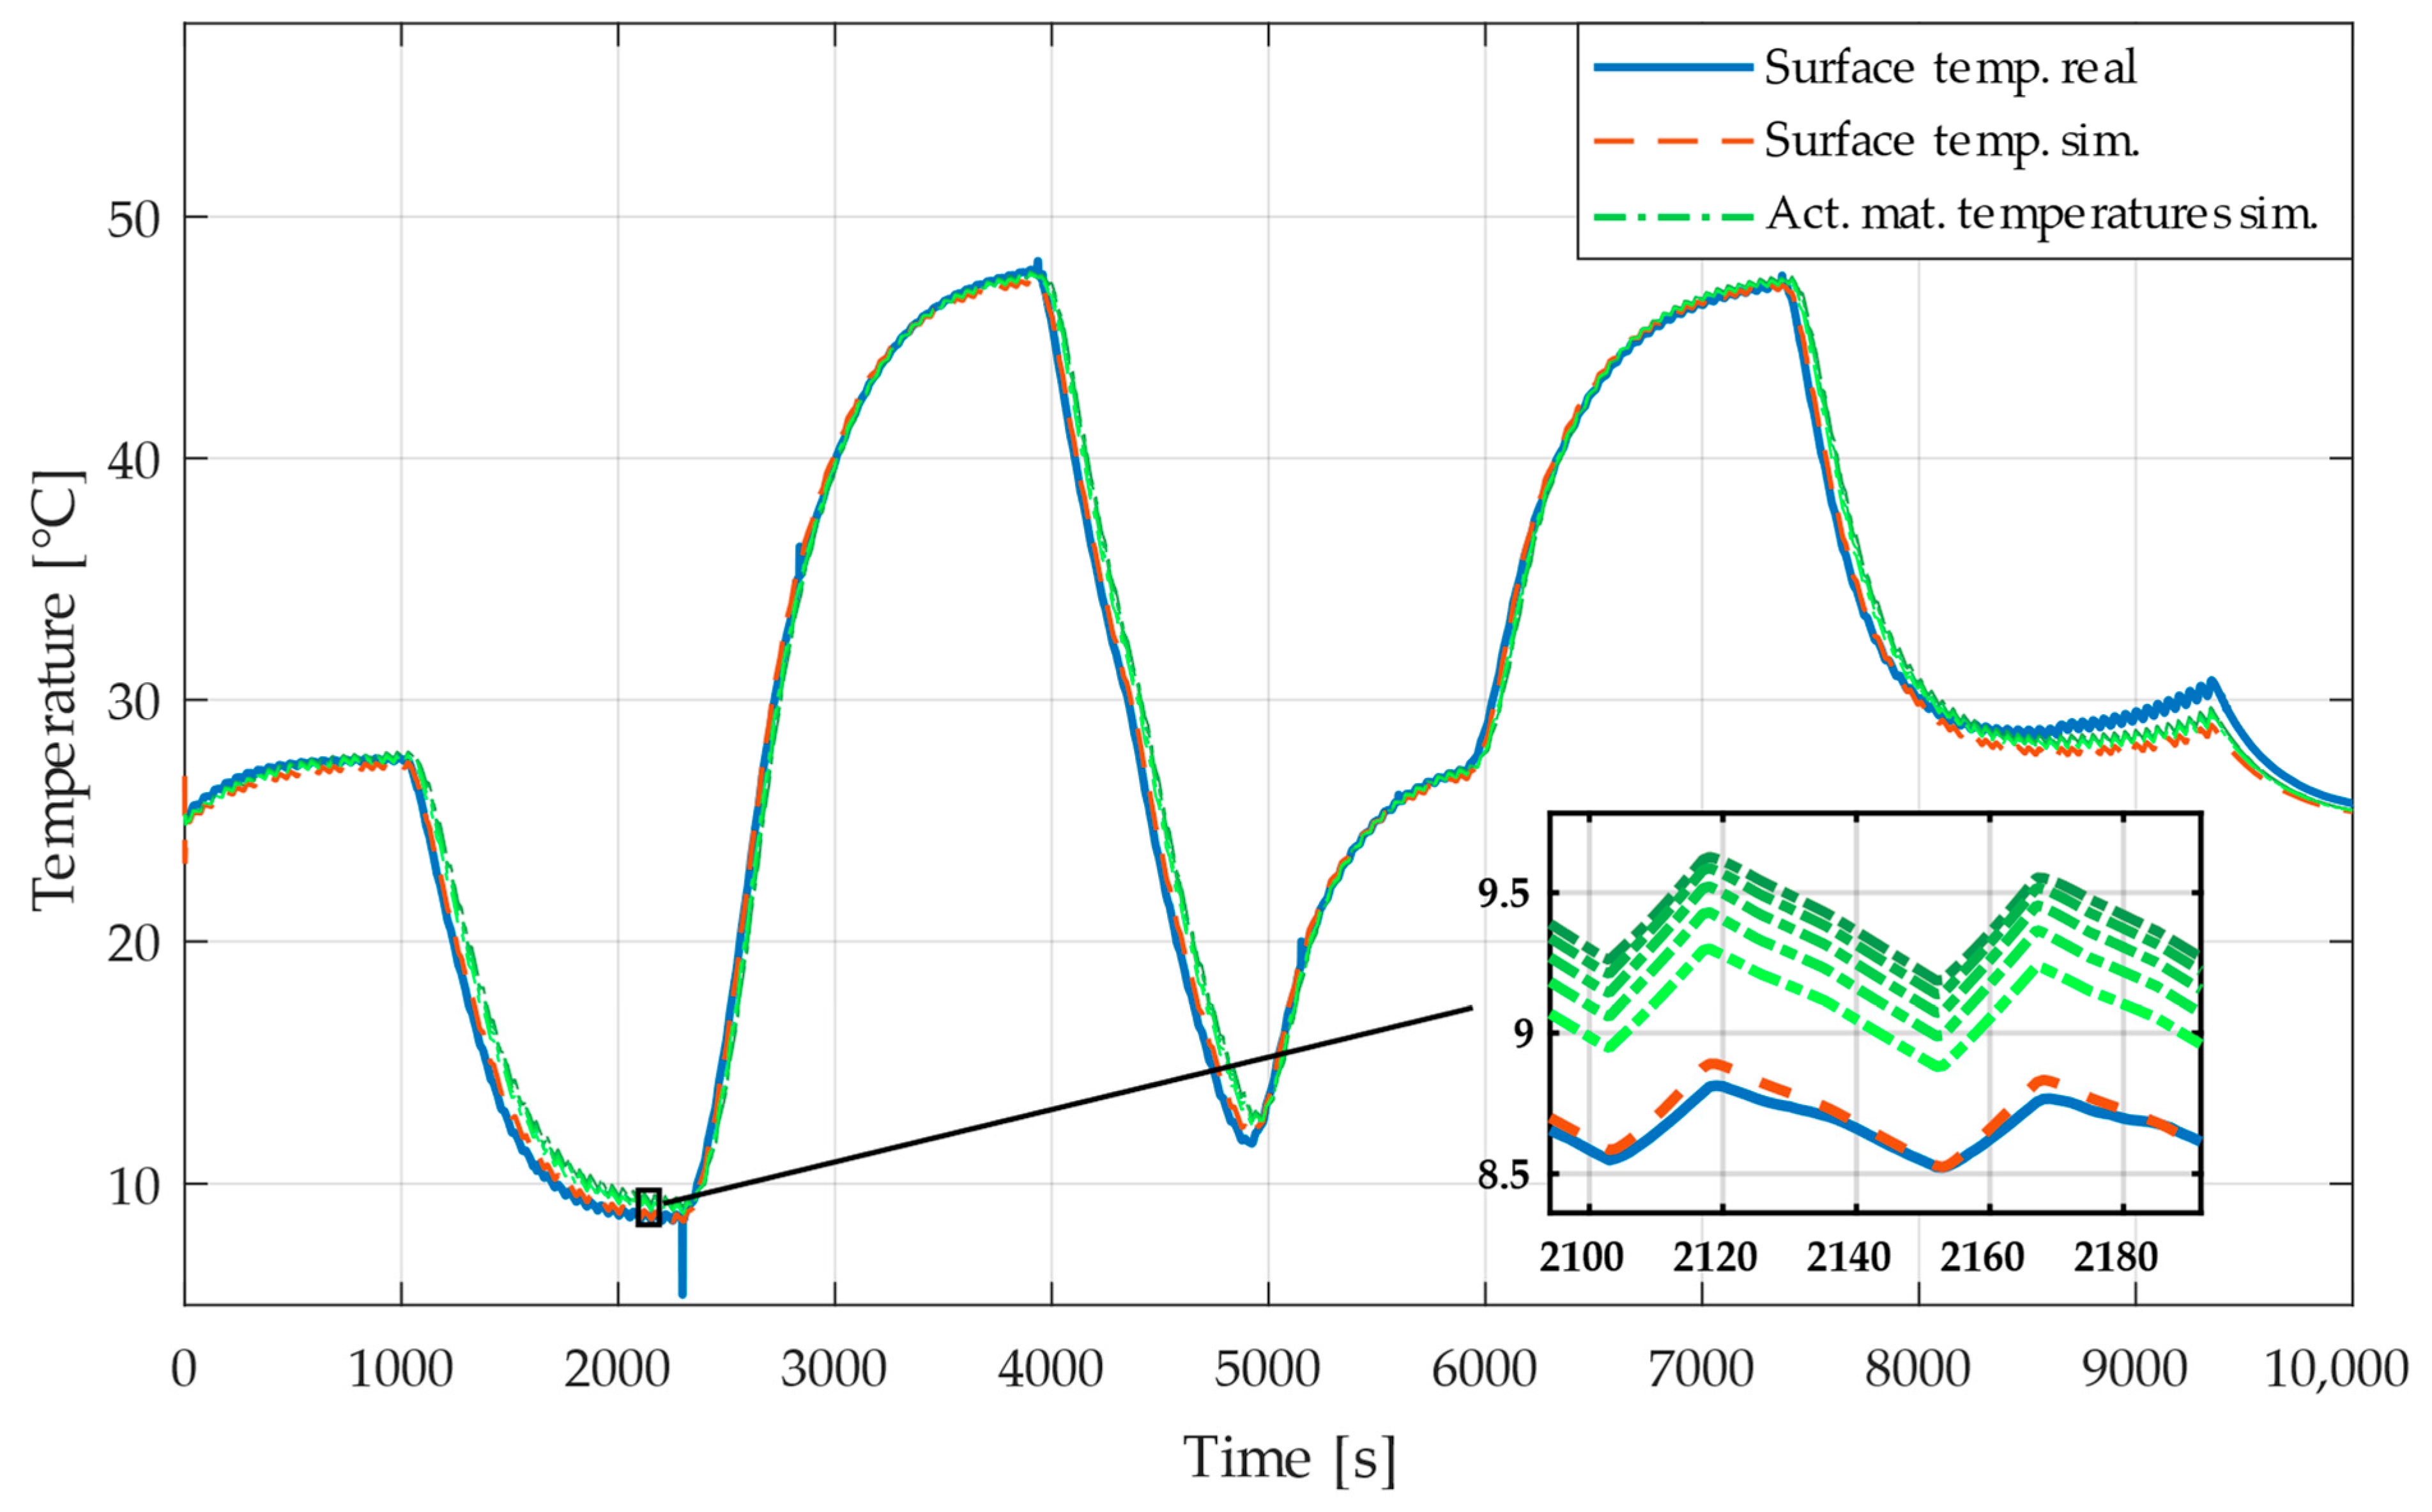

Disclaimer/Publisher’s Note: The statements, opinions and data contained in all publications are solely those of the individual author(s) and contributor(s) and not of MDPI and/or the editor(s). MDPI and/or the editor(s) disclaim responsibility for any injury to people or property resulting from any ideas, methods, instructions or products referred to in the content. |
© 2026 by the authors. Licensee MDPI, Basel, Switzerland. This article is an open access article distributed under the terms and conditions of the Creative Commons Attribution (CC BY) license.