6.3. Validation Under Real Wind Profile
To validate the controllers obtained in
Section 6.1.2 and
Section 6.2.2, a real wind-speed profile measured by a Supervisory Control and Data Acquisition (SCADA) system from a wind turbine was used [
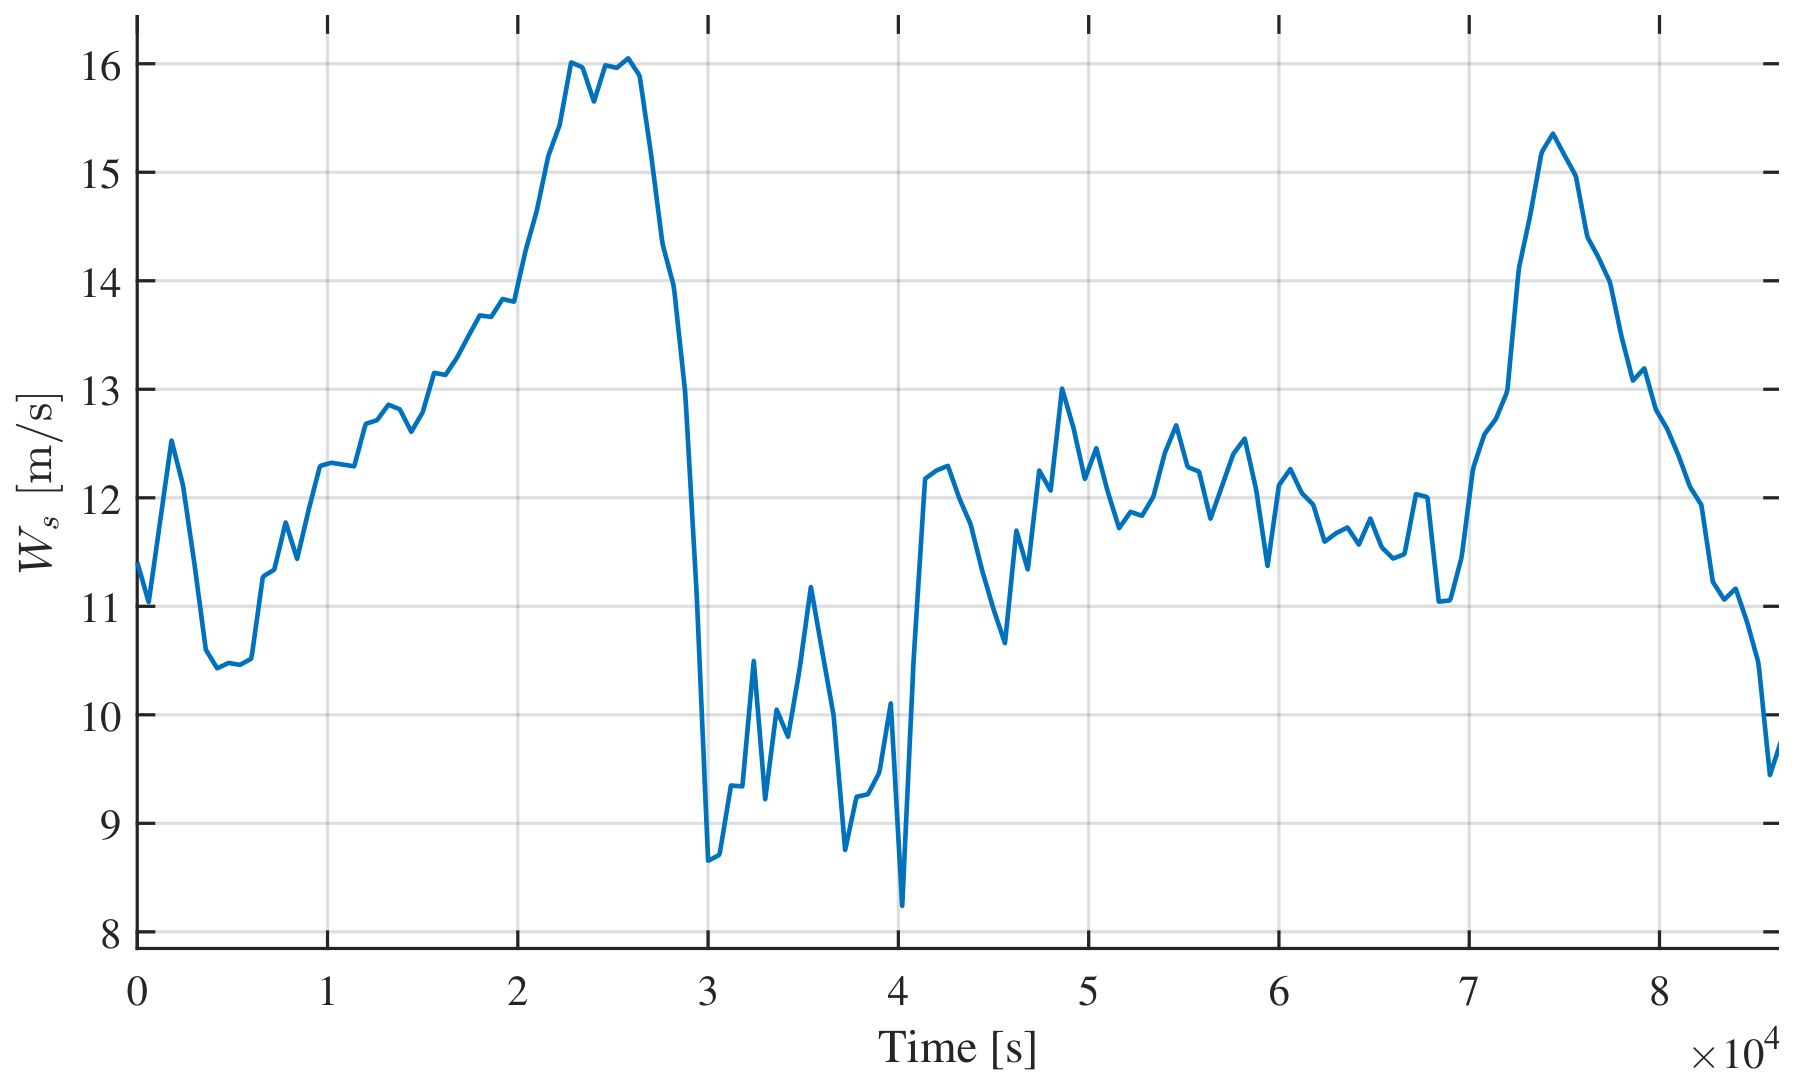
43]. Specifically, the wind profile recorded on 7 January 2018, shown in
Figure 9, was selected.
Both the baseline controller and the selected DE-tuned controllers were evaluated using the wind profile shown in
Figure 9, which spans wind-speed ranges suitable for analyzing transitions between operating regions.
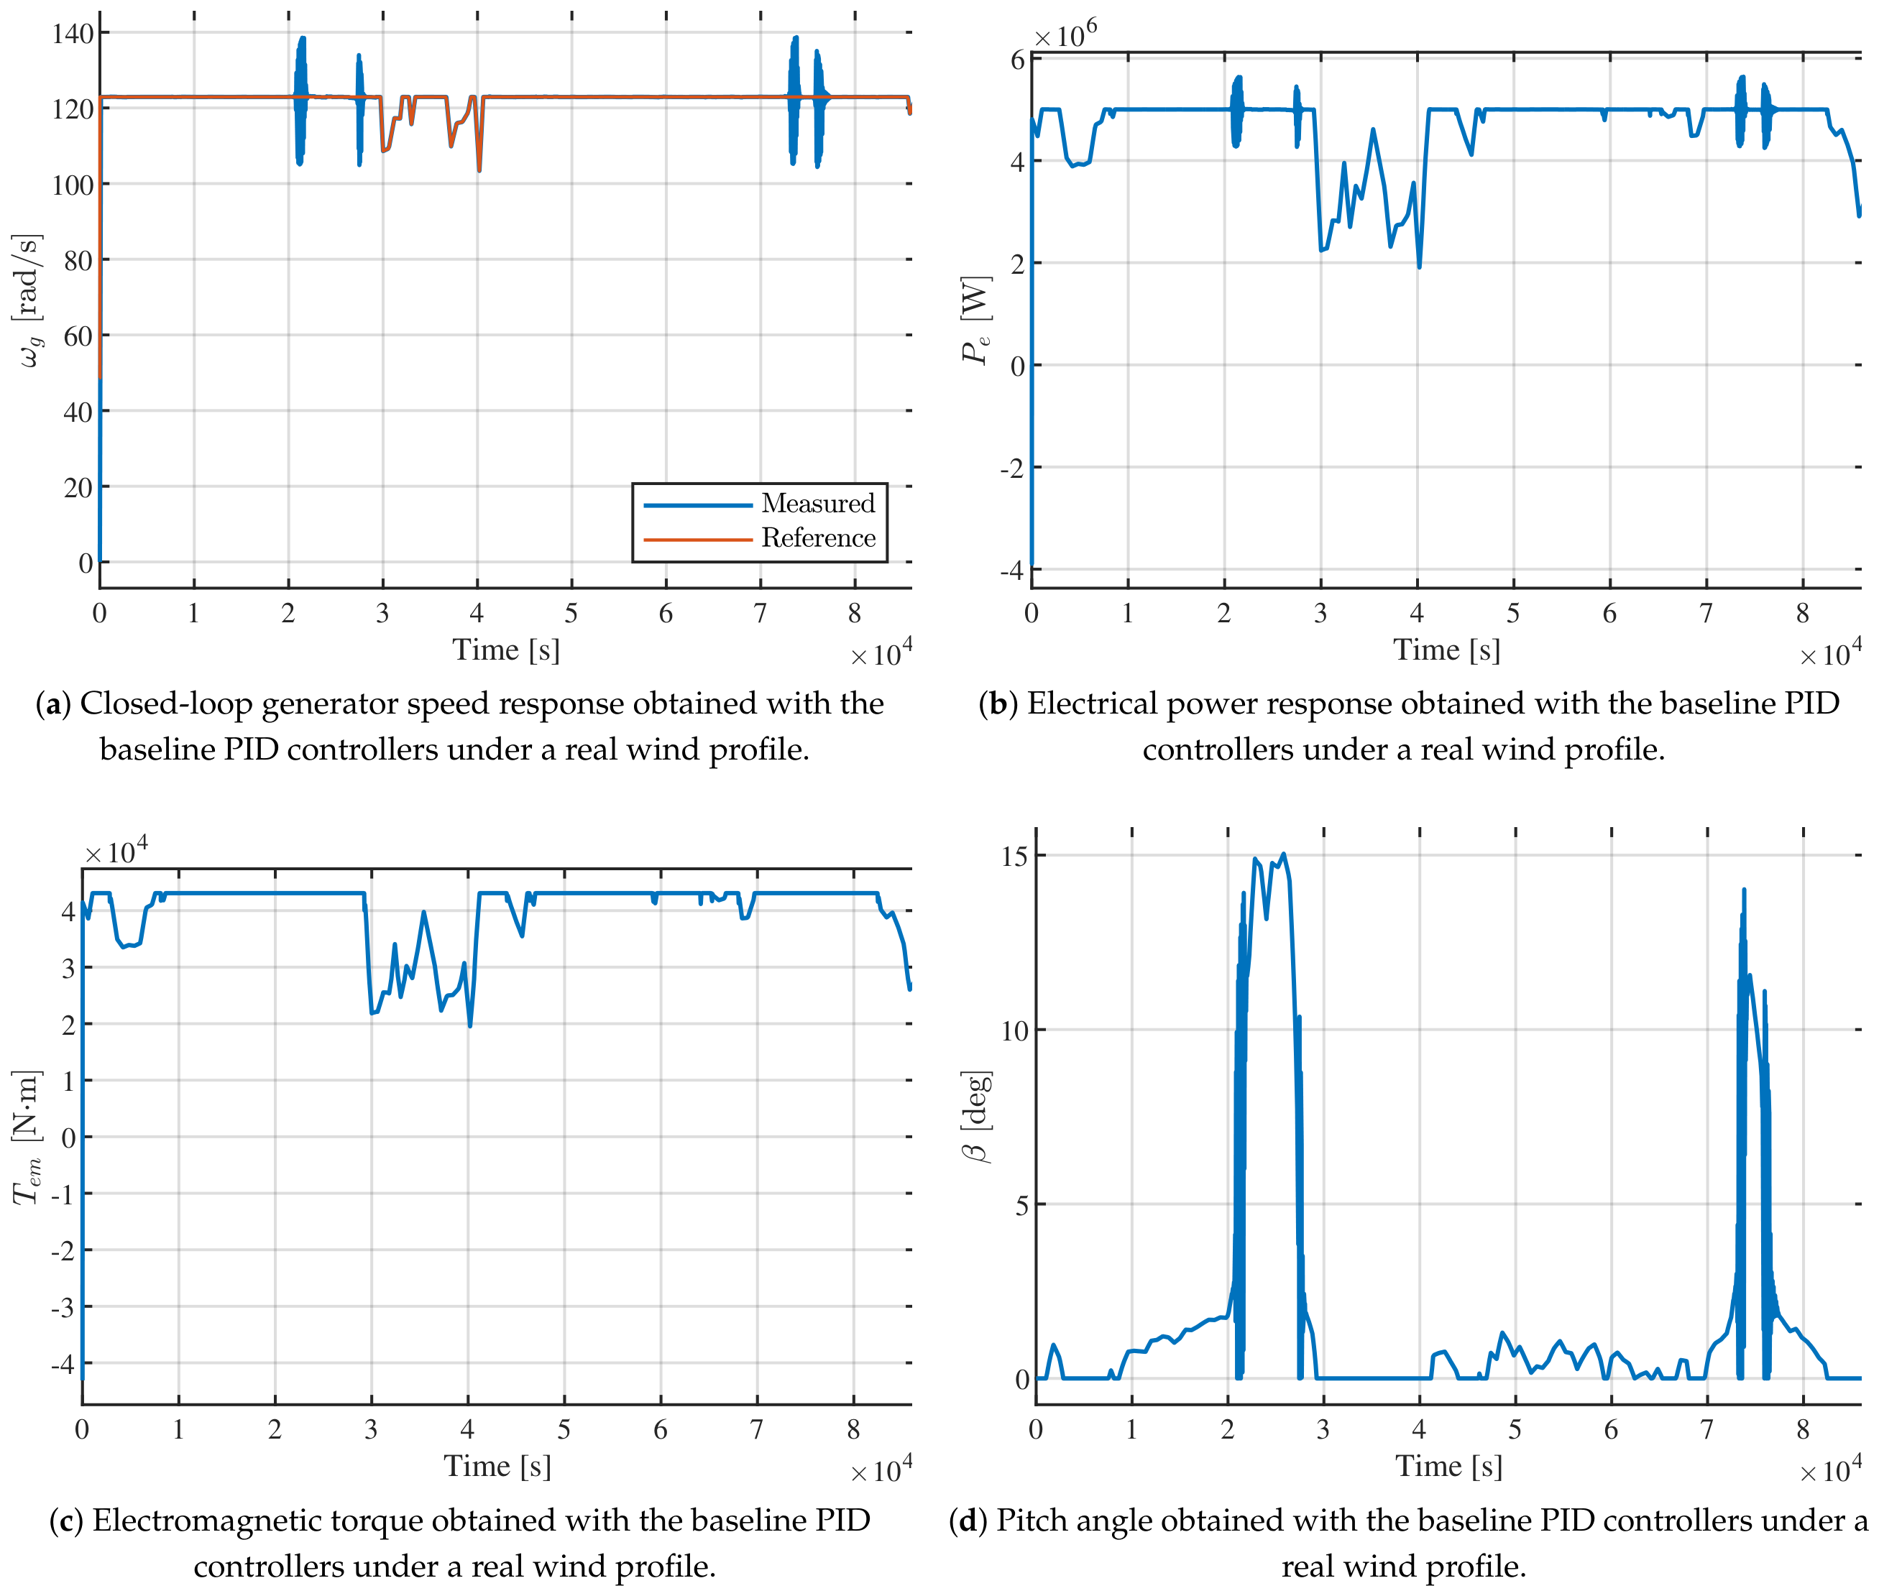
The generator angular speed and its reference, obtained with the baseline controllers, are shown in
Figure 10a.
Although the controlled variable is the generator speed, the most relevant output for power production is the active electrical power, defined by Equation (
9) and shown in
Figure 10b.
The control signals corresponding to
Figure 10a,b are shown in
Figure 10c,d. As observed in
Figure 10c, the electromagnetic torque presents a smoother behavior than the pitch angle shown in
Figure 10d. In contrast, the pitch signal exhibits more pronounced oscillations, which are transferred to the generator-speed response and contribute to the oscillatory behavior observed in
Figure 10a.
As discussed in
Section 6.2, the baseline PID controller in Region 3 exhibits a relatively slow dynamic response. Consequently, the control action tends to oscillate in an attempt to compensate for wind-induced speed deviations and recover the rated operating condition. This behavior not only increases the oscillatory content of the system output, but also has a physical implication for the turbine. Repeated pitch variations may increase the activity and wear of the pitch actuator, while oscillations in generator speed may introduce additional mechanical stress in the drivetrain and rotor shaft. Therefore, the analysis of the control signals confirms that the baseline PID controller does not only present poorer numerical performance, but also a less desirable dynamic behavior from an operational and mechanical perspective.
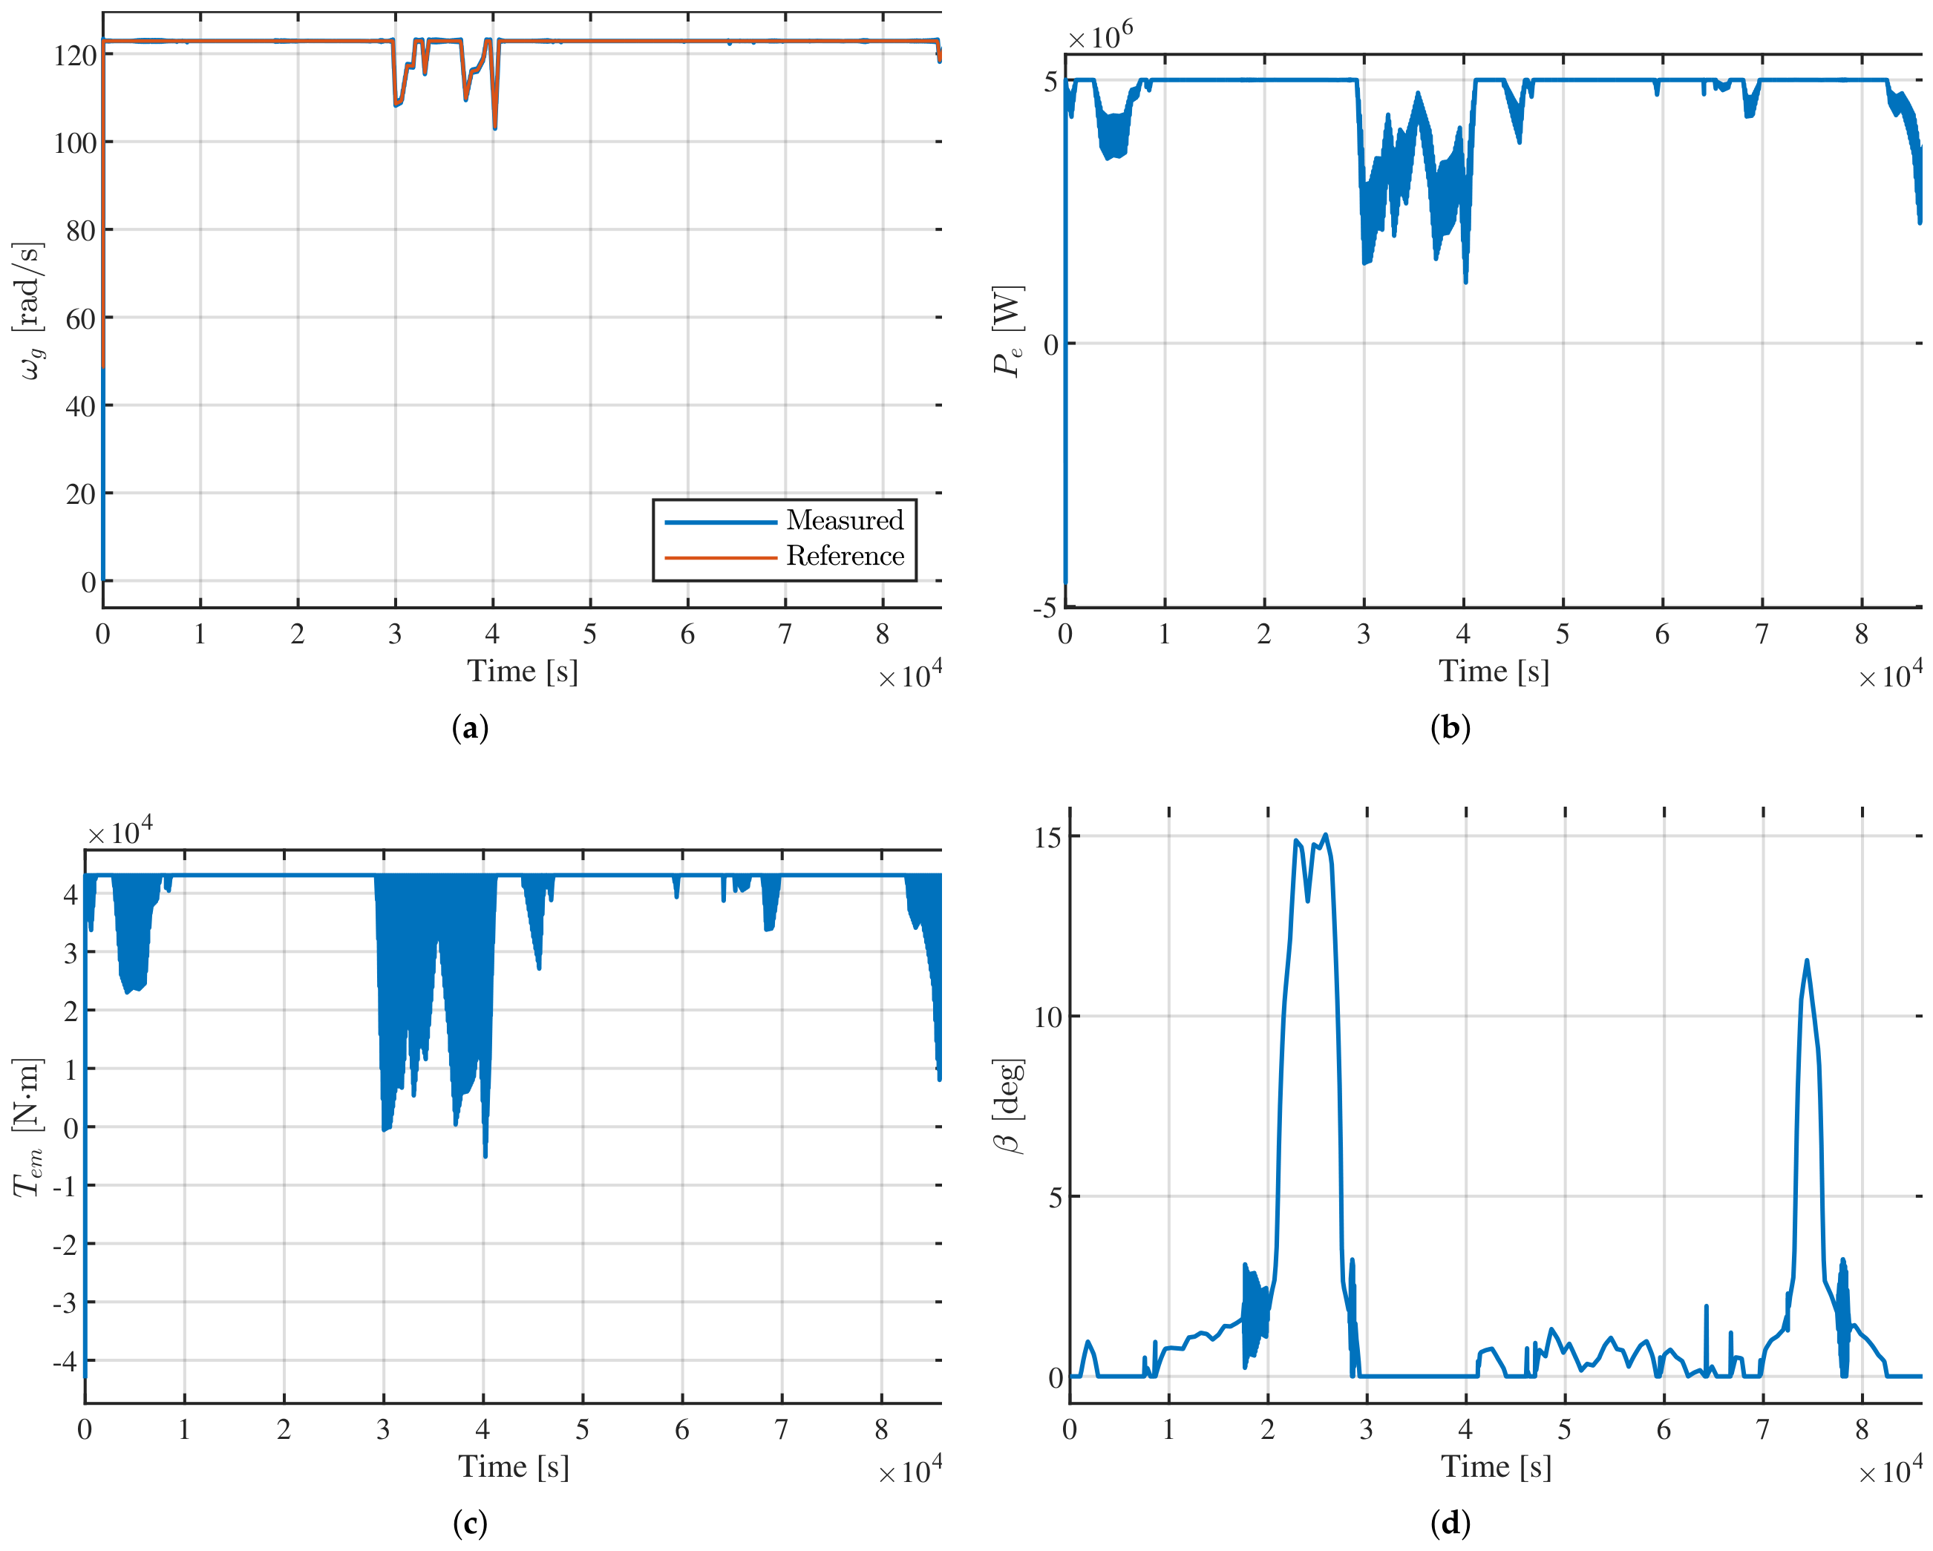
The same evaluation scenario was subsequently applied using the PIDA-DE/best/1/bin controller in Region 2 and the PIDA-DE/best/1/bin controller in Region 3. The resulting generator angular speed is shown in
Figure 11a. It is worth noting that the reference signals computed by the MPPT strategy exhibit slight variations depending on the selected controller, as they are influenced by internal model variables.
Figure 11a reveals a noteworthy behavior. Under high-load operating conditions, the controller tuned for Region 3 outperforms the baseline controller. This improvement is also reflected in the pitch-angle signal shown in
Figure 11d, which is clearly smoother than the corresponding signal obtained with the baseline PID controller.
Although the DE-tuned PIDA controller shows a clear improvement in Region 3, its performance is comparatively less favorable in Region 2. In this operating region, the generator-speed response exhibits small oscillations, particularly around and during the interval between and .
This response suggests a highly oscillatory control behavior in Region 2, with a consequent degradation in the quality of the control action. The corresponding electromagnetic torque control effort is shown in
Figure 11c. As observed, the control signal exhibits repeated oscillatory corrections under this operating condition, which are then reflected in the generator-speed response shown in
Figure 11a. From a physical perspective, this behavior is undesirable because persistent oscillatory control actions may increase dynamic loading on the drivetrain and rotor shaft.
In accordance with Equation (
9), the active electrical power also exhibits oscillatory behavior in Region 2, as shown in
Figure 11b. This response is not favorable for power generation, since fluctuations in generator speed and electromagnetic torque are directly reflected in the generated electrical power. From an operational perspective, these power variations may lead to undesirable fluctuations in the power injected into the grid, potentially affecting power quality if not properly mitigated. Therefore, although the DE-tuned PIDA controller improves the response in Region 3, its behavior in Region 2 indicates poorer generalization under real wind conditions.
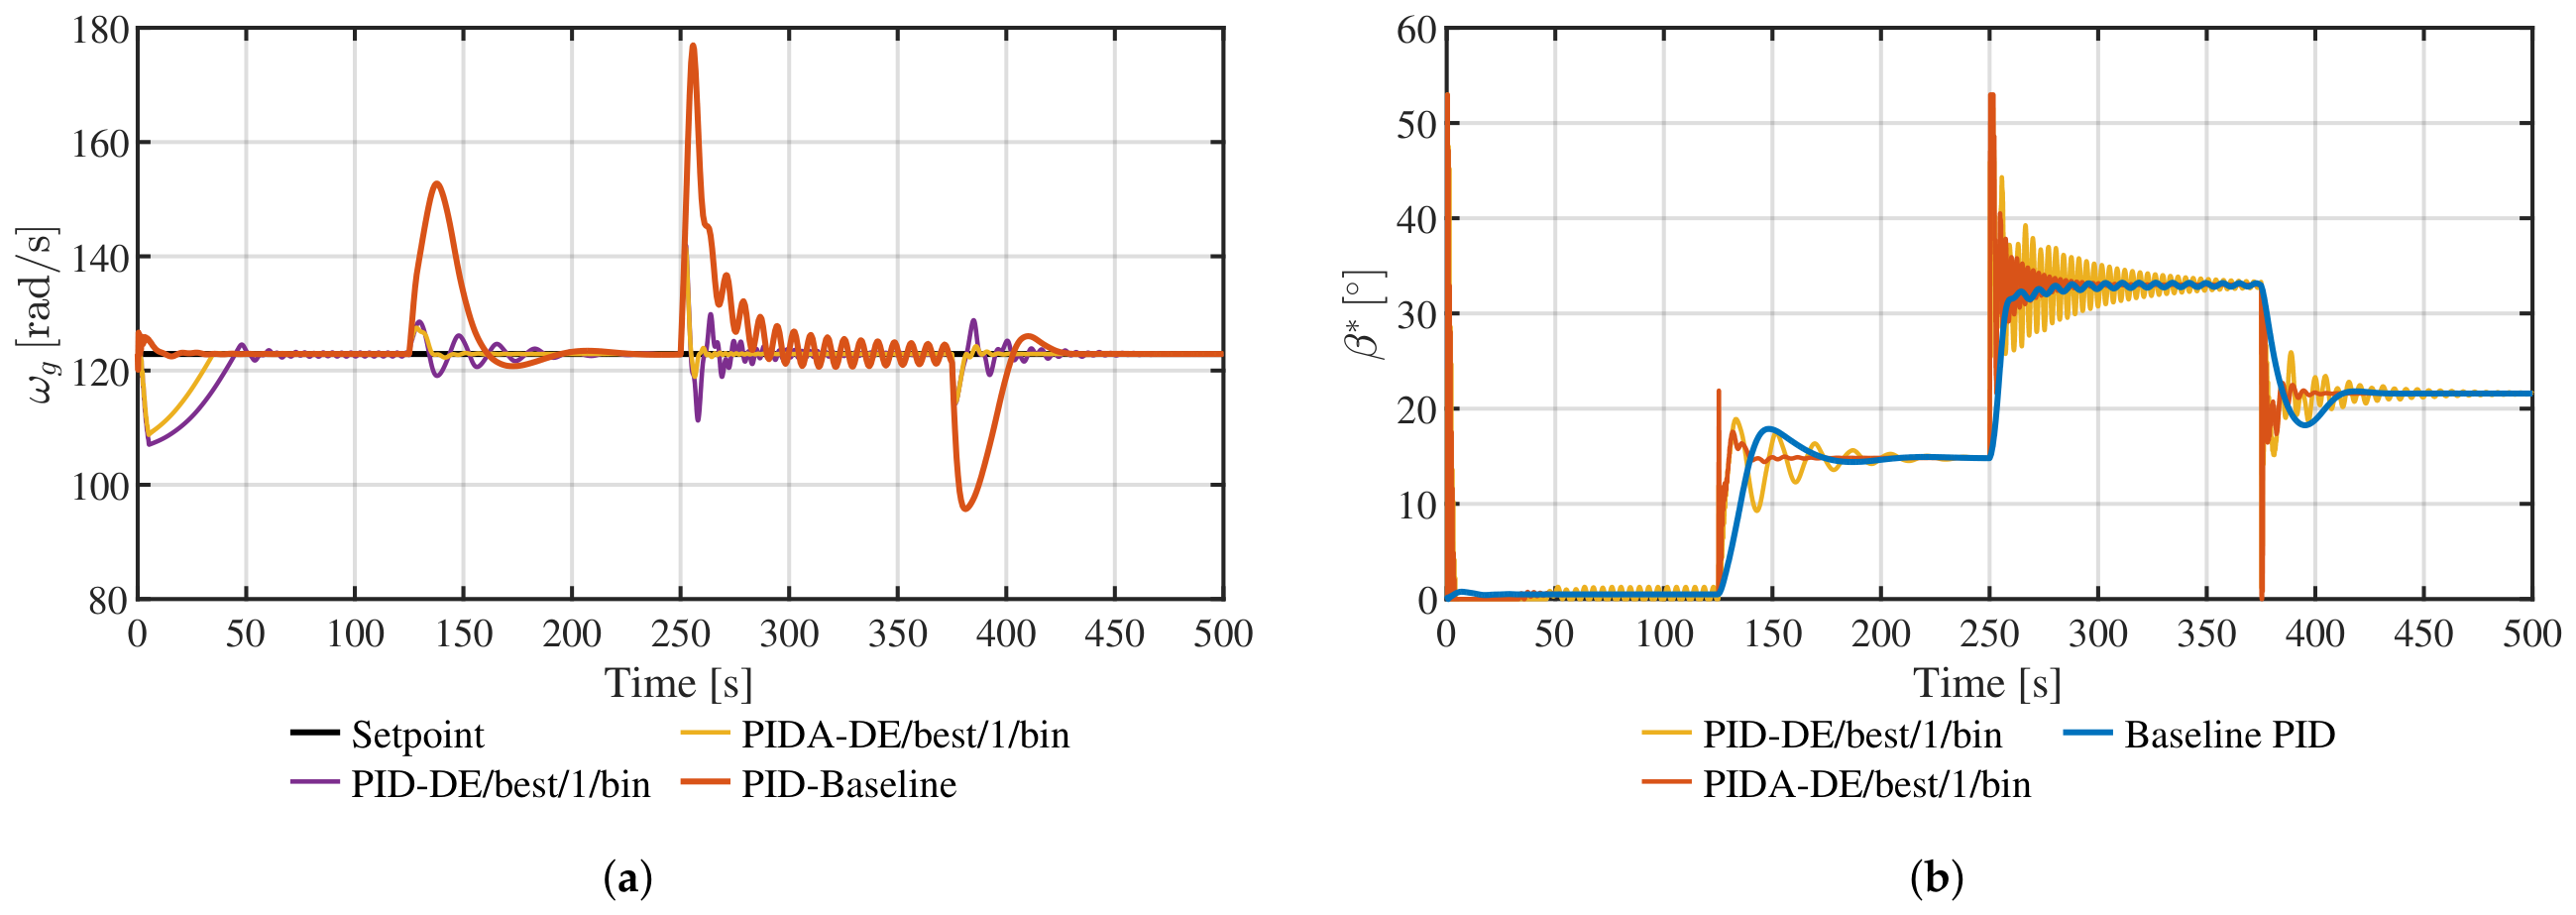
The observed performance degradation in Region 2 can be further interpreted by analyzing
Table 5. Two controllers are particularly noteworthy: DE/best/1/bin, which achieved the lowest
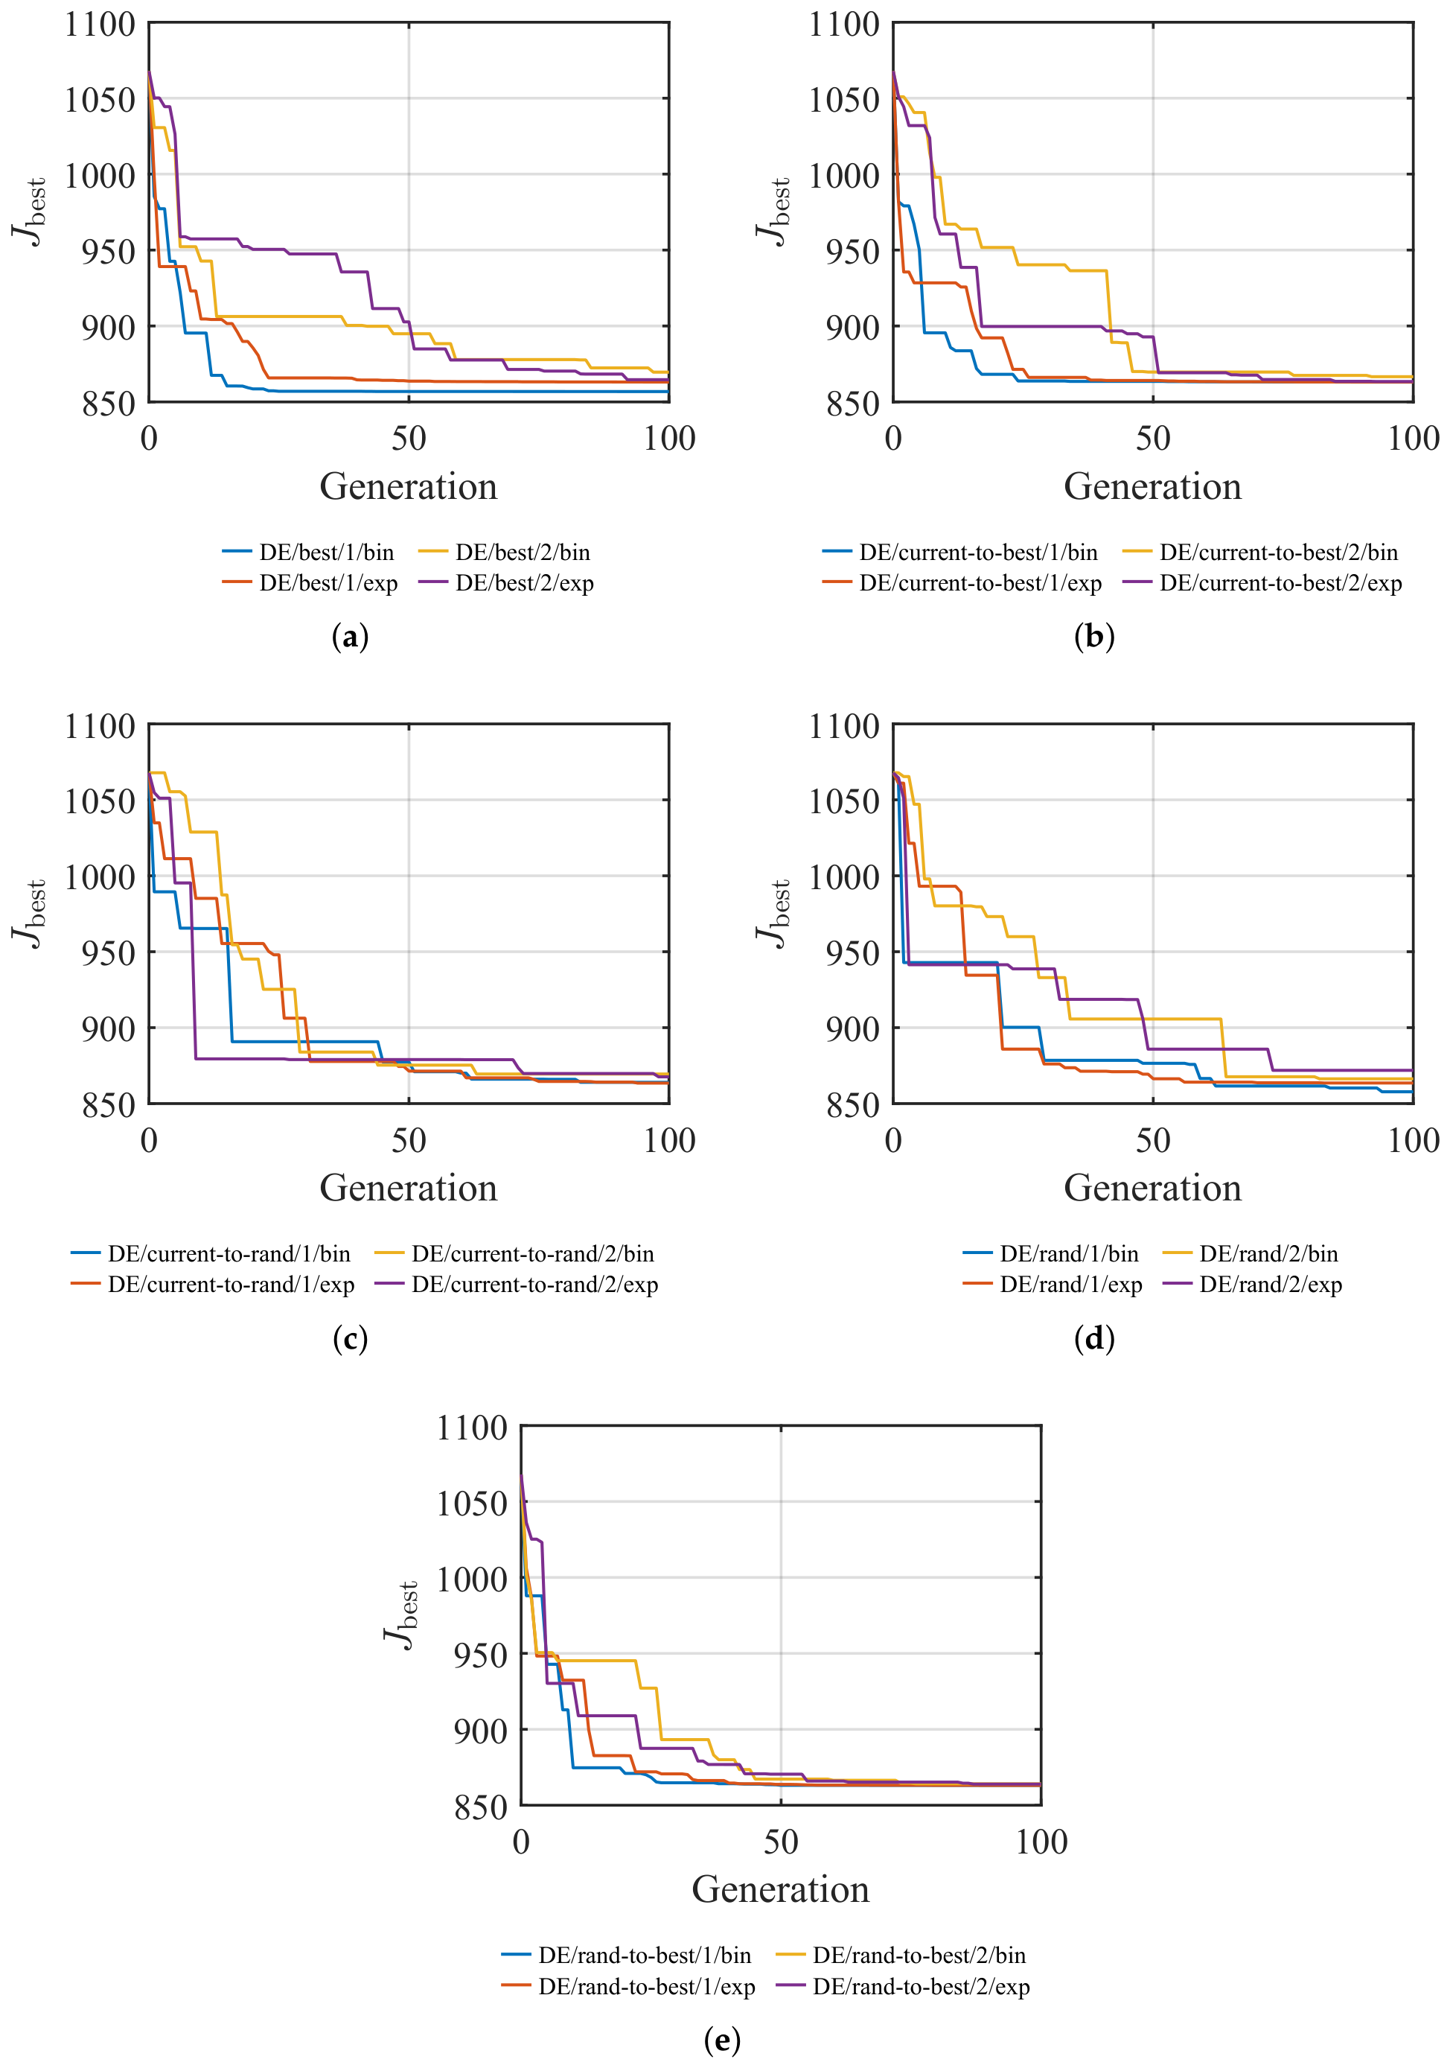
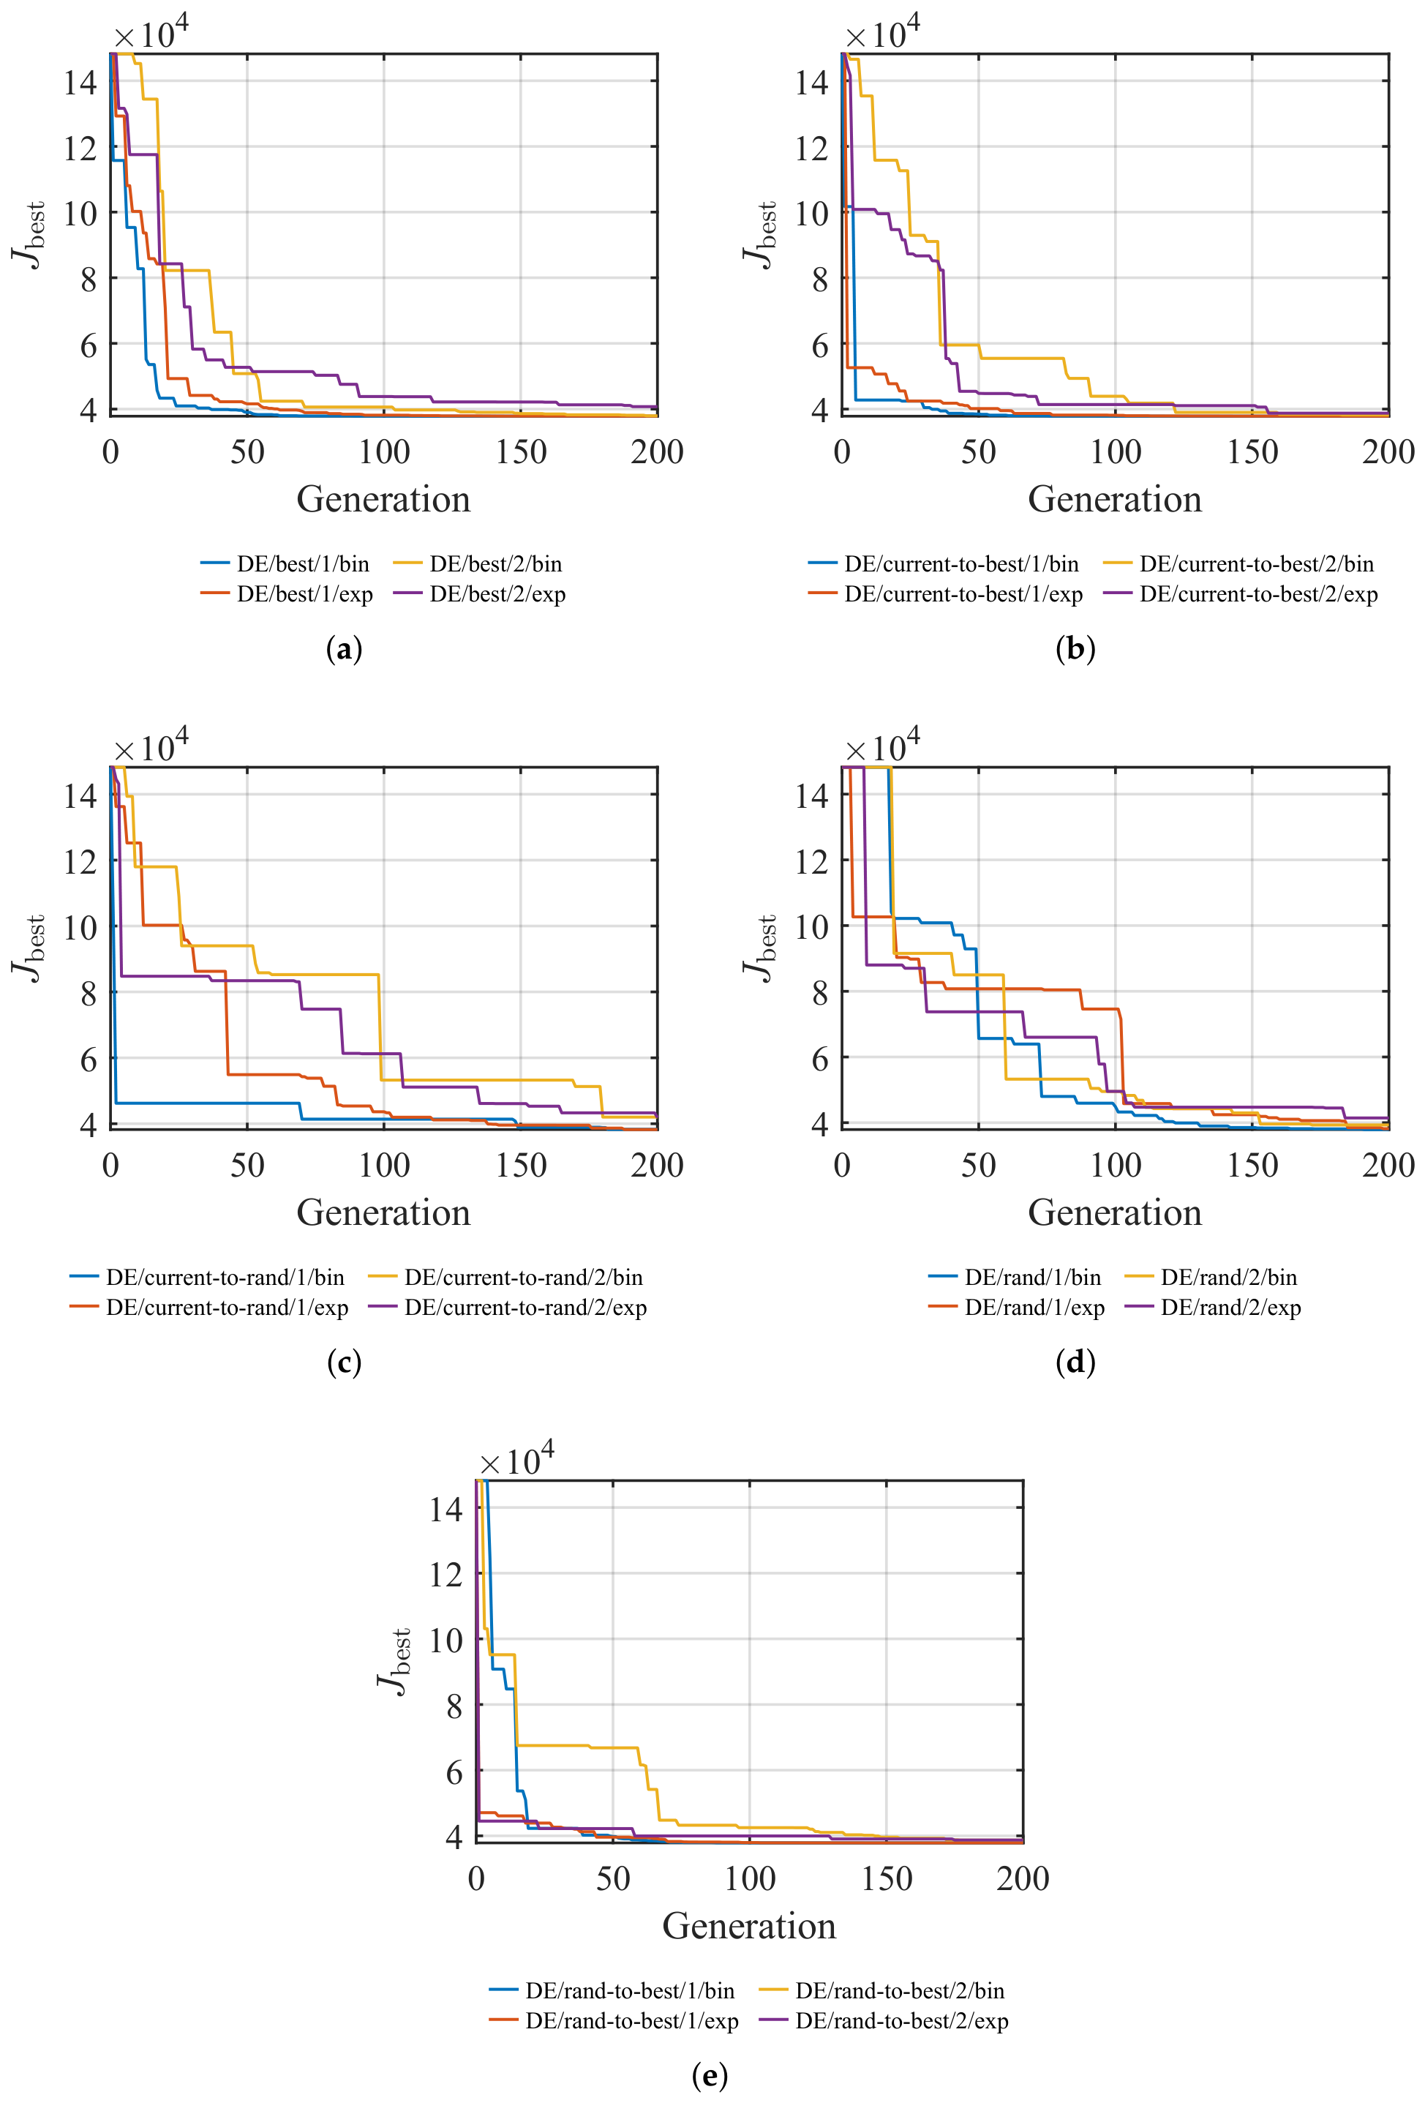
J value under the considered Region 2 configuration, and the closely following DE/rand/1/bin. These controllers are of special interest because their gain values differ significantly from those of the remaining controllers, which tend to cluster around a similar local minimum of the objective function
J.
To quantify whether the final controller configuration preserves its performance beyond the tuning scenarios, the performance indices were normalized with respect to their corresponding baseline values. For the tuning scenarios, the Region 2 PID-DE IAE and the Region 3 PIDA-DE ITAE were divided by the respective baseline values, yielding normalized ratios of
and
. These values were combined using their geometric mean, as shown in Equation (
15).
The same normalization was applied to the SCADA validation results using the IAE and ITAE values reported in
Table 10. The resulting normalized ratios were
and
, respectively, and their geometric mean is given by Equation (
16).
The composite generalization gap is defined as the difference between the SCADA and tuning indicators. Using Equations (
15) and (
16), the resulting value is given by Equation (
17).
The negative value of G indicates that the relative performance of the final controller configuration does not deteriorate under the independent SCADA wind profile. Instead, its normalized performance relative to the baseline improves during validation, supporting the generalization capability of the selected PID controller in Region 2 and PIDA controller in Region 3.
This behavior may indicate a degree of overfitting to the optimization scenario. This behavior is consistent with their strong performance under the tuning conditions. In particular, the best performance is obtained with DE/best/1/bin. However, their performance degrades when they are evaluated under operating conditions different from those used during tuning.
Given this scenario, it becomes necessary to select a controller that avoids the previously observed signs of overfitting. According to
Table 5, among the PIDA controllers that did not exhibit these signs, DE/rand-to-best/1/bin achieved the lowest objective-function value, with
. However, as shown in
Table 6, the PID controller tuned using DE/best/1/bin achieves a lower value of
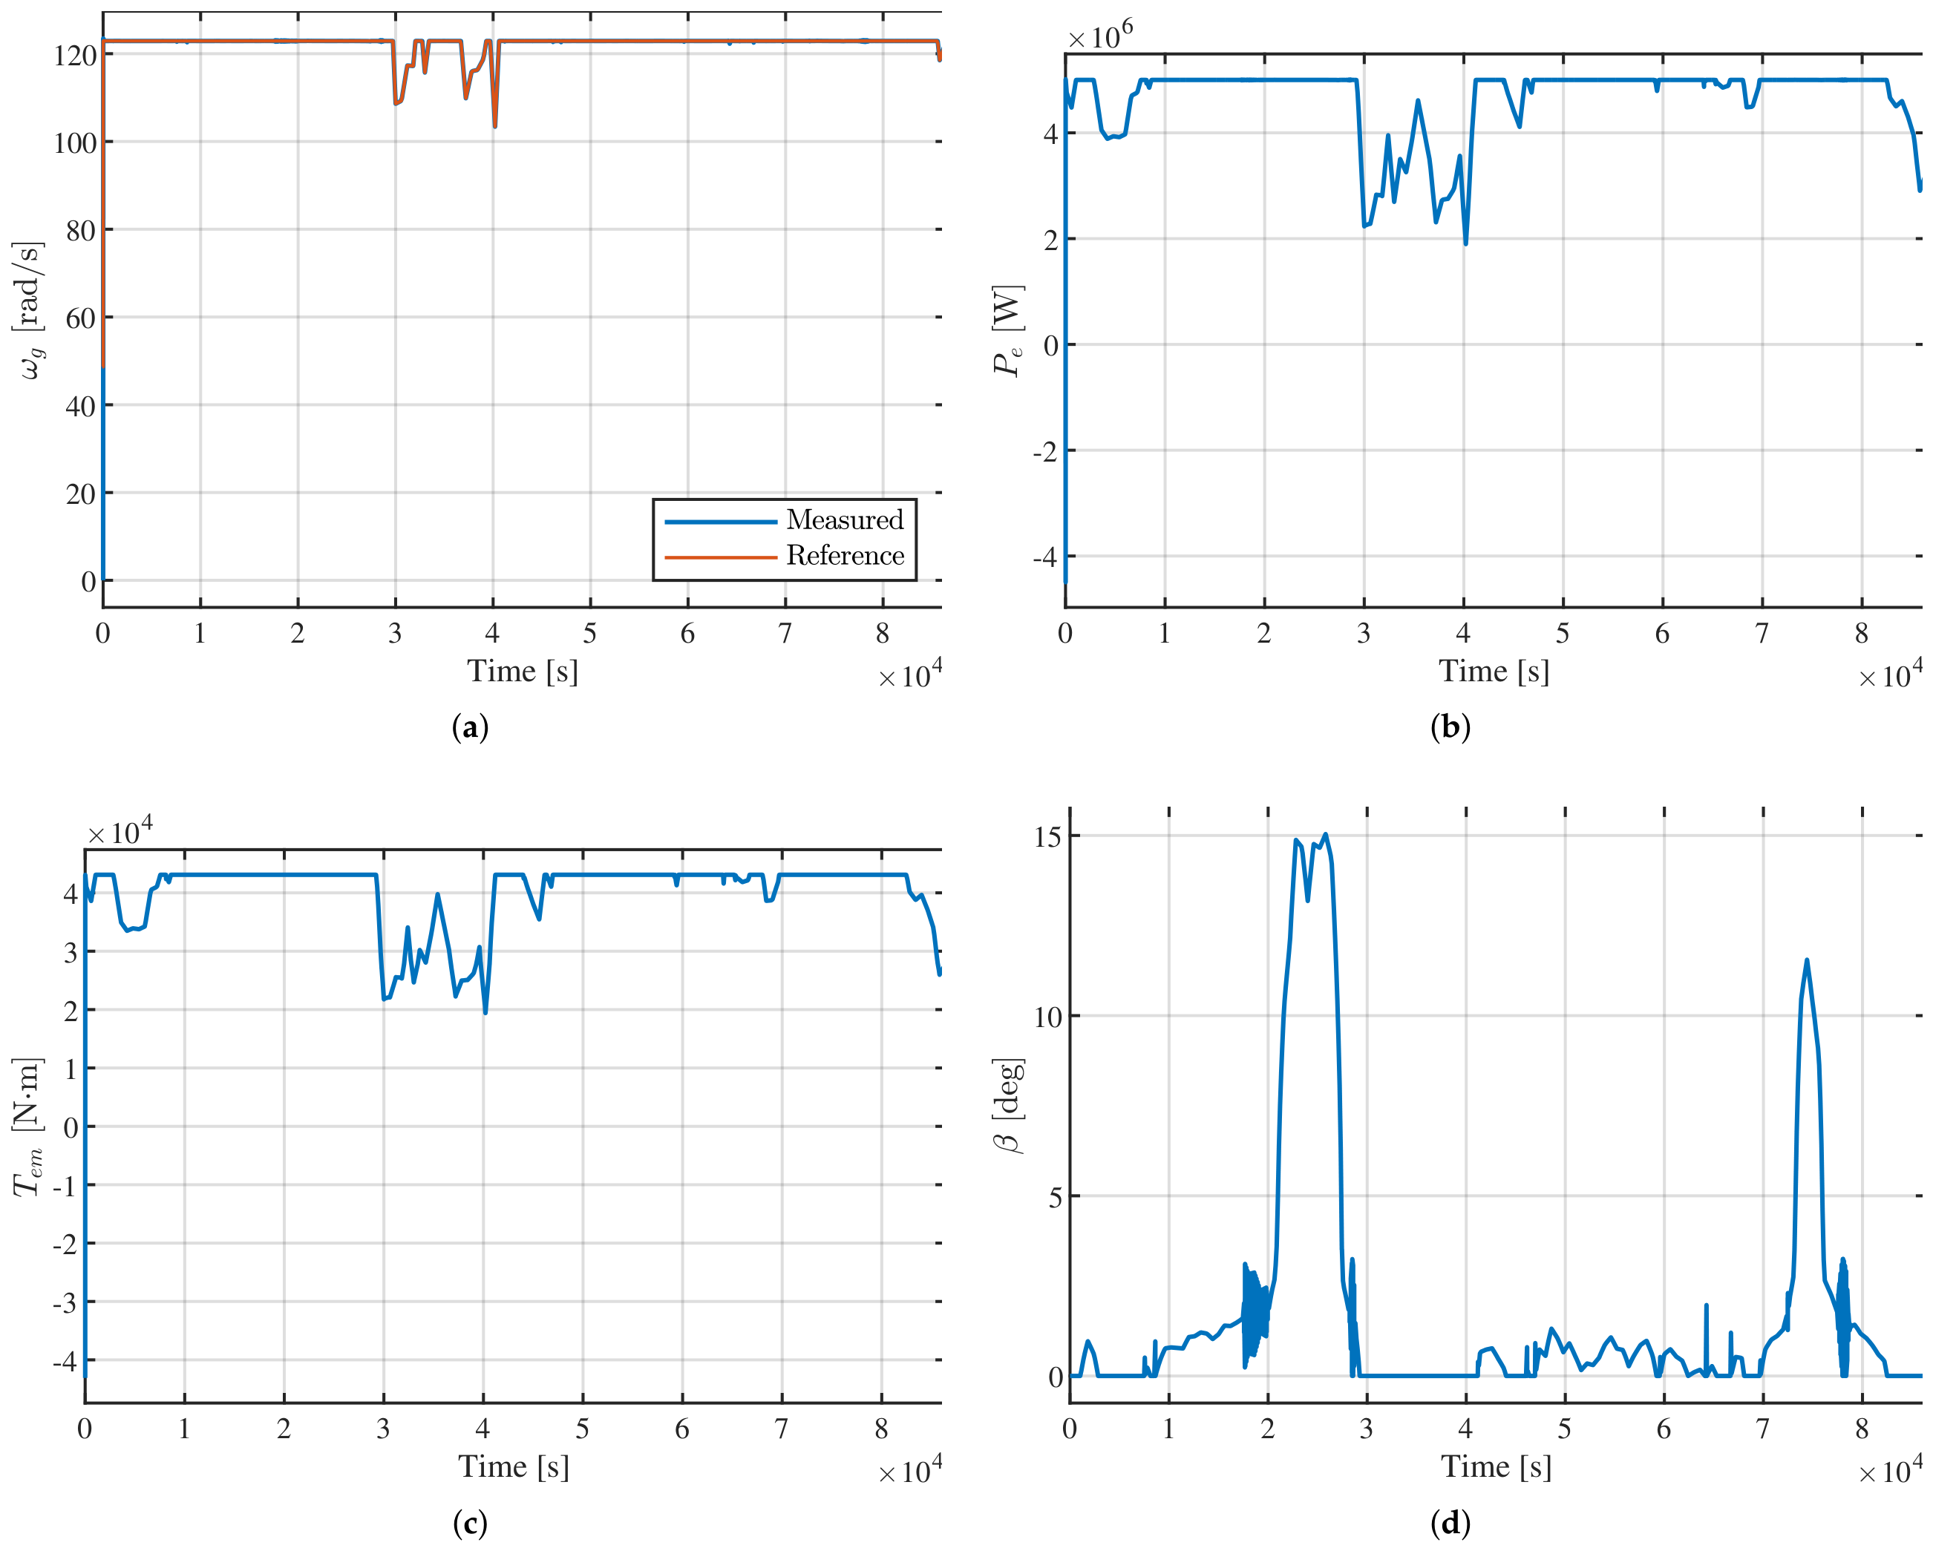
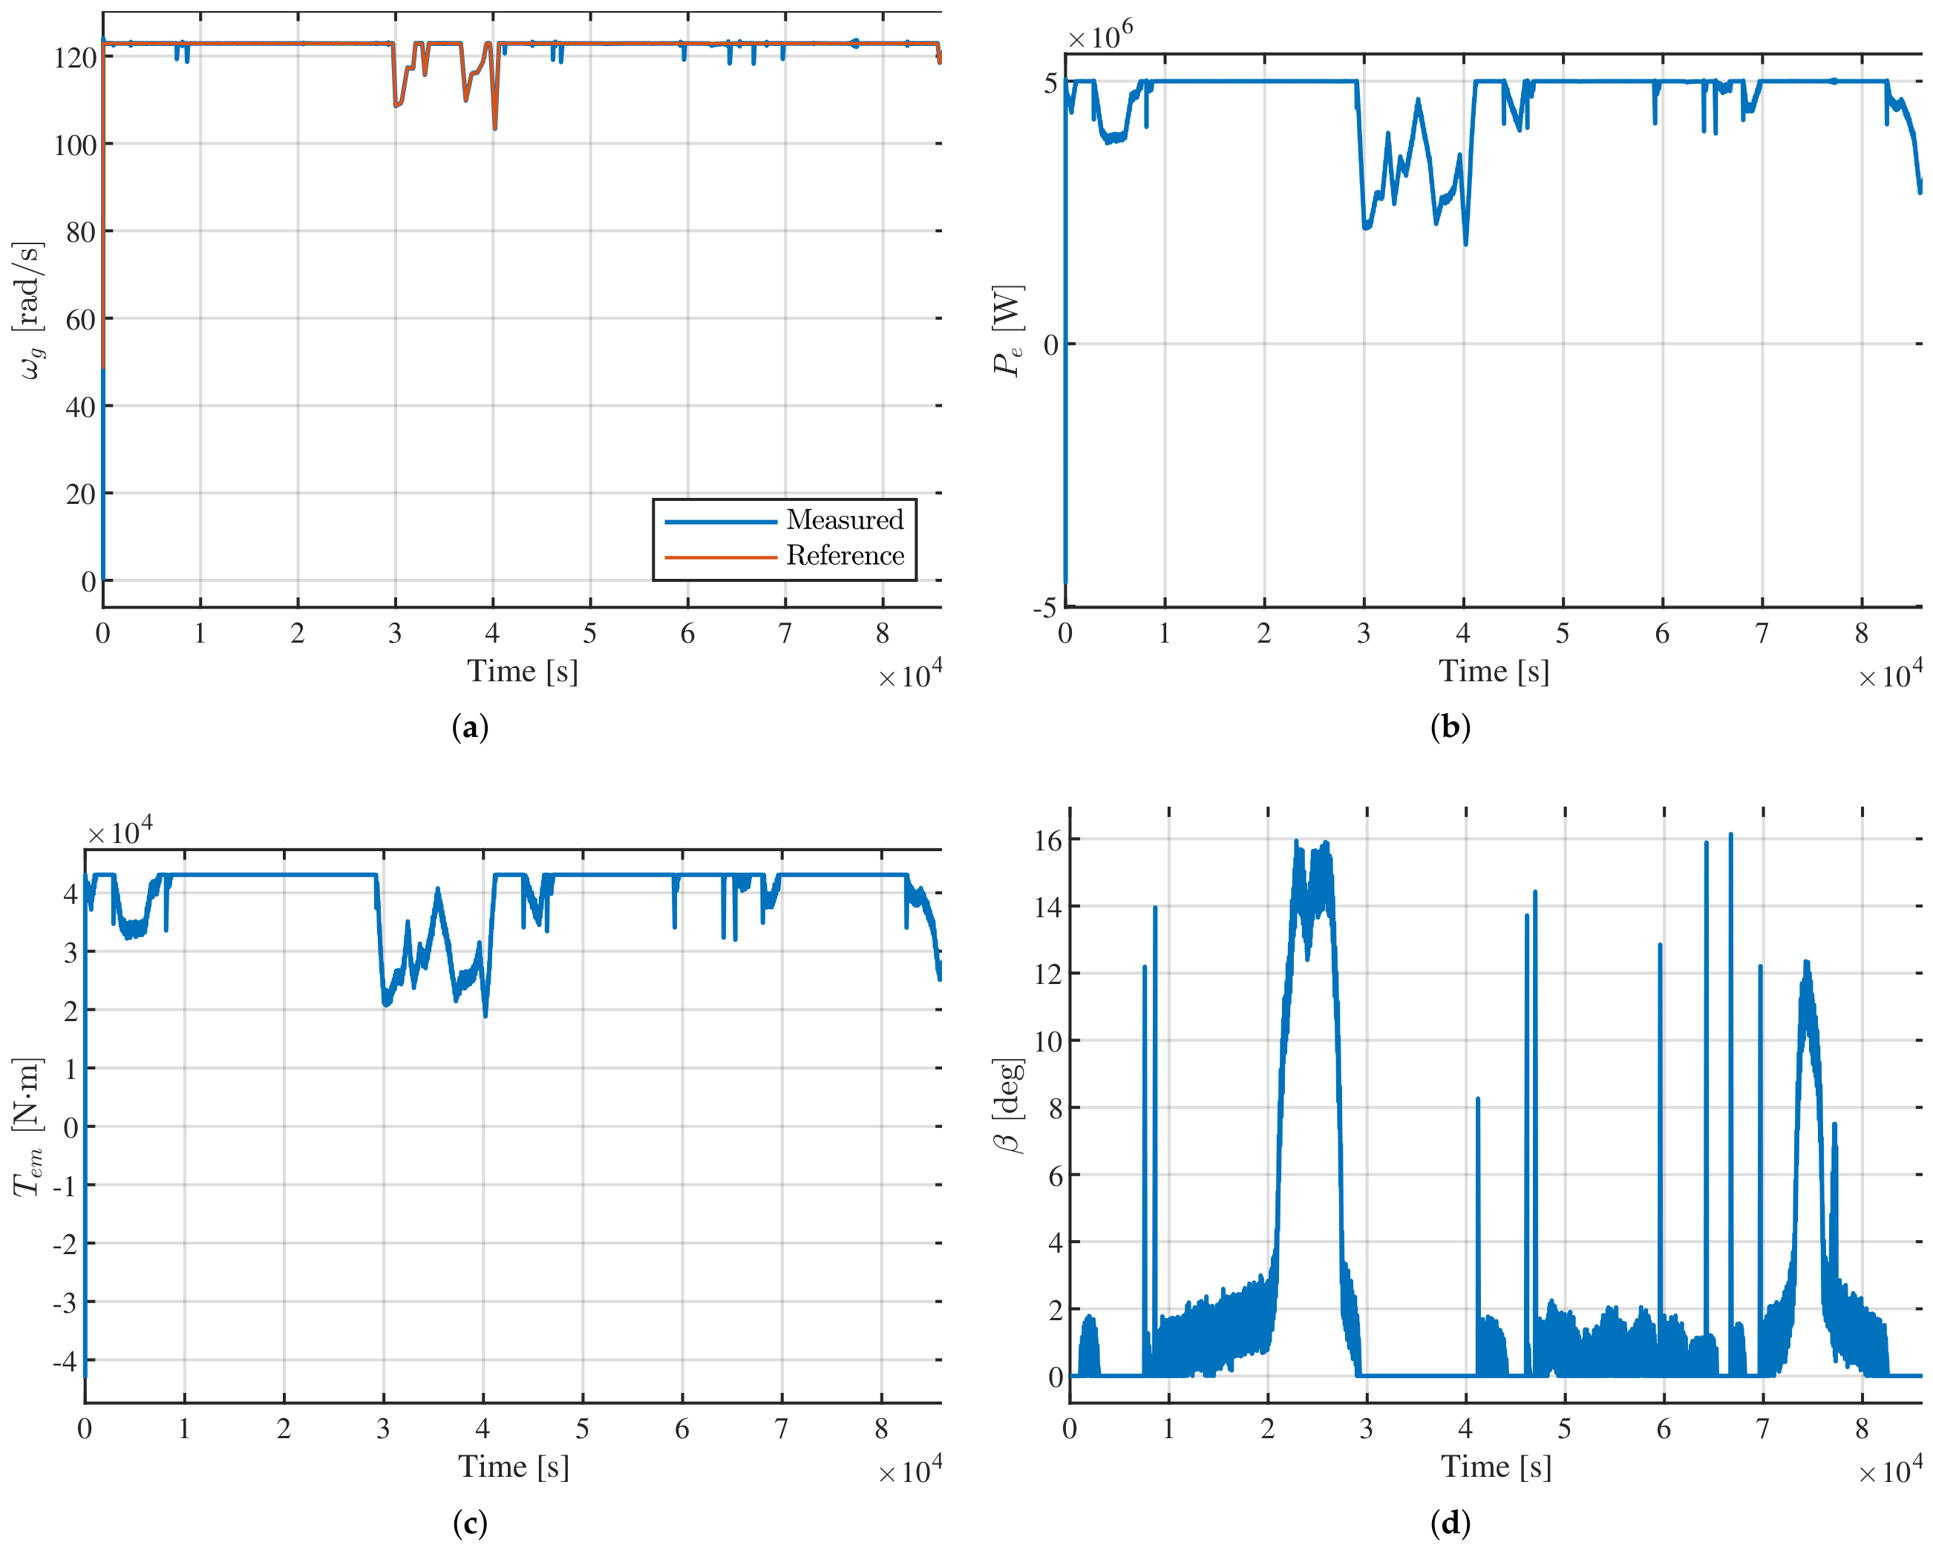
, outperforming the PIDA controllers that maintained satisfactory generalization behavior under the measured wind profile. Therefore, the PID controller is selected for operation in Region 2, while the DE-tuned PIDA controller selected for Region 3 is retained for above-rated operation. The generator-speed response and electrical-power output obtained with this combined control strategy are presented in
Figure 12a and
Figure 12b, respectively. The corresponding electromagnetic-torque and pitch-angle signals obtained with the selected DE-tuned controllers are shown in
Figure 12c and
Figure 12d, respectively. Compared with the previous cases, both control signals exhibit noticeably smoother behavior, which contributes to reducing the oscillations observed in the generator-speed and active-power responses.
With this combination of controllers, both Region 2 and Region 3 outperform the baseline controller, achieving improved reference tracking with reduced error. These results can be quantitatively assessed using integral performance indices, whose values are reported in
Table 10.
With the appropriate selection of controllers, the performance evaluated using real data corresponding to a full day of operation shows a significant improvement for the DE-based controllers. Specifically, these controllers achieve reductions of 96.7%, 95.8%, 98.1%, and 99.9% in the IAE, ISE, ITAE, and ITSE indices, respectively.
These results show that the benefits of the optimal DE-tuned controllers are not limited to improved tracking performance. The smoother control signals also contribute to a more stable active-power response and may reduce unnecessary mechanical stress on the drivetrain and pitch actuators. This highlights the importance of appropriate controller tuning in wind turbine applications, demonstrating that performance does not depend solely on using more complex controller structures, but also on selecting gain parameters that produce a balanced dynamic response.
In contrast to the results obtained under tuning conditions, the most suitable option for the partial-load region under a real wind profile, with the MPPT strategy active, is a well-tuned PID controller, owing to the relative simplicity of the system dynamics in this operating regime. On the other hand, Region 3 presents more complex dynamics, as discussed in
Section 6.2.2, where the PIDA architecture offers a clear advantage over the classical PID controller.
Accurate control of the generator angular speed results in a more stable active power output, since electrical power depends directly on generator speed. Accordingly, the active power dynamics closely follow those of the generator speed, as shown in
Figure 10b,
Figure 11b and
Figure 12b, highlighting the role of precise speed regulation in ensuring stable power generation under real operating conditions.
It should be noted that negative electrical power values appear during the initial transient, as the turbine temporarily draws energy from the grid to overcome inertial effects and initiate drivetrain rotation.
6.4. Robustness Evaluation Under Combined Non-Ideal Conditions
To complement the nominal validation based on the measured wind-speed profile, an additional robustness stress test was performed under a combined set of non-ideal operating conditions. The controller parameters obtained during the original DE tuning process were kept unchanged, such that the test evaluates the sensitivity of the previously tuned controllers rather than performing a new optimization.
A simultaneous parametric perturbation was introduced into the wind turbine model. The turbine and generator inertias were increased by 10%, the drivetrain stiffness and damping were reduced by 10%, and the natural frequency and damping ratio of the pitch actuator were reduced by 10%. In addition, the generator time constant was increased by 10% to represent a slower generator response.
Measurement uncertainty was introduced into the generator-speed feedback signal using a Band-Limited White Noise block with a noise power of and a sampling time of 0.1 s. The block default seed value of 23341 was retained to ensure reproducibility of the noise realization. The resulting measurement was processed by a first-order low-pass filter with a time constant of 0.5 s before being supplied to the controller. The same measured wind-speed profile employed in the nominal validation was retained so that changes in performance could be attributed to the introduced non-idealities rather than to variations in the wind excitation.
This combined scenario is not intended to represent a mathematically determined worst-case condition, but rather a deliberately challenging robustness stress test designed to assess whether the performance advantages observed under nominal simulation conditions are preserved when simultaneous model uncertainty and measurement disturbances are introduced.
The closed-loop responses obtained under the combined robustness stress-test scenario are shown in
Figure 13, while the corresponding integral performance indices are summarized in
Table 11. Despite the simultaneous introduction of parameter uncertainty and measurement disturbances, the closed-loop responses remained bounded throughout the complete real wind profile, although increased tracking deviations and control activity were observed relative to the nominal SCADA-based validation.
As expected, these non-ideal conditions degraded the performance of the DE-tuned control strategy. The IAE increased from 795.00 to 4147.00, corresponding to a 421.64% increase, while the ISE increased by 80.54%, from 8676.00 to 15,663.48. Greater relative increases were observed in the time-weighted indices, with the ITAE increasing by 739.85% and the ITSE by 11,361.47%.
The particularly large increase in ITSE indicates that persistent tracking deviations occurring at later stages of the wind profile are strongly penalized by the time-weighted squared-error formulation. Therefore, this increase should not be interpreted independently as an equivalent deterioration in the physical response of the turbine. In contrast, the considerably smaller increase in ISE indicates that the overall accumulated squared tracking error remains substantially less affected than suggested by the time-weighted metric.
Despite this degradation, the closed-loop response remained bounded throughout the complete measured wind-speed profile, demonstrating that the controller maintained stable operation under the simultaneous introduction of plant-parameter variations and noisy measurements. These results indicate that the performance gains obtained during nominal optimization are sensitive to non-ideal operating conditions, particularly when persistent errors are emphasized, while also showing that the DE-tuned controller retains closed-loop regulation capability without retuning.