1. Introduction
Coal self-heating in goaf zones is one of the most significant fire hazards in underground coal mining. The process results from the oxidation of residual coal in contact with oxygen transported by airflow migrating through the porous rock mass. This phenomenon may lead to spontaneous combustion, posing a serious threat to the safety of mining operations.
In the years 2020–2024, a total of 13 endogenous fires caused by spontaneous coal combustion occurred in underground coal mines in Poland, including five in active mining areas [
1]. These incidents directly affected the safety of mining personnel; in 2024 alone, 1166 miners were evacuated from operational areas, including 18 using self-rescue equipment. These data clearly demonstrate the importance of developing effective methods for preventing fire hazards associated with coal self-heating.
The mechanism of coal self-heating has been widely investigated in the literature [
2,
3,
4,
5,
6,
7]. The studies indicate that the process is governed by coupled phenomena, including gas flow through porous media, mass transport, chemical reactions, and heat accumulation [
8,
9,
10]. The oxidation of coal is a surface process whose intensity depends on temperature, oxygen availability, and the structure of the porous medium. The two gaseous components, CO and CO
2, produced as a result of the self-heating of coal, change the intensity of the gas flow in the open pores of the goaf layer due to the carbon they contain and thus their higher molar masses. The oxidation of hard coal is in fact a surface reaction. In many cases, computational fluid dynamics (CFD) methods have been applied to simulate the distribution of oxygen concentration, temperature, and gas composition in the goaf [
11,
12]. Recent studies have focused on the identification of spontaneous combustion zones, fire early-warning systems, and advanced numerical simulations of coupled gas flow and heat transfer processes in goaf environments [
13,
14]. Comprehensive reviews have also highlighted the growing importance of integrated modelling approaches for fire prevention and risk assessment in underground coal mines [
15]. These models provide valuable insights into the development of self-heating zones and fire risk; nonetheless, they have often been based on simplified assumptions, such as isothermal conditions (approximately 25 °C), steady-state airflow, and constant methane supply.
These models provide valuable insights into the development of self-heating zones and fire risk; nonetheless, they have often been based on simplified assumptions, such as isothermal conditions (approximately 25 °C), steady-state airflow and constant methane supply. In many cases, the permeability of the goaf has been assumed to be constant, which limits the ability of such models to accurately represent real mining conditions, where the permeability of the caving zone depends strongly on the geological composition and fragmentation of the rock mass [
16].
The aim of this study is to develop a mathematical model describing the initiation of fire in goaf zones resulting from coal self-heating under non-isothermal and transient conditions. The model accounts for airflow filtration, continuous methane emission, and the possibility of inertisation using nitrogen. In addition, it incorporates coupled chemical reactions and heat transfer processes occurring in both gas and solid phases. The present work extends the analysis to include non-isothermal conditions and chemical reactions. These processes involve heat generation and accumulation, as well as changes in gas composition over time in both the gas and solid phases. As temperature increases, the rate of oxidation of both carbon and methane intensifies, leading to an increased risk of fire development. The proposed mathematical model simulates the non-stationary process. The formulation requires the definition of initial conditions describing the spatial distribution of key physical fields, including pressure, temperature, molar concentrations, and gas velocity. The solution obtained in previous studies is used as the initial state for the simulations presented in this work [
2,
5,
17].
It should be emphasised that the permeability distribution used in the present model was determined based on in-situ mining data obtained in previous studies [
2,
5]. The porous-medium parameters used in the simulations, including the permeability distribution, are introduced as input data at the beginning of the computational procedure. Their determination is outside the scope of the present study, which focuses on the transient non-isothermal process of coal self-heating. Considerable progress has been made in the numerical modelling of gas flow and spontaneous coal combustion in longwall goaf areas, particularly using CFD-based approaches [
9,
12,
15,
18]. These studies have improved the understanding of coupled transport and reaction processes in porous mining environments. However, many existing models employ simplified permeability distributions and do not explicitly represent spatial variability derived from field data.
From a thermal engineering perspective, coal self-heating in a goaf represents a transient reactive heat and mass transfer problem in a heterogeneous porous medium. Heat generation due to chemical reactions, conductive and convective heat transport, species transport, gas filtration, and heat exchange between the gas and solid phases are strongly coupled. Consequently, predicting the development of local temperature increases requires the simultaneous solution of the governing thermal, flow, species transport, and reaction equations.
Although substantial progress has been achieved in modelling spontaneous combustion in goaf areas, there remains a need for numerical approaches that simultaneously account for transient gas flow, non-isothermal heat transfer, coupled heterogeneous and homogeneous chemical reactions, and spatially variable permeability derived from in-situ data. The present study addresses this need by developing a coupled mathematical model of heat and mass transfer in a reactive porous medium representing a longwall goaf.
The principal contribution of this work is the simultaneous prediction of gas- and solid-phase temperature fields, gas composition, pressure, and gas velocity under transient operating conditions. In contrast to approaches based on uniform permeability distributions, the present model incorporates spatially variable permeability reflecting the geological composition and fragmentation of the caving zone [
2,
5,
16,
19]. The model is applied to U-type and Y-type ventilation configurations to analyse how different flow conditions affect oxygen transport, heat generation, temperature development, and the spatial evolution of zones susceptible to coal self-heating.
Although the model was developed specifically for longwall goaf environments, the mathematical formulation represents a more general class of coupled heat and mass transfer problems in reactive porous media. In contrast to general-purpose commercial simulation software, the present formulation is specifically tailored to the coupled processes governing coal self-heating in a heterogeneous goaf, including gas filtration, species transport, heat transfer, heterogeneous coal oxidation, and homogeneous gas-phase reactions. Application to other coal-bearing porous systems would require appropriate modification of the geometry, permeability distribution, initial conditions, and boundary conditions.
2. Description of the Mathematical Model
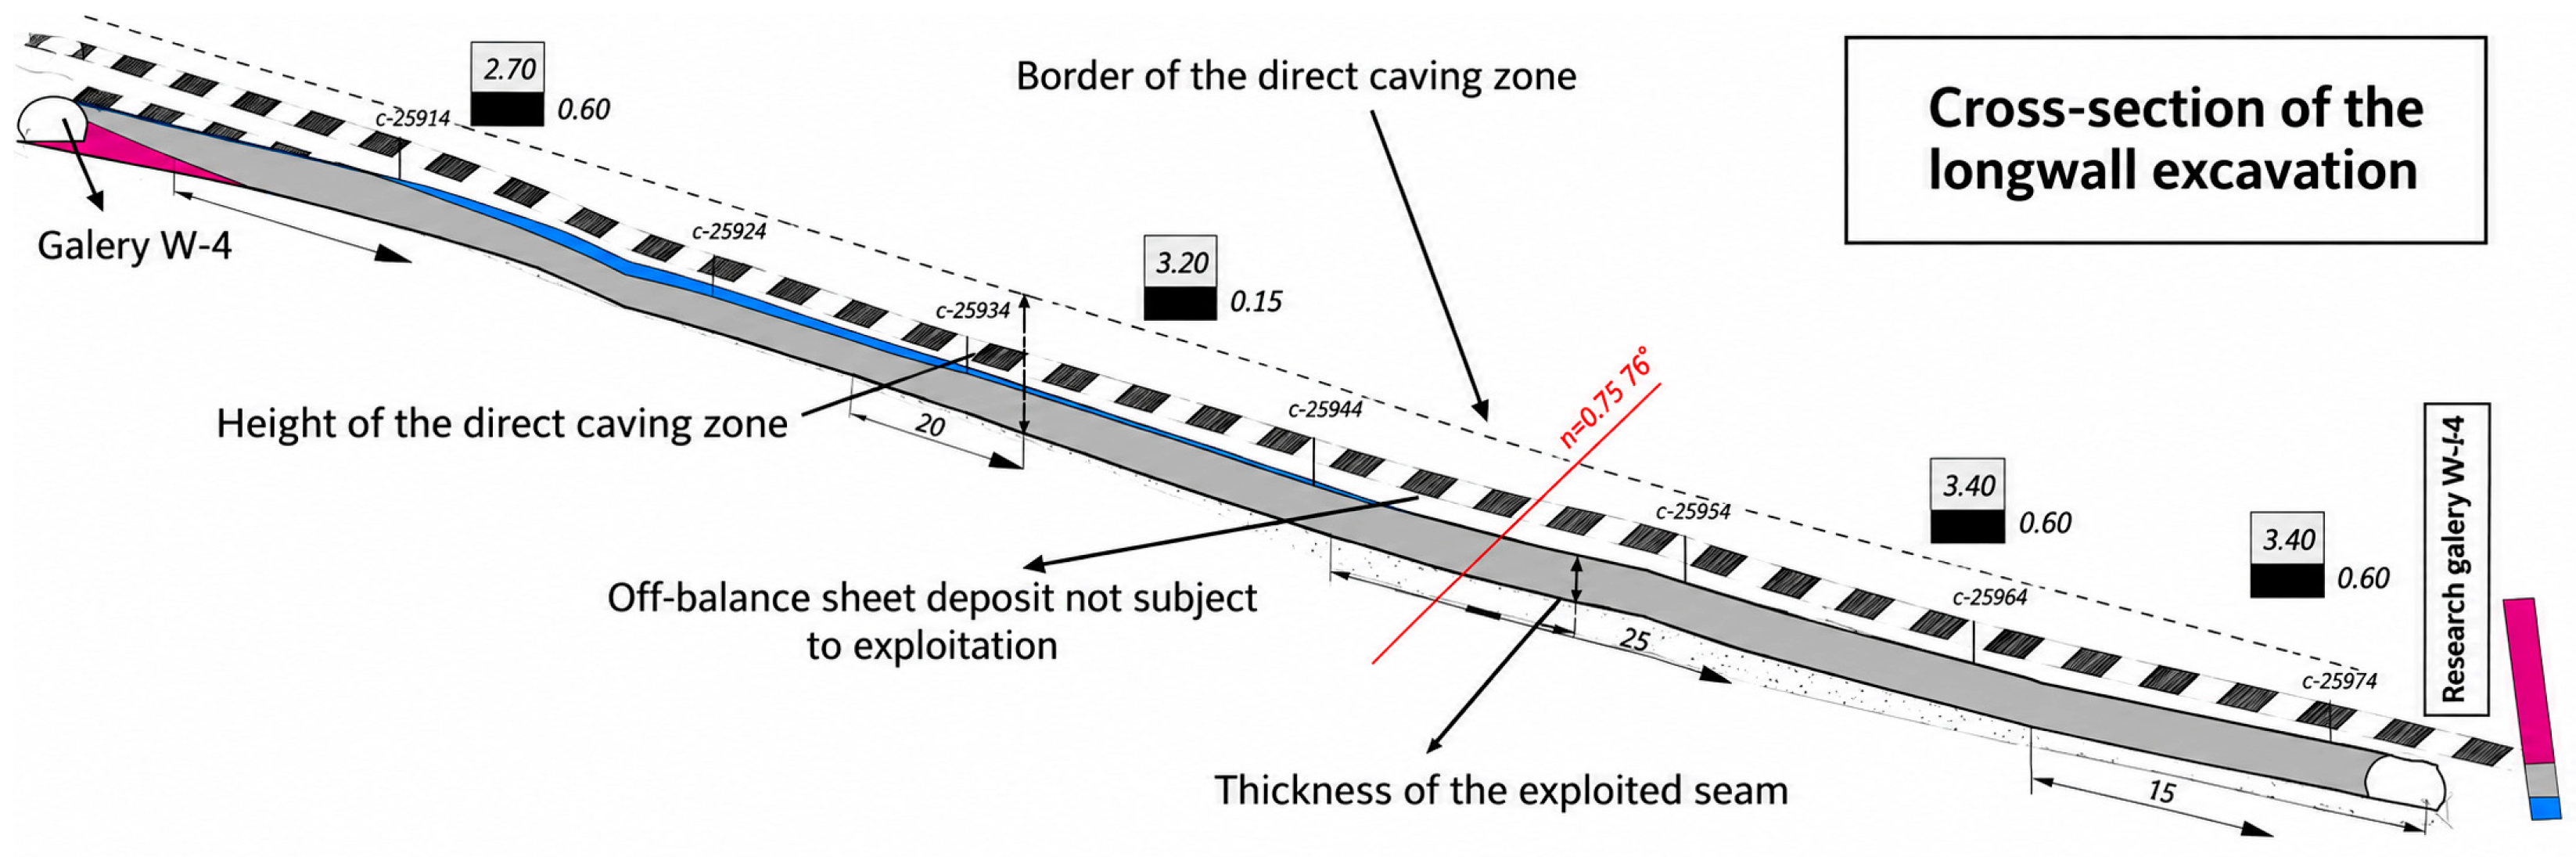
The system under consideration represents a rectangular domain corresponding to the direct caving zone (goaf) formed during longwall coal extraction with roof caving. During the extraction process, the direct caving zone develops above the mined seam. Its thickness is typically about 3–4 times the thickness of the extracted coal seam (
Figure 1). This zone is characterized by air flow through the collapsed rock mass, which may promote oxidation of residual coal and a subsequent increase in temperature. A layer of out-of-balance coal remaining within the direct caving zone may therefore undergo self-heating due to oxygen ingress.
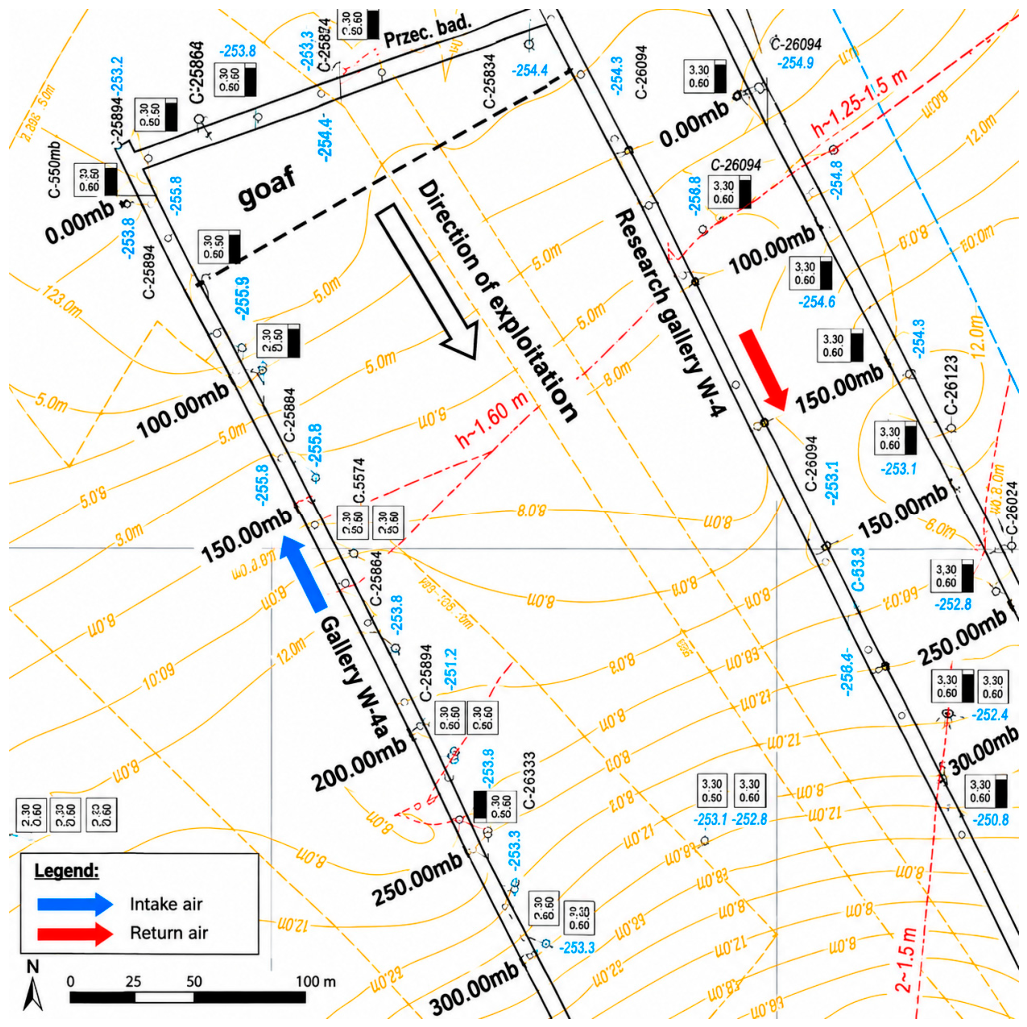
The characteristic horizontal dimensions of the analysed domain range from 200 to 600 m. Part of its boundaries is adjacent to ventilation galleries, through which airflow generated by the main ventilation system is transported, while the remaining boundaries are in contact with the undisturbed rock mass (
Figure 2). The airflow within the galleries induces gas filtration through the collapsed rock mass containing residual coal from the mining process.
For a coal seam with a thickness of 2.0 m, the actual average height of the direct caving zone considered in the present analysis is
H = 7 m. This height is relatively small compared with the horizontal dimensions of the analysed domain. Therefore, the problem is treated as two-dimensional, and variations in the analysed quantities along the vertical direction, i.e., along the goaf height
H, are neglected. Two-dimensional approaches have also been successfully applied to similar problems reported in the literature [
20,
21,
22].
2.1. Physical Domain and Model Assumptions
The goaf is treated as a heterogeneous porous system consisting of rock fragments of various sizes containing residual carbon and a gas phase filling the pore space. At the initial stage of the process, the gas phase consists of ventilation air and methane released from the surrounding rock mass. As the gas mixture filters through the goaf, oxygen reacts with carbon present in the solid phase. This heterogeneous exothermic surface reaction changes the gas composition and causes local heat generation, which may lead to progressive self-heating.
The model considers two interacting phases: a solid phase consisting of rock fragments containing carbon and an interconnected gas phase. Carbon oxidation occurs at the surface of the solid particles, whereas the combustion of carbon monoxide and methane is treated as a homogeneous gas-phase process. At elevated temperatures, these additional gas-phase reactions can substantially increase heat generation and may result in rapid temperature growth, thereby increasing the risk of fire and explosion.
For modelling purposes, the solid phase is represented by loosely packed spherical particles with a representative diameter, d, which is used as an input parameter of the calculation procedure. Each particle is assumed to have a homogeneous composition consisting of carbon and inert mineral matter. Although the actual particle-size distribution within the goaf is heterogeneous, a representative particle diameter is adopted to simplify the calculations while retaining the surface character of the oxidation process.
Due to the assumed point contacts between neighbouring particles, direct heat and mass exchange between the solid particles is neglected. Heat and mass transfer between the two phases therefore occurs through the particle surfaces. The gas in the immediate vicinity of each particle is assumed to be locally homogeneous with respect to temperature and composition. This assumption allows heat transfer within an individual particle to be described using spherical coordinates.
The open porosity of the goaf is estimated using the Blake–Kozeny relationship [
23], which relates permeability to porosity. The spatial distribution of permeability used in the present calculations was determined in previous studies [
2,
3,
5,
19] and is introduced here as an input field,
. The determination of this permeability distribution is outside the scope of the present study, which focuses on the coupled heat and mass transfer processes associated with coal self-heating. The corresponding local porosity values are obtained by numerical inversion of the Blake–Kozeny relationship. The resulting porosity distribution is subsequently used to determine the surface development coefficient required in the formulation of the oxidation and heat-transfer processes:
The gas phase consists of six components: nitrogen (N
2), oxygen (O
2), carbon monoxide (CO), carbon dioxide (CO
2), water vapour (H
2O), and methane (CH
4). The composition of the gas mixture is described using the mass fractions, which satisfy:
where the components are numbered as follows: N
2 (
i = 1), O
2 (
i = 2), CO (
i = 3), CO
2 (
i = 4), H
2O (
i = 5), and CH
4 (
i = 6). The corresponding molar masses are used to calculate the molar concentrations of the individual components:
The density of the gas mixture is calculated from the ideal-gas equation:
The total local pressure is expressed as the sum of the atmospheric pressure
p0, which is assumed to be approximately constant in the mining area, and the pressure differential
p* generated by the ventilation system. The pressure differential constitutes the driving force for gas flow through the ventilation galleries and the goaf. Its value decreases to zero along the galleries, where the gas mixture leaves the analysed area. Its highest value is reached at the inlet cross-section of the gallery. The molar fractions of the individual components are defined as:
The dynamic viscosity of the gas mixture is calculated using Wilke’s method [
23], accounting for the contribution of the individual gas components.
The model considers three main irreversible reactions associated with coal oxidation and subsequent gas-phase combustion in the goaf:
- (A)
carbon oxidation, treated as a heterogeneous surface reaction;
- (B)
carbon monoxide combustion, treated as a homogeneous gas-phase reaction;
- (C)
methane combustion, treated as a homogeneous gas-phase reaction .
Due to oxygen deficiency in the goaf, carbon oxidation is assumed to result primarily in the formation of carbon monoxide. According to Cygankiewicz [
24], the oxidation process is divided into three temperature-dependent stages: preliminary self-heating, accelerated self-heating, and proper combustion. The corresponding transition temperatures adopted in the present model are
T0 = 298.0 K,
TKr = 360.0 K, and
Tsp = 600 K.
The kinetics of carbon oxidation are described using the generalized Arrhenius-type relationship proposed by Cygankiewicz [
24]:
where the reaction rate constant
is defined according to:
The kinetic parameters reported by Cygankiewicz [
24] for the three temperature ranges are adopted as input data in the present model. To account for the heterogeneous nature of reaction (A), the kinetic expression is reformulated for the outer surfaces of the spherical particles representing the goaf. The reaction rate is additionally related to the local carbon content of the solid phase:
where the surface development coefficient
is based on the experimental data reported by Cygankiewicz [
24], while (
f) denotes the mass fraction of carbon in the solid material and (
α) is the empirical reaction—order exponent with respect to carbon content. In the present study,
α = 1. The carbon mass fraction is assumed to vary with time within each particle while remaining spatially uniform inside an individual particle. Its decrease represents progressive carbon consumption during oxidation and results in a corresponding reduction in particle mass.
Taking into account the stoichiometry of reaction (A), the rate of carbon consumption is described by:
Equation (9) provides the temporal evolution of the carbon mass fraction and is solved together with the remaining governing equations to obtain its spatial and temporal distribution within the goaf.
Reactions (B) and (C) occur exclusively in the gas phase when the local temperature and reactant concentrations are sufficiently high. Their rates are described by Arrhenius-type relationships:
In the numerical implementation, the reaction-rate expressions are converted from molar concentrations to gas-phase mass fractions using Equation (3), together with the local gas density. The resulting expressions are used directly in the species and energy balances.
2.2. Mass Exchange During the Oxidation Process
In addition to gas filtration and the chemical reactions considered in the model, mass exchange within the goaf includes internal sources associated with methane inflow from the surrounding rock mass and carbon monoxide generation as a product of reaction (A). These components are introduced into the gas mixture in their pure form and modify both the local gas composition and the filtration flow.
Methane emission from the surrounding rock mass is treated as a continuous source. Its volumetric intensity
is determined from technological data and is assumed to remain constant throughout the simulated period. The methane source is defined as:
where the density of pure methane under standard conditions (
), i.e., at a temperature of
T0 and total pressure
p0, is determined using Equation (4) adapted for a single-component gas.
Carbon monoxide is introduced into the gas phase as a product of reaction (A). Based on the stoichiometry of this reaction, its mass source is defined as:
The methane and carbon monoxide source terms are treated as internal mass sources supplying the gas mixture flowing through the goaf. Their contribution to the mass fraction of the component is described by:
where the source term represents the mass supplied per unit volume and time, while the composition of the supplied gas is taken into account. In limiting cases, the supplied medium may consist of a pure component, for which
), or may not contain the considered component, for which (
2.3. Gas Flow and Species Transport
The transport of the gas mixture components during the fire process is described by a system of coupled partial differential equations supplemented by appropriate boundary conditions. These conditions are defined at the interfaces between the goaf and the surrounding rock mass, as well as along the vertical surfaces of the ventilation galleries through which air flows. The governing equations are coupled with the energy balance equations used to determine the temperature field within the goaf. All equations are therefore strongly coupled, resulting in a nonlinear problem.
The mathematical model is formulated in the two-dimensional Cartesian coordinate system (X, Y), where the X—coordinate is perpendicular to the longwall face and the Y—coordinate is aligned with the direction of coal seam extraction. The mass transport equations are presented below, followed by the energy balance equations describing the temperature field.
2.3.1. Filtration Equation
Gas flow through the goaf is described by a filtration equation obtained by combining Darcy’s law with the continuity equation and accounting for the total internal mass sources (
. Assuming quasi-stationarity of the gas density, the governing equation for the pressure field is:
where
,
and the coordinates of the Cartesian system satisfy the following ranges:
and
.
The formulation of Equation (15) assumes quasi-stationarity of the gas density. This assumption is justified by the relatively short relaxation time of the gas density compared with the characteristic time scale of the self-heating process. Consequently, the accumulation term is neglected and the resulting equation has an elliptic form [
5].
The total internal mass source (
is defined as the sum of methane inflow and carbon monoxide generation:
where the CO source represents the net mass contribution associated with reaction (A). Based on the pressure field obtained from Equation (15), the components of the gas velocity vector are calculated using Darcy’s law:
The resulting velocity field is used to determine the convective transport of the individual gas components.
2.3.2. Convection–Diffusion Transport Equations
In order to determine the time-dependent mass fraction fields of the individual components in the gas mixture, the components of the mass flux density vector are defined in the Cartesian coordinate system:
where the first term represents convective transport and the second term describes diffusive transport according to Fick’s law. The inclusion of porosity accounts for the heterogeneous structure of the goaf. The convective component is determined from the gas velocity obtained from Equation (17), whereas the diffusive component depends on the gradient of the corresponding species mass fraction.
To determine the changes in the composition of the gas mixture within the goaf, the contribution of the internal mass sources must be taken into account. As discussed above, these sources include methane inflow from the surrounding rock mass and carbon monoxide generation at the surface of the solid particles as a product of reaction (A), as described by Equations (12) and (13). The total source terms (Si) for the N − 1 gas components are defined separately for each component of the gas mixture.
Oxygen (O2) is a reactive component involved in all three reactions, (A), (B), and (C), and is therefore consumed during the oxidation and combustion processes. In addition, its mass fraction is affected by dilution associated with the internal inflow of methane and carbon monoxide. Its total source term is therefore given by:
Carbon monoxide (CO) is generated as a product of reaction (A) at the surface of the solid particles and is introduced into the gas phase. It is subsequently transported with the gas mixture and acts as a reactant in reaction (B). Taking into account Equation (14), its total source term is defined as:
The expression defined by Equation (9) is used to formulate the mass balance for each component separately. In the case of carbon monoxide and methane, their concentrations increase due to the corresponding internal source terms, whereas the mass fractions of the remaining components decrease accordingly to satisfy the overall mass balance. For the gas-phase reactions (B) and (C), no additional external mass source term is introduced , as these reactions satisfy the principle of mass conservation.
To determine the time-dependent mass fraction fields (
) of all gas components, a system of coupled convection–diffusion equations is solved. The governing equations are derived from the mass balance of each component over a differential control volume of dimensions
dxdy and unit thickness (1 m for the differential time
). The mass flux densities of components across the boundaries of the control volume are determined using Equation (18), together with the corresponding source term (
Si). The resulting general form of the governing equation is:
where
i = 1, 2, …,
N − 1.
The above equation is written in a simplified form based on the assumptions of quasi-stationary gas density and Darcy-type flow through the porous medium. Under these assumptions, the conservative form of the species transport equation can be expressed in terms of mass fractions.
Methane is treated in the model as a complementary component of the gas mixture. Therefore, its mass fraction in both the goaf and the ventilation galleries is determined from Equation (2), based on the mass fractions of the remaining gas components. Accordingly, the methane mass fraction is obtained from the following relationship:
The system of differential equations describing mass exchange and transport during the fire process is supplemented by Equation (9), which describes the rate of carbon consumption within the spherical particles. However, these equations alone are not sufficient to describe the fire initiation process, because the reaction rates depend strongly on temperature. It is therefore necessary to determine the temperature fields in both the solid phase and the filtering gas. As the temperature increases during self-heating, the rates of the oxidation reactions increase, resulting in a strong thermal–chemical feedback.
2.4. Heat Exchange and Transport During a Fire
The increase in temperature within the goaf is caused by the exothermic chemical reactions (A), (B), and (C). These reactions are accompanied by heat release, the intensity of which depends on their respective reaction rates. Therefore, the corresponding thermal effects must be quantified using appropriate thermochemical data. For this purpose, the local enthalpy change under isobaric conditions is defined for each reacting component. Nitrogen (N
2) is excluded from this analysis because it is chemically inert and does not participate in reactions (A), (B), or (C). The enthalpy changes of the gaseous components and carbon in the solid phase are expressed as:
where (
Ci) denotes the molar heat capacity of component
i for p =
p0 =
idem,
T0 = 298 K is the initial temperature, and
T is the local temperature during the self-heating process. These temperatures correspond to the initial and current thermodynamic states, respectively. The formation of enthalpy term
applies only to chemical compounds (CO, CO
2, H
2O, and CH
4), whereas for elements such as carbon and oxygen, its value is taken as zero (
). The integral term in Equation (26) accounts for the temperature dependence of the molar heat capacity. This dependence is commonly approximated using the Kelley equation, which can be simplified to a linear function over a limited temperature range [
25]. Under this assumption, the integral in Equation (26) is evaluated using the average molar heat capacity (
) over the considered temperature interval. Based on the molar heat capacities of the individual components, the local specific heat capacity of the gas mixture is determined from:
The average specific heat over a given temperature interval is denoted by an overbar. For an individual component, it is expressed as , whereas for the gas mixture it is denoted as . These quantities are used in the numerical algorithm.
The thermal effects associated with reactions (A), (B), and (C), conventionally expressed per mole of the reacting substrate, are determined using Kirchhoff’s law based on the enthalpy changes defined in Equation (26). For the reactions considered in the present model, these effects are obtained from the following balance relations:
It should be noted that, according to Equation (26), thermochemical effects associated with possible phase transitions are negligible for most components involved in the oxidation process. In particular, no phase transitions occur for nitrogen and the majority of reacting species. An exception is methane combustion, for which water vapour (H2O) may undergo condensation at temperatures of approximately 373 K, releasing additional heat. However, this process occurs outside the fire zone, during the cooling of exhaust gases, and therefore does not affect the temperature field within the goaf. Accordingly, the thermal effect of combustion is interpreted in terms of the corresponding calorific value.
Based on the above considerations, the temperature field within the goaf is assumed to be generated exclusively by internal heat sources associated with the exothermic reactions (A), (B), and (C). Reaction (A) occurs at the surface of the coal-containing particles; therefore, its corresponding heat source is also of a surface nature. Assuming local homogeneity of the gas phase in the vicinity of each particle, the temperature at the particle surface is considered uniform. At the initial stage of self-heating, the temperatures of the gas and solid phases are assumed to be equal. As the exothermic reactions proceed, heat is released within the coal-containing particles and transferred to the surrounding gas. This results in a temperature difference between the solid and gas phases, which drives convective heat exchange between them. The heat flux between the solid particles and the gas is described using a convective heat-transfer coefficient,
as−g, and is expressed as:
where
Ts(
r,
x,
y) denotes the temperature distribution within a spherical particle as a function of the radial coordinate
x,
y, while
Tg(
x,
y) represents the temperature field of the gas phase within the goaf. The value of the parameter
as−g is determined using the Froessling correlation [
20], which relates the Nusselt number to the Reynolds and Prandtl numbers. Since the Reynolds number depends on the local gas velocity, the heat-transfer coefficient is evaluated at each point of the flow domain. The detailed numerical procedure used to calculate the local values of
as−g is not presented here because of its complexity.
In the gas phase, additional internal heat sources are generated by the exothermic reactions (B) and (C). The intensity of these sources is proportional to the rates of carbon monoxide and methane combustion. Using Equations (10) and (11), the total heat source term is expressed as:
where the values of the thermal effects
QB and
QC are determined based on Equations (29) and (30).
The energy balance of the gas phase is additionally affected by mass sources associated with methane inflow and carbon monoxide generation as a product of reaction (A). These processes introduce additional enthalpy fluxes into the gas mixture and therefore affect both its thermal state and mass flux. The total mass flux considered in this contribution consists of methane (CH
4) originating from the surrounding rock mass and carbon monoxide (CO) generated at the surface of the solid particles as a result of heterogeneous reaction (A). Methane entering the goaf from the surrounding rock mass is assumed to have a constant initial temperature (
T0). In contrast, the temperature of carbon monoxide is assumed to correspond to the local surface temperature of the particles, which varies in space and time as reaction (A) progresses. The resulting heat source term associated with these mass sources is expressed as:
where the molar heat capacities of carbon monoxide and methane are taken as average values over the temperature intervals specified in square brackets. The second term in Equation (33) is non-positive throughout the process because the corresponding temperature difference is negative (
Tg ≥
T0). Consequently, the inflow of methane from the surrounding rock mass has a cooling effect on the gas mixture.
The total heat source in the gas phase within the goaf is obtained as the sum of the contributions defined by Equations (31)–(33). Therefore, the overall heat source term is expressed as:
To derive the governing equation for the transient temperature field in the gas phase, (
Tg(
x,
y,
t)), the components of the heat-flux density vector must first be defined. Similarly to the mass transport model given by Equation (18), the heat flux is expressed as the sum of convective and conductive contributions, with the latter described by Fourier’s law. The corresponding expressions are
where
—thermal conductivity coefficient of the gas mixture.
The heat transport equation is derived analogously to the mass transport equation from the energy balance over a differential control volume of dimensions (
Hdxdy). The resulting governing equation is:
where (
Tg(
x,
y,
t) denotes the transient temperature field in the gas phase within the porous space of the goaf, and (0
x X) and (0
y Y) are the spatial coordinates, and (
t 0) denotes the time elapsed since the onset of the self-heating process. The total heat source term is defined by Equation (34).
Within the spherical solid particles, heat transfer occurs exclusively by conduction. Based on the assumption of local homogeneity of the gas temperature in the vicinity of each particle and uniform thermophysical properties within the solid phase, the temperature field inside each particle is assumed to be radially symmetric. The heat-conduction equation can therefore be formulated in spherical coordinates as:
where (
r) is the radial coordinate,
Ts(
r,
x,
y,
t) denotes the temperature distribution within a spherical particle at a given time and spatial location in the goaf, and (
f0 =
f(
x,
y, 0)) is the initial mass fraction of carbon in the solid phase. The factor (1 −
f0 +
f) introduced in Equation (37) accounts for the change in the effective heat capacity of the solid phase resulting from progressive carbon consumption during self-heating. As the carbon content decreases, the thermophysical properties of the material change, which is reflected in the modified transient term. The thermal diffusivity (
) is defined as
where (
) denote the thermal conductivity, (
) density, and (
) specific heat capacity of the solid phase, respectively. Changes in thermal conductivity resulting from carbon consumption are neglected. The boundary conditions for the temperature field inside the spherical particles are defined at the particle centre and at the particle surface. At the centre of the particle, symmetry requires the radial temperature gradient to vanish:
Using Equations (1), (6)–(8) and (21), a boundary condition can be formulated to define the heat flux at the outer surface of a spherical particle. This condition simultaneously accounts for heat generation due to the surface reaction, heat conduction within the particle, and heat exchange with the surrounding gas phase. The corresponding boundary condition is expressed as follows:
The last term on the left-hand side of Equation (39) represents the rate of heat release per unit surface area of a spherical particle associated with carbon oxidation in the solid phase (reaction (A)), i.e., the surface heat source. The remaining terms describe the distribution of the released heat between the interior of the particle, through heat conduction according to Fourier’s law, and the surrounding gas phase, through heat transfer according to Newton’s law. It is assumed that the temperature field is homogeneous over the total surface area of the particles within a unit volume assigned to a given point in the computational domain. A similar assumption is adopted for the gas phase. Consequently, a temperature difference develops between the solid and gas phases during the self-heating process, driving heat exchange between them. Locally, this heat transfer may be very intense. The system of governing equations, including Equations (9), (15) and (34), together with Equations (19) and (24), which define the methane mass fraction, describes the coupled physical fields within the goaf: and .
The formulated transient problem requires both initial and boundary conditions to obtain a unique physically relevant solution. The initial condition has already been discussed in
Section 1. The boundary conditions are defined along the regions of airflow in the ventilation galleries adjacent to the goaf and are therefore relatively complex. Their formulation requires the specification of pressure, gas-component mass fractions, and temperature distributions along the coordinate axis parallel to the galleries. For this reason, the boundary conditions are presented in detail in
Section 3.
3. Mass and Heat Transport in the Gallery Space, Boundary Conditions, and Summary of the Mathematical Model
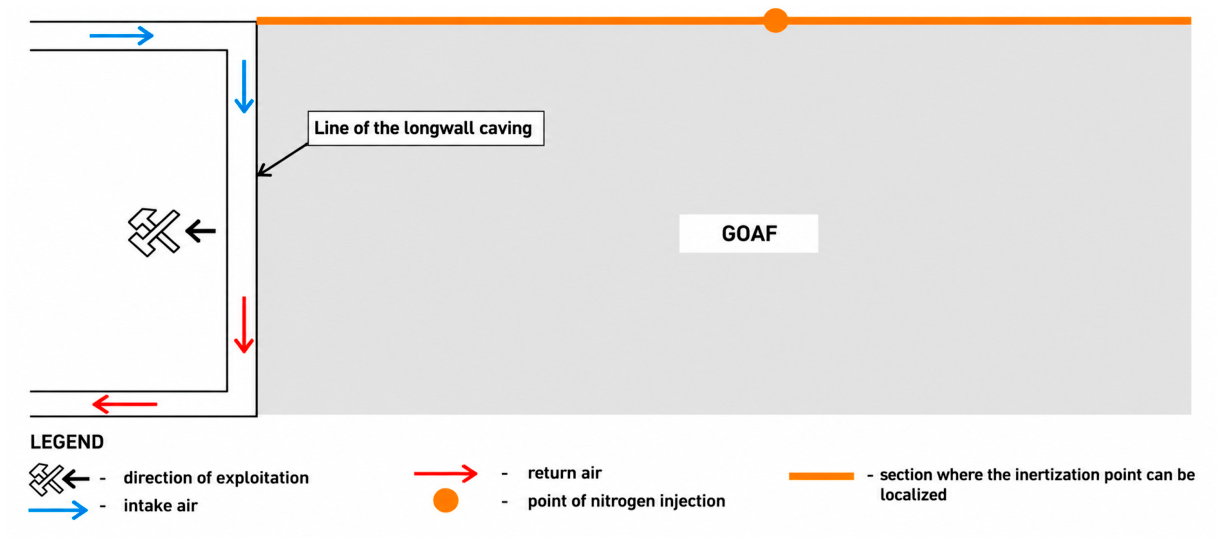
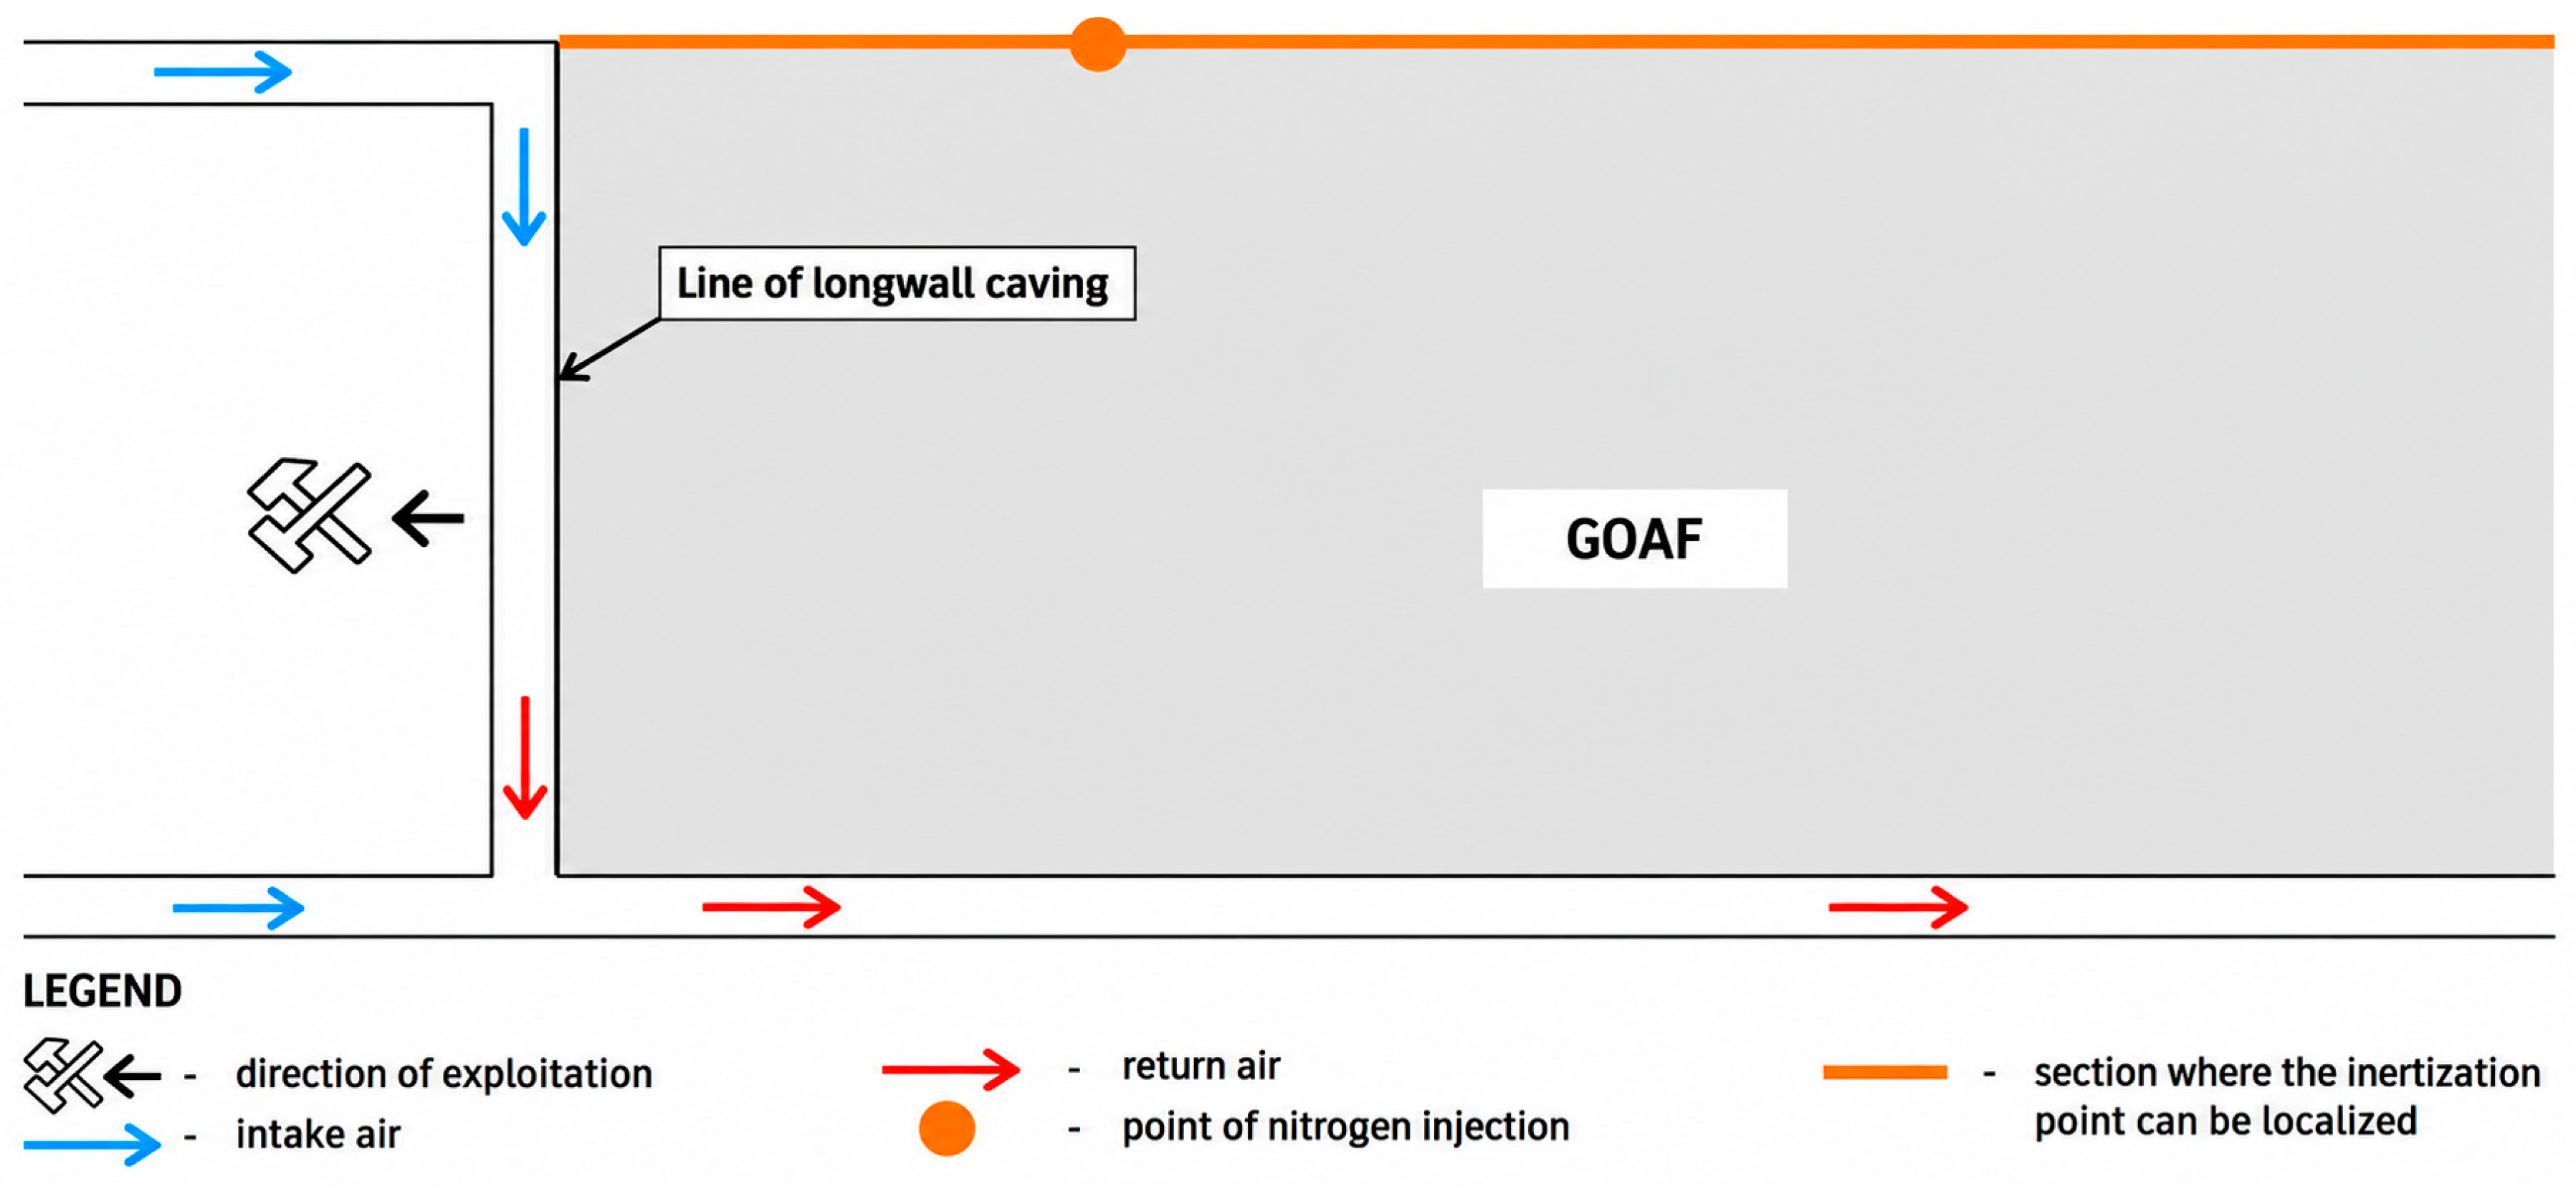
This study presents a numerical simulation of the self-heating process of coal residues induced by air penetration into a rectangular region of a mine goaf. The analysed domain is bounded by four sides, some of which are adjacent to ventilation galleries through which air flows, while the remaining boundaries are in contact with the surrounding unmined rock mass. The simulations consider two ventilation system configurations (
Figure 3 and
Figure 4). In the first configuration, the analysed region is separated from the longwall face by a single gallery of width (
dy) (
Figure 3). The right boundary of the region, corresponding to the longwall front, coincides with the (
Oy) axis of the Cartesian coordinate system. The domain extends along this boundary over the interval (
x = 0
y ), where (
Y) is the width of the goaf corresponding to the longwall length. Air enters the gallery at (
y = 0), uniformly across the inlet cross-section, and leaves the analysed domain at the opposite end of the gallery, at point (
x = 0,
y =
Y). In this configuration, only the boundary parallel to the longwall is in direct contact with the flowing air.
In the second configuration (
Figure 4), two galleries intersect at right angles at the junction point. The width of the second gallery is denoted by
dx (usually
dx dy). At the intersection, two air streams merge, one of which originates from the longwall face. Their volumetric flow rates may differ and combine at the junction to form a single airflow. The resulting air stream, containing methane released from the rock mass and gaseous products of reactions (A), (B), and (C), is directed towards the outlet gallery. According to the model assumptions, the outlet is located at the corner of the analysed domain, at (
x =
X,
y = 0), where (
X) denotes the length of the goaf region.
Airflow along the galleries is fully forced, as it is generated by the main ventilation system. These flows induce air filtration into the goaf, which in turn promotes the self-heating of coal residues and increases the associated fire hazard. The airflow in the galleries provides the basis for defining the boundary conditions for the governing Equations (10), (15), (19), (24), (30) and (34), which describe mass and heat transport within the goaf. To determine these boundary conditions, additional equations are introduced to describe the pressure, mass fractions of the gas components, and temperature of the airflow within the galleries.
Owing to the predominantly one-dimensional nature of the airflow in the galleries, a numerical coordinate (O) is introduced along the direction of airflow. In the first configuration, this coordinate coincides with the axis (Oy) along the gallery adjacent to the goaf and varies over the interval (0 Y). In the second configuration, because the galleries intersect at a right angle, the coordinate (O) is defined piecewise along the airflow path. Its direction changes at the junction point (x = 0, y = Y), where the galleries intersect, while the coordinate remains continuous along the flow path. After the change in direction, the coordinate spans the interval (Y X + Y).
In contrast to the filtration flow within the goaf, the physical fields describing the airflow in the galleries can be considered predominantly one-dimensional. However, the airflow is accompanied by turbulence, which causes fluctuations in velocity and temperature. Turbulent diffusion therefore constitutes an important mechanism of momentum and heat transport along the airflow path. Similarly to the goaf region, solving the governing equations for momentum, mass, and heat transport in the galleries provides the transient distributions of the following quantities, denoted by the subscript (), to indicate the gallery atmosphere:
- ✓
air pressure differential (),
- ✓
mass fractions of individual gas components (),
- ✓
gas temperature ()
The pressure field in the galleries, (
(
,
t)) is described by a differential equation analogous to Equation (10), but formulated with respect to the one-dimensional coordinate (
):
where
E is equivalent to the permeability coefficients
Kx and
Ky, corresponding to those in Equation (15), and
is the local density of the gas mixture in the gallery.
Mass and heat transport in the galleries, where forced convection is the dominant transport mechanism, are described by a system of ordinary differential equations for the dependent variables as functions of the coordinate (
), and time (
t).
The gas velocity used in these equations represents the cross-sectional average (superficial) linear velocity of the flowing medium.
The source terms appearing in Equations (41)–(43) provide the coupling between the processes occurring within the goaf and the airflow in the galleries. They represent the exchange of mass and heat between the two regions and are defined at the interface between the goaf and the galleries. To formulate these terms, an additional coordinate (
), normal to the gallery axis (
), is introduced. Here,
denotes the local outward unit normal vector to the corresponding boundary segment. Its orientation therefore changes according to the local geometry of the ventilation boundary, while the same normal-flux formulation is applied to all boundary segments for both U-type and Y-type configurations. For both ventilation configurations, (
) is defined (
) in the direction perpendicular to the gallery boundary, for (for 0
y Y). In the second configuration, the definition of (
) is extended locally to account for the change in orientation of the gallery boundary for 0
x X).
for
i = 1, 2, …,
N − 1
The quantities appearing in Equations (44)–(46) describe the properties of the gas phase flowing in the galleries in the immediate vicinity of the goaf. The apparent linear velocity of the gas, directed normal to the gallery boundary and towards the gallery (), represents the filtration flow between the goaf and the gallery. For both configurations, this velocity is defined consistently (equal to (−vx)) along the interface (for 0 y Y). In the second configuration, its definition is extended locally to account for the change in geometry associated with the intersection of the galleries (vy for 0 x X). The gallery width is denoted by (), with the subscript indicating the corresponding gallery segment (x or y).
The boundary conditions (Equations (44)–(46)) describe the exchange of mass and heat between the porous goaf region and the adjacent ventilation galleries. They are formulated based on Darcy’s law and the continuity of mass and energy fluxes across the interface between the two regions. The normal component of the velocity is derived from the pressure gradient in accordance with the filtration model, while the source terms represent the net flux of mass and energy exchanged between the goaf and the gallery flow. This formulation ensures consistency between the porous medium flow and the one-dimensional flow in the galleries.
In both ventilation configurations, the boundaries of the goaf that are in direct contact with the unmined rock mass are also taken into account. It is assumed that no mass or heat transfer occurs across these boundaries in the direction normal to their surfaces (
O). This condition is expressed by the following boundary conditions:
The generalised source term (Φ) is defined as a set of component functions determined within the model, i.e., () for (i = 1, 2, …, N − 1). The conditions given in Equation (47) apply to all boundaries directly adjacent to the unmined rock mass.
For the system of ordinary differential Equations (40)–(42), the boundary conditions at the inlet point () for (x = 0, y = 0) are of particular importance. At this location, clean air enters the gallery with a specified mass flow rate () and atmospheric composition. The inlet air is assumed to consist of nitrogen ( and oxygen (. The total pressure (p) and temperature (), are specified based on operational measurements. These quantities allow the density of the incoming air and the corresponding mass fractions of its components ( to be determined. Under the assumption of dry air, all remaining gas components are neglected and their mass fractions are set to zero. The boundary conditions at the inlet () are therefore defined as follows:
- ✓
In the case of Equation (40), there is a boundary condition of the second kind of the following form:
- ✓
For Equations (41) and (42), only first-order conditions are required:
Since Equation (40) is a second-order differential equation with respect to the spatial coordinate (
), an additional boundary condition is required to obtain a unique solution. This condition is specified at the outlet section of the gallery: at (
=
Y) for the first ventilation configuration and at (
=
Y + X) for the second configuration. In both cases, the following boundary condition is applied:
In the second ventilation configuration, special attention is required at the junction point ( = Y), where two air streams merge. As described above, the combined stream subsequently flows towards the outlet at ( = Y + X). In the proposed model, the junction is treated as a point source of mass and heat representing the inflow of an additional air stream. At this location, the standard source terms defined by Equations (44)–(46) are replaced by modified expressions that account for the additional inflow. In particular, the local mass source term in Equation (40) is increased by the contribution of the incoming air stream. For the component balance in Equation (41), the general formulation given by Equation (14) is applied, with the inlet composition () corresponding to the air supplied from the longwall. The source terms for the individual components are determined from the known mass fractions of the incoming air ( for i = 1, 2, …, N). For brevity, the explicit expressions are not presented here.
To summarise the proposed mathematical model, the numerical simulation provides approximate solutions for the following scalar fields within the goaf and the adjacent gallery regions:
- 1.
Pressure Differential Field in the Goaf ) and Along the Galleries ), Pa,
- 2.
Mass fraction fields of individual gas components in the goaf and along the galleries for (i = 1, 2, …, N), kg·kg−1,
- 3.
Temperature field of the gas phase in the goaf ( and along the galleries (, K,
- 4.
Radially symmetric temperature field within spherical solids in the goaf (, K,
- 5.
Carbon mass fraction in the solid phase within the goaf (, kg·kg−1.
In addition, the model determines the velocity field of the gas mixture (), within the goaf and the airflow velocity along the galleries (. All of the above-mentioned fields are non-stationary; their local values vary with time as the self-heating process develops and may ultimately lead to fire.
4. Numerical Solution of the Equations of the Proposed Model
The initial–boundary problem formulated in the previous sections is strongly nonlinear and cannot be solved analytically. Therefore, a numerical approach based on the Control Volume Method (CVM), also known as the Finite Volume Method (FVM), was applied. The numerical formulation follows the approach developed by Patankar [
26], which is widely used for transport problems involving coupled convection and diffusion. The method is based on the discretisation of the independent variables. For steady-state problems, only spatial discretisation is required, whereas for transient processes, discretisation is also performed in time. The numerical scheme used in this study follows Patankar’s approach, which is suitable for convection–diffusion transport problems. The convective terms are approximated using the POWER-LAW scheme, a modification of the classical upwind approach. The spatial discretisation is performed by dividing the computational domain into a finite number of control volumes associated with numerical nodes representing the geometry of the excavations and adjacent roadways. The computational domain was discretised using a structured control-volume grid. During the numerical calculations, different grid resolutions were considered to assess their influence on the convergence and stability of the solution. The grid adopted for the simulations presented in this study was selected as sufficient to reproduce the main spatial features of the coupled flow, mass-transfer, and heat-transfer processes while maintaining numerical convergence and reasonable computational cost. The final computational grid consisted of
control volumes. The purpose of the spatial discretisation was to obtain a convergent numerical representation of the coupled processes and their dominant spatial trends rather than to resolve fine-scale local structures within the goaf. The governing differential equations are transformed into algebraic form by approximating the spatial derivatives using the distances between neighbouring nodes (
,
,
). For transient processes, time discretisation is introduced by dividing the simulation time into finite increments, and the solution is obtained sequentially at discrete time levels. The resulting solution is discrete, with the physical fields determined at the computational nodes. Each algebraic equation represents a balance of the transported quantity over a control volume surrounding a central node and its neighbouring nodes, forming the computational stencil. In the Cartesian coordinate system, the control volumes take the form of rectangular elements. To properly account for convective transport, a staggered-grid arrangement is employed, in which the velocity components
and
are defined at the faces of the control volumes. The discrete form of the governing equations for a representative control volume in the transient two-dimensional case is presented below:
where
denotes a generalised physical field whose spatial and temporal variations describe the transport of an extensive quantity, such as momentum, mass, or thermal energy. The capital-letter subscripts refer to the central node
and its neighbouring nodes
W,
E,
S,
N, corresponding to the west, east, south, and north directions, respectively. Lowercase subscripts denote the locations of the control-volume faces between neighbouring nodes, where the velocity components are defined and the corresponding transport coefficients are evaluated. The coefficient
is associated with the control volume surrounding node
and represents the storage term: mass for the mass-conservation equations (Equation (24)) and heat capacity for the energy equation (Equation (36)). The discretisation in time uses the solution from the previous time level. The value of
at the central node represents the numerical solution at the corresponding time level. The temporal accumulation term on the right-hand side of Equation (52) is evaluated using a backward-difference approximation of the time derivative, which provides a stable formulation for the transient simulations. At the initial time level, the field values are specified by the initial conditions. The solution is then advanced in time by successively updating the field values and solving the resulting system of algebraic equations at each time step. The calculations are continued for the prescribed simulation period or, where applicable, until a steady state is reached.
At each time step, the numerical solution is obtained according to the following computational sequence:
- 1.
Solution of the filtration Equation (15) to determine the pressure differential field ( in the goaf and adjacent galleries.
- 2.
Calculation of the gas velocity field in the goaf using Darcy’s law (Equation (17)) and the pressure field obtained in Step 1.
- 3.
Determination of the carbon mass fraction in the solid phase, , by solving Equation (9) within the goaf.
- 4.
Solution of the system of Equation (24) to determine the mass fractions of the gas components (, excluding methane (for ), in the goaf and adjacent galleries.
- 5.
Determination of the methane mass fraction using Equation (25).
- 6.
Solution of the energy equation to obtain the gas-phase temperature field, , in the goaf and adjacent galleries.
- 7.
Solution of Equation (37), together with the boundary conditions given by Equations (38) and (39), to determine the temperature distribution within the spherical solid particles.
Because the governing equations are strongly nonlinear and mutually coupled, the above computational steps are performed iteratively at each time level. In addition, the nonlinear source terms in Equation (24) are linearised using the standard procedures described by Patankar [
26].
To maintain numerical stability and computational efficiency, a variable time step is used. Its value is adjusted according to the local rate of the combustion reactions. Specifically, the time step is selected so that the decrease in the oxygen mass fraction in the most reactive control volume does not exceed the prescribed threshold of . This threshold was selected based on numerical tests as a compromise between computational efficiency and the ability to capture local oxygen depletion. Smaller time steps substantially increase the computational cost, whereas larger time steps may reduce the accuracy of resolving rapid changes in oxygen concentration.
During the numerical calculations, different grid resolutions were considered to assess their influence on the stability and convergence of the solution. The grid adopted for the simulations presented in this study was selected based on these numerical tests. The final resolution was considered sufficient to obtain a convergent solution and to reproduce the dominant spatial characteristics of the coupled flow, mass-transfer, and heat-transfer processes, while maintaining reasonable computational efficiency.
5. Example Calculations and Discussion of Results
Based on the developed mathematical model and the implemented simulation program, exemplary calculations were performed for the longwall ventilation systems shown in
Figure 3 and
Figure 4. The simulations were intended to demonstrate the behaviour of the coupled gas-flow, mass-transfer, and heat-transfer processes associated with coal self-heating under two different ventilation configurations.
Direct measurements within the goaf are technically difficult because of the inaccessible nature of the collapsed zone. Therefore, the present comparison with operational data is based on measurements available at the boundaries of the analysed domain, particularly at the inlet and outlet sections. These data are used for qualitative assessment of the calculated gas-composition trends. The results presented below should therefore be interpreted primarily as a demonstration of the physical behaviour reproduced by the model rather than as a quantitative validation of all predicted fields. A more extensive quantitative validation using field measurements will be addressed in future work.
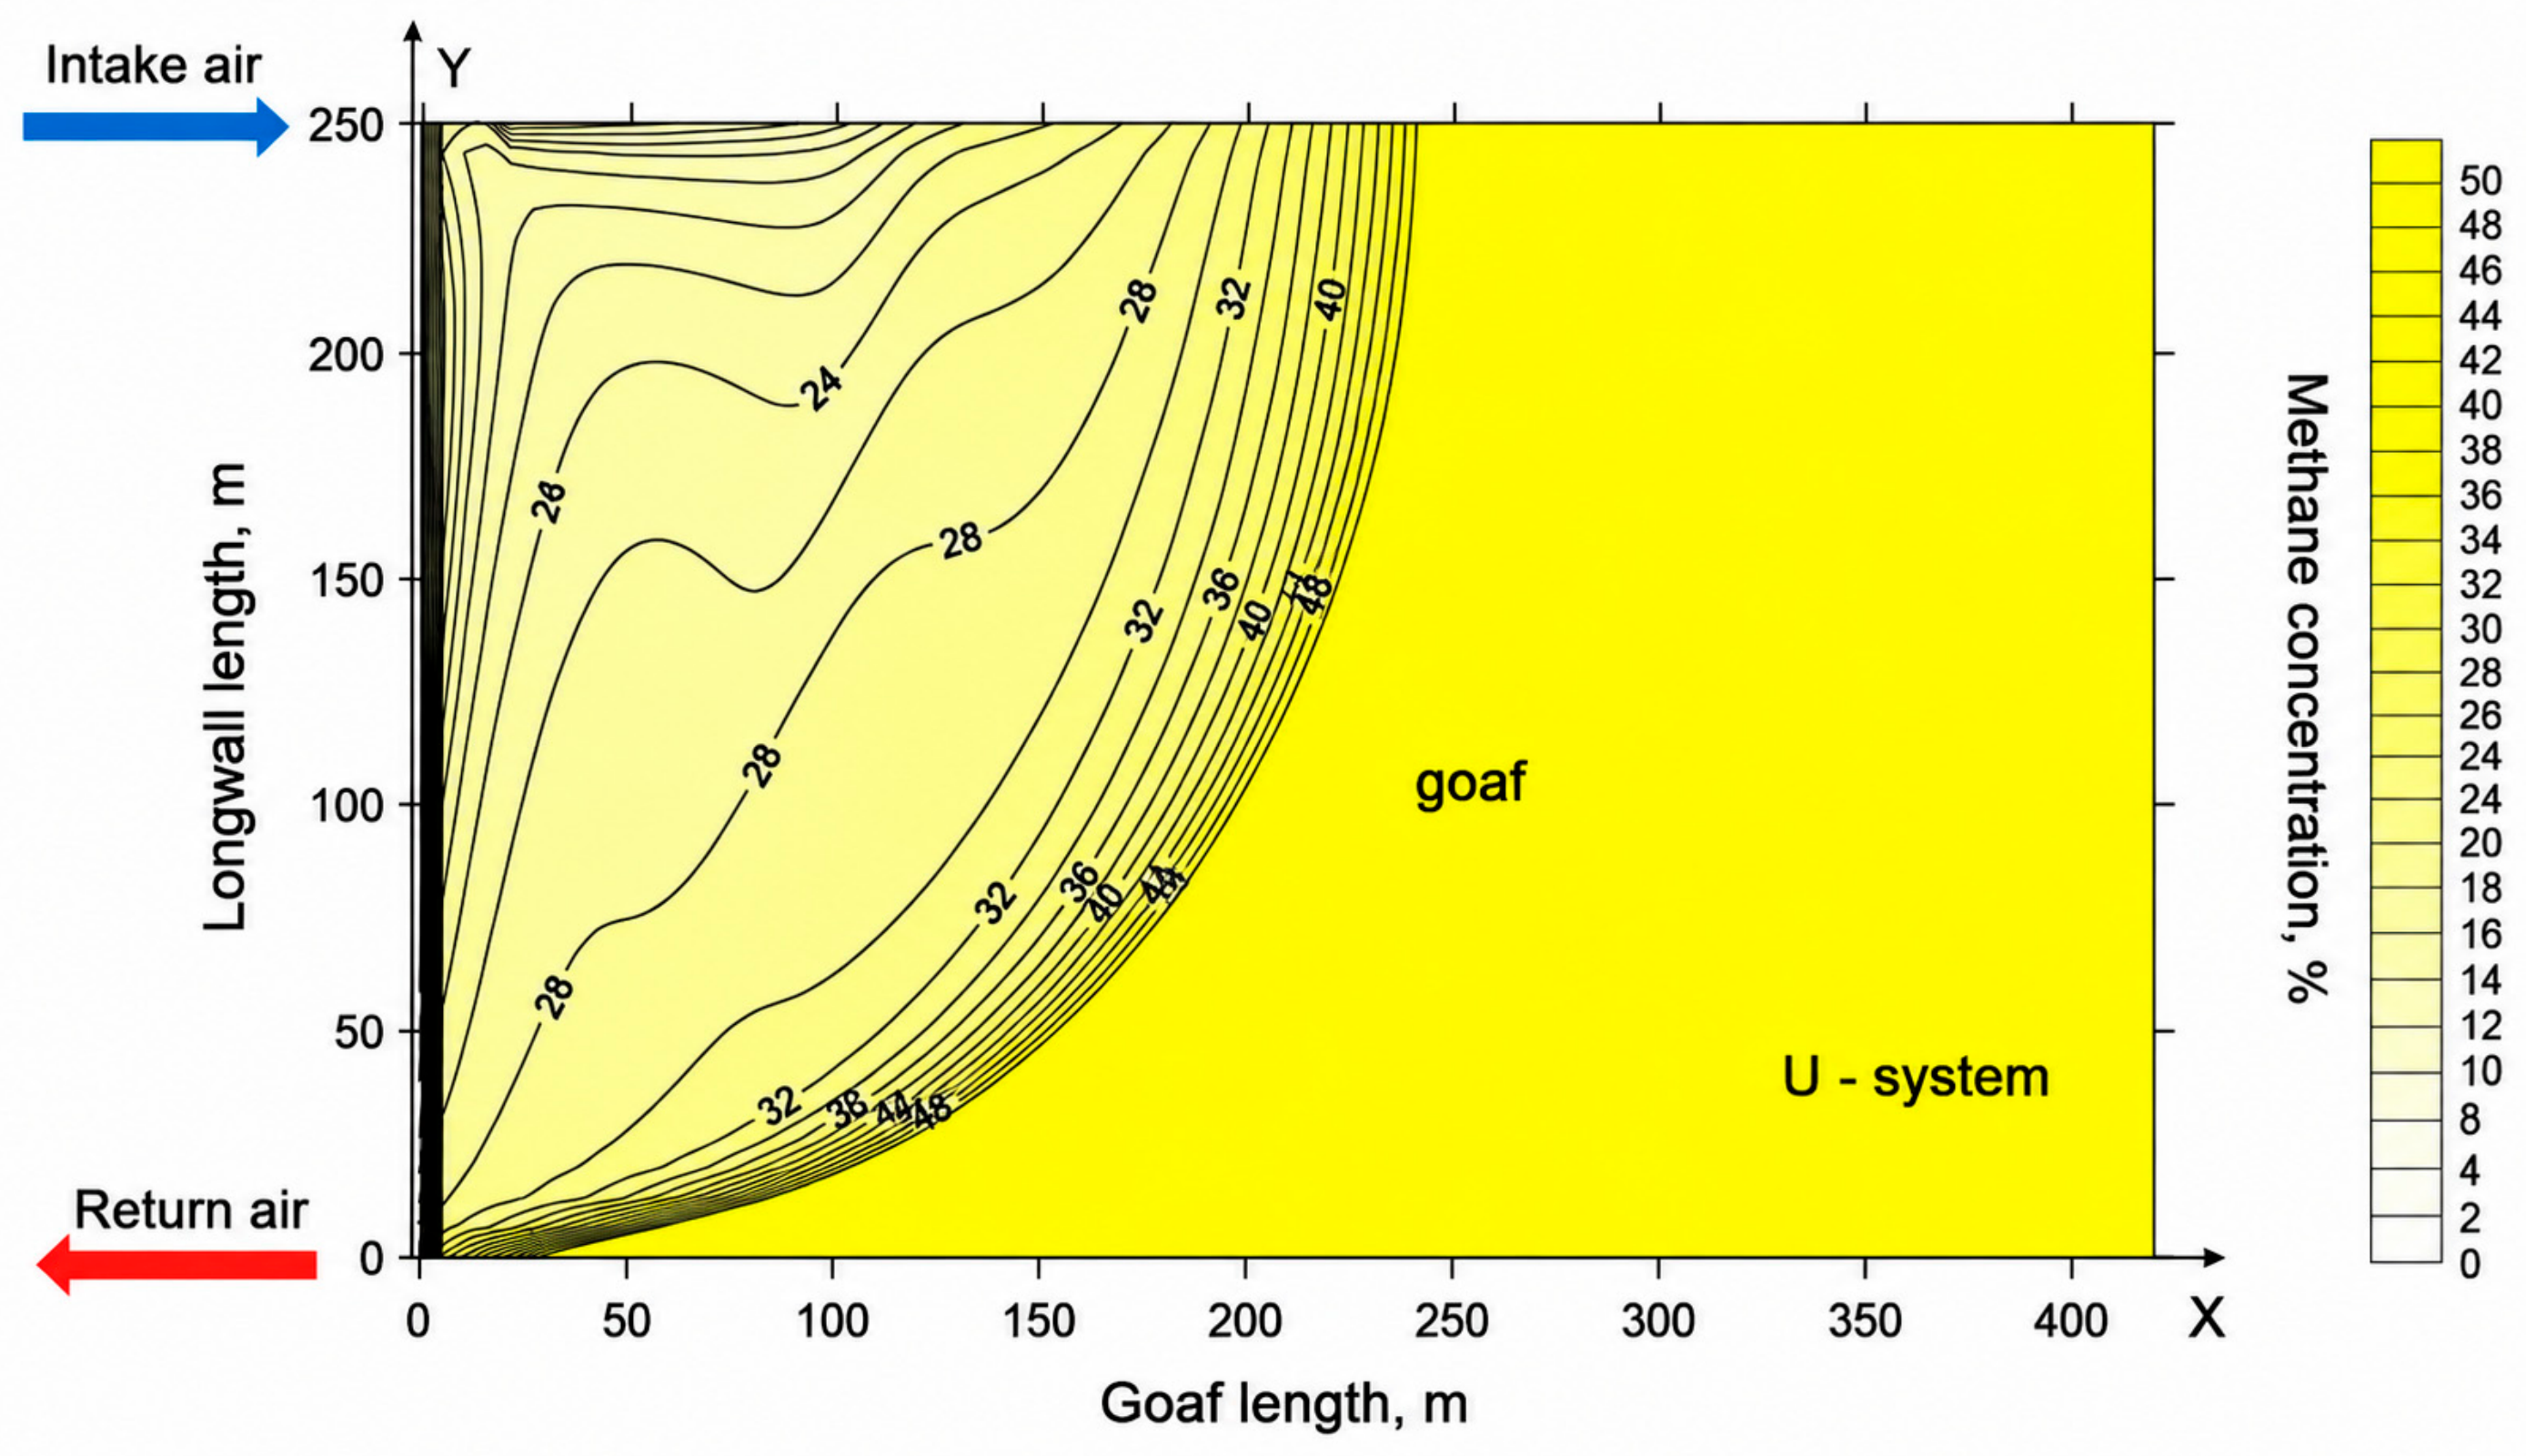
The results of the computer simulations are obtained in numerical form. The governing equations are solved for the mass fractions of the individual gas components. For graphical presentation, the calculated mass fractions are converted during post-processing into volumetric gas concentrations (% vol.). Surfer 8.0 software is then used to generate the corresponding contour maps. The figures below present only the contour maps of CH
4, CO, and O
2 concentrations and the gas temperature distribution, while the remaining parameters obtained from the simulations are not presented.
Figure 5,
Figure 6,
Figure 7 and
Figure 8 present the corresponding distributions for the U-type ventilation configuration shown in
Figure 3:
- –
- –
- –
carbon monoxide concentration (
Figure 7),
- –
Figure 5.
Contour map of methane concentration distribution in the goaf for the U-type ventilation configuration.
Figure 5.
Contour map of methane concentration distribution in the goaf for the U-type ventilation configuration.
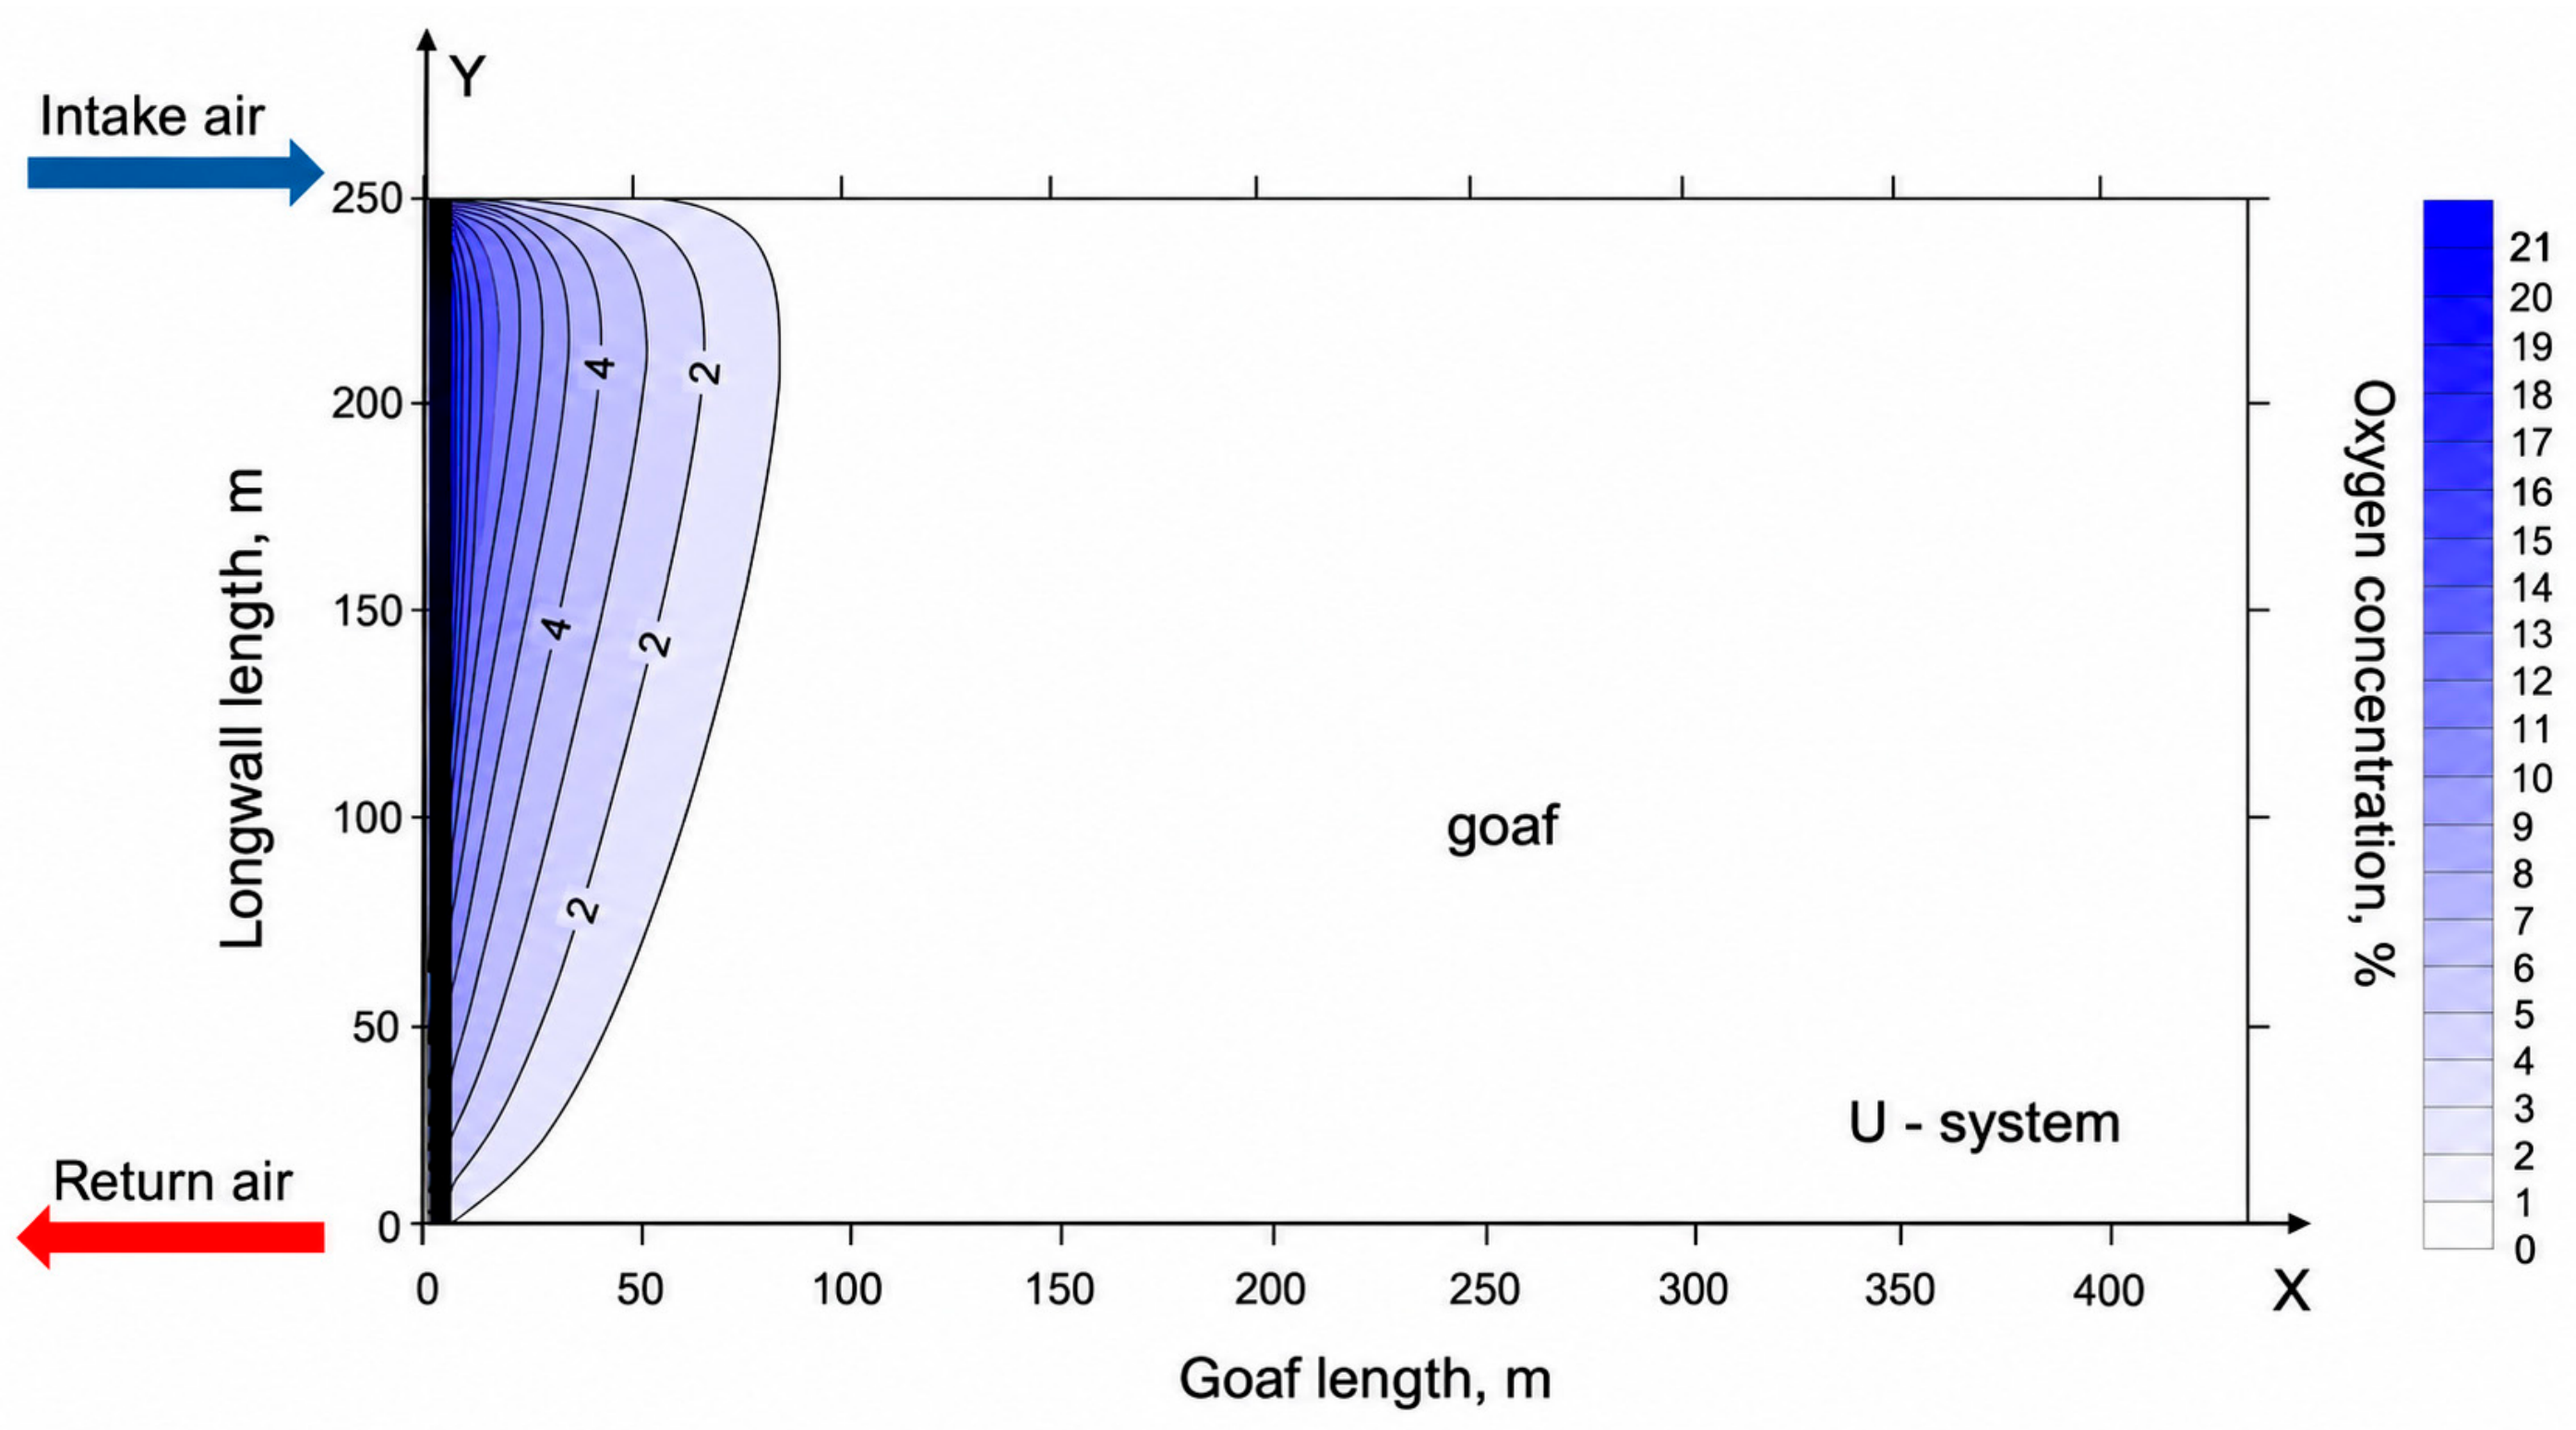
Figure 6.
Contour map of oxygen concentration distribution in the goaf for the U-type ventilation configuration.
Figure 6.
Contour map of oxygen concentration distribution in the goaf for the U-type ventilation configuration.
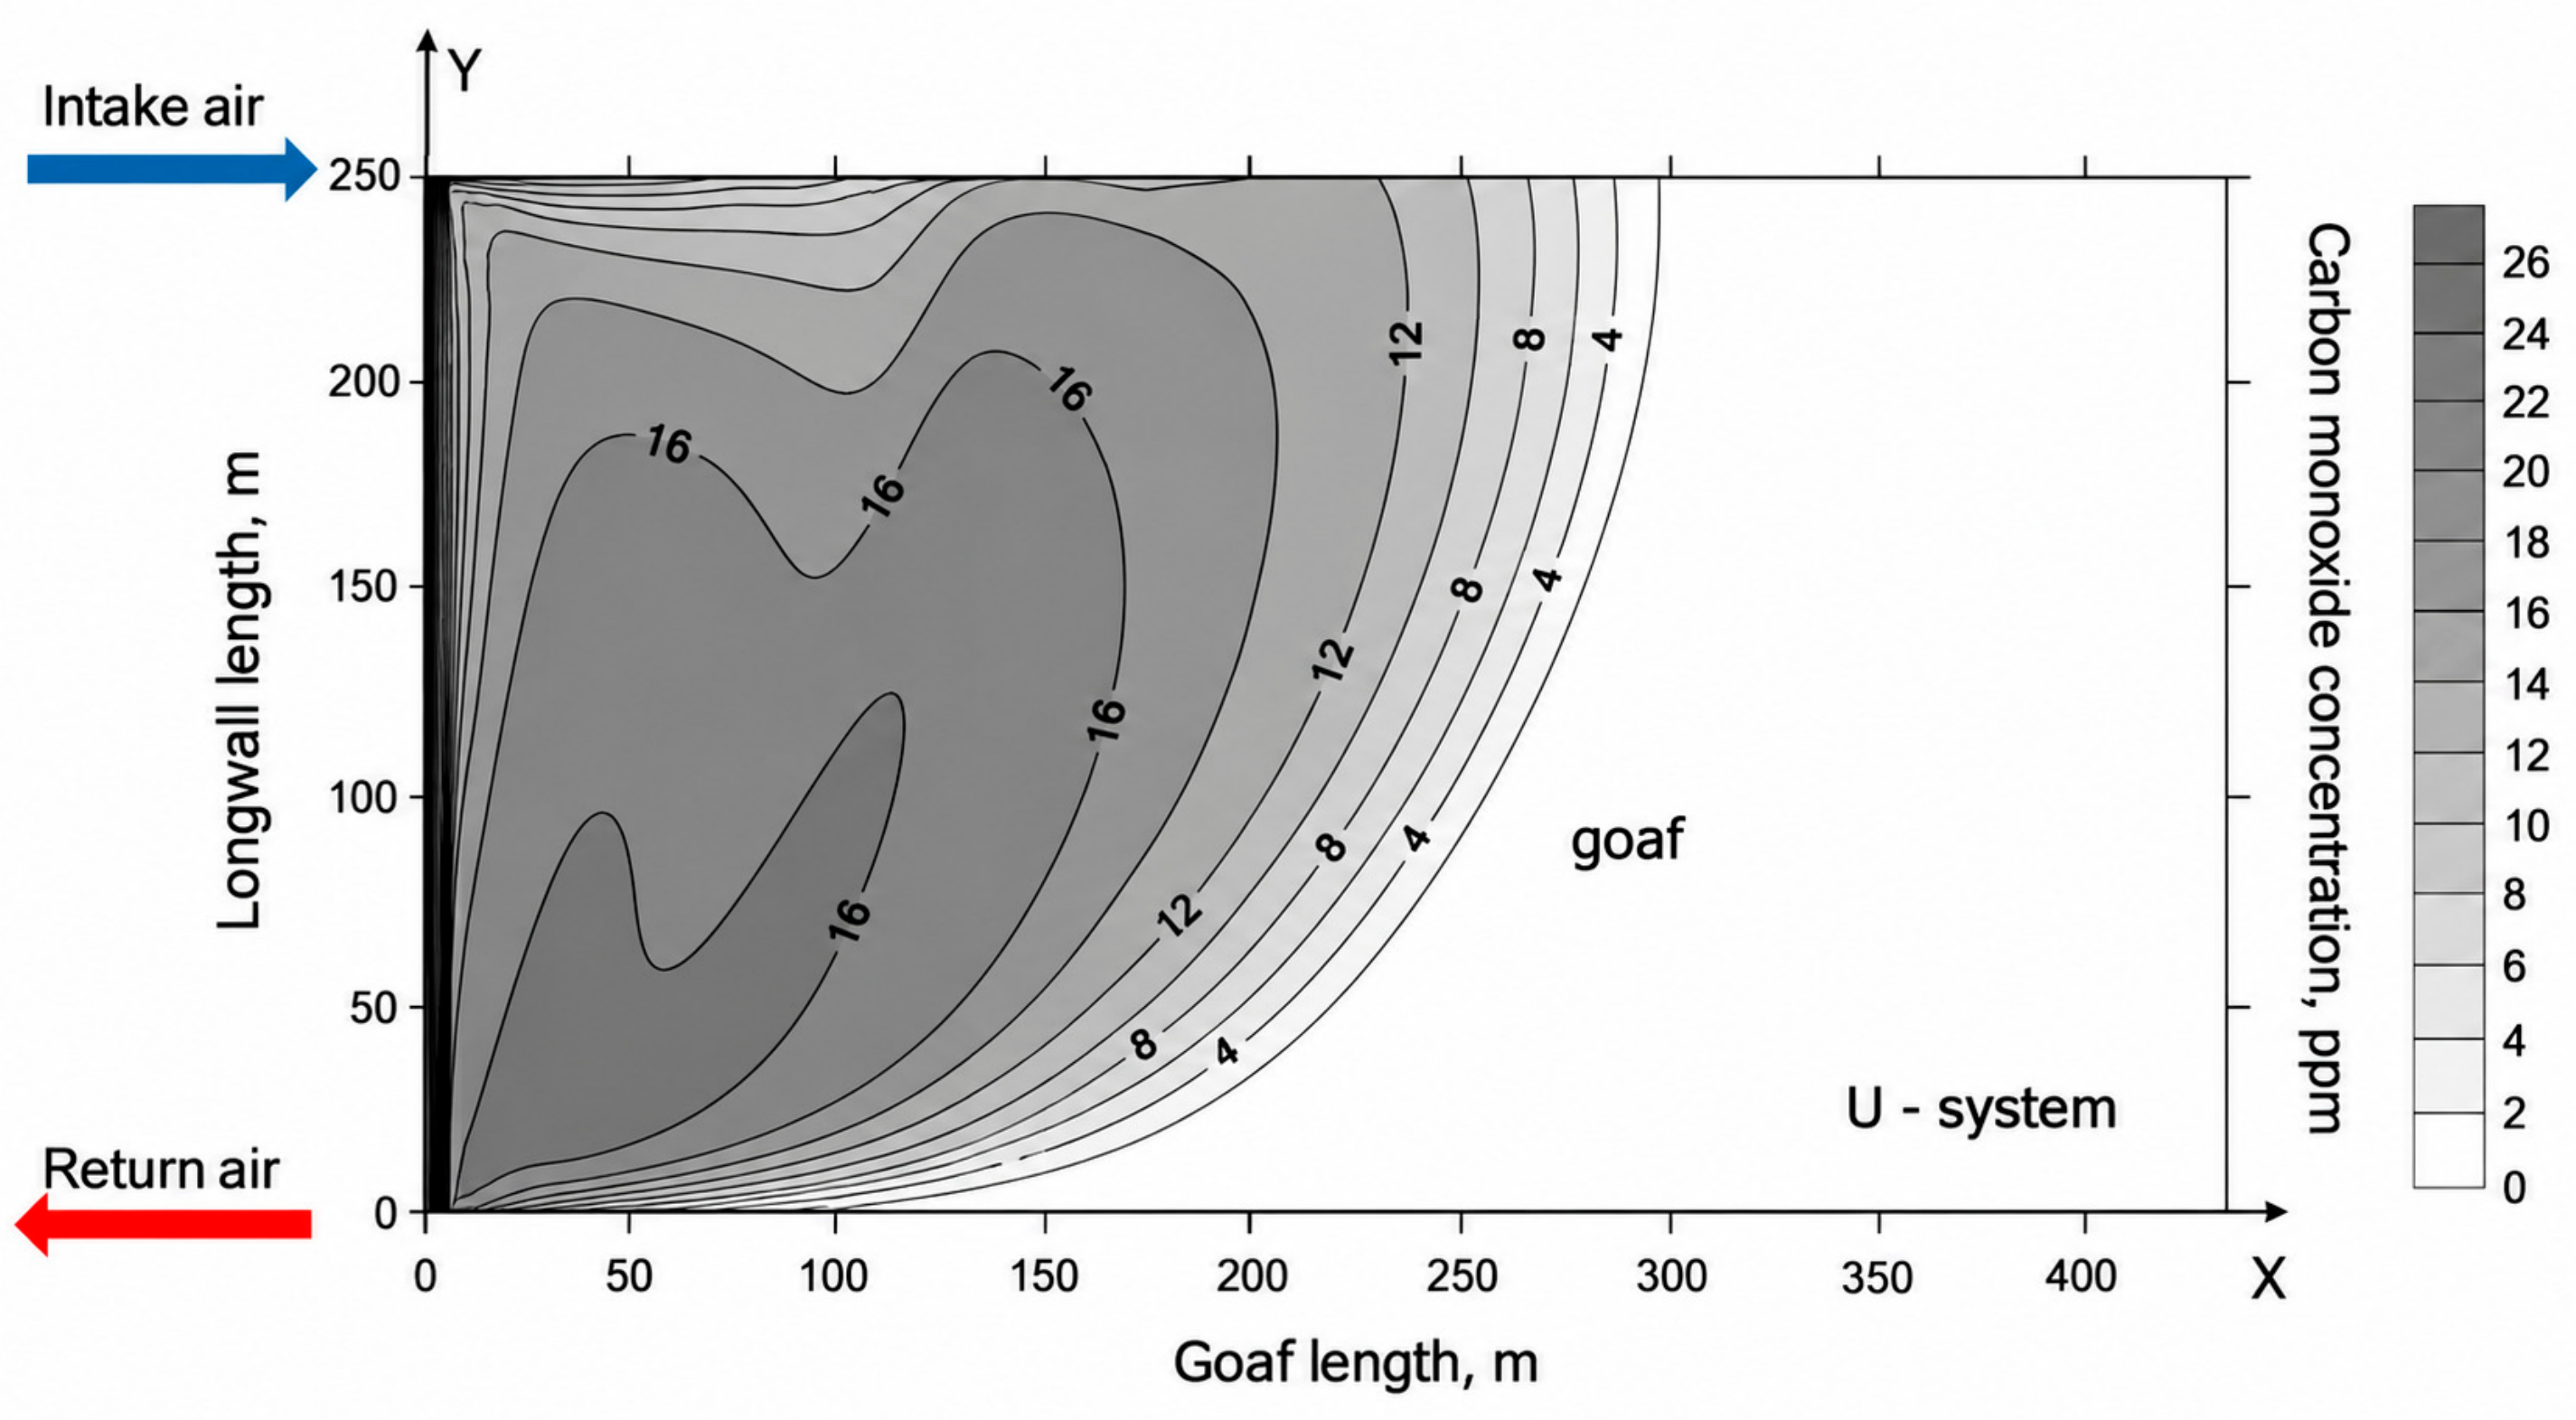
Figure 7.
Contour map of carbon monoxide concentration distribution in the goaf for the U-type ventilation configuration.
Figure 7.
Contour map of carbon monoxide concentration distribution in the goaf for the U-type ventilation configuration.
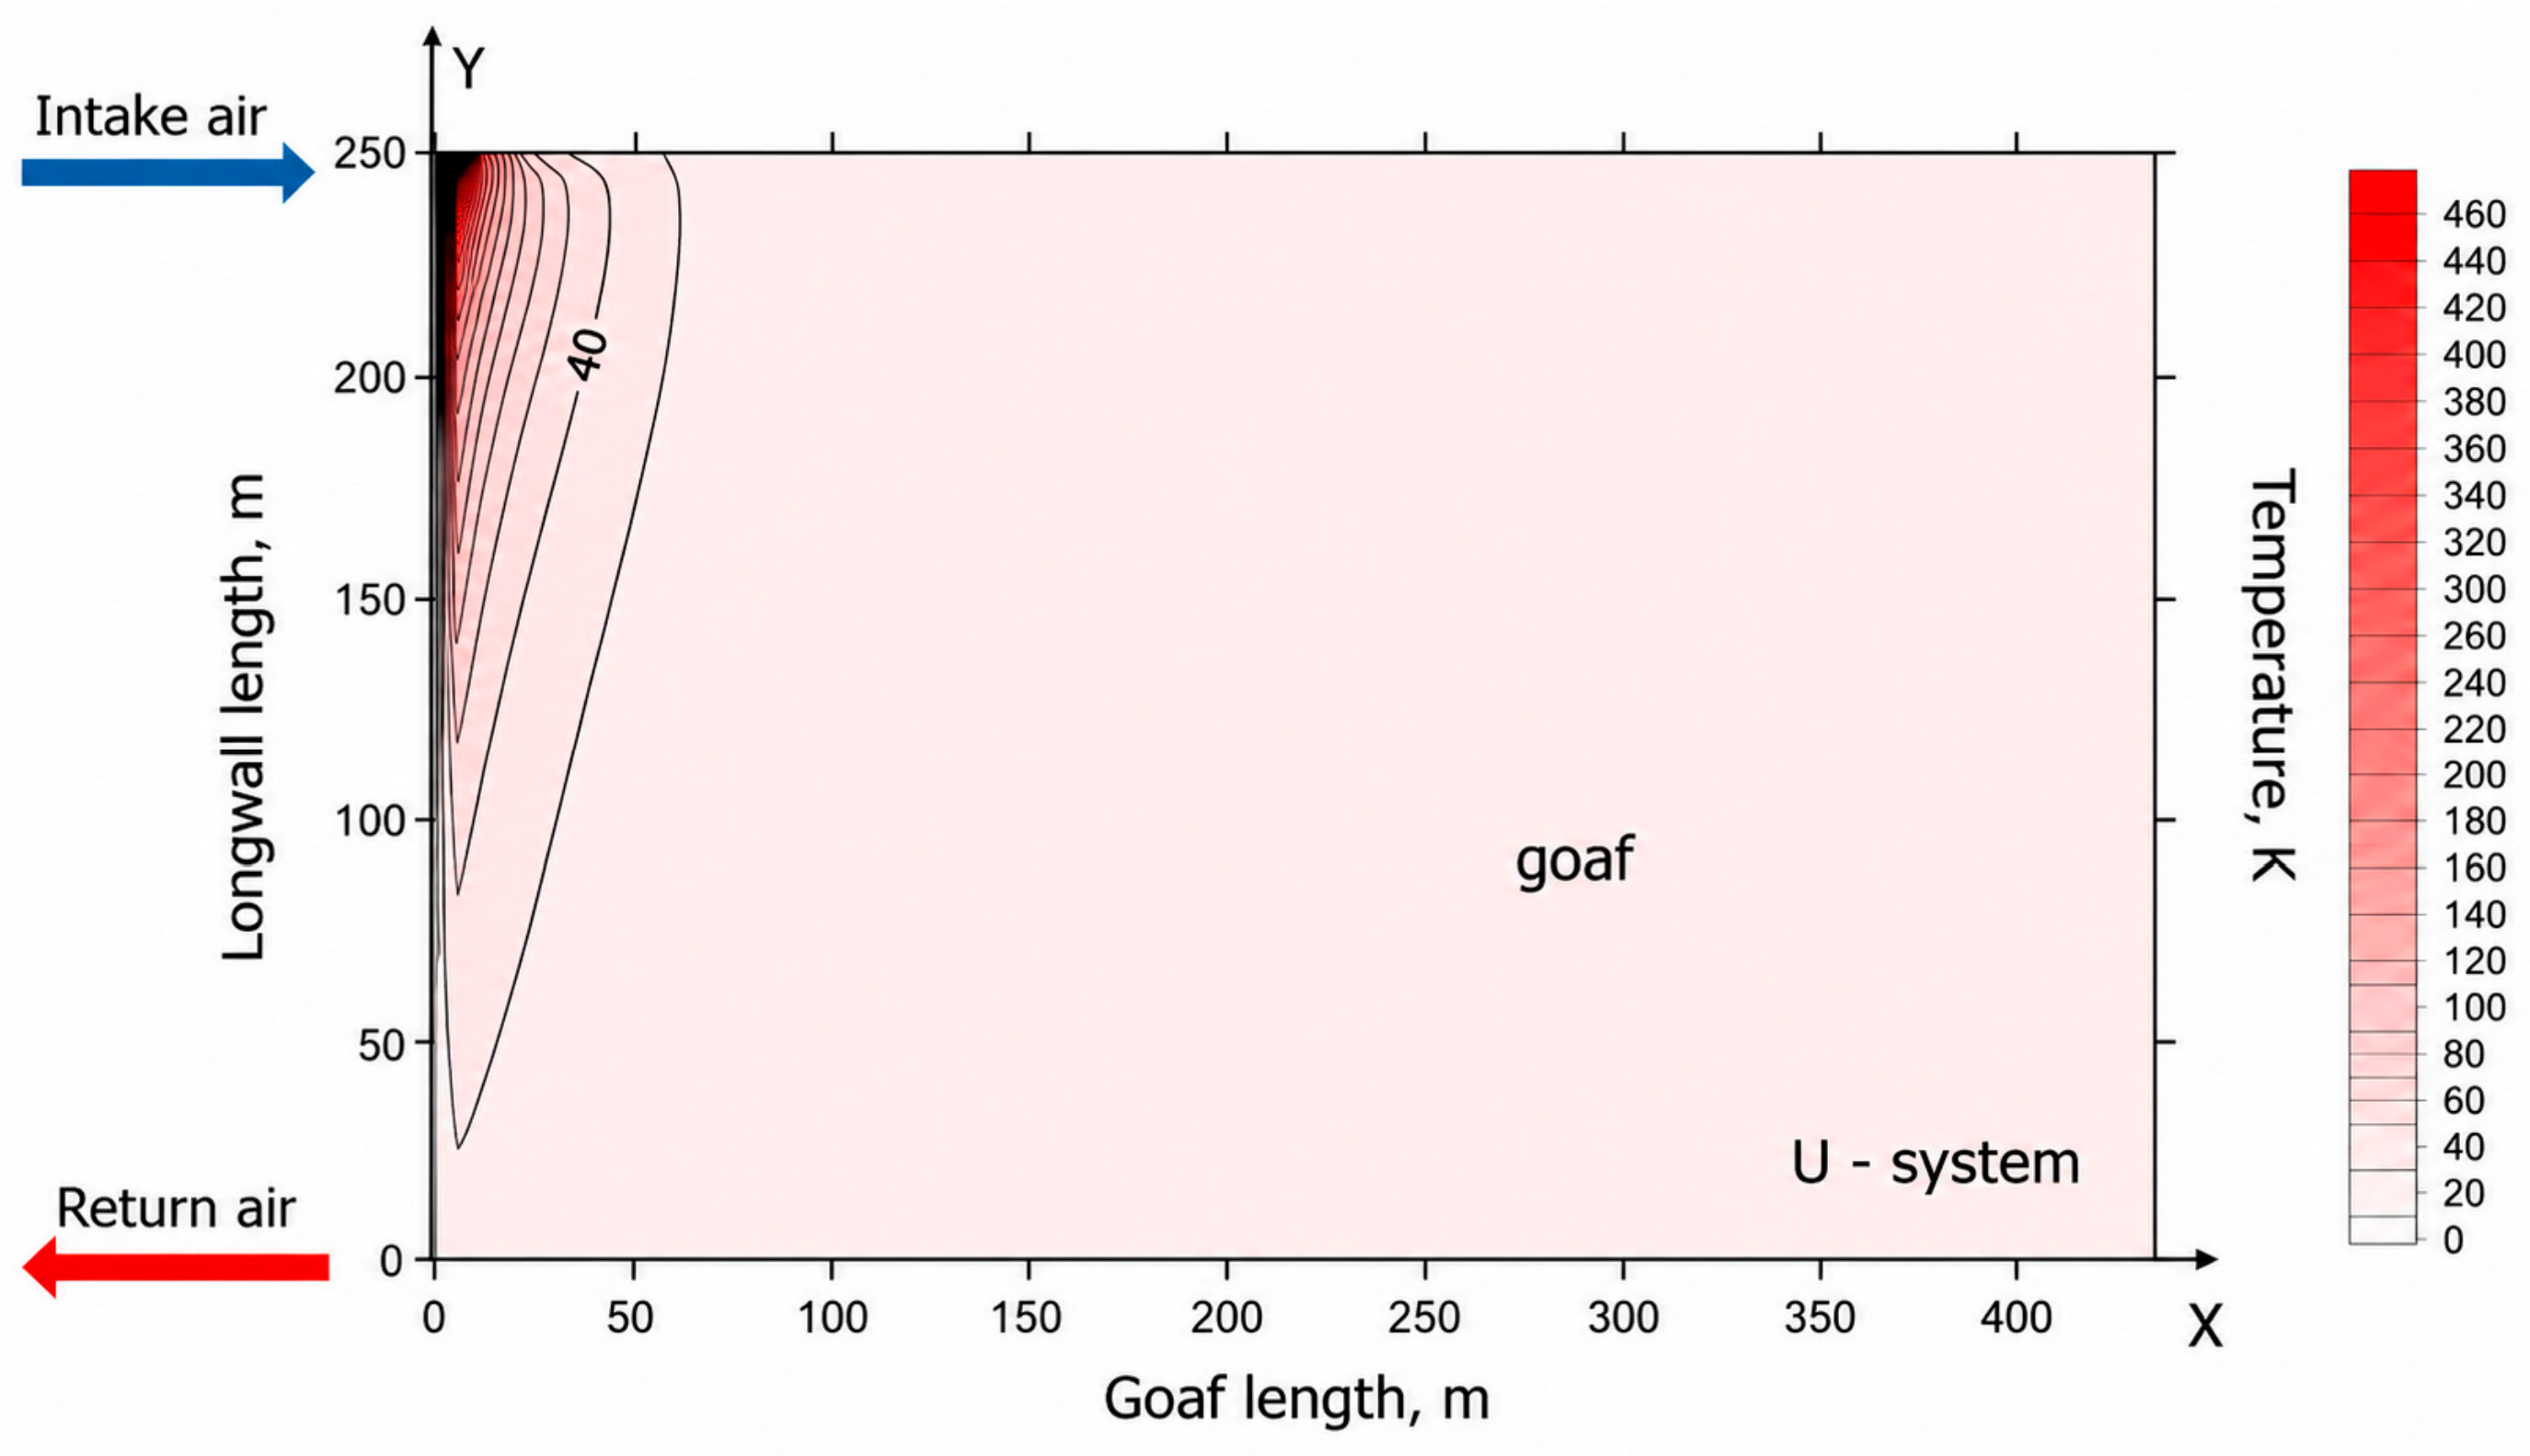
Figure 8.
Contour map of gas temperature distribution in the goaf for the U-type ventilation configuration.
Figure 8.
Contour map of gas temperature distribution in the goaf for the U-type ventilation configuration.
The coordinate system used in
Figure 5,
Figure 6,
Figure 7 and
Figure 8 corresponds to that shown in
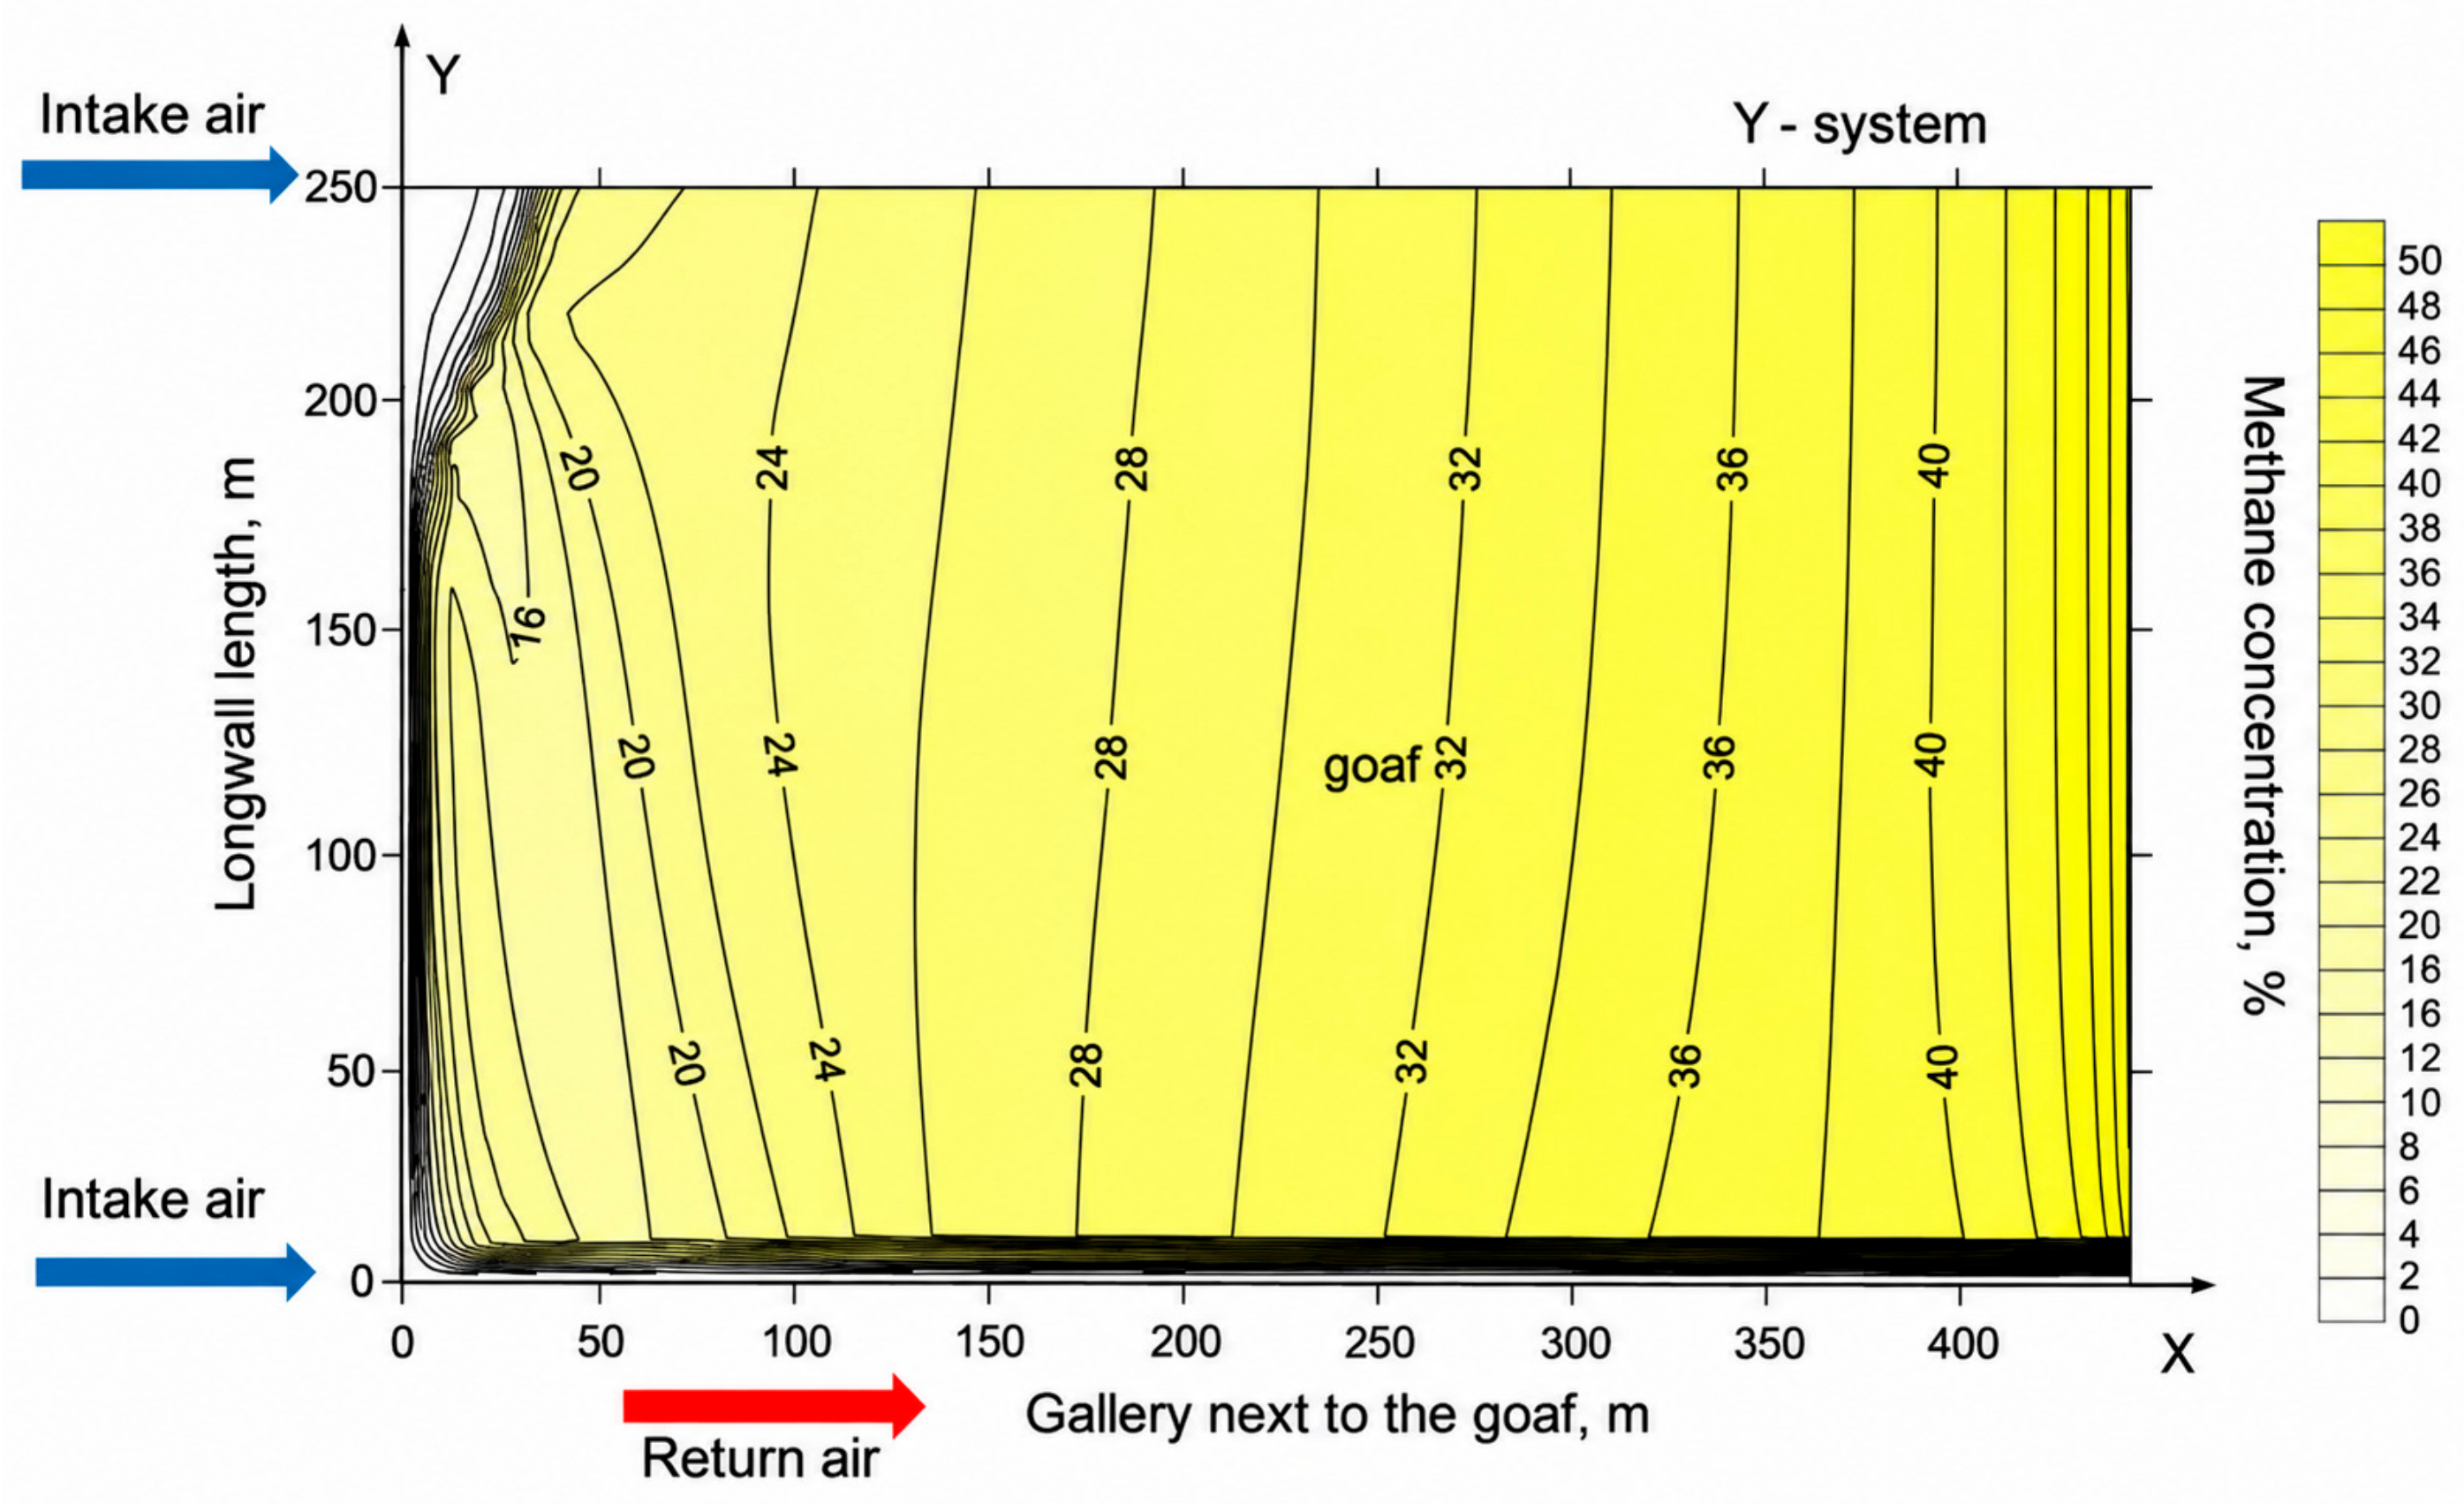
Figure 3. The vertical axis (0–250 m) represents the longwall face length, whereas the horizontal axis corresponds to the goaf area formed as a result of the mining operation. At the location corresponding to 250 m, fresh air enters the longwall panel and initiates airflow penetration into the goaf. As a result, a decrease in methane concentration is observed in the vicinity of the inlet (
Figure 5). Towards the outlet, located at 0 m, the methane concentration increases as methane released within the goaf is transported with the airflow.
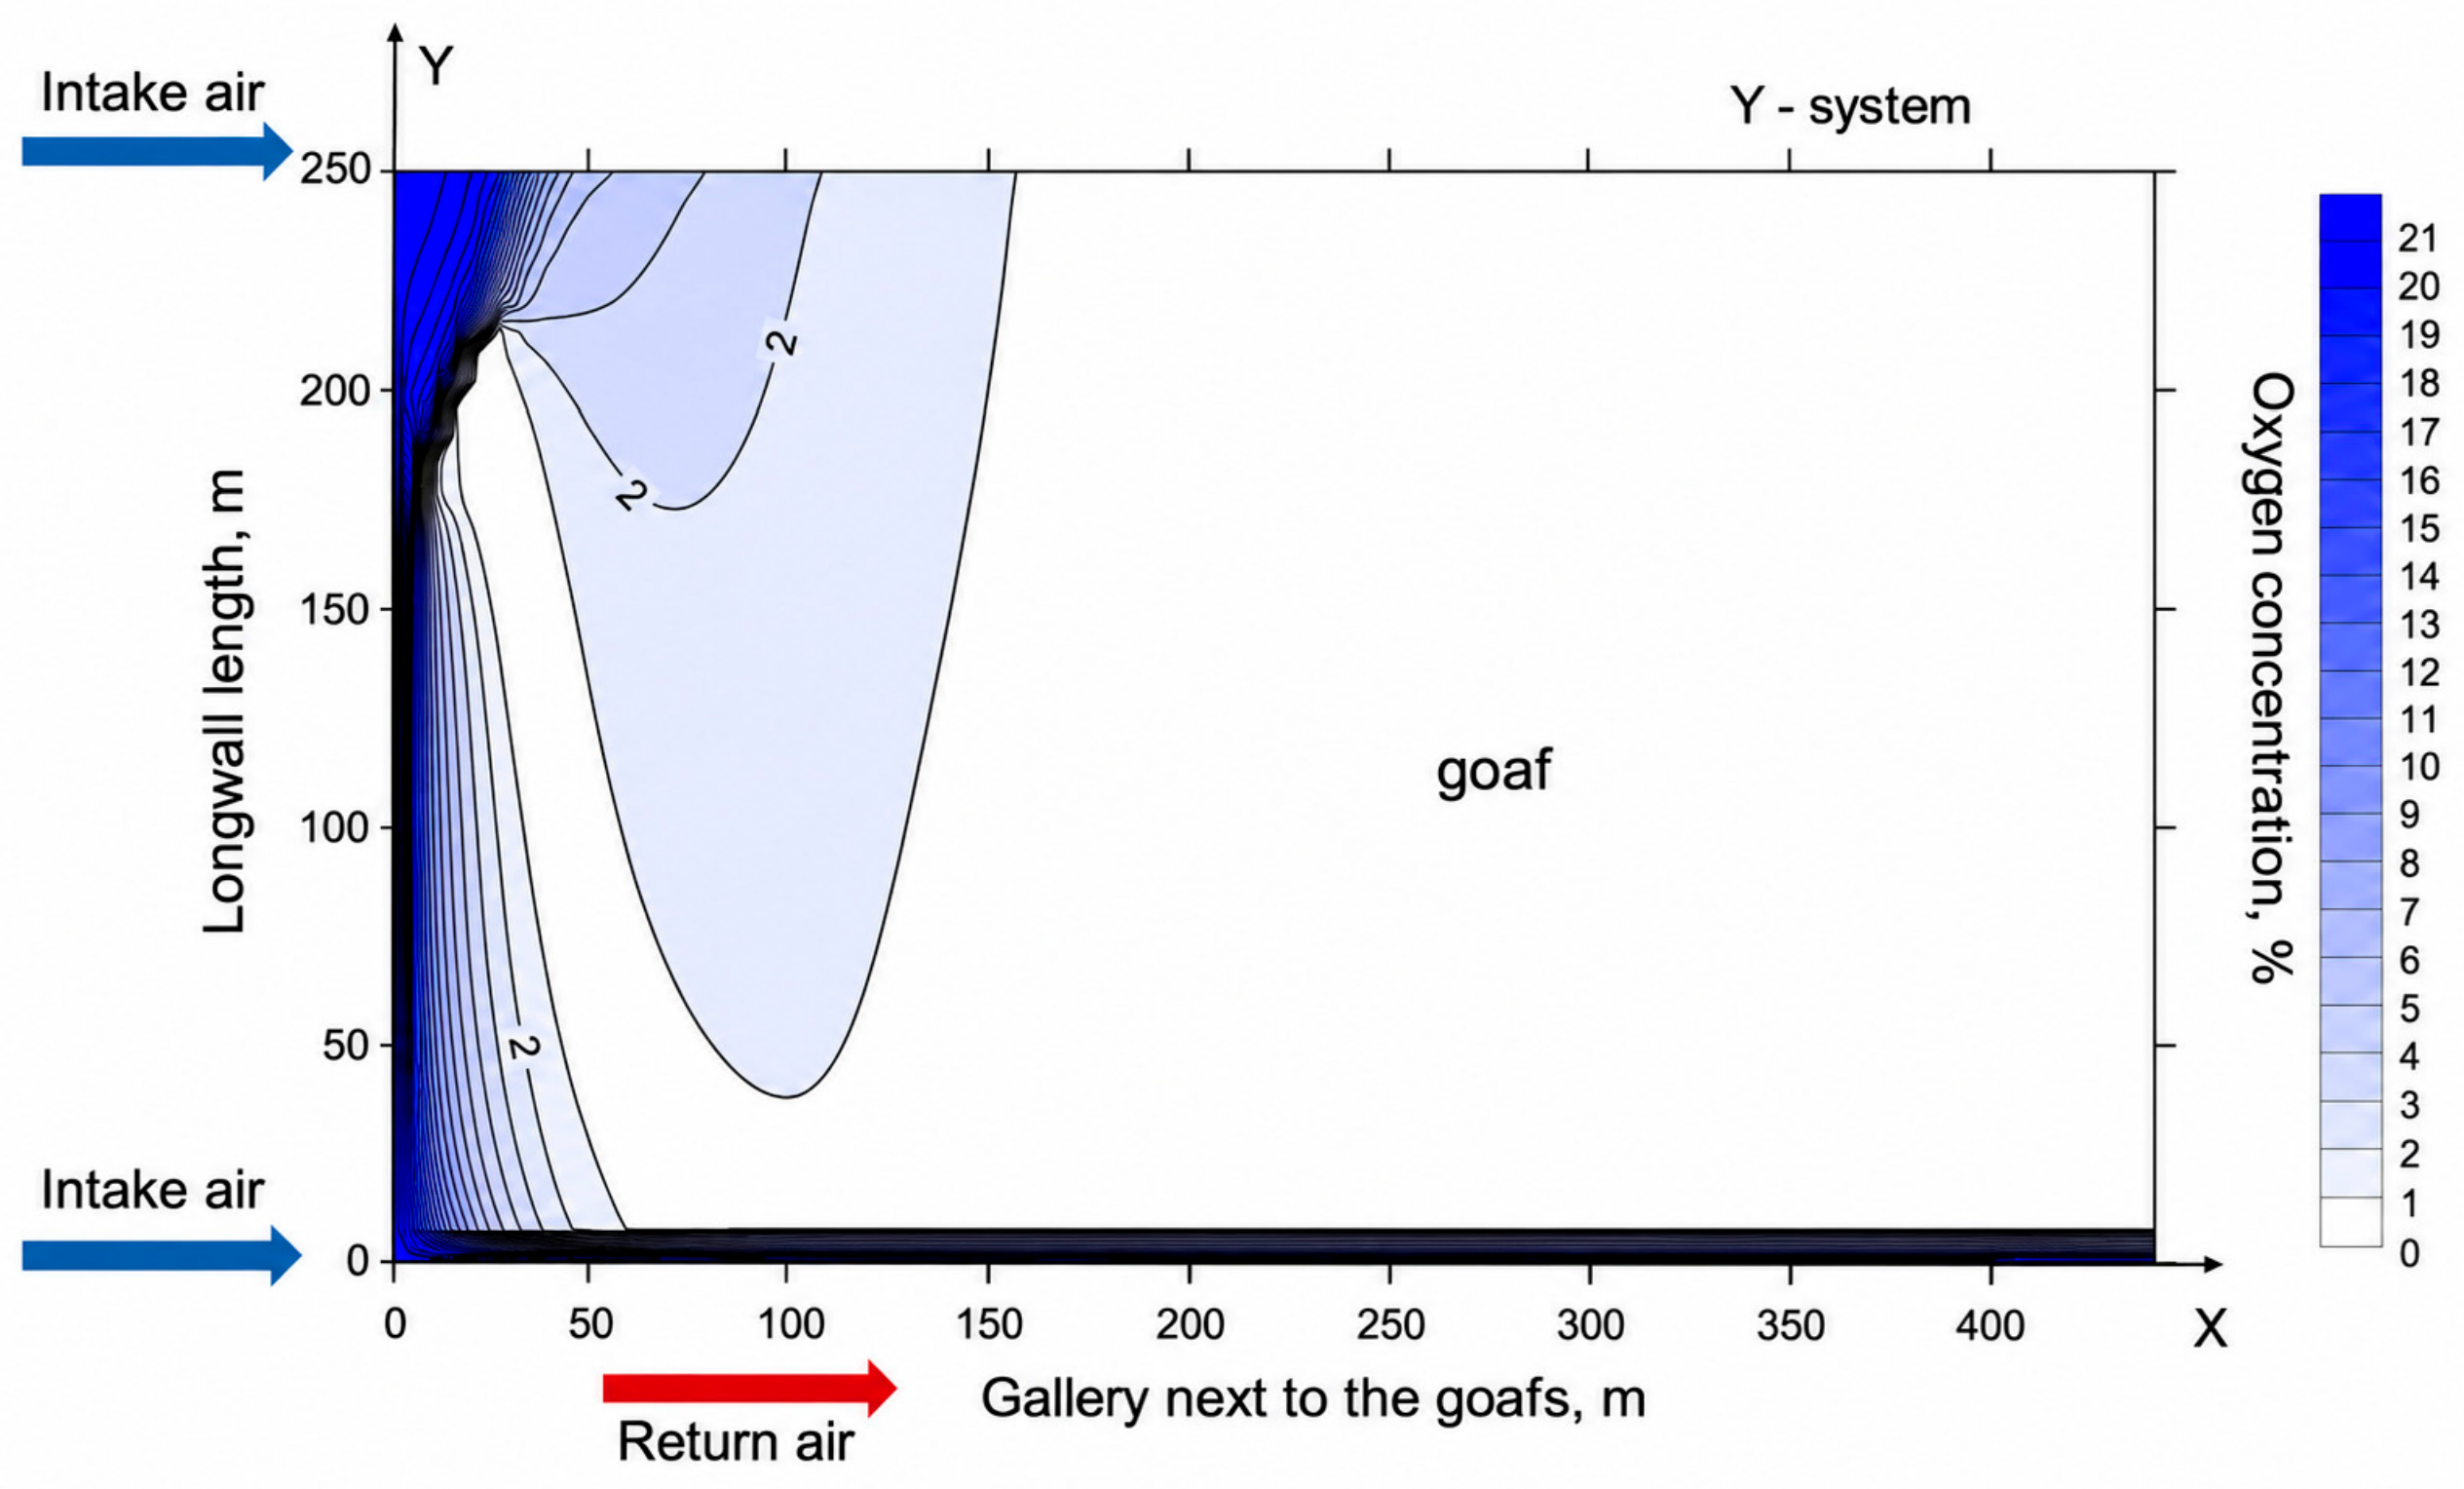
A similar spatial pattern can be observed for oxygen (
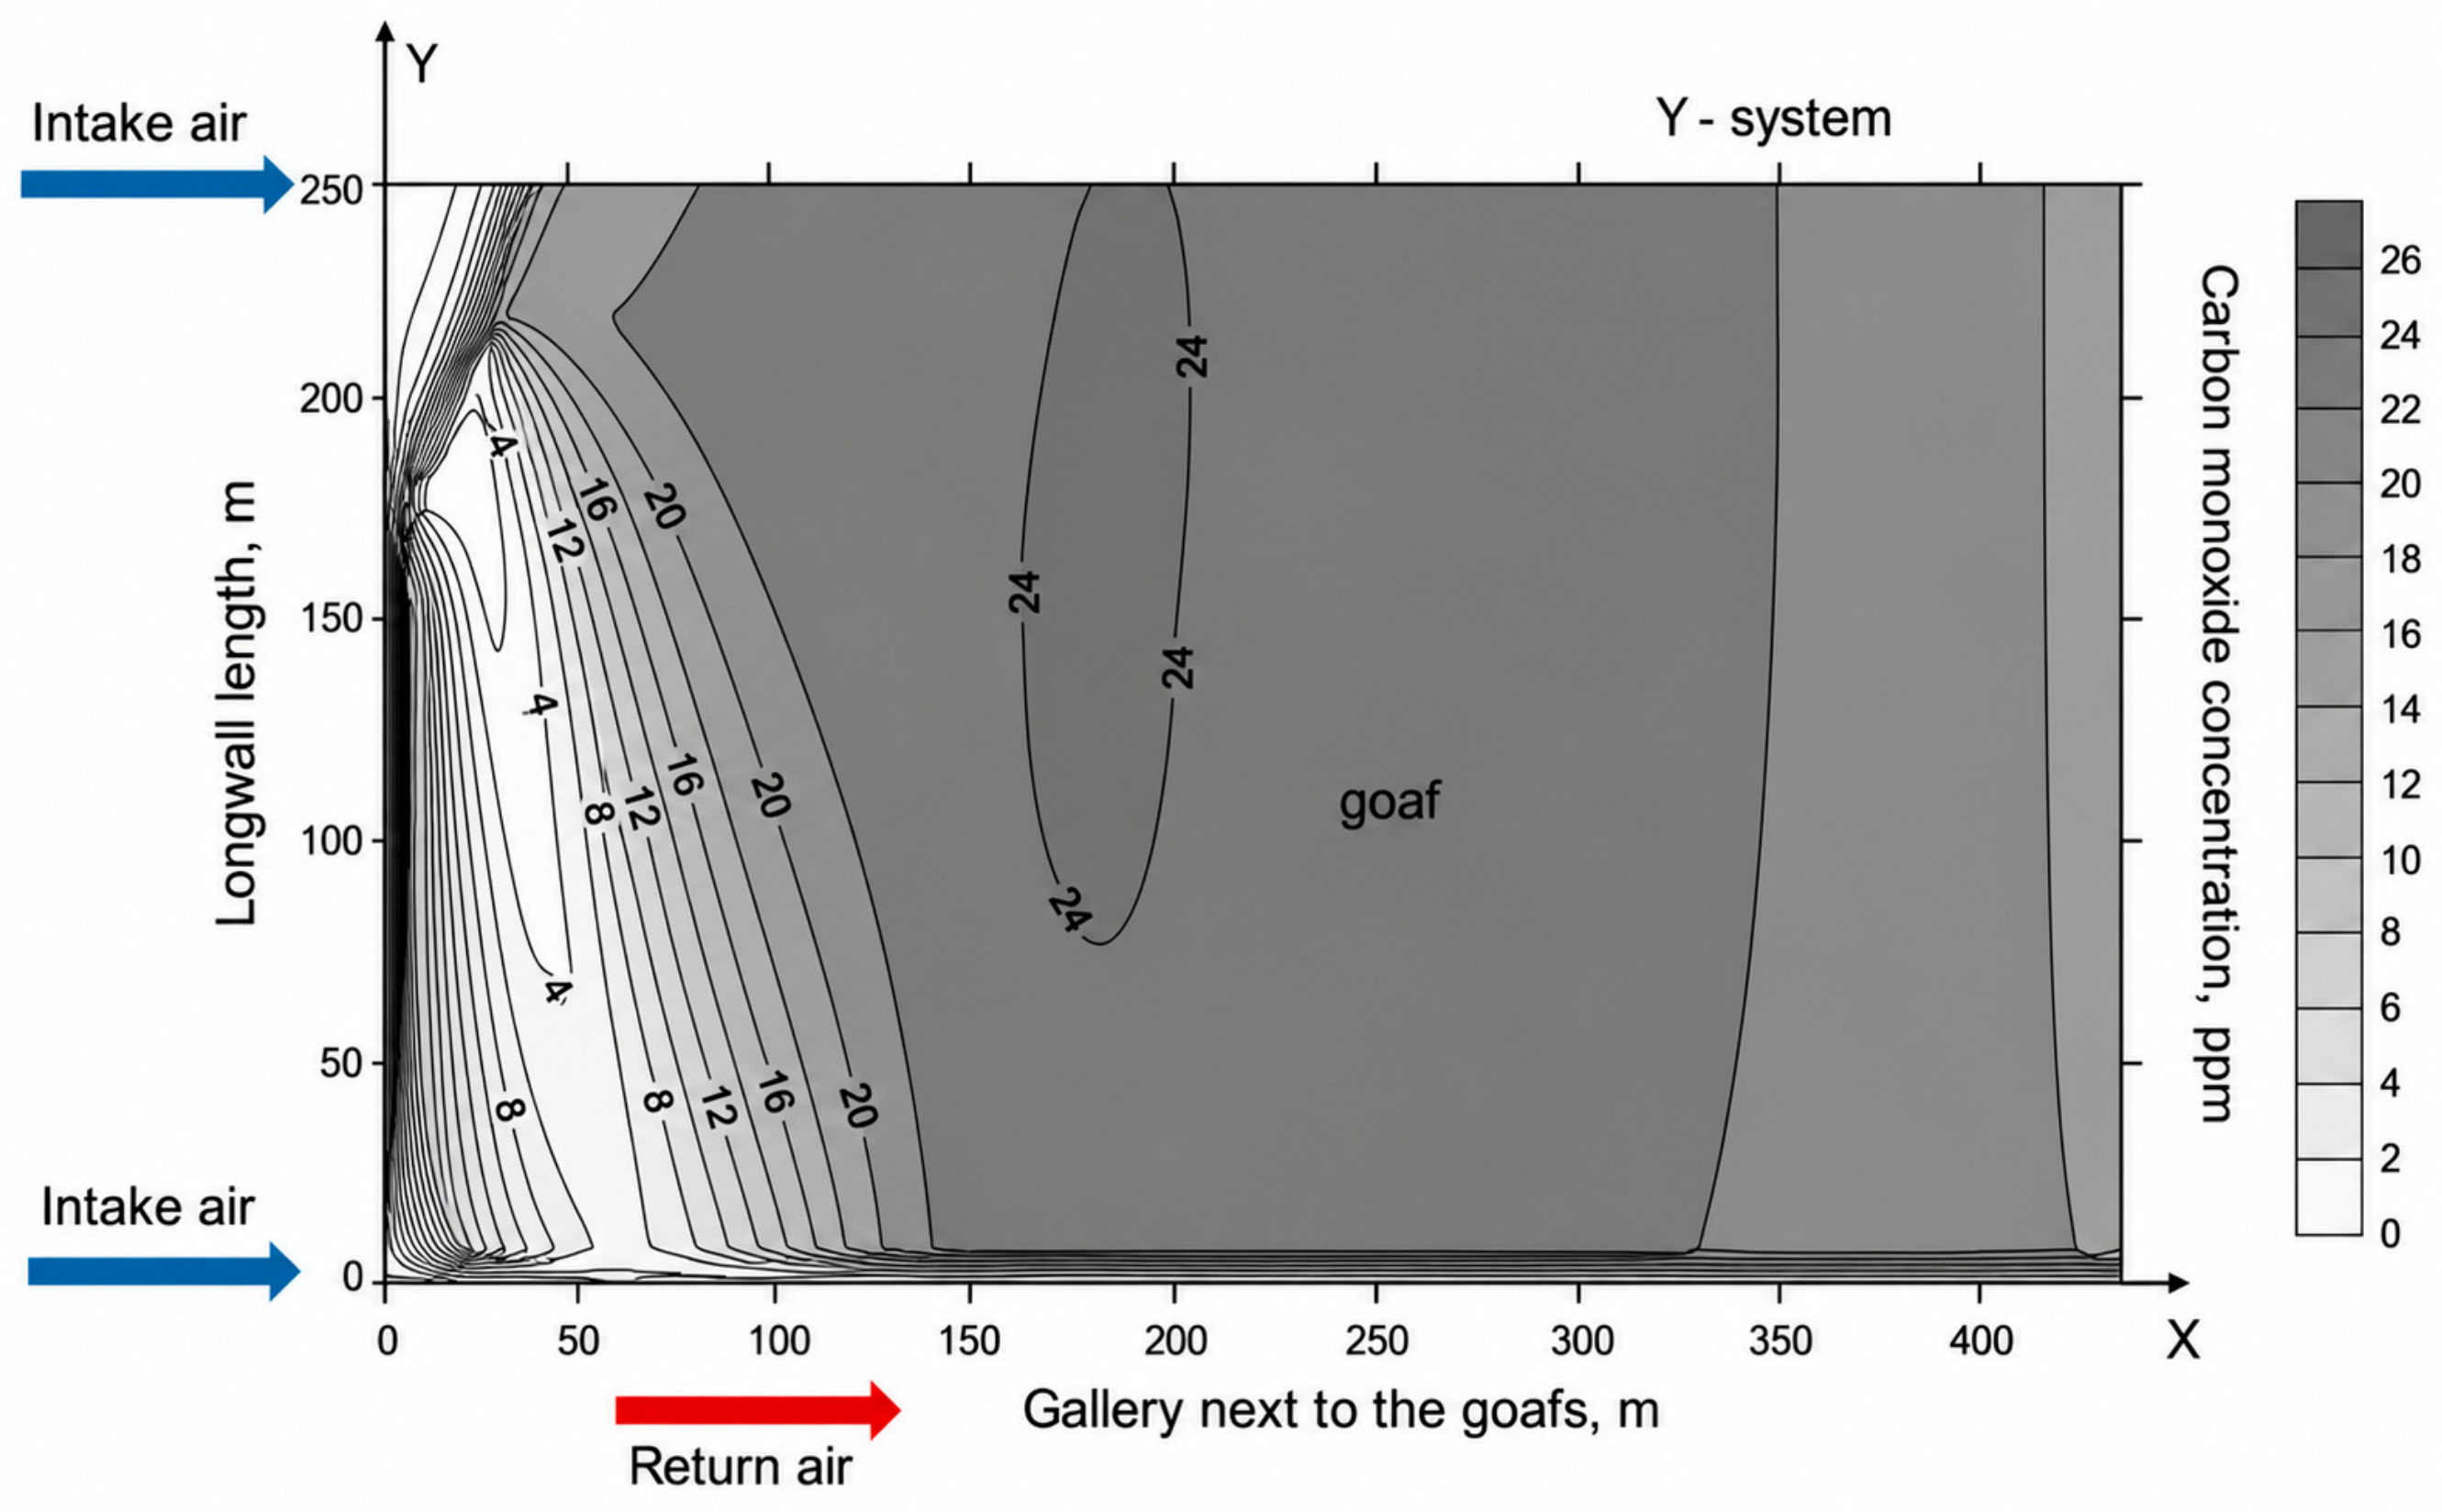
Figure 6). Oxygen supplied with the fresh air penetrates into the goaf and reaches approximately 75 m from the inlet. Its presence in this region provides the conditions for oxidation of the residual coal. The oxidation process results in the formation of carbon monoxide (
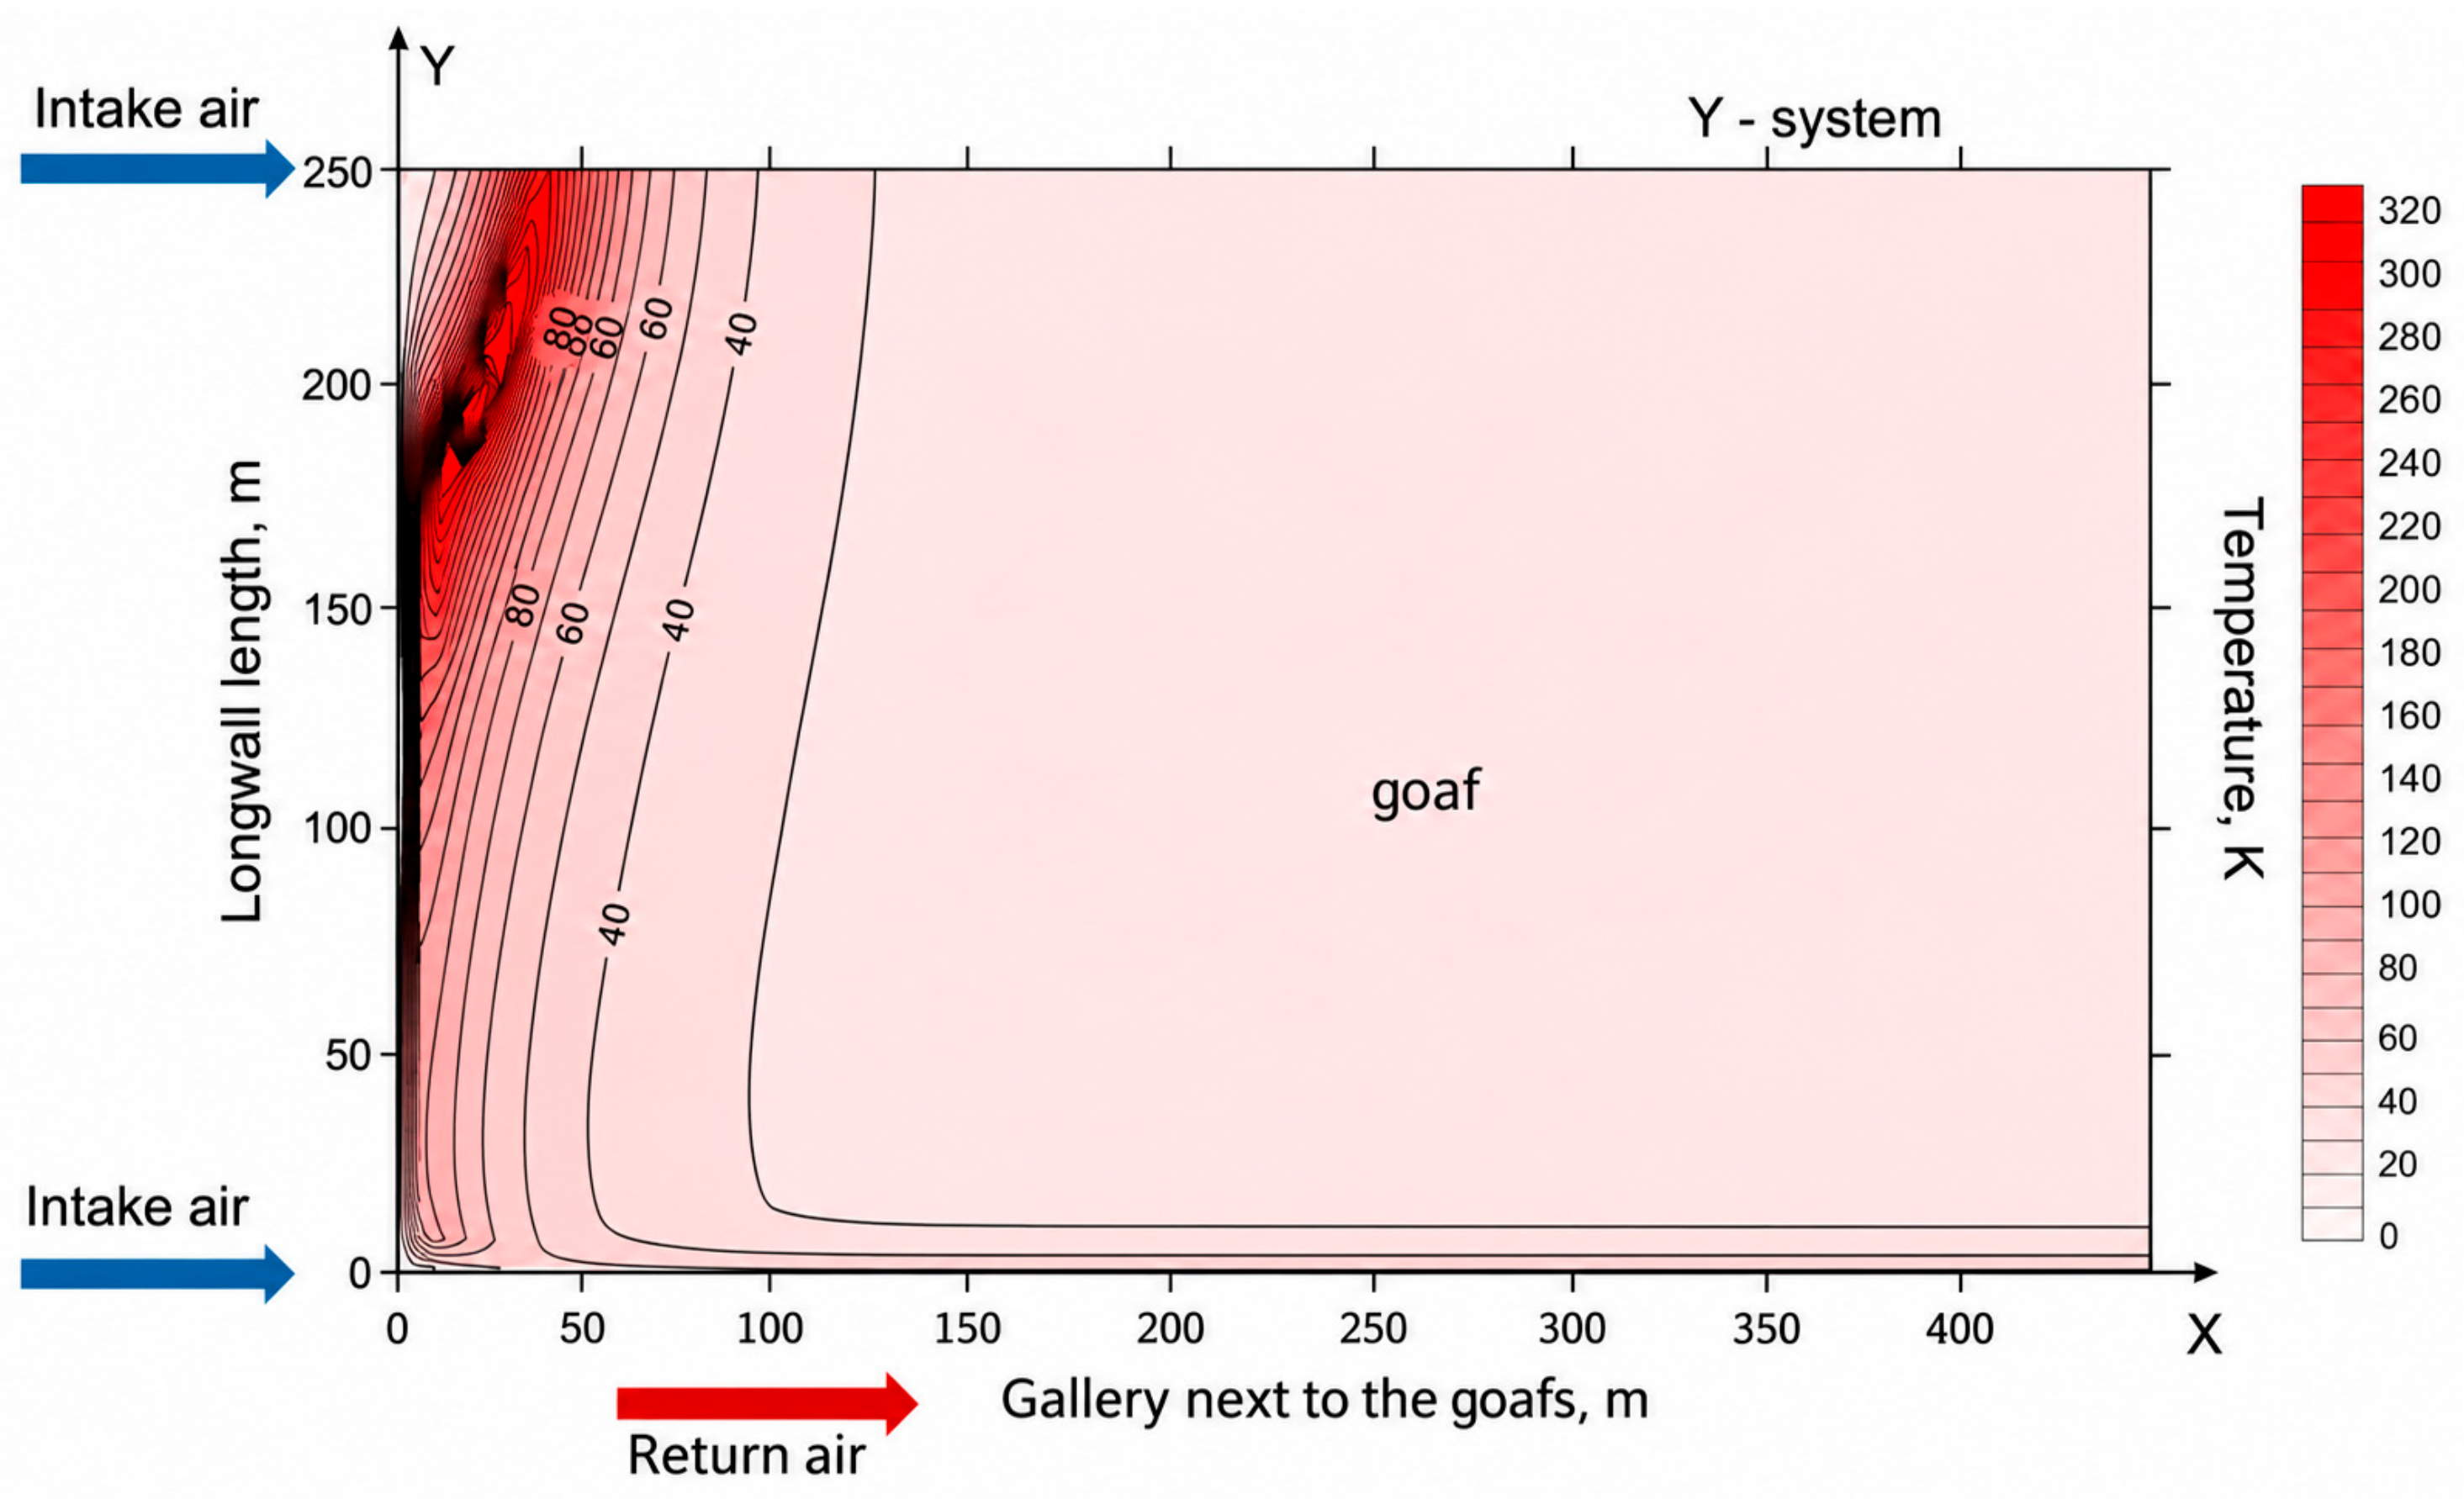
Figure 7) and is accompanied by an increase in gas temperature (
Figure 8), indicating the development of the self-heating process. The calculated fields therefore illustrate a consistent sequence of coupled phenomena: fresh-air ingress, oxygen penetration, oxidation of residual coal, formation of carbon monoxide, and heat generation.
Because direct access to the goaf is not available, the calculated distributions cannot be directly validated within the goaf. However, comparison with operational measurements available at the inlet (250 m) and outlet (0 m) indicates that the predicted qualitative trends in gas concentrations are consistent with practical observations.
Figure 9,
Figure 10,
Figure 11 and
Figure 12 present the corresponding distributions for the Y-type ventilation configuration shown in
Figure 4. In this configuration, fresh air enters the system at 250 m, while an additional air stream is introduced near the outlet region. The resulting flow configuration promotes deeper penetration of oxygen into the goaf compared with the U-type system. Consequently, oxygen remains available over a larger region for oxidation of residual coal, which is reflected in the distributions of methane, oxygen, carbon monoxide, and gas temperature.
The results indicate that, under the analysed conditions, the Y-type configuration creates a greater potential for coal oxidation and self-heating than the U-type configuration, particularly in regions containing residual coal and characterised by locally modified flow conditions.
The additional return airway in the Y-type configuration also provides additional boundary locations at which the model results can be compared with operational measurements. This may facilitate more extensive indirect validation of the model in future studies.
Although direct validation within the goaf is not currently feasible, the calculated distributions exhibit trends that are qualitatively consistent with operational observations and previously reported behaviour of gas flow and coal self-heating in goaf regions. The simulations demonstrate the capability of the proposed modelling framework to analyse the coupled effects of ventilation, gas transport, chemical reactions, and heat transfer and to compare the resulting self-heating potential for different ventilation configurations. Further work will focus on quantitative validation using available indirect field measurements and on systematic sensitivity analyses of the model parameters.
6. Conclusions
The present study developed a mathematical and numerical framework for analysing transient coupled heat and mass transfer processes associated with coal self-heating in a reactive porous medium. The model accounts for gas filtration through the goaf, transport of individual gas components, heat transfer between the gas and solid phases, heat generation due to heterogeneous and homogeneous reactions, and the resulting evolution of gas composition and temperature.
Numerical simulations were performed for U-type and Y-type ventilation configurations. The results demonstrate that the ventilation layout has a significant influence on gas flow, oxygen penetration, gas composition, and the development of thermal conditions within the goaf. Under the conditions analysed, the Y-type configuration promoted deeper oxygen penetration and therefore created a greater potential for coal oxidation and self-heating than the U-type configuration.
The calculated distributions of methane, oxygen, carbon monoxide, and gas temperature form a physically consistent sequence of processes associated with coal self-heating. The results also demonstrate the importance of considering the coupling between ventilation-induced gas flow, species transport, chemical reactions, and heat transfer when analysing fire-development conditions in porous goaf regions.
The numerical calculations were performed using different grid resolutions to assess the stability and convergence of the solution, and the grid adopted in the present study was found to be sufficient for the analysed processes. The model parameters describing transport properties are based on values established in previous studies and are used here as input data for the self-heating simulations; their independent determination is outside the scope of the present work.
The main limitation of the present study is the lack of direct measurements within the inaccessible goaf region. The current validation is therefore based on qualitative comparison with operational measurements available at the boundaries of the analysed domain. Further work should focus on quantitative validation using indirect field measurements and on systematic sensitivity analyses of the model parameters. Extension of the model to include moisture transport and phase-change effects may also be considered in future studies.