Article

High-Frequency Oscillation Suppression in a PMSG-Based Grid-Connected System via a Current-Feedback Active Damping Strategy with Coordinated Multi-Index Tuning

School of Electric Power Engineering, South China University of Technology, Guangzhou 510641, China
*
Author to whom correspondence should be addressed.
Energies 2026, 19(17), 4115; https://doi.org/10.3390/en19174115
Submission received: 30 July 2026 / Revised: 23 August 2026 / Accepted: 30 August 2026 / Published: 31 August 2026

Abstract

This paper proposes a current-feedback active damping strategy to address the high-frequency oscillations in permanent-magnet synchronous generator (PMSG)-based grid-connected systems. The core idea is an active damping controller with coordinated multi-index tuning that jointly considers the impedance–intersection margin, dominant-resonance suppression depth, sideband component increment, and total harmonic distortion. First, positive- and negative-sequence GSC output impedance models are established by incorporating the inner current loop, phase-locked loop, sampling delay, and filter dynamics, and their accuracy is verified through frequency sweep tests. Based on these models, the high-frequency stability mechanism is analyzed using an impedance-based criterion, and parameter sweep studies identify the key control and delay parameters affecting the high-frequency impedance characteristics. Subsequently, a current-feedback active damping controller is designed to reshape the GSC output impedance while minimizing its influence on non-target frequency components. Finally, case studies demonstrate that the proposed strategy eliminates adverse high-frequency impedance intersections and suppresses the target oscillation. Comparison with a virtual-admittance method further confirms a more favorable balance between stability enhancement and power-quality preservation under the investigated operating condition.

1. Introduction

As the global energy structure undergoes an accelerated low-carbon transition, the installed capacity of renewable energy, particularly wind power, continues to increase significantly. The permanent-magnet synchronous generator (PMSG)-based direct-drive wind turbine has become a prominent technology in grid-connected wind power systems [1]. However, the large-scale integration of PMSGs into weak grids via power electronic converters intensifies interactions among the turbine control loops, filter, sampling link, and grid [2,3]. These interactions can readily create impedance intersections in the high-frequency range and give rise to negative damping characteristics, which in turn lead to high-frequency oscillations [4,5]. Such oscillations can amplify grid-connected voltage and current harmonics and degrade power quality. In severe cases, they may also compromise the safety of converters and wind turbine equipment. Therefore, investigating the mechanism of high-frequency oscillations in PMSG-based grid-connected systems and developing effective suppression strategies are critical for ensuring the secure and stable operation of power systems.
Existing methods for suppressing high-frequency oscillations in power electronics-based grid-connected systems can generally be classified into passive and active damping approaches. Passive damping methods dissipate oscillation energy within specific frequency bands by adding damping filters or modifying existing filter branches [6,7,8,9,10,11]. For example, Ref. [8] introduces a passive damping filter to mitigate negative damping in the high-frequency range. Ref. [9] considers the cable-capacitance effect in offshore wind farm collection networks and proposes a hybrid active–passive damping method based on the impedance model of the converter–network system. Further developments in bypass and C-type damping filters are presented in [10,11] for subsynchronous oscillation suppression, wideband oscillation mitigation, and harmonic attenuation. Although passive damping methods offer clear physical mechanisms and relatively straightforward implementation, they generally require additional hardware and may increase power losses. Their effectiveness also depends strongly on frequency-specific parameter design. Moreover, the added damping branches may alter the original power-transfer characteristics of the system.
By contrast, active damping methods reshape the output impedance of grid-connected converters by introducing additional feedback loops or virtual impedances into the converter control, thereby enhancing damping without the need for extra primary hardware [12,13,14]. For instance, Ref. [14] embeds an active filtering function into the wind turbine converter control to suppress harmonic voltage amplification in offshore wind farms. Ref. [15] tackles high-frequency oscillations in grid-connected inverters of PMSG-based direct-drive wind turbines through a capacitor-current-feedback active damping strategy designed to improve damping in the LCL filter resonance region. Compared with passive damping approaches, active damping methods eliminate additional hardware costs and provide greater flexibility in parameter tuning. However, active damping controllers typically require additional feedback signals, filtering stages, or virtual impedance blocks, thereby increasing the structural complexity of the control system. Furthermore, their damping performance is susceptible to sampling delays, control bandwidth limitations, sensor noise, and variations in operating conditions [16]. Parameter design may not only attenuate the original dominant oscillation peak but also induce resonance frequency shifts, increase harmonic components in non-target frequency bands, and even introduce negative damping in new frequency bands [17,18]. Consequently, relying solely on amplitude attenuation at the target oscillation frequency as the design criterion for active damping is insufficient; it is imperative to further evaluate the impact of impedance reshaping on the full-frequency-band stability margin and power quality.
In recent years, research has increasingly shifted toward adaptive and coordinated oscillation suppression strategies. Ref. [19] proposes an adaptive wideband oscillation suppression control for offshore wind farm integration, addressing wideband oscillation challenges with its effectiveness validated through high-frequency case studies. From a device- and station-level coordinated optimization perspective, Ref. [20] develops an oscillation stability control method based on supplementary dissipation compensation to enhance the system-level damping of PMSG wind farms. Although these approaches improve adaptability and system-wide coordination in oscillation suppression, they generally involve more complex system modeling, parameter identification, or multi-layer control coordination, thereby increasing implementation complexity.
In summary, existing suppression strategies still exhibit two main limitations. First, many existing methods are designed for specific converter topologies, oscillation frequencies, or nominal operating conditions. Variations in wind turbine parameters, grid impedance, or filter configuration may shift the critical impedance intersection or introduce additional negative damping regions [21,22,23]. Therefore, a fixed-parameter design may require retuning when the operating condition changes. Second, active damping controllers are often designed primarily to attenuate the dominant resonance, with insufficient consideration of harmonic amplification in non-target frequency bands, sideband elevation (i.e., the elevation of high-frequency components adjacent to the dominant oscillation frequency), and total harmonic distortion (THD). Consequently, suppressing the dominant oscillation alone may not ensure simultaneous improvements in system stability and power quality after impedance reshaping.
To bridge this gap, this paper proposes a current-feedback active damping strategy for high-frequency impedance reshaping. The core idea involves incorporating a notch filter into the feedback path to reject the fundamental current component, while utilizing the remaining non-fundamental components to generate a supplementary modulation signal that reshapes the high-frequency impedance. The controller gain is determined according to the impedance-intersection margin, and the frequency-selectivity parameter is iteratively adjusted by jointly considering the dominant-resonance suppression depth, sideband-component increment, and THD. Consequently, the proposed strategy not only eliminates adverse high-frequency impedance intersections but also effectively mitigates harmonic amplification outside the target oscillation band.
The main contributions are as follows:
(1)
Positive- and negative-sequence terminal impedance models of the PMSG-based direct-drive wind turbine are established for high-frequency stability analysis. The effects of the inner current loop, PLL, and sampling delay are incorporated, and the model accuracy is validated through frequency sweep tests.
(2)
The high-frequency oscillation mechanism is clarified from the perspective of impedance interaction. Parameter sweep analysis identifies the filter parameters, inner-current-loop proportional gain, and sampling delay as the principal factors affecting the high-frequency impedance characteristics and demonstrates the limitations of conventional parameter retuning.
(3)
A current-feedback active damping strategy with coordinated multi-index tuning is proposed, in which the controller gain and frequency-selectivity parameter are jointly determined using the impedance-intersection margin, dominant-resonance suppression depth, sideband-component increment, and THD. A fundamental-frequency notch filter rejects the fundamental current component from the damping channel, while the retained non-fundamental components generate a supplementary modulation signal for high-frequency impedance reshaping. Consequently, the proposed strategy eliminates adverse impedance intersections while limiting harmonic amplification in non-target frequency bands.
The remainder of this paper is organized as follows. Section 2 establishes the positive- and negative-sequence impedance models of the PMSG-based grid-connected system. Section 3 analyses the high-frequency stability and investigates the effects of control parameters on the high-frequency impedance characteristics through parameter sweep analysis. Section 4 proposes a current-feedback active damping strategy for high-frequency oscillation suppression. Section 5 presents case studies to verify the effectiveness and superiority of the proposed current-feedback active damping strategy. Finally, Section 6 summarizes the main findings and concludes the paper.

2. Sequence-Domain GSC Output Impedance Model of PMSG Grid-Connected System

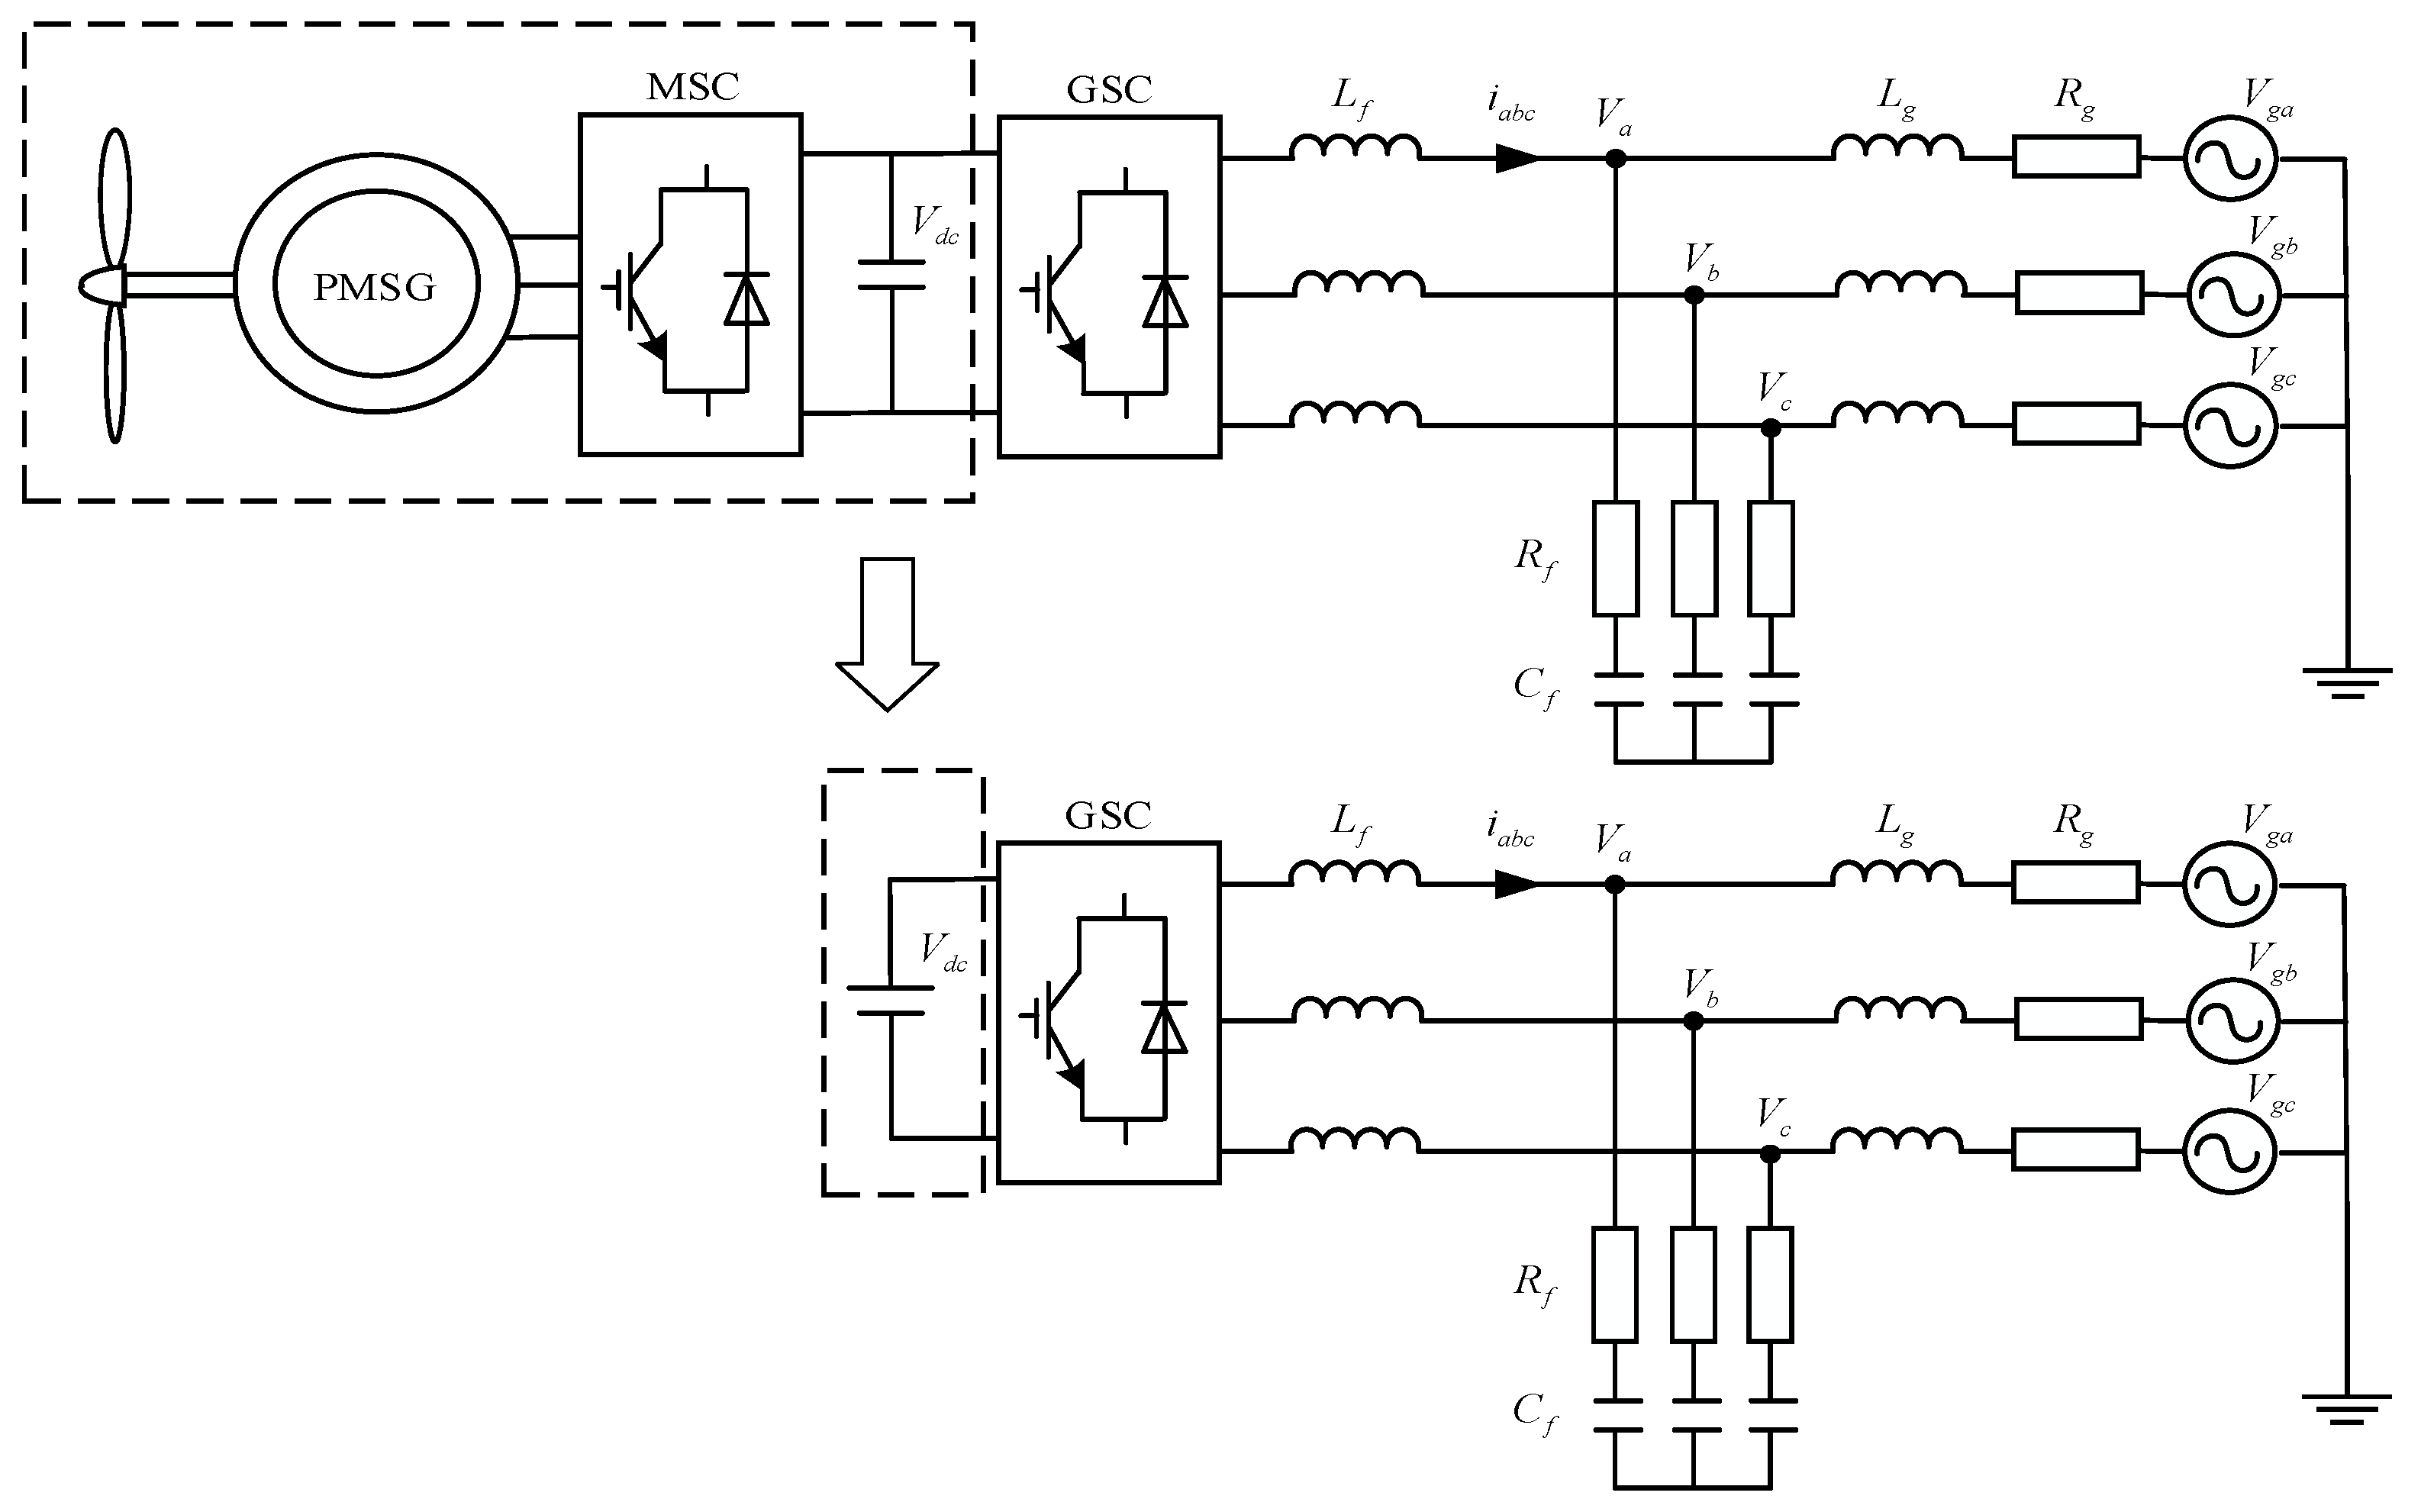
The topology of the PMSG-based grid-connected system is illustrated in Figure 1 and can be divided into the main circuit and the control system. The main circuit is primarily composed of the machine-side converter (MSC), grid-side converter (GSC), and its associated filter, while the control system encompasses the phase-locked loop (PLL), the outer control loop, and the inner current control loop.
In a full-scale PMSG wind turbine, the MSC regulates generator torque and rotor speed for maximum power extraction, whereas the GSC maintains the DC-link voltage and controls grid-side power exchange. For the high-frequency range considered in this study, the GSC output impedance is governed primarily by the GSC inner current loop, PLL, sampling delay, and filter dynamics, while the DC-link-voltage and other outer control loops have substantially lower bandwidths and exert only a limited influence on the impedance characteristics [24]. Moreover, when the DC link is sufficiently stiff, the machine- and grid-side dynamics can be approximately decoupled through the DC-link capacitor [23,25]. Accordingly, the PMSG–MSC subsystem is not explicitly modeled; instead, the DC terminal of the GSC is represented by an ideal constant-voltage source, and only the GSC and its high-frequency control dynamics are retained in the detailed impedance model [15]. This approximation is restricted to balanced high-frequency small-signal analysis. The machine-side, DC-link, and outer-loop dynamics should be retained when analyzing sub-synchronous or medium-frequency oscillations, substantial DC-link voltage variations, or systems with limited DC-link capacitance.
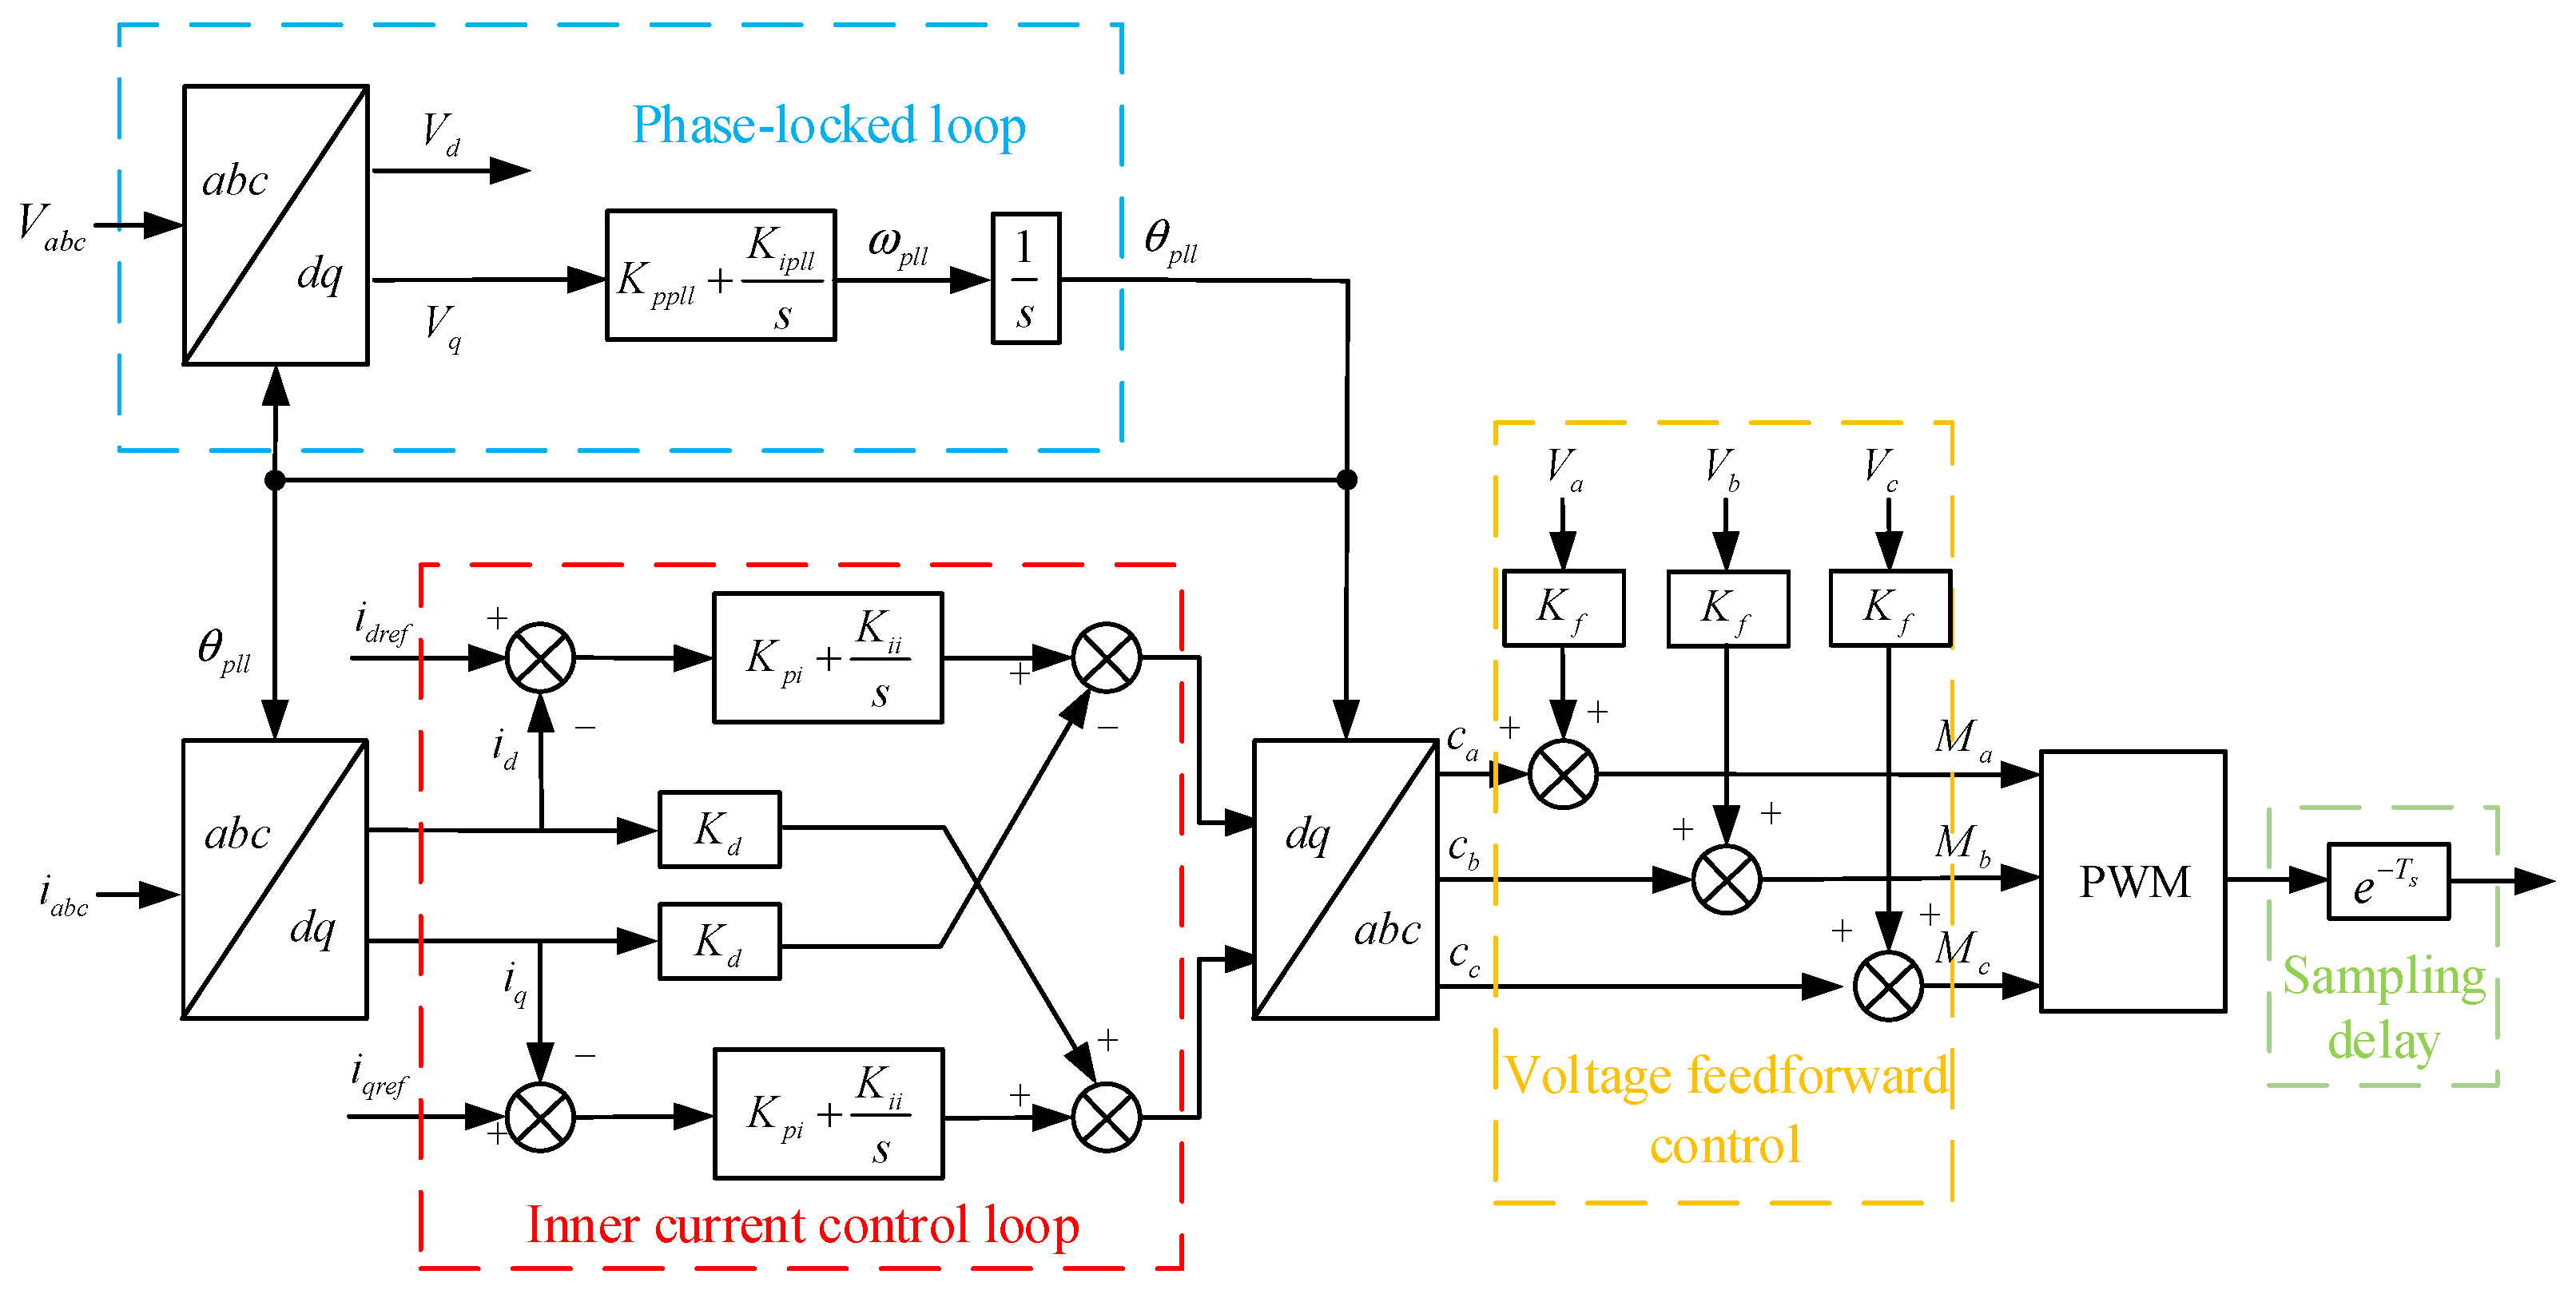
The electrical quantities are defined as follows: V d c is the DC-link voltage; L f is the filter inductance; R f and C f are the damping resistance and filter capacitance, respectively; L g and R g are the equivalent inductance and resistance of the grid; V g a , V g b , V g c represent the three-phase grid voltages; i a b c is the grid-connected current from the wind turbine; and V a , V b , V c are the three-phase voltages at the point of common coupling. In the diagram, c a , c b , c c denote the outputs of the inner current control loop in the stationary reference frame; M a , M b , M c are the modulation signals; K f is the voltage feedforward gain; and K d represents the decoupling coefficient. In the subsequent analysis, the DC-link voltage fluctuation is neglected, and its value is assumed to be constant, such that the focus remains on the dynamics of the PLL and the inner current control loop.
Before deriving the impedance model, the applicability of the sequence-domain formulation is specified. Both dq-domain and sequence-domain impedance representations have been widely used for converter-grid stability analysis, with each offering distinct practical advantages [26,27]. In the high-frequency range considered in this study, which is well above the PLL and outer-loop bandwidths, mirror-frequency coupling is comparatively weak under the balanced small-signal conditions considered here. Accordingly, the off-diagonal sequence-coupling terms are neglected, and the positive- and negative-sequence impedances are represented by two scalar models. This approximation is adopted specifically for balanced high-frequency small-signal analysis. When mirror-frequency coupling becomes significant, the full 2 × 2 matrix representation should be retained.
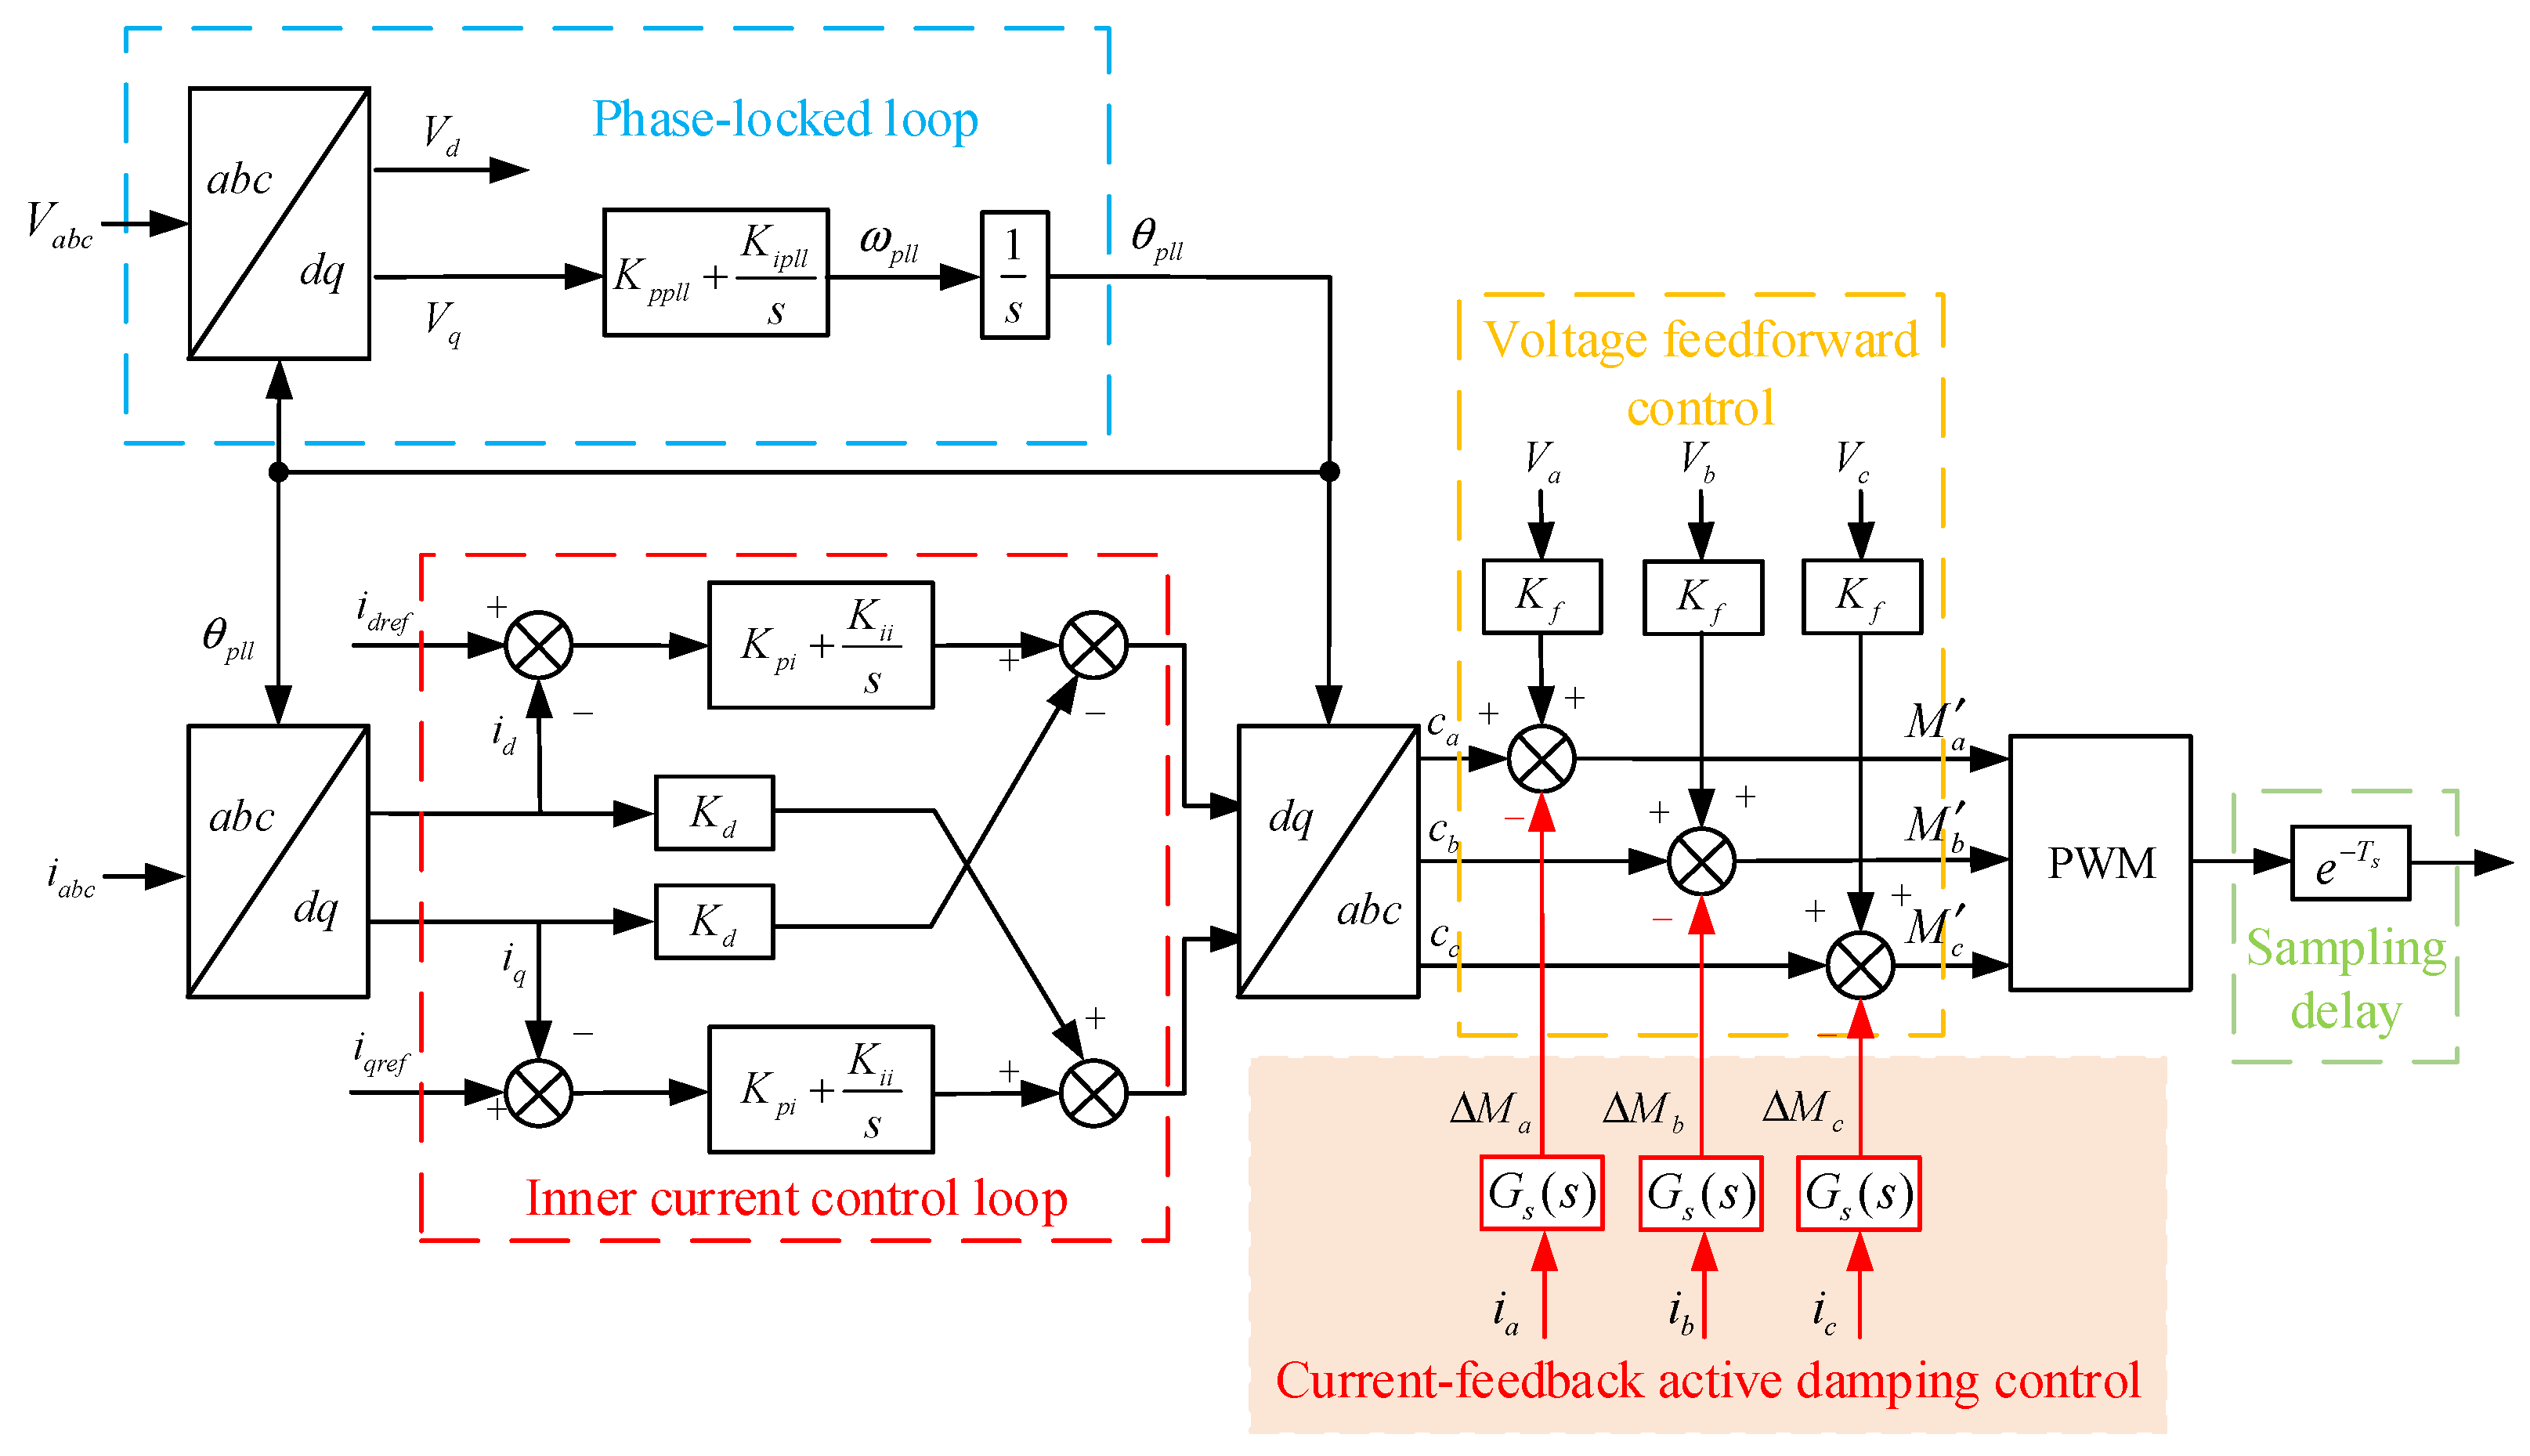
Based on the topology shown in Figure 2, a frequency-domain small-signal modeling approach is adopted [5]. K p p l l and K i p l l represent the proportional and integral coefficients of PI controller in PLL, respectively; K p i and K i i represent the proportional and integral coefficients of PI controller in inner current control loop, respectively; K f and K d represent the voltage feedforward gain and decoupling coefficient, respectively. The time-domain expressions for the phase-a voltage and current can be expressed as follows:
V a t = V 1 cos ( 2 π f 1 t ) + V p cos ( 2 π f p t + φ v p ) + V n cos ( 2 π f n t + φ v n ) i a t = I 1 cos ( 2 π f 1 t + φ i 1 ) + I p cos ( 2 π f p t + φ i p ) + I n cos ( 2 π f n t + φ i n )
When transformed into the frequency domain, these expressions become
V a f = V 1 , f = ± f 1 V p , f = ± f p V n , f = ± f n , I a f = I 1 , f = ± f 1 I p , f = ± f p I n , f = ± f n
where V 1 = 1 2 V 1 e 0 , V p = 1 2 V p e ± j φ v p , V n = 1 2 V n e ± j φ v n , I 1 = 1 2 I 1 e ± j φ i 1 , I p = 1 2 I p e ± j φ i p , I n = 1 2 I n e ± j φ i n .
The control equation of the PLL in the frequency domain is given by
θ [ f ] = G p l l ( s ) V q [ f ]
In the above expression, G p l l ( s ) = ( K p p l l + K i p l l / s ) / s represents the transfer function of the PLL control loop. Define the following intermediate variable T p l l ( s ) :
T p l l s = V l G p l l s 1 + V l G p l l s
The PLL can then be expressed as
Δ θ [ f ] = ± j T p l l ( s ) G v ( s ± 2 π f 1 ) V p / V 1 , f = ± ( f p f 1 ) j T p l l ( s ) G v ( s 2 π f 1 ) V n / V 1 , f = ± ( f n + f 1 )
where G v ( s ) denotes the voltage sampling function, which incorporates the sampling delay, the PWM delay, and the sampling low-pass filter [28]. The expression for G v ( s ) is given by
G v ( s ) = e T s s ( 1 e T s s ) / [ ( T s s ) ( 1 + s / ω v ) ]
The control equation of the inner current loop can be expressed as
c d = ( i d r e f i d ) H i ( s ) K d i q c q = ( i q r e f i q ) H i ( s ) + K d i d
where H i ( s ) = K p i + K i i / s denotes the transfer function of the current PI controller.
Based on the modulation relationship of the three-phase voltages, Equations (8) and (9) can be derived as follows:
M a = c a + K f V a
s L f i a i b i c = M a M b M c V dc 2 V a V b V c
By substituting the three-phase voltage and current expressions into Equation (9), the positive- and negative-sequence GSC output impedance models can be obtained as follows:
Z p ( s ) = V p ( s ) I p ( s ) = s L f + V dc 2 ( H i ( s j 2 π f 1 ) j K d ) G i ( s ) 1 V dc 2 K f G v ( s ) V dc 4 T p l l ( s j 2 π f l ) V l G v ( s ) H i ( s j 2 π f l ) ( i d r e f + j i q r e f ) Z n ( s ) = V n ( s ) I n ( s ) = s L f + V dc 2 ( H i ( s + j 2 π f 1 ) + j K d ) G i ( s ) 1 V dc 2 K f G v ( s ) V dc 4 T p l l ( s + j 2 π f l ) V l G v ( s ) H i ( s + j 2 π f l ) ( i d r e f j i q r e f )
where G i ( s ) denotes the current sampling function, which incorporates the sampling delay, the PWM delay, and the sampling low-pass filter. The expression for G i ( s ) is given by
G i ( s ) = e T s s ( 1 e T s s ) / [ ( T s s ) ( 1 + s / ω i ) ]
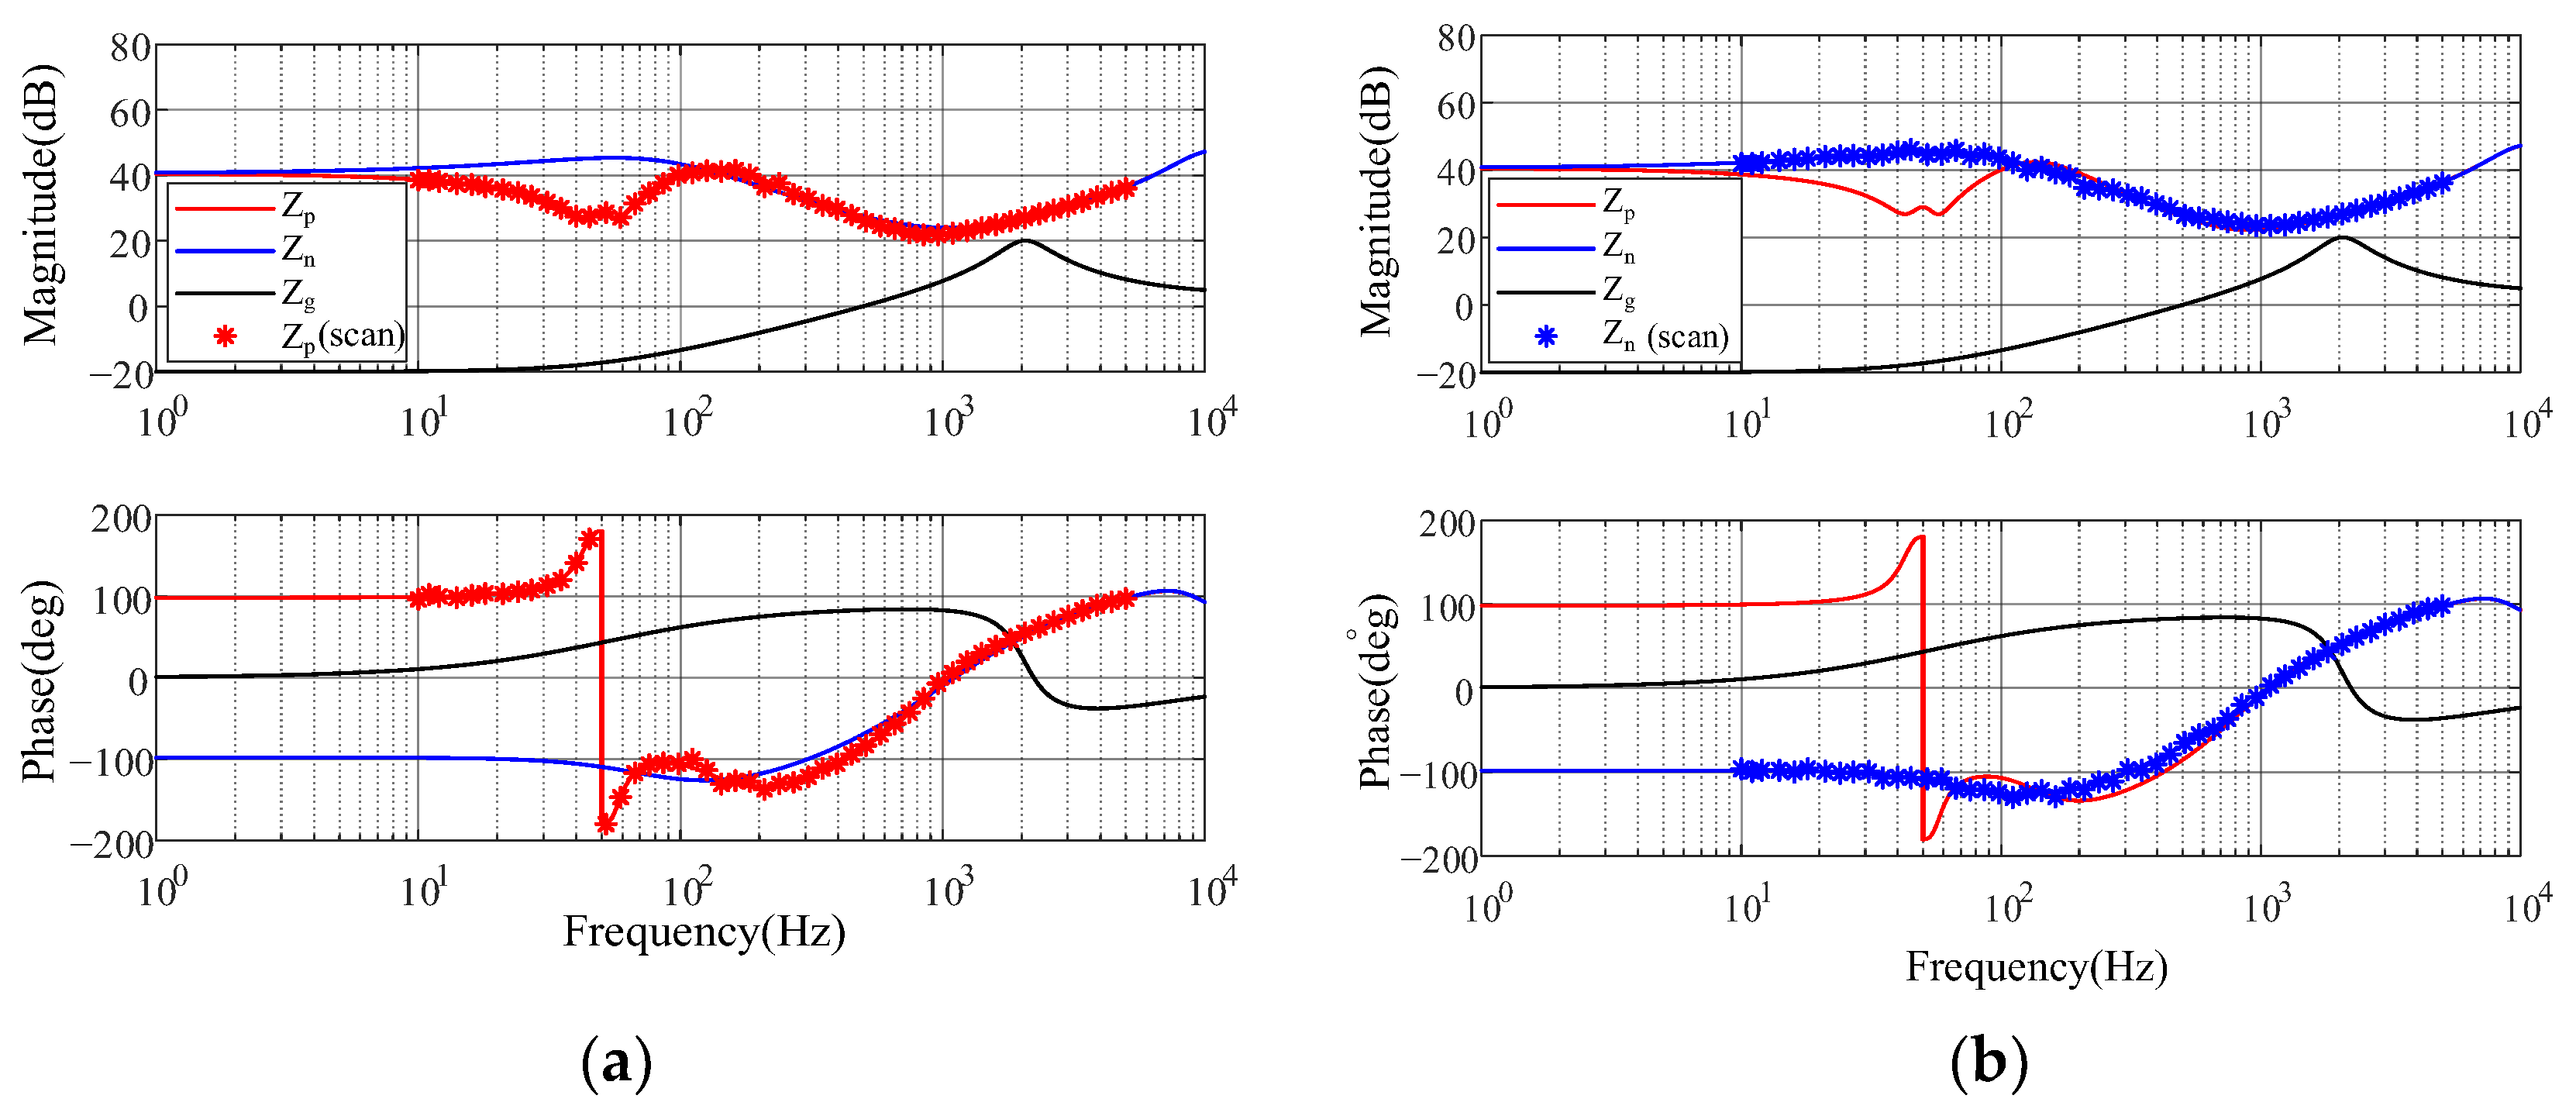
The established impedance model can be validated through frequency sweep using the parameters listed in Appendix A Table A1, with the results shown in Figure 3. The comparison reveals that the theoretical impedance curves closely match the simulated sweep curves in the high-frequency range, indicating that the developed sequence impedance model can accurately characterize the high-frequency impedance behavior of the wind turbine.
To quantify the agreement between the analytical model and the frequency sweep results, the mean absolute magnitude and phase errors are calculated at 50 sweep pointsover the range of 1000–5000 Hz. For the positive-sequence impedance, the mean absolute magnitude and phase errors are 0.134 dB and 1.171°, respectively. Regarding the negative-sequence impedance, the calculated magnitude and phase errors are 0.525 dB and 2.440°, respectively. These small discrepancies, together with the close overlap of the analytical and sweep curves, confirm that the derived model accurately reproduces the high-frequency terminal impedance.
It should be noted that the delay terms must be retained to accurately describe the high-frequency phase characteristic of the GSC output impedance; otherwise, the accuracy of impedance model might be degraded [29].

3. Analysis of High-Frequency Oscillation Mechanism and Influencing Factors

3.1. Analysis of High-Frequency Oscillation Mechanism of PMSG-Based Grid-Connected System

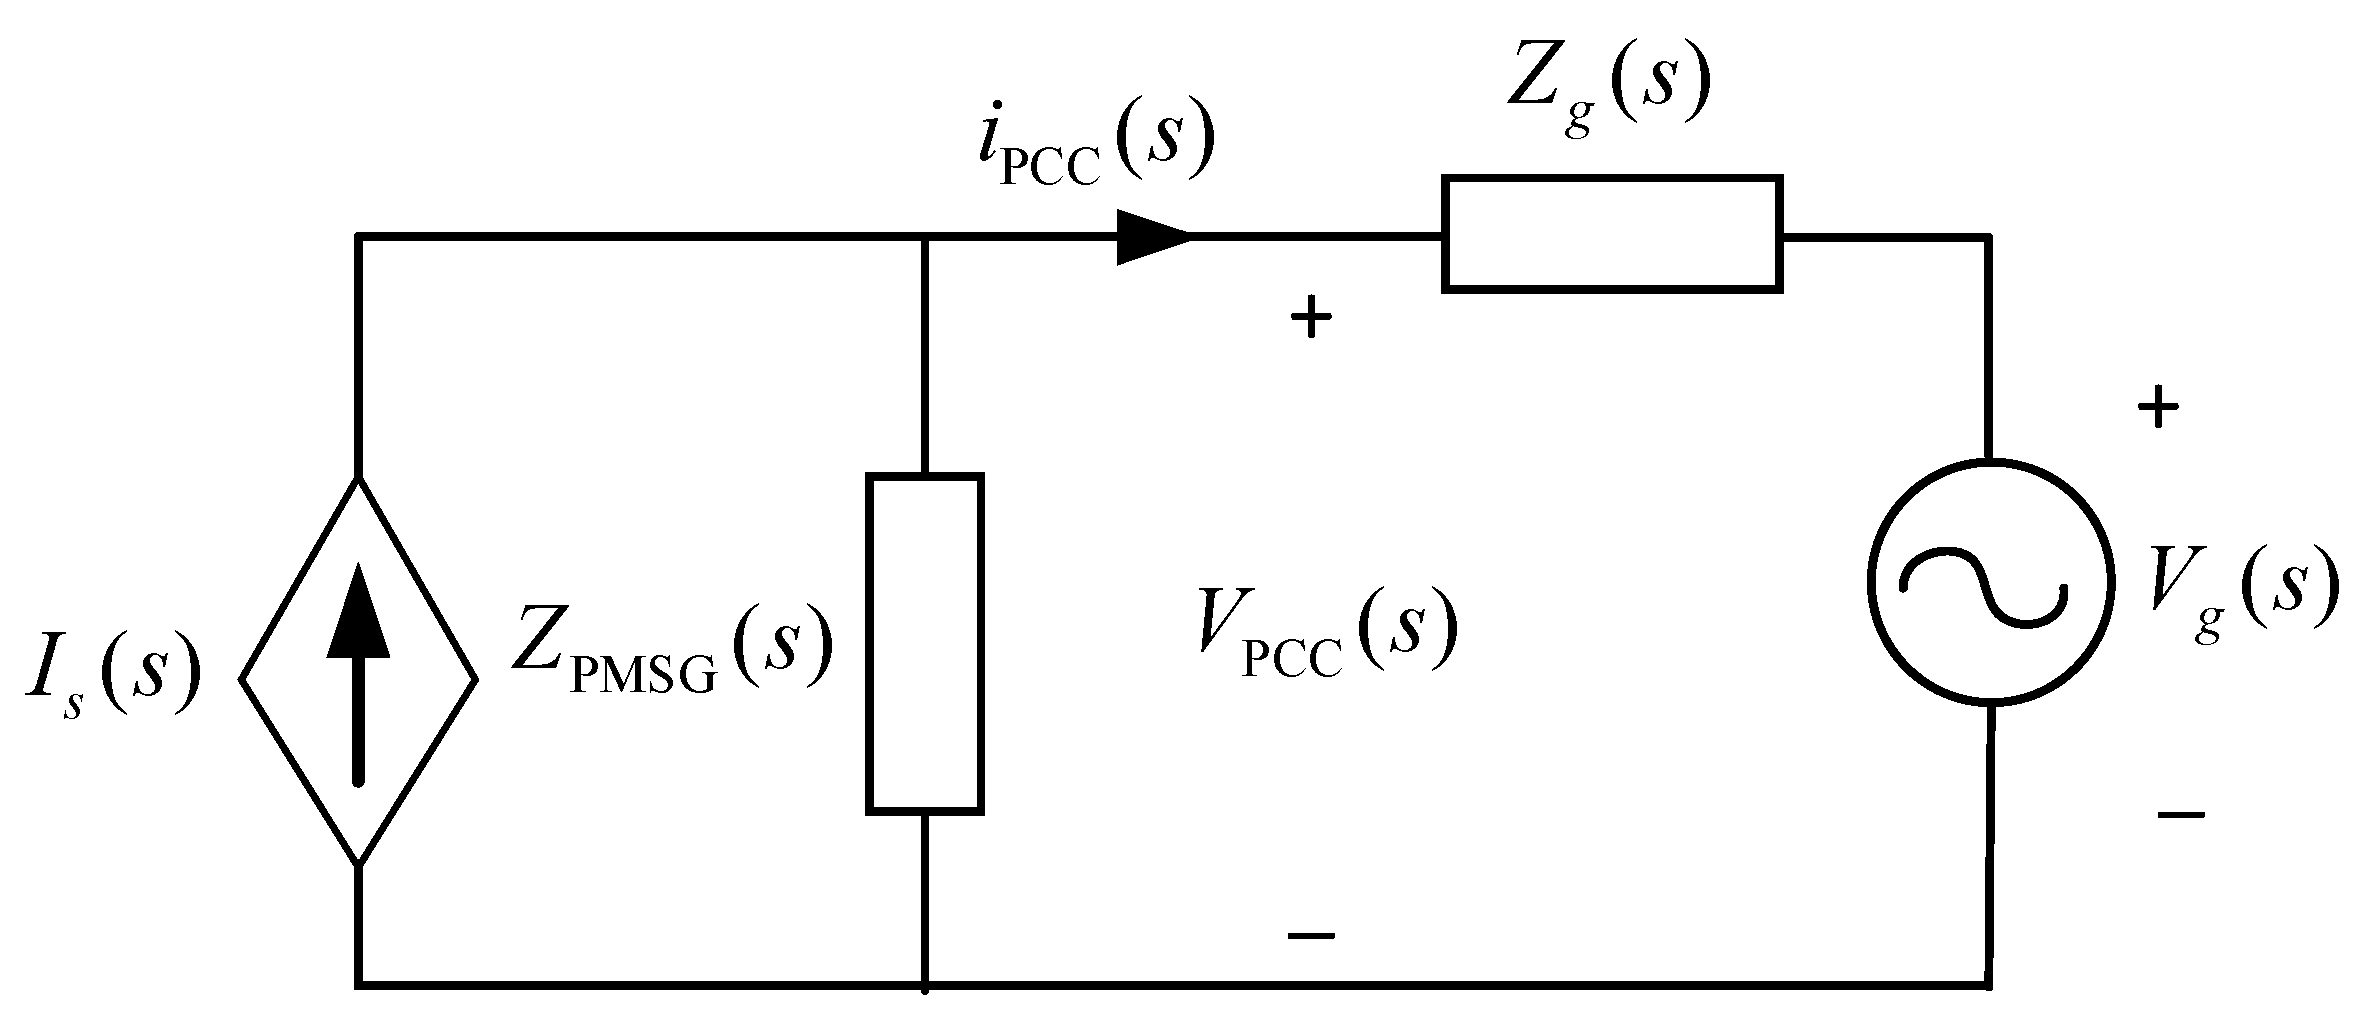
The equivalent circuit of the grid-connected direct-drive wind power system is shown in Figure 4. In Figure 4, Z PMSG ( s ) denotes the GSC output impedance, as expressed in (10); I s ( s ) represents the sum of the equivalent output currents of the converters; Z g ( s ) is the grid impedance; and V g ( s ) is the grid voltage.
The expression for the grid-connected current is given by
i PCC ( s ) = I s ( s ) V g ( s ) / Z PMSG ( s ) 1 + Z g ( s ) / Z PMSG ( s )
According to the Bode diagram criterion, in conjunction with Equation (12), if the magnitude–frequency characteristics of Z g ( s ) and Z PMSG ( s ) intersect at a frequency f x , the phase margin φ m of the grid-connected direct-drive wind power system can be expressed as Equation (13).
φ m = 180 ° ( Z g ( j 2 π f x ) Z PMSG ( j 2 π f x ) )
At each frequency f x where the magnitudes of the grid impedance and GSC output impedance are equal, the corresponding phase margin is evaluated using (13). A positive φ m indicates that the phase difference at the impedance intersection remains below 180°, and the system satisfies the small-signal stability requirement at that frequency. By contrast, φ m < 0 implies that the phase difference exceeds 180°, indicating negative damping and a potential oscillatory instability near f x . When multiple magnitude intersections exist, the phase margin should be calculated at each intersection, and the minimum value is taken as the critical stability margin. Therefore, the system stability is determined jointly by the magnitude-intersection frequencies and the phase relationship between the grid impedance and GSC output impedance.
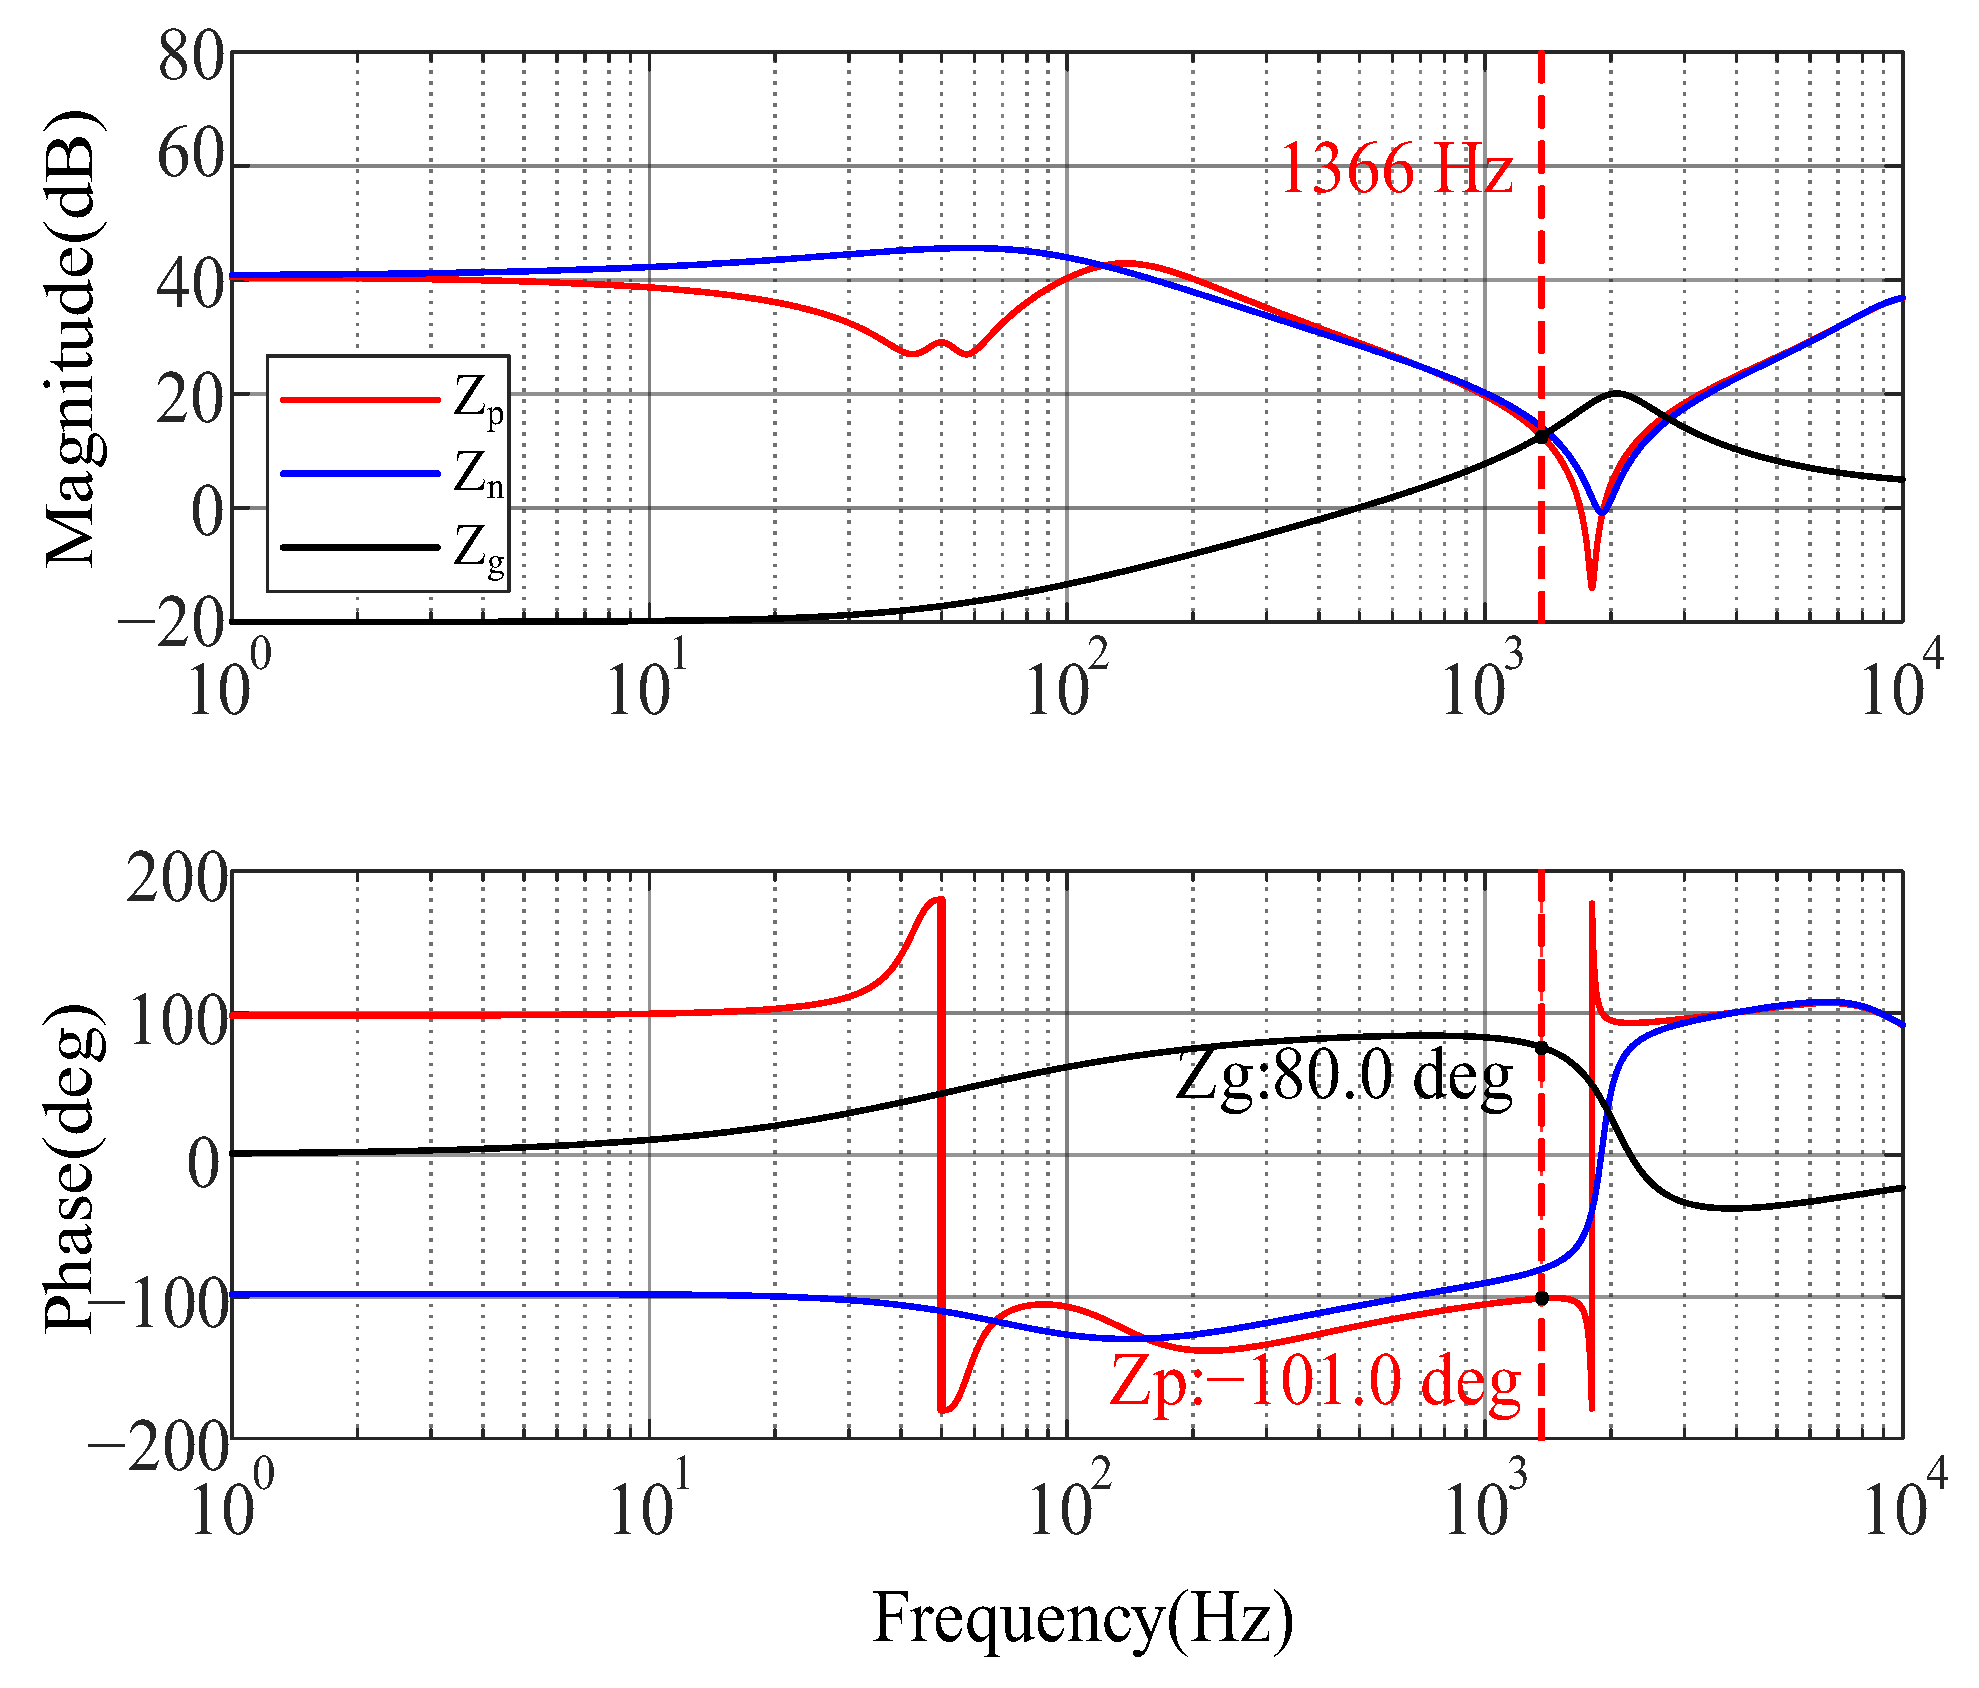
Using the parameters listed in Table A1 of Appendix A as the base case, high-frequency oscillations occur in the PMSG-based grid-connected system when the system parameters are set to conditions L f = 0.9   mH and L g = 0.3   mH , respectively. As shown in Figure 5, the magnitude curves of the GSC output impedance and grid impedance intersect at 1366 Hz, at which the phase difference reaches 181°. According to (13), the phase stability margin at this frequency is negative, indicating that the system provides negative damping in the vicinity of 1366 Hz and is thus prone to high-frequency oscillations.
The physical mechanism underlying this oscillatory instability can be interpreted as follows. Changes in the filter parameters cause the magnitude of the GSC output impedance to decrease in the high-frequency range, resulting in an intersection with the magnitude curve of the grid impedance. At the corresponding intersection frequency, the current-sampling delay and PLL introduce additional phase lag, causing the phase difference between Z g and Z PMSG to exceed 180° in magnitude. Consequently, the magnitude and phase conditions for oscillatory instability are simultaneously satisfied, and the system exhibits negative damping at this frequency. Under such conditions, even a small disturbance may be progressively amplified, eventually giving rise to sustained high-frequency oscillations.

3.2. Analysis of the Influencing Factors of Control Parameters

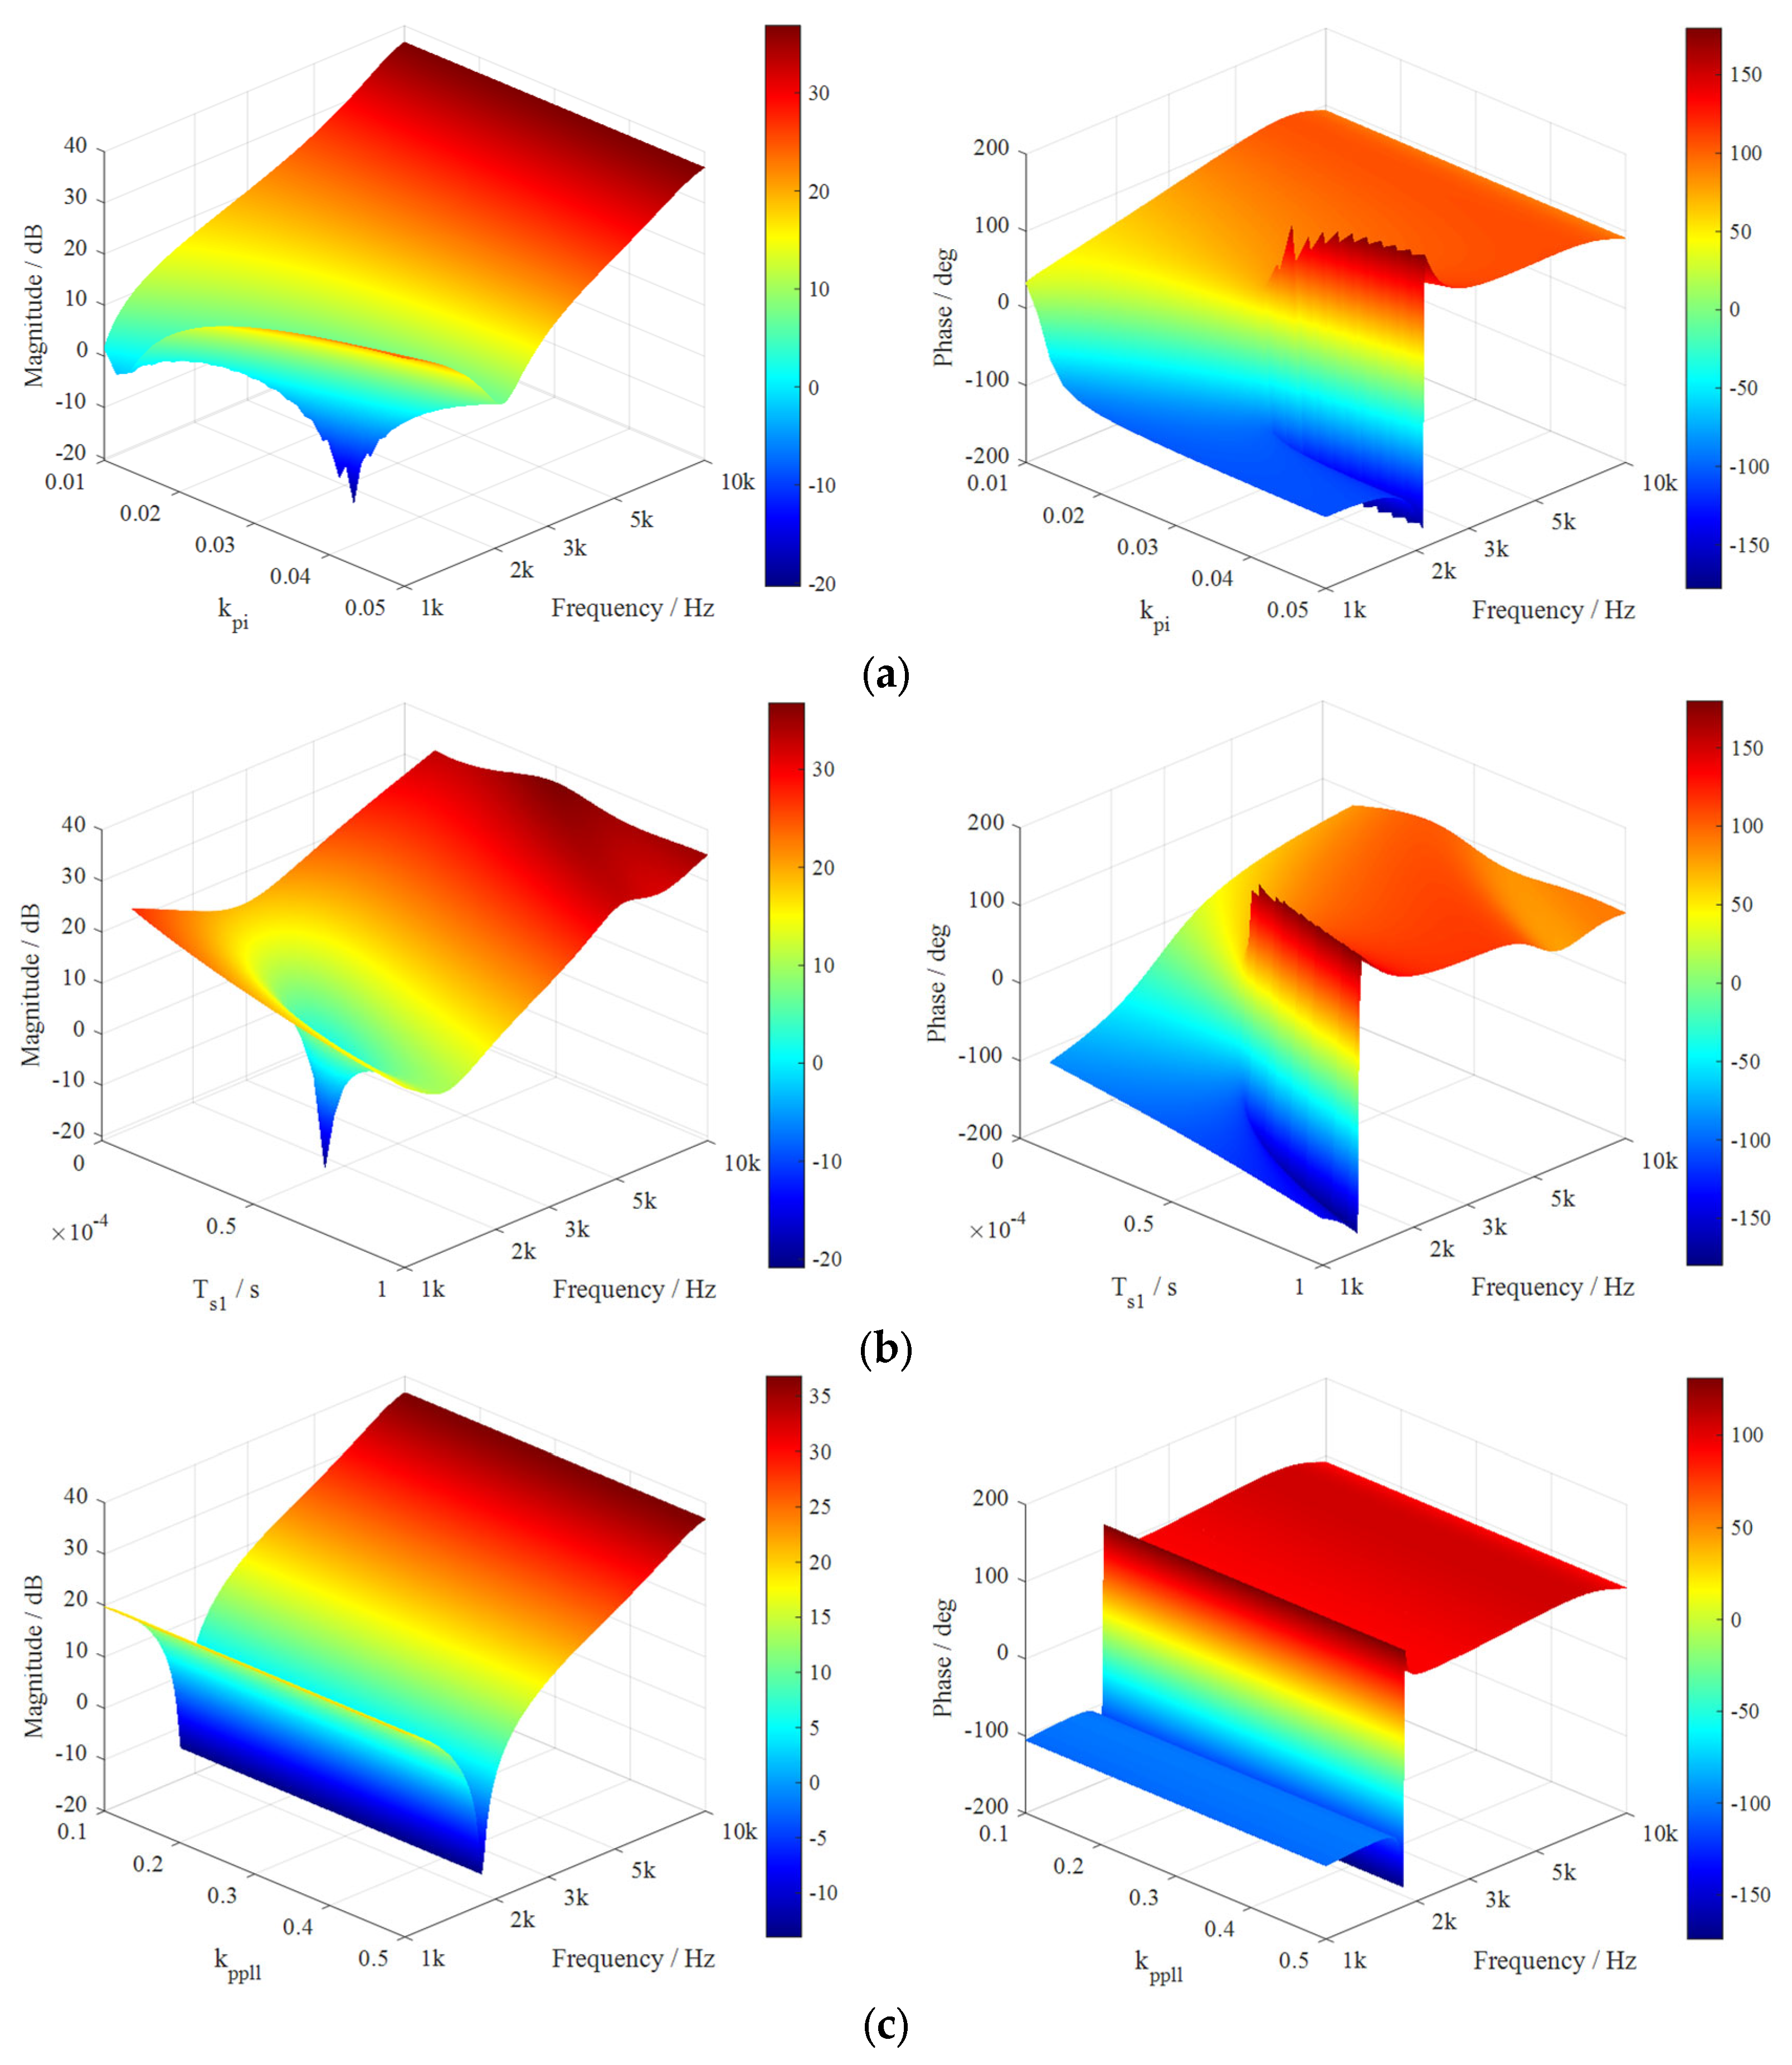
Based on the above analysis of the high-frequency oscillation mechanism, it can be inferred that the occurrence of high-frequency oscillations is primarily influenced by the filter parameters, which create an intersection of the magnitude characteristics, together with the negative damping introduced by the inner current-control loop and the sampling delay. In the following, the effects of the control parameters, specifically those of the inner current-control loop, the PLL, and the sampling delay, on the GSC output impedance characteristics and high-frequency oscillations are investigated in detail through parameter sweeps.
As shown in Figure 6a, increasing the proportional gain K p i of the inner current loop produces a pronounced local minimum in the impedance magnitude over the frequency range of 1000–3000 Hz. As K p i increases further, this minimum shifts towards higher frequencies, thereby increasing the likelihood of an intersection between the GSC output impedance and the grid impedance. Meanwhile, the phase response of the GSC output impedance develops a sharp variation in the vicinity of the corresponding frequency. The resulting phase deterioration may introduce negative damping and consequently increase the risk of high-frequency oscillations in the grid-connected system.
As illustrated in Figure 6b, when the sampling delay varies from 40 to 60 μs, a similar local minimum emerges in the impedance magnitude within the 1000–3000 Hz range, whereas the impedance magnitude outside this frequency band remains nearly unchanged. An increase in the sampling delay also produces a sharp variation in the impedance phase near the local minimum. Therefore, both a larger inner-current-loop proportional gain and a longer sampling delay can deteriorate the high-frequency impedance characteristics and increase the susceptibility of the system to high-frequency oscillations.
By contrast, the other control parameters considered in this study exert only a limited influence on the high-frequency impedance characteristics. The proportional gain K p p l l of the PLL, presented in Figure 6c, is included as a representative example of such parameters.
The parameter sweep results align closely with the theoretical analysis, thereby validating the mechanism of high-frequency oscillation formation in the PMSG-based grid-connected system described in the preceding section. It is also evident that only a limited number of control parameters significantly affect the high-frequency oscillations. Although these high-frequency oscillations can be mitigated to some extent by retuning the above control parameters, the feasible adjustment range is restricted by controller bandwidth, dynamic-response requirements, and system stability constraints. Moreover, excessive parameter modification may degrade steady-state and transient performance, while parameter retuning alone does not provide a systematic means of satisfying the required impedance margin under the operating condition changes. To address these limitations, a current-feedback-based active damping method is proposed in the following section to suppress high-frequency oscillations without compromising the original control parameters.

4. The Design of the Current-Feedback Active-Damping Controller

The preceding analysis indicates that high-frequency oscillations are strongly influenced by the filter parameters and delay elements. However, these parameters have limited tuning ranges in practical systems, and excessive adjustment may adversely affect system performance. Therefore, parameter tuning alone is insufficient to achieve the required oscillation suppression without compromising the original control performance.
In recent years, increasing attention has been devoted to impedance-reshaping strategies based on control modifications. Nevertheless, most existing suppression methods primarily attenuate the impedance components within the target oscillation-frequency range, while the influence of the additional controller on non-target frequency bands is not sufficiently considered. To address this issue, a grid-injected-current-feedback active damping strategy is proposed for impedance reshaping. The corresponding active damping controller modifies the GSC output impedance to avoid adverse intersections with the grid impedance while limiting its influence on non-target frequency components.

4.1. Impedance Reshaping Model

The block diagram of the wind turbine based on current-feedback active damping strategy is shown in Figure 7.
In Figure 7, G s ( s ) denotes the active damping controller, and Δ M a represents the additional modulation signal. With the incorporation of the active damping controller, the final modulation signal, denoted M a , can be expressed as shown in Equation (14).
M a = M a Δ M a = M a G s ( s ) i a
Similarly, M b and M c can be obtained. By substituting M a , M b and M c into Equation (9), the positive- and negative-sequence impedance expressions of the permanent-magnet direct-drive wind turbine generator after impedance reshaping can be derived as follows:
Z p ( s ) = V p ( s ) I p ( s ) = s L f + V dc 2 ( H i ( s j 2 π f 1 ) j K d + G s ( s ) ) G i ( s ) 1 V dc 2 K f G v ( s ) V dc 4 T p l l ( s j 2 π f l ) V l G v ( s ) H i ( s j 2 π f l ) ( i d r e f + j i q r e f ) Z n ( s ) = V n ( s ) I n ( s ) = s L f + V dc 2 ( H i ( s + j 2 π f 1 ) + j K d + G s ( s ) ) G i ( s ) 1 V dc 2 K f G v ( s ) V dc 4 T p l l ( s + j 2 π f l ) V l G v ( s ) H i ( s + j 2 π f l ) ( i d r e f j i q r e f )
The results indicate that the incorporation of the active damping control alters the magnitude characteristics of the positive- and negative-sequence GSC output impedances. Therefore, if the active damping control is appropriately designed, the magnitude curve of the reshaped GSC output impedance can avoid intersecting the grid-impedance magnitude curve in the high-frequency range, thereby eliminating the impedance intersection that may induce oscillations.

4.2. Design Principles for Active Damping Controller Parameters

The active damping controller G s ( s ) is designed to reshape the high-frequency GSC output impedance while preserving the fundamental-frequency operating characteristics. Therefore, the fundamental current component should be excluded from entering the active damping channel, whereas the non-fundamental components associated with oscillations should be retained for supplementary damping control. Through the coordinated tuning of the active damping controller parameters, the proposed controller is intended to provide the required high-frequency impedance-reshaping effect while minimizing its influence on the original low- and medium-frequency control dynamics, including those associated with the PLL and outer control loops.
To achieve this objective, the active damping controller is constructed by combining the damping gain K s with a fundamental-frequency notch filter G ( s ) , as expressed by
G I ( s ) = K s G ( s )
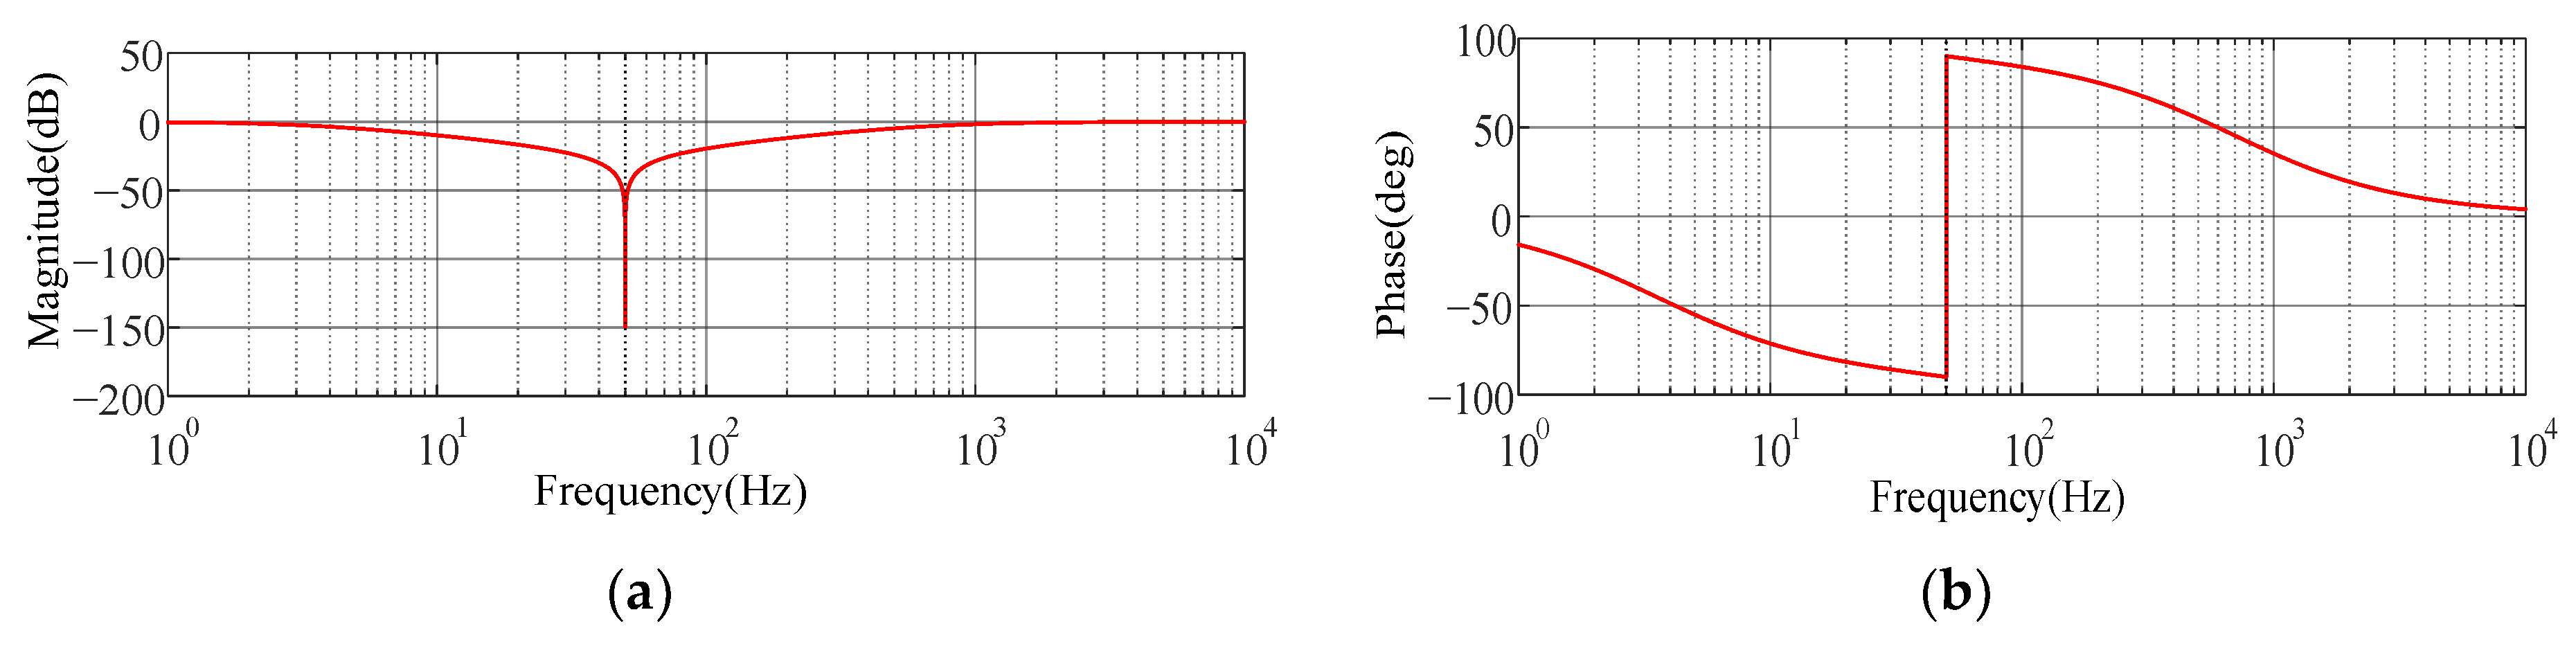
The notch angular frequency is set to the fundamental angular frequency, namely ω c = 2 π f 1 = 100 π   rad / s . Consequently, the filter gain approaches zero at the fundamental frequency, ensuring that the fundamental current component produces almost no additional modulation signal. By contrast, the non-fundamental current components pass through the filter and are fed back with a negative sign according to (14). The resulting supplementary modulation signal therefore reshapes the high-frequency terminal impedance without materially affecting the fundamental-frequency current regulation and steady-state power transfer.
The gain K s determines the magnitude of the impedance-reshaping effect, whereas the frequency-selectivity parameter ω bw influences the frequency range and phase characteristics of the active damping channel. Both parameters are subsequently coordinated to eliminate adverse impedance intersections while limiting harmonic amplification in non-target frequency bands. The transfer function of the fundamental-frequency notch filter is given by
G ( s ) = s 2 + ω c 2 s 2 + 2 ξ ω bw s + ω c 2
where ω c is the central angular frequency of the notch; ξ is the damping coefficient, taken as 0.707; and ω bw is the frequency-selectivity parameter. When ω bw = 1000 π   rad / s , the magnitude-frequency and phase-frequency characteristics of the notch filter are shown in Figure 8a,b, respectively.
It should be noted that ω bw is a continuous-domain frequency-selectivity parameter appearing in the denominator of the notch filter, rather than the closed-loop bandwidth of the grid-side converter or a frequency component to be directly reproduced by the digital controller. Therefore, its numerical value should not be directly compared with the Nyquist frequency as if it were a signal frequency. Nevertheless, its sampled-data implementation should be further evaluated through discretization and fixed-step digital simulation.

4.2.1. Gain Design Principle

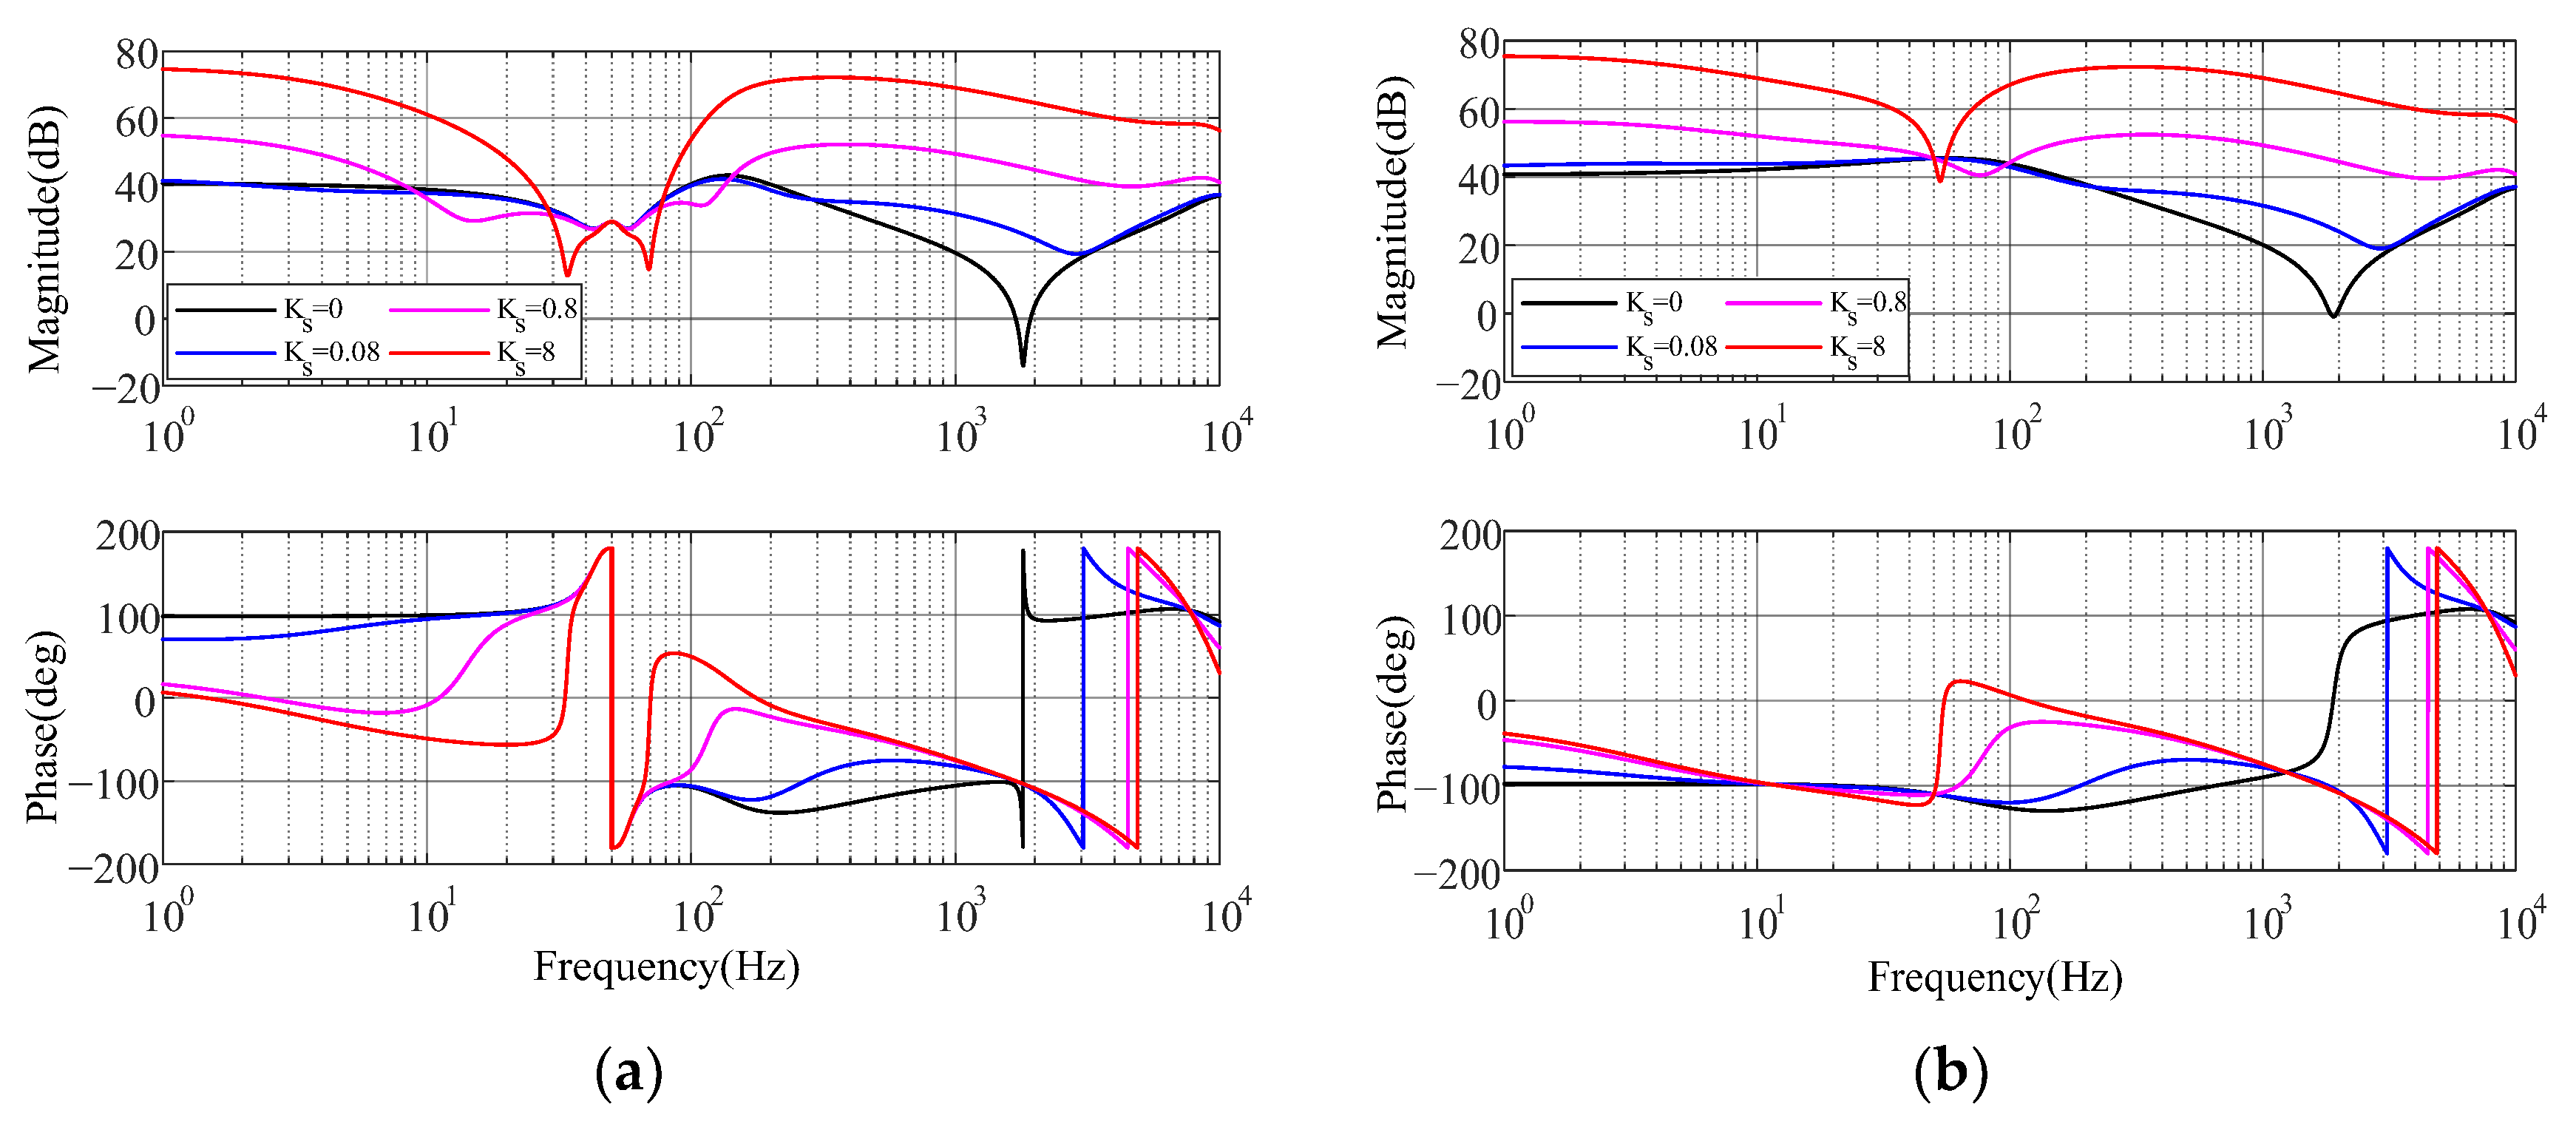
The influence of the gain K s on the reshaped GSC output impedance characteristics is examined by varying its magnitude. Figure 9 presents the Bode diagrams of the positive- and negative-sequence GSC output impedances for different values of K s , with ω bw = 1000 π   rad / s and other parameters as listed in Appendix A, Table A1. As can be seen, a larger gain K s produces a more pronounced reshaping effect on the GSC output impedance magnitude; however, an excessively large K s significantly alters the impedance characteristics in the low- and medium-frequency bands.
From Equation (15), it can be seen that after introducing active damping, the positive-sequence impedance Z p ( s ) and the negative-sequence impedance Z n ( s ) of the wind turbine can be uniformly expressed as
Z p n ( s ) = Z p n ( s ) + K s M ( s )
where M ( s ) is the additional impedance term introduced by the active damping controller, and its expression is given by
M ( s ) = V p ( s ) I p ( s ) = V dc 2 G s ( s ) G i ( s ) 1 V dc 2 K f G v ( s ) V dc 4 T p l l ( s j 2 π f l ) V l G v ( s ) H i ( s ± j 2 π f l ) ( i d r e f ± j i q r e f )
According to the impedance-based stability criterion described above, a sufficient margin should be maintained between the magnitude of the GSC output impedance and that of the grid impedance to suppress high-frequency resonance. Let the magnitude margin coefficient be h m , which is taken as 3 dB in the following. At all intersection frequencies of the wind turbine and grid impedance magnitude curves prior to impedance reshaping, the reshaped impedance magnitude relationship should satisfy:
20 lg ( Z p n ( f x ) / Z g ( f x ) ) h m
where f x denotes the intersection frequency of the impedance magnitude curves before reshaping, and Z g ( s ) is the equivalent grid impedance. By substituting the expression into the equation, the gain K s that satisfies the corresponding magnitude margin h m can be determined.
Based on the above analysis, the procedure for determining the gain K s is summarized as follows. First, the magnitude relationship between Z p n ( f ) and Z g ( f ) is swept over the entire frequency range to identify all intersection frequencies f x at which Z p n ( f x ) = Z g ( f x ) . Subsequently, at each intersection frequency, the gain K s corresponding to the specified magnitude margin is calculated using the equation. Finally, the maximum value of K s among all intersection frequencies is adopted as the tuning result.
It is worth noting that although the original intersection between the GSC output impedance and grid impedance curves at f x is eliminated after impedance reshaping, the change in K s alters the magnitude of the GSC output impedance, which may lead to new intersections at other frequencies. Therefore, the above solution procedure must be repeated iteratively until all intersections are eliminated.

4.2.2. Design Principle for the Frequency-Selectivity Parameter

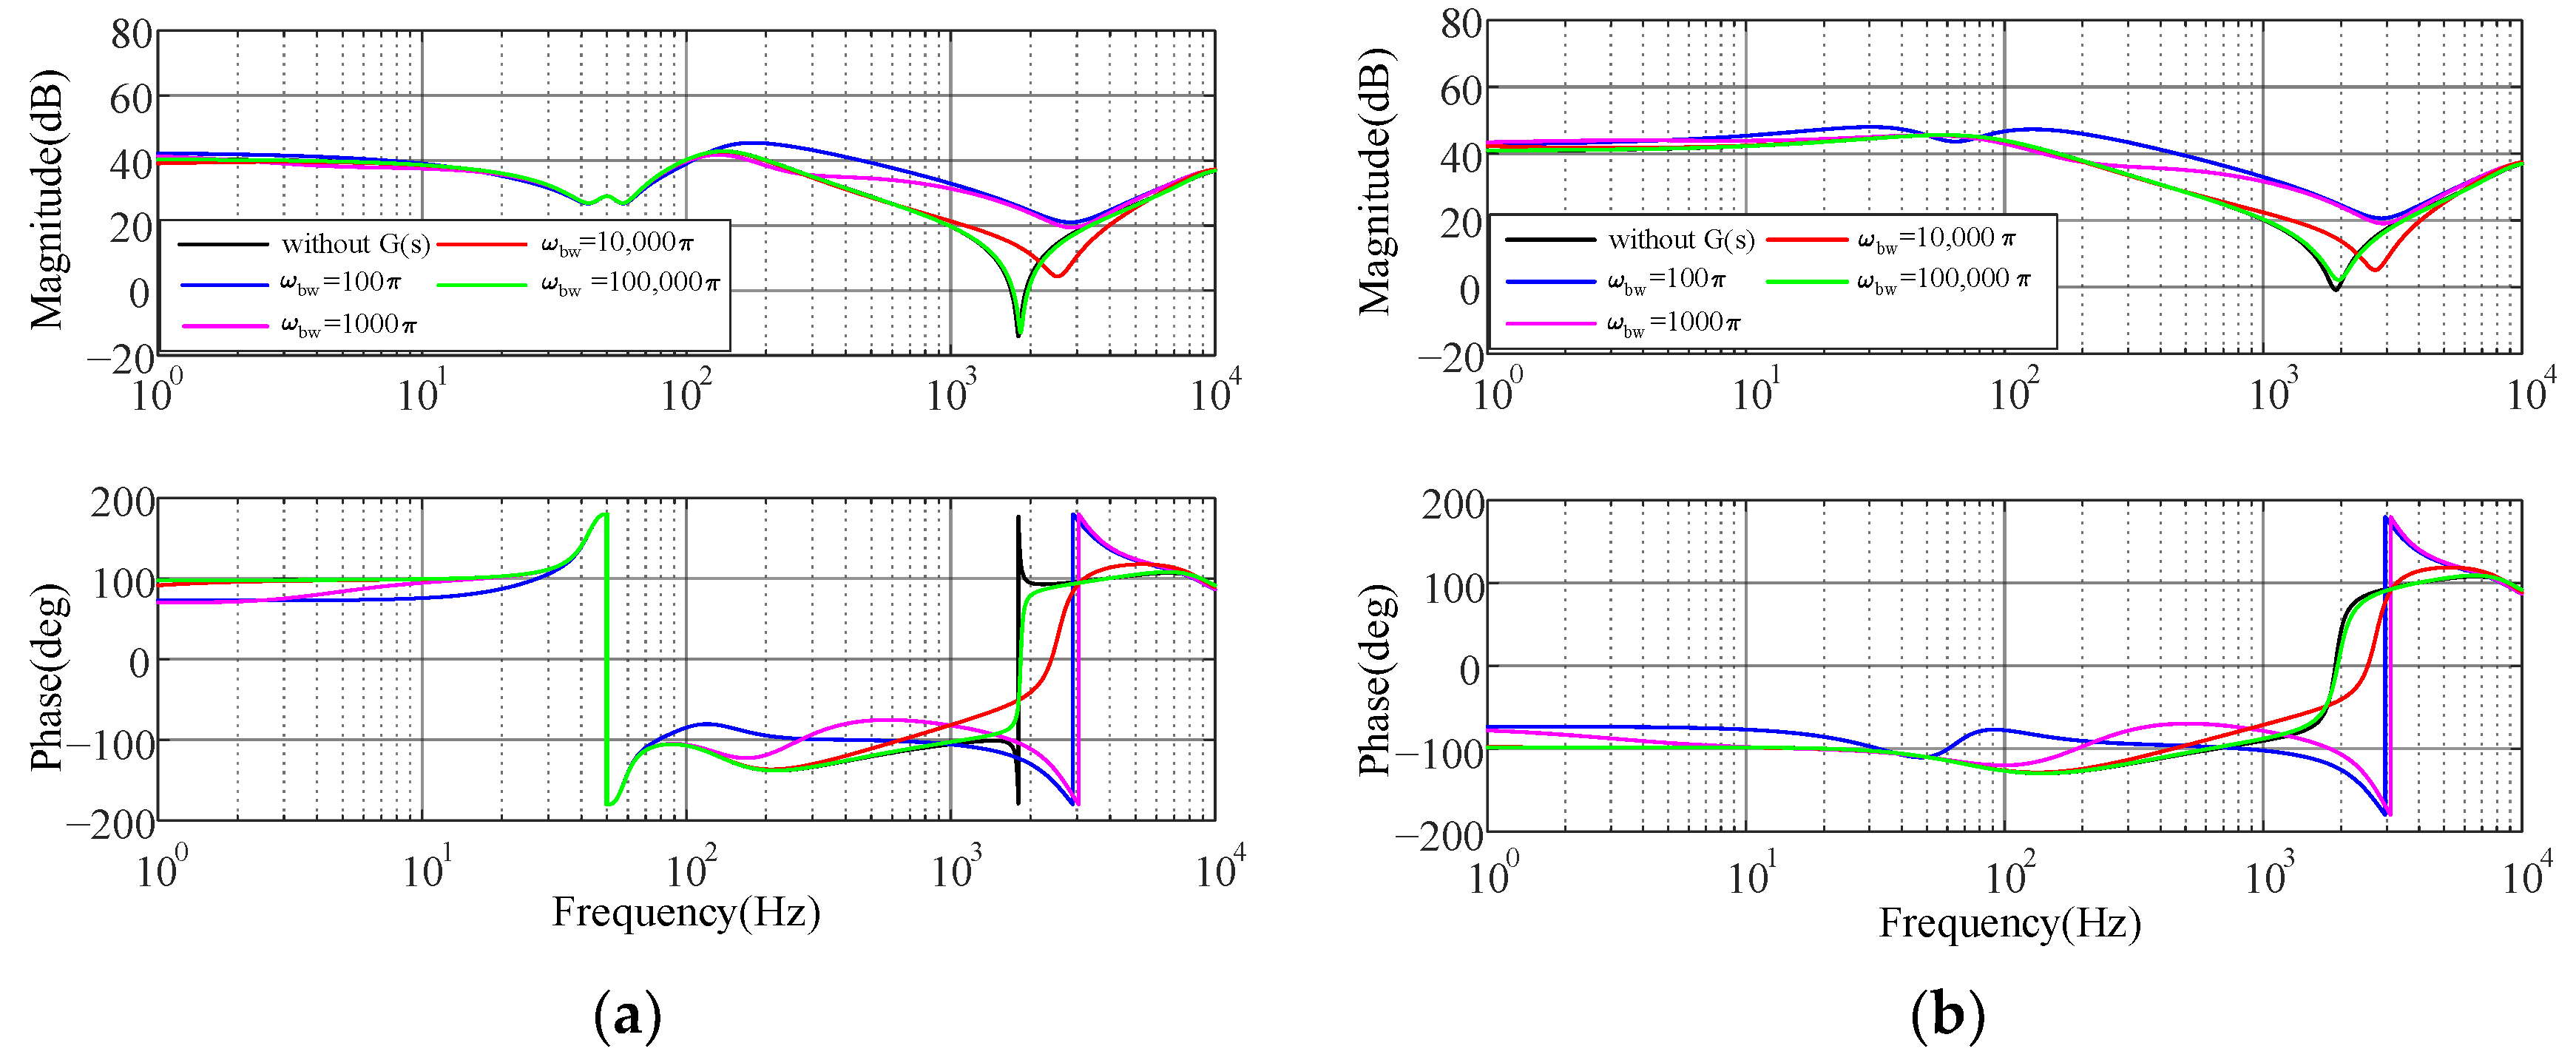
Similarly, to investigate the influence of the frequency-selectivity parameter ω bw on the GSC output impedance characteristics, its value is adjusted and the resulting effects are observed. Figure 10 presents the Bode diagrams of the positive- and negative-sequence GSC output impedances for different values of ω bw , with K s = 0.08 and other parameters as listed in Appendix A, Table A1. As can be seen, the frequency-selectivity parameter ω bw determines the transition from the fundamental-frequency rejection band to the high-frequency feedback band. A smaller ω bw allows the filter gain to recover more rapidly outside the fundamental-frequency notch, thereby strengthening the impedance-reshaping effect over a broader high-frequency range. Conversely, excessive high-frequency feedback may amplify non-target components. By contrast, increasing ω bw attenuates a wider range of non-fundamental components and reduces the reshaping intensity, which helps limit out-of-band harmonic amplification.
Based on the above analysis, and in order to balance the different tuning objectives of ω bw , two key evaluation indicators are proposed in accordance with the fundamental principles outlined above: the dominant resonance suppression depth Δ F and the sideband component increment Δ S .
Δ F is the change in the current magnitude at the dominant resonance frequency f d o m before and after the introduction of active damping. It quantifies the degree of attenuation of the current magnitude at the dominant oscillation frequency and indicates the efficacy of target oscillation suppression. It is defined as
Δ F = 20 lg ( I c u r ( f d o m ) / I 0 ( f d o m ) )
where I 0 ( f d o m ) denotes the magnitude of the system output current at the dominant resonance frequency without active damping, and I c u r ( f d o m ) denotes the current magnitude at the same frequency after the introduction of active damping. A negative value of Δ F indicates that the resonance peak has been effectively attenuated.
Δ S is the change in the root mean square (RMS) value of the current in the sideband (above 55 Hz and outside the ±10% range of the dominant resonance frequency) before and after the introduction of active damping. It quantifies the overall variation of high-frequency components outside the target suppression band, and its objective is to reflect whether additional harmonic amplification has been introduced while suppressing the target oscillation. It is defined as
Δ S = 20 lg ( R M S ( I c u r , s i d e ) / R M S ( I 0 , s i d e ) )
where I 0 , s i d e is the RMS value of the system output current in the sideband without active damping, and I c u r , s i d e is the RMS current value in the same sideband after the introduction of active damping. If Δ S remains negative or exhibits only a small change, it indicates that no significant deterioration has occurred in the non-target frequency bands.
During the tuning process, Δ F and Δ S impose constraints on the direction of adjustment for ω bw . Specifically, if Δ S increases upon the introduction of active damping, it indicates amplitude elevation in the sideband region. Thus, ω bw should be increased to mitigate the local side effects caused by an overly narrow bandwidth. If Δ S remains negative or exhibits only a small change, it suggests that no significant deterioration has occurred in the non-target frequency bands, and ω bw can be adjusted primarily based on the trend of Δ F . Regarding Δ F , if its reduction is insufficient and Δ S shows no positive increase, it implies that the active damping has not caused notable sideband degradation but the suppression of the dominant resonance is inadequate; under these conditions, ω bw can be appropriately reduced to further enhance the impedance reshaping effect. Conversely, if Δ F decreases significantly, it indicates that the current ω bw setting can effectively suppress the dominant resonance, and ω bw may be suitably increased. In this paper, two termination criteria are imposed on the iterative tuning process of ω bw . The iteration is terminated only when the THD is below 5% and the relative change in ω bw between two successive iterations is less than 1%. Once both conditions are satisfied, the tuned values of ω bw and K s are obtained.
Based on the above analysis, this paper adopts a multiplicative adjustment form to describe the update relationship for the direction and magnitude of ω bw :
ω b w ( k + 1 ) = λ ( Δ F , Δ S , THD ) ω bw ( k )
where k is the iteration number, and λ is the adjustment coefficient jointly determined by Δ F , Δ S , and the THD. The specific expression for λ is given in Equation (24):
λ = 1 α F max ( 0 , Δ F Δ F r e q ) F 0 + α S max ( 0 , Δ S ) S 0 + α T max ( 0 , THD THD max ) THD max
where F 0 and S 0 denote the normalization scales of dominant resonance suppression depth and the sideband component increment, respectively. Δ F r e q and THDmax represent the reference level that activates the dominant-resonance penalty and prescribed THD limit, respectively. In this study, F 0 = 12 dB, S 0 = 6 dB, Δ F r e q = −3 dB, and THDmax = 5%. α F , α S and α T are the respective weighting factors, which are set to 0.5, 0.3, and 0.2 in this paper. In addition, the adjustment coefficient λ must satisfy Equation (25):
λ [ λ min , λ max ]
where λ min and λ max are the minimum and maximum limits of the adjustment coefficient, taken as 0.3 and 2, respectively.
It can be observed that when Δ S is positive, the corresponding adjustment coefficient λ tends to be greater than 1, causing ω bw to increase in order to suppress the sideband elevation; whereas when Δ S is negative, the value of λ is primarily adjusted according to the trend of Δ F . Similarly, when Δ F is greater than −3, the corresponding λ tends to be less than 1, reducing ω bw to suppress the oscillation at the dominant frequency; when Δ F is less than −3, λ may take a value close to 1. The iterative process for ω bw is terminated when the THD falls below 5% and the relative change in ω bw between two successive iterations is less than 1%.

4.3. Tuning Procedure

It should be clarified that the proposed multi-index tuning is not formulated as a formal multi-objective optimization problem that searches for a Pareto-optimal or globally optimal solution. Instead, it is a coordinated iterative tuning procedure in which multiple performance indices are incorporated into a hierarchical parameter-update mechanism. The resulting parameter set represents a converged feasible solution satisfying the prescribed stability and power-quality criteria, rather than a mathematically guaranteed Pareto-optimal solution.
At the k-th outer iteration, the controller parameter vector is defined as
θ ( k ) = [ K s ( k ) , ω bw ( k ) ] T
(1)
Tuning criteria
For a fixed ω bw ( k ) , the inner layer determines K s from the impedance-stability requirement. The positive- and negative-sequence magnitude-intersection set Γ is defined as
Γ ( K s , ω bw ) = 20 lg ( Z p n ( f x ) / Z g ( f x ) ) = 0
K s ( k ) = max i K s , i ( k ) = max i 20 lg ( Z p n ( f x ) / Z g ( f x ) ) h m
At each detected intersection, a prescribed magnitude-separation margin h m is imposed, allowing K s to be calculated by (28).
The outer layer evaluates the dominant-resonance suppression depth Δ F , the sideband-component increment Δ S , and THD.
To make the roles of the design constants explicit, we define
e F ( k ) = max ( 0 , Δ F Δ F r e q ) F 0
e S ( k ) = max ( 0 , Δ S ) S 0
e T ( k ) = max ( 0 , THD THD max ) THD max
(2)
Weighting factors
Weighting factors include α F , α S and α T . These coefficients are coordination weights in the update law rather than weights of a scalarized optimization objective, which satisfy (32).
α F + α S + α T = 1
(3)
Parameter-update rule
λ ˜ ( k ) = 1 α F e F ( k ) + α S e S ( k ) + α T e T ( k )
λ ( k ) = min [ λ max , max ( λ min , λ ˜ ( k ) ) ]
ω bw ( k + 1 ) = λ ( k ) ω bw ( k )
Accordingly, insufficient dominant-resonance attenuation tends to reduce ω bw and strengthen impedance reshaping, whereas sideband deterioration or THD violation tends to increase ω bw and reduce excessive non-target feedback.
(4)
Stopping conditions
Γ =
ω b w ( k + 1 ) ω bw ( k ) ω bw ( k ) 1 %
THD 5 %
The final parameter pair is returned only when the inner impedance-intersection condition and both outer stopping conditions are simultaneously satisfied.
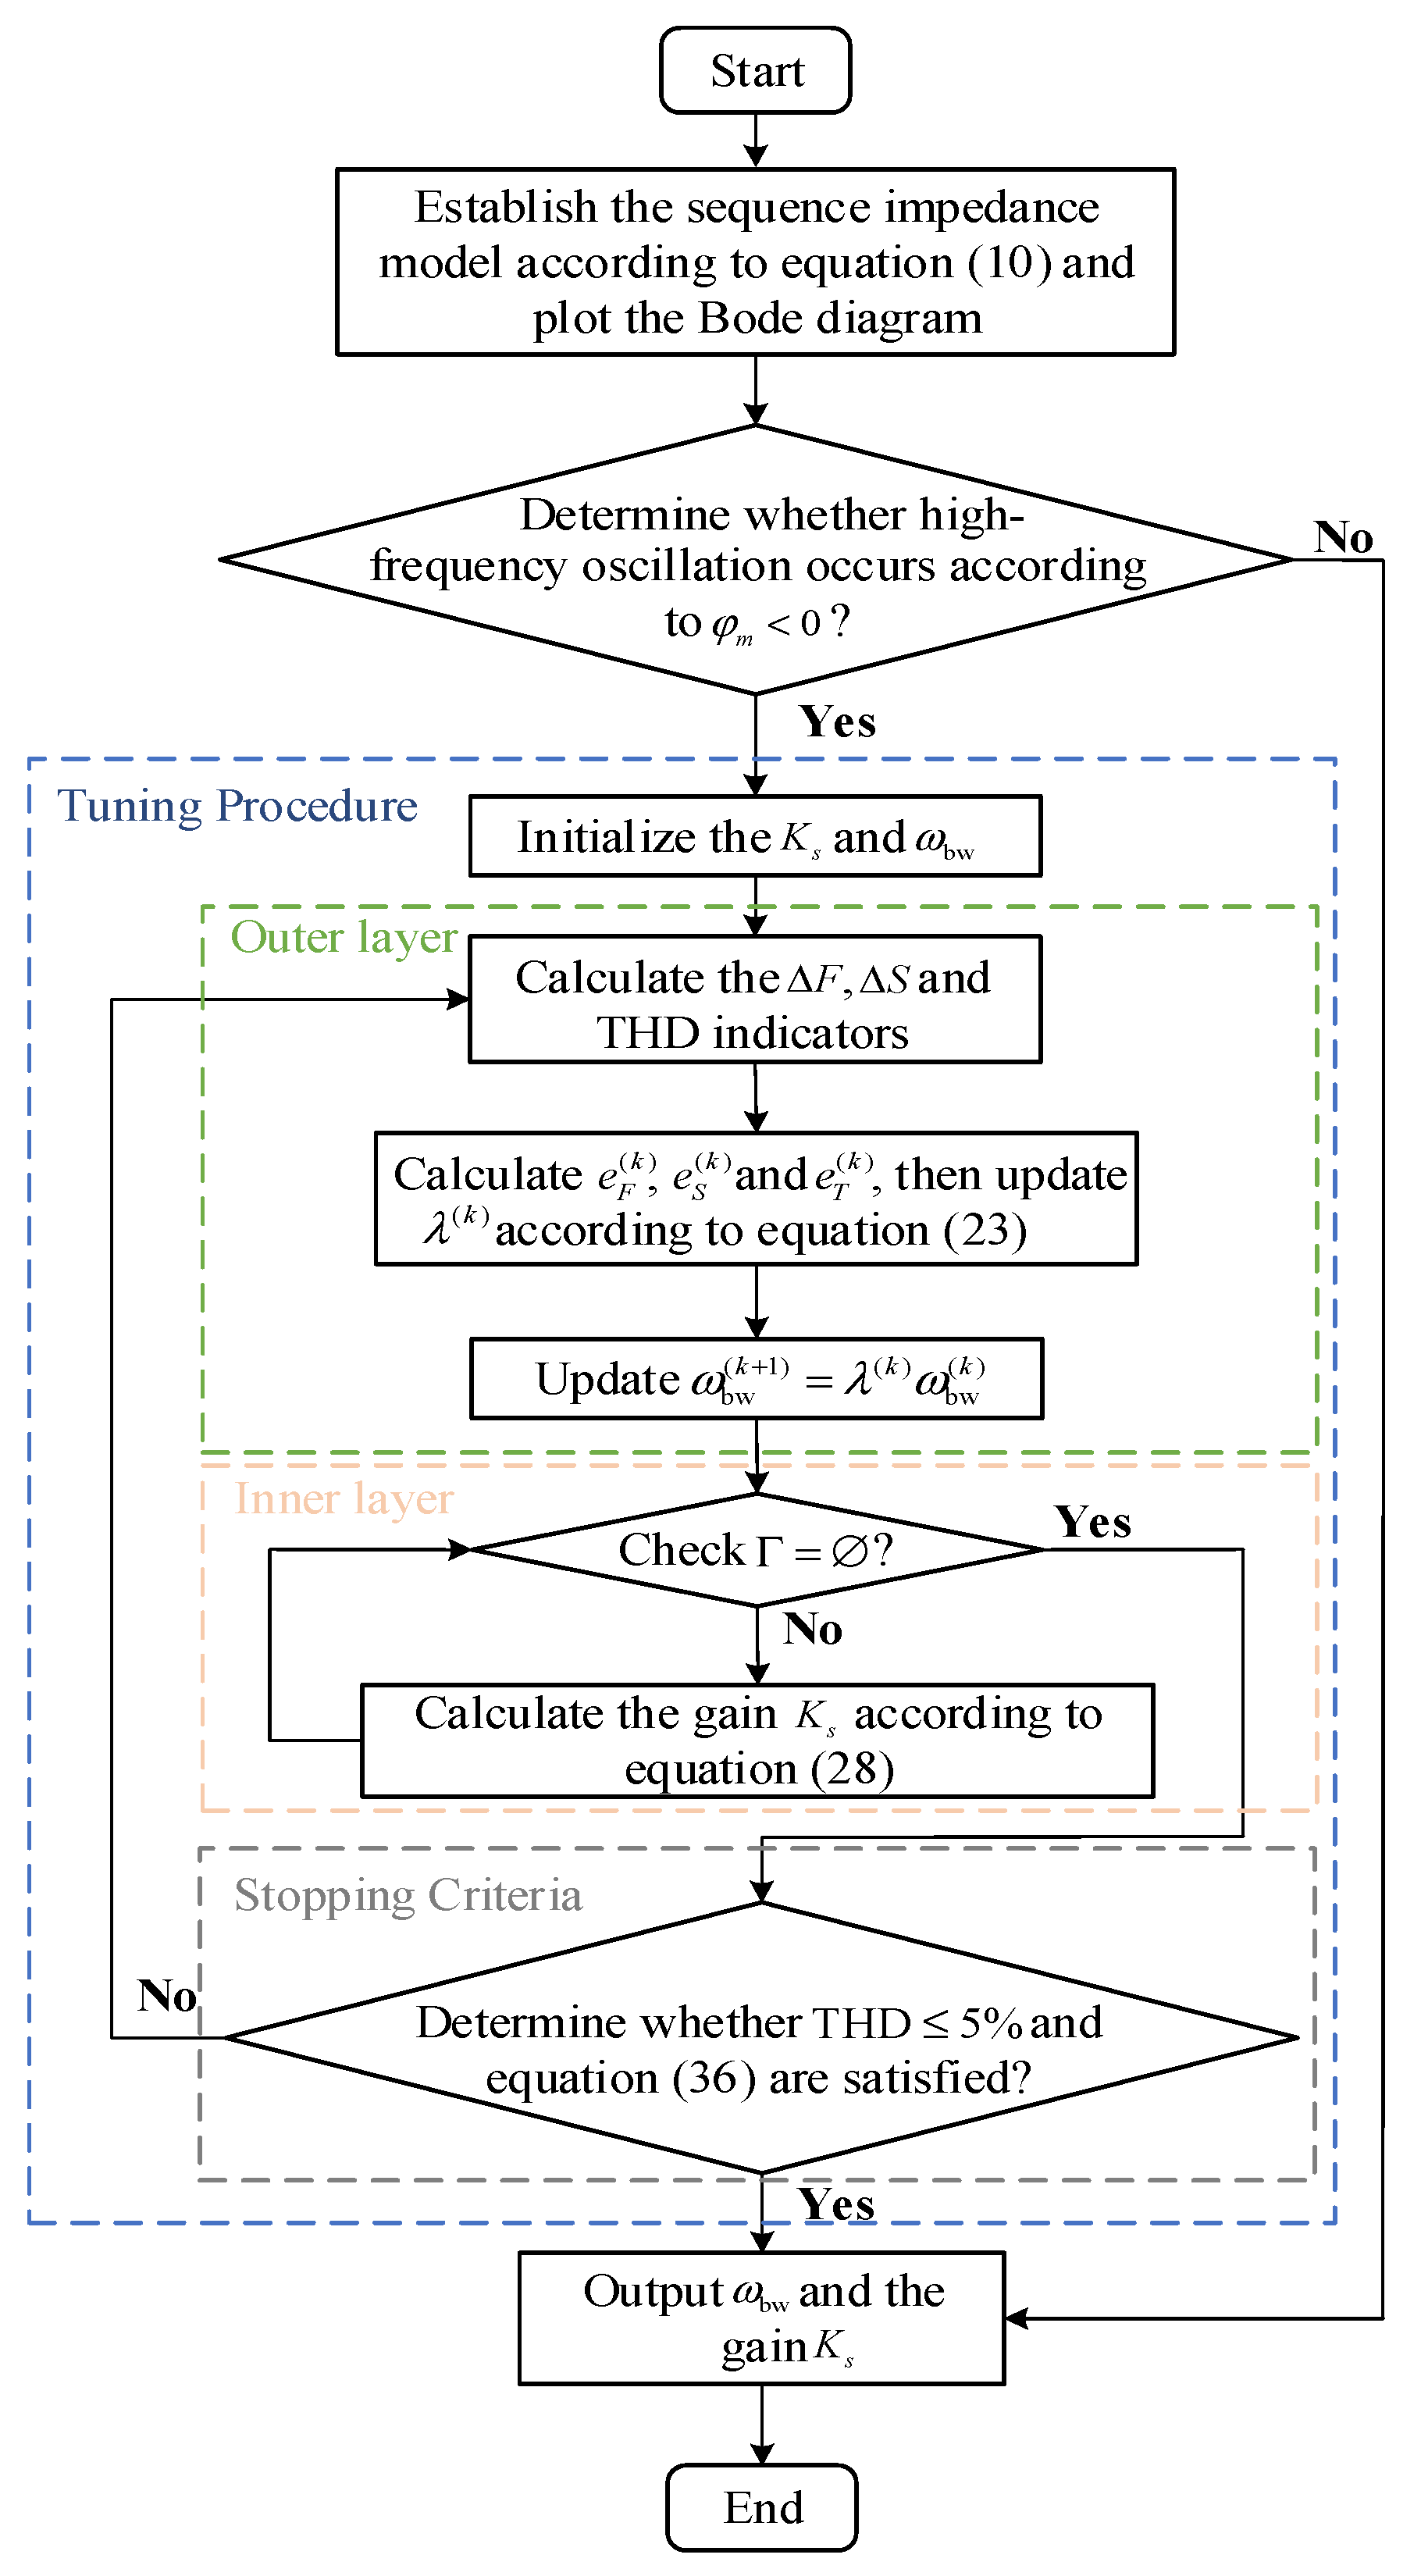
In summary, the tuning of K s and ω bw constitutes a coordinated iterative tuning procedure: the inner layer iteratively calculates K s with the objective of eliminating intersections in the impedance magnitude curves, while the outer layer progressively adjusts ω bw according to the dominant-resonance suppression depth, sideband-component increment, and THD. The flow chart summarizing this process is shown in Figure 11, demonstrating how the two parameters are tuned alternately and in coordination, enabling the active damping controller to effectively balance the two control objectives: suppressing high-frequency oscillations and maintaining the fundamental-frequency characteristics.
In a practical wind farm, the equivalent grid impedance is location dependent because individual turbines are connected through collector cables and transformers with different electrical distances. Different turbines may therefore exhibit different impedance-intersection frequencies and may require different K s and ω bw values. Turbines with similar electrical characteristics may be grouped and represented by an equivalent unit, provided that the collector-network equivalence is validated. Otherwise, a multi-machine or network-level impedance representation should be retained.


5. Case Studies

5.1. Effectiveness Verification of Current-Feedback Active Damping Strategy

To validate the proposed high-frequency oscillation suppression strategy, a detailed simulation model of the PMSG-based grid-connected system shown in Figure 1 is developed in MATLAB/Simulink R2024a using Simulink and Simscape Electrical Specialized Power Systems. The simulated subsystem includes the GSC, grid-side LC filter, PLL, inner current-control loop, sampling and PWM delay, proposed active-damping controller, and equivalent AC grid. Consistent with the high-frequency modeling assumptions in Section 2, the PMSG-MSC subsystem is represented by a stiff DC voltage source. The grid resistance, grid inductance, and filter inductance are set to R g = 0.1   Ω , L g = 0.3   mH , and L f = 0.9   mH , respectively, while the remaining parameters are listed in Table A1 of the Appendix A.
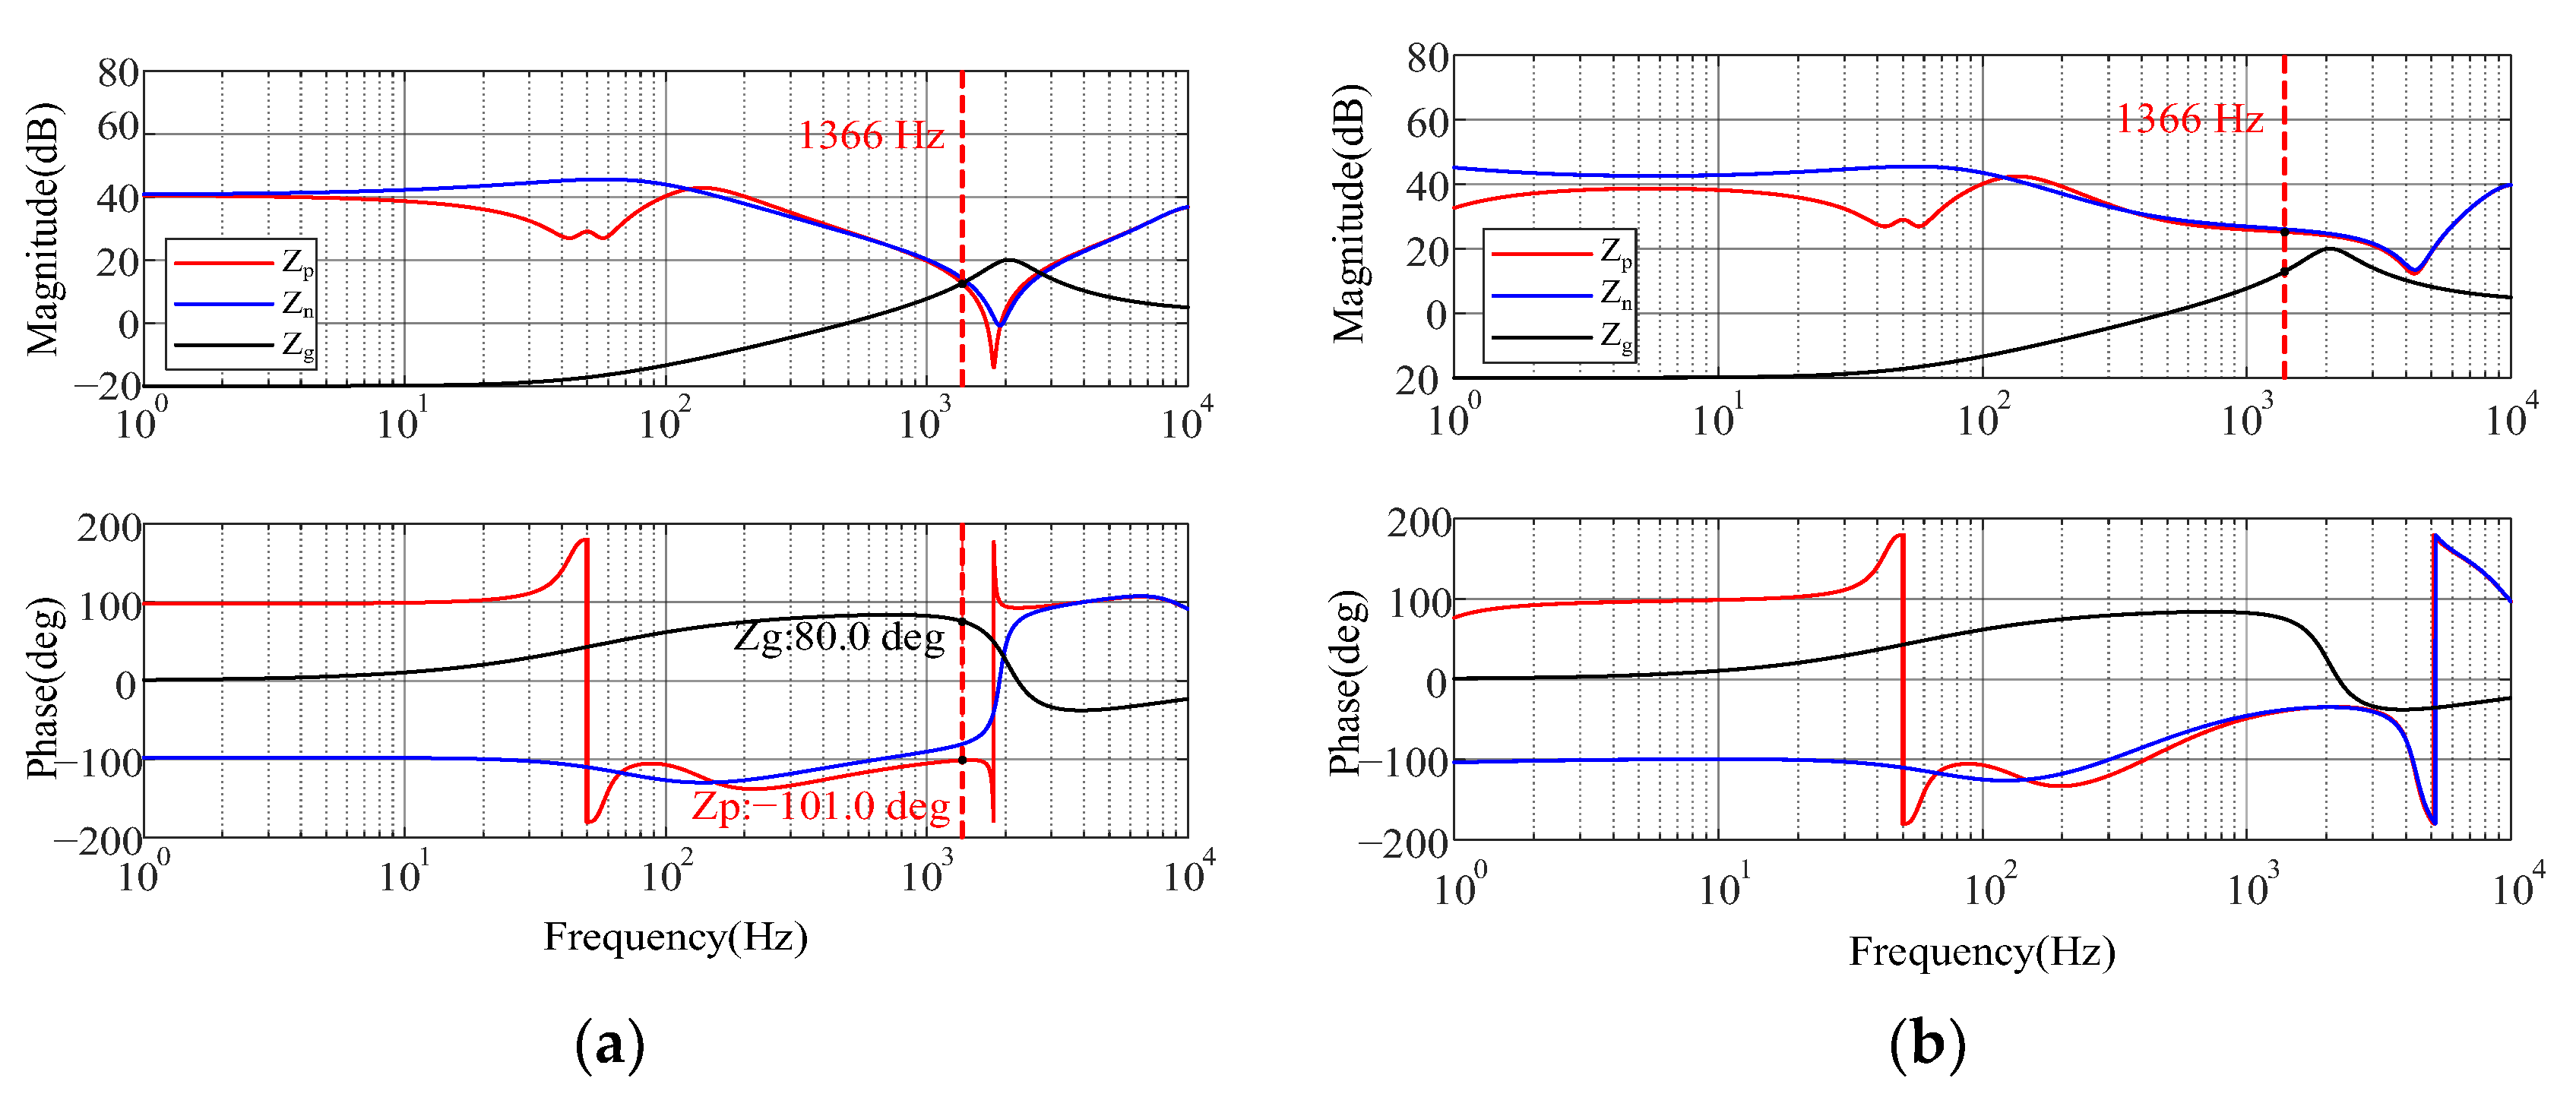
Figure 12 compares the grid impedance with the positive- and negative-sequence GSC output impedances. Before impedance reshaping, the magnitude curves of the grid impedance and the positive-sequence impedance intersect at 1366 Hz, where the phase difference reaches 181.917°, indicating a potential high-frequency instability. After impedance reshaping, no magnitude intersection occurs between the grid impedance and either sequence impedance in the high-frequency range, thereby removing the corresponding resonance condition.
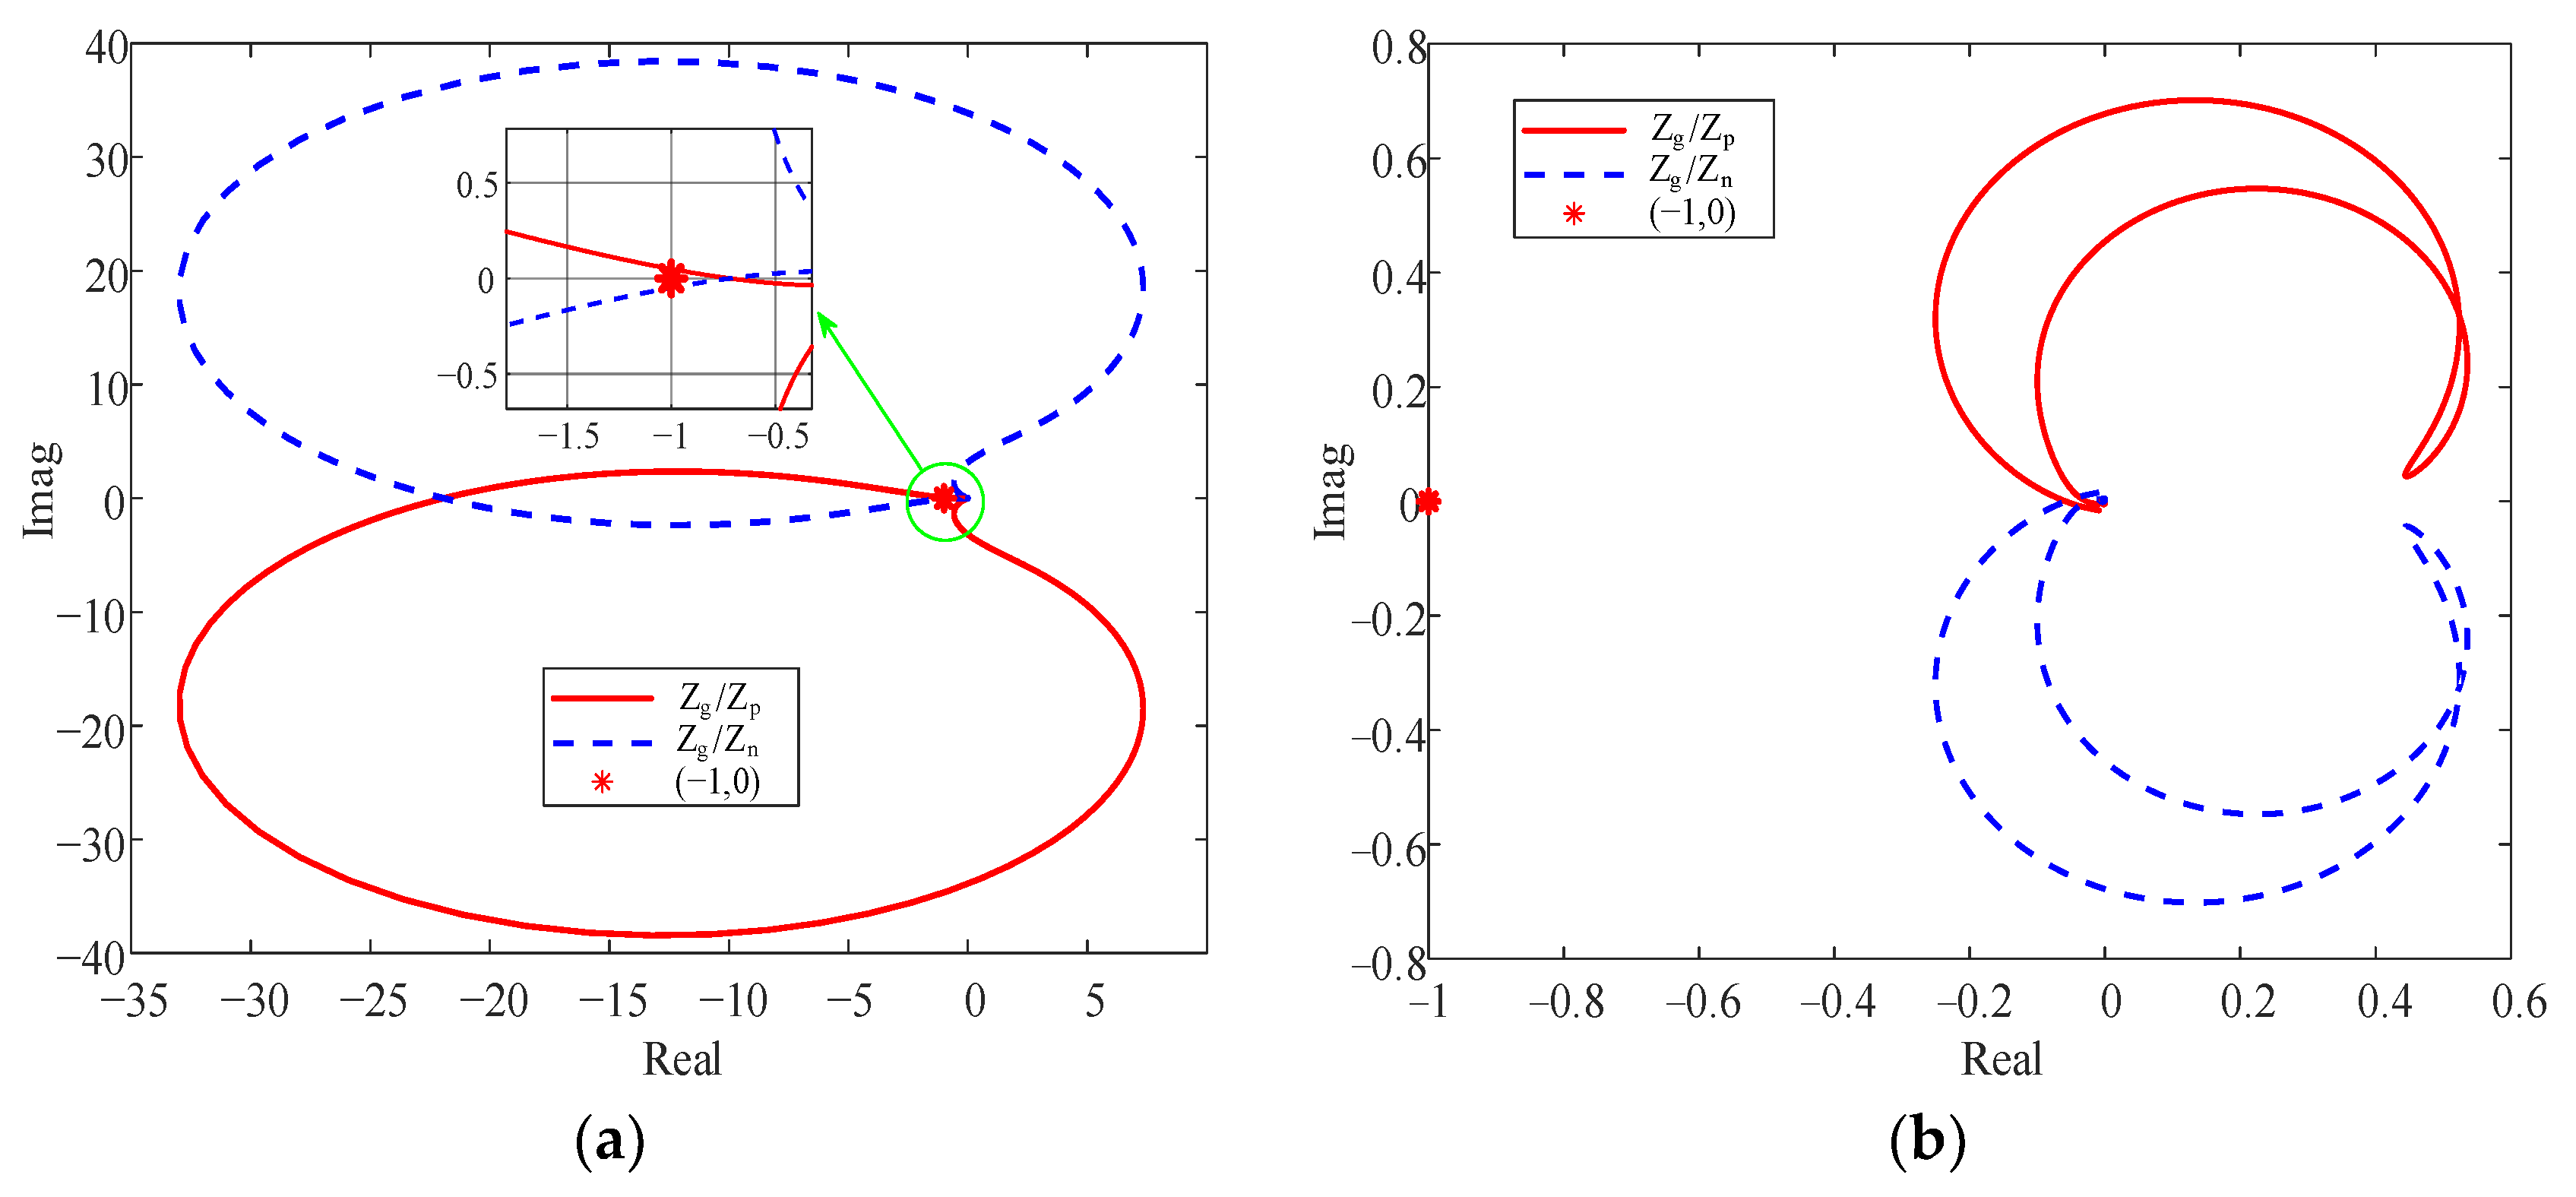
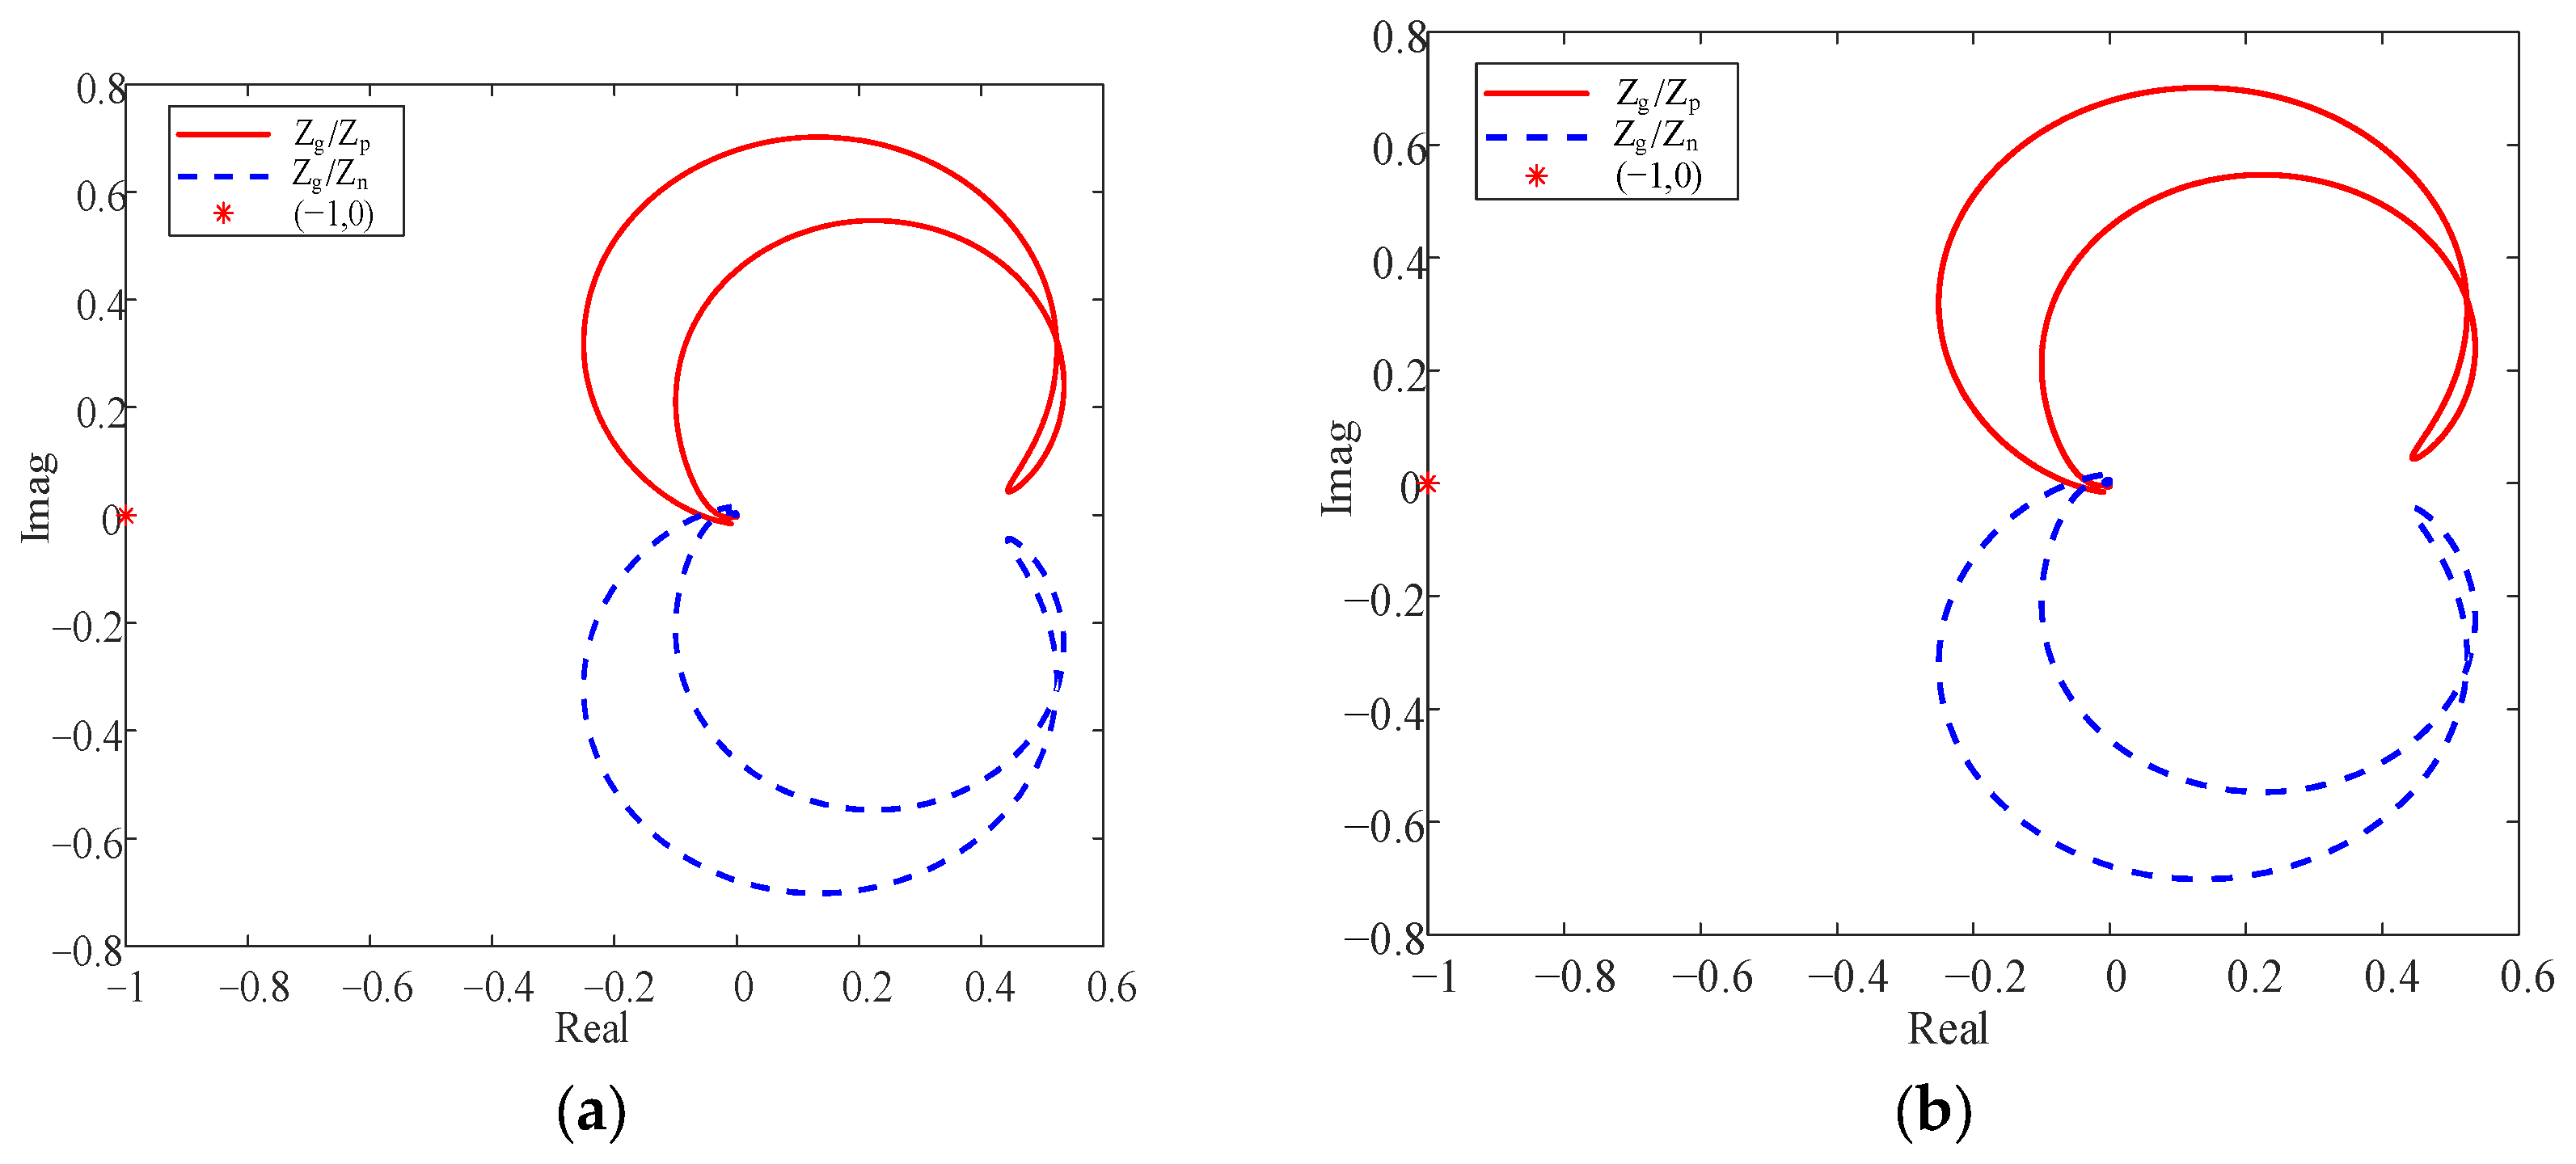
Figure 13 further presents the Nyquist plots of the impedance ratio between grid impedance and GSC output impedance. Before impedance reshaping, both the positive- and negative-sequence impedance-ratio loci encircle the point (−1, j0) clockwise, indicating an unstable system. After impedance reshaping, neither locus encircles this point, confirming that system stability is restored.
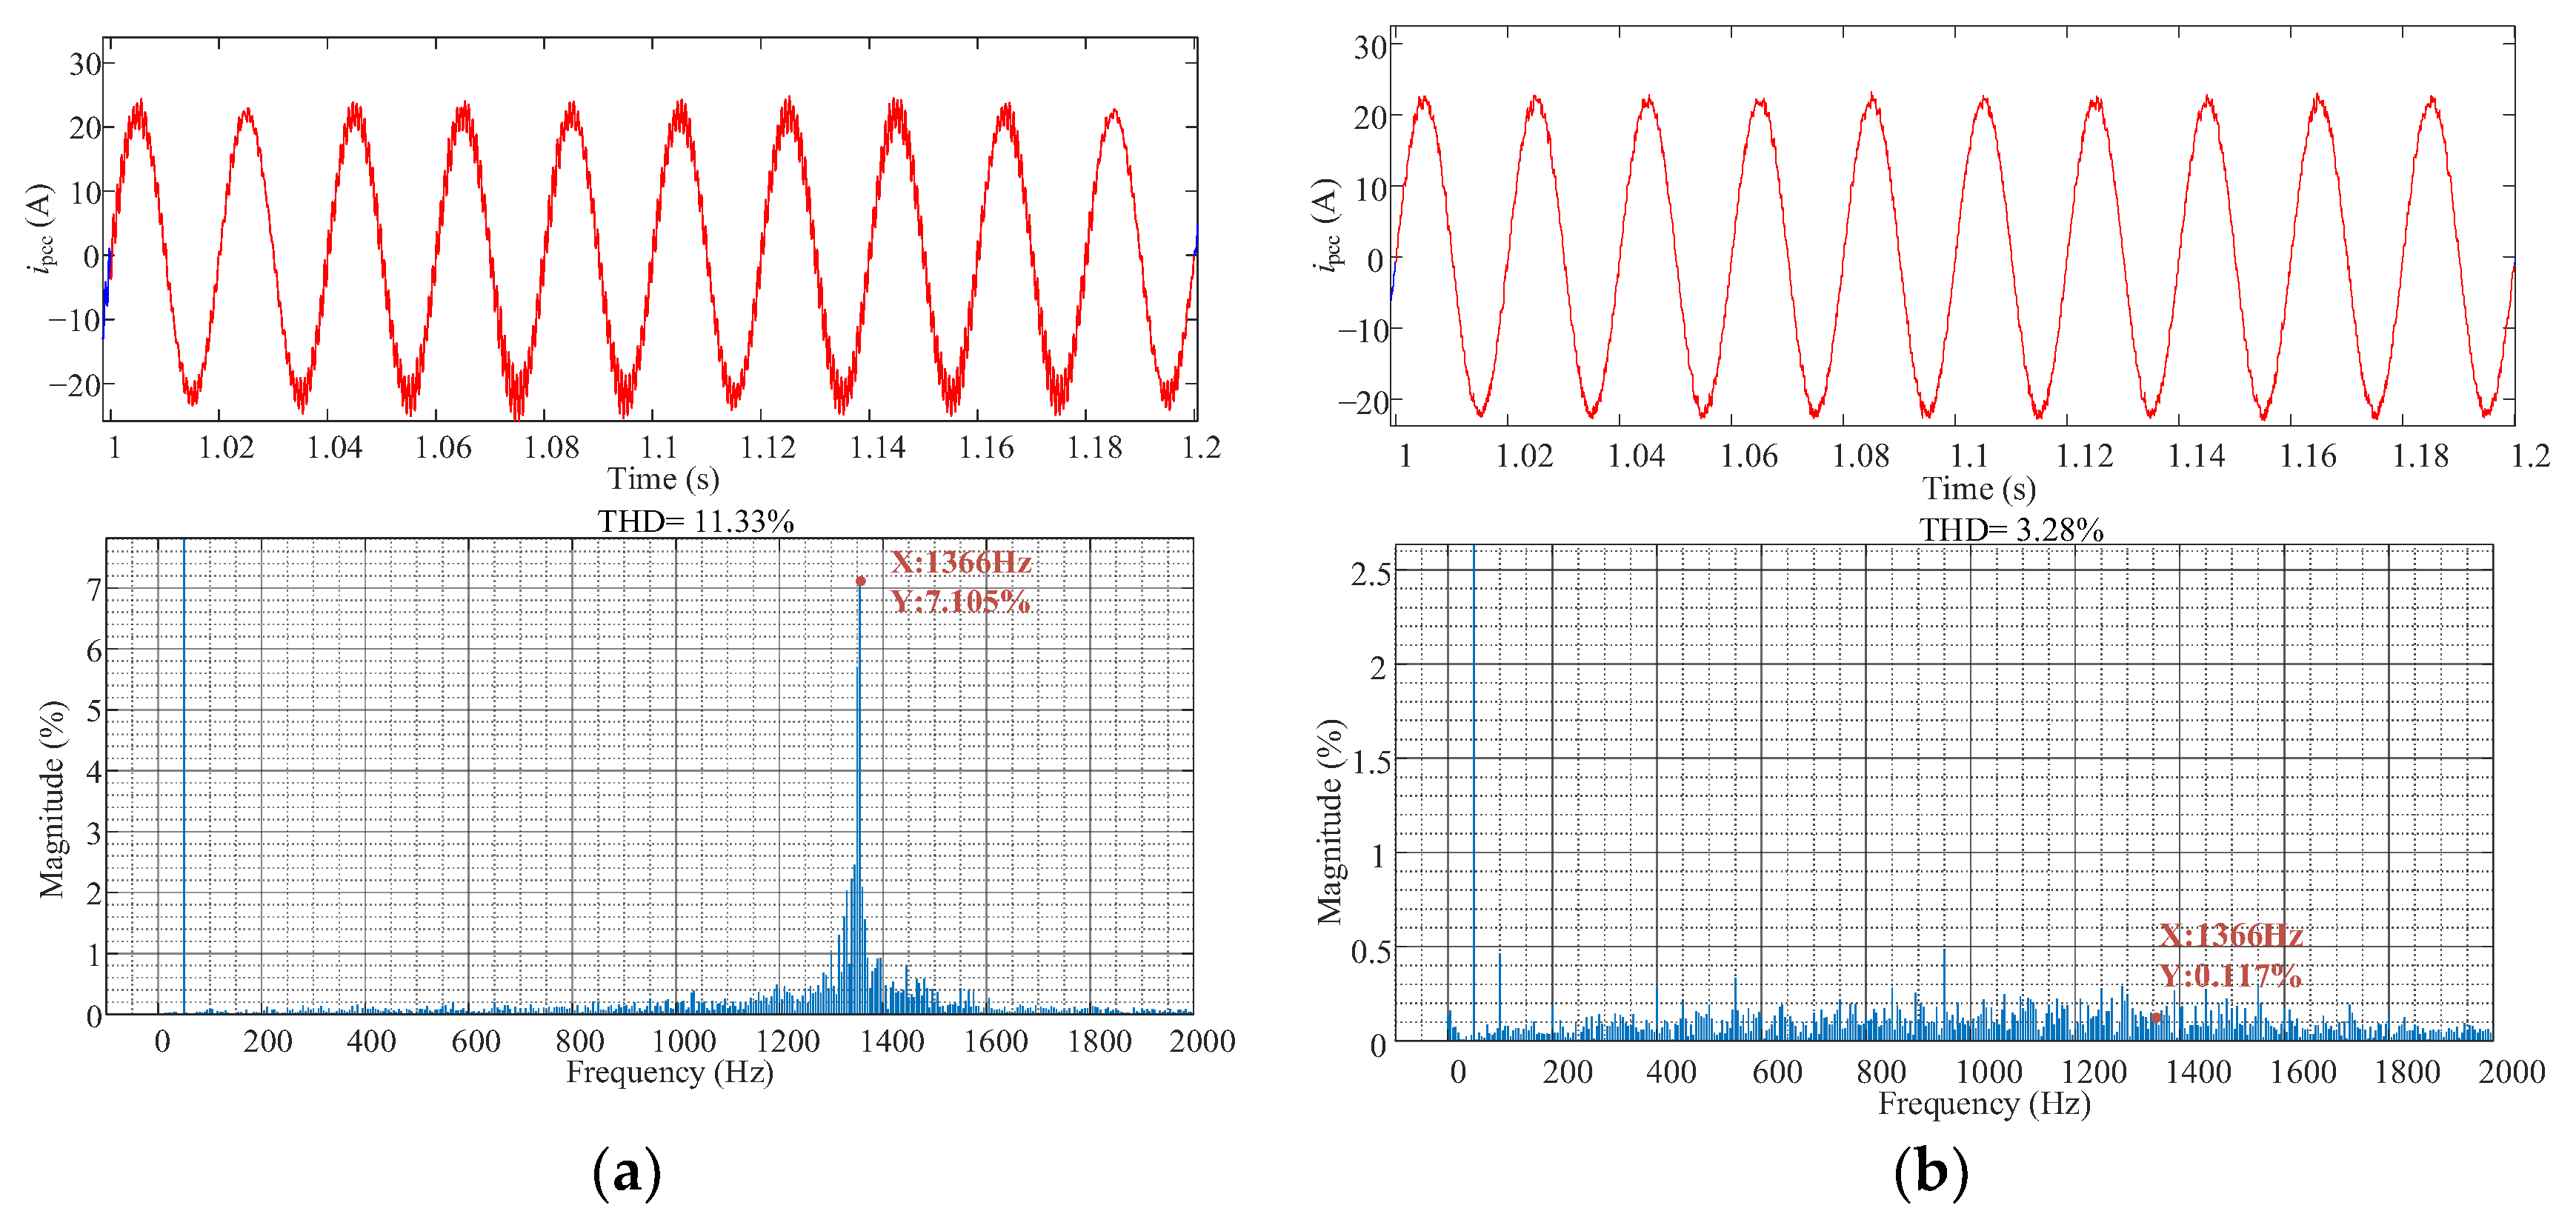
The current signal spectrum in Figure 14 verifies the above impedance-based analysis. It is worth noting that for figures such as Figure 14, the red line in the upper panel represents the time-domain waveform of the current signal, while the blue line in the lower panel represents the corresponding frequency-domain spectrum. Before impedance reshaping, a pronounced oscillation occurs at 1366 Hz, with an amplitude ratio of approximately 7.105%. After applying the proposed strategy, this oscillation is effectively suppressed, while the amplitude ratios of the remaining high-frequency components remain below 0.5%. These results confirm the effectiveness of the proposed impedance-reshaping method.
Furthermore, a parameter sensitivity analysis is conducted to verify the general applicability of the proposed impedance-reshaping method in Appendix B.
5.2. Comparison with Virtual Admittance Method

In this section, the virtual admittance method in [30] is selected as the benchmark method, with all original parameters kept unchanged. The expression for the virtual admittance controller is given by
H v ( s ) = K 2 ξ ω n s s 2 + 2 ξ ω n s + ω n 2
The parameters of the virtual admittance are selected based on the principle of suppressing the dominant high-frequency oscillation at 1366 Hz. The parameters adopted in this paper are K = 0.1 , ξ = 0.707 and ω n = 2 π f n = 2 π × 1366   rad / s .
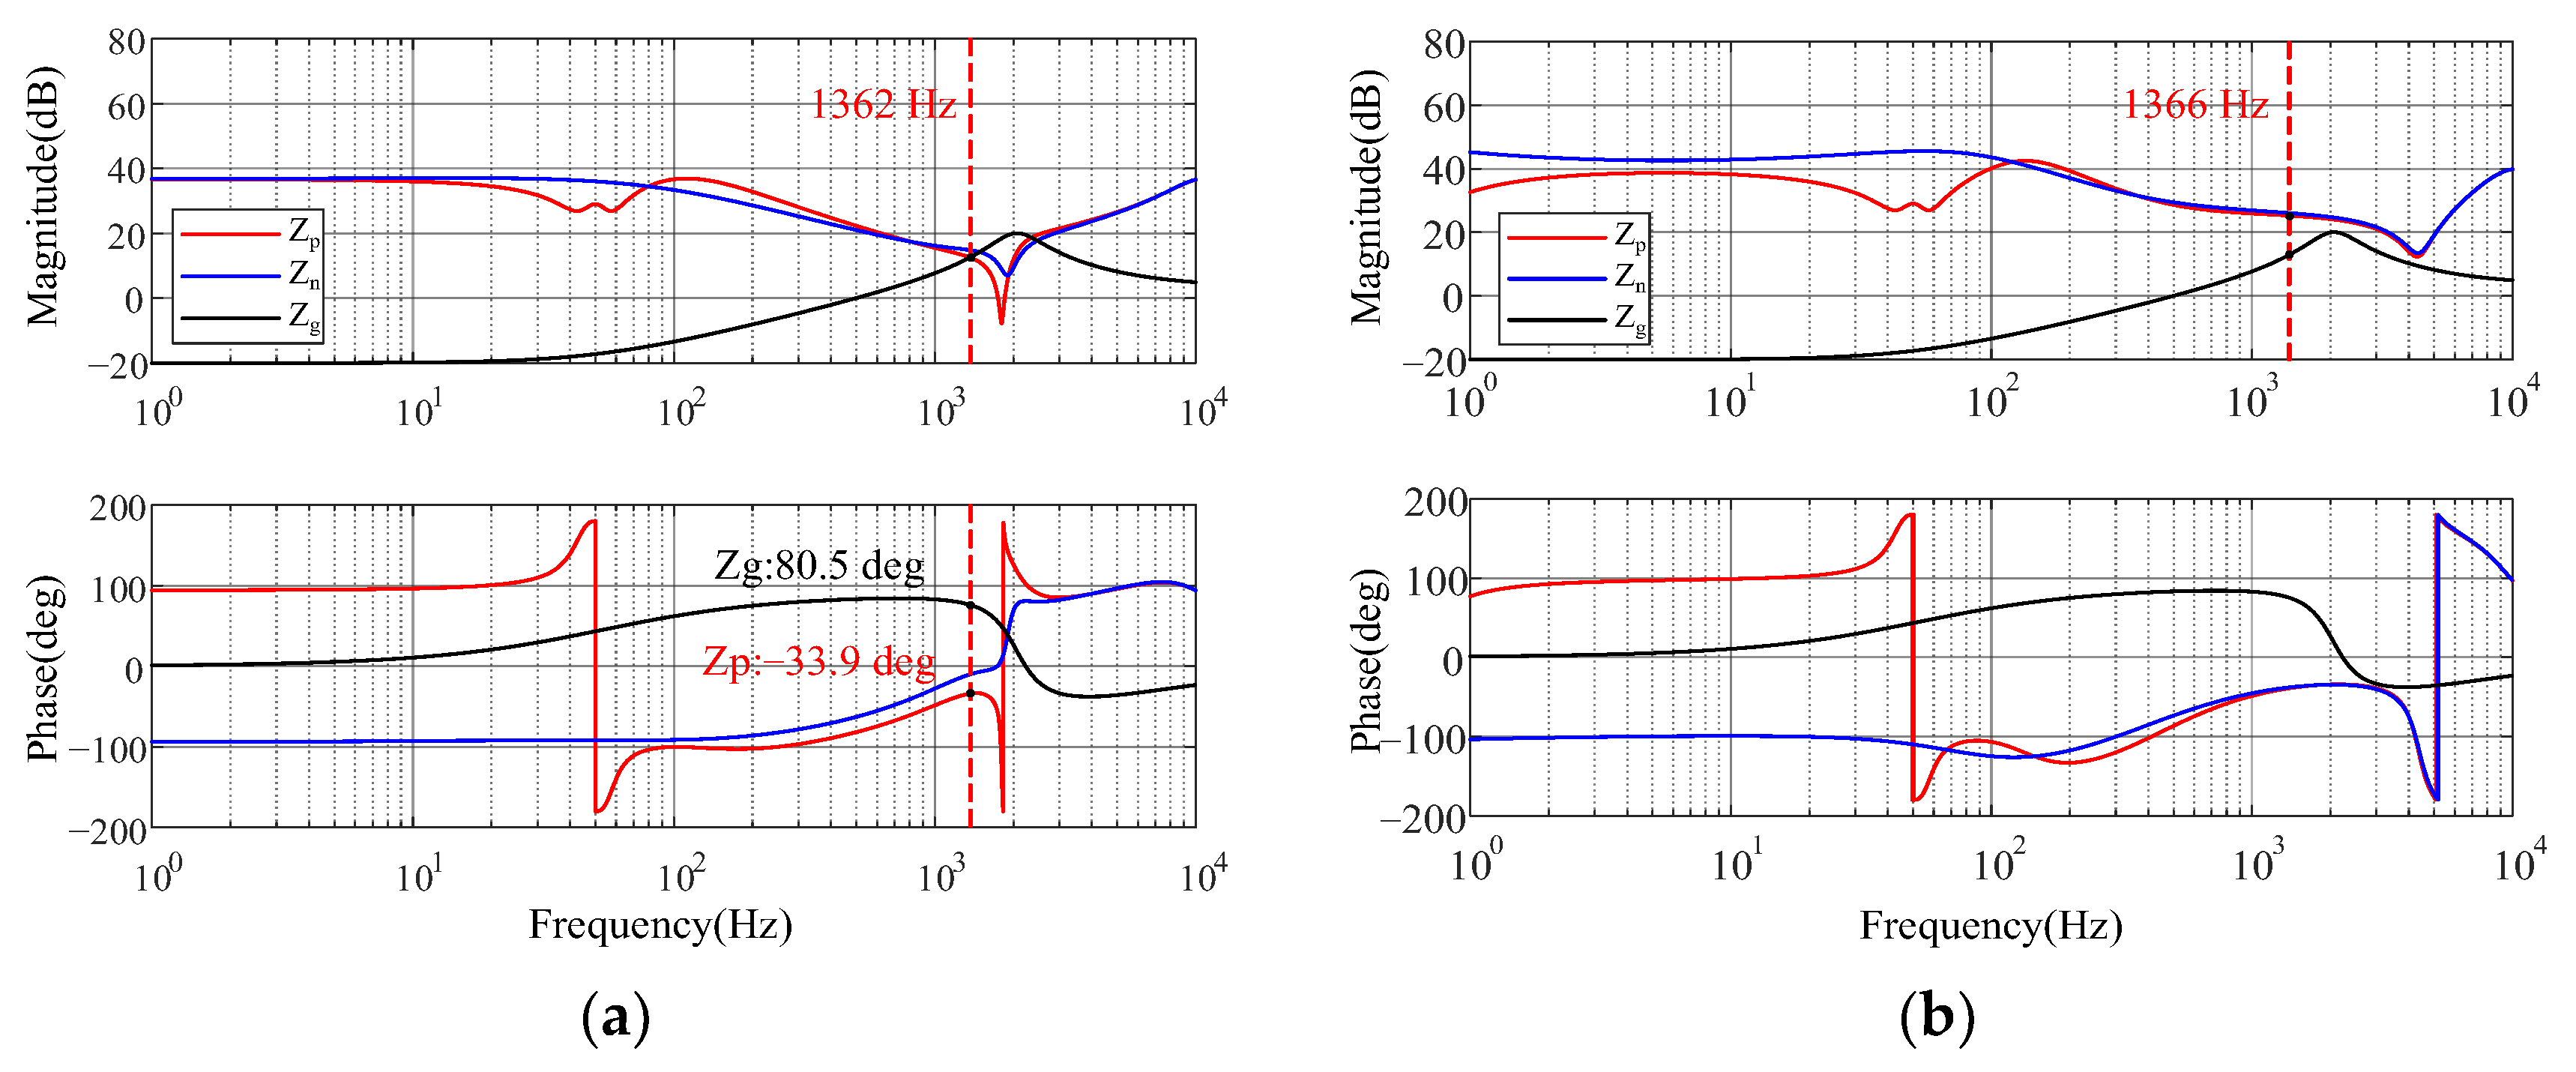
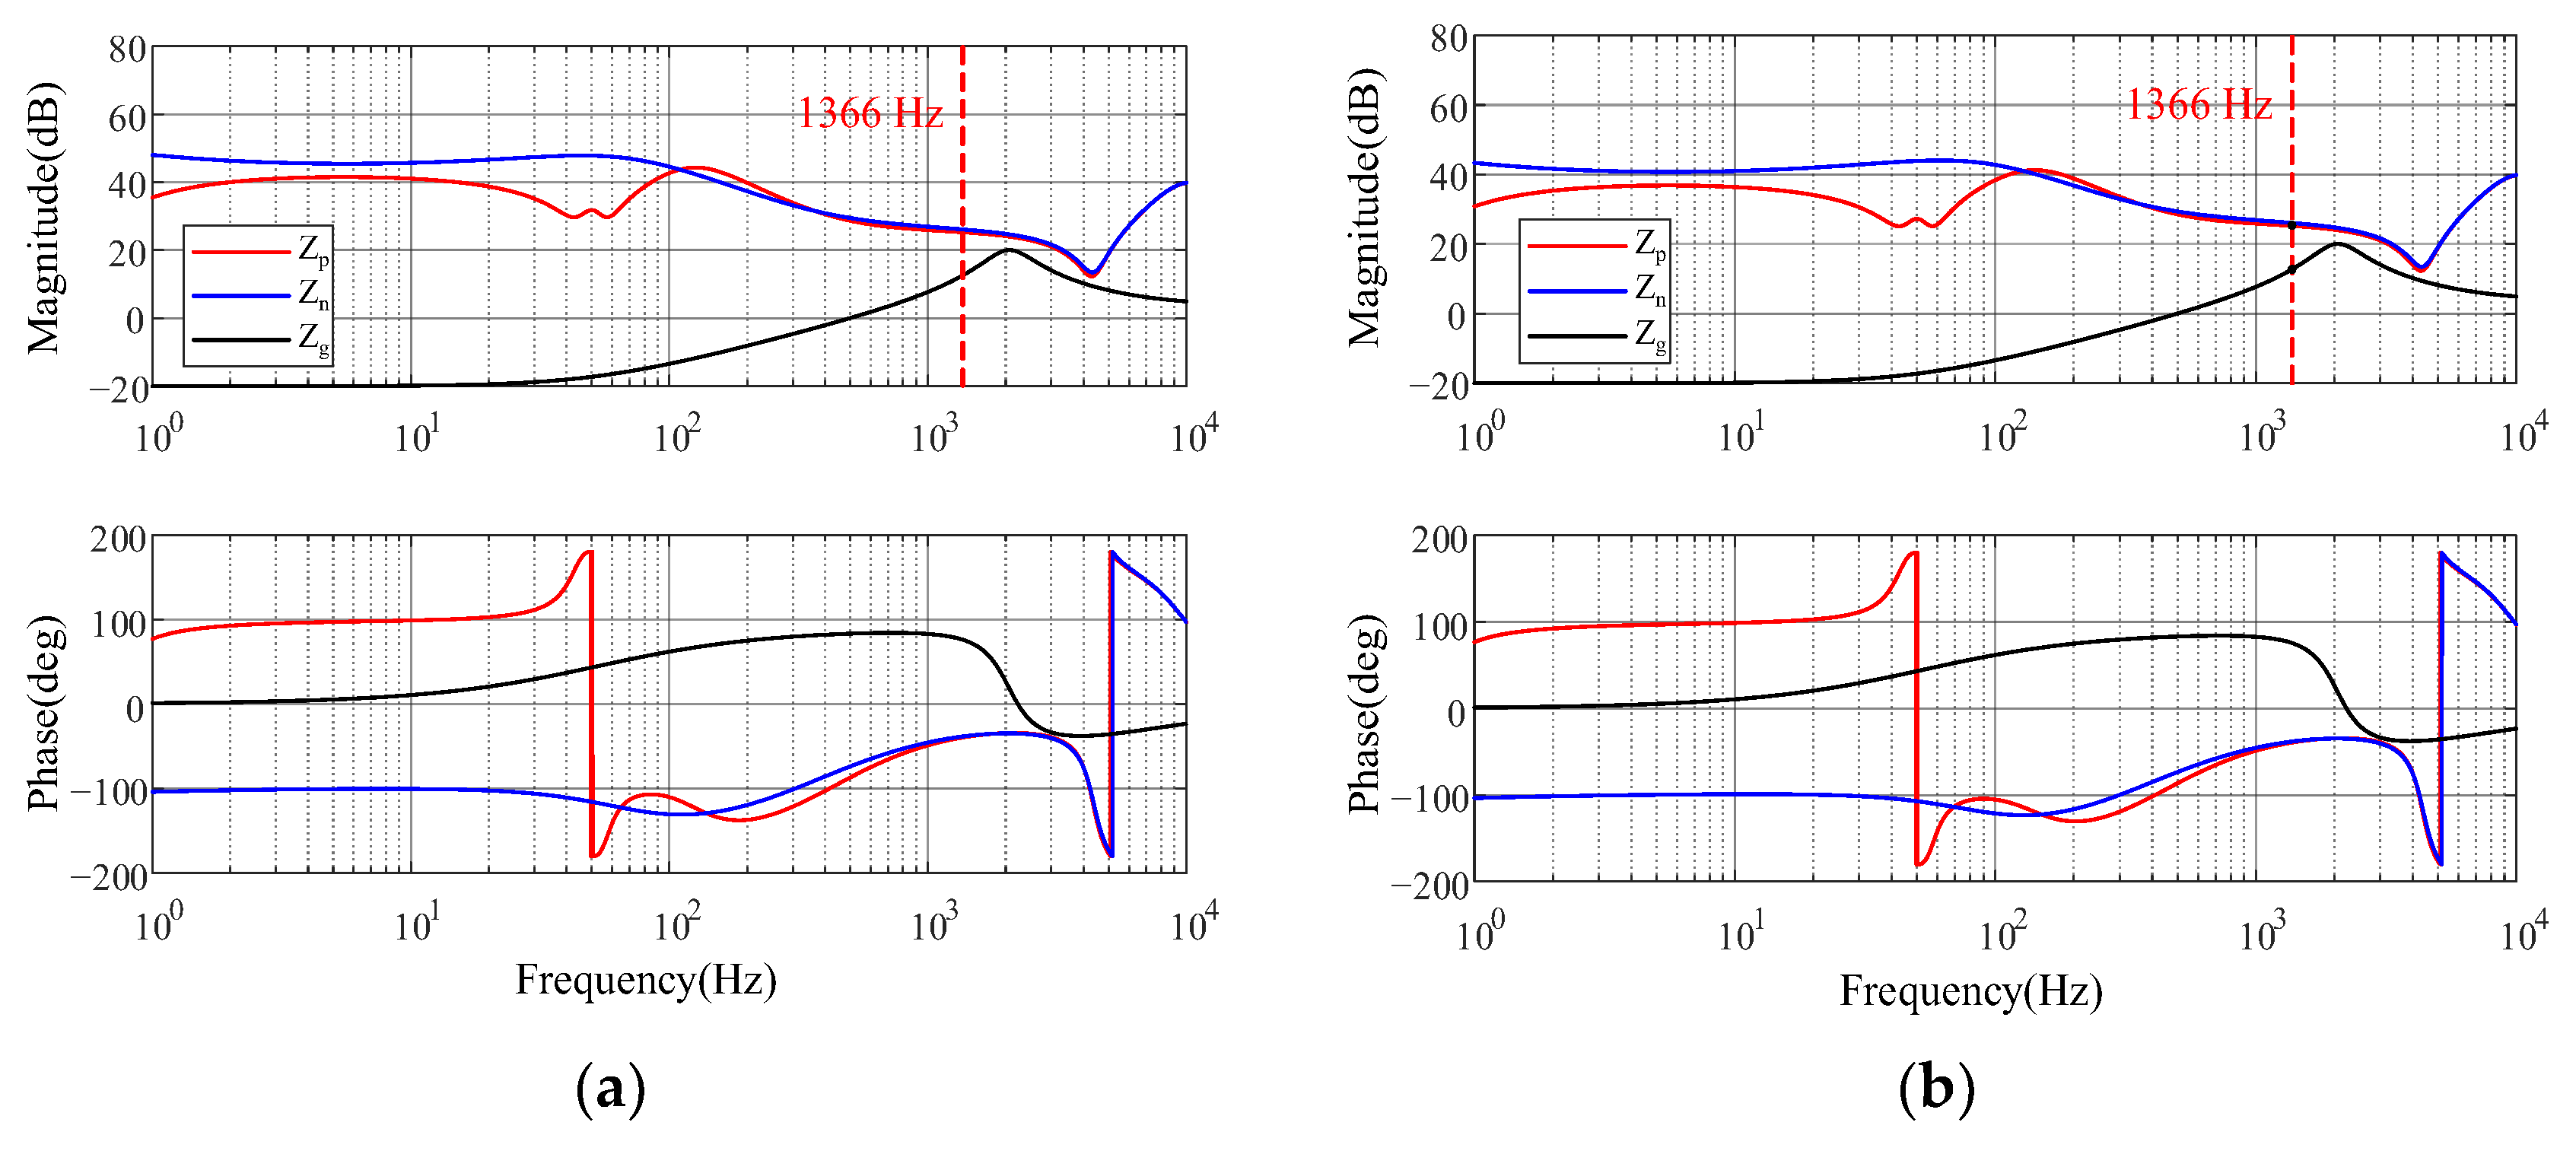
The Bode diagrams of the grid impedance and the positive- and negative-sequence GSC output impedances after applying the virtual admittance method are plotted as shown in Figure 15. It can be seen from Figure 15 that the virtual admittance method alters the magnitude and phase characteristics of the GSC output impedance around the oscillation point, thereby increasing the phase margin at the original impedance intersection and suppressing the high-frequency oscillation at that frequency.
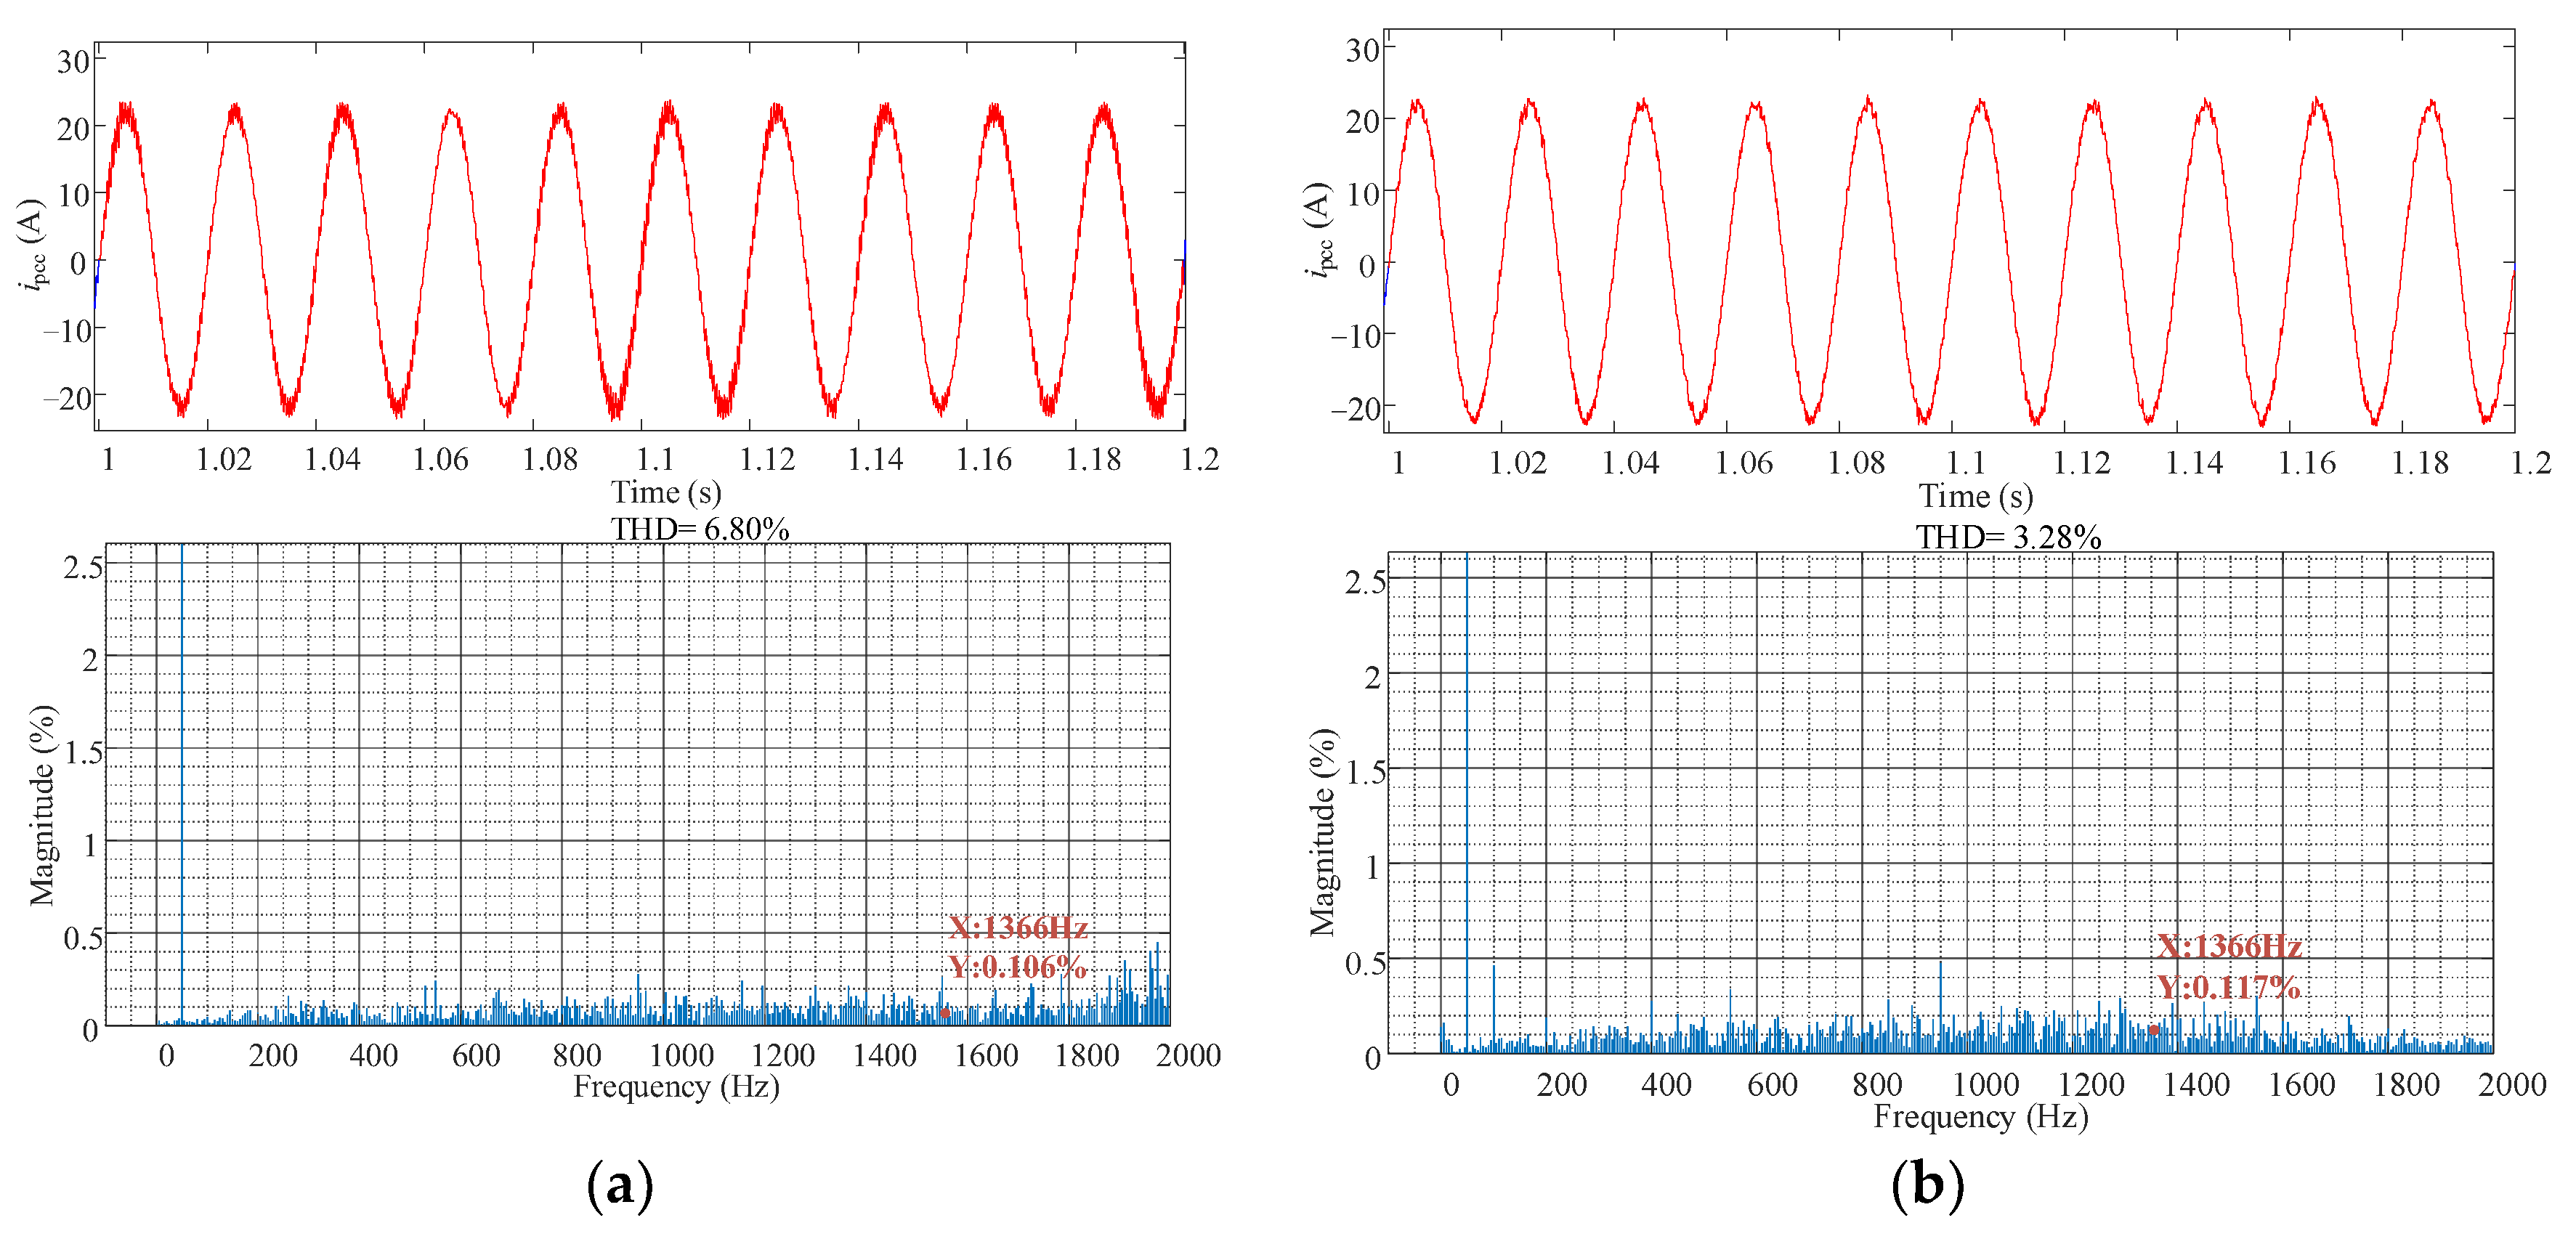
Figure 16 shows the spectrum of the grid-connected current signal after applying the virtual admittance method. As can be seen from Figure 16, although the virtual admittance method partially suppresses the high-frequency oscillation components, it may increase certain high-frequency components in non-target bands, resulting in a relatively high THD. This demonstrates that if the impact on components in other frequency bands is neglected and the degree of dominant oscillation suppression is taken as the sole criterion for evaluating the effectiveness of the introduced controller, it would be difficult to comprehensively reflect the controller’s overall effect on the power quality of the grid-connected system.
As can be seen in Table 1, the advantage of the virtual admittance method lies in its ability to rapidly attenuate the dominant high-frequency oscillation by increasing the equivalent damping, with its parameters tuned primarily by selecting the virtual-admittance value. Although the virtual admittance method can improve the damping characteristics of the grid-connected system to a certain extent and suppress high-frequency oscillations under weak grid conditions, its impedance reshaping acts over a relatively wide frequency band, which may easily introduce additional impedance variations beyond the target frequency, thereby affecting the sideband components and the THD.
By contrast, the current-feedback active damping strategy proposed in this paper aims to eliminate the impedance magnitude intersection, and the tuning process simultaneously takes into account the dominant resonance suppression depth, the sideband component increment, and the THD index. While ensuring effective suppression of the dominant 1366 Hz oscillation, it also minimizes the impact on the fundamental-frequency operating characteristics and the non-target high-frequency bands. As demonstrated in the previous section, after applying the proposed strategy, the magnitude–frequency characteristics of the grid impedance and the wind turbine positive- and negative-sequence impedances no longer intersect in the high-frequency range, and the simulation results confirm that the 1366 Hz high-frequency oscillation is effectively suppressed, with the THD not exceeding 5%. Therefore, compared with the typical virtual admittance method, the proposed strategy achieves a favorable balance between improving the system stability margin and limiting additional harmonic amplification in non-target frequency bands, demonstrating a more favorable trade-off between stability improvement and non-target harmonic amplification under the investigated operating condition.

5.3. Robustness of Proposed Strategy Under Different Active-Power Operation Conditions

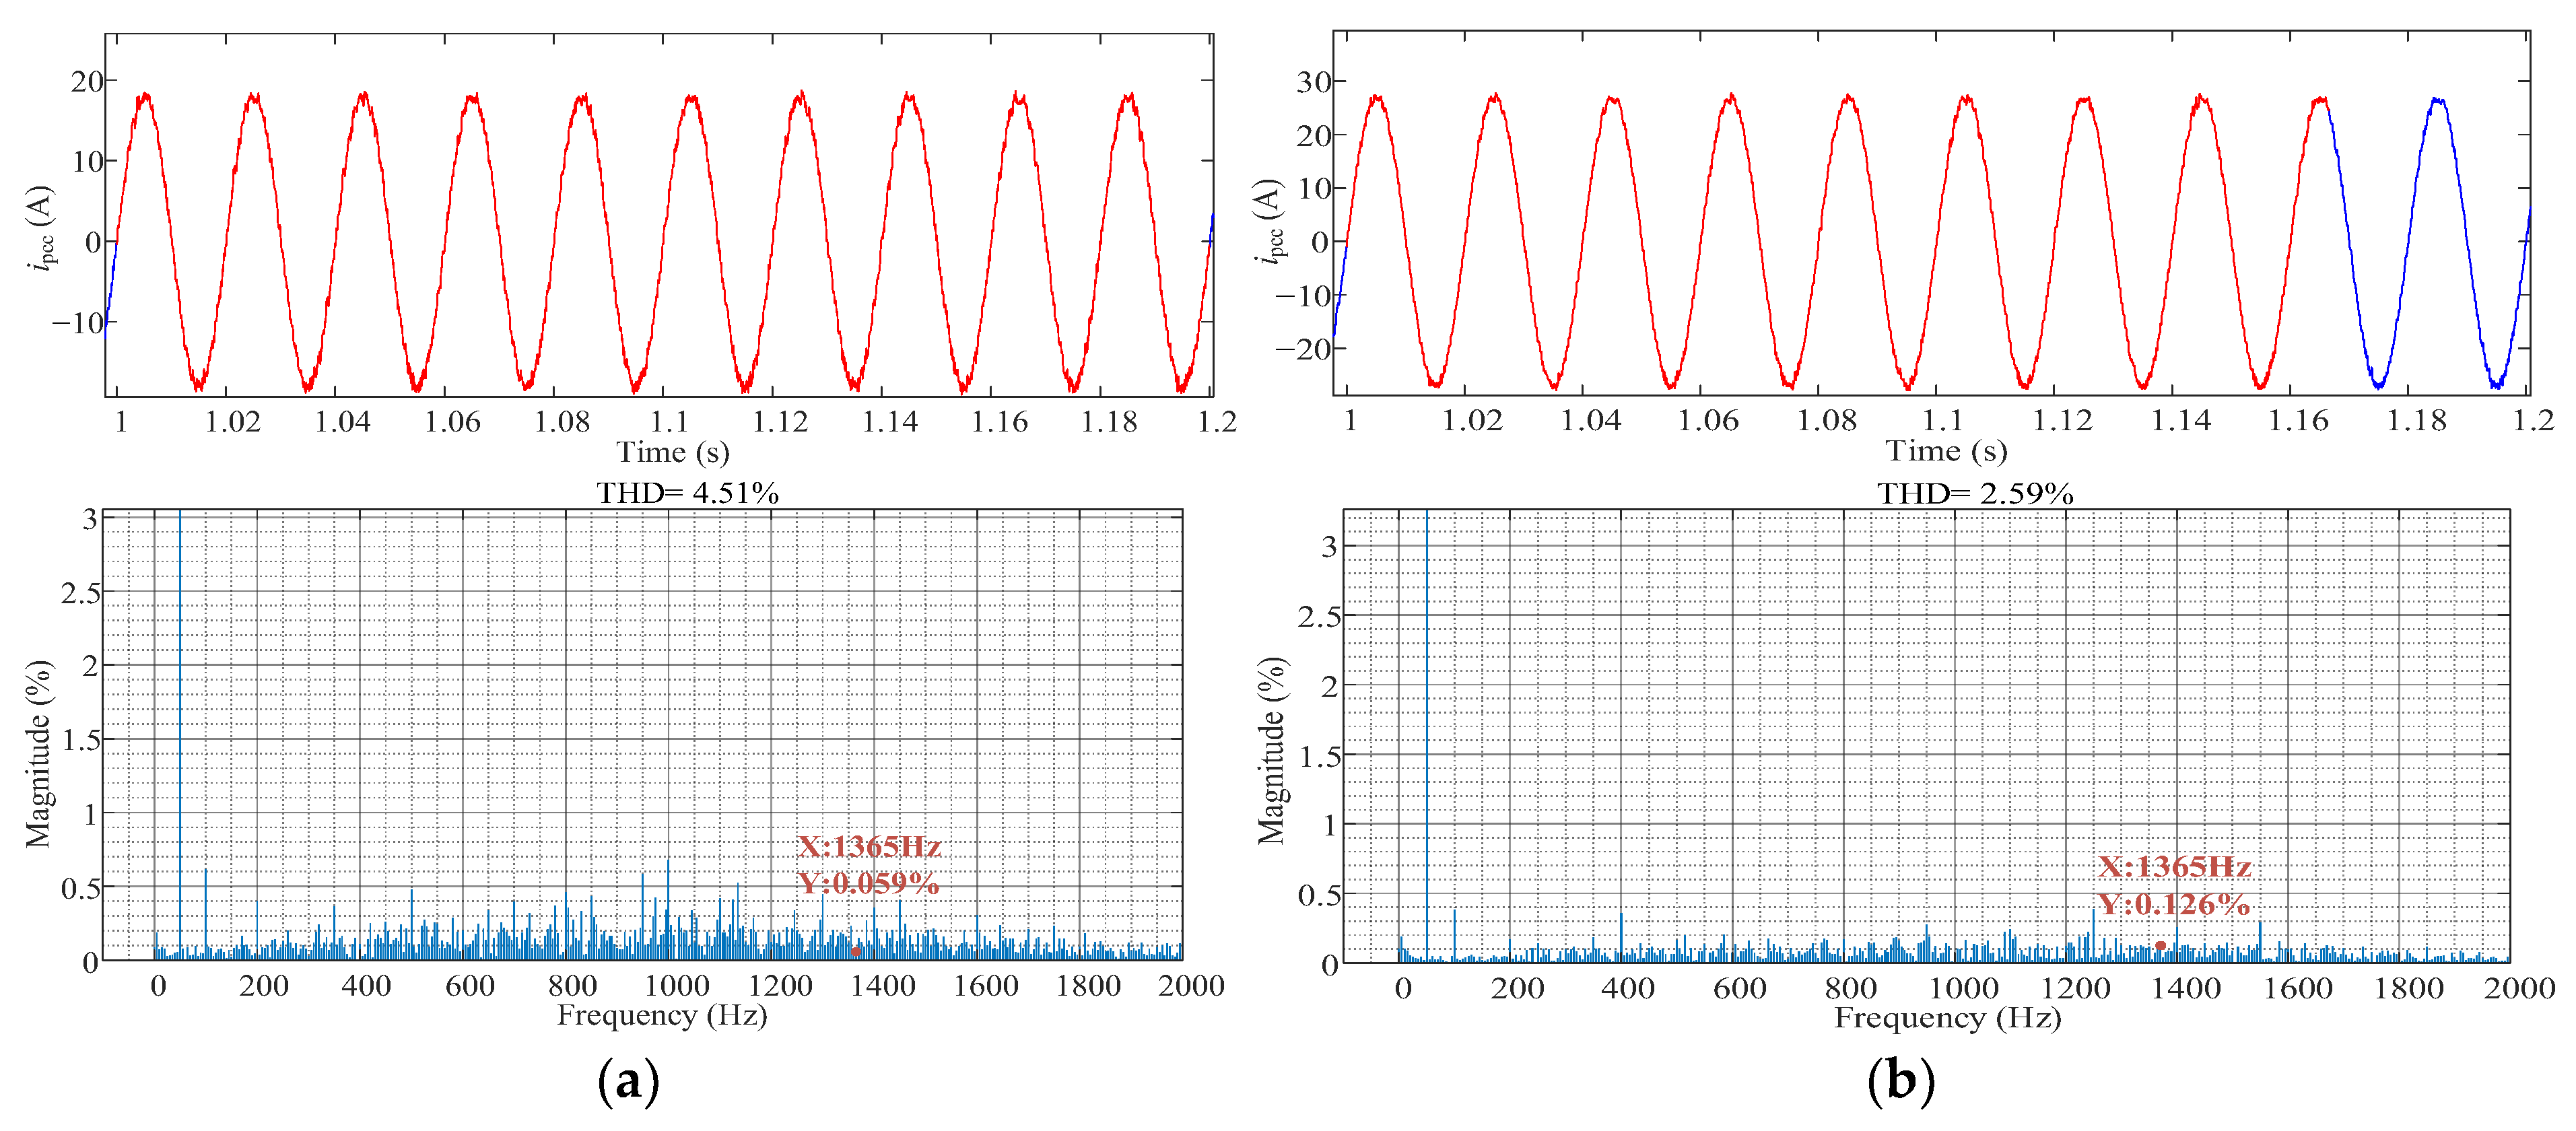
To evaluate operating-point robustness, the active-damping parameters tuned at the base operating condition are kept unchanged and the active-power reference is varied to 7.5 kW and 12.5 kW. The corresponding impedance characteristics, Nyquist curves, and current spectra are recalculated at each operating point. As can be seen in Figure 17, Figure 18 and Figure 19, over the investigated operating range, the GSC and grid impedance magnitudes do not form an adverse high-frequency intersection, the impedance-ratio Nyquist loci satisfy the stability criterion, and the target high-frequency current component remains suppressed while THD remains below 5%. These results in Table 2 indicate that the fixed active-damping parameters retain satisfactory performance over the tested operating-point range.

5.4. Adaptability of Proposed Strategy Under Different Grid Impedance Conditions

Because the converter-grid impedance intersection depends on grid impedance, the proposed tuning procedure is further evaluated under L g = 0.15 and 0.60 mH, while all other system parameters are kept unchanged. For each grid impedance condition, the same tuning algorithm is executed from its prescribed initialization, without manually selecting or adjusting the controller parameters.
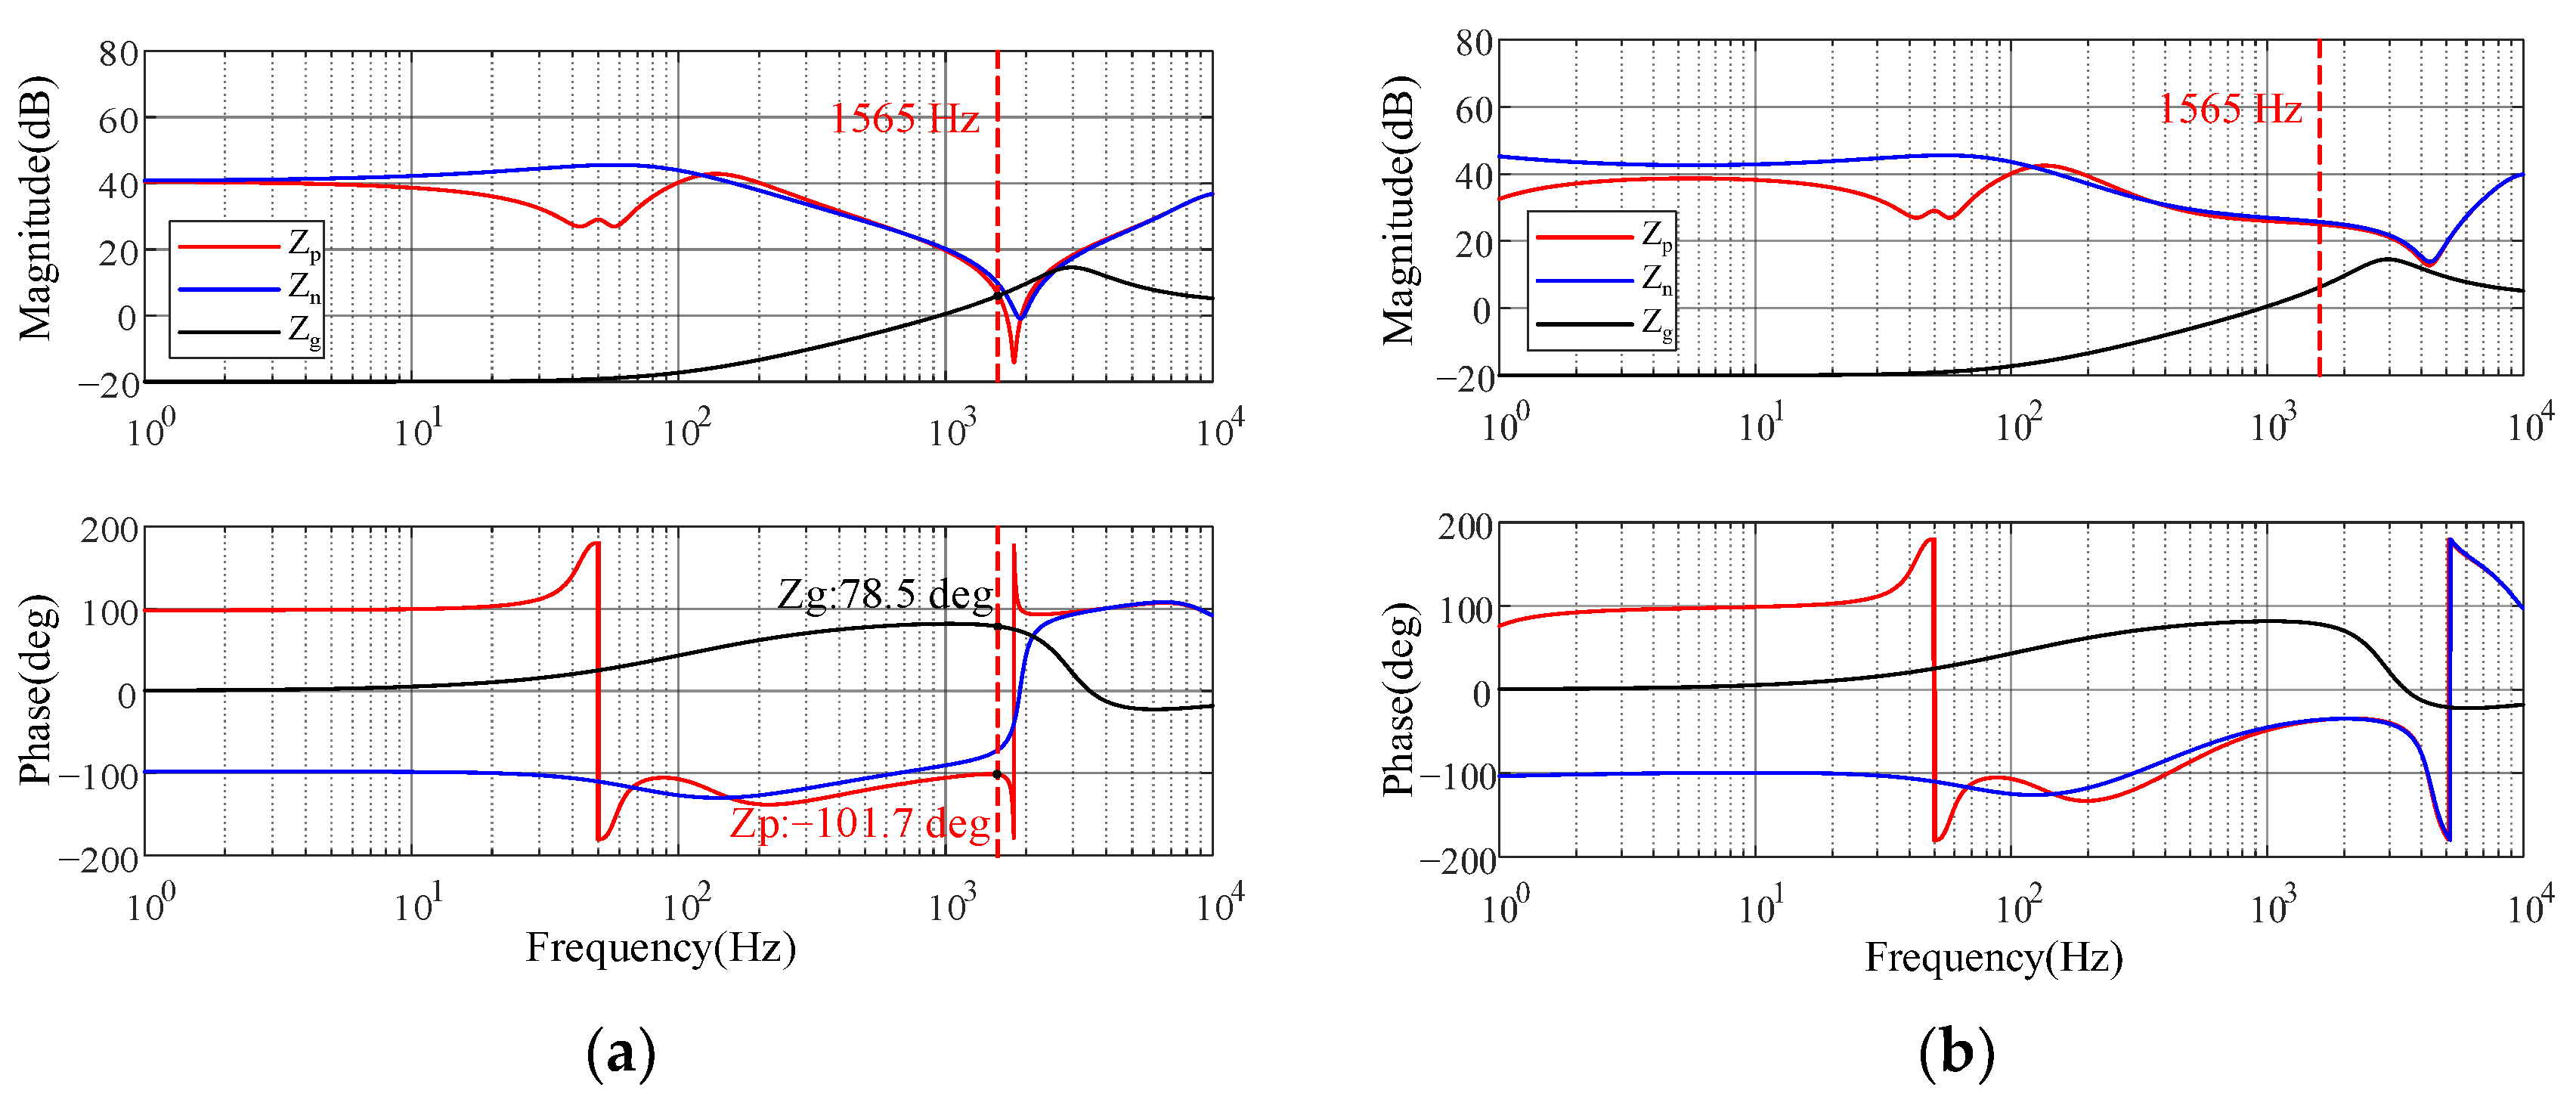
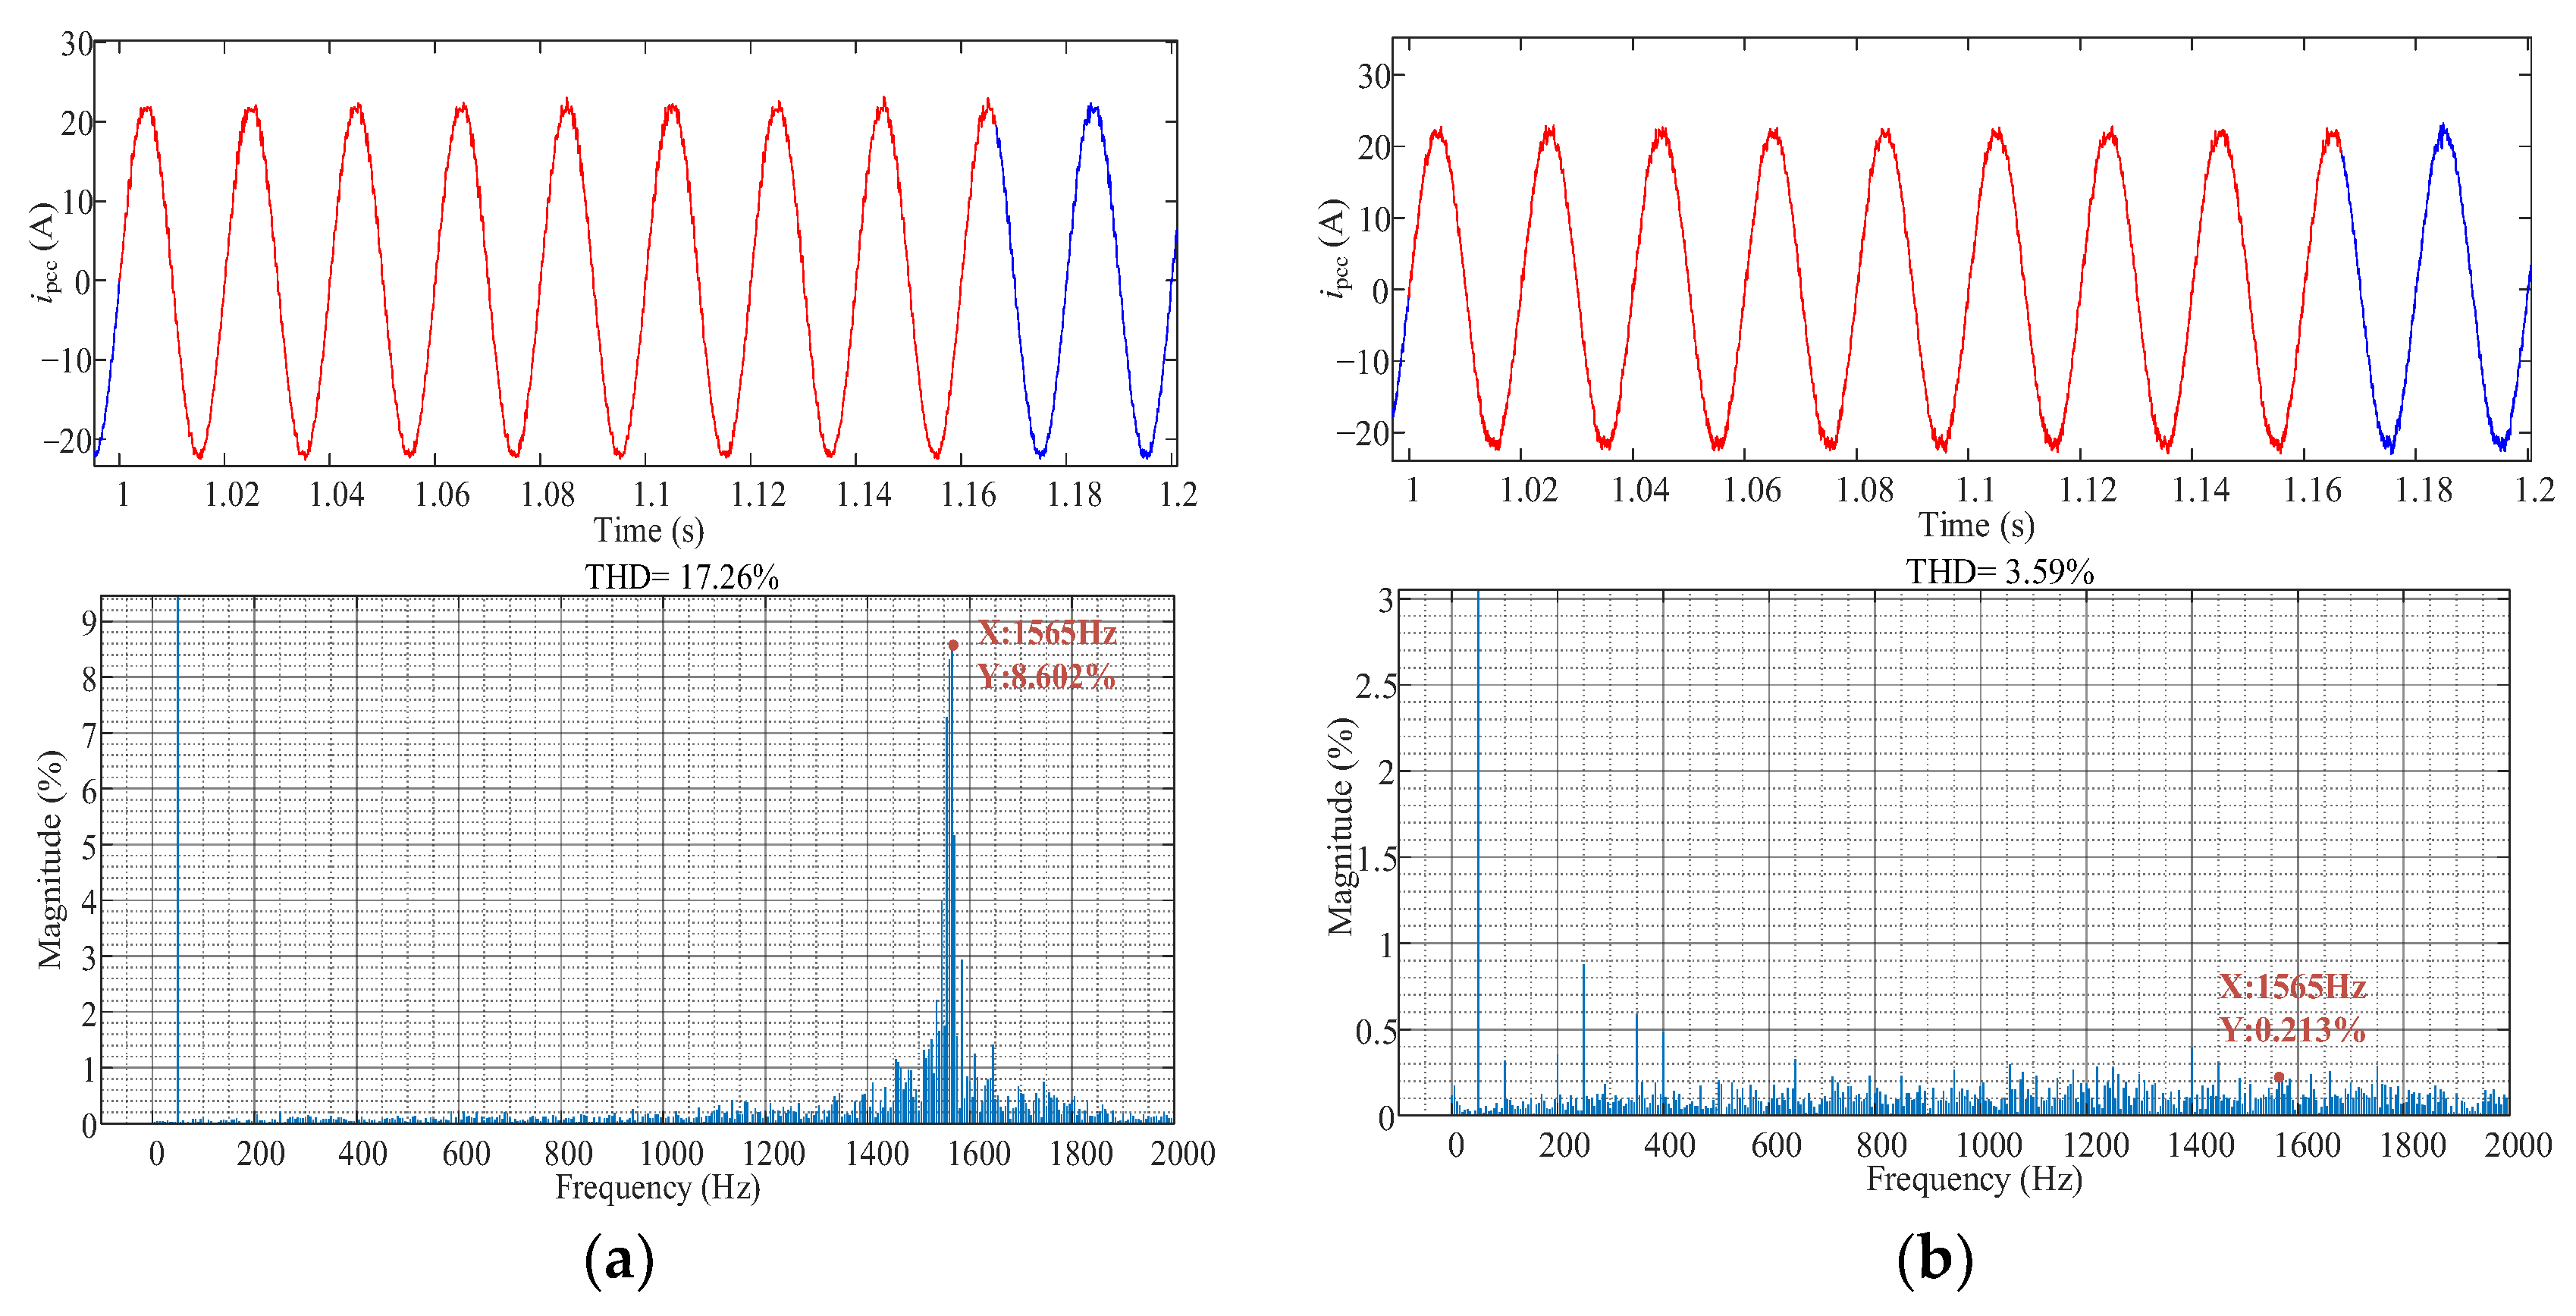
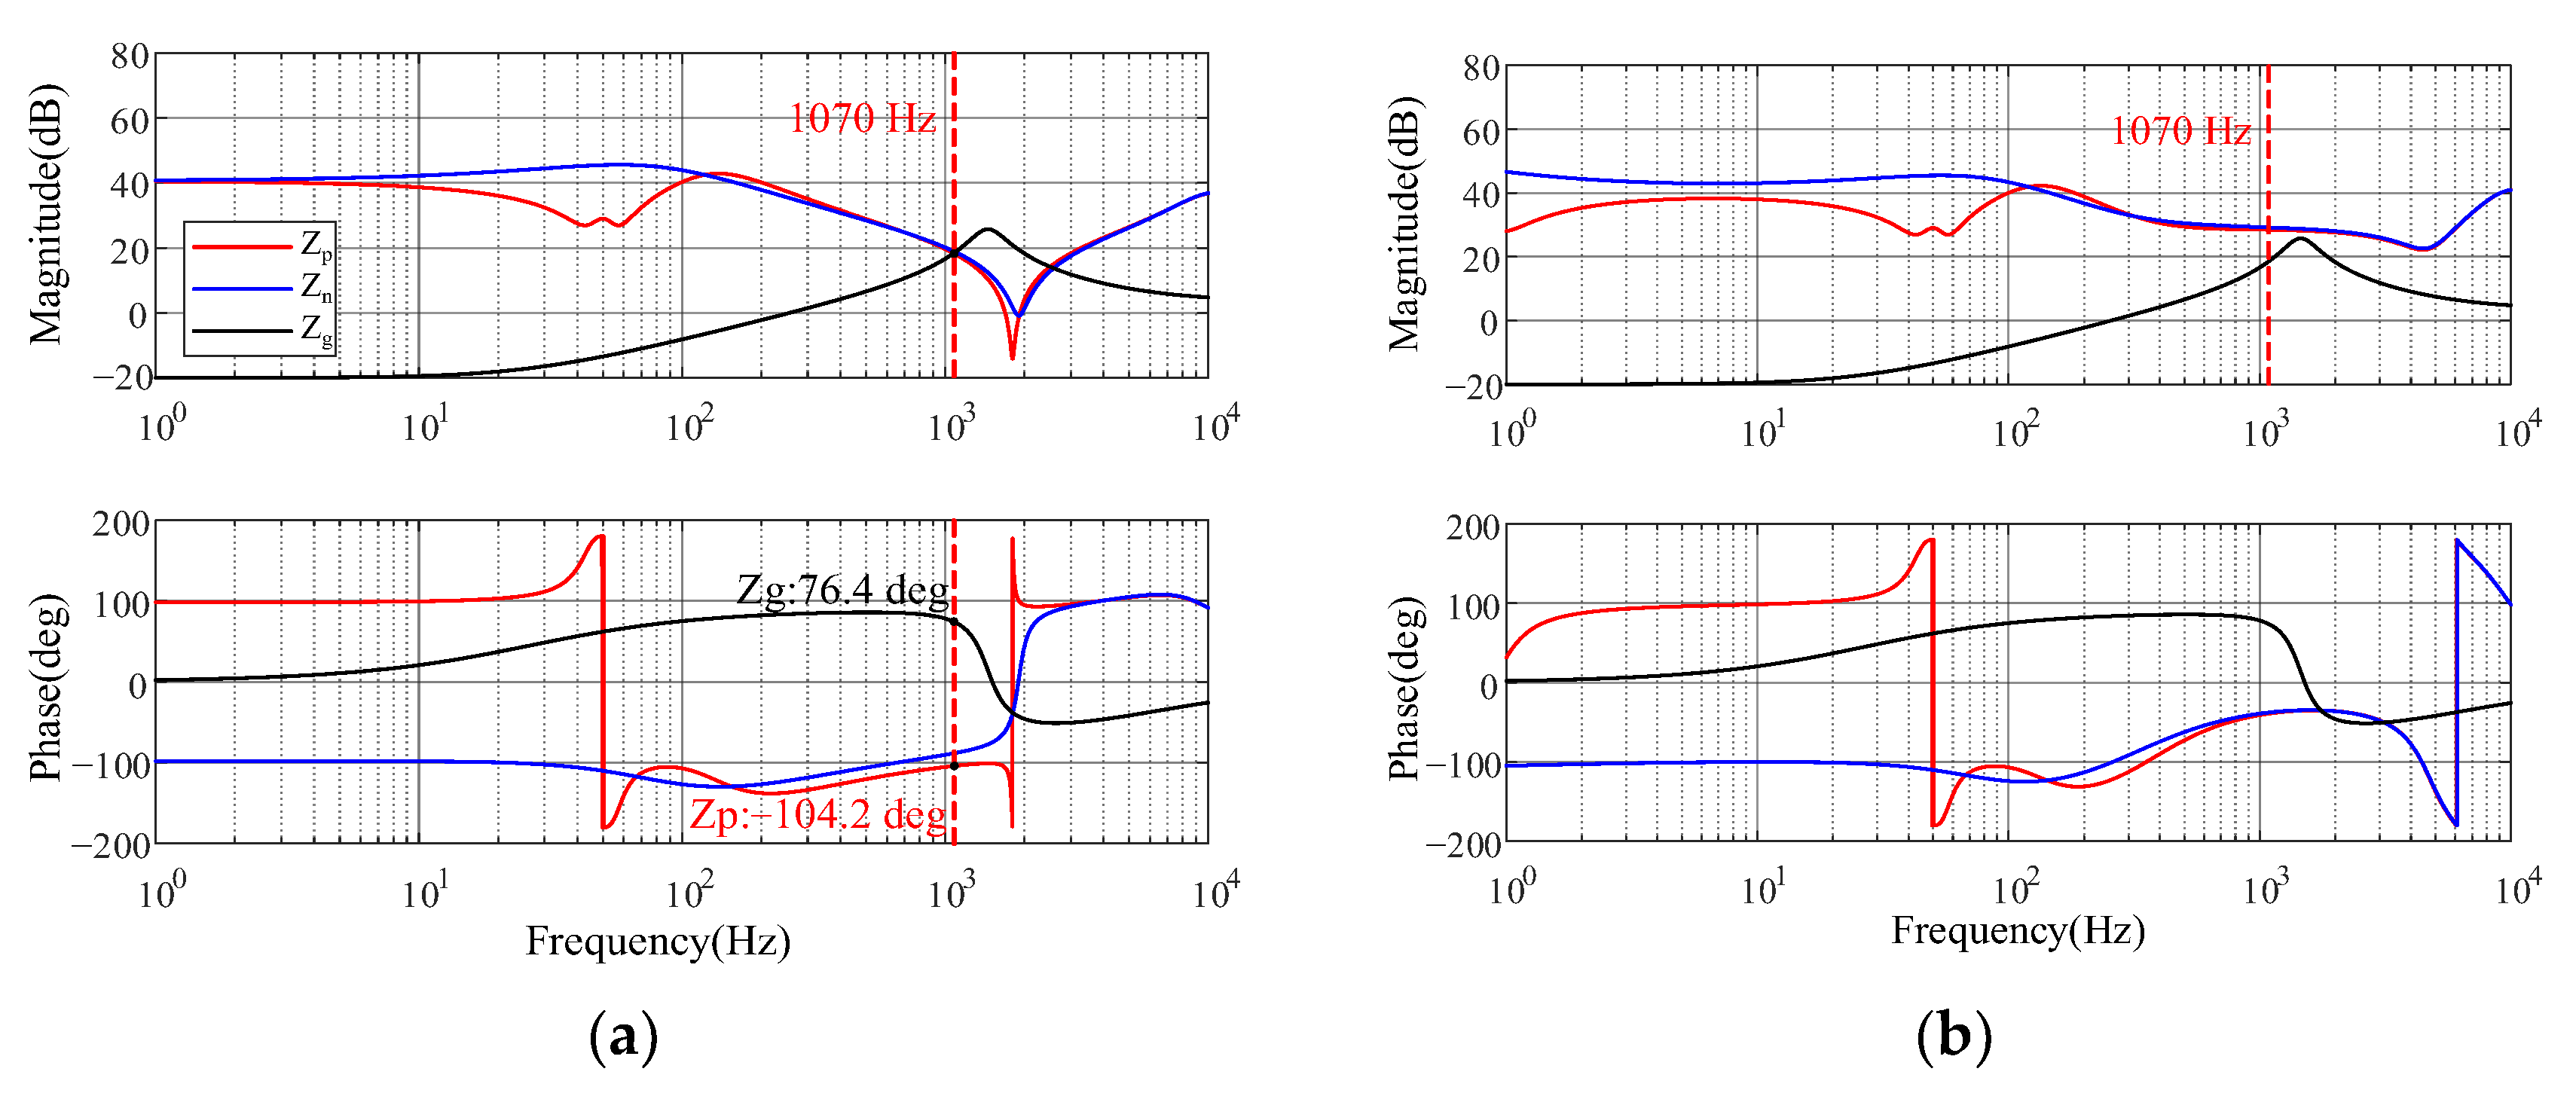
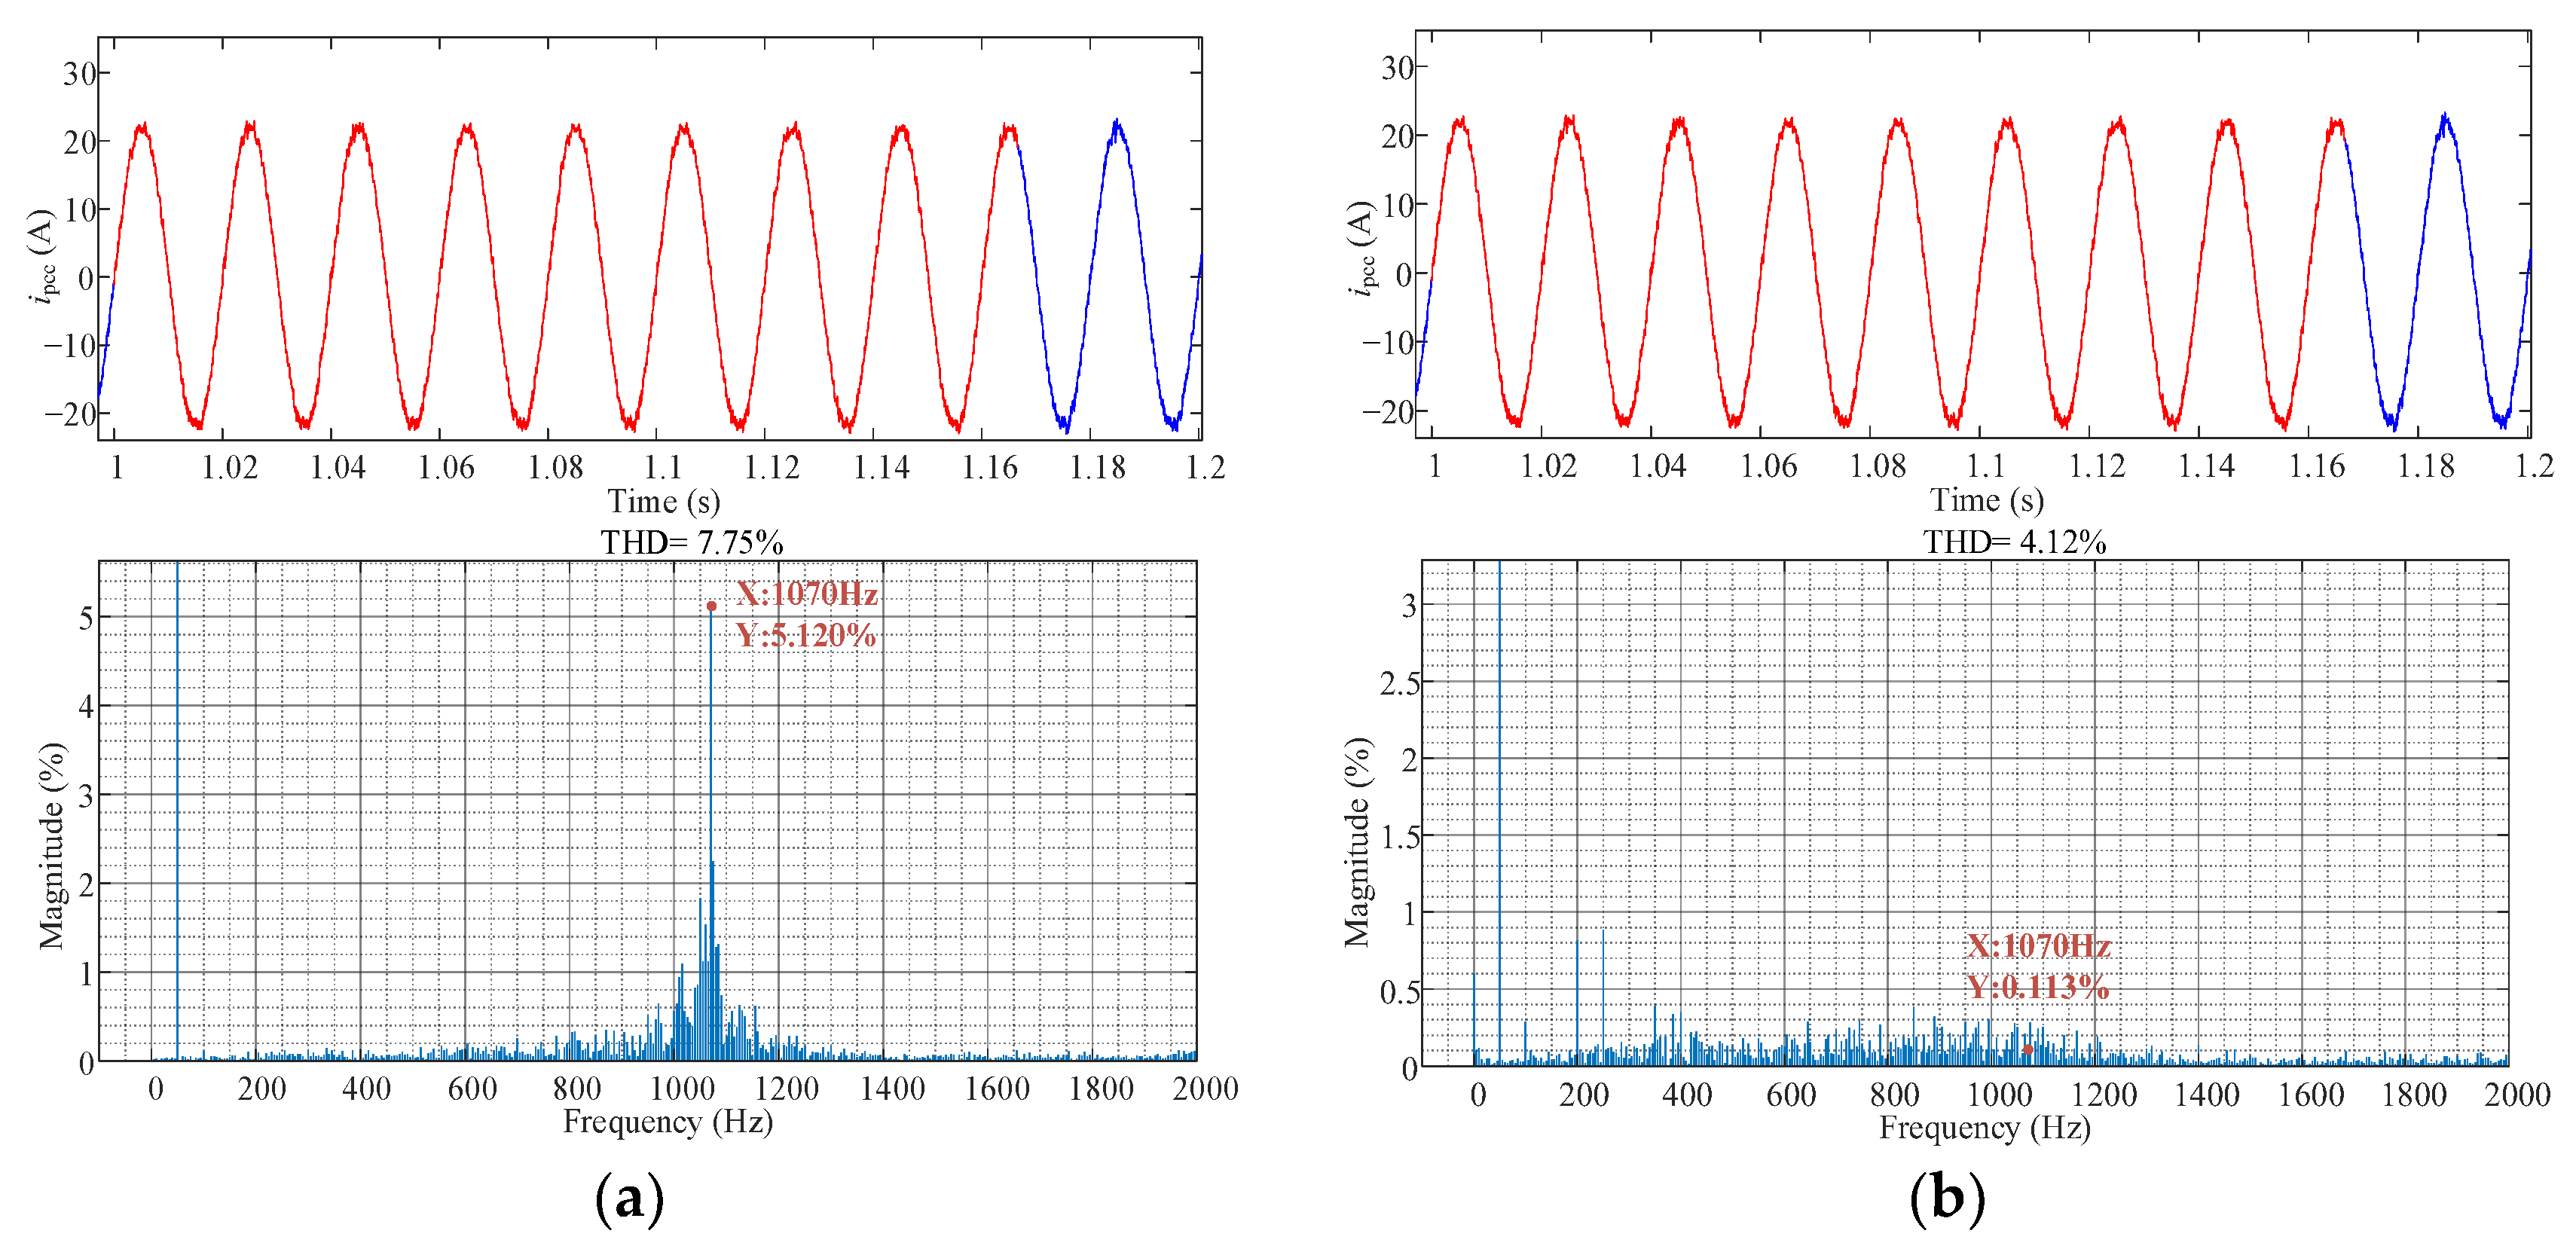
The simulation results are displayed in Figure 20, Figure 21, Figure 22 and Figure 23. As L g varies, the converter-grid impedance-intersection characteristic changes, leading to different tuned active-damping parameters. After retuning, the adverse impedance-intersection condition is removed, and the corresponding high-frequency components are effectively suppressed in both cases. These results in Table 3 indicate that although the numerical values of tuned controller parameters depend on the grid impedance, the proposed impedance-based tuning framework remains effective and applicable under the investigated variations in grid impedance.

6. Conclusions

This paper investigates high-frequency oscillations in the PMSG-based grid-connected system using positive- and negative-sequence impedances. The high-frequency oscillation mechanism and the effects of key parameters have been elucidated via impedance-based stability analysis and parameter sweep evaluations. A current-feedback active damping strategy is then proposed, accompanied by a coordinated parameter-tuning method that simultaneously satisfies impedance stability margins and power-quality constraints. The main conclusions are summarized as follows.
(1)
High-frequency oscillations arise from the interaction between the GSC output impedance and the grid impedance. When their magnitude curves intersect in the high-frequency range, the phase lag introduced by the current inner loop control and sampling delay can yield a negative phase margin at the intersection frequency. The system consequently exhibits negative damping, and small disturbances may develop into sustained high-frequency oscillations.
(2)
The parameter sweep results show that the inner-current-loop proportional gain and sampling delay have pronounced effects on the GSC output impedance within the 1000–3000 Hz range, whereas other evaluated control parameters demonstrate negligible effects. Given that the viable tuning margins of these dominant parameters are strictly constrained by hardware limitations and fundamental control-performance requirements, conventional parameter retuning alone is insufficient to satisfy the required stability margin without compromising the original control performance.
(3)
A current-feedback active damping strategy with coordinated multi-index tuning is developed to reshape the GSC output impedance while jointly accounting for the impedance-intersection margin, dominant-resonance suppression depth, sideband-component increment, and THD. The proposed strategy eliminates the adverse impedance-magnitude intersections and effectively suppresses the target high-frequency oscillation. Under the investigated operating condition, the THD is reduced from 11.33% to 3.28%, while the 1366 Hz current component is reduced from 7.105% to 0.117%. Compared with the virtual admittance method, the proposed strategy achieves a more favorable trade-off between stability enhancement and harmonic performance in non-target frequency bands.
Future work will extend the proposed impedance-reshaping and coordinated tuning framework to other VSC-interfaced renewable energy and storage systems. Furthermore, the DC-link and source-side dynamics will be explicitly retained in the modeling process when dictated by the frequency range of interest.

Author Contributions

Conceptualization, N.Y. and L.Z.; methodology, N.Y.; validation, N.Y., L.Z. and M.Z.; formal analysis, N.Y., M.Z. and X.X.; investigation, N.Y. and D.L.; resources, L.Z.; data curation, Z.L. and D.L.; writing—original draft preparation, N.Y., L.Z. and M.Z.; writing—review and editing, N.Y., L.Z. and M.Z.; visualization, L.Z. and Z.L.; supervision, L.Z.; project administration, L.Z.; funding acquisition, L.Z. All authors have read and agreed to the published version of the manuscript.

Funding

This research was funded by the Basic and Applied Basic Research Foundation of Guangdong Province, funding number 2024B1515250001.

Data Availability Statement

All data generated or analyzed during this study are included in this published article.

Conflicts of Interest

The authors declare no conflicts of interest.

Appendix A

Table A1. Simulation parameters.
ParametersValues
rated AC line-to-ground voltage/V220
DC-side voltage/V700
rated active power/kW10
filter   inductance   L f / mH 3
filter   capacitance   C f / μ F 20
damping   resistance   R f / Ω 1.5
PLL   proportional   gain   K p p l l 0.266
PLL   integral   gain   K i p l l 11
inner   current   loop   proportional   gain   K p i 0.034
inner   current   loop   integral   gain   K i i 45.7
voltage   feedforward   gain   K f 0.0029
decoupling   coefficient   K d 0.0027
sampling   period   T s /s5 × 10−5
active damping controller gain K s 29.8729
active damping controller frequency-selectivity parameter ω bw /rad∙s−1780,168 π  

Appendix B

To verify the impact of the above parameter variations on the final tuning results, a parameter sensitivity analysis is conducted by varying representative parameters within reasonable ranges. Specifically, α F , α S , and α T are coordination weights that determine the relative contributions of different performance indices to the iterative update; F 0 and S 0 are normalization factors rather than performance thresholds; h m , Δ F r e q and THD max are treated as design requirements for phase margin, dominant-resonance attenuation and power quality, respectively; and λ min and λ max are step-size safeguards introduced to prevent excessively large parameter variations.
The proposed tuning procedure is applied to each parameter configuration, and the corresponding tuning parameters and oscillation suppression performance are evaluated. To examine the influence of different design choices, one representative parameter category is varied at a time relative to the baseline configuration. Specifically, Case B-1 uses the typical parameter values suggested in the original paper; Case B-2 modifies the weight factors compared to Case B-1, setting all three weight factors to their average value of 1/3; Case B-3 decreases the normalization scale F 0 compared to Case B-1 while keeping S 0 constant; Case B-4 changes the feasible region constraints compared to Case B-1, increasing h m while keeping other values unchanged; and Case B-5 modifies the safety constraints compared to Case B-1, expanding the adjustable range of the adjustment coefficient. The detailed parameter settings for all cases are summarized in Table B1.
Table B1. Case parameter settings.
Case NumberWeighted FactorsNormalization ScaleFeasible Region ConstraintsSafety Constraints
α F α S α T F 0 S 0 h m Δ F r e q THD max λ min λ max
B-10.50.30.212 dB6 dB3 dB−3 dB5%0.32
B-21/31/31/312 dB6 dB3 dB−3 dB5%0.32
B-30.50.30.29 dB6 dB3 dB−3 dB5%0.32
B-40.50.30.212 dB6 dB6 dB−3 dB5%0.32
B-50.50.30.212 dB6 dB3 dB−3 dB5%0.15
The results confirm that the numerical design settings influence both the converged feasible solution and the convergence trajectory. In the tested range, K s and ω bw vary among the cases, while all cases eliminate the adverse magnitude intersections and maintain THD below 5%. The target high-frequency component remains below 0.5% in all cases.
Therefore, the proposed procedure should not be interpreted as producing a unique globally optimal parameter pair. Instead, it provides a structured coordinated tuning mechanism that converges to a feasible parameter pair consistent with the selected stability and power-quality priorities. Within the investigated parameter ranges, the design parameters primarily determine the specific feasible solution and convergence trajectory, while the explicit feasibility constraints ensure that the resulting controller parameters satisfy the required oscillation suppression and power-quality conditions.
Table B2. Simulation results of cases.
Case NumberTuning ParametersIntersections in Bode DiagramOscillation Frequency Component MagnitudeTHD
K s ω bw BeforeAfterBeforeAfterBeforeAfter
B-129.8729780,168 π   207.105%0.117%11.33%3.28%
B-211.2766296,316.4 π   0.076%4.14%
B-315.5373407,150.4 π   0.222%3.71%
B-414.0594368,704.2 π   0.142%3.76%
B-59.8967260,430.8 π   0.072%4.49%

References

  1. Pang, B.; Si, Q.; Jiang, P.; Liao, K.; Zhu, X.; Yang, J.; He, Z. Review of the Analysis and Suppression for High-Frequency Oscillations of the Grid-Connected Wind Power Generation System. CES Trans. Electr. Mach. Syst. 2024, 8, 127–142. [Google Scholar] [CrossRef] [Scilit]
  2. Luo, J.; Liu, B.; Guo, X.; Yang, L.; Liu, C.; Xu, Y.; Bu, S. Oscillation Stability Induced by Wind Power Integration: Incidents, Mechanism, Countermeasures and Future Challenges. Renew. Sustain. Energy Rev. 2025, 217, 115692. [Google Scholar] [CrossRef] [Scilit]
  3. Argüello, A.; Torquato, R.; Freitas, W. Resonance Assessment of Large-Scale Wind Park Connected to Primary Distribution Network. J. Mod. Power Syst. Clean Energy 2025, 13, 289–299. [Google Scholar] [CrossRef] [Scilit]
  4. Zhang, Q.; Xu, Y.; He, J. Facilitating Wide-Band Oscillation Analysis in Wind Farms with a Novel Linearization Analysis Framework Based on the Average-Value Model. iEnergy 2025, 4, 132–148. [Google Scholar] [CrossRef] [Scilit]
  5. Shi, J.; Yang, L.; Yang, H.; Ji, J.; Chen, Z. Impedance Modeling and Quantitative Stability Analysis of Grid-Connected Voltage Source Converters under Complex Unbalanced Conditions. Electr. Power Syst. Res. 2025, 238, 111084. [Google Scholar] [CrossRef] [Scilit]
  6. Ali, R.; Heydari-Doostabad, H.; Sajedi, S.; O’Donnell, T. Improved Design of Passive Damping for Single-Phase Grid-Connected LCL-Filtered Inverter Considering Impedance Stability. IET Power Electron. 2024, 17, 511–523. [Google Scholar] [CrossRef] [Scilit]
  7. Yang, S.; Liu, K.; Qin, L.; Zhu, S.; Zhou, Y.; Liu, Z.; Wang, Q. Optimized MMC Passive Impedance Shaping Method for High-Frequency Oscillation Suppression. Int. J. Electr. Power Energy Syst. 2024, 159, 110010. [Google Scholar] [CrossRef] [Scilit]
  8. Yang, M.; Li, D.; Liu, X.; Fan, L.; Zheng, K.; Chen, Q. Design of Passive Damping Filter for High-Frequency Oscillation Suppression of MMC. In Proceedings of the 2023 IEEE 2nd International Power Electronics and Application Symposium (PEAS), Guangzhou, China, 10–13 November 2023; pp. 1531–1535. [Google Scholar]
  9. Dai, L.; Wang, H.; Qin, Y.; Shi, G.; Zhang, J.; Cai, X. Analysis and Suppression of High-Frequency Resonance for Offshore Wind Power Grid-Connected Converter Considering Cable Capacitance Effect. Electronics 2023, 12, 2638. [Google Scholar] [CrossRef] [Scilit]
  10. Ji, K.; Pang, H.; He, Z.; Li, Y.; Liu, D.; Tang, G. Active/Passive Method-Based Hybrid High-Frequency Damping Design for MMCs. IEEE J. Emerg. Sel. Top. Power Electron. 2021, 9, 6086–6098. [Google Scholar] [CrossRef] [Scilit]
  11. Xu, Z. Analysis of Wideband Oscillation Mechanism and Suppression Technology Based on C-Type Damping Filter. Energies 2026, 19, 943. [Google Scholar] [CrossRef] [Scilit]
  12. Huang, P.; Wu, H.; Vanfretti, L.; Gomis-Bellmunt, O. Wideband Impedance Passivation of MMCs for Suppressing Harmonic Oscillations. IEEE Trans. Power Deliv. 2024, 39, 3101–3113. [Google Scholar] [CrossRef] [Scilit]
  13. Wang, X.; Harnefors, L.; Blaabjerg, F. Unified Impedance Model of Grid-Connected Voltage-Source Converters. IEEE Trans. Power Electron. 2018, 33, 1775–1787. [Google Scholar] [CrossRef] [Scilit]
  14. Guest, E.; Jensen, K.H.; Rasmussen, T.W. Mitigation of Harmonic Voltage Amplification in Offshore Wind Power Plants by Wind Turbines with Embedded Active Filters. IEEE Trans. Sustain. Energy 2020, 11, 785–794. [Google Scholar] [CrossRef] [Scilit]
  15. Liu, Z.; Yuan, Y.; Liu, C.; Sun, C.; Bin, Z. Design and Optimization of a High-Frequency Oscillation Suppression Strategy for the Grid-Connected Inverter of a Permanent Magnet Direct Drive Wind Turbine. Energies 2025, 18, 1679. [Google Scholar] [CrossRef] [Scilit]
  16. Li, J.; Ma, X.; Wu, B.; Li, R.; Yang, R. Robust Control Delay Compensation Method for Grid-Connected Inverter Based on Improved Newton Interpolation. CSEE J. Power Energy Syst. 2025, 11, 783–792. [Google Scholar] [CrossRef] [Scilit]
  17. Li, S.; Wu, J.; Vasquez, J.C.; Guerrero, J.M.; Palensky, P.; Lekic, A. Active Filter Parameter Tuning Method for Harmonic Voltage Mitigation in Wind Power Plants. Electr. Power Syst. Res. 2024, 234, 110726. [Google Scholar] [CrossRef] [Scilit]
  18. Schwanz, D.; Bollen, M.; Lennerhag, O.; Larsson, A. Harmonic Transfers for Quantifying Propagation of Harmonics in Wind Power Plants. Energies 2021, 14, 5798. [Google Scholar] [CrossRef] [Scilit]
  19. Rao, Y.; Lyu, J.; Wang, Y.; Cai, X. Adaptive Mitigation Control for Wideband Oscillations of Offshore Wind Farms with MMC-HVDC System. CSEE J. Power Energy Syst. 2025, 11, 208–216. [Google Scholar] [CrossRef] [Scilit]
  20. Ma, J.; Deng, Y.; Xu, H.; Zhao, Y. Oscillation Stability Control Based on Equipment-Level and Farm-Level Cooperative Optimization for Power System Connected with Direct-Drive PMSG-Based Wind Farms. J. Mod. Power Syst. Clean Energy 2025, 13, 1580–1592. [Google Scholar] [CrossRef] [Scilit]
  21. Huang, P.; Zhou, N.; Luo, Y.; Duan, X.; Wang, Q. Impedance Coupling Suppression Control Method for Offshore Wind Farms Integrated with MMC-HVDC System. IEEE Trans. Ind. Electron. 2025, 72, 6015–6026. [Google Scholar] [CrossRef] [Scilit]
  22. Yu, H.; Lyu, J.; Cai, X. High-Frequency Self-Stabilizing Control for a Grid-Tied VSC. IEEE Trans. Power Electron. 2024, 39, 7980–7994. [Google Scholar] [CrossRef] [Scilit]
  23. Liu, B.; Li, Z.; Dong, X.; Yu, S.S.; Chen, X.; Oo, A.M.T.; Lian, X.; Shan, Z.; Liu, X. Impedance Modeling and Controllers Shaping Effect Analysis of PMSG Wind Turbines. IEEE J. Emerg. Sel. Top. Power Electron. 2021, 9, 1465–1478. [Google Scholar] [CrossRef] [Scilit]
  24. Ebrahimzadeh, E.; Blaabjerg, F.; Wang, X.; Bak, C.L. Harmonic Stability and Resonance Analysis in Large PMSG-Based Wind Power Plants. IEEE Trans. Sustain. Energy 2018, 9, 12–23. [Google Scholar] [CrossRef] [Scilit]
  25. Xue, T.; Lyu, J.; Wang, H.; Cai, X. A Complete Impedance Model of a PMSG-Based Wind Energy Conversion System and Its Effect on the Stability Analysis of MMC-HVDC Connected Offshore Wind Farms. IEEE Trans. Energy Convers. 2021, 36, 3449–3461. [Google Scholar] [CrossRef] [Scilit]
  26. Zhou, W.; Torres-Olguin, R.E.; Wang, Y.; Chen, Z. DQ Impedance-Decoupled Network Model-Based Stability Analysis of Offshore Wind Power Plant under Weak Grid Conditions. IET Power Electron. 2020, 13, 2715–2729. [Google Scholar] [CrossRef] [Scilit]
  27. Cespedes, M.; Sun, J. Impedance Modeling and Analysis of Grid-Connected Voltage-Source Converters. IEEE Trans. Power Electron. 2014, 29, 1254–1261. [Google Scholar] [CrossRef] [Scilit]
  28. Zhou, X.; Xu, D.; Huang, Y. Impedance Characteristics and Harmonic Analysis of LCL-Type Grid-Connected Converter Cluster. Energies 2022, 15, 3708. [Google Scholar] [CrossRef] [Scilit]
  29. Wu, T.; Xie, X.; Jiang, Q.; Shen, Z. Impedance Modelling of Grid-Connected Voltage-Source Converters Considering the Saturation Non-Linearity. IET Gener. Transm. Distrib. 2020, 14, 4815–4823. [Google Scholar] [CrossRef] [Scilit]
  30. Yang, L.; Chen, Y.; Luo, A.; Huai, K. Admittance Reshaping Control Methods to Mitigate the Interactions between Inverters and Grid. Energies 2019, 12, 2457. [Google Scholar] [CrossRef] [Scilit]
Figure 1. Main circuit diagram of the grid-connected direct-drive wind turbine system.
Energies 19 04115 g001
Figure 2. Control block diagram of the grid-connected direct-drive wind turbine system.
Energies 19 04115 g002
Figure 3. Frequency sweep results of the positive- and negative-sequence GSC output impedances: (a) frequency sweep results of the positive-sequence impedance; (b) frequency sweep results of the negative-sequence impedance.
Energies 19 04115 g003
Figure 4. Equivalent circuit diagram of the PMSG-based grid-connected system.
Energies 19 04115 g004
Figure 5. Bode diagram of the high-frequency oscillation in the grid-connected system.
Energies 19 04115 g005
Figure 6. Influence of control parameter variations on the high-frequency characteristics of the GSC output impedance: (a) current inner loop proportional gain K p i ; (b) sampling delay T s 1 ; (c) PLL proportional gain K p p l l .
Energies 19 04115 g006
Figure 7. Control block diagram of the wind turbine based on current-feedback active damping strategy.
Energies 19 04115 g007
Figure 8. Frequency responses of the fundamental-frequency notch filter: (a) magnitude response; (b) phase response.
Energies 19 04115 g008
Figure 9. Bode diagrams of the high-frequency positive- and negative-sequence impedances under varying K s : (a) positive-sequence impedance; (b) negative-sequence impedance.
Energies 19 04115 g009
Figure 10. Bode diagrams of the high-frequency positive- and negative-sequence impedances under varying ω bw : (a) positive-sequence impedance; (b) negative-sequence impedance.
Energies 19 04115 g010
Figure 11. Flow chart for tuning the gain and frequency-selectivity parameters.
Energies 19 04115 g011
Figure 12. Bode diagram of the impedance characteristics of the PMSG-based grid-connected system: (a) before impedance reshaping; (b) after impedance reshaping.
Energies 19 04115 g012
Figure 13. Nyquist curves of the impedance ratio for the PMSG-based grid-connected system: (a) before impedance reshaping; (b) after impedance reshaping.
Energies 19 04115 g013
Figure 14. Current signal spectrum of the PMSG-based grid-connected system: (a) before impedance reshaping; (b) after impedance reshaping.
Energies 19 04115 g014
Figure 15. Bode diagram of the impedance characteristics of the PMSG-based grid-connected system with different suppression strategies: (a) Virtual admittance method; (b) Current-feedback active damping.
Energies 19 04115 g015
Figure 16. Current signal spectrum of the grid-connected with different suppression strategies: different suppression strategies: (a) virtual admittance method; (b) current-feedback active damping.
Energies 19 04115 g016
Figure 17. Bode diagram of the impedance characteristics of the PMSG-based grid-connected system under different active-power operation conditions: (a) 7.5 kW; (b) 12.5 kW.
Energies 19 04115 g017
Figure 18. Nyquist curves of the impedance ratio for the PMSG-based grid-connected system under different active-power operation conditions: (a) 7.5 kW; (b) 12.5 kW.
Energies 19 04115 g018
Figure 19. Current signal spectrum of the PMSG-based grid-connected system under different active-power operation conditions: (a) 7.5 kW; (b) 12.5 kW.
Energies 19 04115 g019
Figure 20. Bode diagram of the impedance characteristics of the PMSG-based grid-connected system for Lg = 0.15 mH: (a) before impedance reshaping; (b) after impedance reshaping.
Energies 19 04115 g020
Figure 21. Current signal spectrum of the PMSG-based grid-connected system for Lg = 0.15 mH: (a) before impedance reshaping; (b) after impedance reshaping.
Energies 19 04115 g021
Figure 22. Bode diagram of the impedance characteristics of the PMSG-based grid-connected system for Lg = 0.60 mH: (a) before impedance reshaping; (b) after impedance reshaping.
Energies 19 04115 g022
Figure 23. Current signal spectrum of the PMSG-based grid-connected system for Lg = 0.60 mH: (a) before impedance reshaping; (b) after impedance reshaping.
Energies 19 04115 g023
Table 1. Simulation results under different control strategies.
StrategiesIntersections in Bode DiagramPhase Margin at IntersectionStabilityOscillation Frequency Component MagnitudeTHD
Without impedance shaping2negativeunstable7.105%11.33%
Virtual admittance2positivestable0.106%6.80%
Proposed active damping0/stable0.117%3.28%
Table 2. Simulation results under different active-power operation conditions.
Case NumberActive PowerOscillation Frequency Component Magnitude After THD
BeforeAfter Before After
2-110 kW7.105%0.117%11.33%3.28%
2-27.5 kW0.059%4.51%
2-312.5 kW0.126%2.59%
Table 3. Simulation results under different grid impedance conditions.
Case NumberGrid InductancesTuning ParametersOscillation FrequencyOscillation Frequency Component MagnitudeTHD
K s ω bw BeforeAfter Before After
3-10.3 mH29.873780,168 π   1366 Hz7.105%0.117%11.33%3.28%
3-20.15 mH14.484374,695 π   1565 Hz8.602%0.213%17.26%3.59%
3-30.6 mH20.345364,120 π   1070 Hz5.120%0.113%7.75%4.12%
Disclaimer/Publisher’s Note: The statements, opinions and data contained in all publications are solely those of the individual author(s) and contributor(s) and not of MDPI and/or the editor(s). MDPI and/or the editor(s) disclaim responsibility for any injury to people or property resulting from any ideas, methods, instructions or products referred to in the content.