Article

Comparative Numerical Simulation on Heat Transfer Performance of CO2 and Water in Closed-Cycle Geothermal Development Systems

1
The Second Institute of Hydrogeology and Engineering Geology, Shandong Provincial Bureau of Geology & Mineral Resources (Lubei Geo-Engineering Exploration Institute of Shandong Province), Dezhou 253072, China
2
College of New Energy and Environment, Jilin University, Changchun 130021, China
*
Author to whom correspondence should be addressed.
Energies 2026, 19(17), 3956; https://doi.org/10.3390/en19173956
Submission received: 8 July 2026 / Revised: 13 August 2026 / Accepted: 19 August 2026 / Published: 23 August 2026
(This article belongs to the Special Issue Deep Geothermal Energy Development and Utilization)

Abstract

Driven by China’s “Dual Carbon” strategy, medium-deep closed-loop geothermal energy has become a mainstream clean heating technology owing to the advantage of “heat extraction without groundwater production”. However, its large-scale application is restricted by low single-well heat output and an unclear matching mechanism between working fluids and wellbores. Taking sandstone geothermal reservoirs in Dezhou, Northwestern Shandong Depression, as the research object, a 3D coupled heat transfer model of the wellbore–reservoir was established via COMSOL Multiphysics. The heat transfer characteristics of water and CO2 under variable injection temperature, mass flow rate and wellbore layout were compared. The results show that: (1) injection temperature dominates the heat extraction performance of water, which matches branched wells and delays overall reservoir thermal depletion during long-term exploitation; (2) CO2 performance is highly sensitive to mass flow rate and suitable for connected wells, and an asymmetric geothermal field with “cooled injection zone and heated production zone” forms under a high flow rate; (3) limited by low specific heat capacity, CO2 delivers lower heat power at an identical flow rate, while equivalent heat yield can be achieved when its flow rate doubles that of water. This study clarifies matched development schemes for two working fluids and provides a theoretical reference for optimized exploitation of closed-loop geothermal systems in sandstone reservoirs in Northwestern Shandong.

1. Introduction

Driven by China’s “Dual Carbon” strategic goals, medium-to-deep geothermal energy serves as a low-carbon alternative to fossil fuels for heating and industrial thermal supply [1]. Closed-loop geothermal systems operate on the “heat extraction without groundwater production” principle, avoiding groundwater depletion, land subsidence and aquifer contamination inherent to conventional geothermal exploitation [2,3,4,5]. Such systems are well suited for sandstone-bearing sedimentary basins. However, three core bottlenecks hinder their widespread commercialization: limited heat output per single borehole, obvious reservoir thermal decay over long-term operation, and unclear quantitative matching laws between circulating working fluids and various wellbore layouts [6,7,8,9].
Water has long been the dominant circulating fluid for geothermal closed loops, owing to its high specific heat capacity and stable thermophysical properties under common subsurface temperature and pressure. Nevertheless, sustained continuous heat extraction inevitably cools the entire reservoir matrix and weakens heat supply capacity [10]. As an alternative medium, supercritical CO2 (critical point: 31.1 °C, 7.38 MPa) has drawn extensive research attention due to low viscosity and intensified heat transfer near its pseudocritical zone, alongside the additional advantage of geological carbon sequestration [11]. Brown [12] first proposed supercritical CO2 geothermal circulation in 2000, while Pruess et al. [13] systematically analyzed CO2 phase transition and heat transfer characteristics in subsurface circulation systems. Kujawa et al. [14] further established numerical models for CO2 circulating in abandoned horizontal wells and discussed the influence of flow velocity on thermal output. Even with these foundational works, the existing literature lacks systematic quantitative contrasts between water and supercritical CO2 within medium–low temperature sandstone reservoirs. How injection temperature and mass flow rate separately regulate the heat exchange performance of the two fluids has not been fully clarified, creating critical gaps for engineering parameter design.
For numerical simulation methodologies, Luo [15] developed segmented finite line source models to accurately capture axial temperature variation inside deep wells, reducing calculation error to less than 1%. Pan [16] extended quasi-3D borehole heat transfer models to medium-deep geological conditions. Diersch [17] and Zanchini [18] respectively adopted FEFLOW and COMSOL to conduct parametric sensitivity analysis on borehole-reservoir coupled heat transfer. Most of these modeling studies rely on generalized uniform geological parameters without site-specific stratigraphic calibration. Furthermore, most existing variable-control simulations only discuss single-factor effects rather than coupling wellbore geometry with reservoir heterogeneity to compare water and CO2 comprehensively. To date, unified quantitative criteria for matching working fluids and well types are still absent, and the disparate spatial thermal disturbance patterns induced by the two fluids remain insufficiently characterized.
The study site is Decheng District, Dezhou City, Shandong Province, China. The target geothermal reservoir is the sandstone Neogene Guantao Formation, with in situ temperatures ranging from 49 °C to 78 °C, categorized as medium-low temperature geothermal resources perfectly applicable to municipal central heating. Local geothermal exploitation still relies primarily on conventional open extraction–reinjection schemes, with very few long-term monitored closed-loop demonstration projects. Without systematic comparative simulations covering water and CO2, targeted optimized exploitation plans for local sandstone reservoirs cannot be reasonably formulated. To fill this research gap, a transient three-dimensional fluid–wellbore–reservoir coupled heat transfer model is established via COMSOL Multiphysics. Comparative numerical tests of water and supercritical CO2 are carried out under diverse injection temperatures and mass flow rates, adopting two typical well structures: branched wells and connected wells. This work systematically elaborates the intrinsic matching relationships between two working fluids and different wellbore configurations and reveals differentiated reservoir temperature evolution characteristics under multi-decade continuous heat extraction. The research outcomes provide solid theoretical support and quantitative parameter references for optimizing closed-loop geothermal systems in analogous medium–low temperature sandstone basins across the globe.

2. Research Area

2.1. Geographical Location and Geological Background

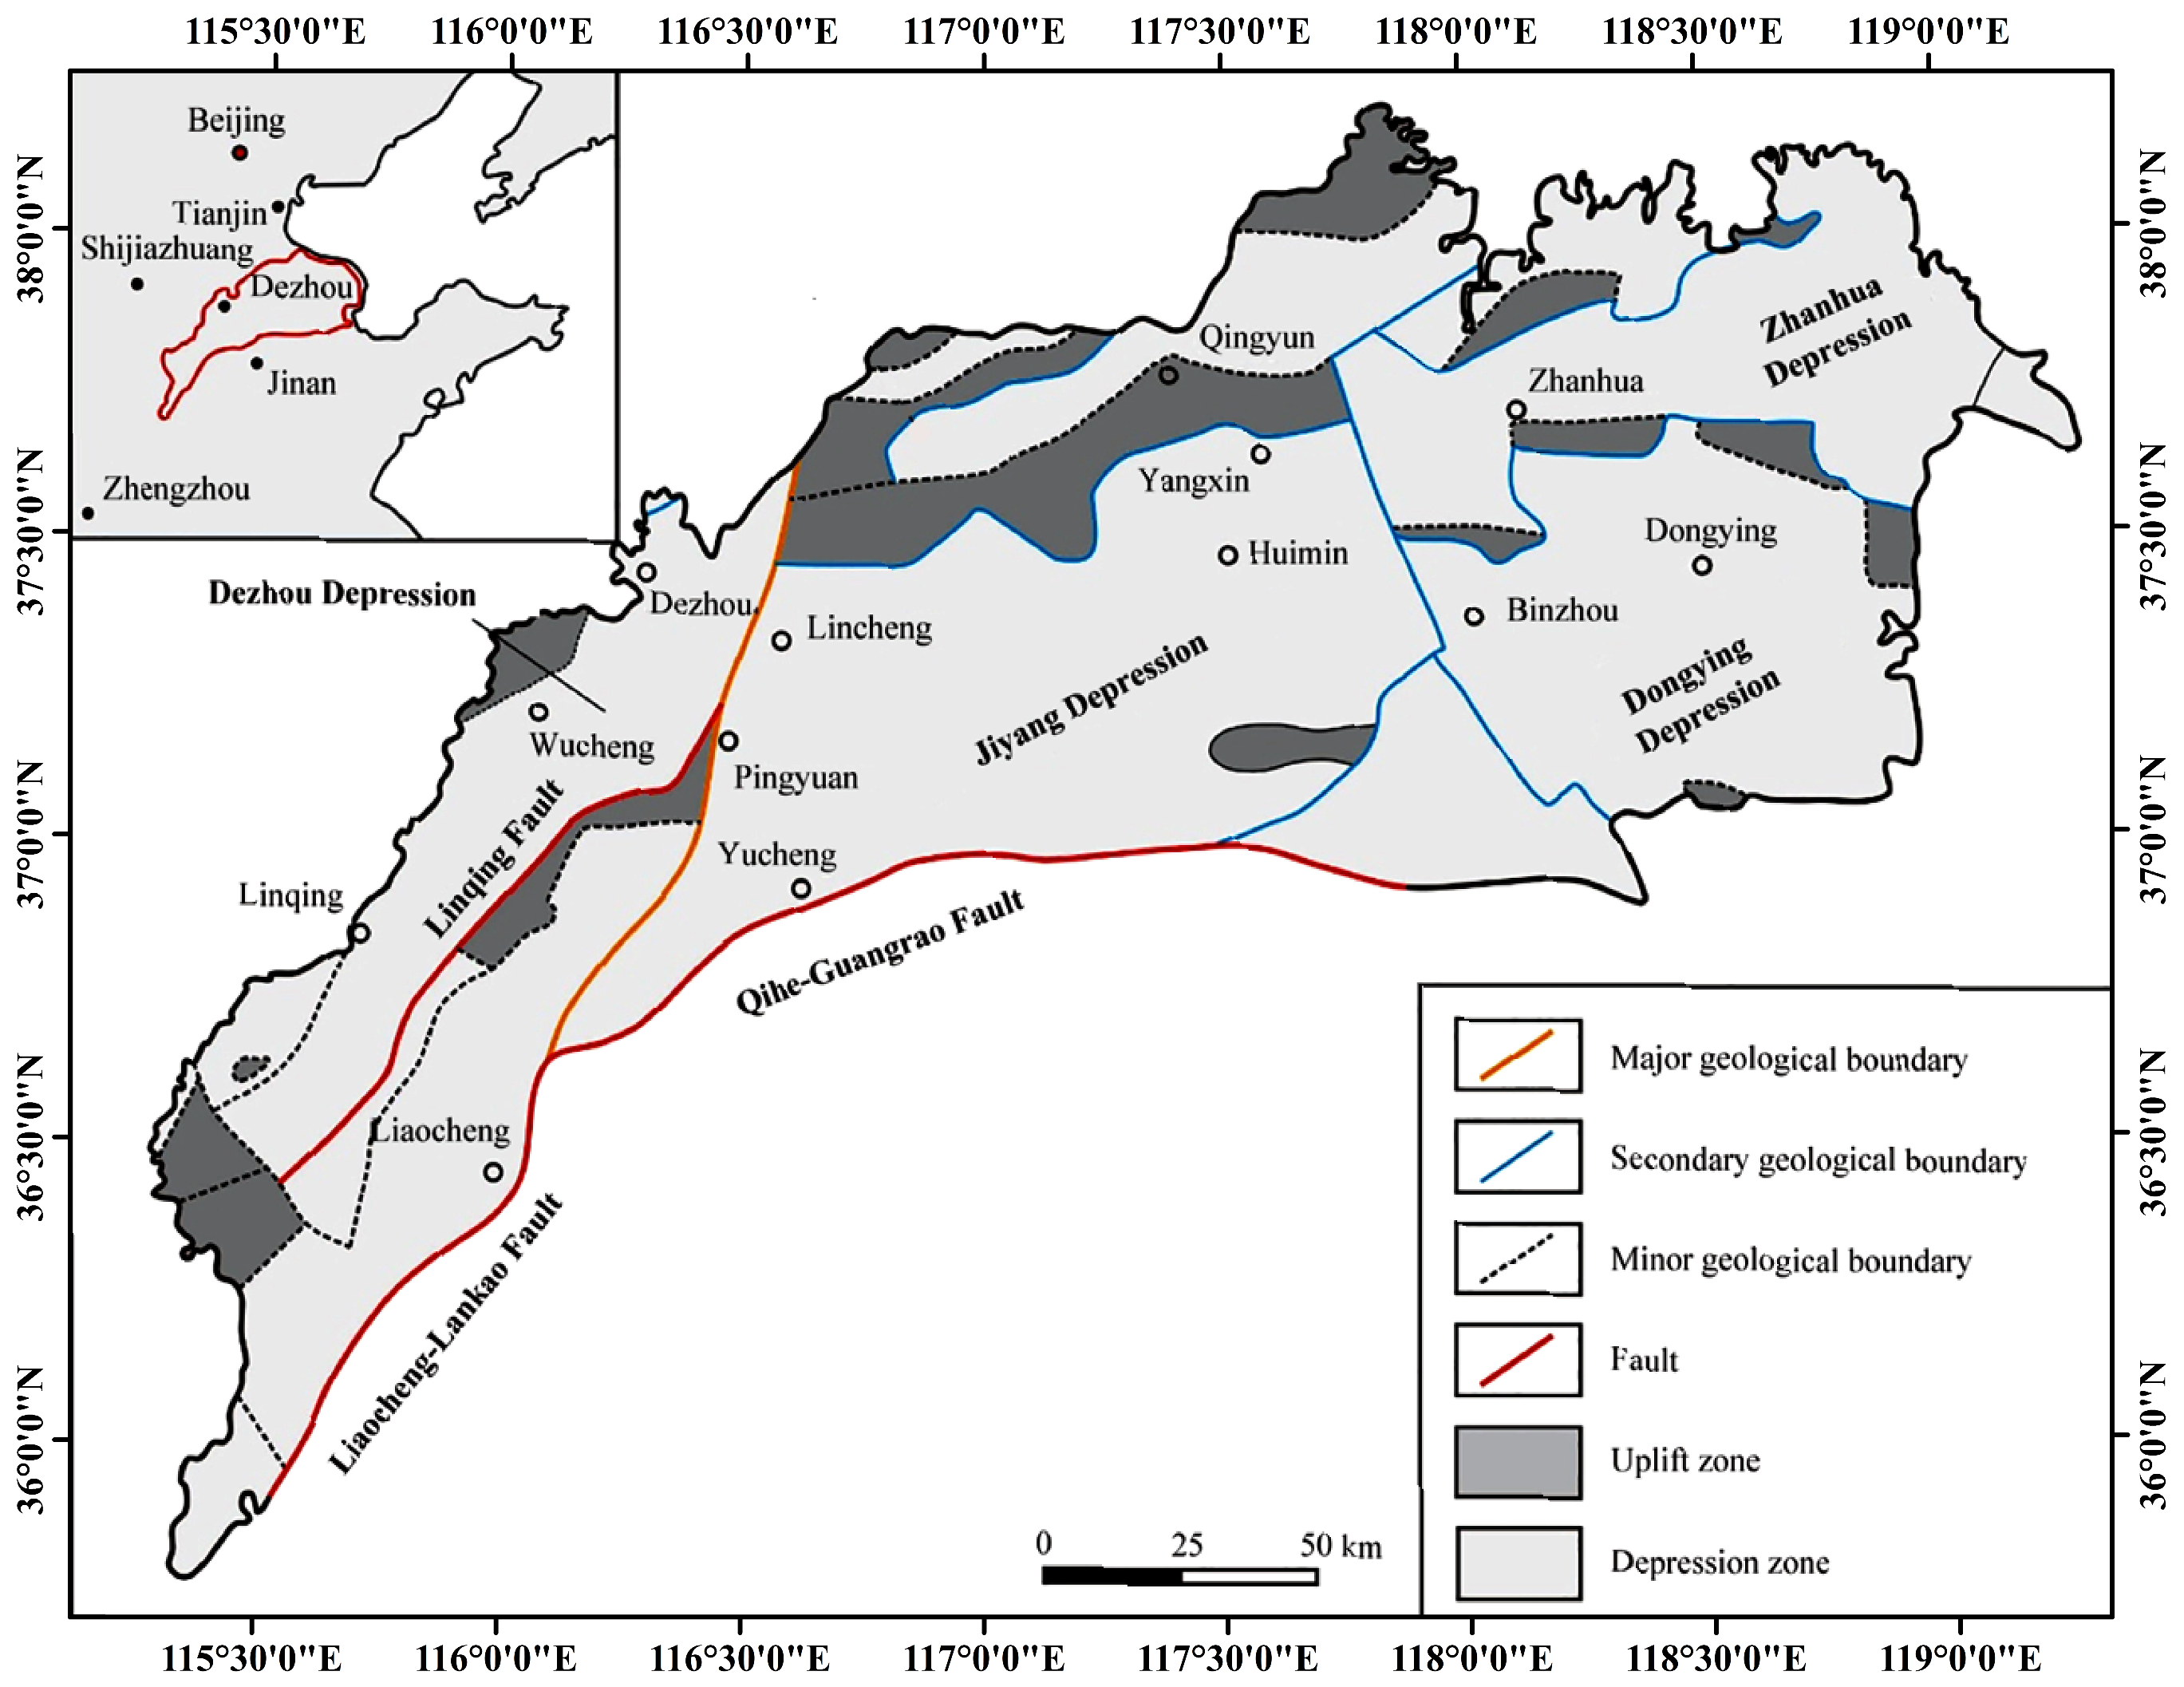
The research site is Decheng District, Dezhou City, Shandong Province, China, with geographic coordinates ranging from 115°45′22″ E to 116°14′45″ E and 37°20′18″ N to 37°39′53″ N [19]. Tectonically, it belongs to the Northwestern Shandong Depression, a typical sedimentary geothermal basin in the North China Plain. The area is situated at the transition zone between the Luxi Uplift and North China Fault Basin, dominated by extensional structures formed during the Yanshanian and Himalayan tectonic movements. Alternating sags and buried uplifts constitute the primary structural framework, where Dezhou Sag acts as the core geothermal storage unit [20]. A set of NE-SW-striking deep basement faults, including the Lingcheng–Decheng Fault and Decheng–Wucheng Fault, serve as vertical migration channels for terrestrial heat flow, while secondary fracture networks improve the permeability of sandstone geothermal reservoirs, creating favorable structural conditions for medium-deep geothermal accumulation. See Figure 1 for a regional location map of the study area.
The study area is covered by 3500–4000 m thick Cenozoic sedimentary sequences over a Precambrian–Paleozoic basement. Paleogene mudstone formations form the lower impermeable barrier, Neogene Guantao and Minghuazhen Formations compose the reservoir–cap assemblage for geothermal resources, and Quaternary loose sediments act as shallow overburden. No surface water bodies or shallow aquifers have hydraulic connection with medium-deep sandstone geothermal reservoirs, so closed-loop geothermal exploitation will not cause interference to shallow groundwater systems [22,23,24].

2.2. Stratigraphic and Sandstone Reservoir Characteristics

The vertical stratigraphic sequence of the research area from shallow to deep consists of the Quaternary Pingyuan Formation, Neogene Minghuazhen Formation, Neogene Guantao Formation, Paleogene Shahejie and Kongdian Formations, and pre-Cenozoic carbonate basement. The Neogene Guantao Formation is identified as the target geothermal reservoir in this work, buried at 1000–1700 m within the Dezhou Sag with a total thickness of 300–700 m. It presents a normal fining-upward sedimentary cycle, with thick conglomerate and coarse sandstone in the lower segment and interbedded fine sandstone and mudstone in the upper segment. Single sand layers range from 10 m to 25 m in thickness. The Guantao sandstone features porosity of 18–25% and permeability of 50–100 mD, classified as medium-high porosity and medium-permeability porous geothermal reservoirs. The rock matrix is dominated by quartz and feldspar with argillaceous and calcareous cement, exhibiting stable lithology and low sand production risk under long-term fluid circulation [25]. The reservoir temperature of the Guantao Formation varies from 49 °C to 78 °C, representing typical medium–low temperature geothermal resources suitable for closed-loop heating systems using water and CO2 as circulating fluids [26]. The overlying Minghuazhen Formation, with a thickness of 600–900 m, is dominated by mudstone, which functions as a high-quality thermal cap to prevent upward heat loss.

2.3. Geothermal Field and Terrestrial Heat Flow Regimes

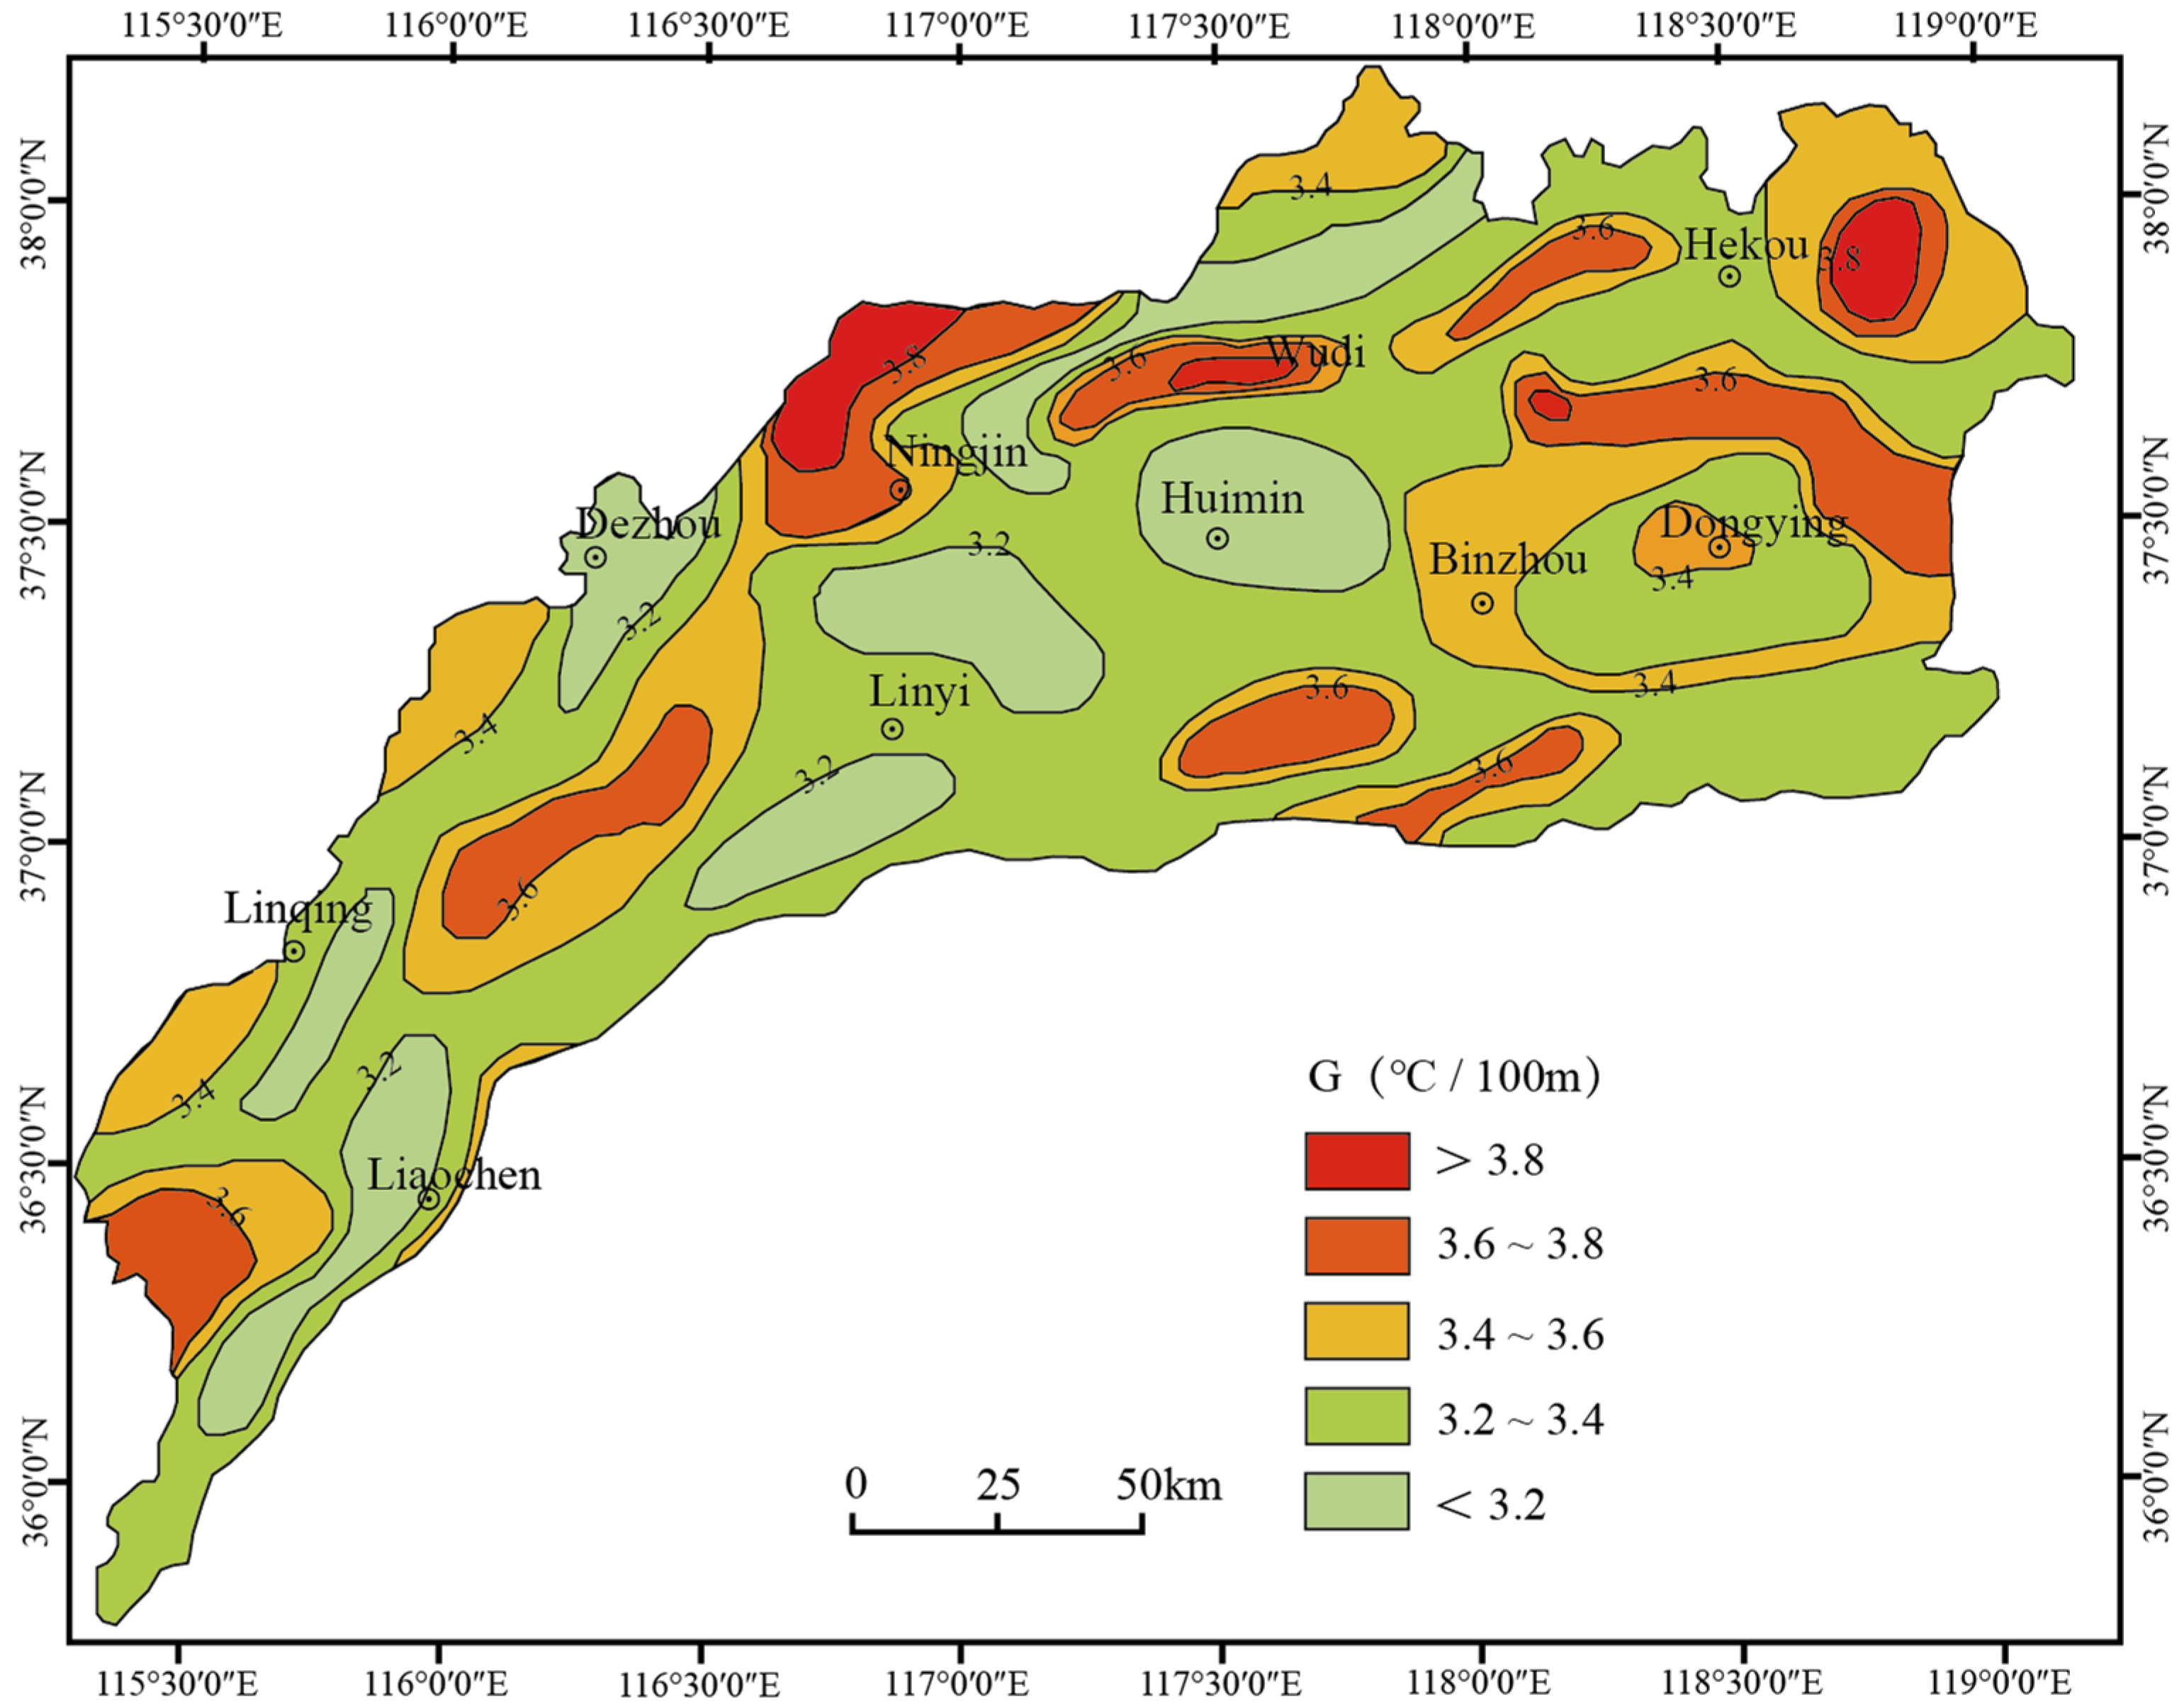
The Northwestern Shandong Depression has an average terrestrial heat flow of 60–70 mW/m2, higher than the average continental heat flow value, due to the relatively shallow Moho surface (around 34 km) beneath this region [27]. The overall cap rock geothermal gradient (Quaternary + Minghuazhen Formation) ranges from 3.1 °C/100 m to 5.1 °C/100 m, with an average of 3.4 °C/100 m; higher gradient values appear on buried uplifts, while sag centers show relatively lower geothermal gradients [28]. Vertically, the subsurface temperature field exhibits regular zoning relevant to geothermal exploitation: the shallow layer within 0–200 m is disturbed by surface temperature variation with fluctuating gradients; the 200–1200 m interval holds a stable gradient of 3.0–3.5 °C/100 m; and below 1200 m where the Guantao reservoir develops, the geothermal gradient stabilizes at 3.2–3.4 °C/100 m, controlled by steady deep conductive heat transfer [29]. The ground temperature gradient of the cover layer of the thermal storage of the Guantao Group and the partitioning of the temperature of the thermal storage are shown in Figure 2.

2.4. Integrated Heat Source–Reservoir–Cap Geothermal System

A complete and mature heat source–reservoir–cap combination is developed in the research area, laying solid geological foundations for closed-loop geothermal development. The primary heat supply comes from deep mantle-derived terrestrial heat flow, supplemented by vertical heat conduction through deep-cut basement faults. The Neogene Guantao porous sandstone serves as the main heat storage space, providing sufficient flow channels and heat exchange interfaces for circulating water and supercritical CO2. The composite cap rock, composed of Minghuazhen mudstone and Quaternary clay, reaches a total thickness of 800–1200 m, with low thermal conductivity of approximately 1.8 W/(m·°C). The dense cap layer effectively restricts upward heat dissipation and preserves subsurface thermal energy. The integrated geothermal system enables long-term stable heat extraction via closed circulation and provides representative geological conditions to compare the heat transfer behaviors of CO2 and water in medium–low sandstone geothermal reservoirs.

3. Numerical Model of Closed-Loop Geothermal System

3.1. Conceptual Model

Based on the sandstone geothermal reservoir geological conditions of the Northwestern Shandong Depression, this study builds a non-steady-state coupled heat transfer model of circulating working fluid inside geothermal heat exchangers and rock formations on the COMSOL Multiphysics 6.3 numerical simulation platform, integrating solid mechanics, fluid dynamics and heat transfer modules. The model systematically depicts the multi-field coupled heat and mass transfer process in closed-loop geothermal systems.
The operating mechanism of a U-tube closed-loop geothermal system is as follows: circulating working fluid is injected at a fixed flow rate from one injection port, exchanges heat with geothermal reservoirs while flowing axially along the wellbore, and is extracted from the production port to complete the geothermal energy extraction cycle. To balance solution efficiency and calculation accuracy of the numerical model while conforming to engineering practice, the following assumptions are made:
  • Axial flow dominates the movement of circulating working fluid inside the wellbore, and radial secondary flow is ignored;
  • Thermophysical properties of formations and well walls are isotropic to avoid interference from complex anisotropic parameters;
  • The circular cross-section of the wellbore is centrally symmetric along its trajectory, a standard simplification for near-wellbore conductive heat transfer modeling, and the 3D geometric model is simplified with the well trajectory as the reference axis;
  • The influence of wellbore inclination angle on heat transfer is ignored, focusing on heat transfer dominated by the axial direction;
  • Contact thermal resistance between formation layers is neglected, and continuous heat transfer between layers is assumed.
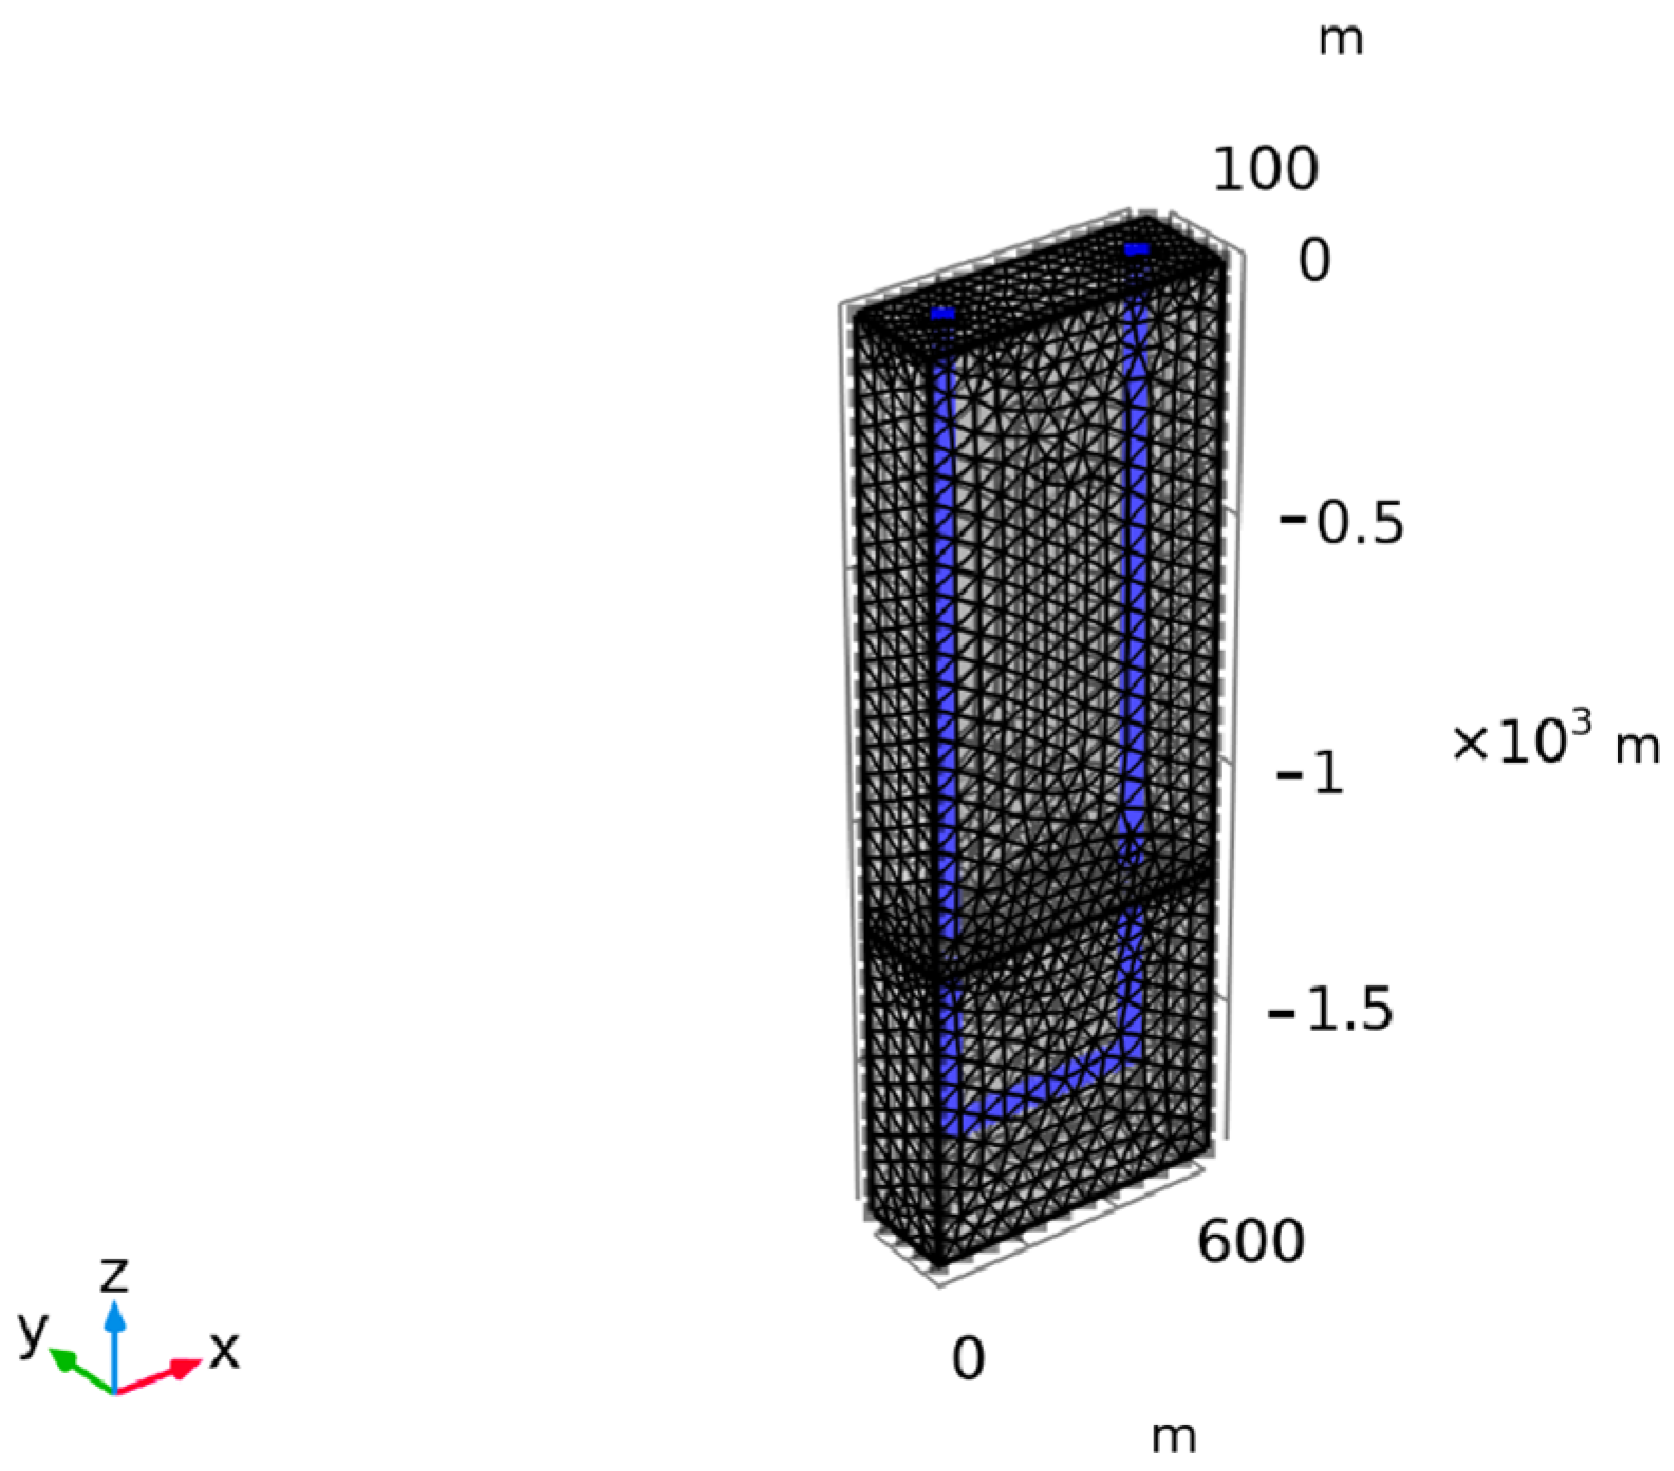
Given the inherent asymmetry of U-tube structures in space, a three-dimensional model is adopted in this study with 3D mesh division. Mesh generation is shown in Figure 3. The vertical section of the geothermal well is 1600 m long, the outer diameter of the wellbore is 88.9 mm, the well wall thickness is 5 mm, and the horizontal section length is set to 400 m.
A reasonable mesh generation scheme is adopted to objectively reflect actual conditions while minimizing computation time. The reservoir boundaries are extended outward in the x, y and z directions to eliminate boundary effects. Referring to the heat influence range of geothermal wellbores of the same scale, the model extends 100 m to both sides along the x-axis, 100 m to both sides along the y-axis, and 200 m downward from the bottom of the well along the z-axis. When the horizontal section length is 400 m, the model dimensions along the x-, y- and z-axes are 600 m, 200 m and 1800 m respectively.
The reservoir and wellbore are meshed integrally. Since the temperature field near geothermal wellbores changes more drastically with proximity to the well, dense meshing is applied to vertical and horizontal well sections to improve the coupling accuracy between the wellbore and reservoir. The XY plane adopts free triangular meshes, and sweep meshing is used vertically along the z-axis. Free tetrahedral meshes are laid out for the arc heat exchange segments of U-tubes to intensify grid distribution and boost calculation precision, with a total of 26,766 mesh elements. Spatial discretization of the coupled wellbore–reservoir domain is realized via the Galerkin finite element method embedded in COMSOL Multiphysics 6.3, with a second-order backward differentiation formula adopted for temporal discretization to ensure numerical stability for the 40-year transient simulation. The customized meshing strategy prioritizes local refinement in near-wellbore zones with steep temperature gradients during heat extraction, effectively balancing computational accuracy and efficiency while suppressing numerical dispersion.

3.2. Definite Solution Conditions

Boundary and initial temperature–pressure conditions of the conceptual model are set with reference to actual field conditions. The U-tube well wall is regarded as a water-isolating and heat-conducting boundary. The reservoir boundaries are sufficiently extended in the x, y and z directions and set as constant-temperature boundaries. The wellhead at the model top is open to the atmosphere with a pressure of 0.1013 MPa (1 standard atmospheric pressure). Since the wellbore is water-tight, internal pressure is solely generated by injected water, and hydrostatic pressure of 15.8 MPa is set at the well bottom. Stratigraphic temperature–pressure conditions are configured according to field data of the study area. The surface temperature at the model top is set to 12.5 °C, and the bottom temperature of the model is calculated as 73.7 °C based on the regional average geothermal gradient.

3.3. Initial Parameters

In actual geothermal exploitation, heat exchange sections and production sections of U-tubes usually adopt casings with different thermal conductivities. Steel casings with high thermal conductivity are used for heat exchange segments to facilitate sufficient heat exchange between the working fluid and geothermal reservoirs through the well wall, while thermal insulation casings with low thermal conductivity are applied to production segments to avoid heat loss of extracted fluid. Therefore, thermal conductivities of different well segments are set separately in the simulation. Stratigraphic lithology in the model is divided into four types based on geological conditions of Decheng District: sandy gravel, mudstone, silty sandstone and pebbly coarse sandstone. Key physical parameters used in the simulation are shown in Table 1.

3.4. Model Validation

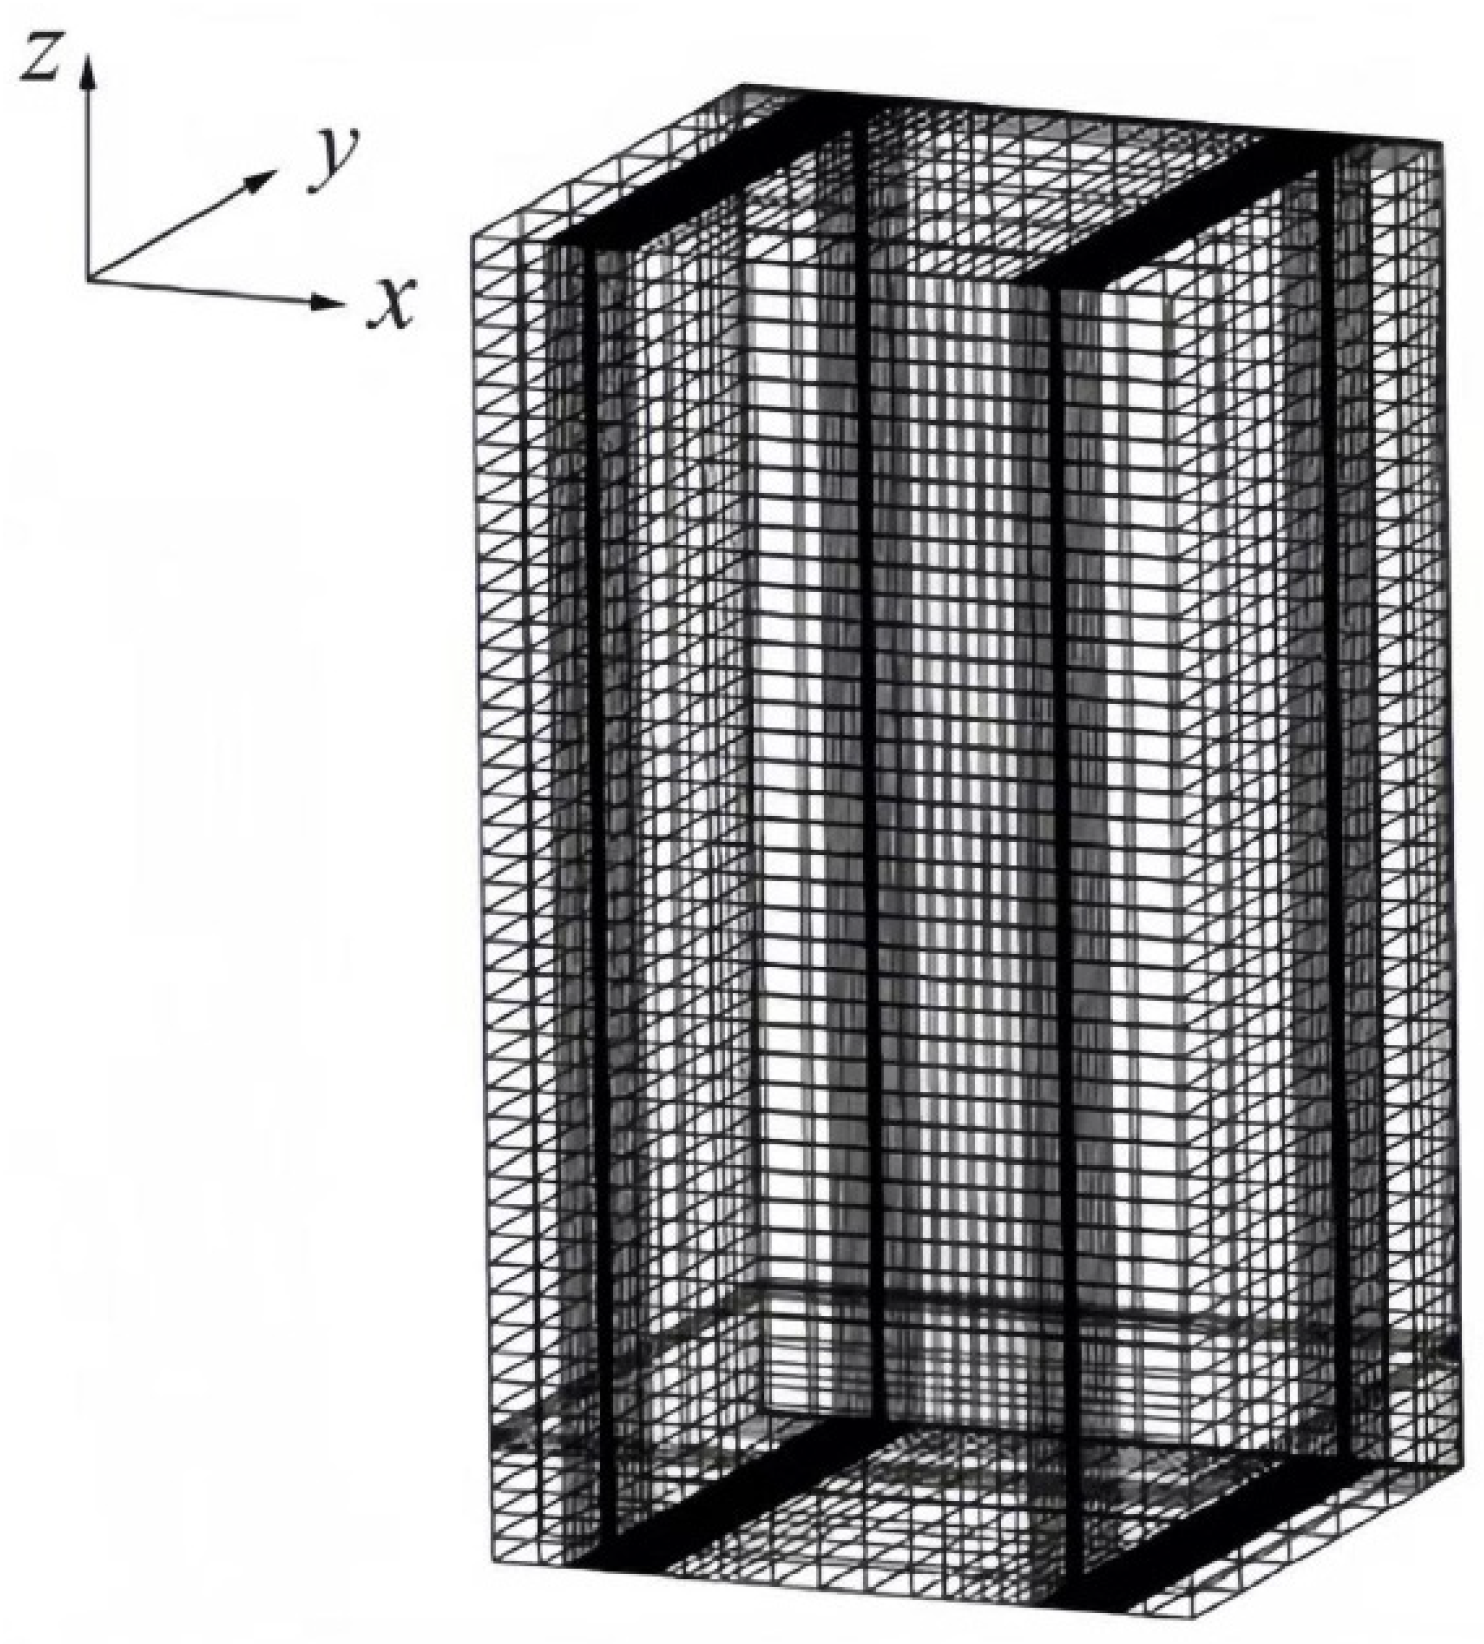
Most geothermal exploitation projects targeting the Guantao Formation sandstone reservoirs in the study adopt injection–production well pairs instead of U-tube closed-loop structures, lacking measured field data for U-tube closed-loop systems. To verify the reliability and accuracy of the established model, cross-verification is carried out with the T2Well/ECO2N Version 1.0 simulation program. Mesh refinement is also implemented for near-well zones in the T2Well model to maintain consistent calculation precision in key regions. Figure 4 displays the mesh generation of the T2Well model.
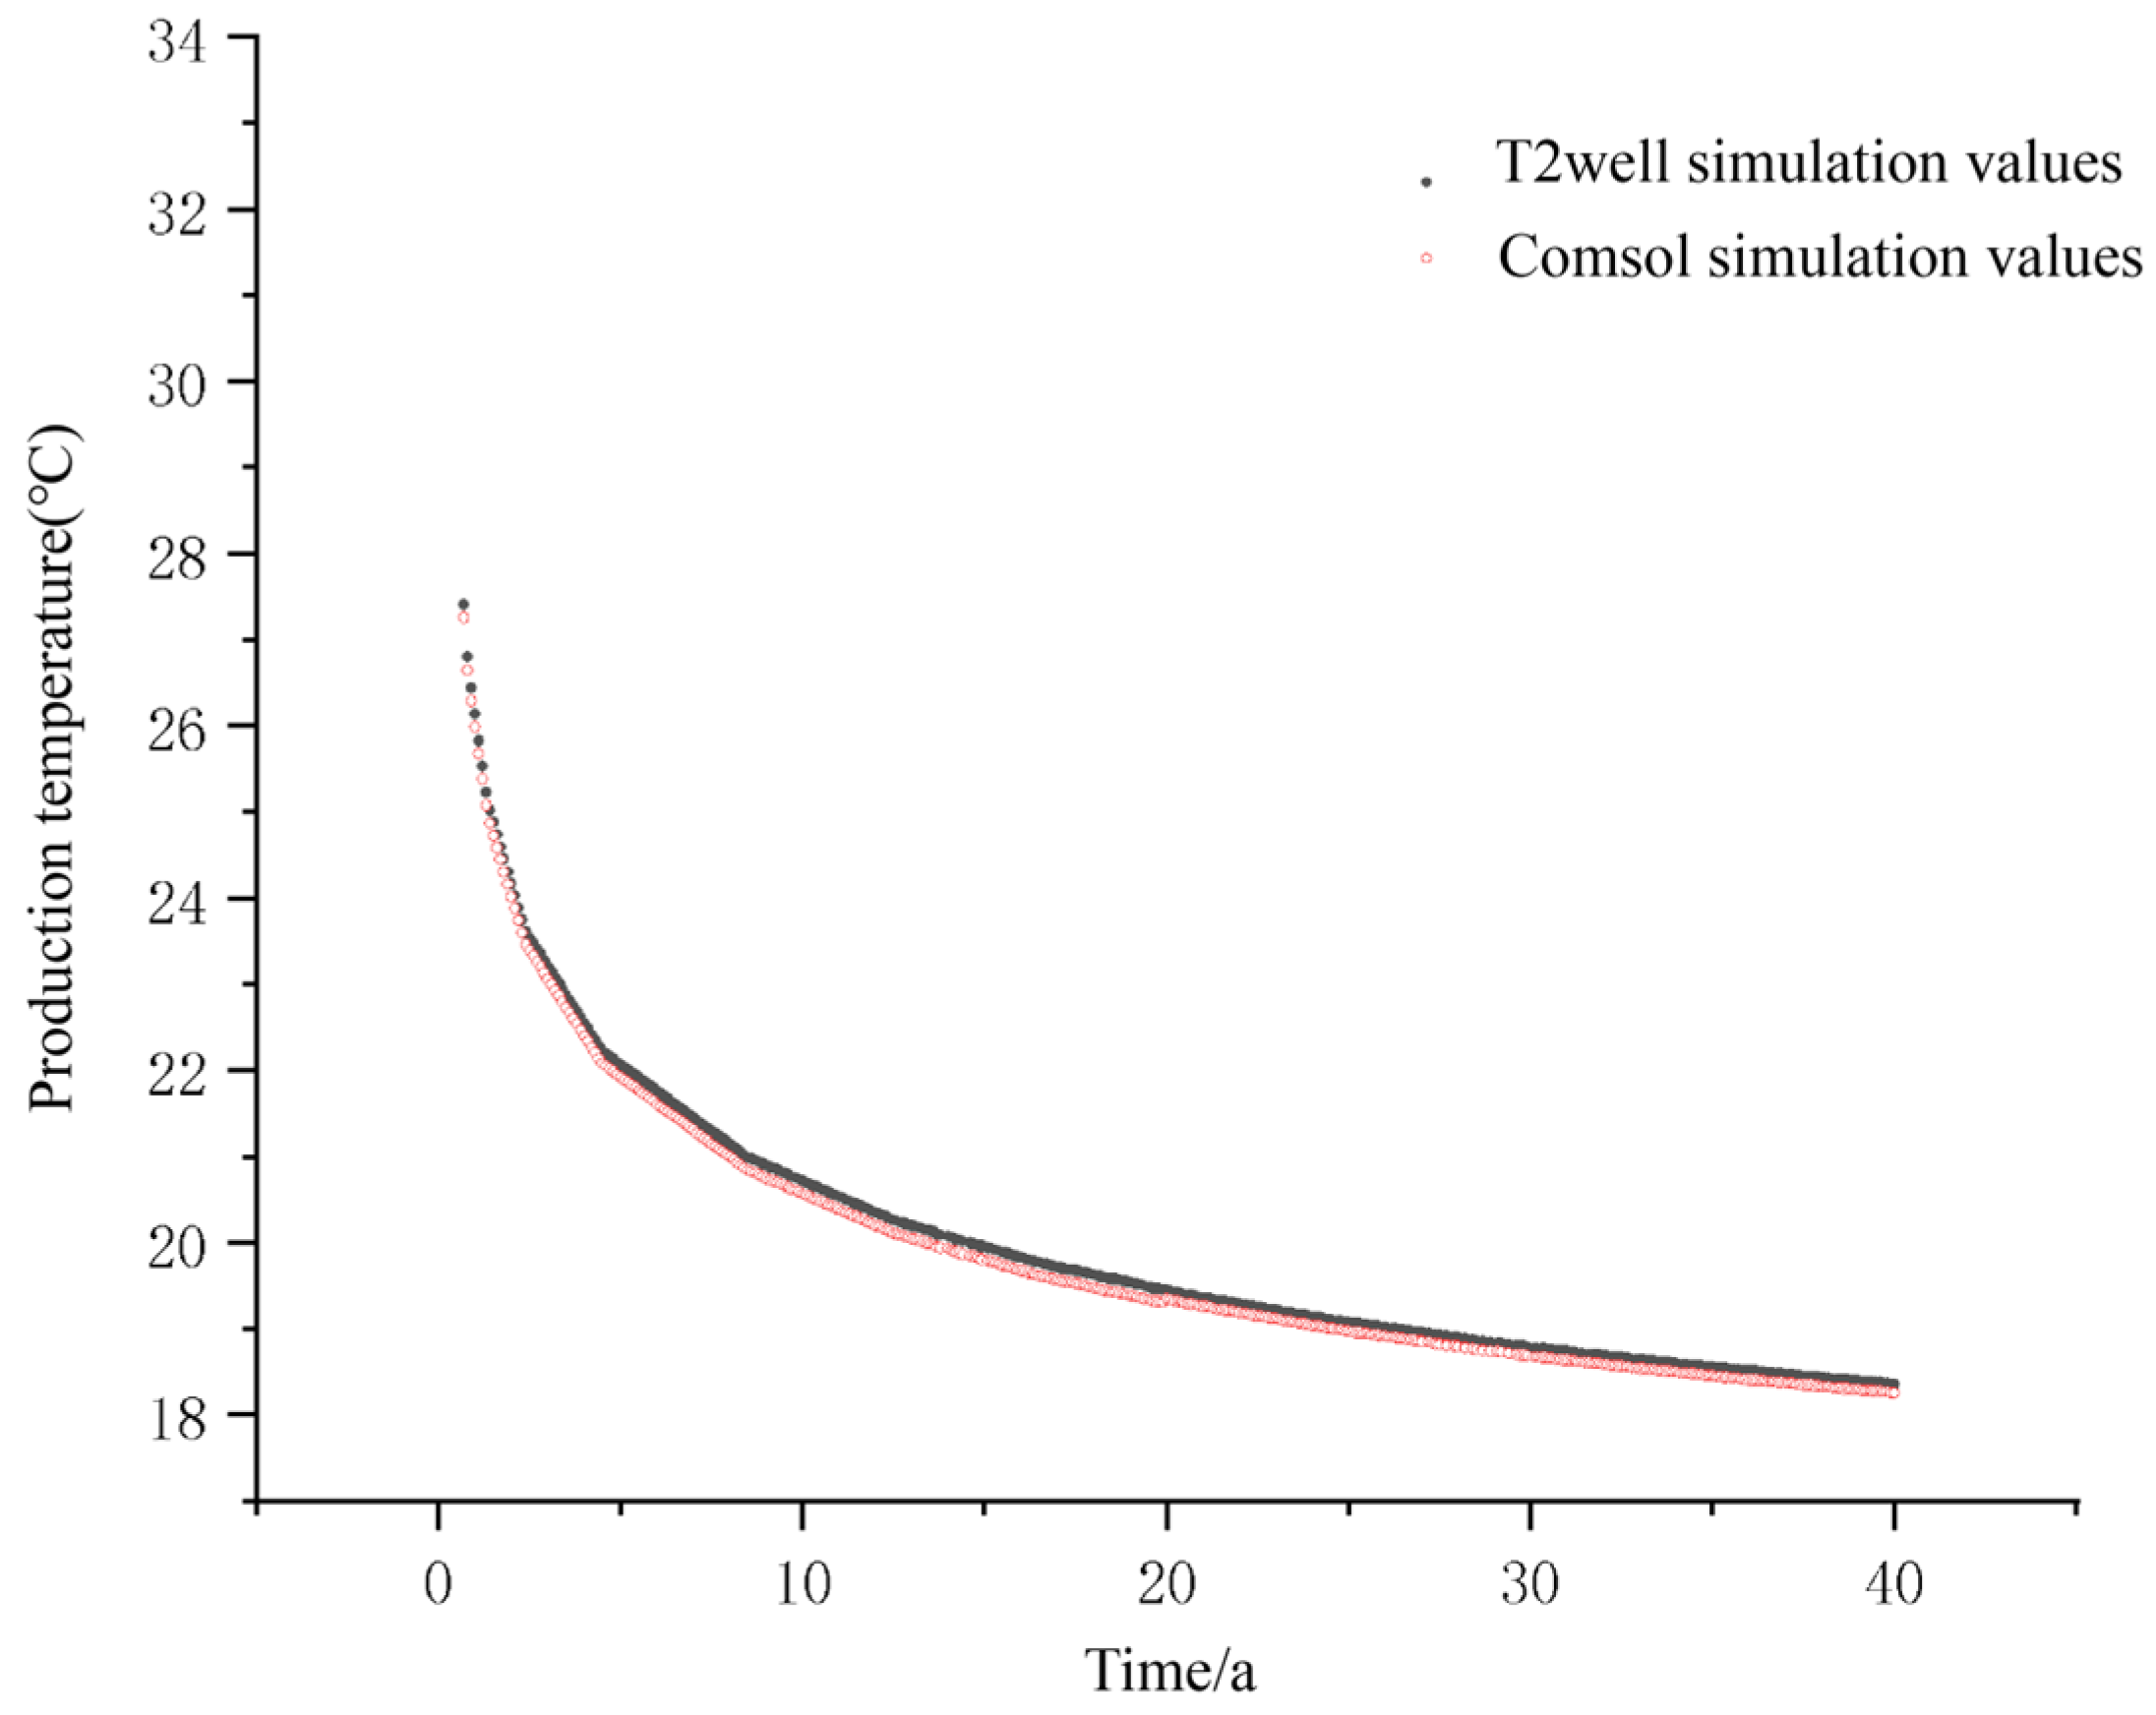
The validation simulation parameters are set as follows: water as the working fluid, injection temperature of 5 °C, injection flow rate of 6 kg/s, and a simulation duration of 40 years, consistent with the service life of conventional geothermal wells. The detailed validation scheme is listed in Table 2.
Figure 5 shows the fitting comparison curve between the self-built model and the T2Well model. The production fluid temperature curves of the two models for the 40-year operation period are highly consistent. In the initial operation stage, the geothermal reservoir maintains a high temperature, and injected water fully exchanges heat with the well wall, resulting in high production temperature. As operation time extends, production temperature gradually declines in both models. After 40 years of operation, the production temperature simulated by both models is around 18 °C, with temperature fluctuation within 0.5 °C and an average error of only 0.95%, which supports the representativeness and validity of the proposed model.

4. Thermal Performance of Water-Based Systems

4.1. Influence of Injection Temperature on Heat Extraction Performance

4.1.1. Simulation Scheme

The 3D numerical model established in Section 3.1 is adopted with water selected as the heat extraction working fluid to study how injection temperature affects the long-term heat production capacity of closed-loop geothermal systems. Other parameters are kept constant to isolate the independent influence of injection temperature: mass flow rate is fixed at 6 kg/s; total simulation period is 40 years; and four injection temperature of 5 °C, 10 °C, 15 °C and 20 °C are set to cover the typical injection temperature range in conventional geothermal engineering. The detailed simulation cases are shown in Table 3.

4.1.2. Comparative Analysis of Production Temperature and Heat Extraction Power

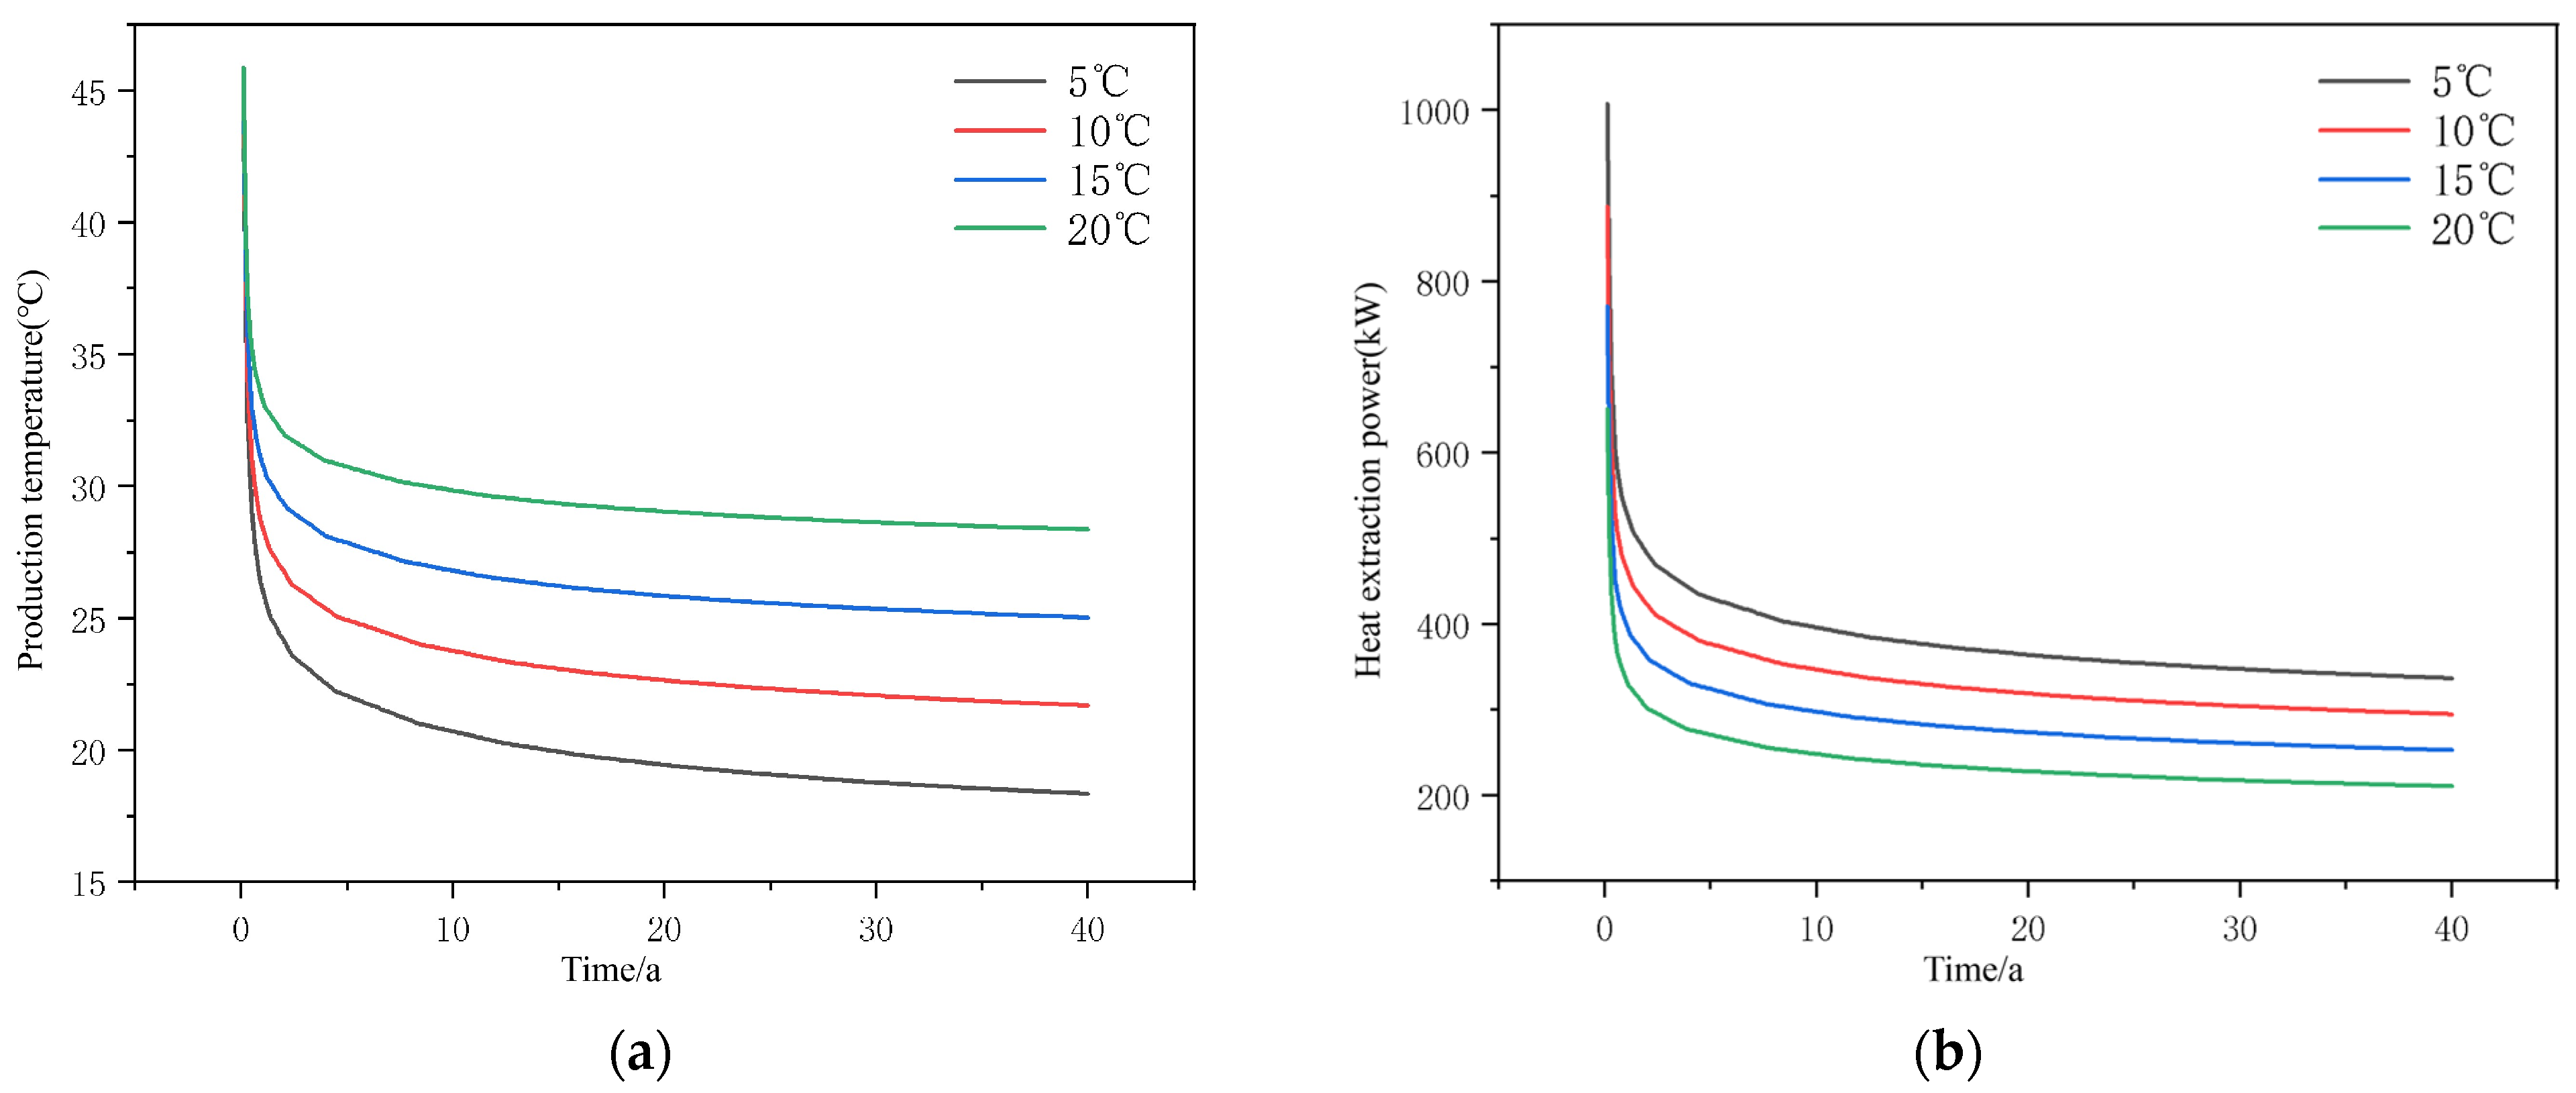
Figure 6 illustrates the variation rules of production temperature and heat extraction power under 40-year continuous operation at different injection temperatures. Systematic analysis of the simulation data shows that with a constant mass flow rate, the production temperature of the closed-loop geothermal system increases monotonically with rising injection temperature, whereas both the temperature increment and total heat extraction power decrease significantly, forming an uncoordinated trend of rising temperature yet declining efficiency.
The core heat transfer mechanism behind this phenomenon lies in the weakened heat transfer gradient induced by higher injection temperature. The rise in injection temperature directly narrows the temperature difference between the well wall and reservoir rock. The temperature gradient serves as the fundamental driving force for conductive and convective heat transfer; a reduced gradient inevitably weakens the overall heat exchange capacity of geothermal wells, leading to slower temperature growth of the output fluid and decreasing thermal power. According to the specific simulation data, when the injection temperature is 5 °C, the temperature rise ratios of produced fluid relative to injection temperature reach 422.8% (1-year operation) and 267.2% (40-year operation) respectively; when injection temperature rises to 20 °C, the corresponding ratios drop sharply to 66.7% and 41.8%.
It is noteworthy that although the production temperature can reach 28.36 °C after 40 years of operation at 20 °C, the average thermal power is merely 210.67 kW with low heat output efficiency. This result reveals that excessively high injection temperature guarantees favorable outlet temperature but sacrifices heat exchange efficiency, creating a bottleneck of high temperature and low resource utilization efficiency. Therefore, a balance between production temperature standard and heat extraction power should be achieved in engineering design.

4.1.3. Analysis of Reservoir Geothermal Field Variation

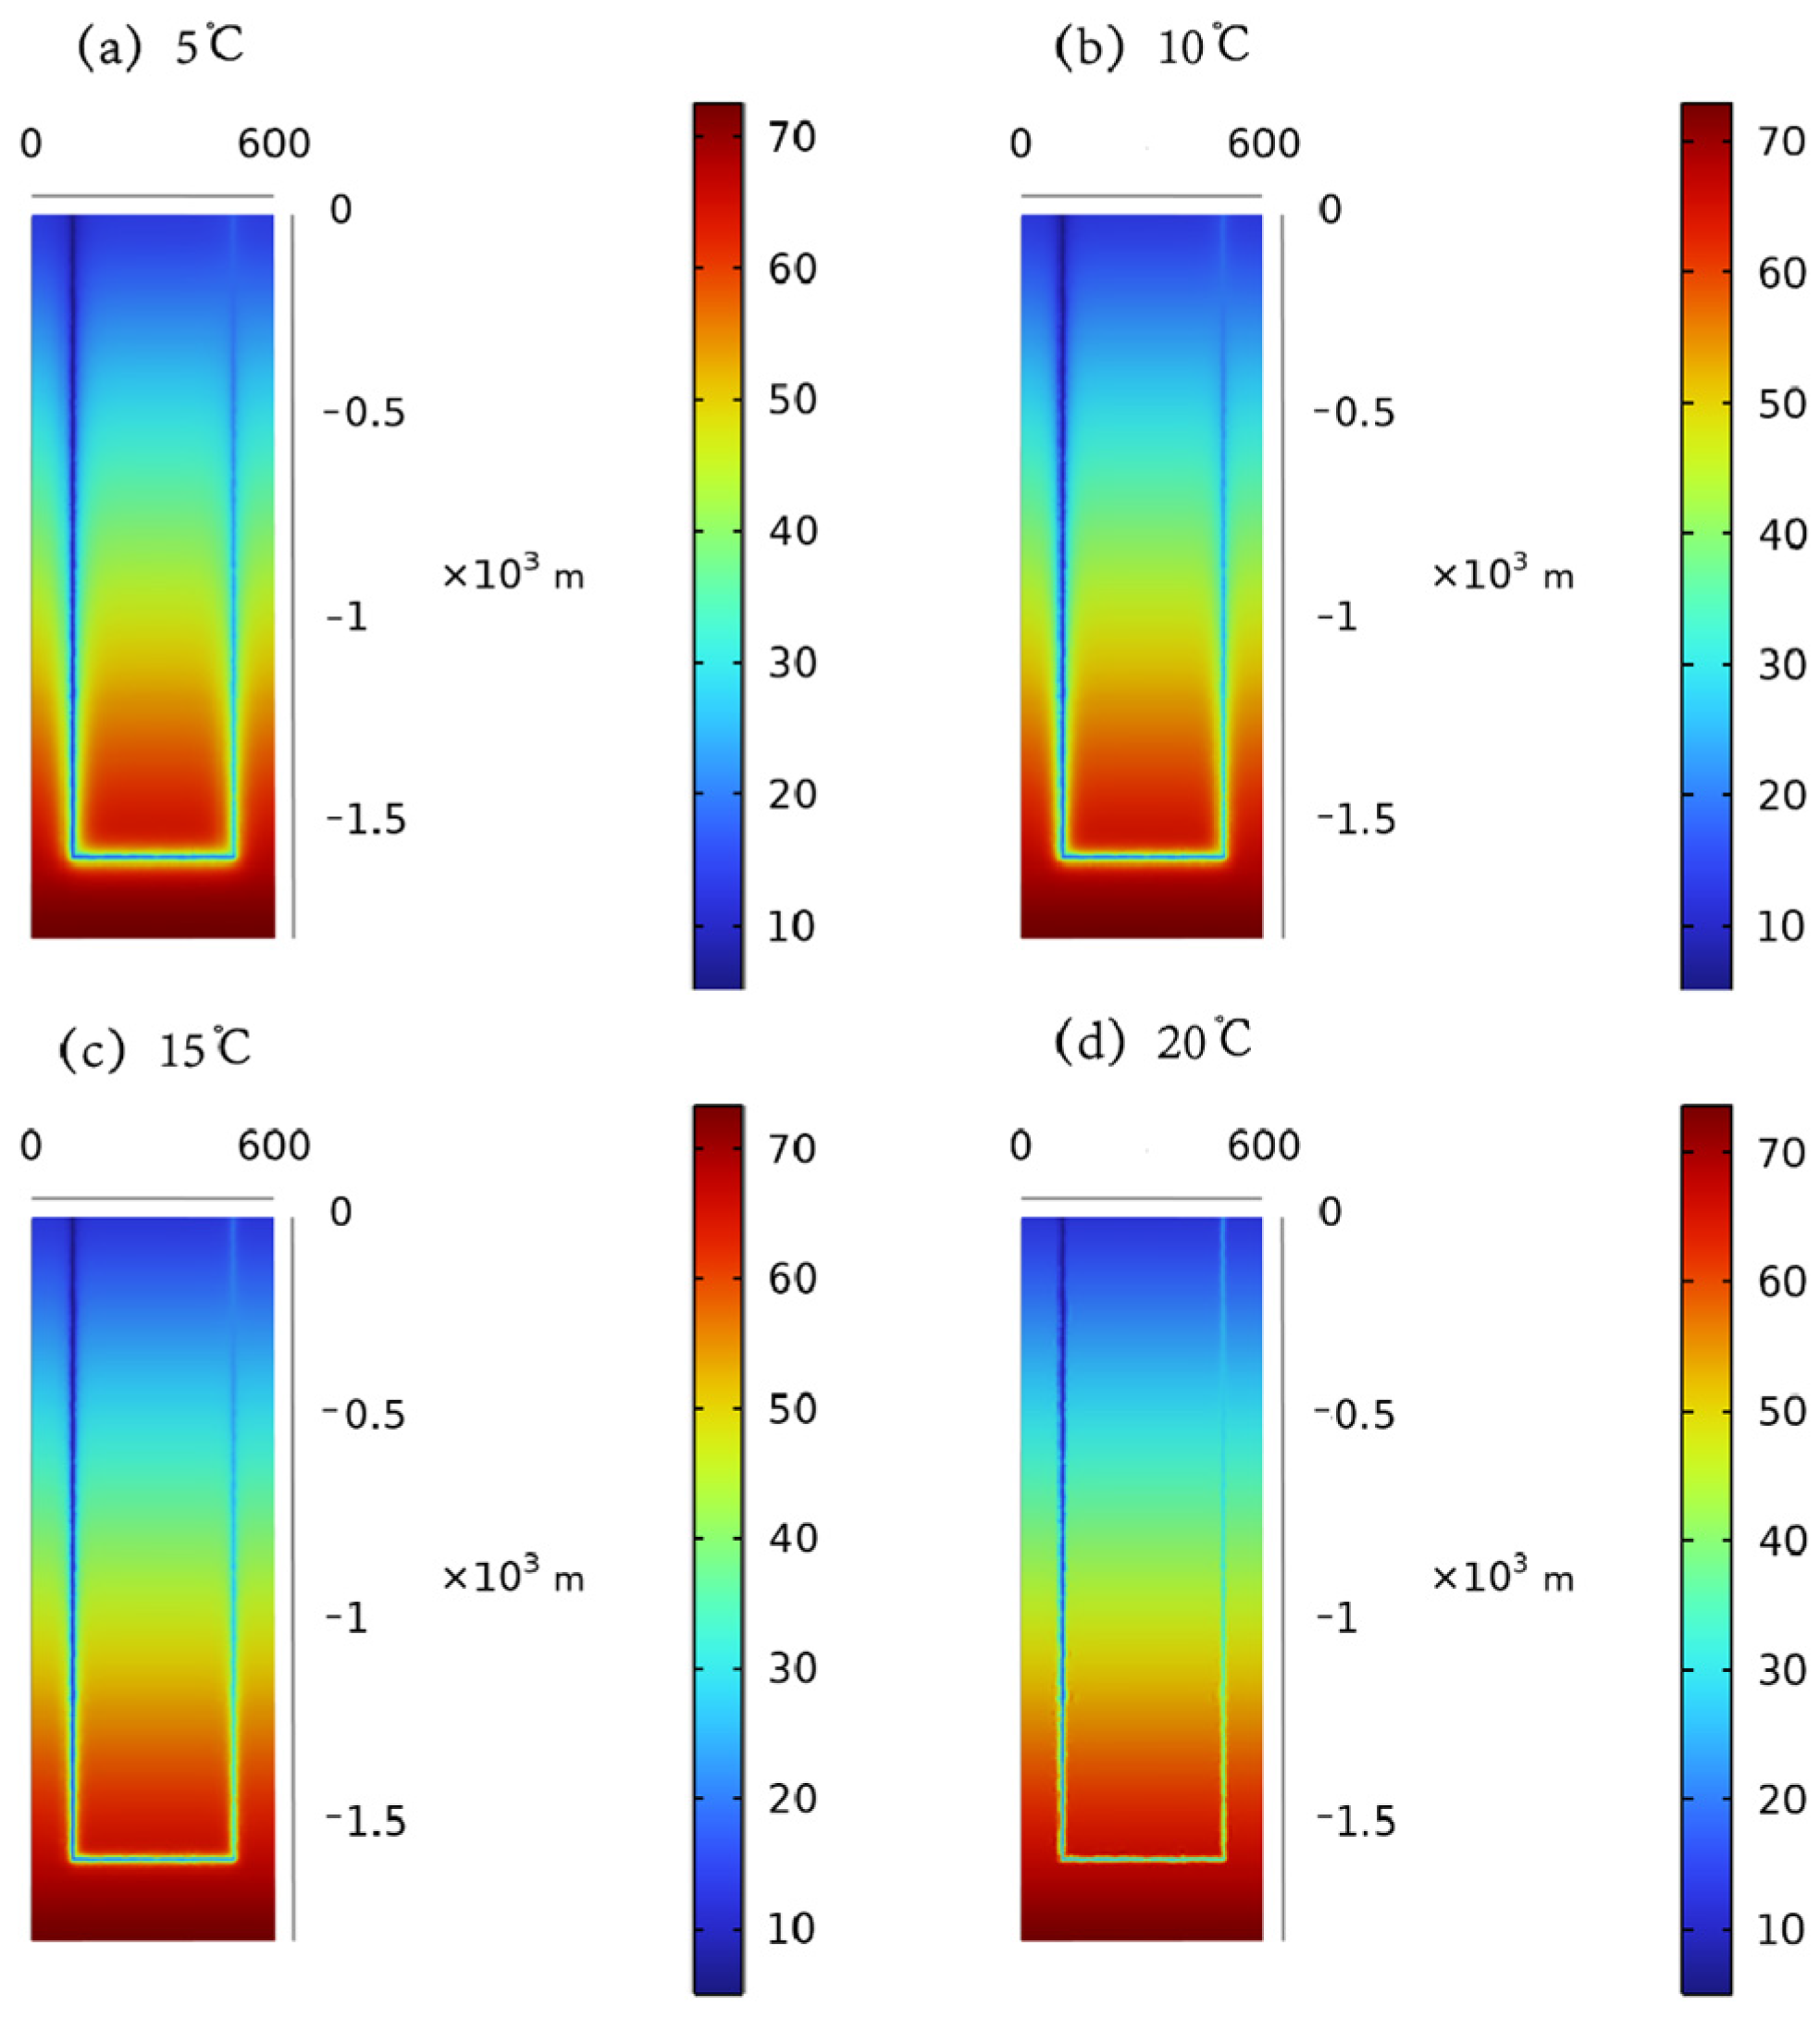
Figure 7 displays cross-section temperature slices of the reservoir after 40 years’ operation under various injection temperatures. Comparison between the 5 °C (Figure 7a) and 20 °C (Figure 7d) cases demonstrates that lower injection temperature corresponds to a wider thermal disturbance range and a more drastic temperature drop in core heat exchange zones. Temperature attenuation around injection wells and horizontal segments is far more severe than that near production wells.
This phenomenon can be explained as follows: during geothermal well exploitation, a lower temperature in the heat-carrying working fluid leads to a larger temperature difference between the fluid and the reservoir. A greater temperature difference corresponds to a higher temperature gradient, which intensifies heat transfer from high-temperature zones to low-temperature zones and produces a stronger disturbance to the geothermal temperature field.
This effect is further exacerbated by differences in wellbore structure and material thermal conductivity. As the primary heat exchange components of the system, injection wells and horizontal wells adopt steel pipes with high thermal conductivity to improve heat exchange efficiency. In contrast, production wells are designed mainly to transport high-temperature working fluid and are generally lined with thermal insulation materials of low thermal conductivity to reduce heat loss.
The thermal conductivity of the pipes used for injection wells and horizontal wells is far higher than that of production well liners. As a result, heat exchange between the well wall and the geothermal reservoir occurs much more readily in injection and horizontal wells. Consequently, the geothermal temperature field around injection wells and horizontal wells undergoes substantially greater perturbation than that surrounding production wells.

4.2. Influence of Injection Mass Flow Rate on Heat Extraction Performance

4.2.1. Simulation Scheme

The numerical model established in Section 3.1 is reused with water as the working fluid. Injection temperature is fixed at 5 °C, and the simulation period is set to 40 years. Four mass flow rates (6, 8, 10, and 12 kg/s) are configured to analyze the effect of flow rate regulation. The detailed schemes are listed in Table 4.

4.2.2. Comparative Analysis of Production Temperature and Heat Extraction Power

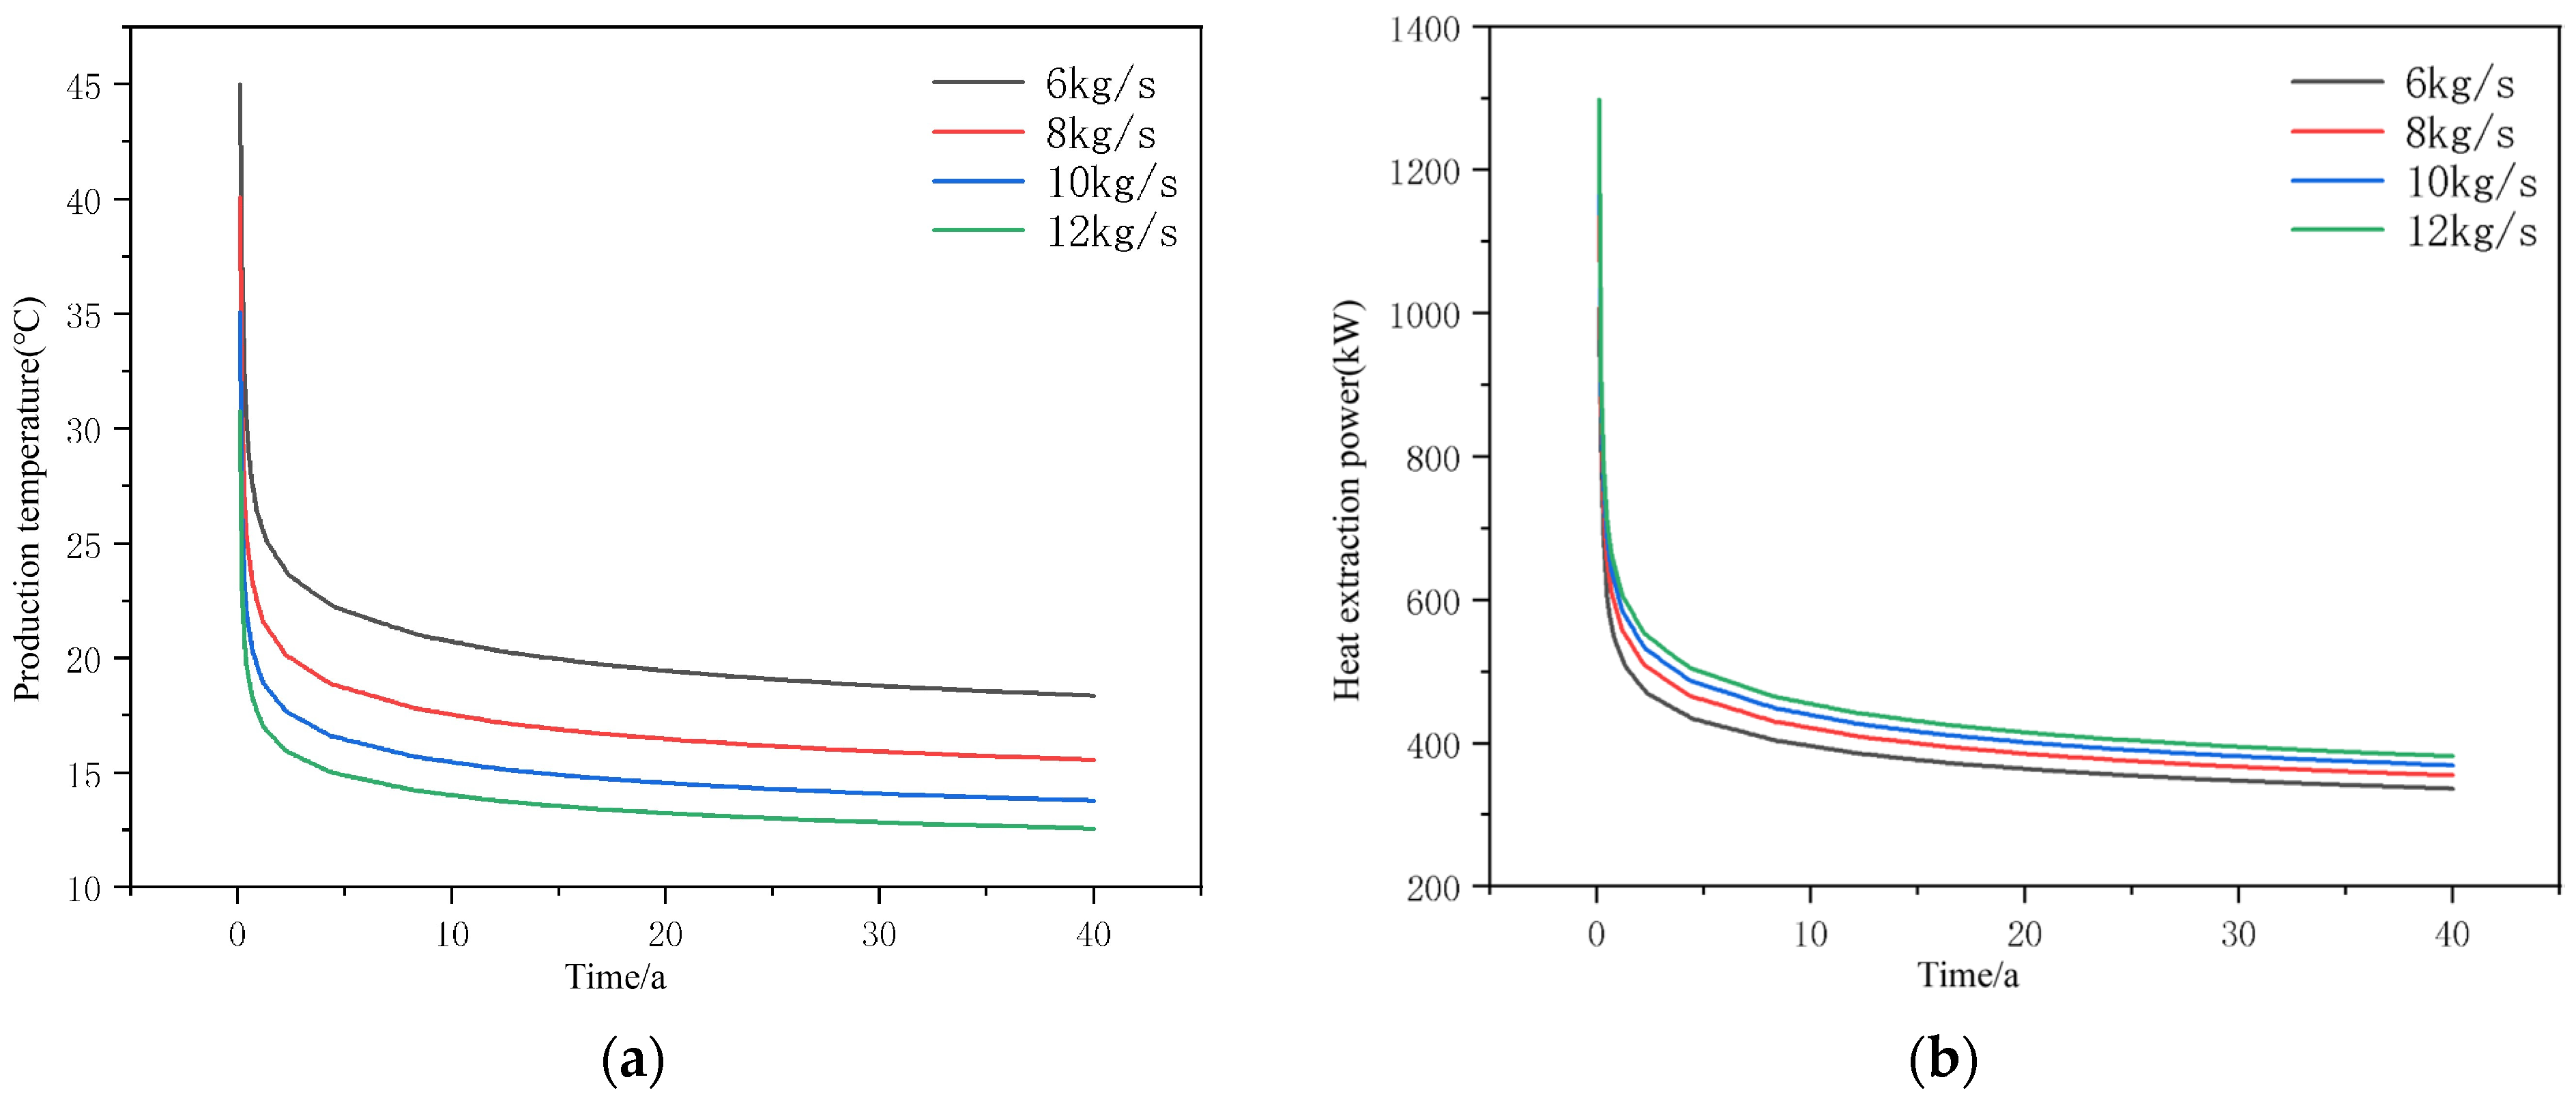
Figure 8 displays the coupled influence laws of various injection mass flow rates on production temperature and heat extraction power for systems running continuously for 40 years with water as the working fluid. Analysis of the simulation data reveals that under constant injection temperature, heat extraction power rises positively with the increased injection mass flow rate during long-term system operation, whereas production temperature decreases significantly with higher flow rates, presenting obvious coupled restriction characteristics.
From specific data, when the injection mass flow rate rises from 6 kg/s to 12 kg/s, the average heat extraction power within 40 years increases by 13.47%, while the corresponding average production temperature drops by 31.48%, directly reflecting the bidirectional regulation effect of flow rate on system thermal output. Further analysis identifies a marginal diminishing law for the boosting effect of injection flow rate on heat extraction power: with the rise of baseline flow rate, the incremental gain of heat extraction power brought by equal flow rate increment gradually flattens out, and the thermal gain of the system enters a plateau stage.
The root cause of this trend lies in the fact that a higher injection mass flow rate drastically increases the volume of working fluid passing through the heat exchange section per unit time. Given the relatively stable total heat release of geothermal reservoirs per unit time, the heat exchange duration of the fluid is greatly compressed, leading to insufficient heating of the working fluid and attenuated overall heat exchange efficiency. This attenuation effect intensifies with further flow rate growth, making it difficult for the heat-carrying capacity of the fluid to keep pace with the rising flow rate, which ultimately results in slower growth of heat extraction power and a continuous drop in production temperature.
It is worth emphasizing that for closed-loop geothermal systems using water as the working fluid, injection mass flow rate exerts weaker regulatory sensitivity on heat extraction power compared with injection temperature. This characteristic stems from the relatively stable thermophysical properties of water such as specific heat capacity and thermal conductivity; temperature variation imposes a stronger influence on its heat-carrying capacity, while flow rate mainly regulates heat extraction efficiency by altering heat exchange duration, providing an important reference for optimal parameter configuration in engineering.

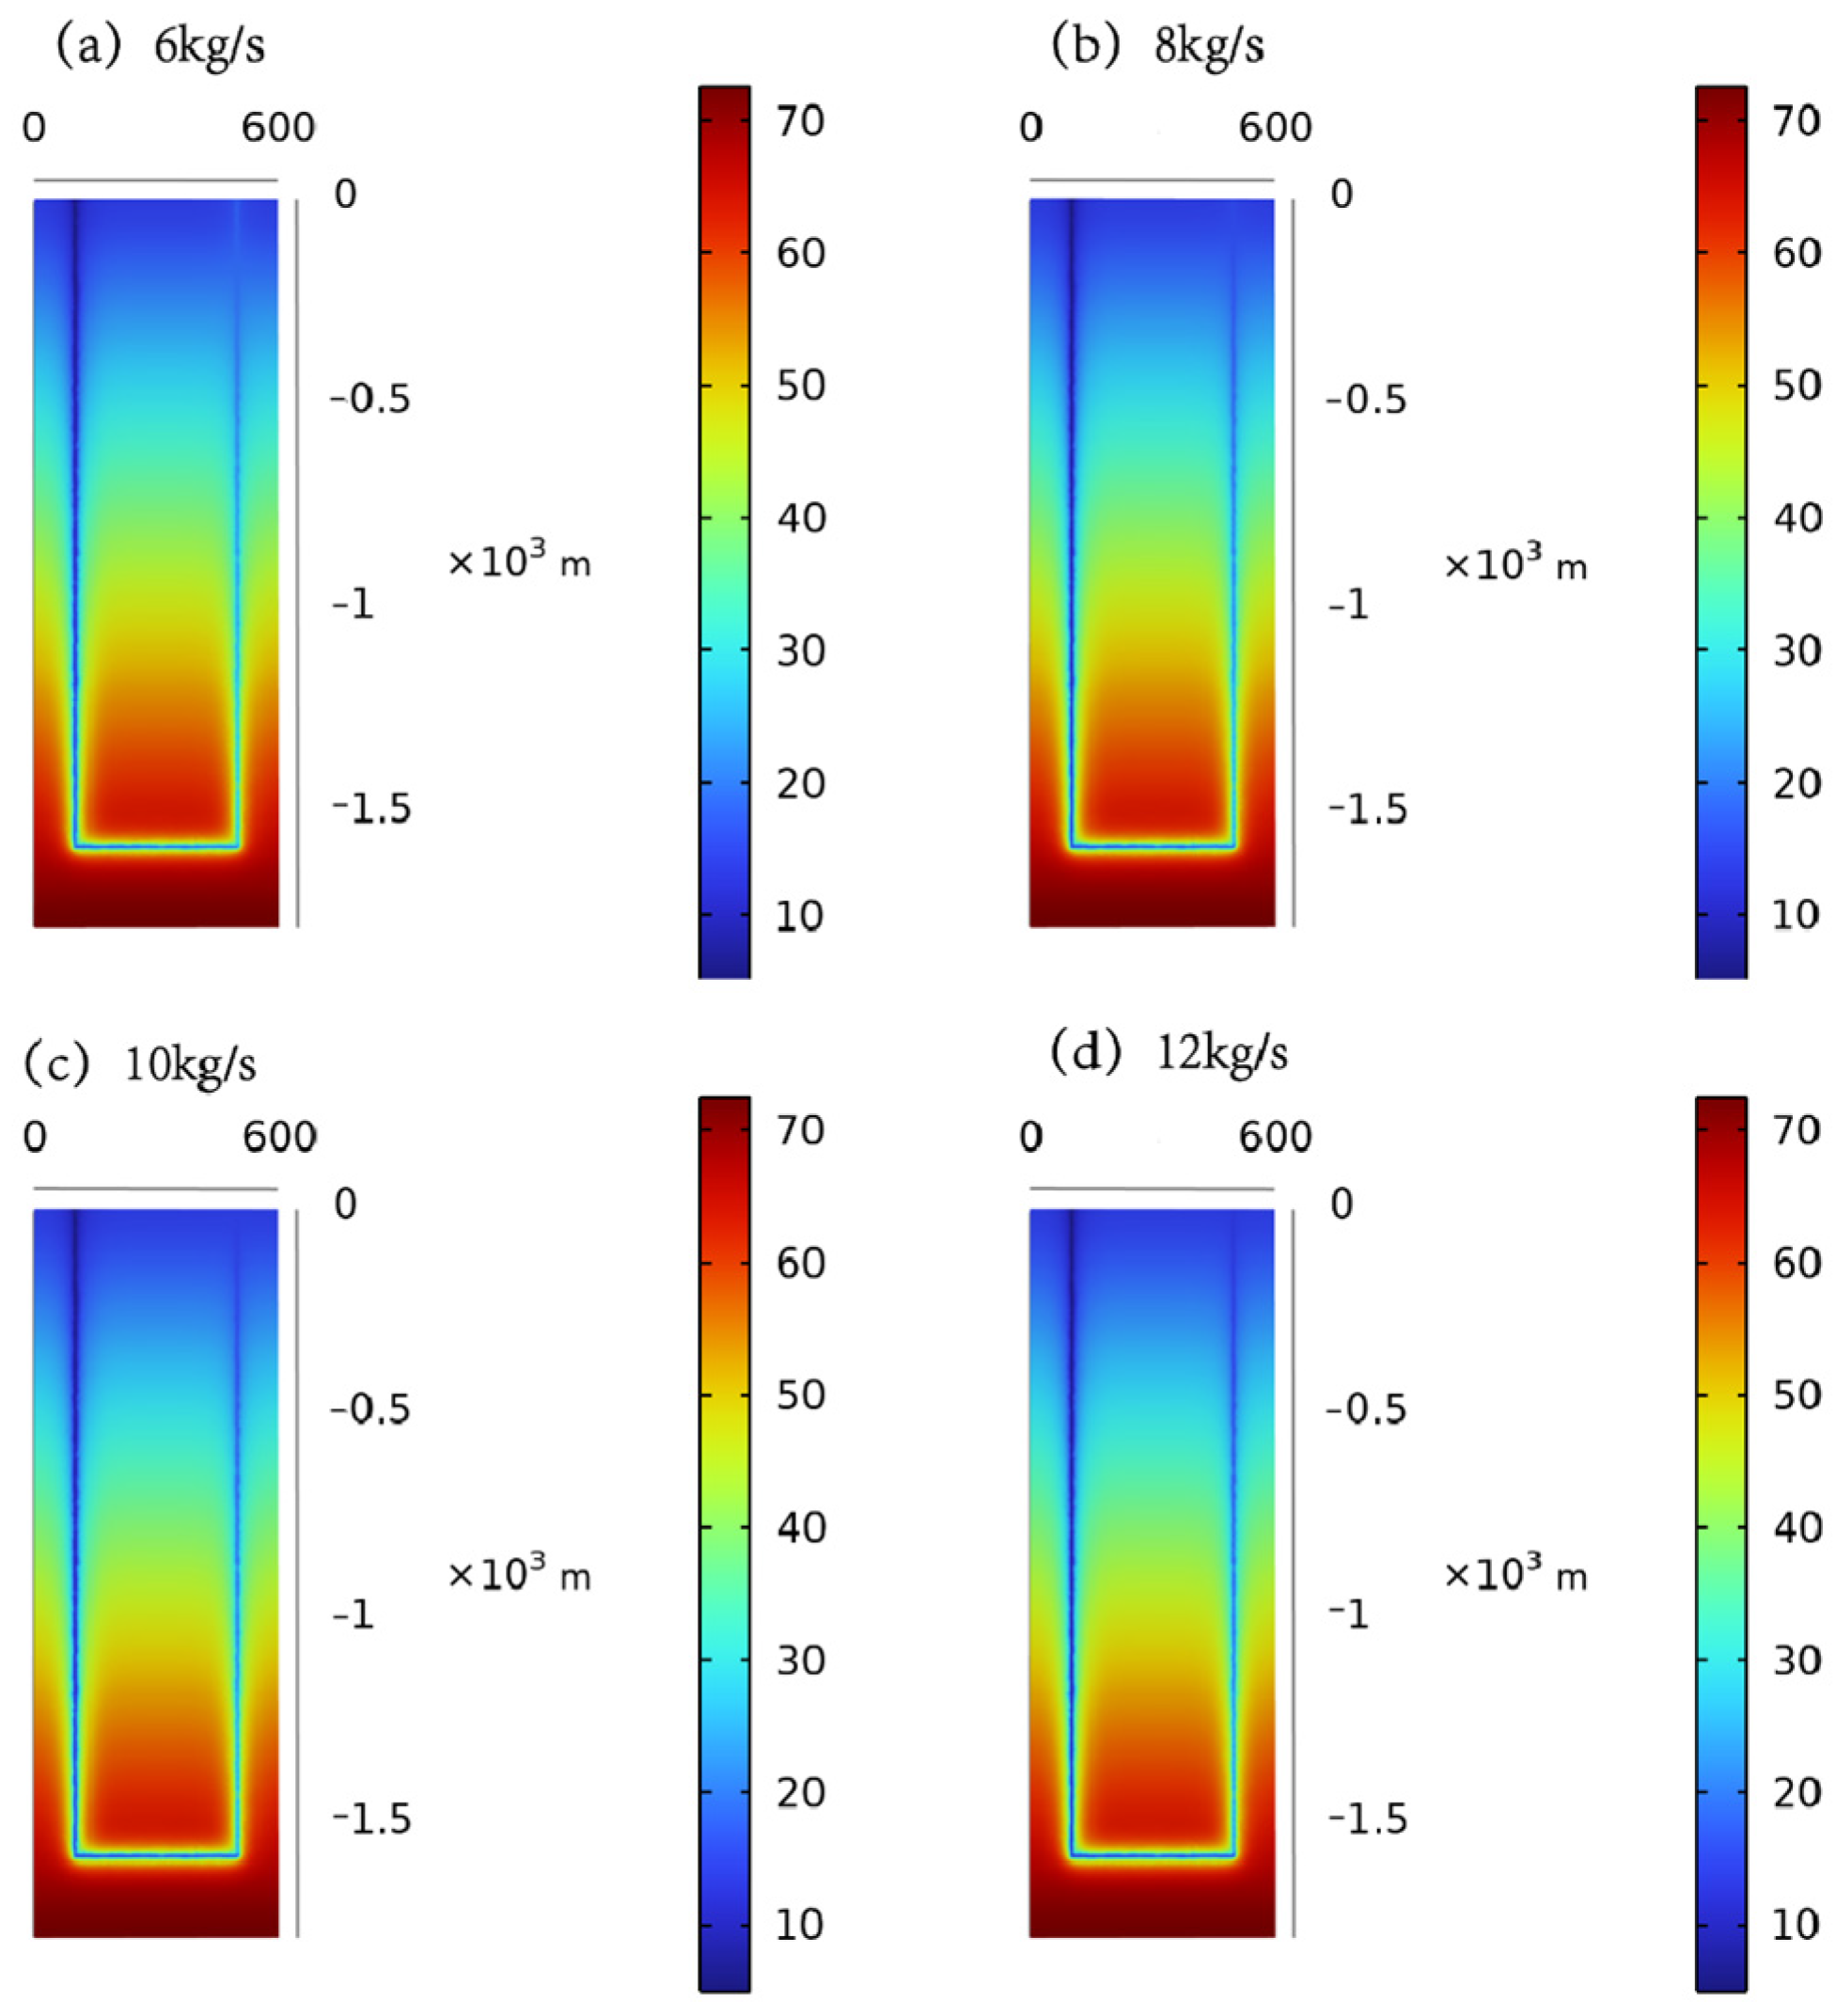
4.2.3. Analysis of Reservoir Geothermal Field Variation

Figure 9 shows cross-section slices of the closed-loop geothermal system model after 40 years of operation with water as the heat-carrying fluid under different injection mass flow rates. Comparison between flow rates of 6 kg/s (Figure 9a) and 12 kg/s (Figure 9d) proves that the injection mass flow rate is positively correlated with the disturbance range and temperature attenuation amplitude of the reservoir geothermal field: a higher flow rate leads to a wider boundary of geothermal field influence and a more drastic temperature drop in core heat exchange zones. Meanwhile, an elevated flow rate generates full-scale geothermal disturbance, with obvious temperature attenuation observed around injection wells, horizontal wells and production wells alike.
The underlying mechanism is as follows: a higher fluid injection flow rate significantly strengthens the convective heat transfer coefficient between the fluid and the heat exchange walls during geothermal exploitation, boosting interphase heat transfer efficiency. This allows the heat-carrying fluid to extract thermal energy from geothermal reservoirs more rapidly through conduction and convection heat transfer across well walls, accelerating heat depletion of reservoirs and expanding the affected range of the geothermal field with greater temperature reduction around core zones. Although production wells are lined with thermal insulation casings to mitigate heat loss, no perfectly insulating material exists in practical engineering. A higher working fluid flow rate intensifies heat exchange between the fluid and production well walls despite insulation, resulting in a prominent temperature drop around production wells and full-scale geothermal field disturbance.

4.3. Influence of Wellbore Type on Heat Extraction Performance

4.3.1. Simulation Scheme

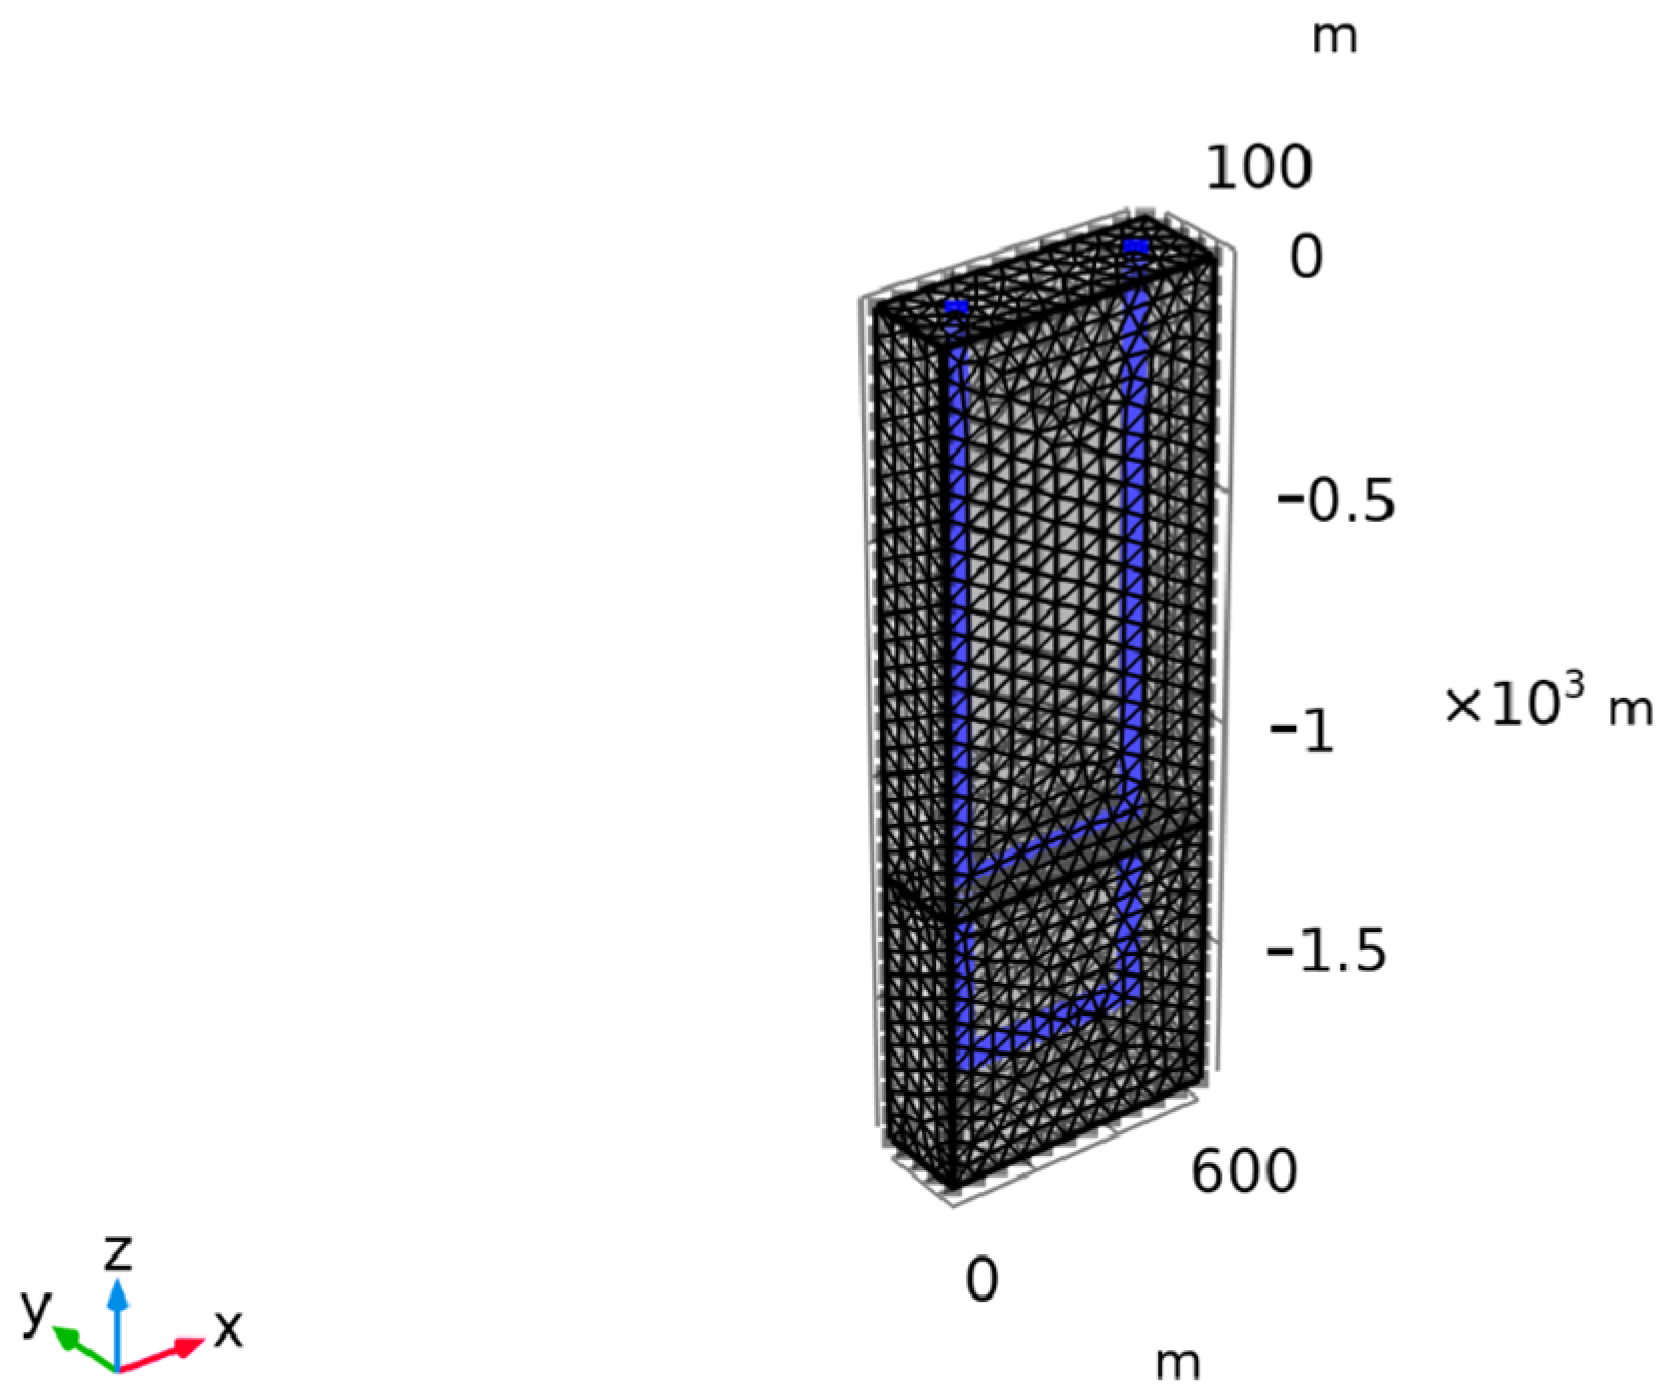
The 3D numerical model established in Section 3.1 was modified to study the influence of wellbore type on the long-term heat production performance of closed-loop geothermal systems with water as the working fluid. Based on the original U-shaped well model, an additional horizontal heat exchange section of 400 m was added 400 m above the existing horizontal section to construct a branched well structure. Steel casings of identical specifications were adopted for both horizontal sections to guarantee single-variable control. The mesh generation of the modified branched well model is shown in Figure 10.
To compare heat production performance between the connected wells and branched wells, all operating parameters were kept consistent for both well types: injection temperature was fixed at 5 °C, injection mass flow rate was fixed at 6 kg/s, and total simulation duration was set to 40 years. The detailed simulation schemes are listed in Table 5.

4.3.2. Comparative Analysis of Production Temperature and Heat Extraction Power

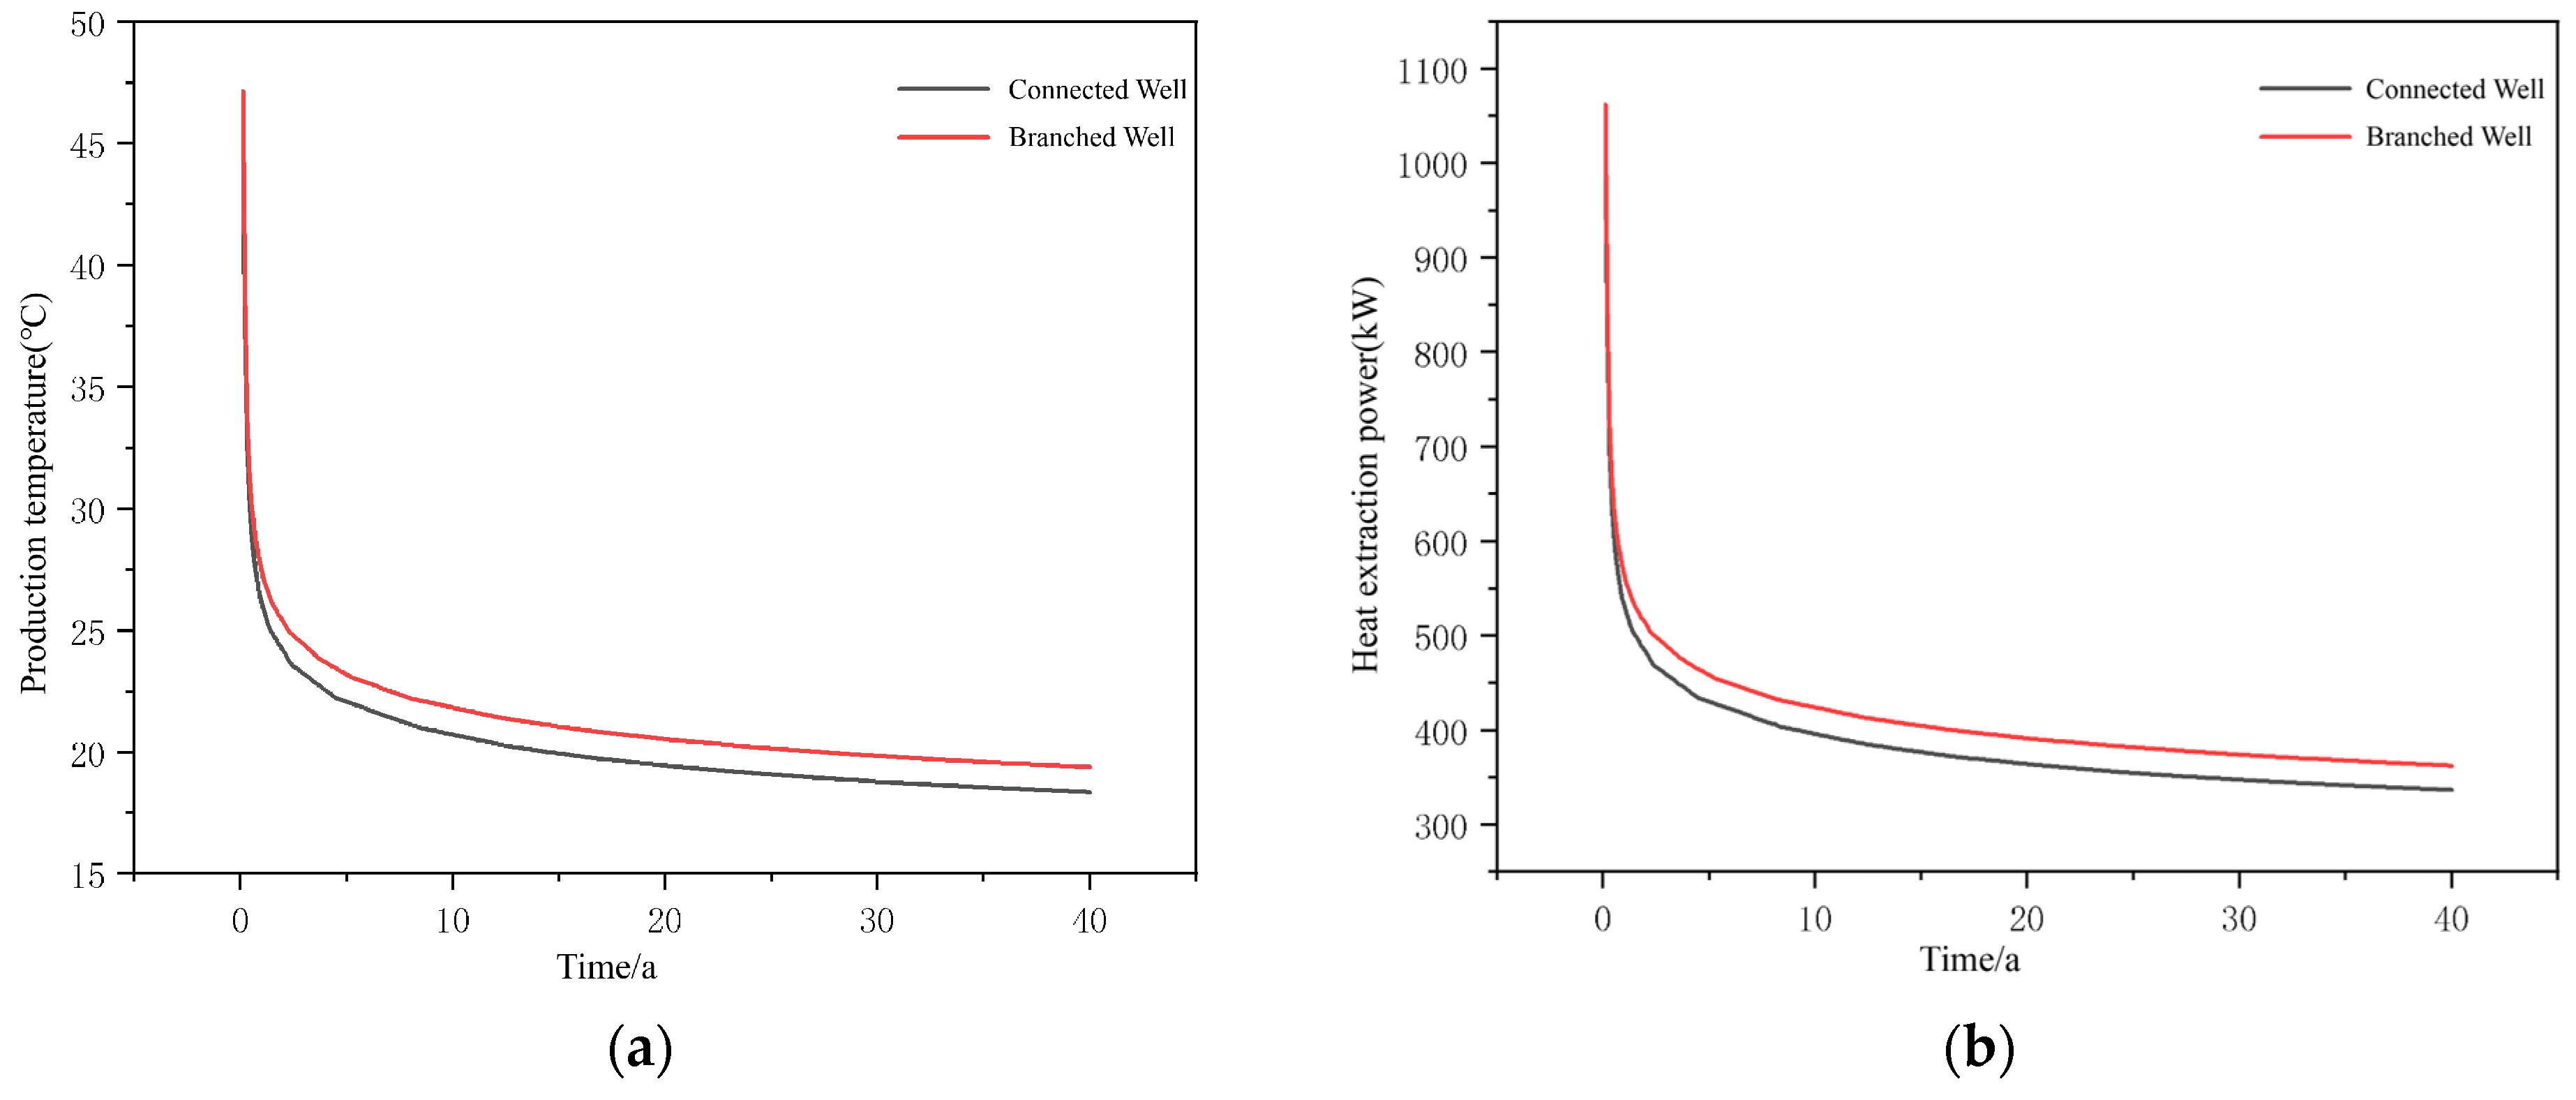
Figure 11 illustrates the influence laws of two wellbore types (branched well vs. connected well) on production temperature and heat extraction power for systems running continuously for 40 years with water as the working fluid. The simulation data indicate that under identical injection temperature and flow rate, branched wells deliver comprehensively superior performance in production temperature and heat extraction power, exhibiting better heat exchange efficiency and long-term operational stability.
Quantitative indicators show that, compared with connected wells, branched wells achieve a 5.56% higher average production temperature and 7.64% higher average heat extraction power within 40 years of operation, representing a remarkable thermal performance improvement. More notably, the production temperature and heat extraction power of the branched wells after 40 years of operation both exceed those of connected wells after only 5 years of exploitation, fully demonstrating the advantages of branched wells in long-term geothermal resource extraction.
The core performance difference originates from the discrepancy in total heat exchange area between the two wellbore types. By adding an extra heat exchange pipeline to optimize layout, branched wells significantly expand the contact area between the wellbore and geothermal reservoirs. A larger heat exchange area extends the heat exchange path and duration of the working fluid, enabling more sufficient conductive and convective heat transfer between the injected fluid and reservoirs, thus attaining higher production temperature and heat extraction power under identical operating conditions and providing key technical support for structural optimization of geothermal wellbores in engineering design.

4.3.3. Analysis of Reservoir Geothermal Field Variation

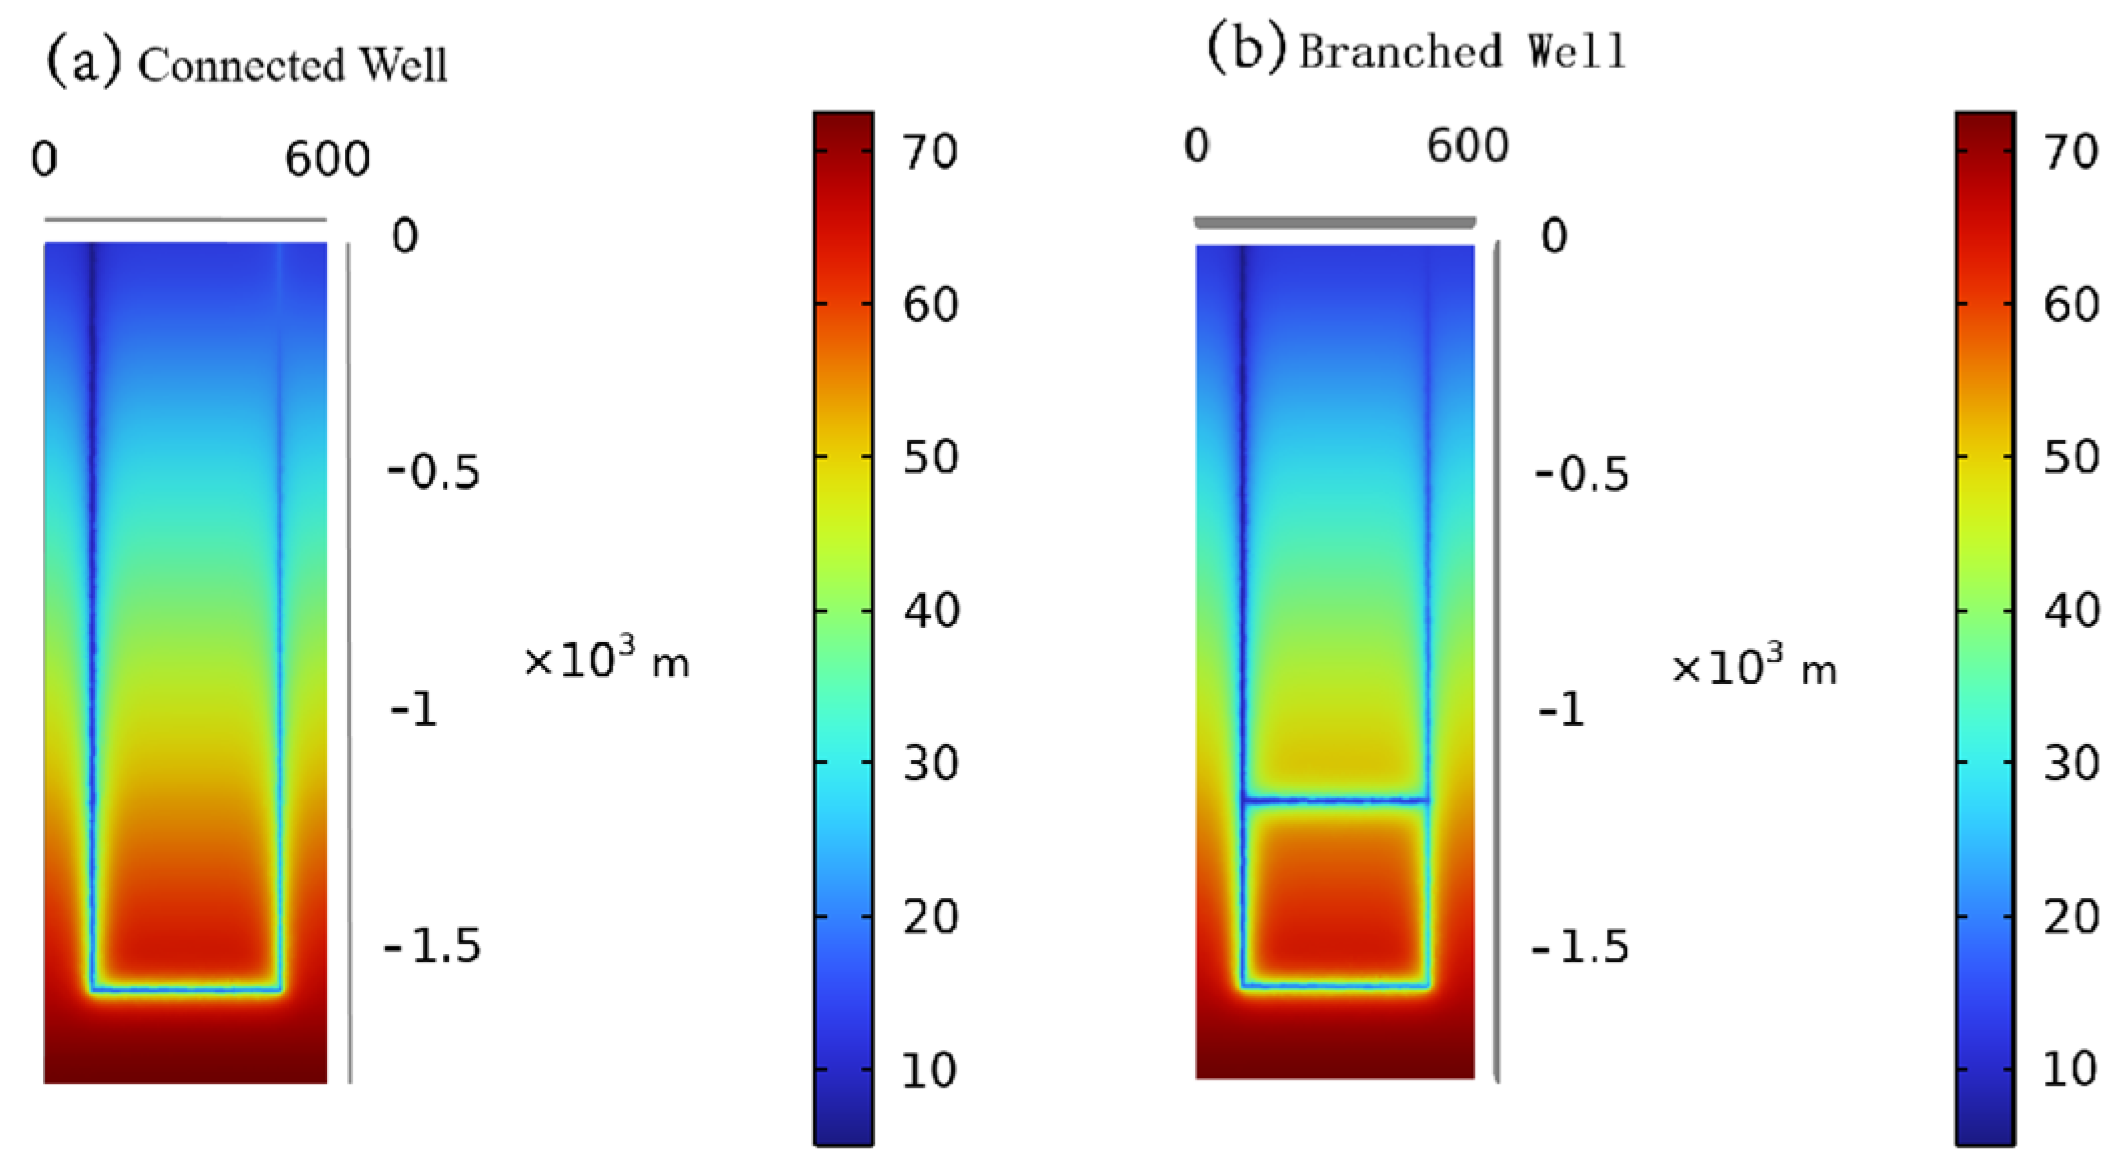
Figure 12 presents cross-section slices of the closed-loop geothermal system model after 40 years of operation with water as the heat-carrying fluid for connected wells and branched wells respectively. Comparison between connected wells (Figure 12a) and branched wells (Figure 12b) reveals that although branched wells exert a wider overall influence range on geothermal reservoirs, temperature attenuation around key wellbore zones is less severe than in connected wells. This characteristic carries great significance for sustainable geothermal exploitation, as it effectively delays reservoir thermal depletion and guarantees stable heat extraction efficiency of geothermal wells over long service lives.
The underlying mechanism lies in the heat exchange efficiency and range between wellbores and reservoirs, which dominate the evolution of geothermal fields during exploitation. Equipped with multi-branch structures, branched wells establish heat exchange channels with geothermal reservoirs at varying depths simultaneously to collect thermal energy across multiple strata. In contrast, connected wells are restricted to heat exchange within a single reservoir interval, concentrating heat extraction in localized zones and triggering rapid temperature drops in surrounding formations. The multi-stratum heat exchange mode of branched wells disperses heat extraction intensity and lowers thermal load per unit reservoir area, reducing geothermal field disturbance and significantly extending the economically viable exploitation lifespan of geothermal wells, offering technical support for large-scale long-term utilization of geothermal resources.
Additionally, as shown in Figure 12b, heat exchange intensity differs between the two horizontal sections of branched wells, with more prominent temperature variation around the shallow upper horizontal section than the deep lower horizontal section. This disparity arises from coupled effects of pressure gradient and gravity on the flow trajectory of injected water. When water flows down the main wellbore to the branch junction, part of the fluid diverts into the shallow upper horizontal section for heat exchange, while the rest continues downward under inertia and gravity to enter the deep lower horizontal section. The upper horizontal section receives a larger fluid flow rate, coupled with distinct thermal properties of shallow formations, leading to more drastic temperature variation in surrounding reservoirs.
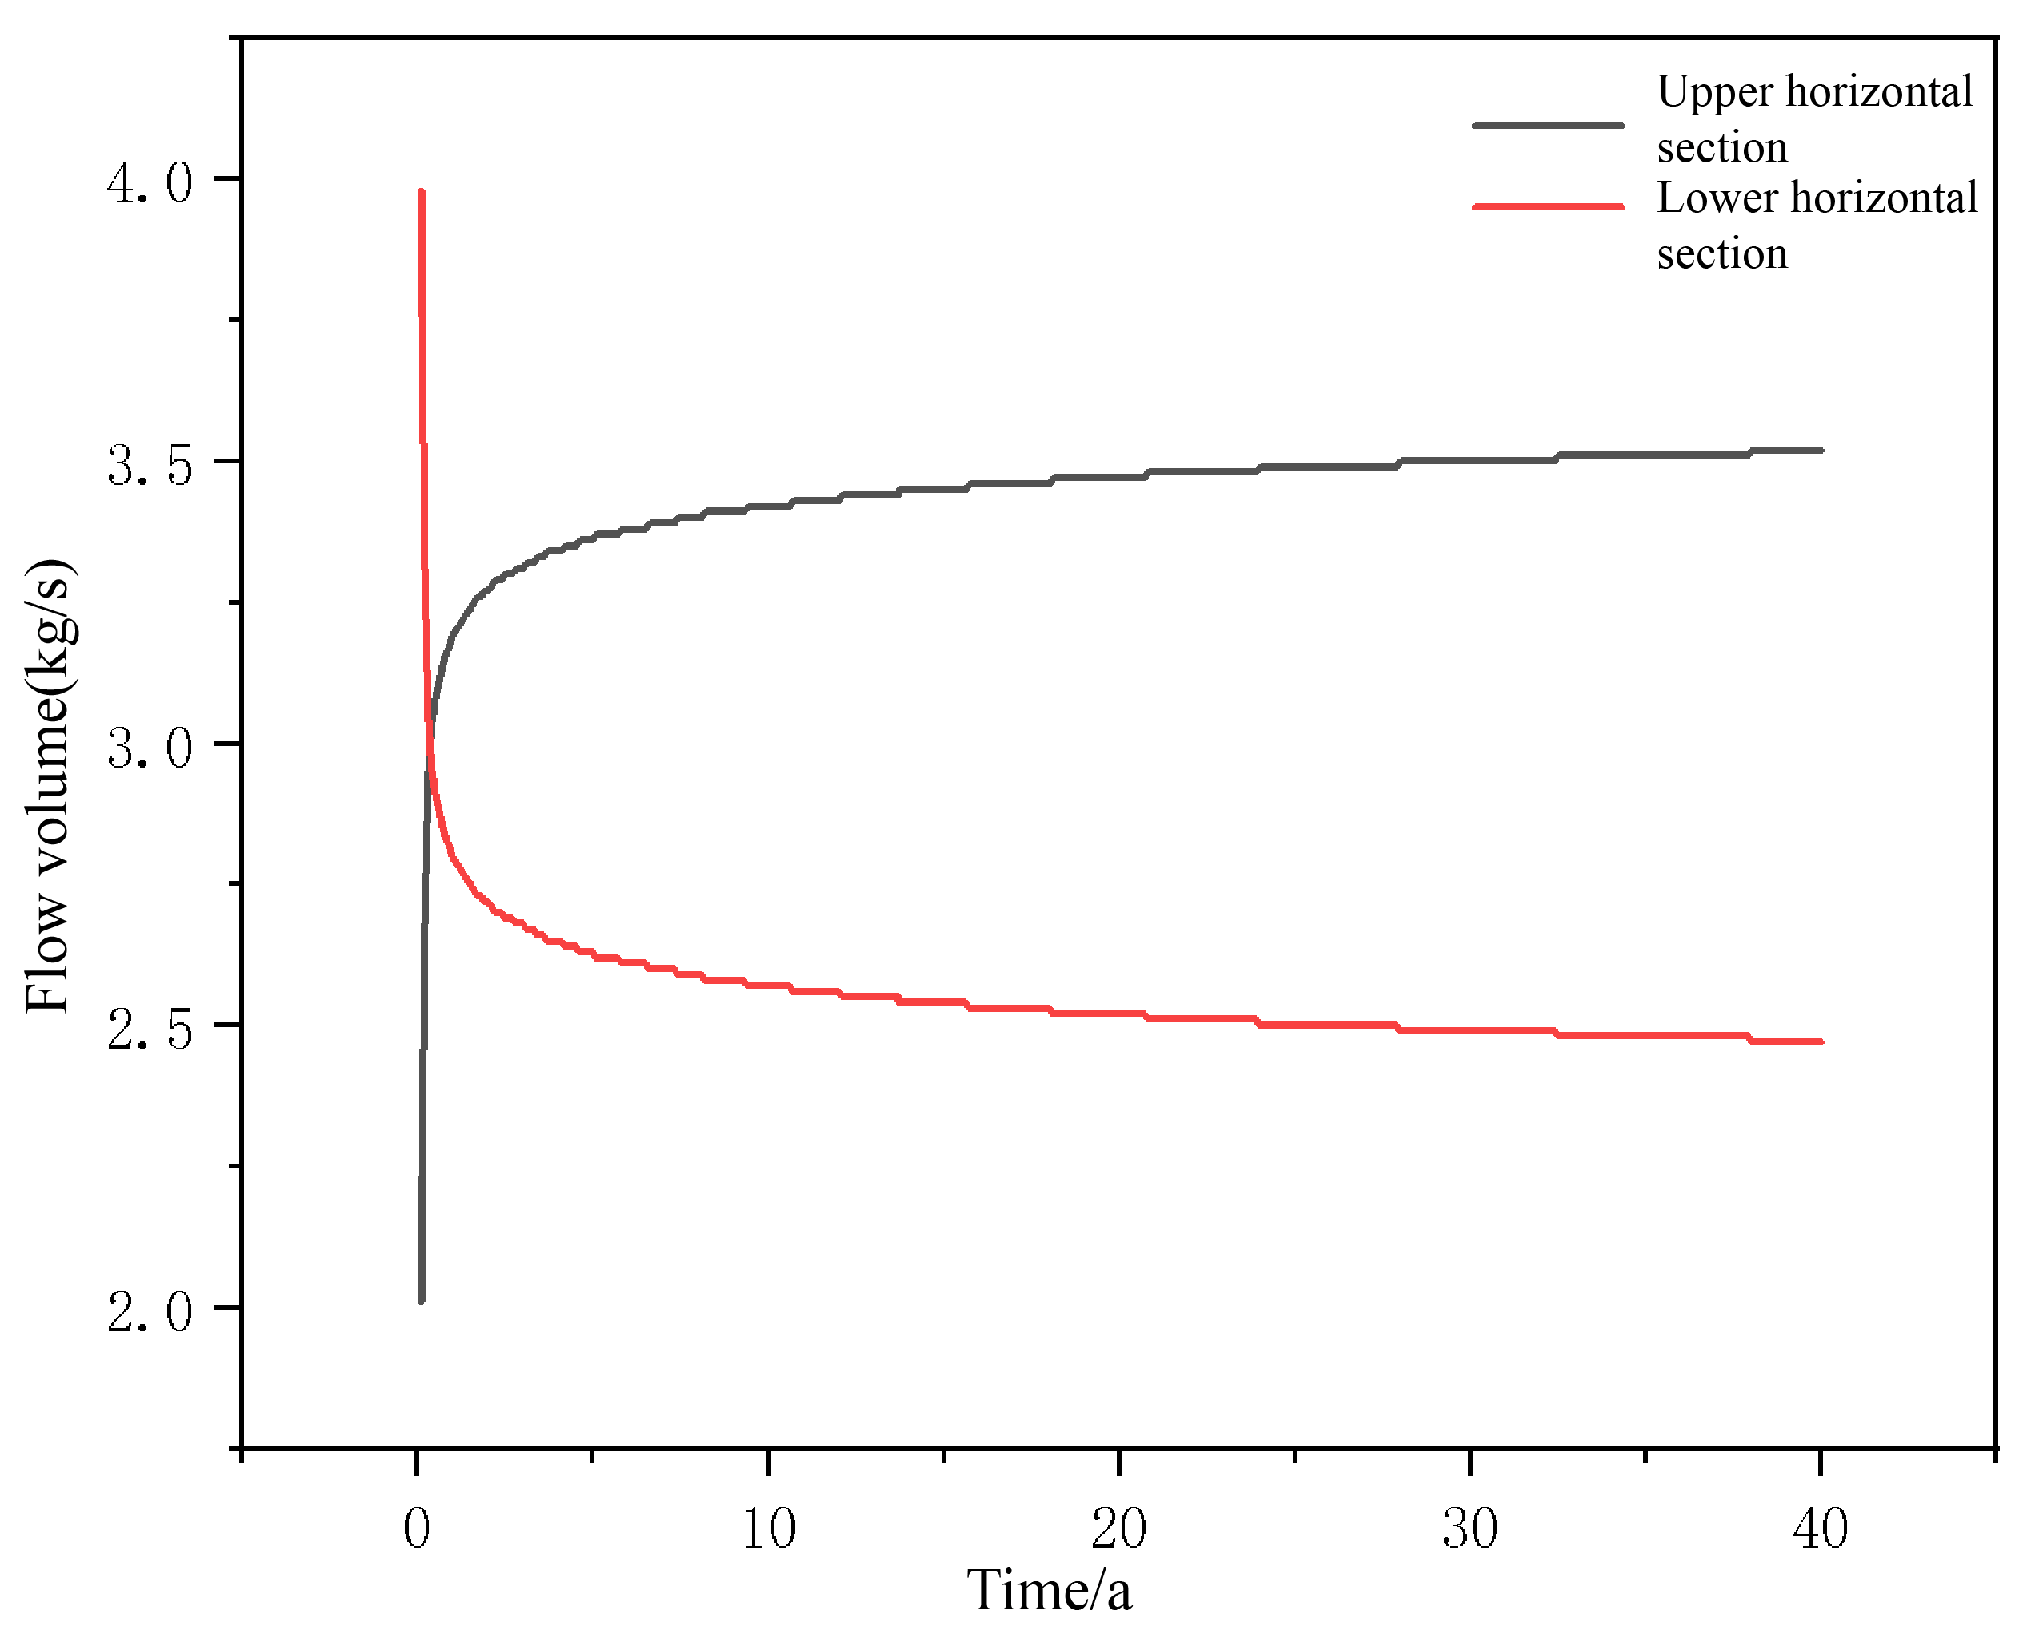
Simulation results of the flow distribution of water in branched wells are plotted in Figure 13. At the initial stage of system operation, nearly all fluid flows into the lower horizontal section with minimal flow in the upper section. After 40 years of continuous operation, a stable flow distribution forms: the upper horizontal section carries a mass flow rate of 3.52 kg/s, approximately 1.4 times that of the lower horizontal section, realizing reasonable fluid allocation between the two horizontal heat exchange segments.
The evolution of flow distribution can be explained as follows: at the startup phase, the working fluid must fully fill the entire branched well pipeline before entering stable heat exchange, resulting in highly uneven flow concentrated in the lower horizontal section with lower flow resistance. After long-term stable operation, thermal gradients around reservoir zones alter the flow resistance of the two horizontal sections and reach dynamic equilibrium, yielding higher flow volume in the upper horizontal section. This balanced distribution maximizes the heat exchange potential of both horizontal segments and improves the overall heat extraction efficiency of branched wells.

5. Thermal Performance of CO2-Based Systems

5.1. Influence of Injection Temperature on Heat Extraction Performance

5.1.1. Simulation Scheme

The three-dimensional numerical model built in Section 3.1 is adopted, with CO2 selected as the heat extraction working fluid to investigate the influence of injection temperature on the long-term heat production capacity of closed-loop geothermal systems. The simulation settings are consistent with those in Section 4.1.1 for comparison purposes: the injection flow rate is fixed at 6 kg/s, the total simulation operation time is 40 years, and four injection temperature of 5 °C, 10 °C, 15 °C and 20 °C are set, which facilitates the horizontal comparison of performance between CO2 and water working fluids.

5.1.2. Comparative Analysis of Production Temperature and Heat Extraction Power

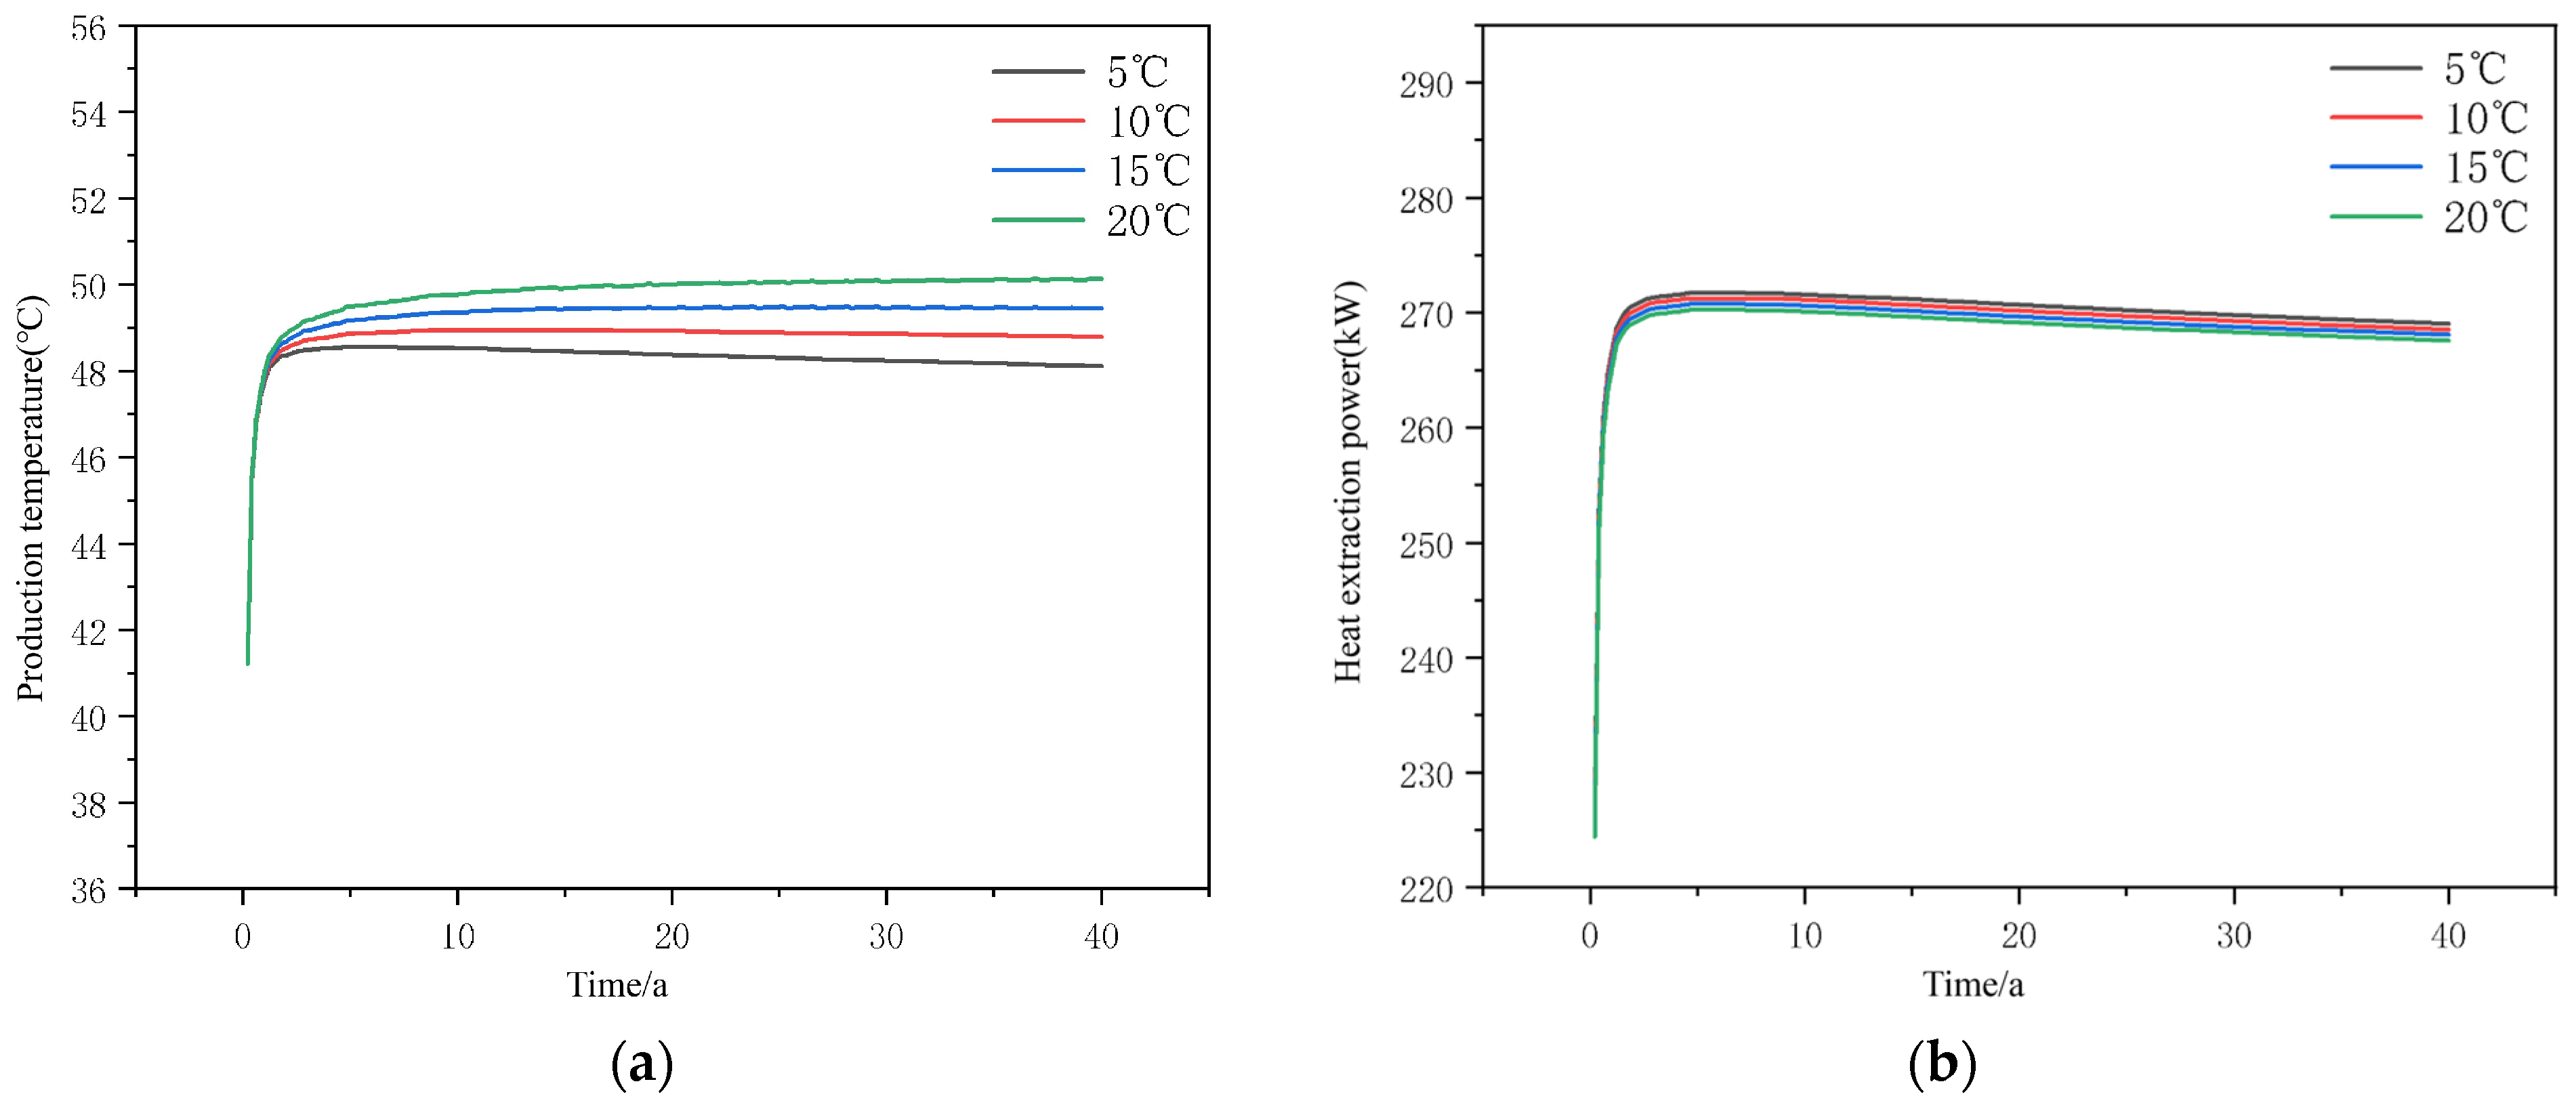
Figure 14 shows the variation curves of outlet fluid temperature and heat extraction power of the system operating for 40 years with CO2 as the working fluid. The simulation results indicate that under the condition of a fixed injection flow rate, the outlet fluid temperature of the closed-loop geothermal system using CO2 increases monotonically with the rise in injection temperature, while the heat extraction power decreases. This core variation rule is consistent with that of a water working fluid, which reflects that the regulation logic of injection temperature on thermal output of closed-loop systems is universal for all working fluids. However, compared with water, CO2 is far less responsive to fluctuations in injection temperature and presents better long-term operational stability. Quantitative data show that when the injection temperature rises from 5 °C to 20 °C, the average heat extraction power of the system only decreases by 1.5 kW within the 40-year operation cycle. Under the geological and operational conditions of the study site, CO2 allows wider flexibility in the selection of injection temperature in engineering design.
In terms of outlet fluid temperature, the outlet temperature of the system using CO2 is generally higher and maintains better long-term stability. Regardless of the injection temperature adopted, the outlet fluid temperature remains above 48 °C during the 40-year operation period. When the injection temperature is 5 °C for both working fluids, the outlet temperature of CO2 reaches 48.12 °C, which is 29.76 °C higher than that of water. It should be noted that a high outlet temperature does not necessarily correspond to greater total heat extraction. Under the same injection flow rate, the average heat extraction power of CO2 is only 80% of that of water, which is caused by the lower specific heat capacity of CO2 and its weaker heat-carrying capacity per unit mass.
In addition, unlike water, continuous geothermal exploitation will not lead to an obvious decline in outlet temperature and heat extraction for CO2. When the injection temperature is 5 °C, the difference between the outlet temperature in the 1st year and the 40th year is merely 0.36 °C for CO2, while the difference reaches 10.6 °C for water, which demonstrates significant performance differences between the two working fluids in geothermal exploitation.

5.1.3. Analysis of Reservoir Geothermal Field Variation

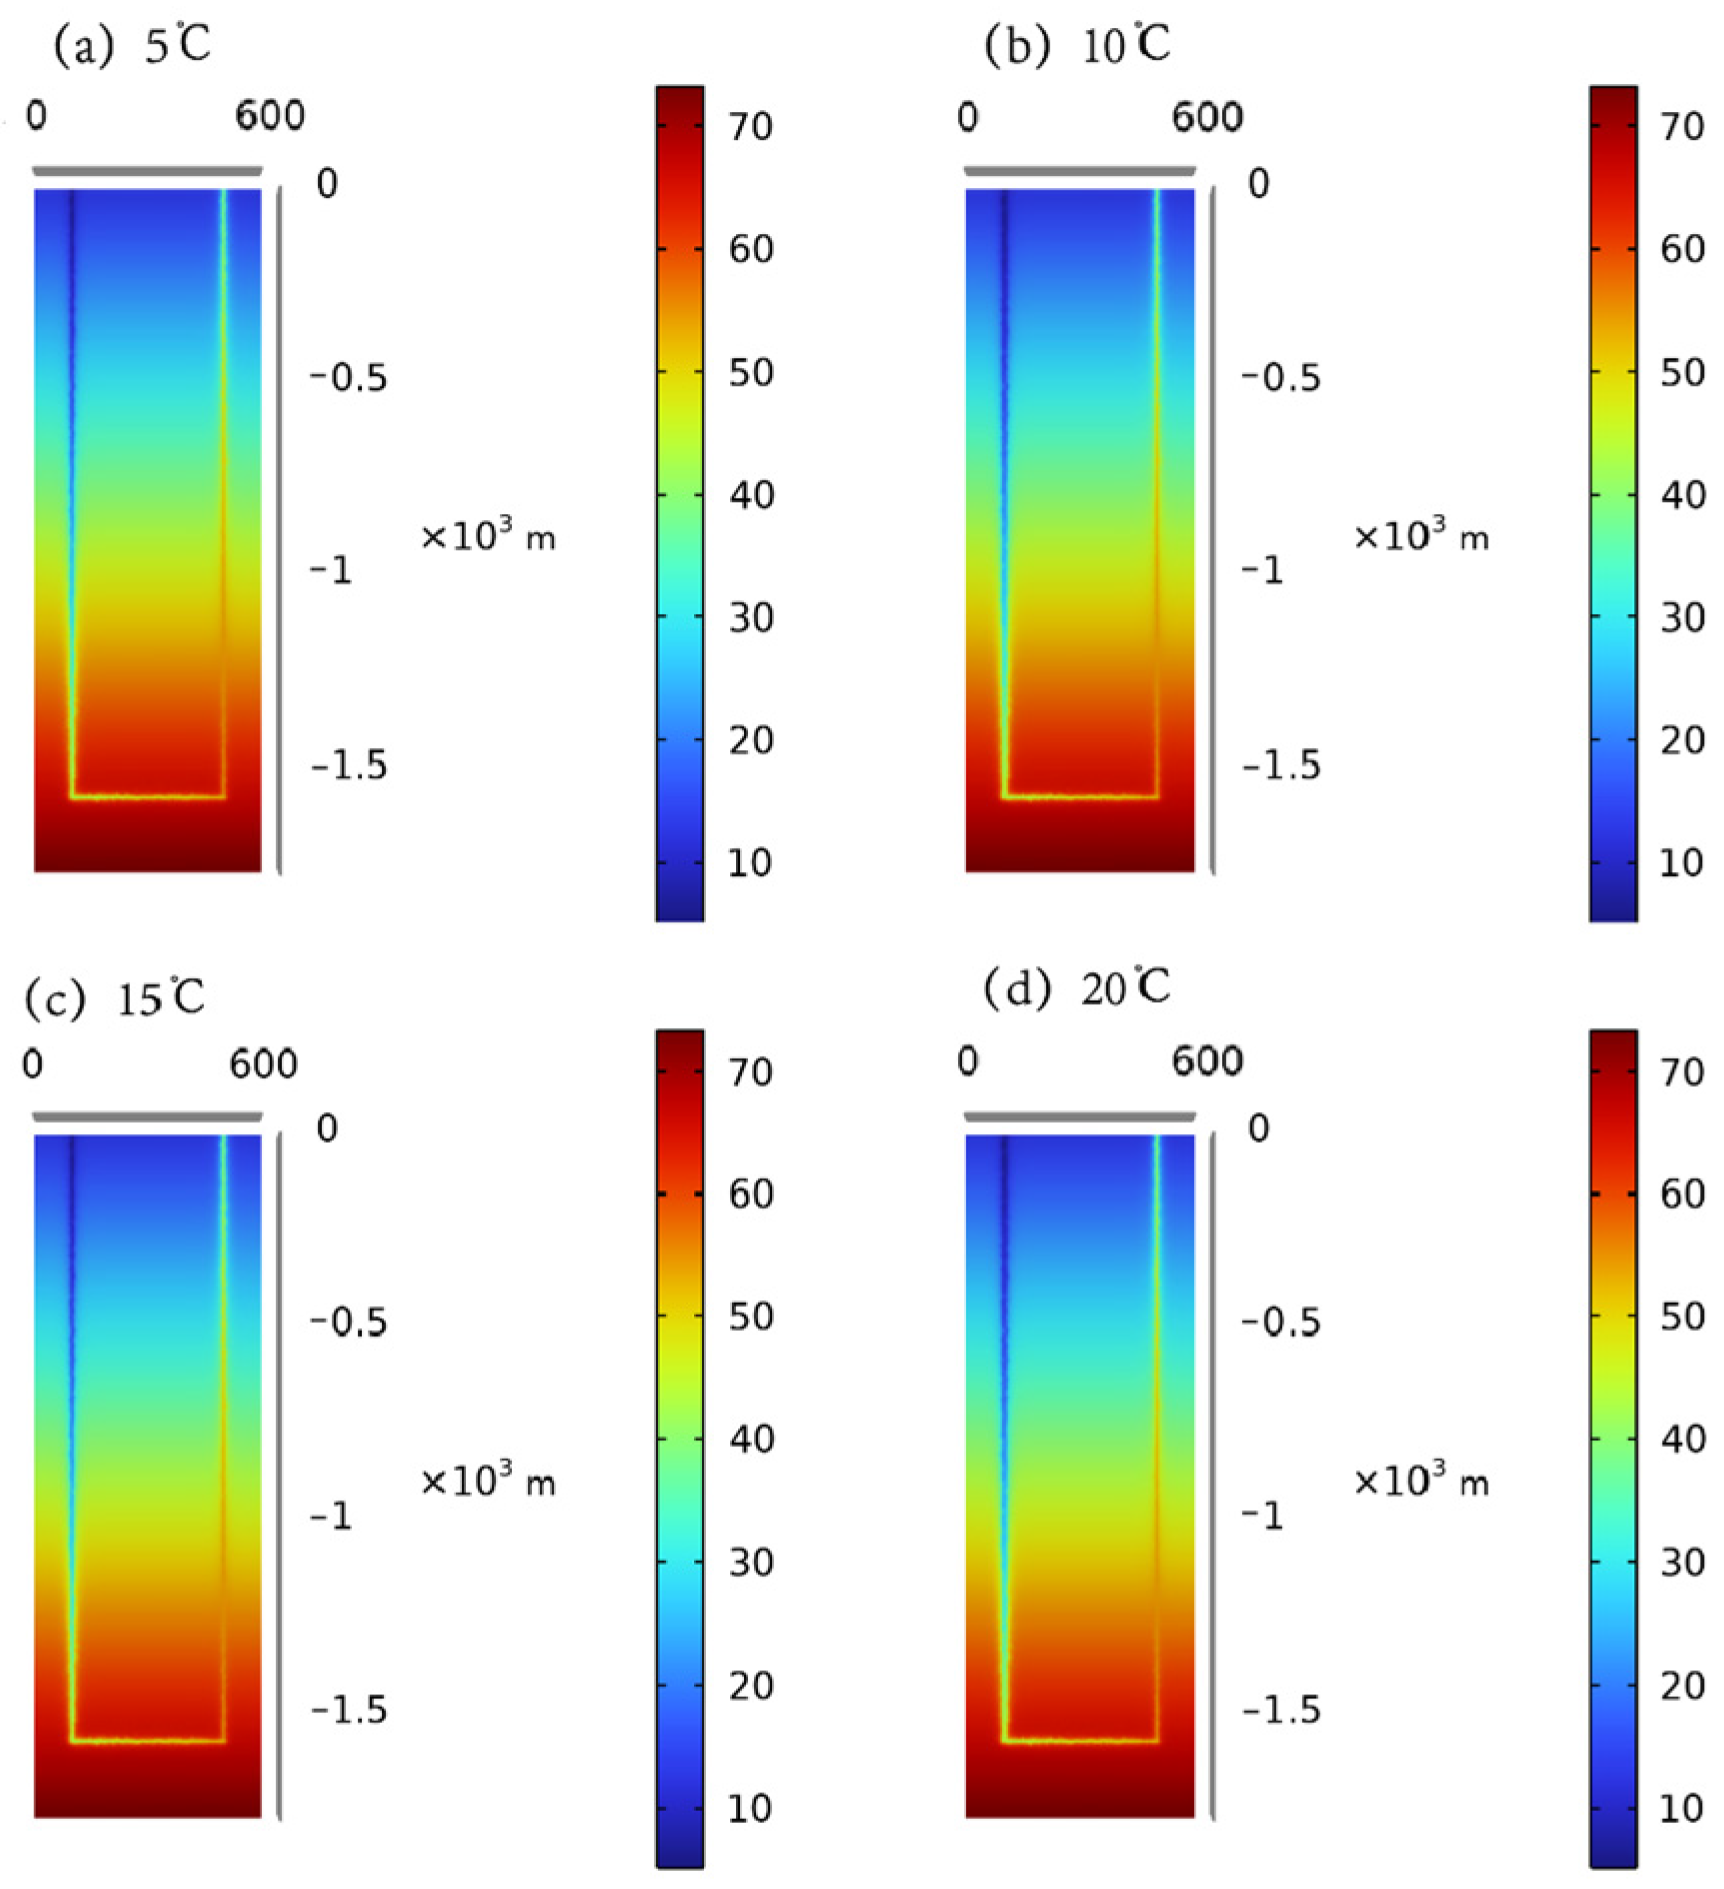
Figure 15 displays cross-section temperature profiles of the numerical model with CO2 as the working fluid after 40 years of operation under different injection temperatures. By comparing the geothermal fields at injection temperatures of 5 °C (Figure 15a) and 20 °C (Figure 15d), it can be found that the change in CO2 injection temperature exerts little influence on the geothermal field, and the geothermal field distribution is basically identical after 40 years of operation.
The underlying reason lies in the steady-state circulation characteristics of closed-loop systems and the essential thermophysical differences between CO2 and water. Under stable circulating conditions of injection pressure, flow rate and cycle length, CO2 achieves a rapid response to minor fluctuations in injection temperature and only produces short-term transient temperature oscillations in the system, without a permanent offset in long-term outlet temperature. In contrast, water has a slower thermal response due to its thermophysical properties, and the temperature difference induced by variable injection temperature cannot be eliminated fully during wellbore heat exchange, resulting in remarkable fluctuations in outlet fluid temperature.

5.2. Influence of Injection Mass Flow Rate on Heat Extraction Performance

5.2.1. Simulation Scheme

The numerical model established in Section 3.1 is adopted, with CO2 taken as the working fluid to study the influence of injection flow rate on the long-term heat production capacity of closed-loop geothermal systems. All simulation settings are consistent with Section 5.1.1 to ensure comparability of results between the two working fluids: the injection temperature is fixed at 5 °C; the simulation operation time is 40 years; and the injection flow rates are set as 6 kg/s, 8 kg/s, 10 kg/s and 12 kg/s.

5.2.2. Comparative Analysis of Production Temperature and Heat Extraction Power

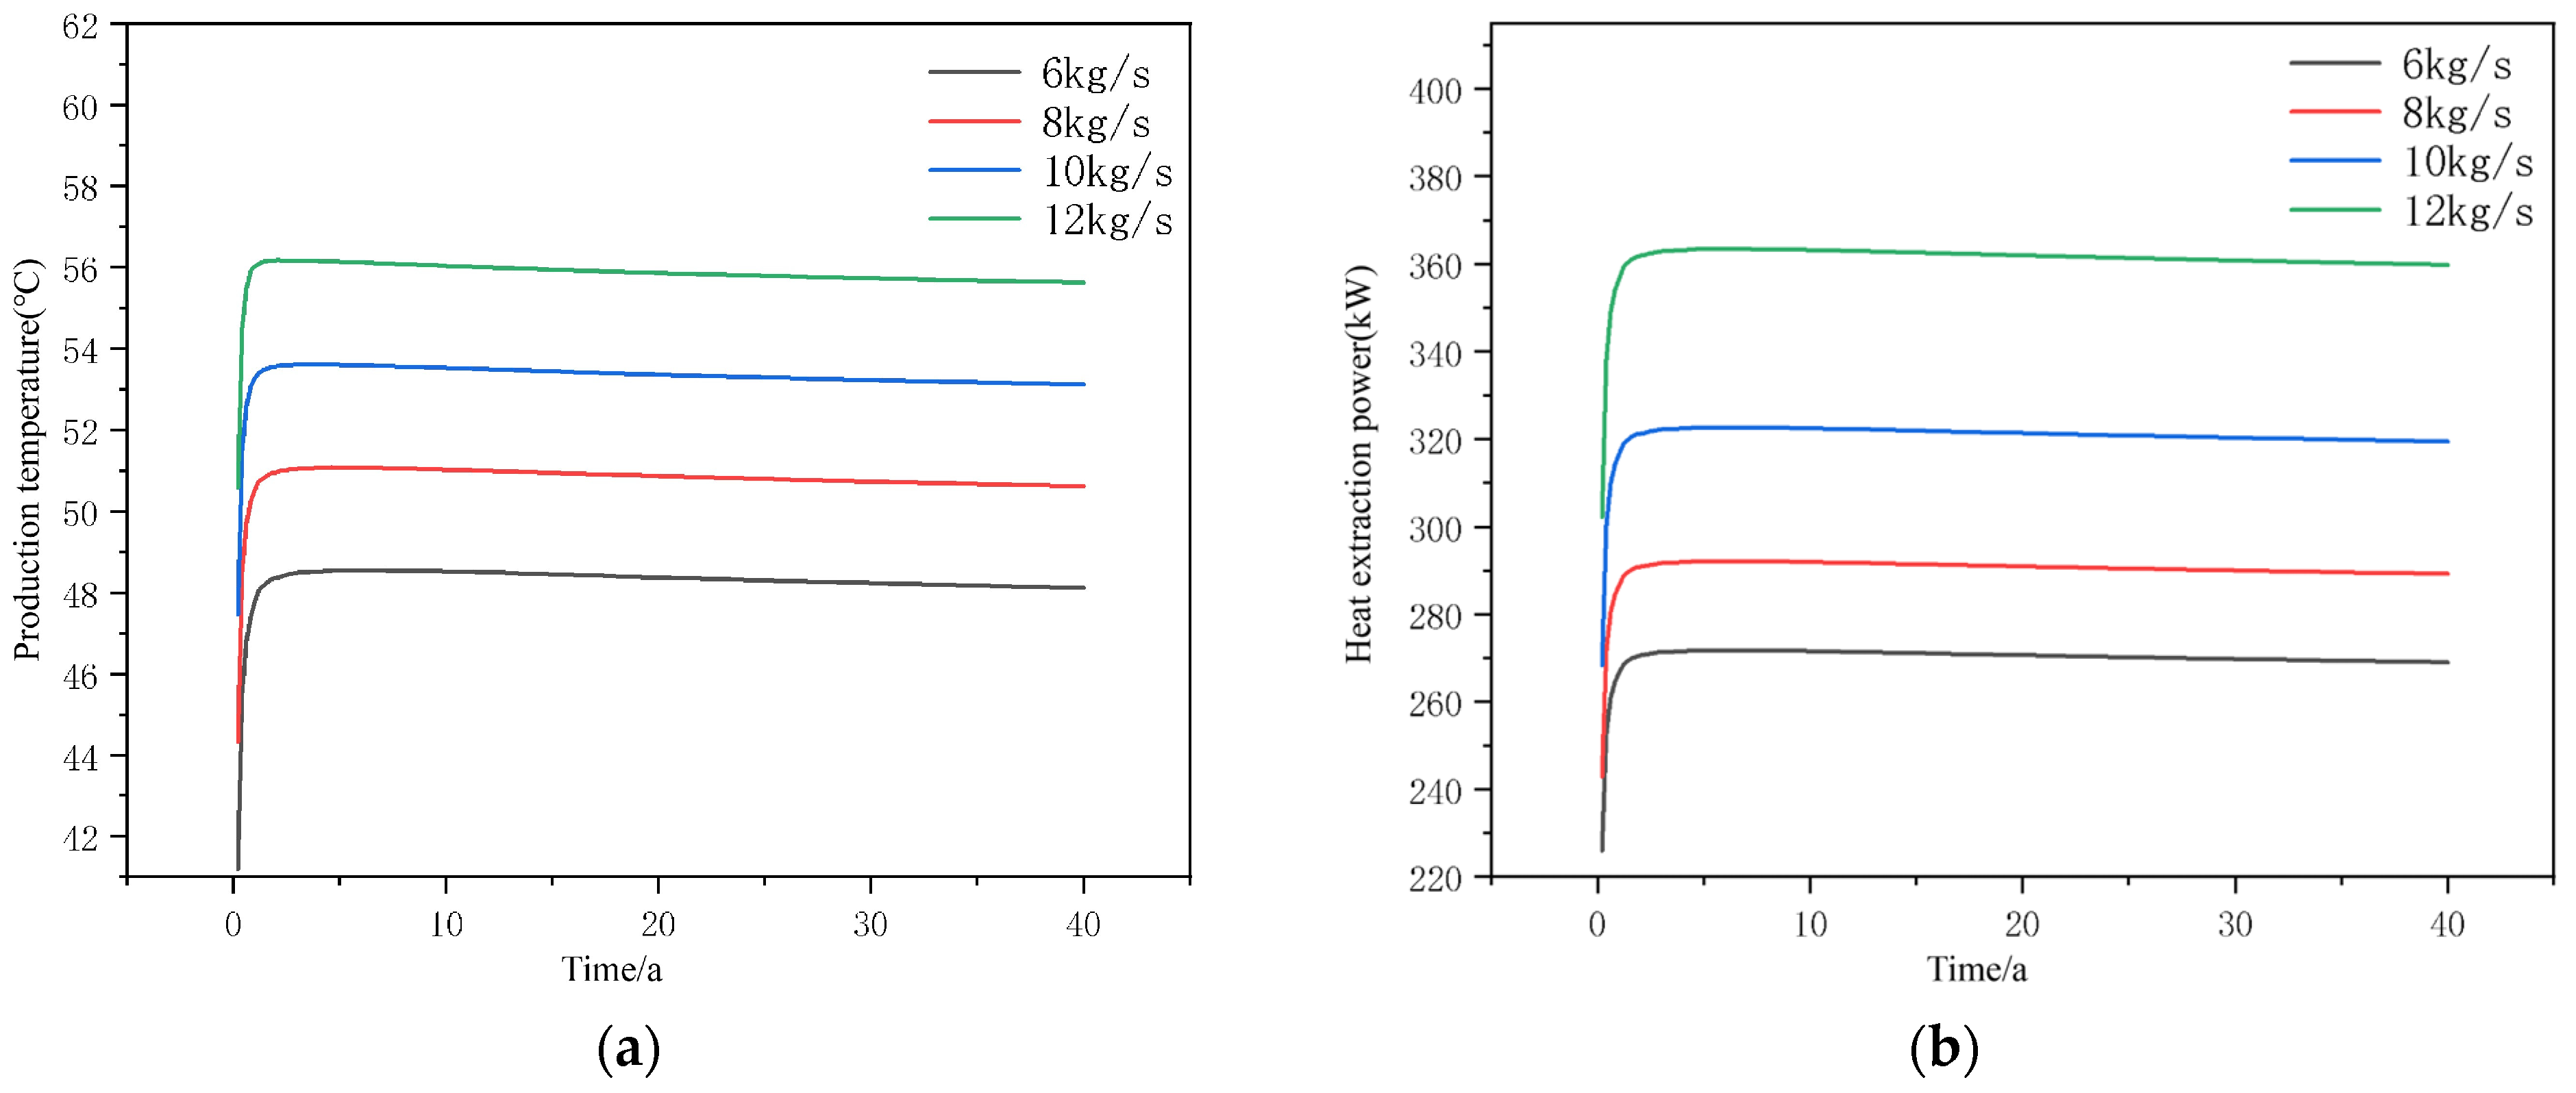
Figure 16 presents the curves of outlet fluid temperature and heat extraction power of the system operating for 40 years with CO2 as the working fluid. The simulation results show that when the injection temperature is fixed, the total heat extraction power of the closed-loop geothermal system rises with the increased injection flow rate, which is consistent with the rule for a water working fluid.
Nevertheless, the outlet fluid temperature of CO2 rises with the growth of injection flow rate, which is completely opposite to the trend of water (outlet temperature decreases as flow rate increases). The intrinsic mechanism is that the rise in the CO2 injection flow rate shortens its upward migration time in the production well, reduces heat loss to surrounding strata during transit, and consequently raises the outlet fluid temperature. When the injection flow rate of CO2 increases from 6 kg/s to 12 kg/s, the outlet temperature after 40 years of operation rises by 7.51 °C. Under the condition of 5 °C injection temperature, the heat extraction power of CO2 at 12 kg/s reaches 359.53 kW, slightly higher than the heat output of water at 6 kg/s. It can be concluded that under the geological and operational parameters of the study site, CO2 can realize superior heat extraction performance only when its injection flow rate is at least twice that of water.

5.2.3. Analysis of Reservoir Geothermal Field Variation

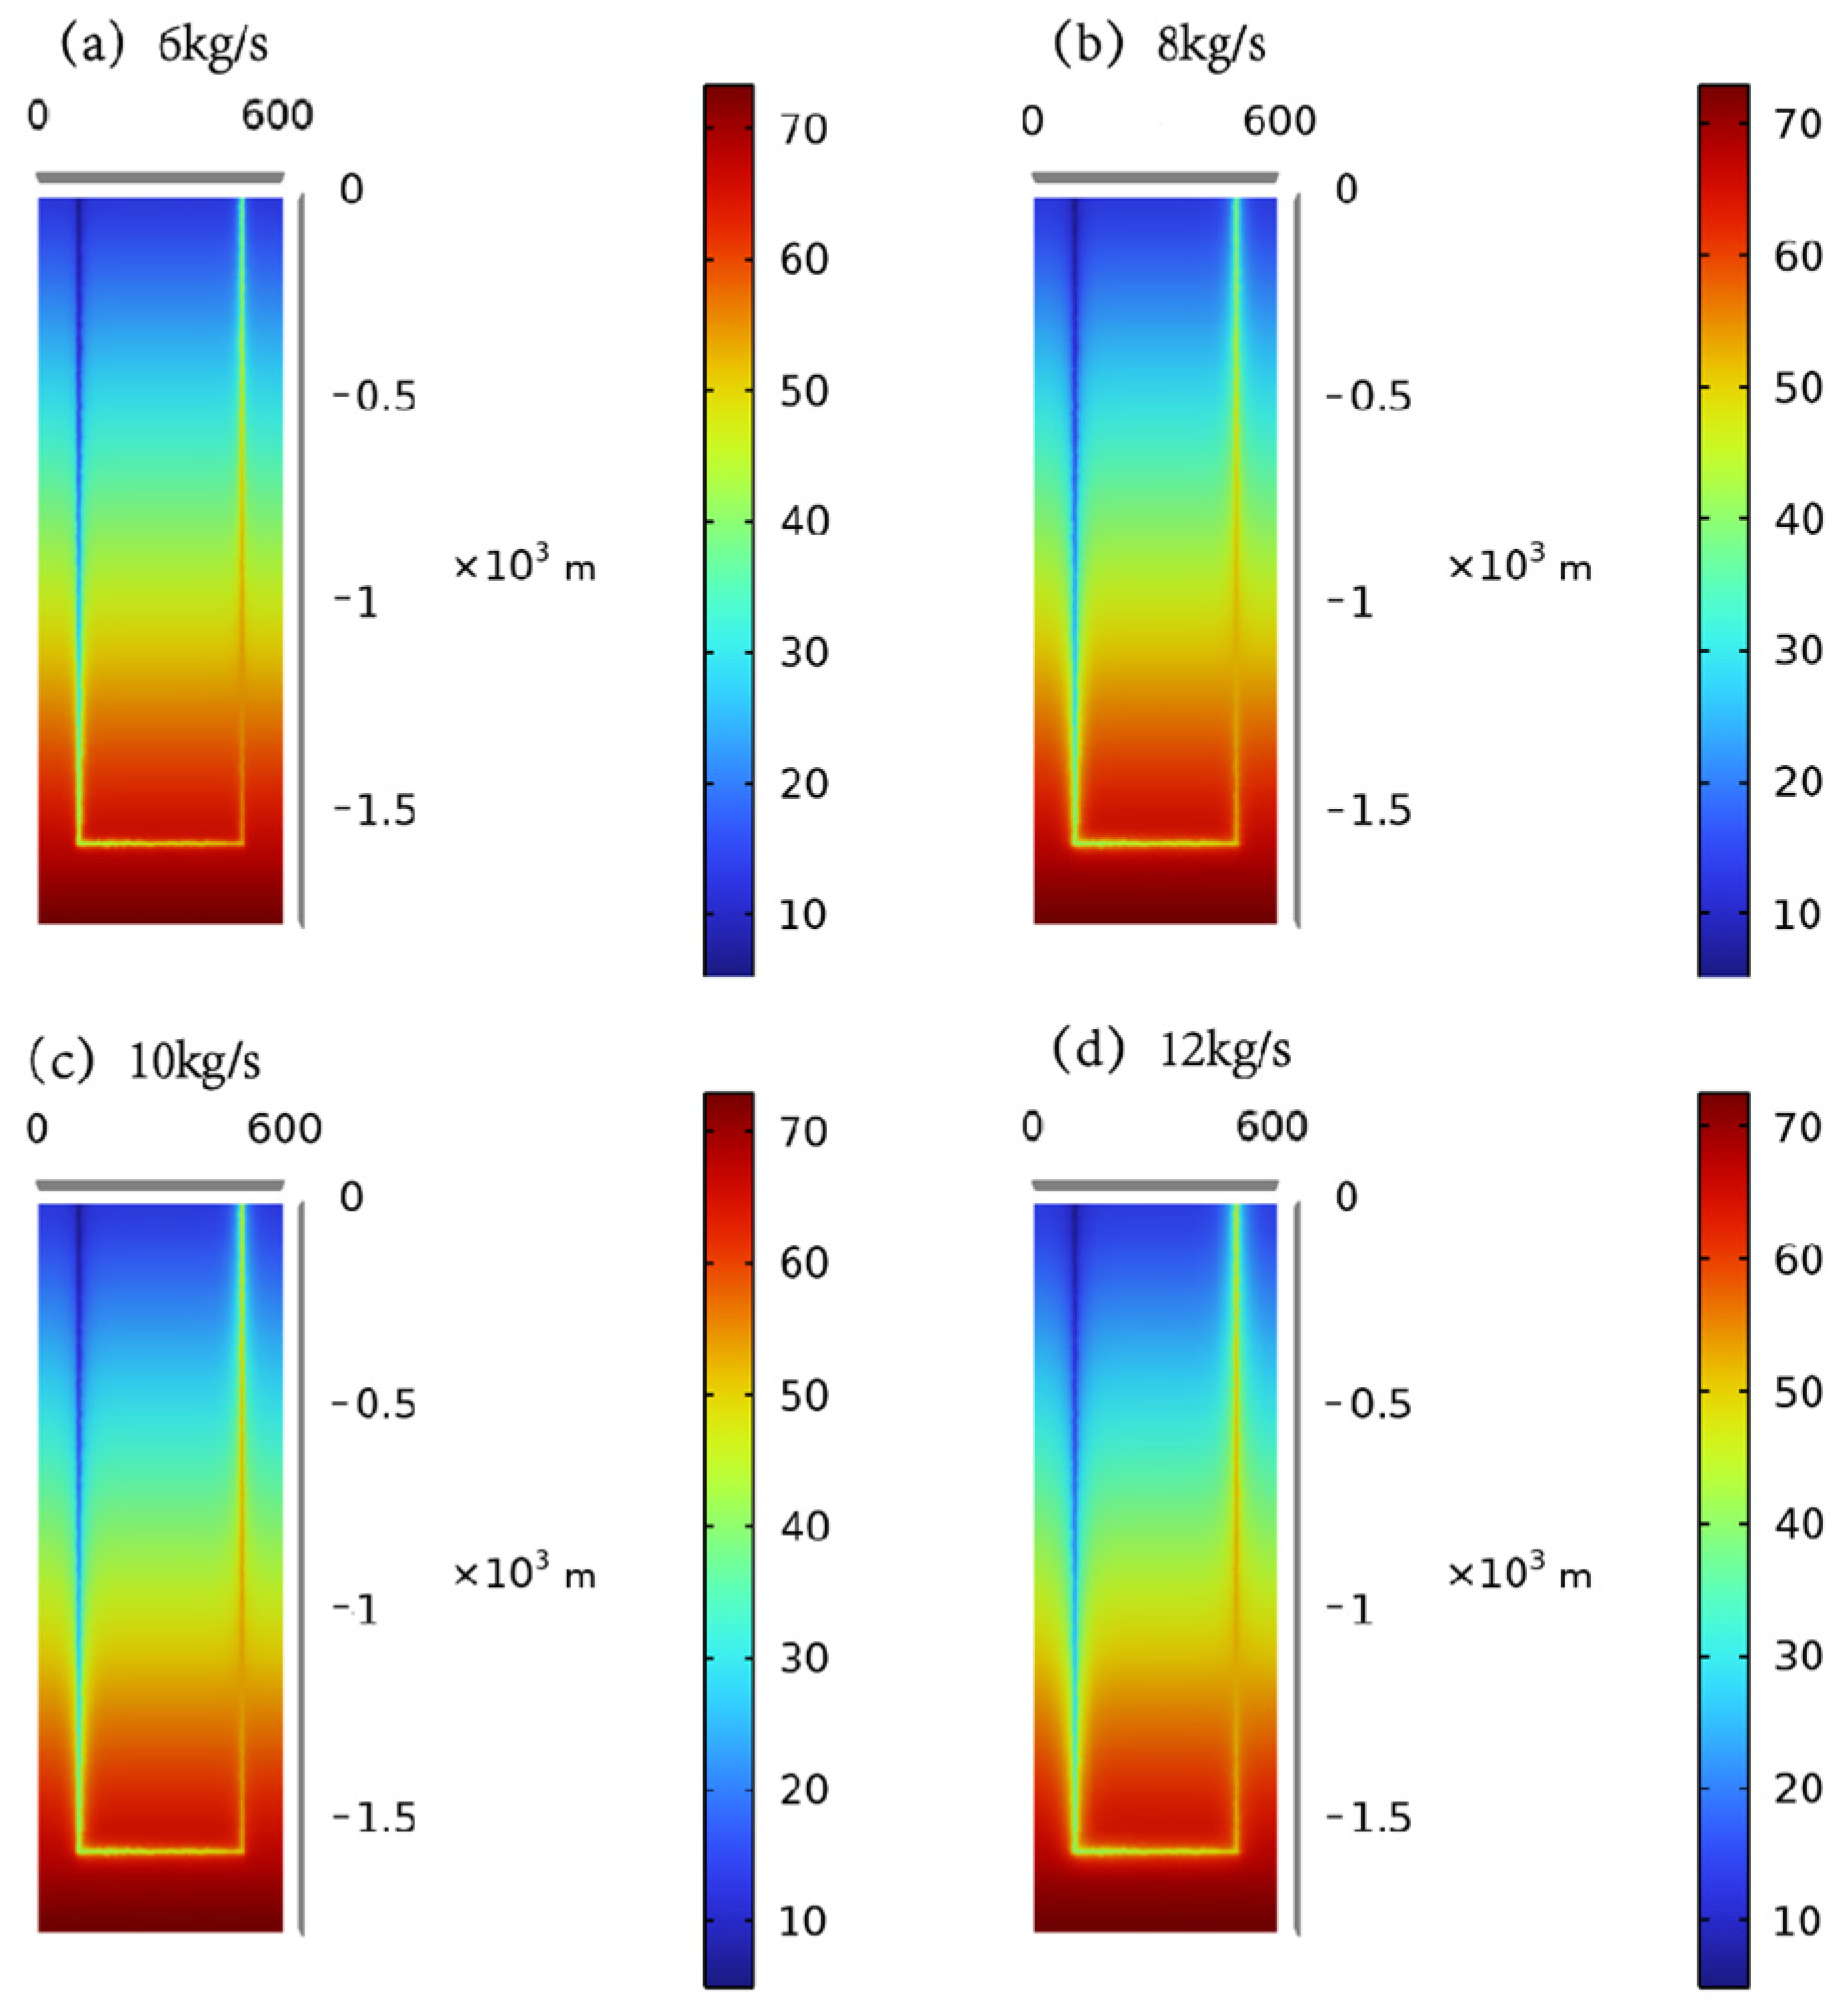
Figure 17 shows cross-section geothermal profiles of the model with CO2 as the working fluid after 40 years of operation under different injection flow rates. The injection flow rate of CO2 not only affects the thermal output of the system, but also produces distinctive evolution rules for reservoir geothermal fields. The higher the injection flow rate, the wider the range of reservoir disturbance and the more significant the overall temperature drop. When the flow rate reaches 12 kg/s (Figure 17d), the area of the low-temperature zone and the temperature reduction amplitude of the core reservoir are obviously larger than those under the 6 kg/s (Figure 17a) working condition, which is attributed to the enhanced convective heat transfer between CO2 and reservoir rock under high flow velocity, accelerating heat extraction from strata.
More prominently, CO2 causes zonal disturbance to the geothermal field. The reservoir temperature around injection wells and horizontal segments decreases significantly, while the temperature near production wells rises as flow rate increases, forming an asymmetric distribution pattern of “temperature drop at injection end and temperature rise at production end”. This feature is fundamentally different from water, which induces uniform temperature attenuation over the whole reservoir area. The low viscosity and high diffusivity of CO2 lead to uneven flow distribution under high velocity: a large amount of heat is carried away at the injection section, while massive accumulated heat is transported to the production well area, warming surrounding rock masses. In contrast, water has higher viscosity and uniform heat exchange, resulting in synchronous temperature decline across all well-surrounding strata.

5.3. Influence of Wellbore Type on Heat Extraction Performance

5.3.1. Simulation Scheme

The modified branched well numerical model from Section 4.3 is adopted, with CO2 as the heat extraction working fluid to analyze the influence of wellbore type on long-term heat production capacity. All operational parameters are kept identical for the two well types: injection temperature 5 °C, injection flow rate 6 kg/s, simulation operation time 40 years.

5.3.2. Comparative Analysis of Production Temperature and Heat Extraction Power

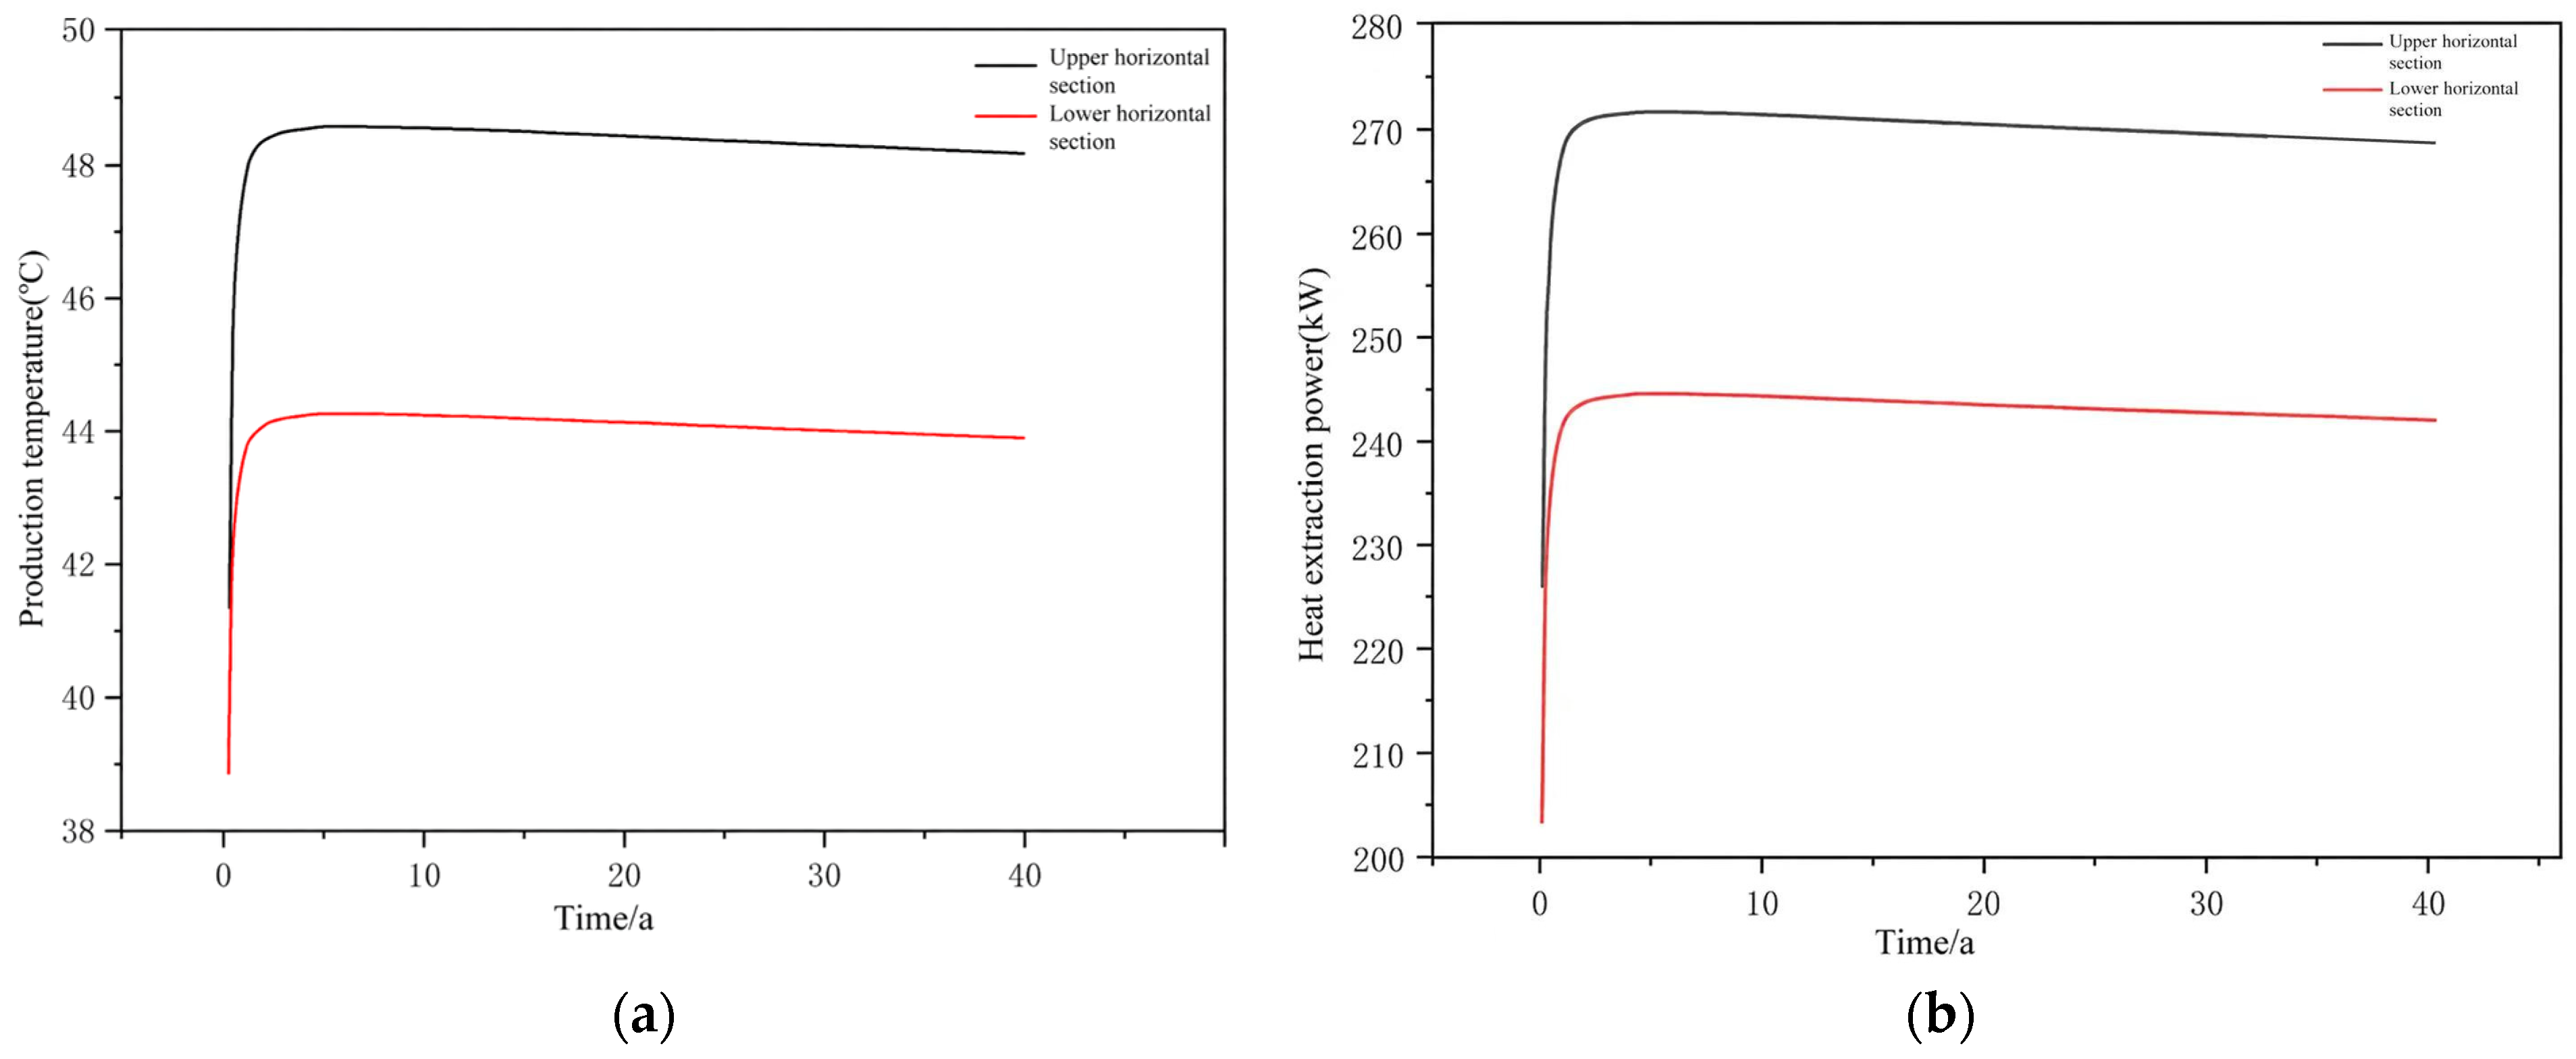
Figure 18 compares outlet fluid temperature and heat extraction power of connected wells and branched wells with CO2 as the working fluid after 40 years of operation. Under identical injection temperature and flow rate, connected wells deliver superior outlet temperature and heat extraction performance compared with branched wells when circulating CO2, which is the reverse of the matching rule for a water working fluid. Quantitatively, after 40 years of operation, the outlet fluid temperature of CO2 in branched wells is 43.75 °C, 4.37 °C lower than that in CO2-connected wells. This performance discrepancy directly confirms the poor compatibility between branched wells and the CO2 working fluid. For additional context, the heat extraction power of CO2 in branched wells is also only 90% of that of water in connected wells under the same operating conditions.
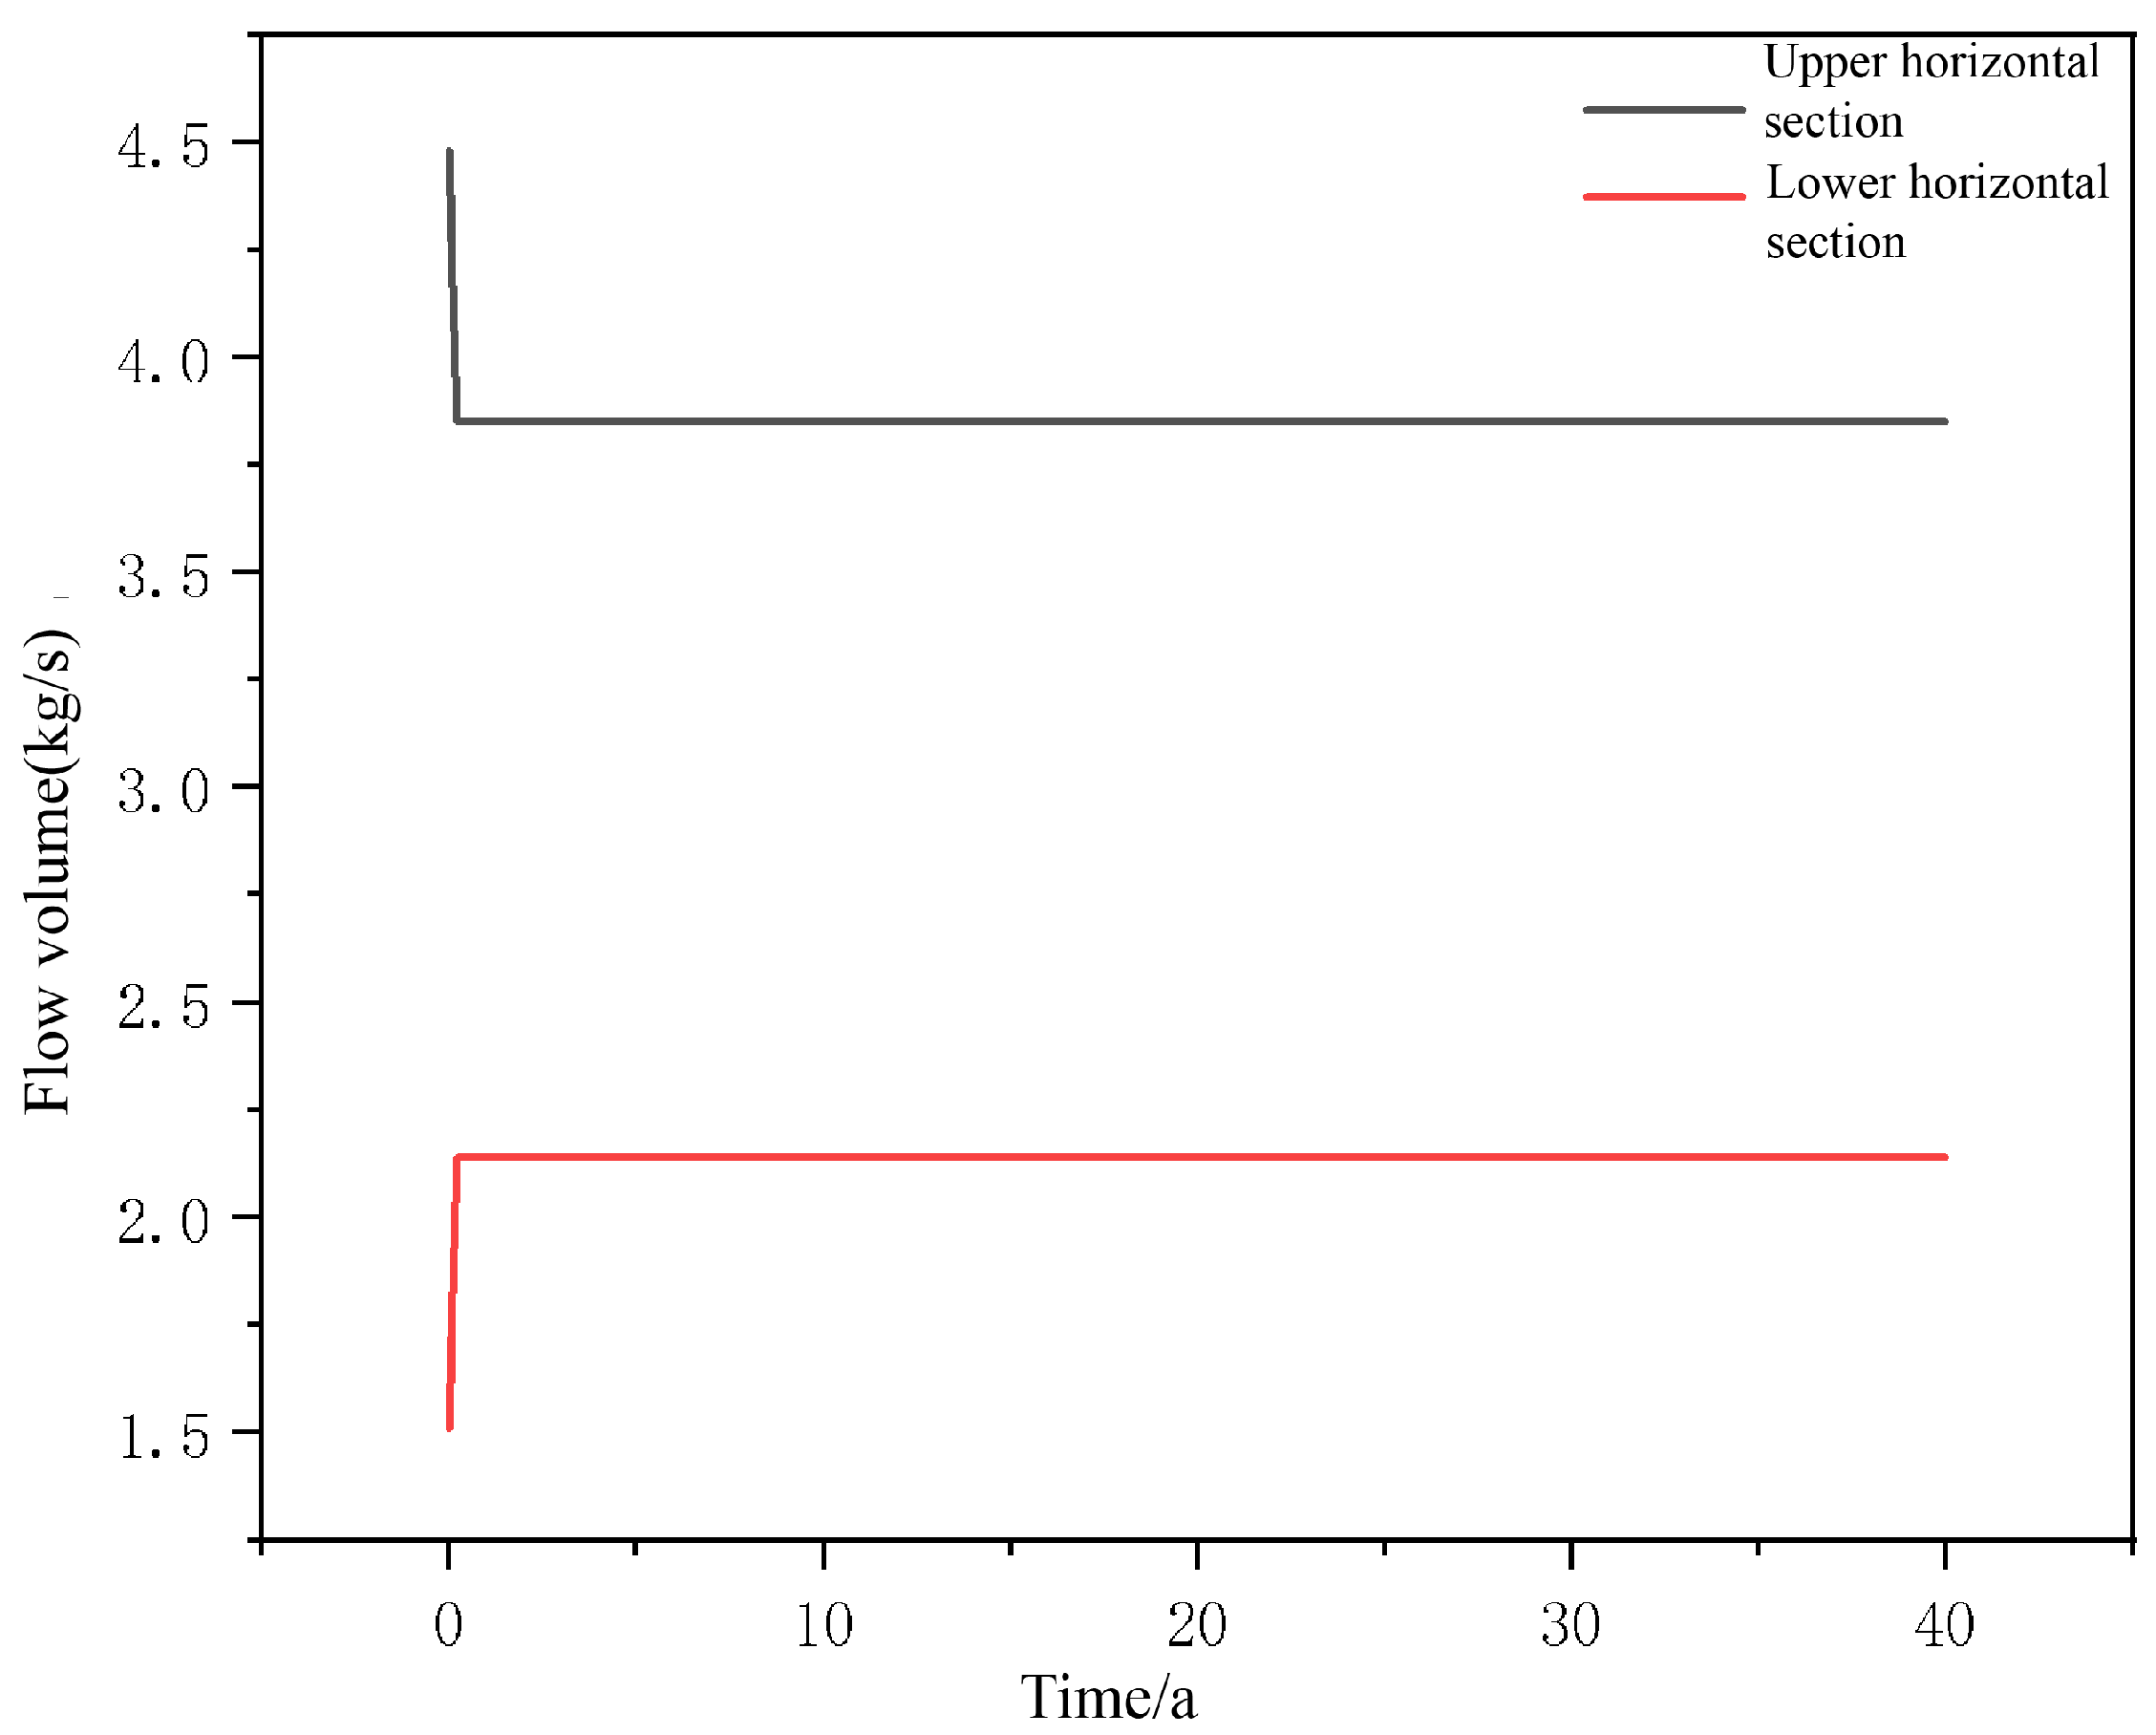
Figure 19 illustrates the flow distribution of CO2 in branched wells under a total injection flow rate of 6 kg/s: the flow rate in the upper shallow horizontal segment is 3.85 kg/s, while the lower deep horizontal segment only carries 2.15 kg/s, forming an uneven flow pattern with more fluid in the upper parts and less in the lower parts. Stratum temperature increases with burial depth, and deep reservoirs contain abundant geothermal resources. However, CO2 preferentially flows into shallow low-temperature sections, failing to fully utilize high-temperature deep strata and leading to low overall heat extraction efficiency. This contrasts with Shi et al. [30], who modeled a multilateral-well CO2-enhanced geothermal system (EGS) and found that multi-branch designs improved heat extraction by increasing reservoir contact area. The difference arises because their system is a fractured EGS where CO2 flows through the reservoir itself, so branching enhances sweep; in the present sealed closed-loop system, branching only adds conductive pipe area without direct fluid–rock contact, explaining the reversed matching behavior.
Therefore, connected wells are the preferred well type for CO2 exploitation under the geological and operational parameters of the study site. This is because, under the near-critical conditions considered, a small temperature difference induces a large density contrast in CO2 (on the order of hundreds of kg/m3), making buoyancy forces comparable to or exceeding the imposed pressure-gradient forces—a behavior well documented for supercritical CO2 in U-shaped wells [31].

5.3.3. Analysis of Reservoir Geothermal Field Variation

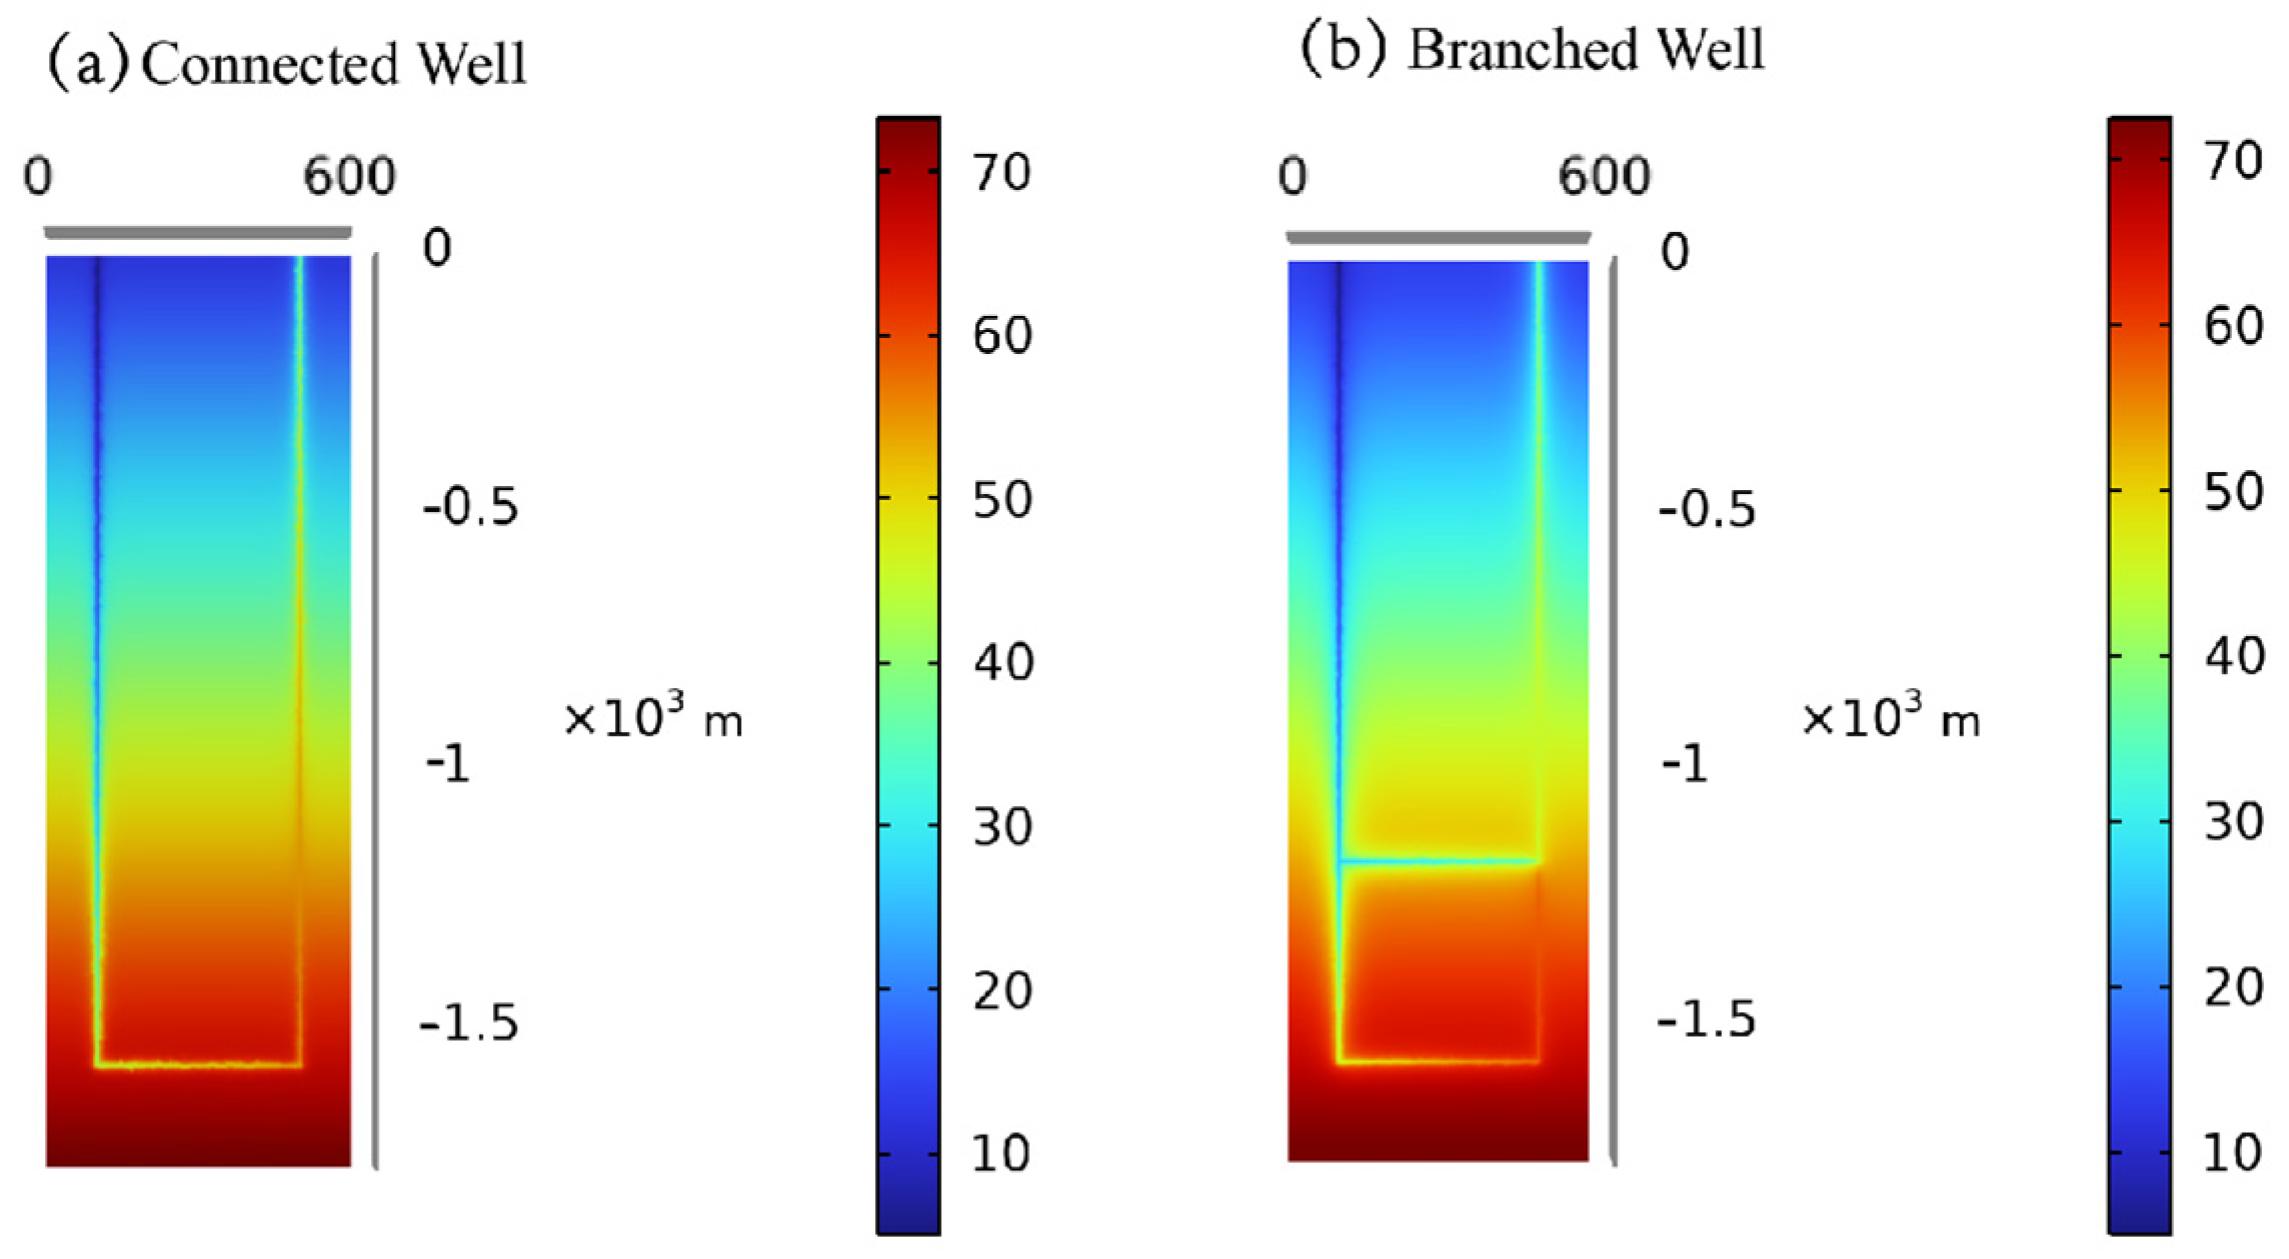
Figure 20 presents reservoir temperature contours of CO2 circulating in connected wells versus branched wells after 40 years of operation. CO2 exploitation via branched wells disturbs a much smaller geothermal area compared to connected wells, which again contrasts with water’s thermal disturbance characteristics.
The root cause lies in CO2’s extreme sensitivity to temperature and pressure variations, which generates strong buoyancy effects along vertical wellbore temperature gradients. When CO2 flows down to the branch junction, buoyancy dominates fluid distribution over pressure gradients, diverting most fluid into the upper shallow horizontal channel with lower flow resistance; only a small volume of CO2 overcomes buoyancy and enters deep high-temperature segments. The multi-branched structure amplifies this flow imbalance, resulting in excessive heat exchange in shallow strata and underutilization of deep geothermal resources. Single-channel connected wells constrain CO2’s flow path, mitigating buoyancy-induced bias and maximizing the utilization of deep hot reservoirs.

5.4. Limitations

The current work is subject to several limitations that should be noted. The four lithologies in Table 1 are assigned isotropic and homogeneous properties, thereby excluding reservoir heterogeneity and anisotropy present in actual formations. Regarding geochemical aspects, the wellbore wall is defined as a water-isolating and heat-conducting boundary in Section 3.2, so the circulating fluids remain confined within the pipe and do not directly react with the quartz–feldspar sandstone containing argillaceous and calcareous cement; however, this closed-loop setup omits potential long-term geochemical interactions, while studies like Cui et al. [32] have demonstrated that CO2–water–rock reactions can precipitate minerals and reduce porosity and heat-mining rate in sandstone reservoirs if contact occurs. Moreover, the comparison between water and CO2 is exclusively thermal, with no economic evaluation of cost factors such as CO2 supply and makeup, higher-pressure well completion, or corrosion-resistant materials that ultimately influence fluid selection; Yu et al. [33] recently performed a thermo-economic analysis of coaxial closed-loop systems using these fluids, which highlights the financial implications that the present thermal-only results—such as CO2 needing about twice the flow rate of water for equivalent output—do not address. Lastly, the model is validated through cross-validation against the T2Well/ECO2N simulator rather than against field-measured U-tube data, which leaves a certain distance from real engineering conditions.

6. Conclusions

Taking sandstone geothermal reservoirs in the Northwestern Shandong Depression as the research background, this study comparatively analyzes the heat transfer performance of CO2 and water in closed-loop geothermal systems via coupled numerical simulation. The key findings regarding the influence mechanisms of injection parameters, wellbore matching, and geothermal field evolution are summarized as follows:
  • Distinct parameter sensitivities. For water, production temperature is positively correlated with injection temperature but negatively correlated with mass flow rate, governed by the heat transfer driving force and fluid residence time. In contrast, CO2 exhibits extremely low sensitivity to injection temperature variations, with its heat extraction power decreasing by only 1.5 kW when the injection temperature rises from 5 °C to 20 °C, indicating superior operational stability.
  • Inverse matching preferences. Branched wells are optimal for water, increasing average production temperature by 5.56% and heat extraction power by 7.64% compared to connected wells, while effectively delaying reservoir thermal depletion. Conversely, connected wells are better suited for CO2, as buoyancy effects in branched wells cause uneven flow distribution, preventing the full utilization of deep high-temperature reservoirs.
  • Performance compensation requirement. Under identical flow rates, CO2’s heat extraction power is only 80% of water’s due to its lower specific heat capacity. Equivalent heat yield can be achieved only when the CO2 injection flow rate is doubled (e.g., reaching 359.53 kW at 12 kg/s), compensating for its thermodynamic limitations in medium–low temperature reservoirs (≤75 °C). It should be noted that this elevated flow rate requirement for CO2 entails practical challenges including higher pumping energy consumption, stricter downhole phase control for supercritical CO2, and increased operation and maintenance costs, which will be addressed in our future engineering-focused follow-up studies.
  • Differentiated geothermal field evolution. Water induces a homogeneous thermal attenuation across the reservoir, where lower injection temperatures and higher flow rates expand the disturbance range. CO2, however, creates a zonal disturbance characterized by an asymmetric pattern of “cooled injection zone and heated production zone” under high flow rates, differing fundamentally from the uniform decline observed with water.
Future research should focus on extending these comparisons to high-temperature hot dry rock reservoirs and exploring mixed working fluid strategies to broaden the technical applicability of closed-loop geothermal development.

Author Contributions

Conceptualization, Z.Z. and Y.C.; methodology, Z.Z. and Y.Y.; validation, J.Y., H.L. and Y.Y.; formal analysis, S.L. and J.Y.; investigation, Z.L.; data curation, S.L.; writing—original draft preparation, Z.Z. and Z.L.; writing—review and editing, H.L. and Y.C. All authors have read and agreed to the published version of the manuscript.

Funding

This research was funded by the Key R&D Program of Shandong Province, China (2026CXGC010306).

Data Availability Statement

The original data presented in the study are included in the article. Further inquiries can be directed to the corresponding author.

Conflicts of Interest

The authors declare no conflicts of interest.

References

  1. Zhang, H.; Li, Y.; Ding, T.; Shao, S.; Feng, Y. Cascade and effective utilization of medium and deep geothermal energy: A comprehensive review and application prospects. Energy 2025, 326, 136–219. [Google Scholar] [CrossRef] [Scilit]
  2. Zargartalebi, M.; Darzi, A.; Kazemi, A.; Sinton, D. Closed-loop geothermal system is a potential source of low-carbon renewable energy. Commun. Earth Environ. 2025, 6, 812. [Google Scholar] [CrossRef] [Scilit] [PubMed]
  3. Liu, S.; Taleghani, A. Closed-loop geothermal systems: Critical review of technologies, performance enhancement, and emerging solutions. Renew. Sustain. Energy Rev. 2026, 225, 116–177. [Google Scholar] [CrossRef] [Scilit]
  4. Roohidehkordi, I.; Krol, M. Applicability of ground source heat pumps as a bioremediation-enhancing technology for monoaromatic hydrocarbon contaminants. Sci. Total Environ. 2021, 778, 146–235. [Google Scholar] [CrossRef] [Scilit] [PubMed]
  5. Liu, Z.; Xu, K.; Zhang, Q.; Yang, M. Numerical Simulation on the Heat Recovery Law of Exploiting Geothermal Energy from a Closed-Loop Geothermal System Converted from an Abandoned Five-Spot Well Pattern. ACS Omega 2022, 7, 41723–41731. [Google Scholar] [CrossRef] [Scilit] [PubMed]
  6. Gascuel, V.; Rivard, C.; Raymond, J. Deep geothermal doublets versus deep borehole heat exchangers: A comparative study for cold sedimentary basins. Appl. Energy 2024, 361, 122826. [Google Scholar] [CrossRef] [Scilit]
  7. Tangirala, S.; Vilarrasa, V. On the limitations of closed-loop geothermal systems for electricity generation outside high-geothermal gradient fields. Commun. Eng. 2025, 4, 116. [Google Scholar] [CrossRef] [Scilit] [PubMed]
  8. Nakevska, N.; Schincariol, R.; Dehkordi, S.; Cheadle, B. Geothermal waste heat utilization from in situ thermal bitumen recovery operations. Ground Water 2015, 53, 251–260. [Google Scholar] [CrossRef] [Scilit] [PubMed]
  9. Aliakbari, M.; Pak, A. Geomechanical performance of a novel L-shaped wellbore design for hot dry rock geothermal reservoirs: Insights from fully coupled thermo-hydro-mechanical modeling. Sci. Rep. 2026, 16, 19679. [Google Scholar] [CrossRef] [Scilit] [PubMed]
  10. Wu, X.; Li, P.; Cai, M.; Jiang, T.; Mu, B.; Su, W.; Wang, M.; Li, C. Material Behavior and Computational Validation of Deep CO2 Closed-Loop Geothermal Systems in Carbonate Reservoirs. Materials 2025, 18, 5144. [Google Scholar] [CrossRef] [Scilit] [PubMed]
  11. Hu, Z.; Xu, T.; Feng, B.; Yuan, Y.; Li, F.; Feng, G.; Jiang, Z. Thermal and fluid processes in a closed-loop geothermal system using CO2 as a working fluid. Renew. Energy 2020, 154, 351–367. [Google Scholar] [CrossRef] [Scilit]
  12. Brown, D.W. A Hot Dry Rock Geothermal Energy Concept Utilizing Supercritical CO2 Instead of Water. In Proceedings of the Twenty-Fifth Workshop on Geothermal Reservoir Engineering, Stanford, CA, USA, 24–26 January 2000; pp. 233–238. [Google Scholar]
  13. Pruess, K.; Muller, N. Formation dry-out from CO2 injection into saline aquifers: 1. Effects of solids precipitation and their mitigation. Water Resour. Res. 2009, 45, W03402. [Google Scholar] [CrossRef] [Scilit]
  14. Kujawa, T.; Nowak, W.; Stachel, A. Utilization of existing deep geological wells for acquisitions of geothermal energy. Energy 2006, 31, 650–664. [Google Scholar] [CrossRef] [Scilit]
  15. Luo, Y.; Guo, H.; Meggers, F.; Zhang, L. Deep coaxial borehole heat exchanger: Analytical modeling and thermal analysis. Energy 2019, 185, 1298–1313. [Google Scholar] [CrossRef] [Scilit]
  16. Pan, A.; Lu, L.; Cui, P.; Jia, L. A new analytical heat transfer model for deep borehole heat exchangers with coaxial tubes. Int. J. Heat Mass Transf. 2019, 141, 1056–1065. [Google Scholar] [CrossRef] [Scilit]
  17. Diersch, H.; Bauer, D.; Heidemann, W.; Ruhaak, W.; Schatzl, P. Finite element modeling of borehole heat exchanger systems: Part 1. Fundamentals. Comput. Geosci. 2011, 37, 1122–1135. [Google Scholar] [CrossRef] [Scilit]
  18. Zanchini, E.; Lazzari, S.; Priarone, A. Improving the thermal performance of coaxial borehole heat exchangers. Energy 2010, 35, 657–666. [Google Scholar] [CrossRef] [Scilit]
  19. Zhao, H. Economic development of Dezhou city from the perspective of spatial location. China Mark. 2008, 13, 27–28. [Google Scholar]
  20. Ji, H.; Yang, Y.; Zhang, Y.; Liu, S.; Zhu, Z. Quaternary sedimentary characteristics and land subsidence model in North Shandong Plain. Acta Geol. Sin. 2019, 93, 241–250. [Google Scholar]
  21. Feng, B.J.; Yang, J.; Zhao, Y.; Yang, H.; Tian, G.; Feng, Y.Y. Study on Porosity and Permeability Characteristics of Sandstone Geothermal Reservoir Under Recharge Conditions: A Case Study of Decheng District, Shandong Province. Energies 2025, 18, 6060. [Google Scholar] [CrossRef] [Scilit]
  22. Chen, Z.; Zhao, F. Research on the Current Development Status and Strategies of the Renewable Energy Industry in Shandong Province. Energy Res. Manag. 2025, 17, 174–181. [Google Scholar]
  23. Qin, Y.; Zhang, P. Development and Utilization of Geothermal Resources in the Middle and Deep Layers of Shandong Province. Shandong Land. Resour. 2018, 34, 93–98. [Google Scholar]
  24. Meng, X.; Wang, Q.; Yang, P. Investigation and Problem Analysis on Development and Utilization of Geothermal Resources in Shandong Province. Shandong Land. Resour. 2021, 37, 36–42. [Google Scholar]
  25. Kang, F.; Zheng, T.; Shi, M.; Sui, H.; Xu, M.; Jiang, H.; Zhong, Z.; Qin, P.; Zhang, B.; Zhao, J.; et al. Occurrence rules and enrichment mechanism of geothermal resources in Shandong Province. Earth Sci. Front. 2024, 31, 67–94. [Google Scholar]
  26. Meng, M.; Ji, X.; Liu, P.; Ma, Y.; Jiang, Y.; Li, X.; Du, Y.; Feng, K.; Li, X. Characteristics of Geothermal Reservoir and Fluid Chemical Characteristics of Guantao Formation in Northwestern Shandong Province. Coal Geol. China 2024, 36, 45–51. [Google Scholar]
  27. Wang, T. Evaluation of Geothermal Resources and Target Selection in Shandong Province. Petrochem. Ind. Technol. 2019, 26, 114–115. [Google Scholar]
  28. Wang, Y.; Liu, G.; Hu, S. Study on Geothermal Resource Zoning in Northern Shandong. North China Geol. 2008, 31, 270–277. [Google Scholar]
  29. Zhang, H.; Li, K.; Jin, X.; Sun, R.; Shao, X.; Liu, B.; Zhang, Y.; Wang, Y. Study on the Distribution Characteristics of Geothermal Gradient in Shandong Province. Shandong Land. Resour. 2023, 39, 57–64. [Google Scholar]
  30. Shi, Y.; Song, X.; Wang, G.; McLennan, J.; Forbes, B.; Li, X.; Li, J. Study on wellbore fluid flow and heat transfer of a multilateral-well CO2 enhanced geothermal system. Appl. Energy 2019, 249, 14–27. [Google Scholar] [CrossRef] [Scilit]
  31. Sun, X.; Wang, Z.; Liao, Y.; Sun, B.; Gao, Y. Geothermal energy production utilizing a U-shaped well in combination with supercritical CO2 circulation. Appl. Therm. Eng. 2019, 151, 523–535. [Google Scholar] [CrossRef] [Scilit]
  32. Cui, G.; Zhu, L.; Li, X. Experimental and numerical study of CO2-water-rock interactions in sandstone and carbonate geothermal reservoirs. J. CO2 Util. 2017, 20, 138–146. [Google Scholar]
  33. Yu, J.; Li, X.; Zhang, Y. Comparative thermo-economic analysis of coaxial closed-loop systems using CO2 and water. Appl. Therm. Eng. 2023, 230, 120710. [Google Scholar] [CrossRef] [Scilit]
Figure 1. Local location map of the study area, adapted from Feng et al. [21].
Energies 19 03956 g001
Figure 2. Map of geothermal gradient and thermal reservoir temperature zoning of the Guantao Formation, adapted from Feng et al. [21].
Energies 19 03956 g002
Figure 3. Mesh generation diagram.
Energies 19 03956 g003
Figure 4. Mesh diagram of T2Well model.
Energies 19 03956 g004
Figure 5. Comparison diagram of model fitting results.
Energies 19 03956 g005
Figure 6. Comparison diagrams of production temperature and heat extraction power under different injection temperatures (water as working fluid). (a) Production temperature curve. (b) Heat extraction power curve.
Energies 19 03956 g006
Figure 7. Geothermal field diagrams with water as working fluid under different injection temperatures.
Energies 19 03956 g007
Figure 8. Comparison curves of production temperature and heat power with water under different injection mass flow rates (water as working fluid). (a) Production temperature curve. (b) Heat extraction power curve.
Energies 19 03956 g008
Figure 9. Geothermal field diagrams with water as working fluid under different injection mass flow rates.
Energies 19 03956 g009
Figure 10. Mesh generation diagram of modified branched well.
Energies 19 03956 g010
Figure 11. Comparison diagrams of production temperature and heat extraction power under different wellbore types (water as working fluid). (a) Production temperature curve. (b) Heat extraction power curve.
Energies 19 03956 g011
Figure 12. Geothermal field diagrams with water as working fluid under different wellbore types.
Energies 19 03956 g012
Figure 13. Flow distribution curve of water in branched wells.
Energies 19 03956 g013
Figure 14. Comparison diagrams of production temperature and heat extraction power under different injection temperatures (CO2 as working fluid). (a) Production temperature curve. (b) Heat extraction power curve.
Energies 19 03956 g014
Figure 15. Geothermal field diagrams with CO2 as working fluid under different injection temperatures.
Energies 19 03956 g015
Figure 16. Comparison curves of production temperature and heat power different injection mass flow rates (CO2 as working fluid). (a) Production temperature curve. (b) Heat extraction power curve.
Energies 19 03956 g016
Figure 17. Geothermal field diagrams with CO2 as working fluid under different injection mass flow rates.
Energies 19 03956 g017
Figure 18. Comparison diagrams of production temperature and heat extraction power under different wellbore types (CO2 as working fluid). (a) Production temperature curve. (b) Heat extraction power curve.
Energies 19 03956 g018
Figure 19. Flow distribution curve of CO2 in branched wells.
Energies 19 03956 g019
Figure 20. Geothermal field diagrams with CO2 as working fluid under different wellbore types.
Energies 19 03956 g020
Table 1. Main physical parameters for simulation.
LithologyDensity
kg/m3
Permeability
×10−12 m2
Thermal Conductivity
W/(m·°C)
Specific Heat Capacity
J/(kg·°C)
Sandy gravel20002.22.1909
Mudstone19680.0572.0922
Silty sandstone18500.81.8909
Pebbly coarse sandstone20001.32.1909
Steel casing7850 44.5475
Thermal insulation casing7850 0.26475
Table 2. Numerical simulation scheme for model validation.
Injection Temperature
°C
Injection Flow Rate
kg/s
Operation Life
a
5640
Table 3. Simulation schemes for the influence of injection temperature.
CaseInjection Temperature
°C
Mass Flow Rate
kg/s
156
2106
3156
4206
Table 4. Simulation schemes for the influence of injection mass flow rate.
CaseInjection Temperature
°C
Mass Flow Rate
kg/s
156
258
3510
4512
Table 5. Simulation schemes for the influence of wellbore type.
CaseInjection Temperature
°C
Injection Mass Flow Rate
kg/s
Wellbore Type
156Connected Well
256Branched Well
Disclaimer/Publisher’s Note: The statements, opinions and data contained in all publications are solely those of the individual author(s) and contributor(s) and not of MDPI and/or the editor(s). MDPI and/or the editor(s) disclaim responsibility for any injury to people or property resulting from any ideas, methods, instructions or products referred to in the content.