Article

Machine Learning-Based Health Index Evaluation of Power Transformers Using Novel Parameterization for Predictive Maintenance: Data-Driven Research on Pakistan’s National Grid Regarding Maintenance Cost Optimization


1
Department of Electrical and Biomedical Engineering, Khwaja Fareed University of Engineering and Information Technology (KFUEIT), Rahim Yar Khan 64200, Pakistan
2
500 kV Grid Station, Rahim Yar Khan, National Grid Company (NGC), Rahim Yar Khan 64200, Pakistan
3
Department of Electrical, Electronics and Computer Systems, University of Sargodha (UOS), Sargodha 40100, Pakistan
*
Author to whom correspondence should be addressed.
Energies 2026, 19(15), 3653; https://doi.org/10.3390/en19153653
Submission received: 26 June 2026 / Revised: 28 July 2026 / Accepted: 1 August 2026 / Published: 4 August 2026
(This article belongs to the Special Issue Industrial Energy Efficiency Toward a Sustainable Future)

Abstract

Power transformers are an integral part of electrical power system infrastructure and play a vital role in the efficient and reliable transmission of bulk electrical power to distribution networks. The careful use of these assets enables the optimization of transmission voltages in power networks, a crucial step for reducing electrical energy losses, enhancing grid reliability, and ensuring uninterrupted electricity supply to end-users in interconnected power networks. Operational reliability of power transformers is a critical aspect in ensuring a continuous power supply. The health index (HI) is a crucial diagnostic tool to determine their real condition. Historically, HI assessments were based on scoring and weighting. Lately, however, there has been a significant change in the attitude towards the use of artificial intelligence (AI) and machine learning (ML) to predict the health of high-voltage power transformers. Although developments are taking place, the existing studies on ML-based HI prediction models for power transformers largely rely on an incomplete dataset containing improper parameters. Moreover, dependency on traditional ML models is a significant limitation when it comes to achieving a higher degree of predictive accuracy. This article presents a sophisticated method for determining the overall health condition of power transformers. A total of twenty of the most appropriate and highly relevant input parameters were selected to effectively evaluate the transformer condition. The dataset for these parameters was collected from real-time testing in accordance with international industry standards (i.e., IEC, IEEE, and ASTM), conducted at 220 kV and 500 kV grid stations in the Multan and Lahore regions, operated by the National Grid Company (NGC) in Pakistan. This comprehensive dataset was fed to five state-of-the-art ML models. The Categorical Boosting Regression (CatBoost Regressor) model demonstrated superior performance, achieving the highest accuracy (R2 Score) of 97.2% and the lowest mean absolute error (MAE) of 1.73. The best-performing model was then employed to predict the health index of the power transformers at the 500 kV grid station, Rahim Yar Khan, and the 500 kV grid station, Multan, as a practical case study. To demonstrate the economic importance of the proposed framework, an economic analysis was conducted via an iterative, parameter-skipping imputation strategy for maintenance cost optimization of the electrical power grid. The results verify that the omission of four diagnostic tests (i.e., Dissipation Factor, Capacitance, Insulation Resistance, and Transformer Turn Ratio) can reduce the economic burden by 46.99%, yielding a cost saving of 259,000 PKR per transformer unit. The implementation of this data-driven framework in the national grid can significantly reduce maintenance costs and facilitate an operational shift from traditional preventive maintenance to advanced predictive maintenance.

1. Introduction

The power transformer is regarded as the heart of the electrical power system, responsible for contributing to the seamless flow of electrical energy from the point of generation to the point of utilization. Stepping up voltages at generating stations for transmission and stepping down voltages at distributing stations for utilization is the power transformer’s principal work. Along with efficient long-distance electrical power transmission, power transformers are also liable for sustaining voltage regulation and power quality within transmission and distribution networks. Thus, power transformers are vital assets within electrical power systems. Due to their key role, high cost, and long lead times, any power transformer outage, either planned or unplanned, can result in the complete or partial collapse of the electrical power grid. The rising demand for electrical energy, coupled with the increasing complexity of energy infrastructure, calls for a state-of-the-art approach for monitoring, diagnostics, and predictive maintenance of power transformers [1,2].
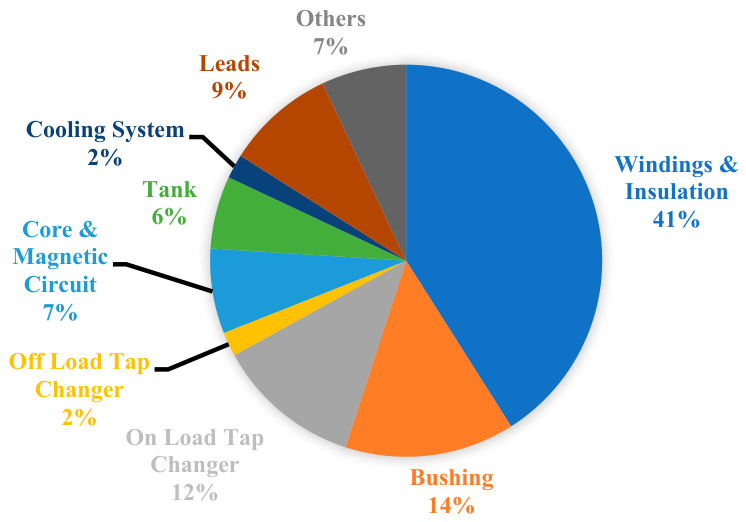
Power transformers experience a variety of internal and external stresses during their operation. These stresses comprise thermal aging and dielectric, mechanical, and chemical degradation. Mineral oil and cellulose-based paper commonly form the insulating system of power transformers. These are the most vulnerable components because they directly influence the dielectric and thermal performance of power transformers. Degradation in power transformers can manifest through various pathways. Dielectric degradation arises from electric field stress. Thermal aging is typically noticed following continuous or cyclic overloading. Moisture infiltration and oxidation can often promote chemical degradation [3,4,5]. In addition, mechanical deformation is caused by short-circuit forces [6,7]. These factors became the reason for the power transformer failure depicted in Figure 1.
The health index (HI) has become a comprehensive measure to assess power transformers, dealing with multi-factor degradation and its complexity. The current health of an asset can be easily stated, and the remaining life of an asset can also be determined by the HI. For a power transformer, the health index is a tool that has been in use for a considerable amount of time for determining the condition of the transformer. The HI incorporates various diagnostic parameters (electrical tests, oil condition, economic considerations, etc.) in one quantitative score or category that represents the overall health of the transformer. To get implementable recommendations that are based on the urgency of maintenance, risk of failure, and service life expectancy of the power transformer, an accurately measured health index is needed. The HI has helped to move from time-based maintenance to more effective condition-based maintenance. This transition has resulted in lower operational costs and less susceptibility to failures [9,10].
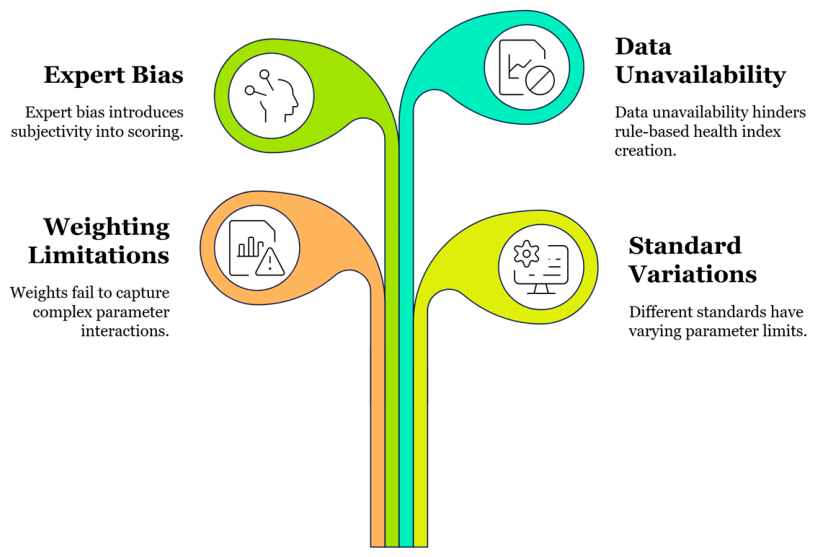
Traditionally, the health index is calculated by means of a rule-based weighting and scoring approach. Different approaches are highly favored by generation, transmission, and distribution companies alike [11,12,13,14]. This is done on the basis of the diagnostic parameters that are selected, such as breakdown voltage (BDV), dissolved gas analysis (DGA) ratios, acidity, furan, the dielectric dissipation factor (DDF), etc. These parameters are then given a health score using international standards such as IEEE C57.104 [15], IEC 60422 [16], and IEC 60599 [17], which define predetermined ranges of values. For example, a breakdown voltage (BDV) value of less than 30 kV may score ‘poor’, whereas a value of greater than 70 kV may score ‘excellent’ in the case of a power transformer. Multiplication of these scores with parameter-specific weights is done, followed by summing these weighted scores to obtain the final health index. Though the traditional methods of scoring and weighting have been in use for a long time, they have some drawbacks. First comes the limits or weights utilized for final scoring. They fail to reflect the complex interactions of parameters among them. Then, the standards, including those from the IEEE (Institute of Electrical and Electronics Engineers), IEC (International Electrotechnical Commission), BSI (British Standards Institution), and ASTM (American Society for Testing and Materials), have different standard limits for these parameters. In addition to this, expert bias can introduce subjectivity, and generalization in scoring systems or transformer type may not exist. Lastly, complete datasets are required for a rule-based health index (HI), while in reality, data unavailability is very common because of test scheduling, cost, and logistics [18,19]. Figure 2 shows the drawbacks of traditional HI methods.
Researchers have found a huge potential in machine learning (ML) to overcome such shortcomings. The predictive capability of machine learning (ML) can easily assess the overall health condition of power transformers or any other high-voltage power equipment. ML algorithms trained on appropriate datasets can be used to evaluate the health index (HI) of power transformers. Machine learning offers a data-driven path that can easily model intricate and nonlinear relationships without the need for strict limits on weights and scores. These models, after learning from datasets, can uncover hidden patterns and complex interactions among diagnostic parameters and can predict the value of the health index [20,21]. Many machine learning algorithms have been utilized in this field, including random forests (RFs), gradient boosting (GB), support vector machines (SVMs), decision trees (DTs), artificial neural networks (ANNs), and K-nearest neighbors (KNNs). These ML models are trained on diagnostic input features like oil parameters, DGA gas concentrations, visual observations, field data, routine tests, etc.
For a valid approximation of the transformer’s overall health condition, some researchers have only considered entirely approachable testing parameters. The authors in [22,23] took the oil BDV, DDF, acidity, IFT, DGA, 2-furfural, percentage of economic lifetime, and aging acceleration factor to evaluate the health index of the transformer. A detailed overview of both traditional and ML-based approaches for finding the HI was discussed in [1]. The article presents a couple of experts from the transformer diagnosis field and includes diagnostic parameters like IFT, DDF, BDV, DGA, color, sediment, water content, acidity, partial discharge (PD), 2-furfural, and transformer age. The researchers in [24] employed a fuzzy logic model based on oil parameters and DGA ratios to calculate the health index. A combined predictive maintenance model based on an ANN was used by the authors in [25] to determine the health index of the transformer. Another ANN-based model was also used by [26] for the prediction of furan content by using seven oil parameters. Reference [27] presented a comparison of classification and regression by taking into account some important parameters related to power transformers. Although machine learning has been a well-liked path for the prediction of the overall health condition of power transformers, there are still limitations associated with this discipline. Currently, researchers have not selected the most relevant and appropriate diagnostic parameters for calculating the health index, resulting in the utilization of insufficient datasets for this purpose. Moreover, current research is limited by its continued dependence on traditional machine learning regression models, such as random forests [28], support vector machines [29], and decision trees [30], rather than implementing more advanced models. There remains reasonable scope for enhancing the accuracy of machine learning models.
This article presents a state-of-the-art approach to assessing the overall health condition of power transformers by analyzing their health index (HI) for predictive maintenance. Twenty of the most appropriate diagnostic parameters including DGA (hydrogen (H2), carbon monoxide (CO), carbon dioxide (CO2), methane (CH4), ethane (C2H6), ethylene (C2H4), and acetylene (C2H2)), furan analysis, water content, acidity, breakdown voltage (BDV), dielectric dissipation factor (DDF), color, interfacial tension (IFT), transformer turn ratio (TTR), partial discharge (PD), winding resistance (WR), insulation resistance (IR), capacitance, and dissipation factor (DF) has been selected. The dataset of the former parameters was collected by real-time testing of 220 kV and 500 kV grid stations of the Multan region and Lahore region owned by the National Grid Company (NGC) (formerly known as National Transmission and Despatch Company (NTDC)) in Pakistan. This carefully gathered dataset was employed on five modern regression models of machine learning, i.e., natural gradient boosting (NGBoost) regressor, categorical boosting (CatBoost) regressor, light gradient boosting machine (LightGBM) regressor, histogram-based gradient boosting (HistGradientBoost) regressor, and extreme gradient boosting (XGBoost) regressor. The model exhibiting the highest predictive accuracy was then utilized for estimating the power transformers’ health index of the 500 kV grid station, Rahim Yar Khan, and the 500 kV grid station, Multan, NGC, as a case study. The economic benefits associated with the predictive maintenance of power transformers proposed in this research work were also discussed, regarding maintenance cost optimization of the national grid.

2. Methodology

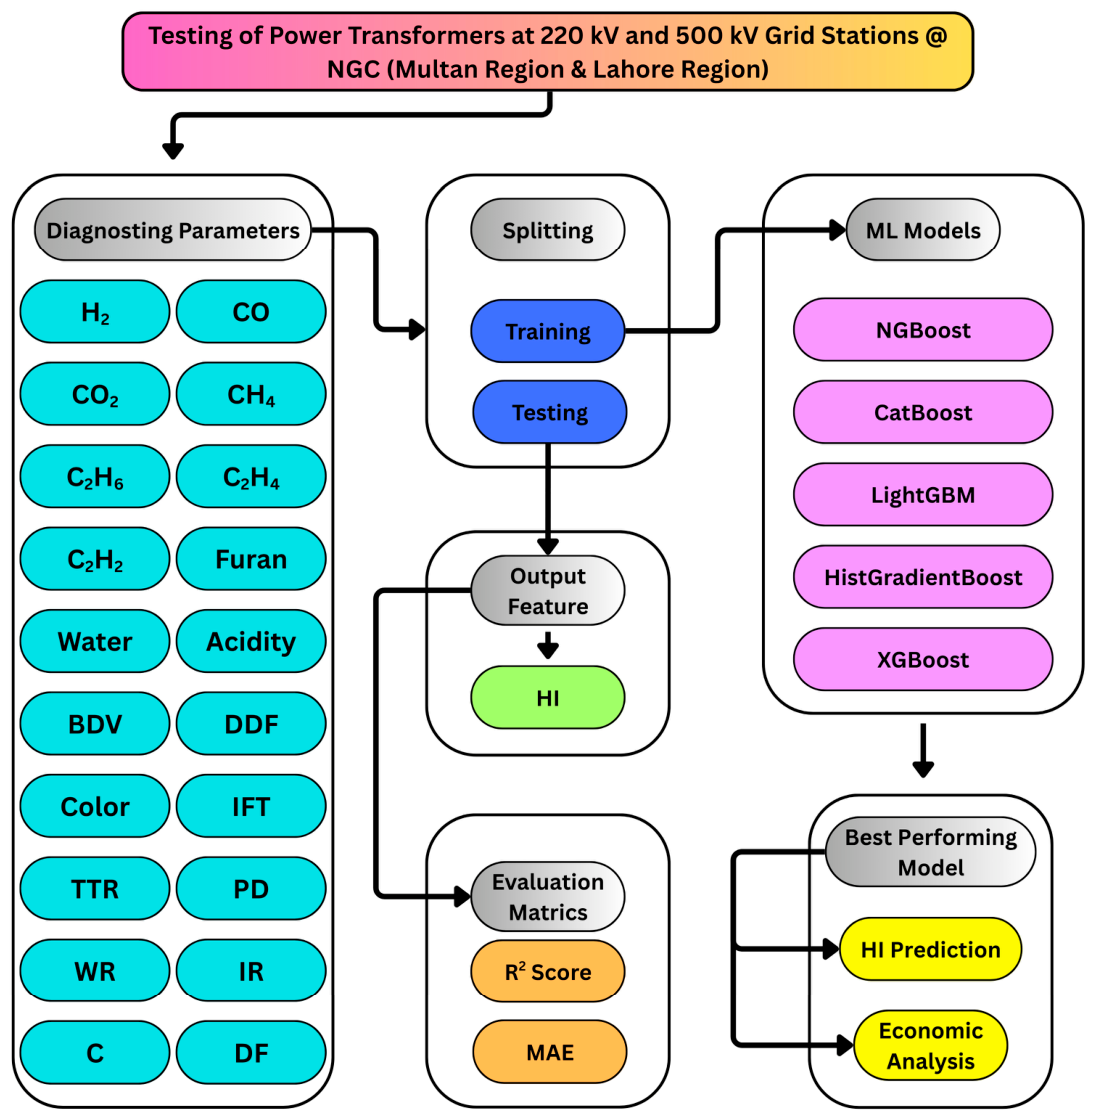
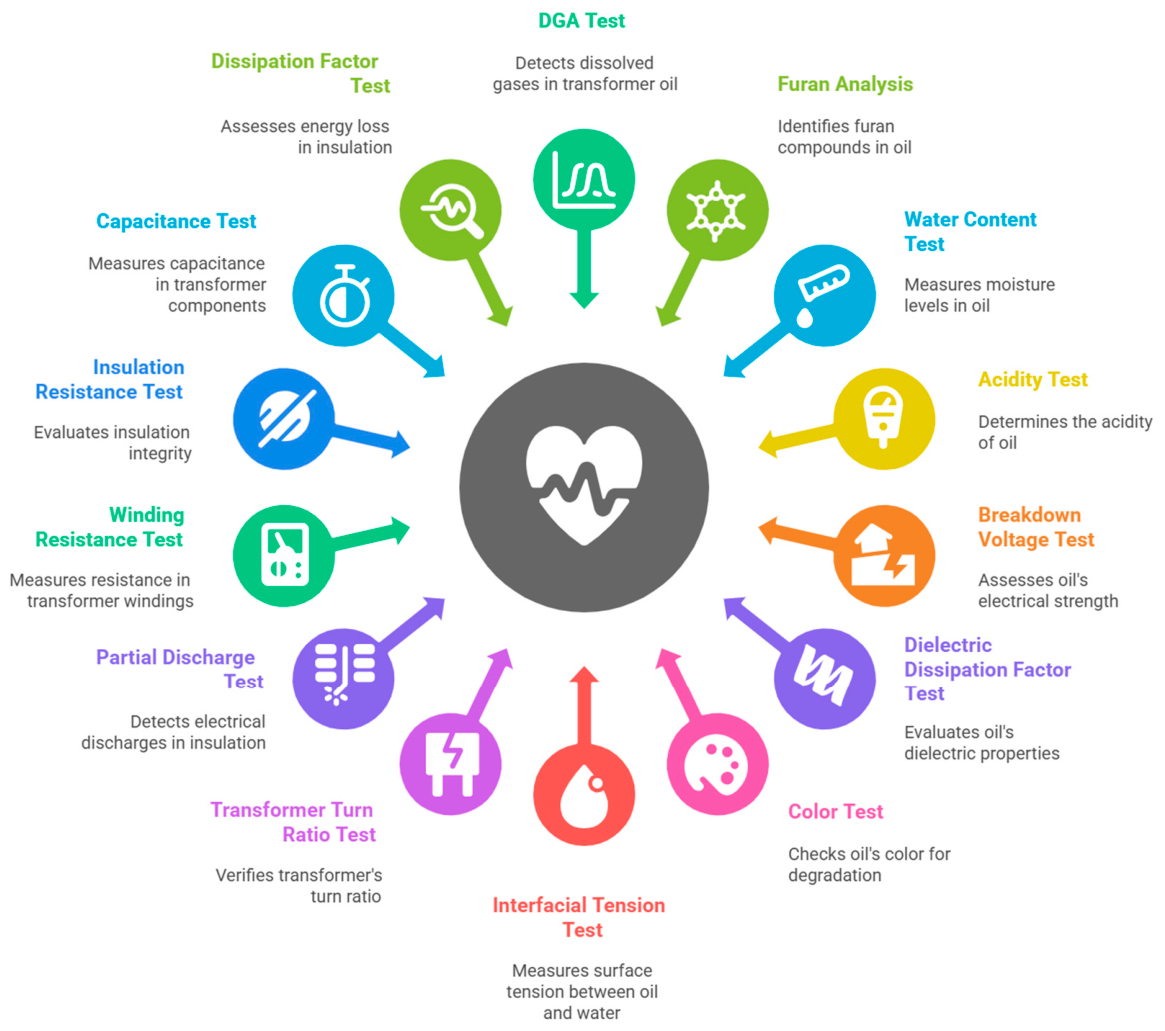
The methodology began with collecting data for the preparation of the dataset. Real-time testing of power transformers employed by the National Grid Company (NGC) (Lahore, Pakistan) (formerly known as National Transmission and Despatch Company (NTDC)) at 220 kV and 500 kV grid stations of the Multan region and Lahore region was performed, with adherence to industry standards, such as IEC, IEEE, ASTM, etc. These included the DGA test, furan analysis test, water content test, acidity test, breakdown voltage (BDV) test, dielectric dissipation factor (DDF) test, color test, interfacial tension (IFT) test, transformer turn ratio (TTR) test, partial discharge (PD) test, winding resistance (WR) test, insulation resistance (IR) test, capacitance test, and dissipation factor (DF) test. The results of these tests are tabulated systematically for a coherent dataset. The dataset was trained on the 5 latest ML regression models, i.e., NGBoost, CatBoost, LightGBM, HistGradientBoost, and XGBoost. The best-performing model was used for the prediction of the health index of power transformers employed at the 500 kV grid station, Rahim Yar Khan, and the 500 kV grid station, Multan. The concluding stage of this research work involved a comprehensive economic analysis to evaluate the financial implications and benefits of the proposed research. Figure 3 presents the schematic of the methodology.

3. Dataset

The collection of data was one of the key steps of this research. NGC has four (4) 500 kV grid stations (NEW MULTAN, MUZAFARGARH, RAHIM YAR KHAN, and DERA GHAZI KHAN) and seven (7) 220 kV grid stations in the Multan region. NGC also has six (6) 500 kV grid stations (SHEIKHUPURA, GATTI FAISALABAD, NOKHAR, SAHIWAL (YOUSAFWALA), NEW LAHORE (SOUTH), and FAISALABAD WEST) and twenty (20) 220 kV grid stations in the Lahore region. Fourteen most-suitable tests, including the DGA test, furan analysis test, water content test, acidity test, breakdown voltage (BDV) test, dielectric dissipation factor (DDF) test, color test, interfacial tension (IFT) test, transformer turn ratio (TTR) test, partial discharge (PD) test, winding resistance (WR) test, insulation resistance (IR) test, capacitance test, and dissipation factor (DF) test, were performed on the power transformers of the above-mentioned grid stations for collecting the real-time dataset according to IEC, IEEE, ASTM, etc., industrial standards. The dataset contained a total of 372 entries with a varying range of HIs. This also means that the ML models were employed on a dataset that is based on international industrial standards (i.e., IEC, IEEE, and ASTM). Each test had its importance in evaluating the overall health index, as explained in the next section.

3.1. Diagnostic Parameters

Power transformer condition assessment involves diagnostic test results. In this research work, twenty relevant input parameters were selected, and each of them represents a specific property of the transformer or its insulating medium. All these parameters are not random. That is, they are known in both the power industry and academia as good markers of the health of a transformer. Some of them relate to the chemical ageing of the insulating oil, and others provide information about moisture content, degradation of the insulating oil, internal discharges, or mechanical faults. They provide a complete visual picture of the condition of the transformer. The collection and selection of these parameters serve the most fundamental purpose of this work, that is, predicting the overall health of the transformer. The HI, by converting these diagnostic data into a single score that can be readily interpreted, greatly facilitates direct access to well-informed asset management. Figure 4 shows the diagnostic parameters taken into account in this research work.

3.1.1. Dissolved Gas Analysis (DGA)

During long-term operation and fault stresses, such as overheating, arcing, or partial discharge, the insulation materials degrade, and then many kinds of gases are formed. These gases are dissolved in the insulating oil, and their kind and content can indirectly indicate the types and severity of faults. Important gases include hydrogen (H2), carbon monoxide (CO), carbon dioxide (CO2), methane (CH4), ethane (C2H6), ethylene (C2H4), and acetylene (C2H2). DGA detects issues that are not identified on standard tests, allowing for proactive maintenance. It also allows a time trend analysis to evaluate whether the situation is stable or deteriorating [31].

3.1.2. Furan Analysis

The degradation of cellulose paper in power transformers is assessed using furan analysis. Unlike oil, the solid, cellulose-based insulation in a transformer cannot easily be renewed or replaced. As this paper ages under thermal stress, it degrades and releases furanic compounds and, in particular, 2-furfuraldehyde (2-FAL) into the oil. Those substances, however, are HDL-apolipoproteins, and they can be quantitatively determined by high-performance liquid chromatography (HPLC). The appearance of high furan levels mostly indicates the final stage in the aging cycle and, hence, is likely to cause a breakdown [32].

3.1.3. Water Content

Changes in the content of water in the transformer oil are decisive for the insulation performance and overall health of the transformer. If external sources, such as leakage, faulty seals, or the surrounding atmosphere, are infiltrated, the system can become moist. Mostly, old and poorly maintained units, where the issue of moisture is more common, can be the source of the problem. It can also be generated inside the transformer by the ageing and decomposition of cellulose insulation. These measurements are typically made in parts per million (ppm) by Karl Fischer titration or by a method similar to this [33].

3.1.4. Acidity

As oil ages, it combines with the air’s oxygen and produces acids that cause corrosion and promote the formation of sludge. These acidic species can cause the destruction of metal parts, intensify the reduction in cellulose insulation, and impede the oil’s insulating properties. In particular, colloidal deposits can pack cooling airways, restricting airflow and thus reducing the cooling effect, and this can lead to overheating. The degree of acidity is typically measured in milligrams of potassium hydroxide (KOH) required to neutralize the acids in one gram of oil [34].

3.1.5. Breakdown Voltage (BDV)

Breakdown voltage (BDV) is an important electrical transformer oil property that shows its capability to withstand electrical stress. The test is performed by applying increasing voltage to a sample of oil until the electric breakdown happens, i.e., the oil no longer has insulating properties. A high BDV value indicates a good insulating capacity, and low BDV is an indication of moisture contamination, particles, or aging by-products contamination in the oil [35].

3.1.6. Dielectric Dissipation Factor (DDF)

Dielectric dissipation factor (DDF) is also called tan delta (tan δ) and is a means to measure the dielectric loss in the component of an insulating material as a result of applying an alternating electric field. It is key to know the quality of the insulating oil and solid insulating materials. A DDF with a low value shows that the quality of the insulation is good, whereas higher values are due to pollution by water, aging of the material, and other contaminants [36].

3.1.7. Color

The yellowish hue of transformer oil might look like a triviality at first. However, it is a very useful visual signal of oil quality and aging. A bright yellow or goldish color appears to be natural for a new oil, while a deeper color can indicate the oil’s diminished quality. Moreover, the color shifts can be an earlier sign that additional laboratory testing is required to detect chemical or moisture-related issues [37].

3.1.8. Interfacial Tension (IFT)

Interfacial Tension (IFT) is the attraction force measurement between the oil of the transformer and the water at their interface. As the oil gets old and gathers polar contaminants like acids, sludge, and oxidation products, its IFT value drops. A minimal value of IFT usually comes from the degradation of the oil that leads to a reduction in the performance of its insulating properties [38].

3.1.9. Transformer Turn Ratio (TTR)

The transformer turn ratio test (TTR) was performed to verify the right ratio between primary and secondary windings of a power transformer. This is probably the most straightforward and reliable way of finding shorted or open winding issues, wound tears, and inter-turn insulation faults. A transformer with a bad turns ratio feature can make use of incorrect voltage levels for the connected equipment. The deviation from the nominal turn ratio may be a confirmation that winding damage on the transformer has taken place due to electrical or mechanical stress, especially in the occurrence of flashover incidents or the physical shocks experienced during the process of transportation [39].

3.1.10. Partial Discharge (PD)

Partial discharge (PD) is the local ionization and vaporization that occurs in the insulation of a transformer without a complete short-circuit of the insulation. They are very often due to the formation of cavities, cracks, humidity, or foreign bodies within the insulation, and are the initial indicators of insulation breakdown. The PD process can attack not only chemicals but also the physical appearance of insulation, due to wear and tear, hence shortening the life of the equipment [40].

3.1.11. Winding Resistance (WR)

Winding resistance (WR) testing is a procedure that diagnoses the transformer’s resistance by using a small direct current. Such a test is practiced to spot loose connections, shorted turns, or bad contacts at tap changers. Each of these may lead to local hot spots, voltage imbalance, or reduced energy efficiency in operation. Therefore, it is the most important activity to be performed after repair, movement, or large-scale operation, or for newly installed transformers [41].

3.1.12. Insulation Resistance (IR)

The insulation resistance (IR) of a transformer is a measurement of how well the insulation can keep the transformer from having any leakage current. If the IR value is low, there is a possibility of water flooding, insulation degeneration, or pollution of the surface. IR testing is a simple, non-time-consuming, and genuine approach to identifying the general state of the insulation. Moreover, it is a standard practice during commissioning, regular maintenance, and in case of any suspicions about the wet environment of the transformer [42].

3.1.13. Capacitance (C)

Capacitance in transformers refers to their ability to store an electrical charge in their insulation system. This property is responsible for the transient performance of the transformer. Maintaining the designated capacitance is of much importance as it helps ensure equal voltage distribution across the windings, thus protecting them from any potential damage. Any change in capacitance can lead to serious problems like resonance [43].

3.1.14. Dissipation Factor (DF)

The dissipation factor (DF) test measures the dielectric losses in a power transformer’s insulation system. It determines the quality of the insulation by comparing the resistive current to the capacitive current when an alternating current (AC) voltage is applied. The dissipation factor is actually the tangent of the angle between the ideal capacitive current and the actual total current. A low value of DF suggests good insulation, while a growing trend can signify concerns like moisture ingress, contamination, or aging, leading to transformer failure [43].

3.2. Output Parameter

The only output parameter of this research is the health index (HI). The HI is a macroscopic indicator that tells us how healthy and safely operable the power transformer is. It unifies the data received from different diagnostic methods and transforms it into a number or class/grade that can directly display the situation of a power transformer regarding the possibility of failure or the necessity of maintenance. The HI can be in the form of a percentage, a plain scale from 0 to 100, or in the form of health classes (e.g., “Excellent”, “Good”, “Fair”, “Poor”, and “Critical”). It is the HI’s mission to provide the decision-makers with a clear and objective picture of the condition of the asset. As it extracts a single output from multiple complex measurements, the HI feature supports condition-based maintenance, the prioritization of assets, and strategies for life extension. The HI was also predicted for power transformers of the 500 kV grid station, Rahim Yar Khan, and the 500 kV grid station, Multan, based on twenty input features using ML as a case study of this research work.

4. Machine Learning (ML) Implementation

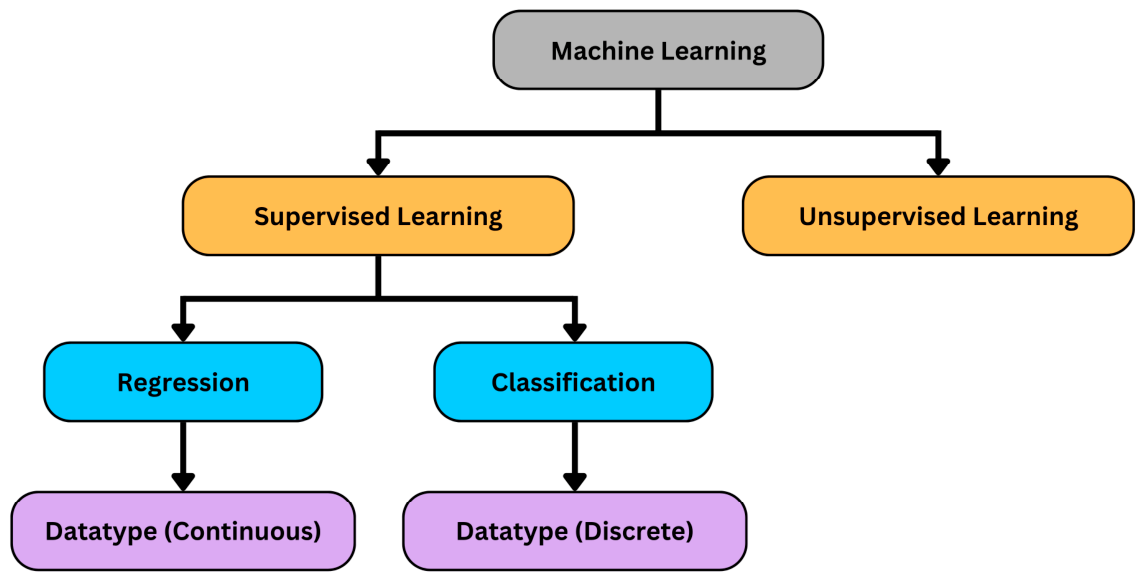
Machine learning (ML) is a branch of artificial intelligence (AI) that creates algorithms that learn patterns from data and uses them for prediction or to make decisions. In recent years, ML has become more popular in different areas of industry as it can analyze large amounts of data and discover hidden trends very efficiently. It has been successfully applied in engineering domains, especially in health assessment and condition monitoring, in order to enhance the operational reliability and minimize downtime [44]. For power transformers, ML methods were found to be capable of diagnosing failures, forecasting aging, and evaluating the health index by using historical data [45]. Regression is one of the most widely used techniques for prediction purposes in machine learning. Figure 5 shows a simple classification of machine learning.

4.1. Regression

Regression is one of the fundamental methods of supervised learning, which is employed to predict continuous values (numbers) based on a labeled input dataset. It is important as it allows us to measure relationships between different diagnostic variables to detect trends. Regression in machine learning is more than just determining the line of best fit. It learns the intricate and nonlinear relationships of input parameters and their effects on the output parameter. Based on these complex patterns, regression makes accurate predictions. The boosting regression algorithms have gained much popularity in recent years because they combine multiple simple “weak” models sequentially to create a highly accurate “strong” model, increasing their prediction accuracy. Instead of building one massive model, boosting models focus on learning from previous mistakes in a step-by-step manner to minimize prediction errors. This research work employed state-of-the-art boosting regression models, including NGBoost, Catboost, LightGBM, HistGradientBoost, and XGBoost, using Python 3.14 on the Google Colab Environment.

4.1.1. NGBoost

Natural gradient boosting regression (NGBoost Regressor) is a novel algorithm that does probabilistic regression by learning a full joint distribution instead of a specific point value, using natural gradients to maximize the expected health index and its uncertainty in the parameters. By using NGBoost in this research, the grid operator can use prediction intervals that quantify the statistical confidence of the transformers’ health assessment, which can help in making more risk-aware predictive maintenance decisions [46].

4.1.2. CatBoost

Categorical boosting regression (CatBoost Regressor) is an advanced gradient boosting algorithm that can automatically process categorical features without prior preprocessing and has a special focus on minimizing overfitting and training time by using the CatBoost symmetric decision tree. By incorporating CatBoost into this research, the model can automatically identify nonlinear relationships in complex diagnostic information and avoid losing important data by manual coding, thereby optimizing the health index assessment. This will help in making quick and economical maintenance decisions in the power infrastructure with the help of high-fidelity predictive mapping by the grid operators [47].

4.1.3. LightGBM

Light gradient boosting machine regression (LightGBM Regressor) is an extremely memory-efficient and fast gradient boosting framework to grow decision trees leaf-wise instead of level-wise, using histogram-based algorithms. The inclusion of LightGBM in this research helps process multi-dimensional diagnostic vectors faster and without compromising the accuracy for the diagnostics of the transformer condition. This is especially useful for large-scale grid datasets and enables utility operators to carry out real-time, cost-optimized asset condition assessments [48].

4.1.4. HistGradientBoost

Histogram-based gradient boosting regression (HistGradientBoost Regressor) is an optimized gradient boosting algorithm that discretizes all numerical features into bins of integers, thus reducing the number of split points that the decision trees have to check when training. Using HistGradientBoost in this research offers an extremely efficient and memory-saving system for forecasting the health index of the transformer from large, dense diagnostic datasets. This allows for quick asset condition assessments and can schedule maintenance to optimize costs while maintaining the accuracy of the prediction needed for the critical grid infrastructure [49].

4.1.5. XGBoost

Extreme gradient boosting regression (XGBoost Regressor) is an ensemble of weak decision trees trained sequentially by gradient boosting, which is scalable and parallelized with advanced regularization, and optimizes the loss function via second-order Taylor expansion. The use of XGBoost in this research offers an extremely powerful baseline to predict the power transformer health index, while simultaneously allowing for the management of missing diagnostic data, as it is sparsity-aware when performing split finding. The techno-economic framework is accurate, making feature elimination more accurate to minimize the maintenance costs of the national grid [50].

4.2. Evaluation Metric

Evaluation metrics are used to measure the performance of machine learning models. These metrics help gauge the effectiveness of the models’ performance in capturing the complicated relationships of data and in predicting the data. Metrics that give a detailed evaluation of regression models are the R2 score and MAE.

4.2.1. R2 Score

The R2 score, or coefficient of determination, is a statistical measure that quantifies the amount of variance in the dependent variable that is explained by the independent variables. In terms of practical use, it measures the accuracy of the regression model predictions in comparison with a simple baseline average. The most important use of the R2 score is to assess the model’s performance (usually in the range of 0 to 1). The greater the score, the more accurate and vice versa. The R2 score is calculated using Equation (1) [51].
R 2 S c o r e = 1 i = 1 N ( P r e d i c t e d V a l u e i A c t u a l V a l u e i ) 2 i = 1 N ( A c t u a l V a l u e i A v e r a g e T a r g e t V a l u e i ) 2

4.2.2. Mean Absolute Error (MAE)

The mean absolute error (MAE) is a statistical measure of the average absolute value errors in a series of predictions, regardless of direction. From a practical perspective, it is a measure of the average magnitude of the difference between the model’s predicted values and the actual values. The main value of the MAE is that it is an intuitive measure of the accuracy in the same units as the target variable, with a smaller value representing a better model. The MAE value is calculated by Equation (2) [52].
M A E = 1 N i = 1 N A c t u a l V a l u e i P r e d i c t e d V a l u e i A c t u a l V a l u e i

5. Results

5.1. R2 Score

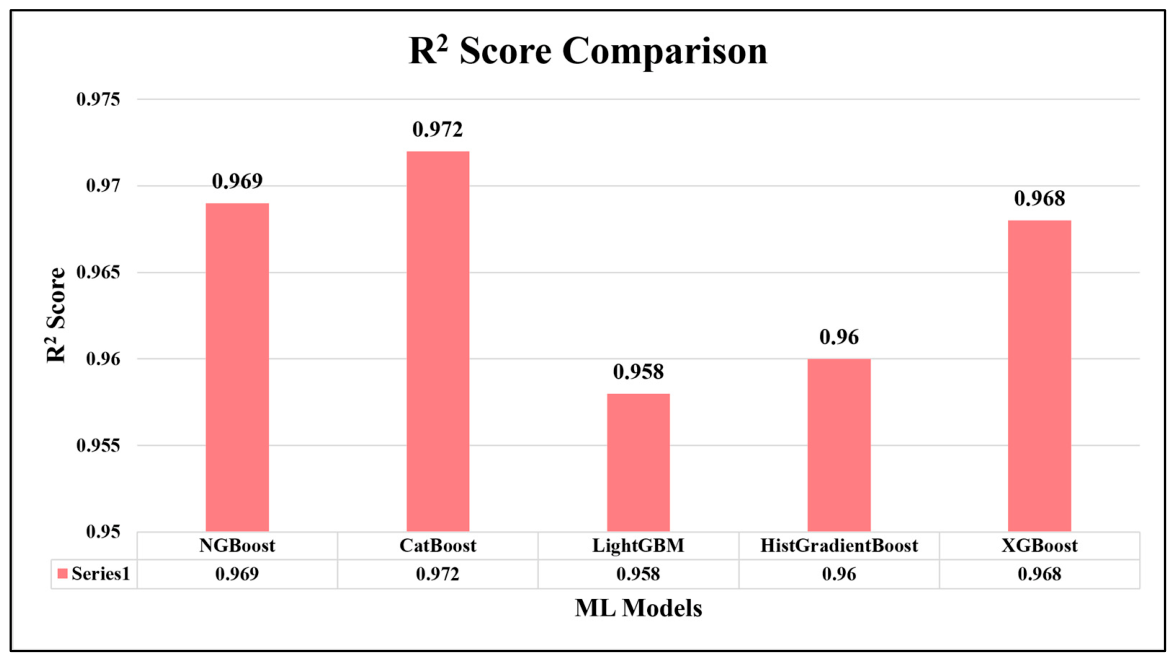
Figure 6 represents a comparative performance evaluation of five advanced machine learning regression models based on their coefficient of determination (R2 score) for health index prediction of high-voltage power transformers. Categorical boosting regression (CatBoost Regressor) showed the highest prediction accuracy of 97.2%, with an R2 score of 0.972. CatBoost’s superior performance is based on its symmetric tree structures, optimized handling of categorical features, and robust regularization techniques, which enable it to prevent overfitting during data training and effectively minimize gradient bias. This shows that CatBoost Regressor captured the complex and nonlinear relationships between the diagnostic input parameters and the targeted output parameter successfully. The NGBoost, XGBoost, and HistGradientBoost also showed good results, having R2 scores of 0.969, 0.968, and 0.96, respectively. LightGBM attained the lowest R2 score of 0.958. The highest accuracy of the CatBoost Regressor confirms that its deployment in the national grid guarantees reliable condition monitoring and health assessment of the power transformer. It will also help in precise predictive maintenance scheduling, optimizing asset maintenance costs, and ultimately minimizing catastrophic failures.

5.2. MAE

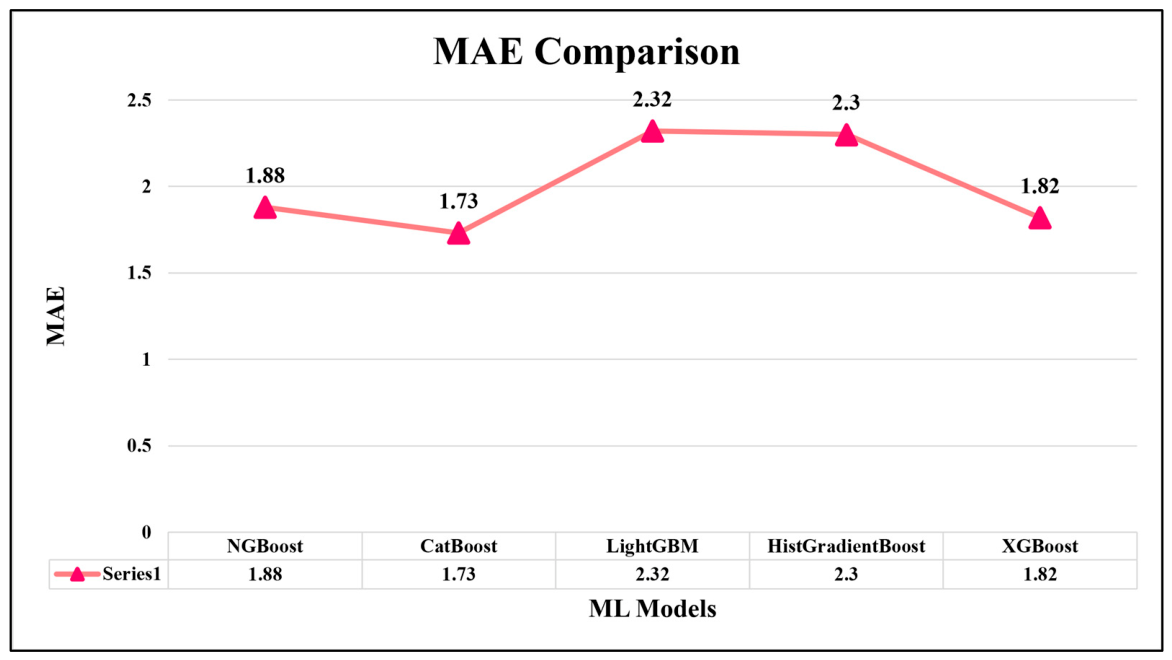
Figure 7 illustrates a comparative performance evaluation of five state-of-the-art machine learning regression models based on the value of mean absolute error (MAE) for health index prediction of the high voltage power transformers. Categorical boosting regression (CatBoost Regressor) showed the lowest prediction error, with an MAE value of 1.73. CatBoost’s optimal performance was due to its symmetric tree growth and innovative ordered boosting mechanism, which significantly handles nonlinear, complex parameter interactions with minimal empirical loss and suppresses prediction shift. This is an indication that CatBoost Regressor recognized the intricate relationships between input and output parameters efficiently. XGBoost, NGBoost, and HistGradientBoost also showed good results, having MAE values of 1.82, 1.88, and 2.3, respectively. LightGBM had the highest MAE of 2.32. The superior performance of CatBoost is a testament to the fact that all assets are on the condition assessment platform reliably across the national grid. This model can, therefore, accurately predict maintenance timing and directly optimize the investment of grid assets, thereby significantly reducing the risk of transformer failure.

5.3. Regression Plot

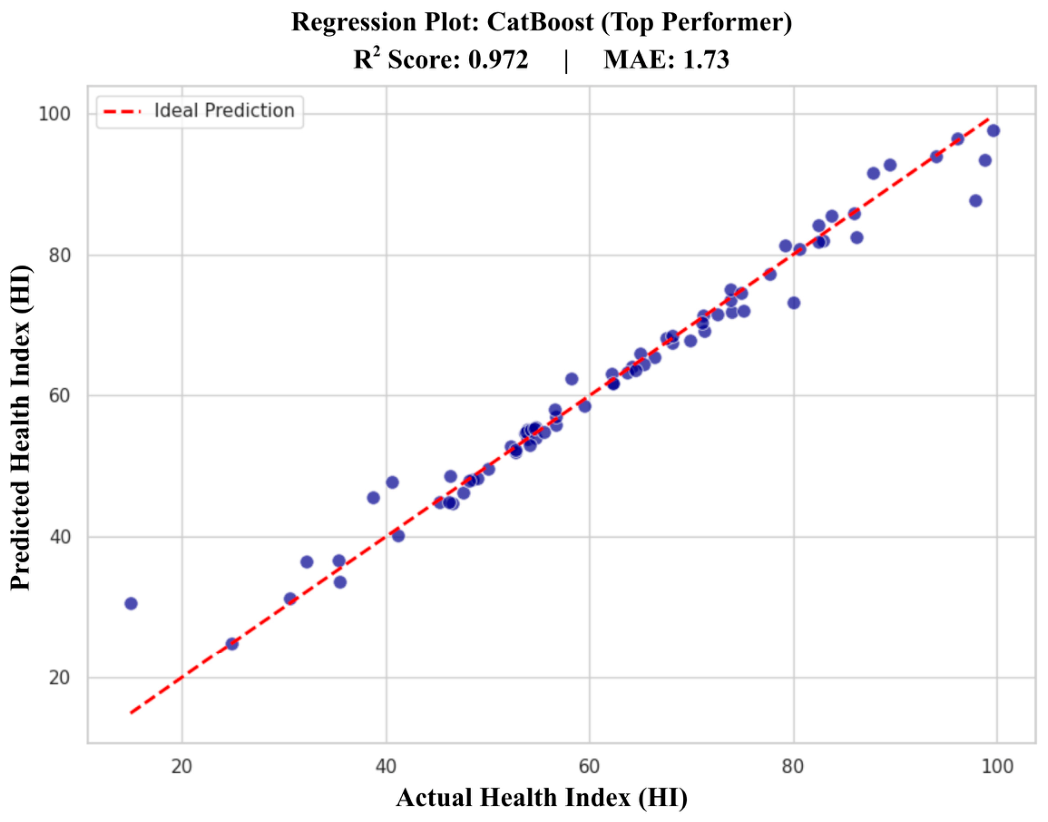
To highlight the predictive ability of the best-performing model (CatBoost Regressor), the regression plot is displayed in Figure 8. The scatter plot for the predicted health index is plotted along the y-axis, and along the x-axis, the actual health index is plotted. The dashed red line is the ideal prediction line. The data points are gathered in a linear and tight manner along the ideal prediction line, showcasing CatBoost’s outstanding evaluation metrics. The central concentration in the regression plot indicates that the CatBoost Regressor has an almost ideal prediction of the health index. This exact alignment indicates that a data-driven framework can correspond the nonlinear and complex transformer degradation parameters to the actual health state of the transformer’s operation, with only a small variation. This ensures that insulation degradation can be identified in the early stages effectively. This comprehensive ML framework can be employed by utilities and asset managers for predictive maintenance of power transformers, which will enable further steps towards cost-effective grid maintenance.

5.4. Correlation Matrix Heat Map

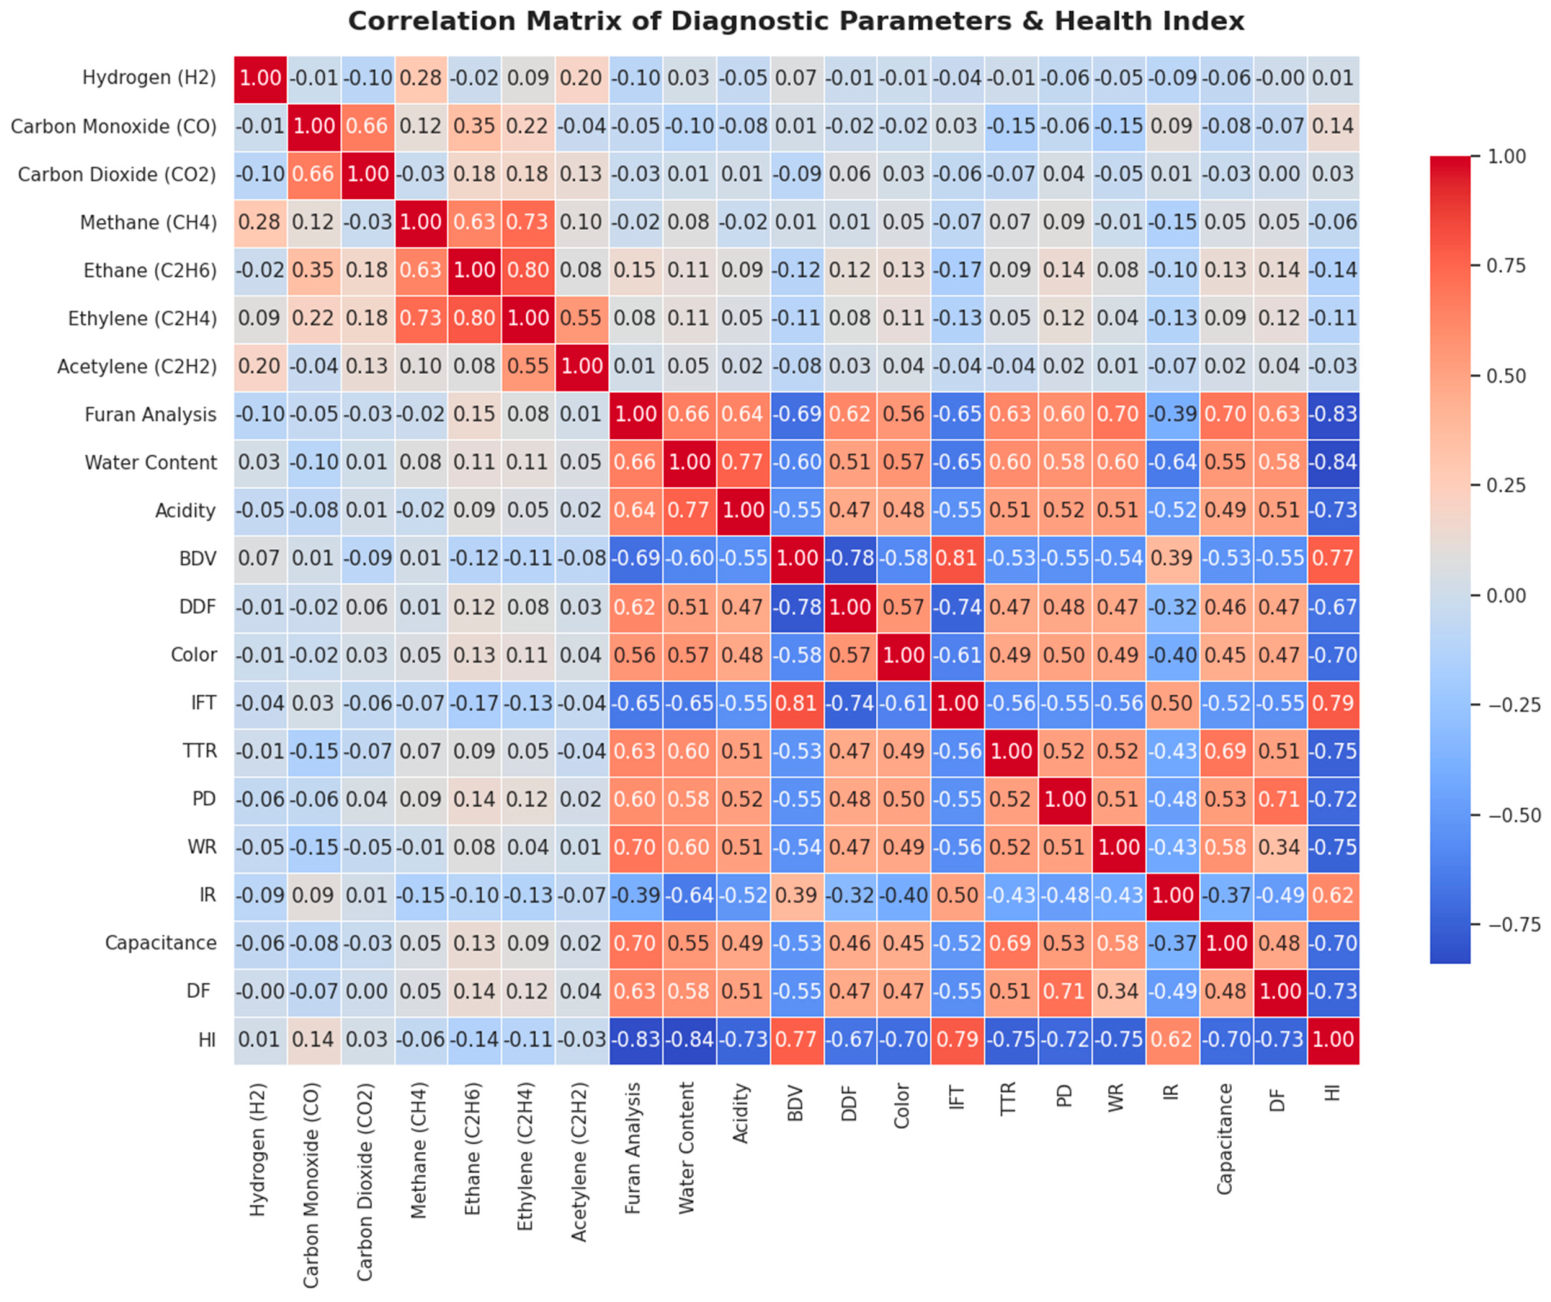
The Pearson correlation matrix heatmap in Figure 9 depicts the linear correlation between the input and output parameters. The color-coded matrix reveals the important multicollinear and independent feature relationships. The heatmap uses an inverted color scale (cool to warm) to show the relationship between different diagnostic parameters and the health index (HI) by highlighting the correlation coefficient that ranges between −1.0 and +1.0. The range of statistically strong to moderate direct linear relationships ranges from dark red to light orange (+1.00 to +0.20). Pale pink to light grey shades, however, refer to between +0.20 and −0.20, indicating weak to negligible linear correlation. Moderate to strong inverse relationships are shown by a range of light blue to dark blue shading, representing coefficients of −0.20 to −1.00. It was found that there were strong negative correlations between the health index and degradation parameters, such as water content (−0.84), furan analysis (−0.83), and acidity (−0.73), which can be interpreted as moisture ingress, aging of insulation, and oxidation of the oil, respectively. This pattern means that, as these parameters increase, the power transformer, as a whole unit, can quickly enter an alarming condition that could lead to catastrophic failure of the system. Interfacial tension (0.79) and breakdown voltage (0.77) show a strong positive correlation. The result shows that, for the power transformer, the higher the value of these parameters, the closer it is to the optimized operation zone, which guarantees its long-lasting safe operation and reliability. This all-round statistical mapping confirms the feature selection process and guarantees that the data-driven framework is focused on the most physically meaningful parameters so as to reach optimal predictive maintenance profiling of Pakistan’s national grid.

6. Case Study

Five state-of-the-art machine learning regression models were systematically evaluated in this research article using the twenty diagnostic parameters to predict the health index of the power transformer. CatBoost Regressor had the best performance and R2 score of 0.972, with an MAE value of 1.73, among all the models. A practical case study was conducted using CatBoost Regressor to predict the health index of the power transformers at the 500 kV grid station, Rahim Yar Khan, and the 500 kV grid station, Multan, based on its remarkable performance.

6.1. Case Study I: 500 kV Grid Station, Rahim Yar Khan

The electrical power substation consists of five different power transformer assets, consisting of a total of 10 high voltage power transformer units, as indicated in Table 1. The substation comprises two 525/231/23 kV auto transformer banks (ATBs) comprising physically isolated single-phase auto transformers and a spare unit to be used in an emergency. The other units come with two 220/132/11 kV power transformers, and one unit of 132/11.5 kV, creating an integrated and varied electric power system infrastructure.
In order to practically validate the significance of the proposed ML framework, the power transformer fleet health index was predicted using CatBoost Regressor. The twenty key diagnostic parameters were precisely measured from a series of laboratory and field tests, following standard industrial procedures (IEC, IEEE, and ASTM), for each physical unit. The predicted results included a quantitative HI value, a qualitative health assessment, and a maintenance recommendation specific to the insulation degradation profile and are presented in Table 2.
Case study I validates that the entire fleet of high-voltage power transformers stayed in peak condition, upholding impeccable fidelity standards across all assets. The red and blue phases of ATB2 showed a remarkable HI of 92%, and the yellow phase showed an HI of 91%. In the case of ATB3, the red phase had an HI of 92%, while the yellow and blue phases registered an HI of 91%. Such an exceptional HI is a measure of the fact that both the auto transformer banks were operating under normal load conditions. Also, their operational electrical and thermal limits were not breached. In addition to this, the heat dissipation mechanisms also benefited the ATBs and suppressed any insulation degradation caused by localized hot spots. The spare phase, which is reserved for ATB2 and ATB3 in any emergency, yielded an HI of 96%. This validates its non-operational, preserved capacity as a reliable and robust emergency reserve. T5 and T6 showed marginally low but acceptable HIs of 87% and 88%, respectively, reflecting expected minor electrical and thermal stresses, attributed to their single physical structure. T7 feeds local substation utility loads, sustaining an HI of 94%, because of the low electricity demand of the grid’s auxiliary systems. All ten units of the power transformers were categorized as healthy units and do not require any corrective maintenance. The healthy longevity of these assets is strongly related to the chronological lifecycle of the substation. A total of only eight years have passed since the commissioning of the power transformers at the 500 kV grid station, Rahim Yar Khan, in 2018. Moreover, the adherence to the structural annual preventive maintenance protocols also contributes to the remarkable structural and dielectric state of the power transformers.

6.2. Case Study II: 500 kV Grid Station, Multan

This electrical power substation currently operates a wide range of seven different types of transformers, with a total of fourteen individual high-voltage units, as detailed in Table 3. The infrastructure comprises three 525/231/22 kV auto transformer banks (ATBs), architecturally arranged in physically isolated single-phase units, with an extra single-phase unit as a standby unit in case of critical emergencies. The remaining power transformers are three 220/132/11 kV and a single 132/11 kV power transformer unit, creating an integrated electric power system infrastructure.
For the purposes of validation of the practical effectiveness of the proposed machine learning system, the CatBoost Regressor was used to predict the health index of the power transformers. Twenty critical diagnostic parameters as an input vector were collected carefully by laboratory and field tests for each physical unit, with full adherence to the international testing standards (such as IEC, IEEE, and ASTM). The resulting predictive mapping cataloged both the quantitative health index and qualitative condition assessments and prescriptive maintenance actions based on the unique insulation degradation profile of each asset, as shown in Table 4.
Case study II showed that the health profile was highly variable throughout the fleet, with some assets being in peak condition and others in moderate condition. In particular, the red phase of T1 had an HI of 75%, while the yellow and blue phases showed an HI of 74%. The red and yellow phases of T2 had an HI of 74%, and the blue phase showed an HI of 73%. This was localized degradation that was highly related to the age of the assets, as both of these transformers were commissioned in 1986. They are in only moderate condition after forty years of use, largely due to the fact that they have followed a well-defined preventative maintenance procedure on an annual basis. Meanwhile, the newer installations have strong insulation profiles, with the red phase of T7 showing a 96% HI, and the yellow and blue phases of T7 showing a 97% HI. The spare phase had the highest HI of 98%, which confirms its good condition and states that it is a reliable emergency standby. All three transformers (T3, T4, and T5) had an excellent HI of 96%, indicating normal loading and very efficient heat dissipation. Their exceptional integrity is due to their short chronological life, which is only four years since commissioning at the 500 kV grid station, Multan, in 2022. Finally, T6 feeds the auxiliary load of the substation and had an HI of 85%. This slight degradation is attributed to the usual stresses it has undergone since being commissioned in 2010.

7. Economic Analysis

In this research work, the input vector for the proposed ML framework comprised twenty key diagnostic parameters. This necessitated a comprehensive collection of fourteen distinct field and laboratory tests for each unit of the power transformer. These tests included the DGA test, furan analysis test, water content test, acidity test, BDV test, DDF test, color test, IFT test, TTR test, PD test, WR test, IR test, capacitance test, and DF test. These diagnostic tests have an economic investment associated with them. The financial expenditures of these tests, along with other miscellaneous charges, are presented in Table 5 in descending order of cost. The standardized pricing is derived from the officials of the state-owned High-Voltage and Short-Circuit Laboratory (HV & SC Lab), Islamabad, operated by National Grid Company (NGC), Pakistan.
The execution of these fourteen diagnostic tests imposes an economic burden of 551,200 PKR per power transformer unit. This financial burden was addressed by performing an economic analysis on the 500 kV grid station, Rahim Yar Khan. This approach was executed to optimize the maintenance cost of the power grid. The predictive capabilities of the best-performing model (CatBoost Regressor) were implemented by an iterative, parameter-skipping imputation strategy. The method omits a single diagnostic test sequentially at a time, starting from the most expensive dissipation factor (DF) test. The CatBoost Regressor is used to predict the missing parameter and subsequently predicts the final health index. The newly predicted HI is compared with baseline case study results for the detection of deviations. If the health index has a marginal variance of less than 2%, the process proceeds to skip and impute the next diagnostic parameter. Any higher deviation of more than 2% in the HI delineates the operational threshold of the feature reduction boundary. By maximizing the number of securely omitted physical tests, the proposed framework cuts the necessity of diagnostic tests without introducing a drastic shift in the health condition of the power transformers. This proves the practical viability of the proposed framework for optimizing maintenance costs across the national grid. The optimization framework for ATB2 is presented step by step in Table 6 only for analytical simplicity.
The economic analysis confirmed that the omission of four costly diagnostic parameters, i.e., DF, capacitance, IR, and TTR, resulted in a significant financial dividend, conserving 46.99% (259,000 PKR) of the total diagnostic cost per unit of a power transformer asset. Such a huge financial burden can be reduced with a variance of merely 1.34% in the predicted health index. The diagnostic overhead can be reduced by almost half by using the proposed ML-based methodology. Further elimination of diagnostic parameters introduces a drastic shift of 4% in the predicted health index. Such a high variance in the HI can compromise the operational reliability of the power transformer and can lead to system-wide failures. The current boundary established by eliminating four diagnostic parameters is an optimal threshold. These findings certify that the proposed machine learning approach can be applied practically for cost optimization regarding national grid maintenance. This framework enables massive economic savings of nearly 50 percent in what may be the largest break from traditional and rigid ‘preventive’ maintenance methods to a more cost-effective and sophisticated ‘predictive’ maintenance methodology.

8. Conclusions

This research article proposed and validated a data-driven approach based on machine learning (ML) to predict the health index (HI) of the power transformer for predictive maintenance, addressing the demanding challenge of the national grid’s maintenance cost optimization via novel parameterization. Five state-of-the-art ML regression algorithms were evaluated using a holistic dataset consisting of twenty relevant diagnostic parameters accumulated through international industry standards (i.e., IEC, IEEE, and ASTM). CatBoost Regressor emerged as the best-performing model by demonstrating an exceptional R2 score of 0.972 and an MAE of 1.73. The practical implementation was done as a real-world case study, utilizing the top-performing model on ten and fourteen operational power transformer units at the 500 kV grid station, Rahim Yar Khan, and the 500 kV grid station, Multan, respectively. The CatBoost Regressor predicted the HI of the entire fleet of the 500 kV grid station, Rahim Yar Khan, in the range of 94% to 98%. The healthy states of the assets were strongly linked to annual maintenance routines, coupled with a brief operational lifespan of 8 years since the power transformers’ commissioning in 2018. The estimated HI of the power transformers at the 500 kV grid station, Multan, spans between 73% and 98%. The diversity in the HIs of these transformers is due to their chronological lifecycles, as some of the power transformers were commissioned in 1986, while others were commissioned recently in 2022. To eliminate the financial overhead of 551,200 PKR per unit of a power transformer required to acquire the values of diagnostic parameters through field and laboratory tests, a novel cost optimization was performed via a sequential feature-skipping imputation loop. The optimization was done by employing the CatBoost Regressor to reduce the financial burden of maintenance on the national grid. The experimental results justify that four tests (i.e., the DF test, capacitance test, IR test, and TTR test) can be omitted and predicted through the CatBoost Regressor, with a minor variance of merely 1.34% in the final HI. Through this innovative approach, the financial expenditures can be conserved by about 46.99% (259,000 PKR per unit) while holding the operational reliability of the power transformers. Ultimately, the real-world implementation of the proposed method within Pakistan’s national grid guarantees significant financial savings along with predictive maintenance of the assets without sacrificing the actual health state of the power transformers. The proposed framework establishes a scalable and high-fidelity path in transitioning from conventional and expensive preventive maintenance toward progressive and cost-optimized predictive maintenance.

Author Contributions

J.A.: Conceptualization, Software, Validation, Writing—Original Draft, and Investigation; A.S.: Methodology, Formal Analysis, Resources, Writing—Original Draft, and Data Curation; W.A.: Conceptualization, Writing—Original Draft, Writing—Review and Editing, Resources, Supervision, and Software. All authors have read and agreed to the published version of the manuscript.

Funding

This research received no external funding.

Data Availability Statement

The original contributions presented in this study are included in this article. Further inquiries can be directed to the corresponding author.

Conflicts of Interest

Author Jawad Amjad was employed by the company “500 kV Grid Station, Rahim Yar Khan, National Grid Company (NGC)”. The remaining authors declare that the research was conducted in the absence of any commercial or financial relationships that could be construed as a potential conflict of interest.

References

  1. Li, S.; Li, X.; Cui, Y.; Li, H. Review of Transformer Health Index from the Perspective of Survivability and Condition Assessment. Electronics 2023, 12, 2407. [Google Scholar] [CrossRef]
  2. Tamma, W.R.; Prasojo, R.A.; Suwarno. High voltage power transformer condition assessment considering the health index value and its decreasing rate. High Volt. 2021, 6, 314–327. [Google Scholar] [CrossRef]
  3. Gao, J.; Wang, S.; Chen, R.; Zhang, C.; Zio, E.; Zhang, Y.; Lu, Y. ZSTT: A Zero-Shot Time-Series Prediction Model Based on Transformer and Its Application to Hydraulic Actuator Performance Degradation Prediction. IEEE/ASME Trans. Mechatron. 2025, 31, 2946–2957. [Google Scholar] [CrossRef]
  4. Ren, Y.; Zheng, D.; Yang, Y.; Zhang, Q.; Dang, Y.; Li, J.; Shen, J.; Zhang, P. A Mechanism-Guided Intelligent Enhancement Method for Early Aging Information of Winding Insulation. IEEE Trans. Ind. Inform. 2025, 21, 5440–5450. [Google Scholar] [CrossRef]
  5. Ying, L.; Wang, D.; Wang, J.; Wang, G.; Wu, X.; Liu, J. Power Transformer Spatial Acoustic Radiation Characteristics Analysis under Multiple Operating Conditions. Energies 2018, 11, 74. [Google Scholar] [CrossRef]
  6. Kaliappan, G.; Rengaraj, M. Aging assessment of transformer solid insulation: A review. Mater. Today Proc. 2021, 47, 272–277. [Google Scholar] [CrossRef]
  7. Abu-Siada, A.; Hmood, S. A new fuzzy logic approach to identify power transformer criticality using dissolved gas-in-oil analysis. Int. J. Electr. Power Energy Syst. 2015, 67, 401–408. [Google Scholar] [CrossRef]
  8. Ushakov, V.Y.; Mytnikov, A.V.; Lavrinovich, V.A.; Lavrinovich, A.V. Causes of Power Transformer Failure. In Transformer Condition Control: Advanced and Traditional Technologies; Power Systems; Springer: Cham, Switzerland, 2021; pp. 1–21. [Google Scholar] [CrossRef]
  9. Dong, M.; Li, W.; Nassif, A.B. Long-Term Health Index Prediction for Power Asset Classes Based on Sequence Learning. IEEE Trans. Power Deliv. 2022, 37, 197–207. [Google Scholar] [CrossRef]
  10. Murugan, R.; Ramasamy, R. Understanding the power transformer component failures for health index-based maintenance planning in electric utilities. Eng. Fail. Anal. 2019, 96, 274–288. [Google Scholar] [CrossRef]
  11. Junjie, J.; Yongqi, Z.; Zhou, X.; AL-Bukhaiti, K.; Anping, W.; Cheng, X.; Ji, X. Enhanced YOLO-IASE for robust safety inspection in complex substation environments. Signal Image Video Process. 2025, 19, 686. [Google Scholar] [CrossRef]
  12. Li, X.; Shang, R.; Zhao, Q.; Zhang, Y.; Liu, J.; Wu, C.; Guo, P. A Unified Online Assessment Framework for Pre-Fault and Post-Fault Dynamic Security. Energies 2026, 19, 673. [Google Scholar] [CrossRef]
  13. Junjie, J.; Yongqi, Z.; Anping, W.; AL-Bukhaiti, K.; Huang, J.; Cheng, X. Multi-target detection for safety monitoring in complex substation environments using YOLO-DySE. Signal Image Video Process. 2025, 19, 804. [Google Scholar] [CrossRef]
  14. Liu, J.; Liu, J.; Ding, T.; Ren, C.; Yan, R. A Generic Scene-Dependent Credibility Evaluation Framework for Machine Learning-Based Transient Stability Assessment of Power Systems. IEEE Trans. Power Syst. 2026, 41, 773–776. [Google Scholar] [CrossRef]
  15. IEEE Std C57.104-2008; (Revision of IEEE Std C57.104-1991); IEEE Guide for the Interpretation of Gases Generated in Oil-Immersed Transformers. IEEE Standards Association: Piscataway, NJ, USA, 2009. [CrossRef]
  16. IEC Standard 60422:2013; Mineral Insulating Oils in Electrical Equipment—Supervision and Maintenance Guide. IEEE Standards Association: Piscataway, NJ, USA, 2013.
  17. IEC Standard 60599:2015; Mineral Oil-Filled Electrical Equipment in Service—Guidance on the Interpretation of Dissolved and Free Gases Analysis. IEEE Standards Association: Piscataway, NJ, USA, 2015.
  18. Žarković, M.; Stojković, Z. Analysis of artificial intelligence expert systems for power transformer condition monitoring and diagnostics. Electr. Power Syst. Res. 2017, 149, 125–136. [Google Scholar] [CrossRef]
  19. Rigatos, G.; Siano, P. Power transformers’ condition monitoring using neural modeling and the local statistical approach to fault diagnosis. Int. J. Electr. Power Energy Syst. 2016, 80, 150–159. [Google Scholar] [CrossRef]
  20. Soliman, A.; Elhemaly, M.; Ghoneim, S.S.M. Integrating Machine Learning Models for Enhancing Power Transformer Health Assessment Based on the Insulating Paper State. Measurement 2025, 256, 118222. [Google Scholar] [CrossRef]
  21. Wan, A.; Peng, S.; AL-Bukhaiti, K.; Ji, Y.; Ma, S. The early warning method for offshore wind turbine gearbox oil temperature based on FSTAE-ATT. Sustain. Comput. Inform. Syst. 2025, 47, 101180. [Google Scholar] [CrossRef]
  22. Guo, H.; Guo, L. Health index for power transformer condition assessment based on operation history and test data. Energy Rep. 2022, 8, 9038–9045. [Google Scholar] [CrossRef]
  23. Liu, G.; Su, Z.; Luo, B.; Zhu, Y. GSLI-RTMdet: An automatic nondestructive detection method for internal defects in gas-insulated switchgear X-DR images. High Volt. 2025, 10, 890–902. [Google Scholar] [CrossRef]
  24. Abu-Elanien, A.E.B.; Salama, M.M.A.; Ibrahim, M. Calculation of a Health Index for Oil-Immersed Transformers Rated Under 69 kV Using Fuzzy Logic. IEEE Trans. Power Deliv. 2012, 27, 2029–2036. [Google Scholar] [CrossRef]
  25. Badawi, M.; Ibrahim, S.A.; Mansour, D.-E.A.; El-Faraskoury, A.A.; Ward, S.A.; Mahmoud, K.; Lehtonen, M.; Darwish, M.M.F. Reliable Estimation for Health Index of Transformer Oil Based on Novel Combined Predictive Maintenance Techniques. IEEE Access 2022, 10, 25954–25972. [Google Scholar] [CrossRef]
  26. Ghunem, R.A.; Assaleh, K.; El-Hag, A.H. Artificial neural networks with stepwise regression for predicting transformer oil furan content. IEEE Trans. Dielectr. Electr. Insul. 2012, 19, 414–420. [Google Scholar] [CrossRef]
  27. Arsya, N.R.; Suwarno, N.; Prasojo, R.A.; Sudrajad, G.A.; Abu-Siada, A. A Holistic Integration of Conventional and Machine Learning Techniques to Enhance the Analysis of Power Transformer Health Index Considering Data Unavailability. IEEE Access 2024, 12, 124549–124561. [Google Scholar] [CrossRef]
  28. Breiman, L. Random Forests. Mach. Learn. 2001, 45, 5–32. [Google Scholar] [CrossRef]
  29. Kecman, V. Support Vector Machines—An Introduction. In Support Vector Machines: Theory and Applications; Springer: Berlin/Heidelberg, Germany, 2005; pp. 1–47. [Google Scholar] [CrossRef]
  30. Zhou, Z.-H.; Chen, Z.-Q. Hybrid decision tree. Knowl.-Based Syst. 2002, 15, 515–528. [Google Scholar] [CrossRef]
  31. Wani, S.A.; Rana, A.S.; Sohail, S.; Rahman, O.; Parveen, S.; Khan, S.A. Advances in DGA based condition monitoring of transformers: A review. Renew. Sustain. Energy Rev. 2021, 149, 111347. [Google Scholar] [CrossRef]
  32. Cheim, L.; Platts, D.; Prevost, T.; Xu, S. Furan analysis for liquid power transformers. IEEE Electr. Insul. Mag. 2012, 28, 8–21. [Google Scholar] [CrossRef]
  33. Arsad, S.R.; Ker, P.J.; Jamaludin, Z.; Choong, P.Y.; Lee, H.J.; Thiviyanathan, V.A.; Ghazali, Y.Z.Y. Water Content in Transformer Insulation System: A Review on the Detection and Quantification Methods. Energies 2023, 16, 1920. [Google Scholar] [CrossRef]
  34. Zemouri, R. Power Transformer Prognostics and Health Management Using Machine Learning: A Review and Future Directions. Machines 2025, 13, 125. [Google Scholar] [CrossRef]
  35. Srividhya, V.; Babu, J.S.; Sujatha, K.; Veerendrakumar, J.; Aruna, M.; Shafiya, S.; Krishna, S.; Anand, M. Determination of Breakdown Voltage for Transformer Oil Testing Using ANN. In Congress on Intelligent Systems; Advances in Intelligent Systems and Computing; Springer: Singapore, 2021; pp. 443–452. [Google Scholar] [CrossRef]
  36. Zeinoddini-Meymand, H.; Vahidi, B. Health index calculation for power transformers using technical and economical parameters. IET Sci. Meas. Technol. 2016, 10, 823–830. [Google Scholar] [CrossRef]
  37. Hadi, M.H.H.; Ker, P.J.; Lee, H.J.; Leong, Y.S.; Thiviyanathan, V.A.; Hannan, M.A.; Jamaludin, Z.; Mahdi, M.A. Measuring Color Index of Transformer Oil–Enabling Single-Wavelength Spectroscopy With Artificial Neural Network-Fuzzy Logic Model. IEEE Trans. Autom. Sci. Eng. 2024, 21, 1358–1368. [Google Scholar] [CrossRef]
  38. Forouhari, S.; Abu-Siada, A. Remnant life estimation of power transformer based on IFT and acidity number of transformer oil. In Proceedings of the 2015 IEEE 11th International Conference on the Properties and Applications of Dielectric Materials (ICPADM); IEEE: New York, NY, USA, 2015. [Google Scholar] [CrossRef]
  39. Prasetyo, A.; Supriyanto, E. Failure Analysis of Power Transformer Based on Transformer Turn Ratio Test and SFRA. J. Phys. Conf. Ser. 2021, 1817, 012021. [Google Scholar] [CrossRef]
  40. Tharamal, L.; Preetha, P.; Sindhu, T.K. Assessing the Degradation of Transformer Oil From Partial Discharge Measurement Data Using Histogram Similarity Measures. IEEE Trans. Instrum. Meas. 2022, 71, 1006810. [Google Scholar] [CrossRef]
  41. Ahmad Khiar, M.S.; Md Thayoob, Y.H.; Yang Ghazali, Y.Z.; Ab Ghani, S.; Chairul, I.S. Condition assessment of OLTC using duval triangle and static winding resistance test. In Proceedings of the 2012 IEEE International Power Engineering and Optimization Conference; IEEE: New York, NY, USA, 2012. [Google Scholar] [CrossRef]
  42. Leu, B.; Seritan, G.; Enache, B.; Tănăsescu, G.; Porumb, R.; Vilciu, I. Power Transformers Loss Of Life Evaluation Using Winding Insulation Resistance Calculation Model. In Proceedings of the 2023 15th International Conference on Electronics, Computers and Artificial Intelligence (ECAI); IEEE: New York, NY, USA, 2023; pp. 1–4. [Google Scholar] [CrossRef]
  43. Fabio, E.A. Smart Monitoring of Power Transformers in Substation 4.0: Multi-Sensor Integration and Machine Learning Approach. Sensors 2025, 25, 5469. [Google Scholar] [CrossRef] [PubMed]
  44. Cen, J.; Yang, Z.; Liu, X.; Xiong, J.; Chen, H. A Review of Data-Driven Machinery Fault Diagnosis Using Machine Learning Algorithms. J. Vib. Eng. Technol. 2022, 10, 2481–2507. [Google Scholar] [CrossRef]
  45. Esmaeili Nezhad, A.; Samimi, M.H. A review of the applications of machine learning in the condition monitoring of transformers. Energy Syst. 2022, 15, 463–493. [Google Scholar] [CrossRef]
  46. Hussain, S.; Mustafa, M.W.; Al-Shqeerat, K.H.A.; Saeed, F.; Al-rimy, B.A.S. A Novel Feature-Engineered–NGBoost Machine-Learning Framework for Fraud Detection in Electric Power Consumption Data. Sensors 2021, 21, 8423. [Google Scholar] [CrossRef] [PubMed]
  47. Shijie, G.; Zhao, Y.; Song, R.; Wu, Z. An Interpretable CatBoost-Based Method for Multi-Feature Fault Diagnosis of Power Transformers. In Proceedings of the 2025 China Automation Congress (CAC), Harbin, China, 26–28 September 2025; IEEE: New York, NY, USA, 2025; pp. 7092–7097. [Google Scholar] [CrossRef]
  48. Ghoneim, S.S.M.; Baz, M.; Alzaed, A.; Zewdie, Y.T. Predicting the insulating paper state of the power transformer based on XGBoost/LightGBM models. Sci. Rep. 2025, 15, 17836. [Google Scholar] [CrossRef] [PubMed]
  49. Shen, Z.; Fan, X.; Zhang, L.; Yu, H. Wind speed prediction of unmanned sailboat based on CNN and LSTM hybrid neural network. Ocean Eng. 2022, 254, 111352. [Google Scholar] [CrossRef]
  50. Yan, Y.; Jin, L.; Chen, J.; Yang, Y.; Li, H. Robust Hierarchical Traveling-Wave Partial Discharge Localization for Efficient Insulation Defect Detection of Medium-Voltage Overhead Lines. IEEE Trans. Instrum. Meas. 2026, 75, 3507915. [Google Scholar] [CrossRef]
  51. Ratner, B. The Correlation coefficient: Its Values Range between +1/−1, or Do they? J. Target. Meas. Anal. Mark. 2009, 17, 139–142. [Google Scholar] [CrossRef]
  52. Karunasingha, D.S.K. Root Mean Square Error or Mean Absolute Error? Use their ratio as well. Inf. Sci. 2021, 585, 609–629. [Google Scholar] [CrossRef]
Figure 1. Causes of power transformer failure [8].
Energies 19 03653 g001
Figure 2. Drawbacks of the traditional (rule-based scoring and weighting) HI approach.
Energies 19 03653 g002
Figure 3. Schematic of methodology.
Energies 19 03653 g003
Figure 4. Diagnostic parameters of the transformer.
Energies 19 03653 g004
Figure 5. Classification of machine learning.
Energies 19 03653 g005
Figure 6. Comparison of R2 scores across machine learning regression models for the prediction accuracy of HI.
Energies 19 03653 g006
Figure 7. Comparison of MAE values across machine learning regression models for error assessment in HI prediction.
Energies 19 03653 g007
Figure 8. Regression plot of the top-performing model (CatBoost Regressor).
Energies 19 03653 g008
Figure 9. Heatmap of the correlation matrix illustrating dependencies among the diagnostic input parameters and the targeted output parameter (HI).
Energies 19 03653 g009
Table 1. Details of power transformers at 500 kV grid station, Rahim Yar Khan.
Sr. No.Transformer NameTechnical Details
1ATB2(RED), 525/231/23 kV, 200 MVA, (TBEA China)
2(Yellow), 525/231/23 kV, 200 MVA, (TBEA China)
3(Blue), 525/231/23 kV, 200 MVA, (TBEA China)
4ATB3(RED), 525/231/23 kV, 200 MVA, (TBEA China)
5(Yellow), 525/231/23 kV, 200 MVA, (TBEA China)
6(Blue), 525/231/23 kV, 200 MVA, (TBEA China)
7Spare (ATB2 and ATB3)(Spare), 525/231/23 kV, 200 MVA, (TBEA China)
8T5220/132/11 kV, 250 MVA, (TBEA China)
9T6220/132/11 kV, 250 MVA, (TBEA China)
10T7132/11.5 kV, 6.3 MVA, (TBEA China)
Table 2. Case study I results outlining predicted health index, operational status, and actionable maintenance for the power transformer fleet at 500 kV grid station, Rahim Yar Khan.
Sr. No.Transformer NamePredicted HIHealth ConditionMaintenance Action
1ATB2 (Red)92%HealthyNone
2ATB2 (Yellow)91%HealthyNone
3ATB2 (Blue)92%HealthyNone
4ATB3 (Red)92%HealthyNone
5ATB3 (Yellow)91%HealthyNone
6ATB3 (Blue)91%HealthyNone
7Spare (ATB2 and ATB3)96%HealthyNone
8T587%HealthyNone
9T688%HealthyNone
10T794%HealthyNone
Table 3. Details of power transformers at 500 kV grid station, Multan.
Sr. No.Transformer NameTechnical Details
1T1(RED), 525/231/22 kV, 150 MVA, (TOSHIBA Japan)
2(Yellow), 525/231/22 kV, 150 MVA, (TOSHIBA Japan)
3(Blue), 525/231/22 kV, 150 MVA, (TOSHIBA Japan)
4T2(RED), 525/231/22 kV, 150 MVA, (TOSHIBA Japan)
5(Yellow), 525/231/22 kV, 150 MVA, (TOSHIBA Japan)
6(Blue), 525/231/22 kV, 150 MVA, (TOSHIBA Japan)
7T7(RED), 525/231/22 kV, 150 MVA, (TBEA China)
8(Yellow), 525/231/22 kV, 150 MVA, (TBEA China)
9(Blue), 525/231/22 kV, 150 MVA, (TBEA China)
10Spare (T1, T2, and T7)(Spare), 525/231/22 kV, 150 MVA, (TBEA China)
11T3220/132/11 kV, 250 MVA, (BEST Turkey)
12T4220/132/11 kV, 250 MVA, (BEST Turkey)
13T5220/132/11 kV, 250 MVA, (BEST Turkey)
14T6132/11 kV, 6.3 MVA, (ELECTROPUTERO Romania)
Table 4. Case study II results outlining predicted health index, operational status, and actionable maintenance for the power transformer fleet at 500 kV grid station, Multan.
Sr. No.Transformer NamePredicted HIHealth ConditionMaintenance Action
1T1 (Red)75%Moderate
deterioration
Corrective maintenance
2T1 (Yellow)74%Moderate
deterioration
Corrective maintenance
3T1 (Blue)74%Moderate
deterioration
Corrective maintenance
4T2 (Red)74%Moderate
deterioration
Corrective maintenance
5T2 (Yellow)74%Moderate
deterioration
Corrective maintenance
6T2 (Blue)73%Moderate
deterioration
Corrective maintenance
7T7 (Red)96%HealthyNone
8T7 (Yellow)97%HealthyNone
9T7 (Blue)97%HealthyNone
10Spare (T1, T2, and T7)98%HealthyNone
11T396%HealthyNone
12T496%HealthyNone
13T596%HealthyNone
14T685%HealthyNone
Table 5. Standard cost schedule (in PKR) for power transformer diagnostic testing by HV & SC Lab, Islamabad.
Sr. No.Test NameCost (PKR)
1Dissipation Factor (DF) Test72,000
2Capacitance Test72,000
3Insulation Resistance (IR) Test60,000
4Transformer Turn Ratio (TTR) Test55,000
5Winding Resistance (WR) Test55,000
6Dissolved Gas Analysis (DGA) Test55,000
7Partial Discharge (PD) Test48,000
8Furan Analysis Test17,000
9Water Content Test11,000
10Dielectric Dissipation Factor (DDF) Test 10,500
11Breakdown Voltage (BDV) Test7500
12Acidity Test6000
13Interfacial Tension (IFT) Test5500
14Color Test1700
Cumulative Sum476,200
Miscellaneous Charges
1Labor Cost 40,000
2Safety Inspection Cost20,000
3Shipping and Handling Cost15,000
Total Cost551,200
Table 6. Economic analysis and cost optimization of ATB2 at 500 kV grid station, Rahim Yar Khan.
Sr. No.T/F NameTest SkippedActual HIPredicted HI% Diff.Cost Saved (PKR)
1(Red) ATB21 (DF)97%99%0.33%
(ATB2)
72,000
(13.06%)
(each unit)
2(Yellow) ATB21 (DF)97%97%
3(Blue) ATB21 (DF)97%96%
4(Red) ATB22 (DF, Capacitance)97%97%1%
(ATB2)
144,000
(26.12%)
(each unit)
5(Yellow) ATB22 (DF, Capacitance)97%95%
6(Blue) ATB22 (DF, Capacitance)97%96%
7(Red) ATB23 (DF, Capacitance, IR)97%99%1.33%
(ATB2)
204,000
(37.01%)
(each unit)
8(Yellow) ATB23 (DF, Capacitance, IR)97%98%
9(Blue) ATB23 (DF, Capacitance, IR)97%98%
10(Red) ATB24 (DF, Capacitance, IR, TTR)97%96%1.34%
(ATB2)
259,000
(46.99%)
(each unit)
11(Yellow) ATB24 (DF, Capacitance, IR, TTR)97%96%
12(Blue) ATB24 (DF, Capacitance, IR, TTR)97%95%
13(Red) ATB25 (DF, Capacitance, IR, TTR, WR)97%95%4%
(ATB2)
0
(% diff. is too high)
14(Yellow) ATB25 (DF, Capacitance, IR, TTR, WR)97%92%
15(Blue) ATB25 (DF, Capacitance, IR, TTR, WR)97%92%
Disclaimer/Publisher’s Note: The statements, opinions and data contained in all publications are solely those of the individual author(s) and contributor(s) and not of MDPI and/or the editor(s). MDPI and/or the editor(s) disclaim responsibility for any injury to people or property resulting from any ideas, methods, instructions or products referred to in the content.