1. Introduction
In recent years, with the rapid development of electric power systems, transmission and distribution networks have progressively transformed from conventional power delivery infrastructures into distributed smart grids characterized by the integration and interaction of generation, grid, load, and storage. Safe, stable, and efficient operation of transmission and distribution networks has become a fundamental requirement for reliable power system performance. Among the various components deployed along these networks, line fittings and structural elements play essential roles in current carrying, insulation, mechanical fixation, and system stability. Consequently, accurate and efficient localization of defective line components has become an increasingly important topic in power-grid operation and maintenance [
1,
2].
Traditional inspection of transmission and distribution networks relies heavily on manual experience. This approach consumes substantial human and time resources, while inspection personnel often struggle to visually identify defects located at tower tops or cable connection points. Therefore, there is an urgent need for efficient and safe defect detection methods for line components. With the development of deep learning and unmanned aerial vehicle (UAV) technologies, UAV-borne object detection methods have gradually become a mainstream solution for defect inspection because of their high efficiency and operational safety [
3].
Earlier defect detection methods for transmission and distribution network components mainly relied on handcrafted feature descriptors, morphological operations, and other conventional image-processing techniques to extract structural and texture features from multi-image samples. However, such methods are highly sensitive to imaging quality and environmental interference, making them insufficient for high-precision inspection tasks. With advances in deep learning, an increasing number of component defect detection methods based on convolutional neural networks have been proposed. Representative frameworks such as YOLO and Faster R-CNN have often been used as baselines, and performance improvements are typically pursued through architectural modifications [
4,
5]. For power-line component inspection, CNN-based insulator defect detection, automatic visual shape clustering for pin-missing defects, knowledge-guided multifitting detection, knowledge-reasoning-based bolt defect detection, and YOLO-series plug-in enhancement have been explored to improve the recognition of small, visually similar, and structurally complex defects [
6,
7,
8,
9,
10]. In addition, image-processing-based intelligent diagnosis has also been applied to other power equipment fault-detection tasks, such as transformer winding fault detection using three-dimensional frequency response signatures [
11]. Beyond model architecture, the reliability of data sources and environmental variability are also critical factors affecting data-driven energy applications. Recent studies in renewable-energy forecasting have highlighted the importance of considering observation uncertainty and environmental variations when evaluating data-driven models [
12]. Existing improvements can generally be divided into two categories. The first enhances feature extraction capability by strengthening backbone networks, introducing attention mechanisms, or improving multi-scale feature fusion. The second incorporates prior knowledge to improve target representation and extraction. In practice, convolutional variants, data augmentation strategies, and loss-function refinements are also widely adopted as auxiliary enhancements.
Although these methods have improved detection performance, most of them are designed for single defects on specific components and therefore may exhibit limited robustness when transferred to more diverse maintenance scenarios. Moreover, methods based only on two-dimensional image data cannot explicitly model the spatial structure of transmission and distribution components, resulting in incomplete feature representation for defects. In typical power-line scenes with cluttered backgrounds, dense structures, and heavy occlusions, such methods often fail to achieve stable and accurate detection.
To improve the holistic perception of transmission and distribution lines, integrating information from different modalities has become a promising direction. Preliminary multimodal defect detection studies have already appeared in the literature. For example, RGB-depth fusion has been investigated for real-time object detection, large-scale monocular depth estimation provides a feasible way to obtain dense structural priors, and multimodal visible/infrared benchmarks such as M3FD have promoted object detection under complex multi-scenario conditions [
13,
14,
15]. In addition, recent studies on multimodal biomedical sensing and robotic imaging have shown that motion-derived features, anatomical image segmentation, and automatic three-dimensional reconstruction can effectively enhance spatial structure understanding in complex visual perception tasks [
16,
17,
18]. Nevertheless, multimodal detection in complex power scenarios still faces several challenges. First, the applicability of some modalities is limited. Infrared imaging, for example, mainly depends on temperature abnormalities and is less effective for common structural defects that cannot be clearly described by thermal information. Second, existing cross-modal fusion schemes often suffer from disordered spatial coupling and insufficient structural-semantic alignment, which negatively affects the fusion of dual-modal target features, especially for conductor-attached components. Third, existing methods often fail to effectively separate background environments from power equipment, leading to feature confusion and false detections.
Related geometric modeling and positional attention mechanisms, such as deformable convolution and coordinate attention, show that adaptive spatial sampling and direction-aware coordinate encoding can improve visual representation under structural deformation and positional ambiguity [
19,
20]. To address the above issues, this paper proposes a dual-modal defect detection model that integrates depth spatial information with visible-light imagery. By combining monocular relative-depth maps and visible-light images, the model learns complementary spatial and positional features that allow it to focus more accurately on transmission and distribution line components while reducing excessive sensitivity to background content. The spatial relationships encoded in depth information improve the model’s ability to learn both component categories and associated defects, forming a more robust defect detection framework for the evaluated inspection scenarios. To better exploit complementary target characteristics across modalities, this study further introduces an adaptive progressive fusion mechanism that performs feature interaction according to the information content at different network depths. In addition, a coordinate attention mechanism is used to strengthen the model’s ability to learn spatial location information and suppress background interference. Comparative experiments show that the proposed approach can precisely localize typical transmission and distribution line defects under different scenarios, improve robustness across the evaluated scenes, and verify the feasibility of multimodal depth-visible fusion for power-line defect inspection.
The main contributions of this study are summarized as follows:
A dual-modal defect detection framework is proposed for transmission and distribution line inspection, in which visible-light images provide appearance cues and monocular relative-depth maps generated from the same RGB frames provide auxiliary spatial and positional information to improve defect localization under occlusion and complex backgrounds.
An adaptive progressive feature fusion mechanism is designed to perform coarse-to-fine multimodal interaction across different network depths, enabling effective integration of shallow texture cues, middle-level regional information, and deep semantic features.
A coordinate attention mechanism is incorporated to strengthen spatial positional encoding and suppress background interference, thereby improving the detection of small, occluded, and visually ambiguous defects in power-line scenes.
A self-constructed dataset containing 9838 RGB images paired with monocular relative-depth maps is established, and extensive experiments demonstrate that the proposed method achieves 92.4% mAP@50 and 67.1% mAP@50–95, showing competitive performance against recent mainstream detectors.
2. Research Background
During long-term operation, typical transmission and distribution line components are vulnerable to a wide range of external environmental conditions, loading states, and aging effects, which may induce multiple forms of defects and degradation. Consistent with the defect-classification logic of State Grid enterprise standards, these defects can generally be classified into two broad categories: mechanical structural damage, such as deformation, fracture, and looseness; and surface deterioration, such as corrosion, wear, coating loss, and local breakage [
21,
22]. In many cases, relatively typical or simple defects appear as large targets with distinct visual characteristics and can be recognized with high accuracy using conventional inspection methods. However, power-line inspection in complex operating environments also involves small defects and occluded defects. These targets are difficult to detect because of their small size, concealed shape, indistinct texture, and partial obstruction by nearby components or vegetation. As a result, they have become a major focus and challenge in current research.
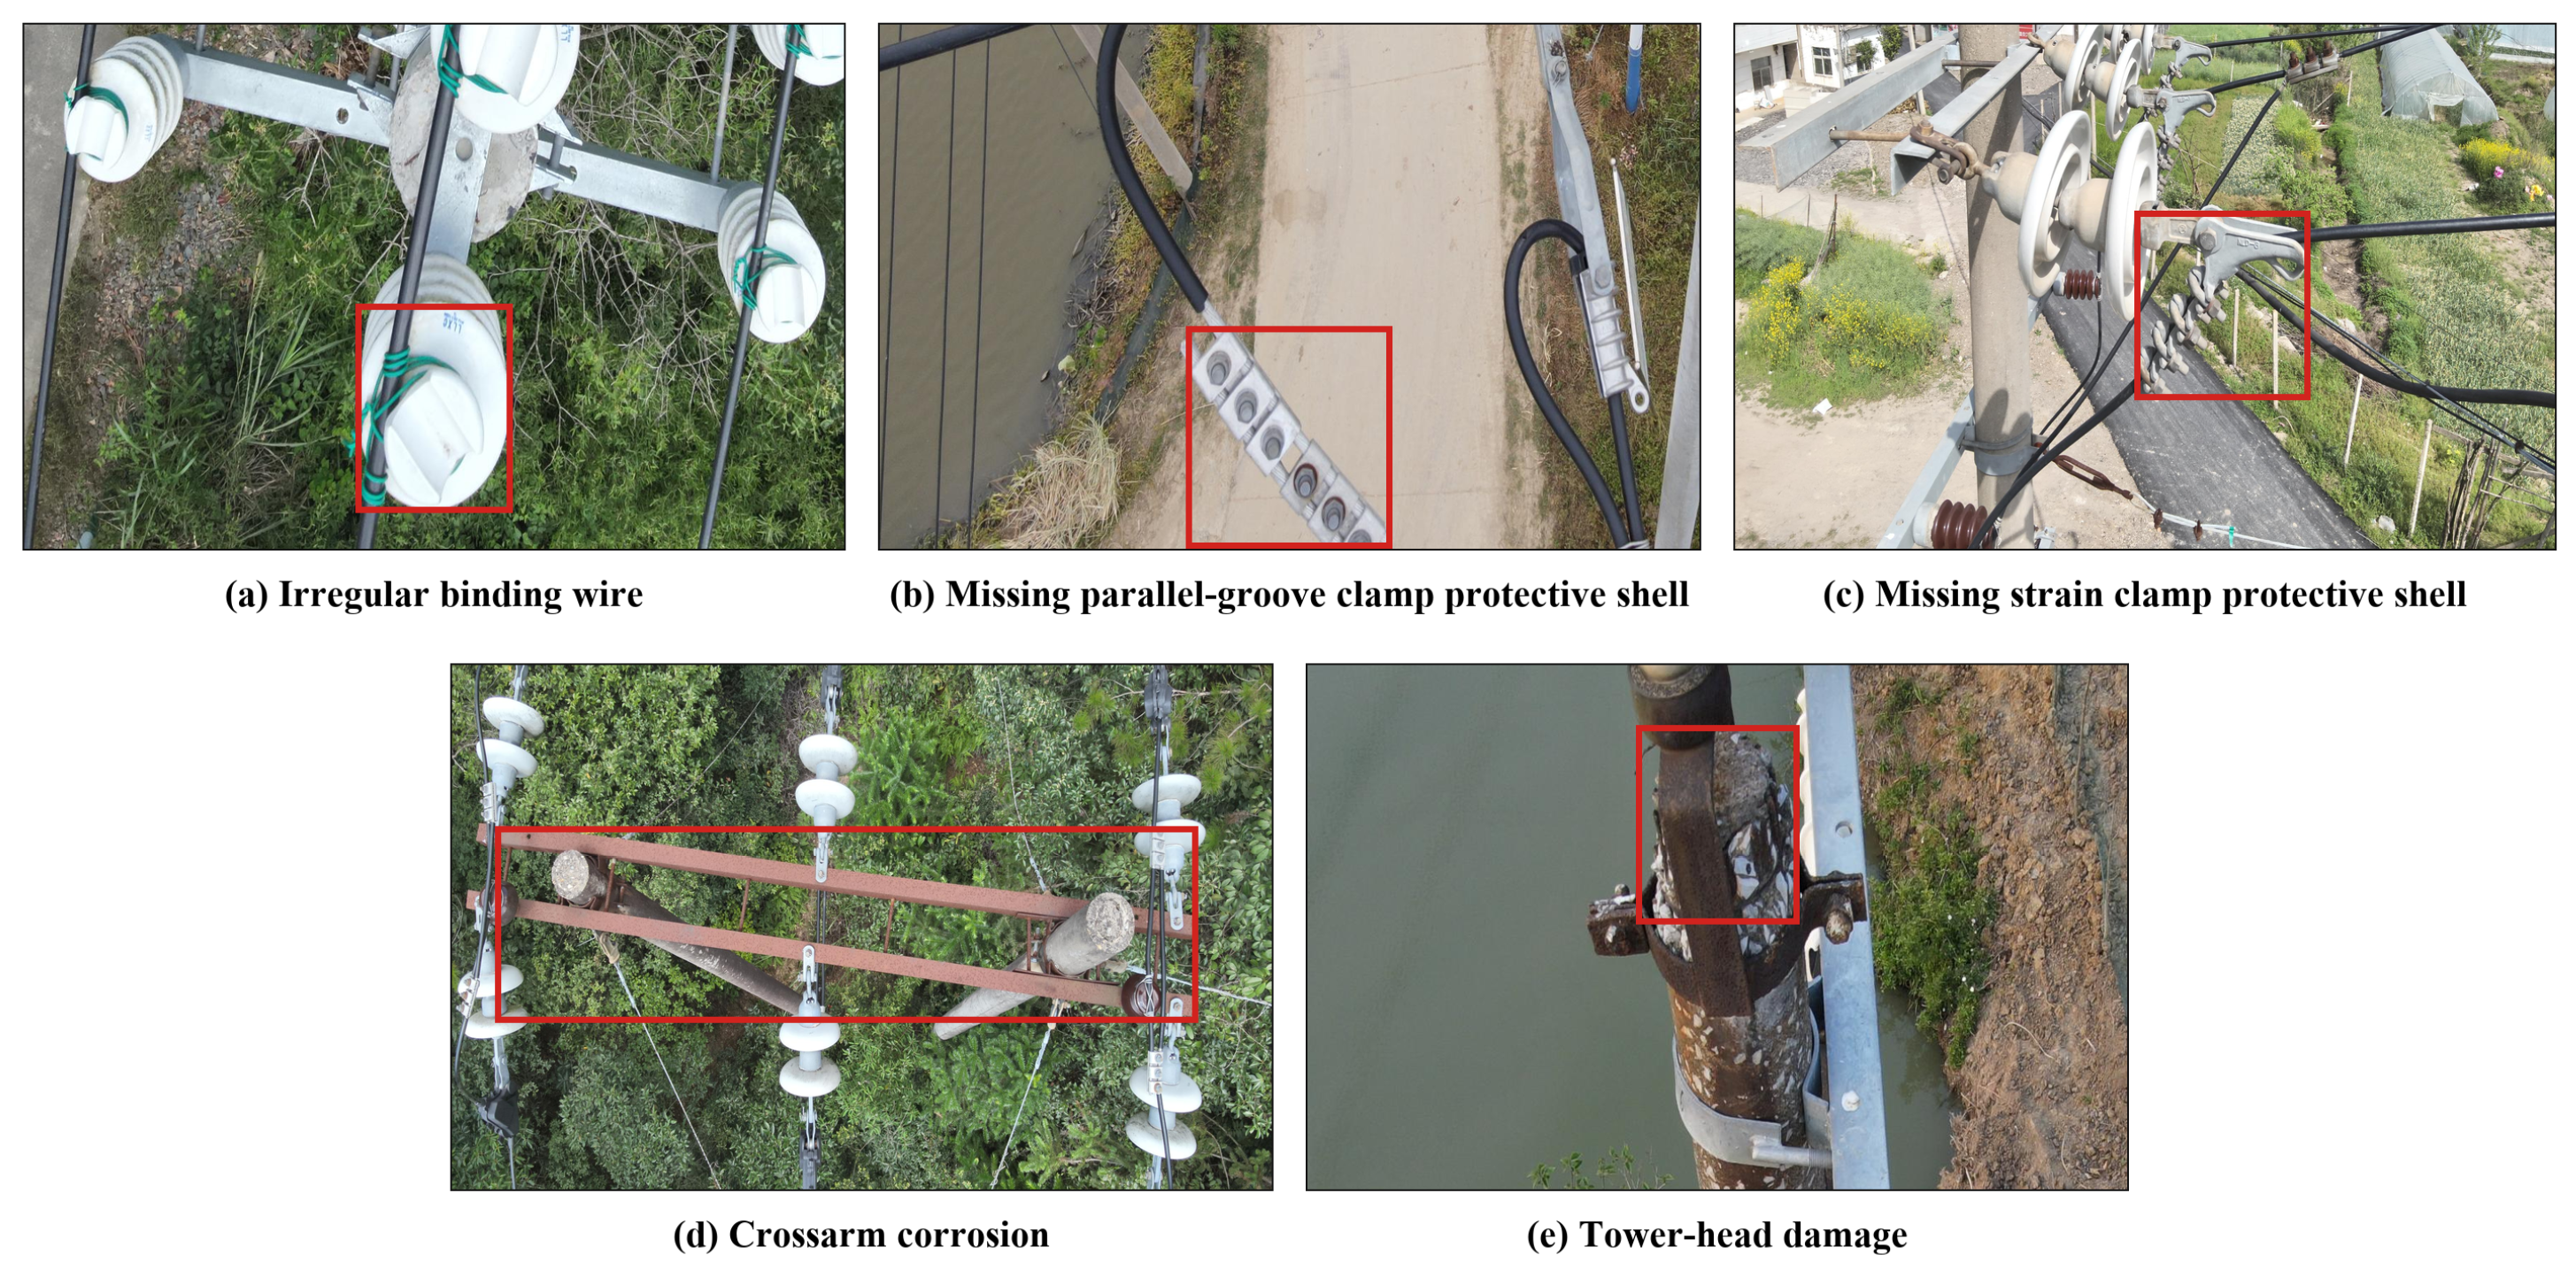
In this study, small-target defects and occlusion-related defects are selected as the primary research objects, and representative targets from transmission and distribution scenarios are modeled and validated. Specifically, the work focuses on five typical defect categories with high practical relevance: tower-head damage, crossarm corrosion, irregular binding wire, missing parallel-groove clamp protective shell, and missing strain clamp protective shell. These defects not only occur frequently in practical inspections, but also exhibit common challenges in image recognition, including small target scale, blurred boundaries, strong background interference, and partial occlusion. Such characteristics impose higher requirements on the feature extraction and discrimination capabilities of detection models. Representative examples of the five defect categories are shown in
Figure 1.
More importantly, these components all play key roles in the safe and stable operation of transmission and distribution lines. For example, tower heads and crossarms are directly related to the overall structural bearing capacity and stability of the line system, whereas binding wires and clamps are essential for conductor fixation and reliable current transmission. Once defects or failures occur in these components, not only may the mechanical strength of the transmission and distribution system be weakened, but local electrical performance may also deteriorate, thereby causing broader safety hazards. Therefore, high-precision detection of small and occluded defects has both important theoretical significance and substantial engineering value.
3. Defect Target Detection Network Integrating Depth Spatial Information and Adaptive Progressive Feature Fusion
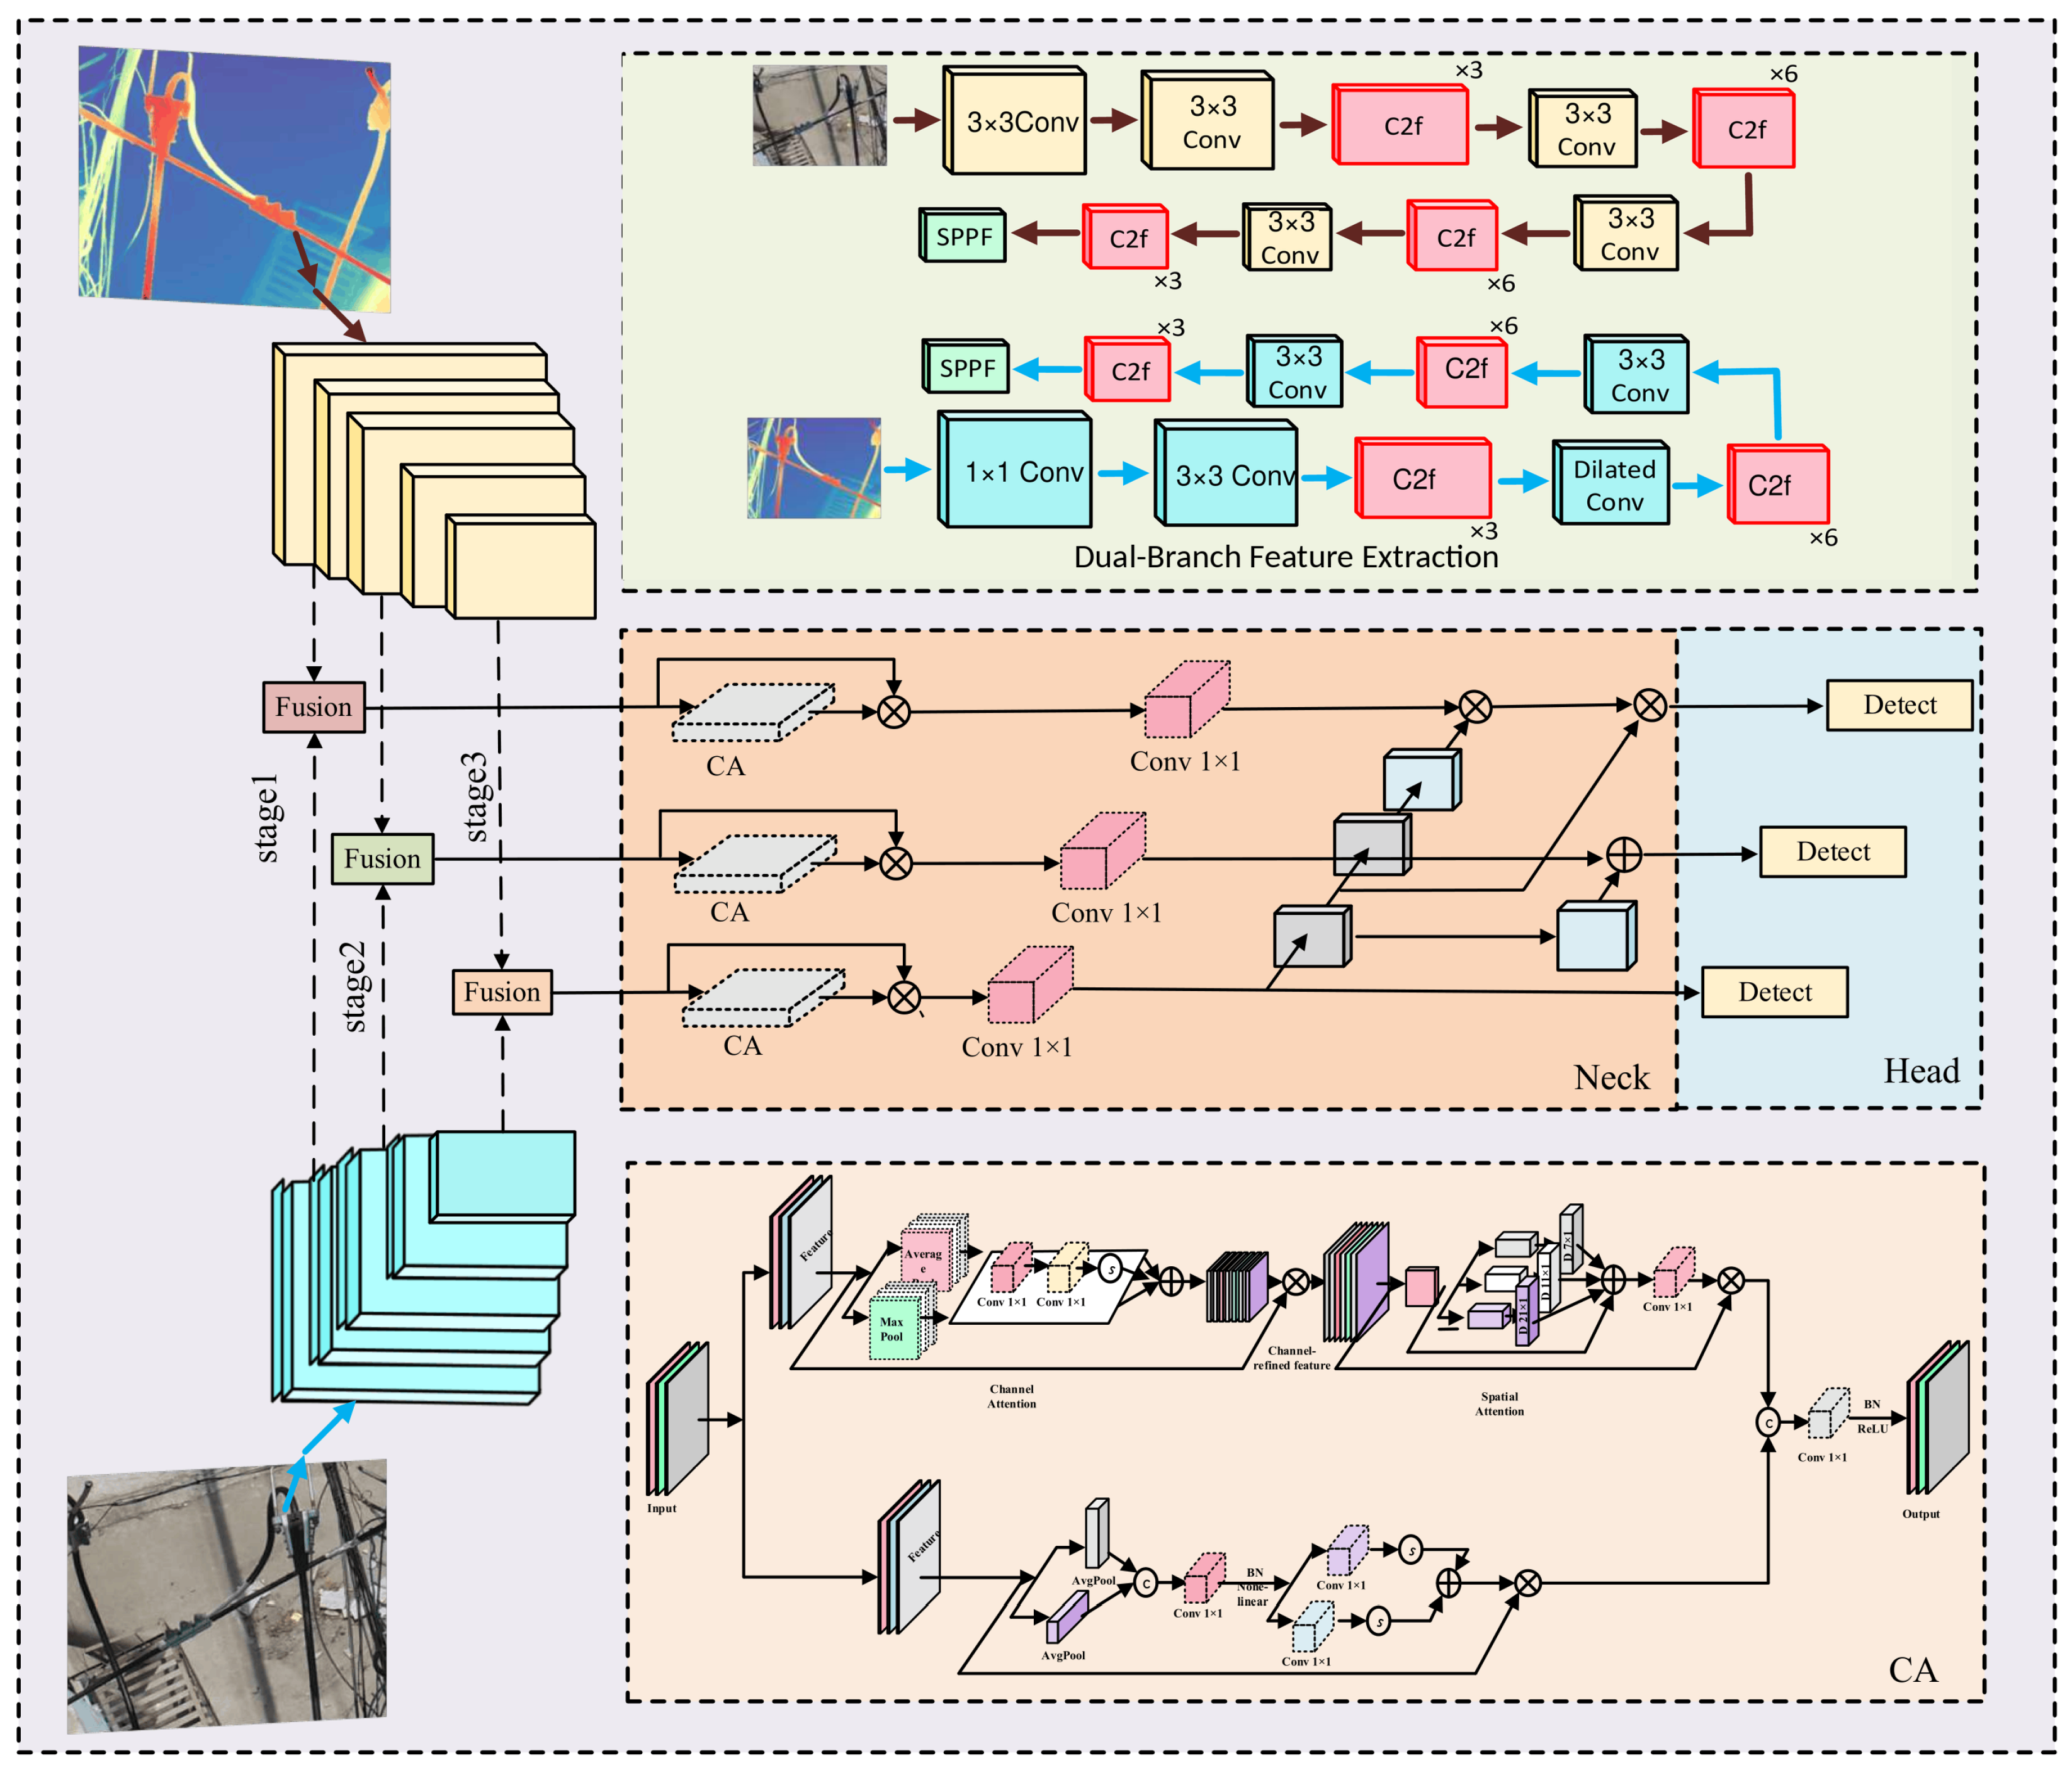
YOLO is a representative one-stage object detection model with advantages in both detection accuracy and inference speed. Its core idea is to use convolutional neural networks to extract image features for direct target localization and classification. However, backbone networks of this type often struggle to perform effective multi-scale feature extraction for small and occluded defect targets in transmission and distribution line scenes. When handling defects with varying scales, the model may lack sufficient sensitivity to subtle image patterns and may fail to capture fine-grained local defect details. In addition, conventional RGB images cannot explicitly describe front-back occlusion relationships among line components. To address the challenges of scale variation, complex background interference, and incomplete image information in power-line defect detection, this paper proposes a defect target detection network integrating depth spatial information and adaptive progressive feature fusion. The overall architecture is conceptually illustrated in
Figure 2.
The model processes the input through two channels. One branch performs conventional feature extraction on visible-light RGB images to obtain appearance cues such as color and texture. The other branch extracts features from monocular relative-depth maps generated from the same RGB frames, thereby learning auxiliary structural relationships and depth cues while avoiding the synchronization and registration issues associated with separate depth sensors. After feature extraction, adaptive progressive feature fusion is used to combine multimodal information from coarse to fine. Finally, a coordinate attention mechanism enhances the learning of spatial location and depth-aware target information, allowing the model to perceive defect features more sensitively in complex transmission and distribution line backgrounds.
3.1. Visible-Light and Relative-Depth Feature Extraction Branches
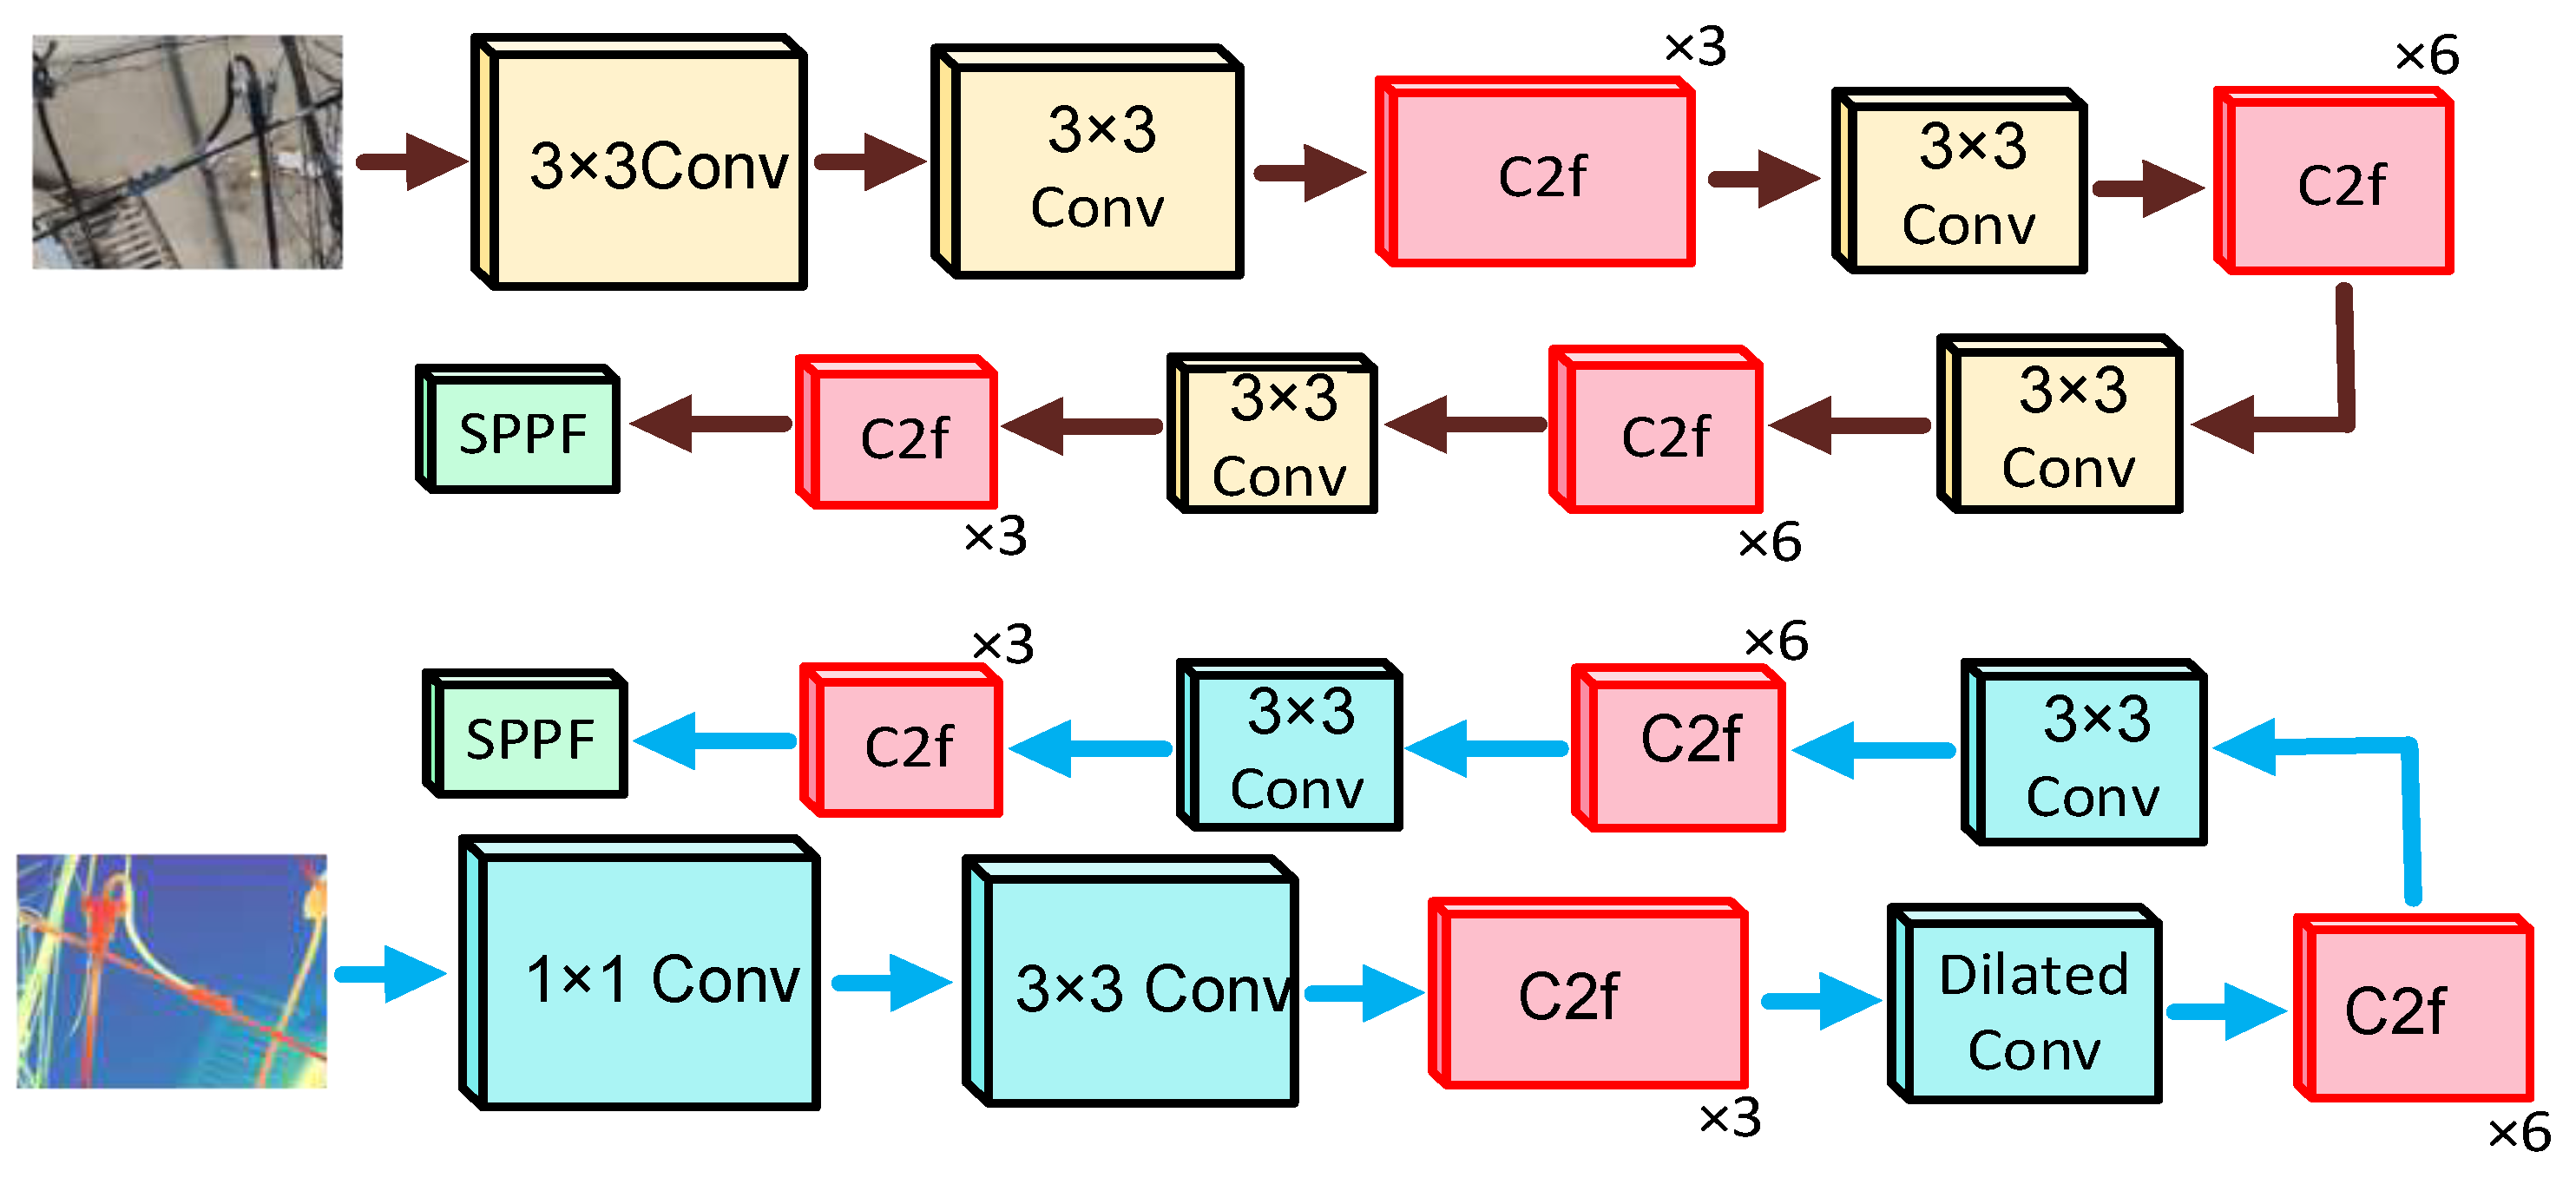
To address severe occlusion and ambiguous positional information in transmission and distribution defect targets, this study introduces a monocular-depth processing branch on top of a conventional vision model. The depth branch learns relative structural relationships among targets in the original scene and compensates for the insensitivity of traditional target detection models to spatial information. The depth feature extractor adopts a five-layer convolutional structure. The first layer uses a convolution to extract depth-related features and reduce the distribution gap between the depth modality and the visible-light modality. The following four layers use convolutions and share weights with the visible-light branch to extract deeper semantic representations.
To realize effective integration between visible-light and depth images, adaptive progressive feature fusion modules are inserted between Layers 2 and 4. These modules calculate the discrepancy between depth features and visible-light features and feed weighted discrepancy information back into the depth branch for complementary enhancement. During the entire extraction process, the original image resolution is preserved, while depth-based spatial relationships and appearance-based texture details are progressively extracted and fused layer by layer. This design provides complementary dual-modal support for subsequent defect detection. The dual-modal feature extraction pipeline is illustrated in
Figure 3.
3.2. Adaptive Progressive Feature Fusion Module
Because the proposed model extracts target features from both RGB images and depth maps, simple feature concatenation or direct fusion may easily cause modal conflicts or loss of critical information. Therefore, this paper proposes an adaptive progressive feature fusion method that enables high-precision feature alignment and integration through multi-stage fusion from coarse to fine.
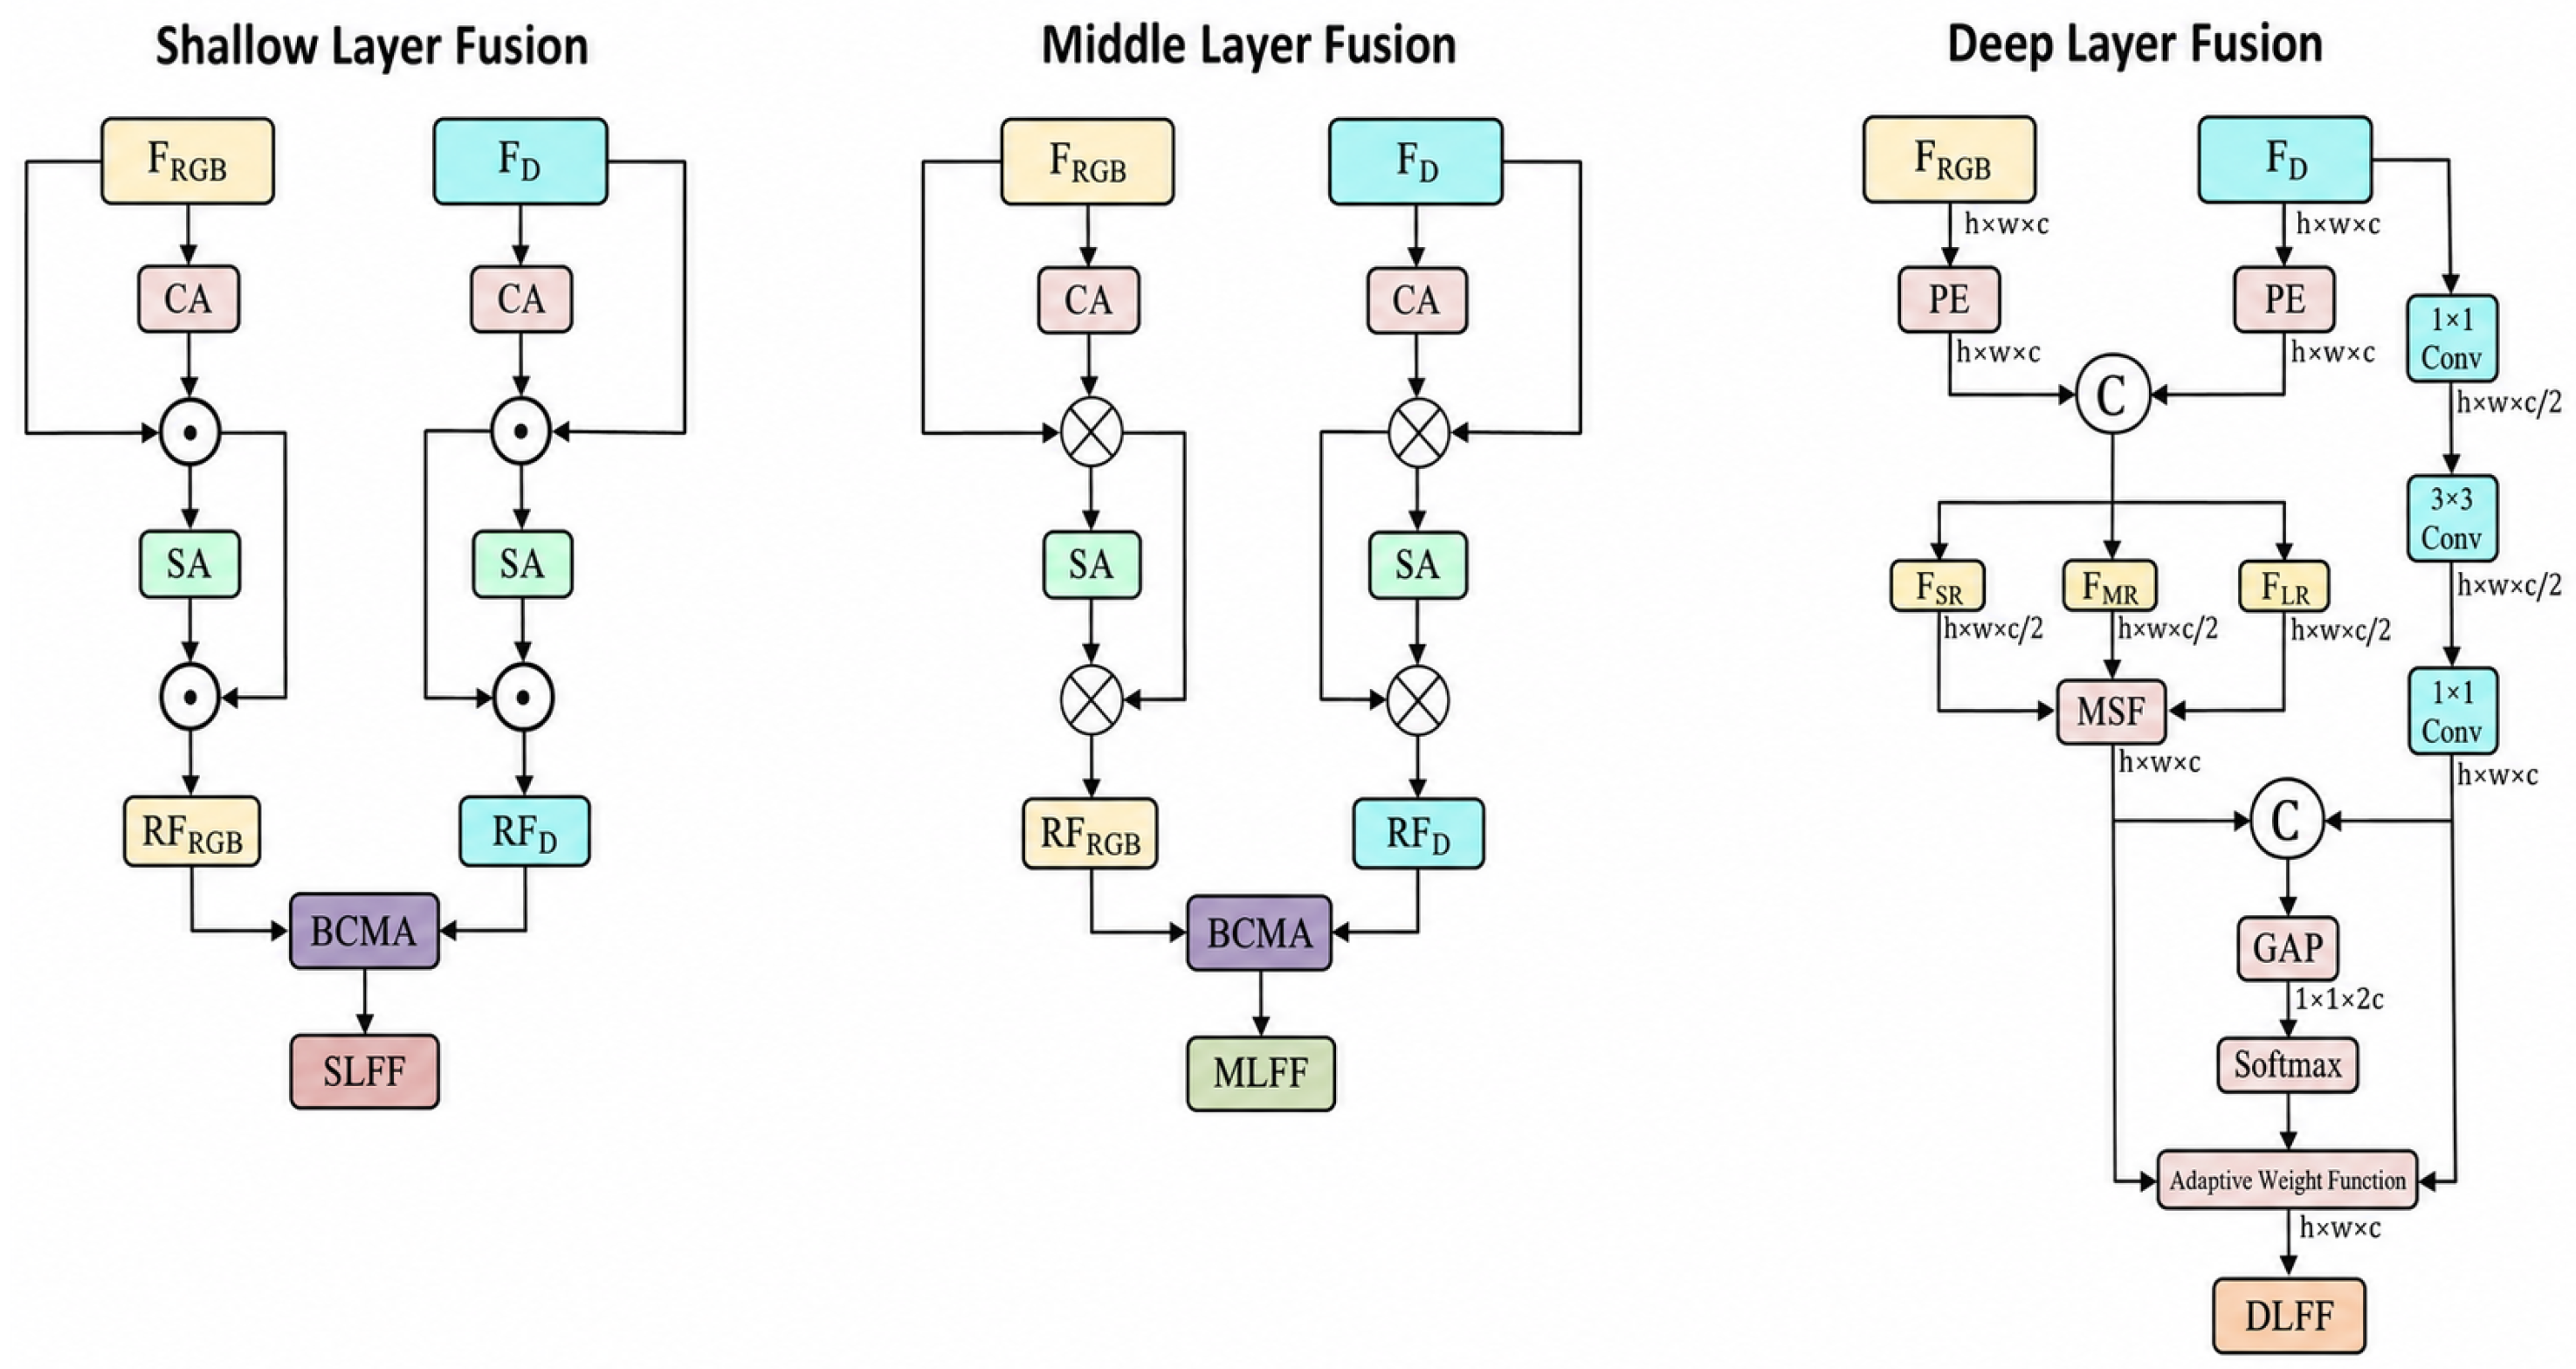
RGB images and depth images convey different types of information at different network depths. Shallow features focus more on local details such as color and texture, whereas deeper features contain more structural, spatial, and geometric semantics. Based on these differences, the proposed fusion mechanism divides the fusion process into three stages: coarse-grained global fusion, medium-grained regional fusion, and fine-grained pixel-level fusion, progressively improving modal consistency and information density, as illustrated in
Figure 4.
For shallow features (Layers 1–2), global average pooling and
convolution are used to extract global statistical descriptors and construct cross-modal alignment. The fusion response can be written in a general form as
where
and
denote RGB and depth features, respectively,
is a ReLU activation function, and
is a Sigmoid activation function. After coarse fusion, multi-scale convolution is further introduced to enlarge receptive fields, followed by spatial attention to enhance regional saliency.
For middle-level features (Layer 3), atrous convolution is used to model long-range structural context, while regional attention emphasizes key areas such as occluded clamp regions and conductor connection zones to strengthen cross-modal consistency. For deep features (Layers 4–5), deformable convolution is introduced to address spatial misalignment between modalities [
19]. The sampling position is defined as
where
denotes the original convolution sampling position and
is a learnable offset. In addition, pixel-level attention is employed to assign adaptive weights to fused features and preserve fine defect cues such as missing clamp shells and abnormal binding-wire configurations.
Overall, the proposed method builds a coarse-to-fine and global-to-local fusion path, fully utilizing modal features at different network layers to achieve semantic alignment and fine-grained feature enhancement. This improves the model’s ability to identify defects in complex transmission and distribution line scenarios.
3.3. Coordinate Attention Mechanism
After dual-modal fusion at different depths, the resulting features may still suffer from distortion in the mapping between spatial information and positional coordinates, because different fusion strategies focus on different regional characteristics. To address this issue, a coordinate attention mechanism is adopted to further enhance positional representation and improve the model’s ability to handle overlapping and occluded targets in power-line scenes [
20].
For a given fused feature map
, two one-dimensional pooling operations with kernel sizes
and
are applied to encode information along the horizontal and vertical directions, respectively. For the
c-th channel, the height-aware pooled feature and width-aware pooled feature can be expressed as
and
Through this transformation, the feature map is aggregated along two spatial directions separately, producing direction-aware descriptors. This enables the attention module to capture long-range dependency in one direction while preserving precise positional encoding in the other direction.
The aggregated features generated by Equations (3) and (4) are concatenated and fed into a shared
convolution transform
, yielding
where
denotes concatenation along the spatial dimension and
is a nonlinear activation function. The feature tensor is then split into two branches and transformed by separate
convolutions
and
to obtain attention maps along the two directions:
where a suitable channel reduction ratio is used to reduce computational complexity. Finally, the output of the coordinate attention module is expressed as
where ⊙ denotes element-wise multiplication.
By incorporating coordinate attention, the model can effectively learn target positional information and significantly improve its ability to capture refined features in defect regions. Together with the complementary fusion of depth and visible-light features, the model performs effective extraction of both surface appearance cues and structural/spatial information, enabling high-precision defect detection for transmission and distribution lines.
4. Experimental Results and Analysis
4.1. Dataset and Experimental Settings
4.1.1. Implementation Environment and Training Configuration
All experiments were conducted on a dual-GPU server equipped with NVIDIA GeForce RTX 3080 graphics cards. CUDA 12.2 was used for GPU acceleration, and the software environment consisted of Ubuntu 20.04, Python 3.9, PyTorch 2.0.1, and Torchvision 0.15.2. Both RGB images and relative-depth maps were resized to
pixels. The models were trained for 200 epochs with a batch size of 16 using SGD, an initial learning rate of 0.01, and a weight decay of
. The inference batch size was set to 1. To reduce the influence of random initialization and stochastic optimization, each reported experimental result represents the average performance over multiple independent training runs under the same experimental configuration. To ensure a controlled comparison, all ablation configurations and comparison models used the same dataset split, training protocol, and evaluation settings. The hardware configuration is summarized in
Table 1, and the principal training and inference settings are summarized in
Table 2.
4.1.2. RGB Data Acquisition and Monocular Depth-Map Generation
The original samples were visible-light images collected during UAV-based inspection of transmission and distribution lines. The original RGB resolution was
pixels, and the typical UAV flight altitude ranged from 5 to 30 m. The acquisition and depth-map generation settings are summarized in
Table 3. No LiDAR, stereo camera, or time-of-flight depth sensor was used in this study.
Detailed platform identifiers, specific line locations, and asset-level inspection metadata are not publicly disclosed because of operational-security and confidentiality restrictions imposed by the collaborating power-grid company.
Each RGB frame was independently processed by Depth Anything V2 to generate a monocular relative-depth map. Because the depth map was derived from the corresponding RGB frame rather than captured by a separate sensor, the two inputs share the same image content and pixel-coordinate system. When the depth estimator produced an output at a different resolution, the relative-depth map was resized to match the RGB input before feature extraction. Consequently, no cross-sensor temporal synchronization or geometric registration was required, and UAV vibration or wind-induced component motion did not create inter-sensor frame mismatch. The resulting maps describe relative scene structure rather than calibrated metric distance; therefore, the system does not have a fixed maximum sensing range determined by a depth sensor. Its effective operating range is governed primarily by target visibility, target pixel size, RGB image quality, and the generalization capability of the monocular depth estimator.
The depth maps were generated before detector training and evaluation in the current experimental protocol. Accordingly, the FPS values reported for the detection models represent detector-only inference with pre-generated depth maps. To characterize the additional cost of online use, Depth Anything V2 was profiled separately and its latency was combined with the detector latency in the computational analysis.
The monocular depth maps are used as auxiliary structural cues rather than as calibrated geometric measurements. Their quality can deteriorate under low contrast, severe occlusion, dense conductor overlap, strong metallic reflections, fog, or overexposure. These limitations are explicitly considered in the discussion and motivate future work on more robust depth estimation; this study does not claim all-weather metric depth sensing.
4.1.3. Dataset Composition and Split
When constructing the dataset of typical transmission and distribution line components and their defects, this study followed the classification criteria defined in the State Grid enterprise standards Q/GDW 745-2012 Classification Standards for Distribution Network Equipment Defects and Q/GDW 1906-2013 Classification Standards for Defects of Primary Transmission and Transformation Equipment [
21,
22]. The paired RGB/relative-depth dataset was organized with a sample structure similar to the public M3FD multimodal benchmark [
15].
Based on practical inspection experience, five defect categories that are difficult for conventional detectors and are strongly related to spatial coordinate information were selected as detection targets: tower-head damage, crossarm corrosion, irregular binding wire, missing protective shells of parallel-groove clamp, and missing protective shells of strain clamp. Candidate images were screened and then manually reviewed to remove samples with unusable imaging quality caused by severe viewpoint or illumination effects. After processing, the dataset contained 9838 RGB images and their corresponding monocular relative-depth maps. The samples were randomly divided into training and validation subsets at a ratio of 8:2. Before dataset splitting, duplicate and near-duplicate images were removed during manual screening to reduce potential information leakage between the training and validation subsets. The validation subset was used for the quantitative results reported in this study. Detailed class statistics are given in
Table 4.
The dataset exhibits a non-uniform class distribution: the ratio between the largest and smallest categories is approximately 3.86 in image count and 15.82 in bounding-box count. Therefore, aggregate mAP is supplemented with class-wise AP, precision, and recall in the subsequent class-wise analysis, allowing the performance on minority categories to be examined explicitly rather than being obscured by the overall average.
No class-balanced sampling, class-specific loss weighting, or oversampling strategy was used during training. The same loss configuration and data augmentation pipeline were applied uniformly to all five defect categories. Class-wise metrics are reported to explicitly examine the influence of the non-uniform class distribution.
No public dataset was identified that simultaneously provides the same five defect categories and paired RGB/relative-depth inputs under a directly compatible annotation protocol. Therefore, the present quantitative conclusions are limited to the self-constructed dataset and the evaluated inspection scenes; external cross-site validation is left for future work rather than being claimed in the current study.
4.2. Evaluation Metrics
This study uses mean Average Precision (mAP), a mainstream metric in object detection and COCO-style evaluation, as the primary evaluation criterion [
23]. The mAP value is calculated as the mean of Average Precision (AP) over all categories. AP is an important indicator of detection performance for a single class and is derived from recall (
R) and precision (
P), which are defined as
and
where
is the number of true positives,
is the number of false positives,
is the number of false negatives,
is the number of categories, and
denotes the AP of the
i-th category. A higher mAP indicates better overall model performance.
4.3. Experimental Results
4.3.1. Ablation Study
To validate the effectiveness of the proposed method, an ablation study was conducted by incrementally introducing the proposed modules on top of the YOLOv8 baseline. The results are summarized in
Table 5.
As shown in
Table 5, introducing the monocular-depth branch improves mAP@50 from 85.6% to 87.6% and mAP@50–95 from 60.4% to 63.1%, corresponding to gains of 2.0 and 2.7 percentage points, respectively. Precision and recall also increase by 2.2 and 2.1 percentage points. These results indicate that the estimated relative-depth maps provide useful auxiliary structural information beyond the RGB appearance features.
The effect of coordinate attention can be isolated directly from two controlled comparisons. Relative to YOLOv8 + Depth, adding CA increases mAP@50 from 87.6% to 90.1% and mAP@50–95 from 63.1% to 65.8%, giving gains of 2.5 and 2.7 percentage points. More importantly, comparing YOLOv8 + Depth + APFF with the full model shows that CA further improves mAP@50 by 3.1 percentage points, mAP@50–95 by 2.7 percentage points, precision by 1.3 percentage points, and recall by 1.1 percentage points. These two comparisons demonstrate that CA provides a consistent contribution both with direct depth fusion and on top of APFF, rather than merely benefiting from the addition of the depth branch.
The APFF configuration improves precision and recall to 90.1% and 88.1%, respectively, indicating that progressive interaction between RGB and relative-depth features improves multimodal discrimination. The complete model achieves the best overall performance, with mAP@50, mAP@50–95, precision, and recall reaching 92.4%, 67.1%, 91.4%, and 89.2%, respectively. The detector-only inference speed decreases from 69 FPS to 51 FPS because of the additional branch and fusion operations; the computational cost is analyzed separately in the computational-complexity subsection.
4.3.2. Stage-Wise Analysis of APFF
To isolate the contribution of the three progressive fusion stages, all configurations in
Table 6 use the same YOLOv8 backbone and monocular-depth branch, while CA is disabled. The coarse-level, middle-level, and fine-level components are enabled progressively so that the incremental effect of each fusion stage can be evaluated under an otherwise identical training setting.
Compared with the depth-only configuration, coarse-level fusion increases mAP@50 from 87.6% to 88.2% and mAP@50–95 from 63.1% to 63.6%, while precision and recall improve by 0.9 and 0.8 percentage points, respectively. Enabling middle-level fusion produces a further gain of 0.6 percentage points in mAP@50 and 0.5 percentage points in mAP@50–95, indicating that regional structural interaction complements the global alignment performed at shallow layers. After fine-level fusion is added, the complete APFF reaches 89.3% mAP@50, 64.4% mAP@50–95, 90.1% precision, and 88.1% recall. Relative to the depth-only model, the full APFF provides total gains of 1.7, 1.3, 2.7, and 2.6 percentage points in these four metrics, respectively. The progressive improvements verify that the global, regional, and pixel-level fusion stages make complementary contributions, although the additional operations reduce the detector speed from 61 to 54 FPS.
4.3.3. Comparison with Mainstream Detection Models
To further verify the advancement and practicality of the proposed model, comparative experiments were conducted against several mainstream detectors, including YOLOv9 [
24], YOLOv10 [
25], DETR [
26], YOLO-World [
27], YOLOE [
28], and Grounding DINO [
29]. The results are reported in
Table 7.
As shown in
Table 7, the task-aligned YOLOv8 + Depth baseline improves mAP@50 by 2.0 percentage points and mAP@50–95 by 2.7 percentage points over RGB-only YOLOv8. The full model further improves these metrics by 4.8 and 4.0 percentage points over direct depth fusion, demonstrating that the gain is not attributable to the relative-depth input alone but also to the proposed APFF and CA modules. Relative to the RGB-only YOLOv8 baseline, the full model obtains gains of 6.8 percentage points in mAP@50 and 6.7 percentage points in mAP@50–95.
Traditional YOLO-series models provide favorable detection efficiency, whereas DETR improves global context modeling. Compared with stronger models such as YOLO-WORLD and YOLOE-8-L, the proposed method remains highly competitive and improves mAP@50 by 3.3 percentage points over YOLO-WORLD while also improving precision and recall. Grounding DINO achieves a slightly higher mAP@50, reflecting the benefit of large-scale vision–language pretraining, but its inference speed is substantially lower under the reported setup. The comparison is intended to position the proposed task-specific detector against representative general-purpose detectors; APFF is designed for hierarchical CNN/YOLO feature maps and is not claimed as a directly transferable plug-in for query-based architectures such as Grounding DINO. Overall, the proposed model provides a balanced trade-off among accuracy, localization quality, and detector-only inference efficiency in the evaluated power-line scenes.
4.3.4. Class-Wise Performance and Class Imbalance
Because the number of bounding boxes varies substantially across the five categories, aggregate mAP alone may obscure performance on minority classes.
Table 8 therefore reports class-wise AP, precision, and recall on the same validation split. The total number of bounding boxes in the full dataset is also listed to indicate the degree of class imbalance.
As shown in
Table 8, the missing strain clamp protective shell category achieves the highest AP@50 of 94.6% and AP@50–95 of 69.2%, together with 93.1% precision and 91.0% recall. Irregular binding wire and missing parallel-groove clamp protective shell also maintain strong performance, with AP@50 values of 93.8% and 92.9%, respectively. By contrast, crossarm corrosion and tower-head damage contain substantially fewer annotated instances and obtain relatively lower recall values of 88.2% and 86.6%. Tower-head damage also shows the lowest AP@50–95 of 64.4%, suggesting that precise localization remains more difficult for this minority class because of limited samples, viewpoint variation, partial occlusion, and background interference. Nevertheless, all five categories achieve AP@50 above 89%, indicating that the proposed depth-assisted representation and progressive fusion strategy retain useful detection capability across both majority and minority classes.
4.3.5. Computational Complexity and Deployment Scope
In addition to FPS, practical deployment requires consideration of parameter count, floating-point operations, model size, and peak memory consumption.
Table 9 separates detector complexity from monocular depth-map generation. The currently reported FPS values correspond to detector-only inference with pre-generated depth maps; they should not be interpreted as the end-to-end frame rate of an onboard system until the depth estimator is included in the timing protocol.
In
Table 9, YOLOv8-D denotes the YOLOv8 baseline equipped with the monocular-depth branch using direct feature fusion, while DAV2 denotes the Depth Anything V2 preprocessing model. All entries use an input resolution of
and an inference batch size of 1. Compared with YOLOv8, YOLOv8-D increases the parameter count from 11.2 M to 16.7 M and the computational cost from 28.6 to 41.8 GFLOPs, while the latency rises from 14.49 to 16.39 ms. Incorporating APFF and CA results in 18.9 M parameters, 48.6 GFLOPs, 36.4 MB model size, 2.13 GB GPU memory, and 19.61 ms detector latency for the complete model. This detector-side latency is consistent with the 51 FPS reported in the ablation study.
DAV2 accounts for the largest portion of the complete pipeline cost, requiring 97.5 M parameters and 46.80 ms per image. When DAV2 and the detector are executed sequentially, the end-to-end pipeline requires 116.4 M parameters, 205.8 GFLOPs, and 66.41 ms per image under the reported profiling setting. Therefore, the current detector retains real-time potential on a desktop GPU, whereas online depth generation substantially increases the total latency. The experiments do not constitute validation on a resource-constrained onboard processor; deployment on platforms such as NVIDIA Jetson requires lightweight depth estimation and device-specific optimization.
4.3.6. Visualization Results
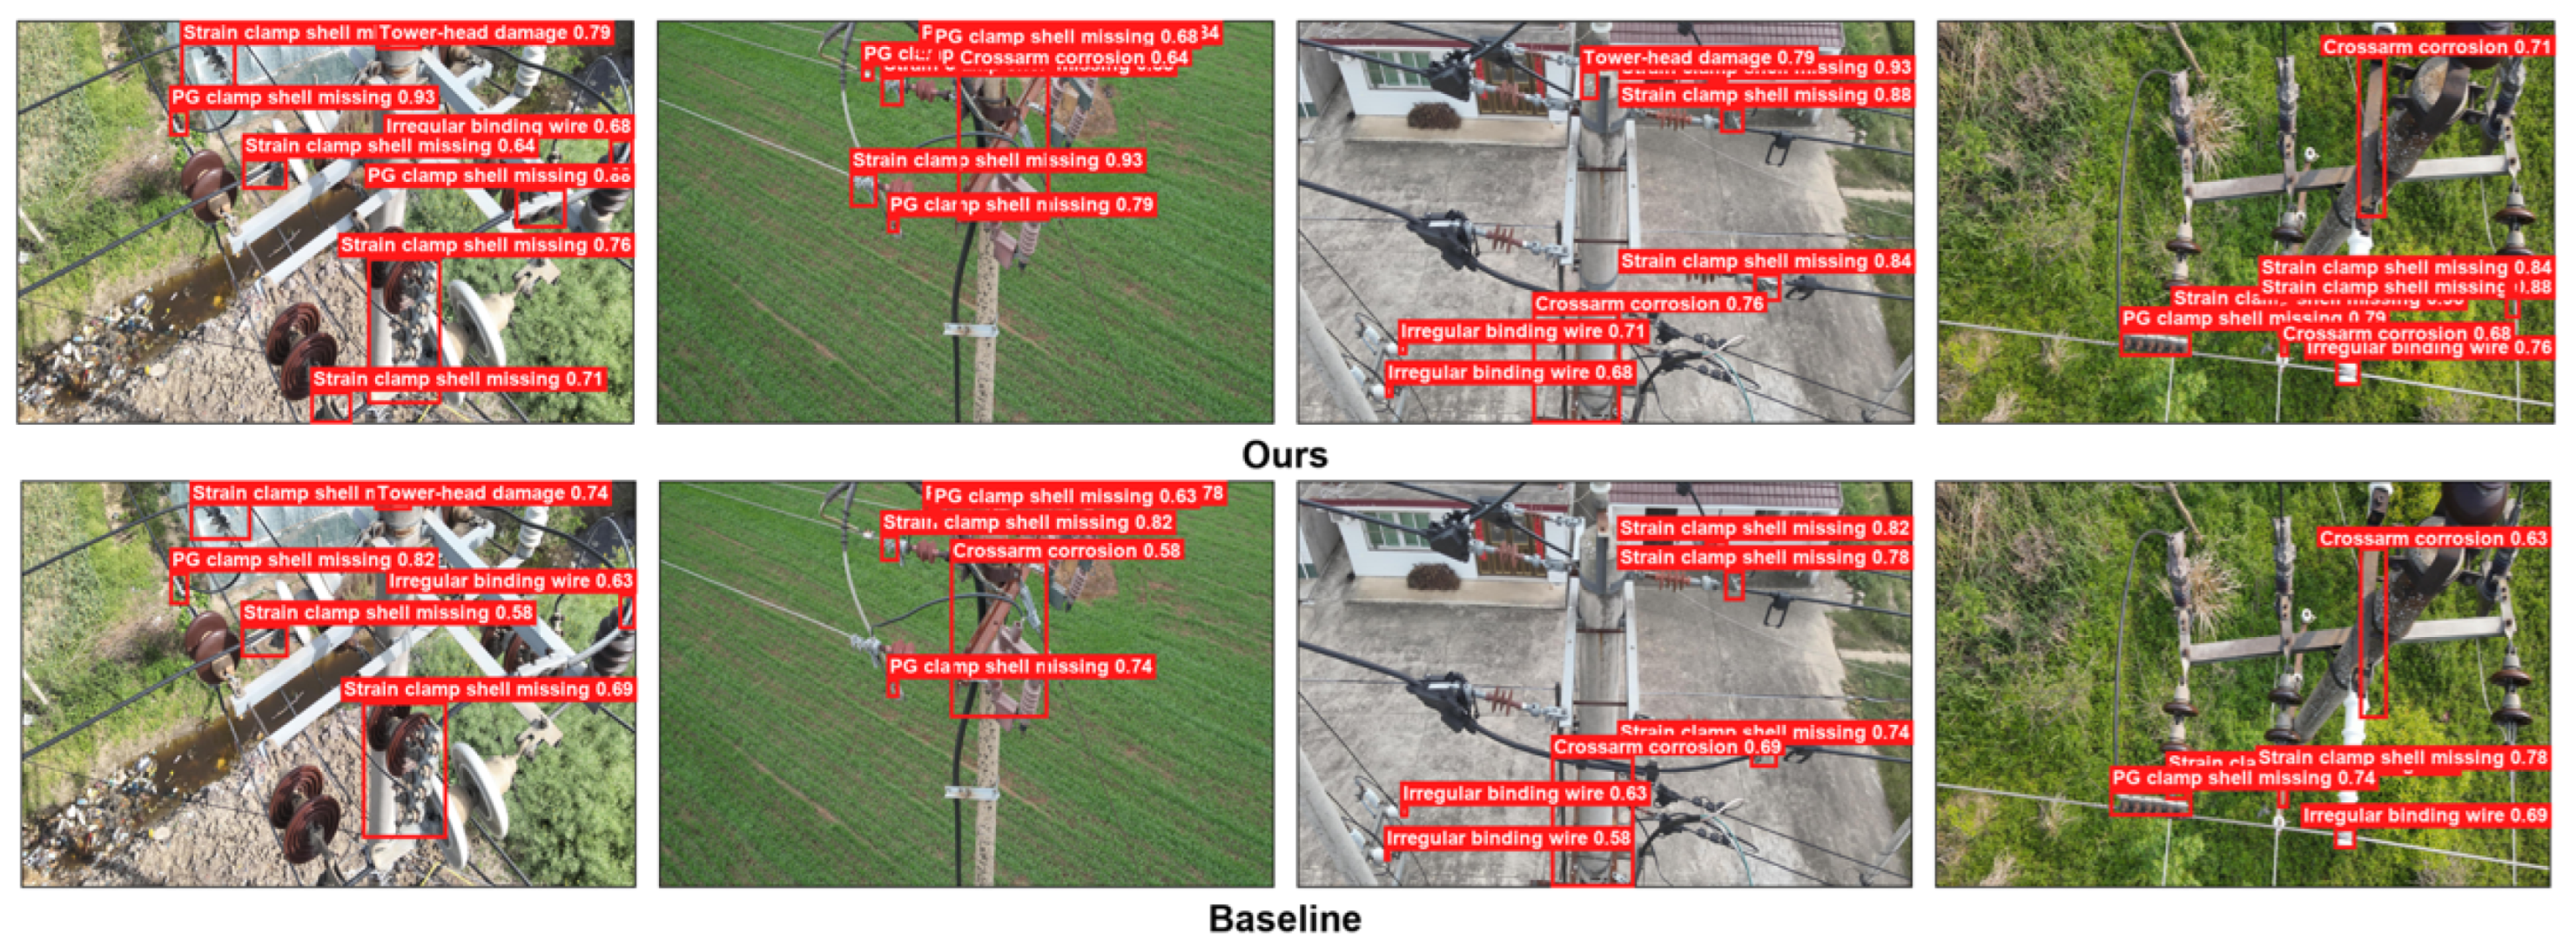
To further verify the effectiveness of the proposed method in complex transmission and distribution scenarios, typical validation samples are visualized and compared with the baseline model, as shown in
Figure 5. The visualization results compare the detection performance of the baseline and the proposed method under small-target, occlusion, and cluttered-background conditions.
From the qualitative analysis, the baseline model tends to suffer from missed detections, false detections, and inaccurate localization when targets are small, partially occluded, or strongly affected by background interference. By contrast, the proposed method can focus more accurately on defect target regions, producing detection boxes that better match the true target position and exhibit stronger responses to local defect details.
This improvement is mainly attributed to three factors. First, the depth-information branch complements the spatial structure and front-back occlusion relationships that are difficult to express explicitly in visible-light images. Second, the adaptive progressive feature fusion module enhances the complementary representation between modalities and feature levels. Third, the coordinate attention mechanism further strengthens the model’s perception of key regions and positional information. Consequently, the proposed method exhibits improved detection robustness in the evaluated complex scenes. Combined with the quantitative results presented above, these visualization results verify that the proposed model has better target localization and defect recognition ability in representative challenging scenarios.
4.3.7. Intermediate Feature Responses and Failure Analysis
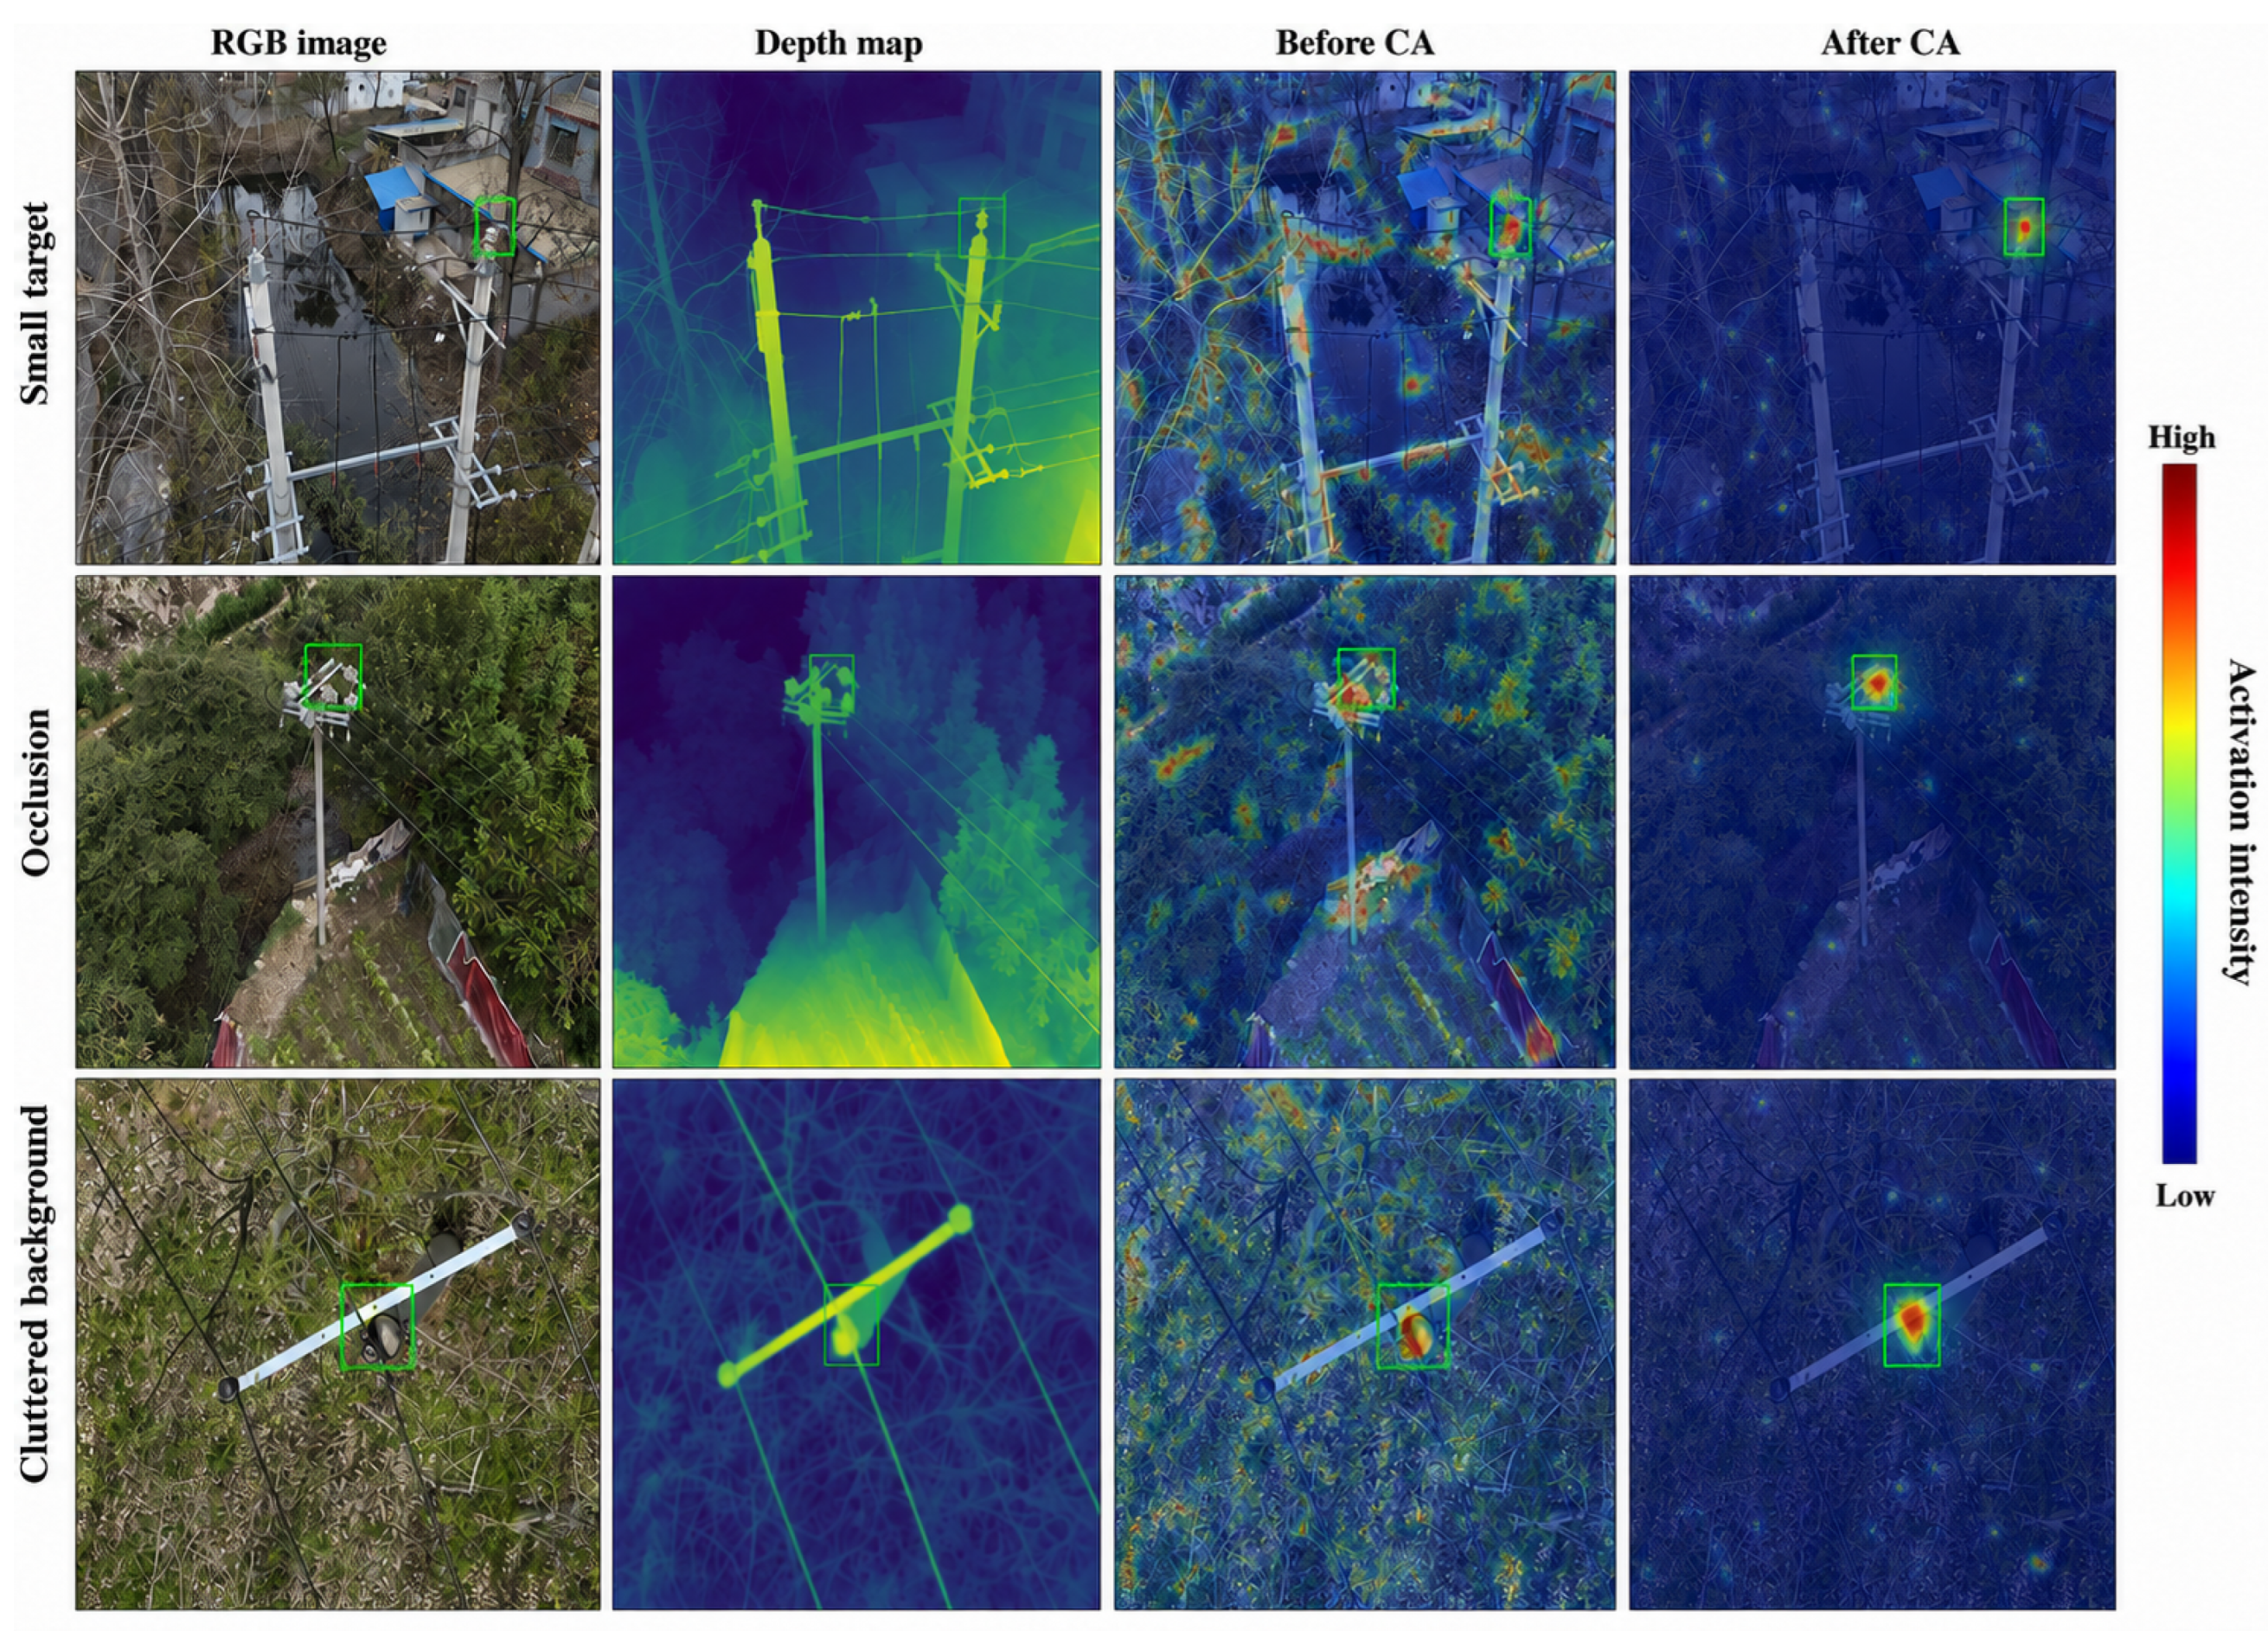
To further investigate the contribution of coordinate attention,
Figure 6 compares the intermediate feature responses before and after the CA module using the same representative samples. The three rows correspond to a small-target scene, a partially occluded scene, and a cluttered-background scene, respectively. For each sample, the channel-averaged activation maps were extracted from the same high-resolution feature branch immediately before and after coordinate attention. The same normalization range and color mapping were used for each before–after pair to ensure a fair visual comparison.
As shown in
Figure 6, the feature responses before coordinate attention are relatively dispersed and are partially activated by conductors, vegetation, utility poles, and other background structures. After the CA module is introduced, the activations become more concentrated around the ground-truth defect regions, while irrelevant background responses are suppressed. This effect is particularly evident in the small-target and partially occluded examples, where the post-CA responses show clearer spatial localization. These qualitative results support the quantitative improvements reported in
Table 5 and indicate that coordinate attention enhances positional encoding and preserves discriminative defect features after multimodal fusion.
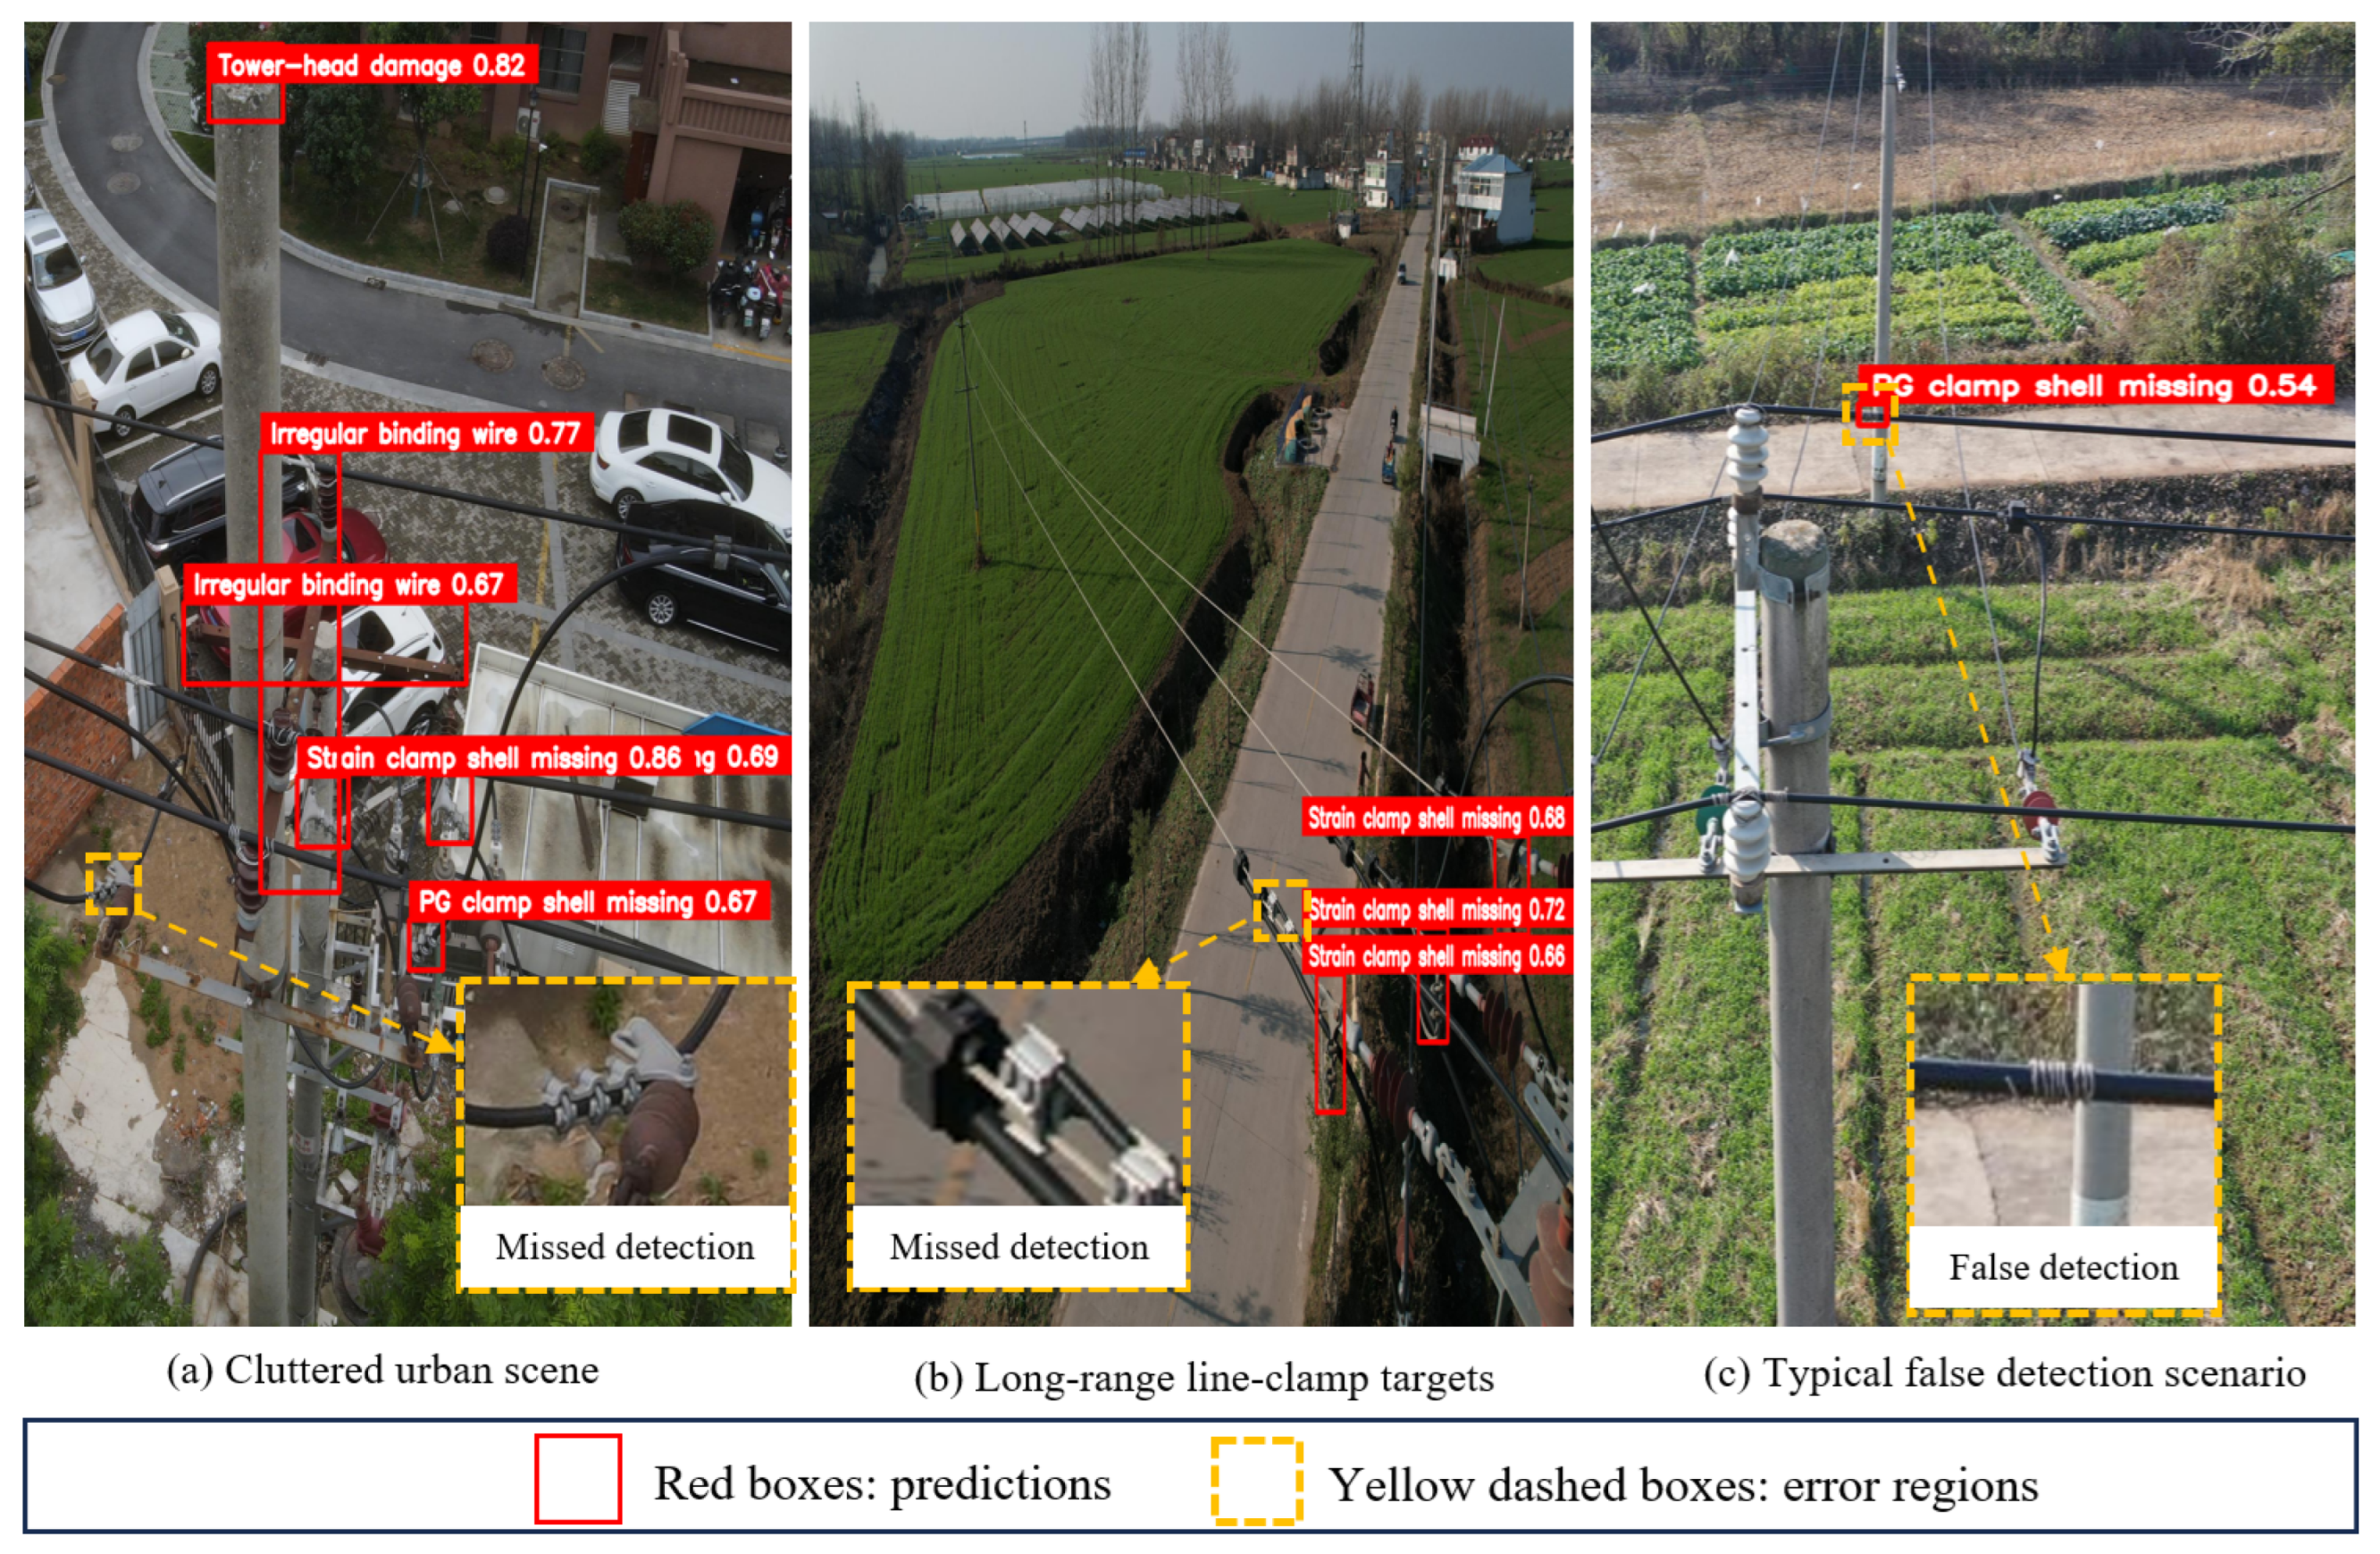
To further clarify the operating boundary of the proposed method,
Figure 7 presents three representative failure cases selected from the evaluation results. Red bounding boxes denote model predictions, while the yellow dashed boxes and enlarged local regions highlight the dominant error sources.
As shown in
Figure 7a, the dense overlap among conductors, insulators, clamps, and background structures produces highly complex local visual patterns. Although the model correctly detects multiple defect instances, one clamp-related target remains undetected because its appearance is partially obscured by nearby hardware and cables. This case indicates that dense structural overlap may weaken both RGB appearance cues and the corresponding monocular-depth boundaries.
Figure 7b shows missed line-clamp targets captured at a relatively long imaging distance. These targets occupy only a small number of pixels in the original image, and their local texture and geometric structure are therefore insufficiently represented after multi-scale feature extraction. Although several nearby strain-clamp shell defects are correctly detected, the smaller clamp instances are missed, demonstrating that the proposed method remains sensitive to extremely small targets under long-range UAV inspection.
In
Figure 7c, the model simultaneously produces a missed detection and a false-positive prediction. The missed target exhibits weak local contrast against the conductor background, whereas the false positive is caused by a structurally similar line fitting being classified as a missing parallel-groove clamp protective shell. This result suggests that visually similar fittings and incomplete monocular-depth boundaries may still cause category confusion in complex power-line scenes.
Overall, these failure cases show that the proposed method is mainly limited by extremely small target size, dense component overlap, weak visual contrast, and structural similarity among different fittings. Future work will focus on higher-resolution local feature extraction, more reliable monocular-depth estimation, and category-aware feature discrimination to improve robustness in these challenging situations.
5. Conclusions
This paper presents a defect target detection network that integrates monocular depth spatial information with adaptive progressive feature fusion for the inspection of power transmission and distribution lines. The proposed framework uses a dual-branch architecture to extract complementary RGB appearance features and relative-depth structural cues. The APFF module progressively performs coarse-level, regional, and fine-grained cross-modal interaction, while coordinate attention strengthens positional encoding and suppresses irrelevant background responses.
Experiments on the self-constructed dataset containing 9838 aligned RGB–depth image pairs demonstrate that the proposed method achieves 92.4% mAP@50 and 67.1% mAP@50–95. The ablation results confirm that the monocular-depth branch, APFF, and coordinate attention provide complementary improvements. The stage-wise analysis further shows that the three fusion stages progressively enhance multimodal representation. Class-wise evaluation indicates that the method maintains competitive performance across all five defect categories, including the minority classes. In addition, the intermediate feature-response visualizations show that coordinate attention concentrates activations around defect regions and suppresses responses to conductors, vegetation, poles, and other background structures.
Despite these improvements, several limitations remain. First, the current evaluation is based on a single self-constructed dataset, and the cross-region, cross-device, and cross-line generalization capability has not yet been systematically validated. Second, the depth maps are generated from individual RGB images using Depth Anything V2 and therefore represent monocular relative depth rather than calibrated metric distance. Their reliability may decrease under strong metallic reflections, severe occlusion, low contrast, dense structural overlap, or adverse weather conditions. Third, the failure-case analysis shows that extremely small line-clamp targets captured at long imaging distances may still be missed because of insufficient pixel-level appearance and structural information. Dense overlap among conductors and fittings may obscure target boundaries, while structurally similar components may cause false-positive predictions, particularly between visually related clamp categories. Finally, the additional depth branch, APFF, coordinate attention, and monocular-depth generation introduce extra computational overhead. The reported detector-side speed does not represent the complete online RGB-to-detection pipeline, and the method has not yet been validated on resource-constrained onboard UAV processors.
Future work will focus on constructing larger cross-site datasets, evaluating statistical stability through broader repeated experiments, improving high-resolution feature representation for distant small targets, enhancing category-aware discrimination among visually similar fittings, and developing more reliable and lightweight monocular-depth estimation. Model compression, joint RGB–depth optimization, and deployment on embedded UAV platforms will also be investigated to improve practical applicability in large-scale power-line inspection.
Author Contributions
Conceptualization, J.L., G.L. and Z.Z.; methodology, J.L., K.G. and H.L.; software, J.G. and K.G.; validation, J.L., J.G. and B.T.; formal analysis, J.L. and K.G.; investigation, J.G., F.Z. and C.L.; resources, G.L., F.Z. and C.L.; data curation, J.G., B.T. and C.L.; writing—original draft preparation, J.L. and K.G.; writing—review and editing, G.L., F.Z., Z.Z. and H.L.; visualization, J.G. and B.T.; supervision, Z.Z. and H.L.; project administration, G.L., F.Z. and H.L.; funding acquisition, G.L. and F.Z. All authors have read and agreed to the published version of the manuscript.
Funding
This research was funded by Guangdong Power Grid Corporation under the project “Research on Image Defect Detection and Deduplication Technology Integrating 3D Space”, grant number 030000KC23120086.
Data Availability Statement
The data presented in this study are available from the corresponding author upon reasonable request. The data are not publicly available due to privacy, security, and confidentiality restrictions related to power-grid inspection scenarios.
Acknowledgments
The authors would like to thank Guangdong Power Grid Corporation for supporting this research project.
Conflicts of Interest
Authors Junsheng Lin, Jinchao Guo, Gao Liu, Feng Zhang and Changyu Li were employed by Electric Power Research Institute of Guangdong Power Grid Corporation, Guangzhou, China. The remaining authors declare that the research was conducted in the absence of any commercial or financial relationships that could be construed as a potential conflict of interest.
Abbreviations
The following abbreviations are used in this manuscript:
| APFF | Adaptive Progressive Feature Fusion |
| CA | Coordinate Attention |
| FPS | Frames Per Second |
| mAP | Mean Average Precision |
| RGB | Red–Green–Blue |
| UAV | Unmanned Aerial Vehicle |
References
- Nguyen, V.N.; Jenssen, R.; Roverso, D. Automatic Autonomous Vision-Based Power Line Inspection: A Review of Current Status and the Potential Role of Deep Learning. Int. J. Electr. Power Energy Syst. 2018, 99, 107–120. [Google Scholar] [CrossRef]
- Sharma, P.; Saurav, S.; Singh, S. Object Detection in Power Line Infrastructure: A Review of the Challenges and Solutions. Eng. Appl. Artif. Intell. 2024, 130, 107781. [Google Scholar] [CrossRef]
- Bellou, E.; Pisica, I.; Banitsas, K. Aerial Inspection of High-Voltage Power Lines Using YOLOv8 Real-Time Object Detector. Energies 2024, 17, 2535. [Google Scholar] [CrossRef]
- Ren, S.; He, K.; Girshick, R.; Sun, J. Faster R-CNN: Towards Real-Time Object Detection with Region Proposal Networks. In Proceedings of the Advances in Neural Information Processing Systems, Montreal, QC, Canada, 7–12 December 2015; Volume 28. [Google Scholar]
- Jocher, G.; Chaurasia, A.; Qiu, J. Ultralytics YOLOv8; Computer Software; Ultralytics: Frederick, MD, USA, 2023; Available online: https://github.com/ultralytics/ultralytics (accessed on 30 April 2026).
- Tao, X.; Zhang, D.; Wang, Z.; Liu, X.; Zhang, H.; Xu, D. Detection of Power Line Insulator Defects Using Aerial Images Analyzed With Convolutional Neural Networks. IEEE Trans. Syst. Man Cybern. Syst. 2020, 50, 1486–1498. [Google Scholar] [CrossRef]
- Zhao, Z.; Qi, H.; Qi, Y.; Zhang, K.; Zhai, Y.; Zhao, W. Detection Method Based on Automatic Visual Shape Clustering for Pin-Missing Defect in Transmission Lines. IEEE Trans. Instrum. Meas. 2020, 69, 6080–6091. [Google Scholar] [CrossRef]
- Zhai, Y.; Yang, X.; Wang, Q.; Zhao, Z.; Zhao, W. Hybrid Knowledge R-CNN for Transmission Line Multifitting Detection. IEEE Trans. Instrum. Meas. 2021, 70, 5013312. [Google Scholar] [CrossRef]
- Zhang, K.; Lou, W.; Wang, J.; Zhou, R.; Guo, X.; Xiao, Y.; Shi, C.; Zhao, Z. PA-DETR: End-to-End Visually Indistinguishable Bolt Defects Detection Method Based on Transmission Line Knowledge Reasoning. IEEE Trans. Instrum. Meas. 2023, 72, 5016914. [Google Scholar] [CrossRef]
- Wang, Y.; Song, X.; Feng, L.; Zhai, Y.; Zhao, Z.; Zhang, S.; Wang, Q. MCI-GLA Plug-In Suitable for YOLO Series Models for Transmission Line Insulator Defect Detection. IEEE Trans. Instrum. Meas. 2024, 73, 9002912. [Google Scholar] [CrossRef]
- Zhao, X.; Wu, G.; Yang, D.; Xu, G.; Xing, Y.; Yao, C.; Abu-Siada, A. Enhanced Detection of Power Transformer Winding Faults Through 3D FRA Signatures and Image Processing Techniques. Electr. Power Syst. Res. 2025, 242, 111433. [Google Scholar] [CrossRef]
- Khan, M.A.; Dairaku, K.; Kelkar, S. Assessing wind power generation potential over South Asia using wind speed observation and reanalysis datasets. Stoch. Environ. Res. Risk Assess. 2025, 39, 1179–1207. [Google Scholar] [CrossRef]
- Ophoff, T.; Van Beeck, K.; Goedemé, T. Exploring RGB+Depth Fusion for Real-Time Object Detection. Sensors 2019, 19, 866. [Google Scholar] [CrossRef] [PubMed]
- Yang, L.; Kang, B.; Huang, Z.; Zhao, Z.; Xu, X.; Feng, J.; Zhao, H. Depth Anything V2. In Proceedings of the Advances in Neural Information Processing Systems, Vancouver, BC, Canada, 10–15 December 2024; Volume 37. [Google Scholar]
- Liu, J.; Fan, X.; Huang, Z.; Wu, G.; Liu, R.; Zhong, W.; Luo, Z. Target-Aware Dual Adversarial Learning and a Multi-Scenario Multi-Modality Benchmark to Fuse Infrared and Visible for Object Detection. In Proceedings of the IEEE/CVF Conference on Computer Vision and Pattern Recognition, New Orleans, LA, USA, 18–24 June 2022; pp. 5802–5811. [Google Scholar] [CrossRef]
- Lan, B.; Sun, D.; Tamadon, I.; Niu, K. Self-derived Motion Features from sEMG for Inferring 3D Forearm Trajectories. IEEE Trans. Biomed. Eng. 2026. Early Access. [Google Scholar] [CrossRef] [PubMed]
- Sun, D.; Stramigioli, S.; Niu, K. HCCE-CUNet-Based Multi-Class Musculoskeletal Segmentation for Robotic Ultrasound System. IEEE Trans. Med. Robot. Bionics 2025, 7, 1728–1738. [Google Scholar] [CrossRef]
- Sun, D.; Cappellari, A.; Lan, B.; Abyazid, M.; Stramigioli, S.; Niu, K. Automatic Robotic Ultrasound for 3D Musculoskeletal Reconstruction: A Comprehensive Framework. Technologies 2025, 13, 70. [Google Scholar] [CrossRef]
- Dai, J.; Qi, H.; Xiong, Y.; Li, Y.; Zhang, G.; Hu, H.; Wei, Y. Deformable Convolutional Networks. In Proceedings of the IEEE International Conference on Computer Vision, Venice, Italy, 22–29 October 2017; pp. 764–773. [Google Scholar] [CrossRef]
- Hou, Q.; Zhou, D.; Feng, J. Coordinate Attention for Efficient Mobile Network Design. In Proceedings of the IEEE/CVF Conference on Computer Vision and Pattern Recognition, Virtual, 19–25 June 2021; pp. 13713–13722. [Google Scholar]
- Q/GDW 745-2012; Classification Standards for Distribution Network Equipment Defects. State Grid Corporation of China: Beijing, China, 2012.
- Q/GDW 1906-2013; Classification Standards for Defects of Primary Transmission and Transformation Equipment. State Grid Corporation of China: Beijing, China, 2013.
- Lin, T.Y.; Maire, M.; Belongie, S.; Hays, J.; Perona, P.; Ramanan, D.; Dollár, P.; Zitnick, C.L. Microsoft COCO: Common Objects in Context. In Proceedings of the European Conference on Computer Vision, Zurich, Switzerland, 6–12 September 2014; pp. 740–755. [Google Scholar] [CrossRef]
- Wang, C.Y.; Yeh, I.H.; Liao, H.Y.M. YOLOv9: Learning What You Want to Learn Using Programmable Gradient Information. arXiv 2024. [Google Scholar] [CrossRef]
- Wang, A.; Chen, H.; Liu, L.; Chen, K.; Lin, Z.; Han, J.; Ding, G. YOLOv10: Real-Time End-to-End Object Detection. In Proceedings of the Advances in Neural Information Processing Systems, Vancouver, BC, Canada, 10–15 December 2024; Volume 37. [Google Scholar]
- Carion, N.; Massa, F.; Synnaeve, G.; Usunier, N.; Kirillov, A.; Zagoruyko, S. End-to-End Object Detection with Transformers. In Proceedings of the European Conference on Computer Vision, Virtual, 23–28 August 2020; pp. 213–229. [Google Scholar] [CrossRef]
- Cheng, T.; Song, L.; Ge, Y.; Liu, W.; Wang, X.; Shan, Y. YOLO-World: Real-Time Open-Vocabulary Object Detection. In Proceedings of the IEEE/CVF Conference on Computer Vision and Pattern Recognition, Seattle, WA, USA, 17–21 June 2024; pp. 16901–16911. [Google Scholar] [CrossRef]
- Wang, A.; Liu, L.; Chen, H.; Lin, Z.; Han, J.; Ding, G. YOLOE: Real-Time Seeing Anything. In Proceedings of the IEEE/CVF International Conference on Computer Vision, Honolulu, HI, USA, 15–29 October 2025. [Google Scholar]
- Liu, S.; Zeng, Z.; Ren, T.; Li, F.; Zhang, H.; Yang, J.; Jiang, Q.; Li, C.; Yang, J.; Su, H.; et al. Grounding DINO: Marrying DINO with Grounded Pre-Training for Open-Set Object Detection. In Proceedings of the European Conference on Computer Vision, Milan, Italy, 29 September–4 October 2024; pp. 38–55. [Google Scholar] [CrossRef]
Figure 1.
Illustrative examples of five representative transmission and distribution line defects. Red boxes indicate the defect regions, and the defect-category labels are provided within the figure.
Figure 1.
Illustrative examples of five representative transmission and distribution line defects. Red boxes indicate the defect regions, and the defect-category labels are provided within the figure.
Figure 2.
Overall architecture of the proposed network. Brown/blue paths indicate RGB/depth branches; ⊗, ⊕, C, and denote multiplication, addition, concatenation, and repetition, respectively.
Figure 2.
Overall architecture of the proposed network. Brown/blue paths indicate RGB/depth branches; ⊗, ⊕, C, and denote multiplication, addition, concatenation, and repetition, respectively.
Figure 3.
Dual-modal feature extraction branches. Brown and blue paths denote the RGB and depth branches, respectively; denotes repetition.
Figure 3.
Dual-modal feature extraction branches. Brown and blue paths denote the RGB and depth branches, respectively; denotes repetition.
Figure 4.
Three-stage adaptive progressive feature fusion mechanism, including coarse-grained global fusion, medium-grained regional fusion, and fine-grained pixel-level fusion. Colors distinguish fusion stages; arrows show feature flow; C and ⊗ denote concatenation and weighting, respectively.
Figure 4.
Three-stage adaptive progressive feature fusion mechanism, including coarse-grained global fusion, medium-grained regional fusion, and fine-grained pixel-level fusion. Colors distinguish fusion stages; arrows show feature flow; C and ⊗ denote concatenation and weighting, respectively.
Figure 5.
Qualitative comparison of detection results in typical complex scenarios.
Figure 5.
Qualitative comparison of detection results in typical complex scenarios.
Figure 6.
Intermediate feature responses before and after coordinate attention. The three rows correspond to small-target, partially occluded, and cluttered-background examples, respectively. Warmer colors indicate stronger activation responses, and green boxes indicate the target defect regions.
Figure 6.
Intermediate feature responses before and after coordinate attention. The three rows correspond to small-target, partially occluded, and cluttered-background examples, respectively. Warmer colors indicate stronger activation responses, and green boxes indicate the target defect regions.
Figure 7.
Representative failure cases of the proposed method. Red boxes denote model predictions, while yellow dashed boxes indicate the dominant error regions.
Figure 7.
Representative failure cases of the proposed method. Red boxes denote model predictions, while yellow dashed boxes indicate the dominant error regions.
Table 1.
Hardware configuration of the experimental platform.
Table 1.
Hardware configuration of the experimental platform.
| Hardware | Model | Quantity |
|---|
| CPU | Intel Xeon Silver 4210R | 1 |
| GPU | NVIDIA GeForce RTX 3080 | 2 |
| Memory | Samsung DDR4 32G | 4 |
| SSD | Samsung SSD 980 PRO 8TB | 1 |
Table 2.
Training and inference configuration.
Table 2.
Training and inference configuration.
| Configuration Item | Setting |
|---|
| Input image size | pixels |
| Batch size | 16 |
| Training epochs | 200 |
| Optimizer | SGD |
| Initial learning rate | 0.01 |
| Weight decay | |
| Inference batch size | 1 |
Table 3.
RGB data acquisition and depth-map generation protocol.
Table 3.
RGB data acquisition and depth-map generation protocol.
| Item | Description |
|---|
| Original RGB resolution | pixels |
| Typical flight altitude | 5–30 m |
| Depth-map generator | Depth Anything V2 [14] |
| Depth representation | Monocular relative depth; non-metric |
| Depth-map resizing | Bilinear interpolation to pixels |
Table 4.
Detailed statistics of the proposed dataset.
Table 4.
Detailed statistics of the proposed dataset.
| Defect Category | Number of Images | Number of Bounding Boxes |
|---|
| Irregular binding wire | 3717 | 14,510 |
| Missing parallel-groove clamp protective shell | 3317 | 11,285 |
| Missing strain clamp protective shell | 3748 | 16,148 |
| Crossarm corrosion | 987 | 1556 |
| Tower-head damage | 972 | 1021 |
Table 5.
Ablation study of the proposed method.
Table 5.
Ablation study of the proposed method.
| Model Configuration | mAP@50 (%) | mAP@50–95 (%) | Precision (%) | Recall (%) | FPS |
|---|
| YOLOv8 | 85.6 | 60.4 | 85.2 | 83.4 | 69 |
| YOLOv8 + Depth | 87.6 | 63.1 | 87.4 | 85.5 | 61 |
| YOLOv8 + Depth + APFF | 89.3 | 64.4 | 90.1 | 88.1 | 54 |
| YOLOv8 + Depth + CA | 90.1 | 65.8 | 88.8 | 87.4 | 56 |
| Full Model | 92.4 | 67.1 | 91.4 | 89.2 | 51 |
Table 6.
Stage-wise ablation of the adaptive progressive feature fusion module. CA is disabled in all configurations.
Table 6.
Stage-wise ablation of the adaptive progressive feature fusion module. CA is disabled in all configurations.
| Fusion Configuration | mAP@50 (%) | mAP@50–95 (%) | Precision (%) | Recall (%) | FPS |
|---|
| Depth branch only | 87.6 | 63.1 | 87.4 | 85.5 | 61 |
| +Coarse-level fusion | 88.2 | 63.6 | 88.3 | 86.3 | 59 |
| +Coarse- and middle-level fusion | 88.8 | 64.1 | 89.3 | 87.4 | 56 |
| +Full APFF (coarse + middle + fine) | 89.3 | 64.4 | 90.1 | 88.1 | 54 |
Table 7.
Comparison with mainstream and task-aligned depth-aware detection baselines.
Table 7.
Comparison with mainstream and task-aligned depth-aware detection baselines.
| Method | mAP@50 (%) | mAP@50–95 (%) | Precision (%) | Recall (%) | FPS |
|---|
| YOLOv8 | 85.6 | 60.4 | 85.2 | 83.4 | 69 |
| YOLOv8 + Depth (direct fusion) | 87.6 | 63.1 | 87.4 | 85.5 | 61 |
| YOLOv9 | 85.9 | 59.7 | 85.5 | 84.9 | – |
| YOLOv10 | 86.4 | 62.1 | 87.1 | 85.1 | – |
| DETR | 87.7 | 64.3 | 88.5 | 86.9 | – |
| YOLO-WORLD | 89.1 | 66.7 | 89.7 | 88.4 | 54.6 |
| YOLOE-8-L | 89.5 | 67.1 | 88.6 | 88.7 | – |
| Grounding DINO | 93.1 | 66.7 | 91.3 | 90.1 | 6.0 |
| Ours | 92.4 | 67.1 | 91.4 | 89.2 | 51 |
Table 8.
Class-wise detection performance of the full model.
Table 8.
Class-wise detection performance of the full model.
| Defect Category | Total Boxes | AP@50 (%) | AP@50–95 (%) | Precision (%) | Recall (%) |
|---|
| Irregular binding wire | 14,510 | 93.8 | 68.7 | 92.3 | 90.5 |
| Missing parallel-groove clamp protective shell | 11,285 | 92.9 | 67.4 | 91.8 | 89.7 |
| Missing strain clamp protective shell | 16,148 | 94.6 | 69.2 | 93.1 | 91.0 |
| Crossarm corrosion | 1556 | 91.1 | 65.8 | 90.4 | 88.2 |
| Tower-head damage | 1021 | 89.6 | 64.4 | 89.4 | 86.6 |
| Mean | – | 92.4 | 67.1 | 91.4 | 89.2 |
Table 9.
Computational complexity and inference efficiency.
Table 9.
Computational complexity and inference efficiency.
| Model | Params (M) | FLOPs (G) | Size (MB) | Memory (GB) | Latency (ms) |
|---|
| YOLOv8 | 11.2 | 28.6 | 21.5 | 1.42 | 14.49 |
| YOLOv8-D | 16.7 | 41.8 | 32.1 | 1.86 | 16.39 |
| Ours | 18.9 | 48.6 | 36.4 | 2.13 | 19.61 |
| DAV2 | 97.5 | 157.2 | 374.0 | 2.81 | 46.80 |
| End-to-End | 116.4 | 205.8 | 410.4 | 4.36 | 66.41 |
| Disclaimer/Publisher’s Note: The statements, opinions and data contained in all publications are solely those of the individual author(s) and contributor(s) and not of MDPI and/or the editor(s). MDPI and/or the editor(s) disclaim responsibility for any injury to people or property resulting from any ideas, methods, instructions or products referred to in the content. |





 and
and