1. Introduction
The continuity of electric power supply is a critical attribute of service quality in distribution systems and is commonly quantified through reliability indices such as the System Average Interruption Frequency Index (SAIFI), the System Average Interruption Duration Index (SAIDI), and the Customer Average Interruption Duration Index (CAIDI), as defined in IEEE Std. 1366 [
1]. In radial distribution networks, the existence of a single electrical path between the substation and downstream customers causes faults located in upstream feeder sections to affect large groups of users. This structural characteristic makes the optimal placement of sectionalizing devices one of the most cost-effective alternatives for improving service continuity in distribution feeders [
2,
3]. Sectionalizing devices allow the faulted section to be isolated and enable the restoration of healthy feeder segments before the definitive repair of the damaged component is completed, either through manual operation or remote-controlled switching depending on the installed technology [
4]. Consequently, the placement of these devices has been widely formulated as a mixed-integer optimization problem within distribution-system reliability planning [
2,
5].
The installation of sectionalizing devices must be planned by balancing the investment required for new equipment against the expected customer interruption cost. For this reason, a total-cost formulation consistent with the actual operating behavior of the feeder is essential [
6,
7]. Insufficient or poorly located sectionalizing may increase the expected energy not supplied (EENS) and deteriorate regulatory reliability indices. Conversely, excessive sectionalizing may increase capital expenditure without producing a proportional reduction in EENS, thereby compromising the economic feasibility of the reliability-improvement project [
4,
8]. The problem becomes even more complex when the failure probability of the switching device itself, the coordination between protection and switching equipment, and the operational heterogeneity between manual and remotely controlled devices are considered [
4,
8,
9]. Therefore, the scientific question addressed in this study is how efficiently a recent metaheuristic algorithm can solve a total Scost-based formulation for the optimal placement of sectionalizing devices when applied to the IEEE 69-bus radial distribution system.
Recent studies on sectionalizing-device placement have addressed the problem using increasingly detailed mathematical formulations. Early approaches formulated the problem through mixed-integer programming models that integrate reliability and cost within a single objective function [
5]. Subsequent mixed-integer linear programming (MILP)-based formulations incorporated the distinction between manual and remotely controlled devices, enabling a more detailed representation of fault isolation and service restoration processes [
2]. Other contributions extended the reliability assessment by evaluating interruptions event by event, estimating outage duration through operational simulations, and validating the resulting model in complex distribution networks [
6]. Additional studies introduced the failure probability of the switching device into the customer interruption cost model, showing that neglecting this factor may alter the optimal solution [
8]. The scope has also been extended to active distribution networks with distributed generation and uncertainty, where mixed-integer nonlinear programming (MINLP) formulations explicitly include the economic value of power losses [
7]. More recent works have differentiated manual and remotely controlled sectionalizing devices through multiobjective formulations based on Pareto fronts between cost and EENS [
4]. Alam et al. [
10] studied the optimal placement of reclosers in radial distribution systems for reliability improvement, showing that protective-device location has a direct effect on reliability indices and service-continuity performance. At a more advanced level, the simultaneous coordination of reclosers, sectionalizers, and disconnectors, including the relocation of pre-existing equipment, has also been investigated [
9]. Despite these advances, the Aquila Optimizer (AO) has received limited attention in the optimal placement of sectionalizing devices in radial distribution networks, mainly because it is a relatively recent metaheuristic in the optimization field [
11]. Moreover, there is still a clear need for rigorous and controlled comparisons between AO and consolidated optimization approaches such as the Grey Wolf Optimizer (GWO) and hybrid Genetic Algorithm–Particle Swarm Optimization (GA-PSO) methods under the same mathematical formulation and equivalent experimental conditions [
12,
13,
14,
15].
Distribution-system planning has also been studied from broader perspectives that include voltage quality, structural expansion, active losses, generation adequacy, distributed generation, power-electronic interfaces, and reliability under uncertainty. Meng et al. [
16] addressed dissipativity-based multiport stability root-cause identification and mitigation for solid-state transformers, showing the increasing relevance of stability and control constraints in modern active distribution systems. However, this contribution is related to power-electronic stability rather than reliability-oriented placement of sectionalizing devices. However, several of these works focus on reliability indices, network expansion, or cost reduction as separate objectives rather than integrating technical and economic criteria into a unified decision-making framework [
17,
18,
19]. This separation limits the practical applicability of the proposed solutions in real planning environments, where the placement of sectionalizing devices must be justified simultaneously in terms of operational impact, implementation cost, and contribution to service continuity [
2,
4,
7]. Zuñiga Villarreal et al. [
17] formulated the radial distribution-network expansion problem through a multicriteria objective function that integrates voltage quality, active power losses, and average failure rate. Their study evaluated the effect of demand growth on conductors over a ten-year planning horizon using the IEEE 15-bus and 33-bus systems, showing that early interventions in critical branches may defer investments by up to five years. Nevertheless, their formulation explicitly excludes the placement of sectionalizing devices and does not consider the expected customer interruption cost as a decision variable. Peña et al. [
20] assessed the reliability of the Ecuadorian National Interconnected System through a recursive convolution model applied to 369 generation units, calculating loss of load expectation (LOLE), EENS, and the energy index of reliability (EIR) for 2023 and 2024, with projections to 2029 under four availability scenarios. Their results reported LOLE values of 90.71 days per year in 2024, well above the international reference threshold of 0.1 days per year recommended by the North American Electric Reliability Corporation (NERC), identifying hydropower dependence as the main structural vulnerability of the system. However, this work operates at the generation level and does not address distribution-level reliability-improvement mechanisms, particularly the optimal placement of sectionalizing devices for reducing energy not supplied.
Aguila Téllez et al. [
19] proposed a probabilistic framework for reliability assessment in active distribution networks with high photovoltaic penetration under extreme weather conditions. Their approach used Monte Carlo simulation on the IEEE 33-bus system with stochastic synthesis of load and generation profiles at a 15 min resolution. The results showed that storm events increased SAIDI by 204.1% with respect to the base scenario and that the benefits of photovoltaic penetration saturated at approximately 30–35%, losing effectiveness under high climatic exposure. Nevertheless, that study modeled protection devices through aggregated failure-rate and restoration-time parameters without incorporating the optimal placement of sectionalizers or a total interruption-cost objective function. Aguila Téllez et al. [
18] developed a methodology for the optimal placement of reclosers in radial systems by combining Monte Carlo simulation with a multicriteria assessment weighted through the criteria importance through intercriteria correlation (CRITIC) method over SAIFI, SAIDI, CAIDI, and average energy not supplied (AENS). The methodology generated pseudo-random variables within predefined ranges to represent uncertainty in failure rates and repair times, and its validation through exhaustive search on the IEEE 15-bus system confirmed agreement in more than 90% of the generated scenarios. However, that study considered reclosers as the only device type, did not extend the analysis to sectionalizers, and did not compare the performance of different metaheuristics under a total-cost function that jointly integrates investment cost and expected customer interruption cost. The recurring gap in this body of literature is the absence of a unified and reproducible assessment framework that simultaneously integrates technical and economic criteria for the optimal placement of sectionalizing devices [
17,
18,
19,
20], evaluates the behavior of a recently developed metaheuristic such as the Aquila Optimizer [
11], and compares it under controlled experimental conditions with consolidated reference algorithms such as GWO and hybrid GA-PSO [
12,
13,
14,
15] on a standardized test system such as the IEEE 69-bus feeder. In this context, the scientific contribution is not limited to introducing another optimizer into a known binary placement problem; rather, it lies in quantifying how solution quality, robustness, convergence behavior, computational effort, and reliability improvement interact when different stochastic search mechanisms are applied to the same cost-based sectionalizing-device placement formulation.
Based on these limitations, this work proposes the application of the Aquila Optimizer to the optimal placement of sectionalizing devices in radial distribution networks and compares its performance with GWO and a hybrid GA-PSO algorithm [
11,
12,
13,
14]. The proposed framework simultaneously considers reliability performance and economic restrictions within a single optimization model [
2,
4,
7]. The general objective is to determine the optimal location of sectionalizing devices in a radial feeder by using AO as the main optimization technique and by evaluating its behavior against two consolidated metaheuristic references. The decision variables are encoded as a binary vector that indicates the presence or absence of a sectionalizing device in each candidate branch of the IEEE 69-bus system. The objective function minimizes the total expected cost, composed of the customer interruption cost and the installation cost of the selected devices [
2,
5]. The formulation is subject to candidate-branch eligibility, maximum number of devices, maximum available budget, and maximum allowable restoration time, while the radial topology of the base feeder is preserved by construction [
2,
8]. SAIFI, SAIDI, and CAIDI are computed as evaluation outputs to verify the reliability improvement obtained with respect to the base case, without being directly embedded in the objective function [
1].
The main contribution of this paper is threefold. First, it formulates the sectionalizing-device placement problem as a cost-based binary optimization model in which investment cost and expected customer interruption cost are jointly evaluated, while SAIFI, SAIDI, CAIDI, and EENS are used as post-optimization reliability indicators. Second, it provides a controlled and reproducible evaluation of the Aquila Optimizer for this planning problem by comparing it with GWO and hybrid GA-PSO under identical population sizes, iteration budgets, independent runs, binarization criteria, and pseudo-random seed conditions. Third, it establishes a comparative decision criterion that jointly considers best and mean objective-function values, convergence behavior, dispersion across independent runs, computational time, number of installed devices, and reliability-index improvement. This contribution is intended to clarify the planning value and limitations of AO rather than to claim unconditional superiority over the benchmark algorithms. The main findings show that the best identified installation of eight sectionalizing devices substantially reduces SAIDI and the total expected cost with respect to the base case, while SAIFI remains unchanged because the analyzed radial configuration does not include load-transfer paths. The comparative assessment also shows that the three algorithms reach solutions of similar quality around the best identified configuration, but with differentiated performance profiles: GWO exhibits the highest robustness and lowest dispersion, GA-PSO confirms the best identified configuration by reaching the same optimum, and AO provides the lowest computational time with a near-optimal cost value. These results support the interpretation of AO as a computationally efficient alternative for rapid sectionalizing-device planning analyses, while final investment decisions should still consider economic performance, robustness, and reproducibility across independent runs.
The remainder of this paper is organized as follows.
Section 2 presents the theoretical framework, including radial distribution-network modeling, the fundamentals of sectionalizing-device placement, the metaheuristic algorithms considered, and the reliability indices used for performance assessment.
Section 3 defines the problem formulation and describes the general planning framework adopted for the IEEE 69-bus test system, including the base-case configuration used as the reference scenario.
Section 4 develops the mathematical formulation, including the decision variables, objective function, operational constraints, reliability-output metrics, fitness evaluation, computational-complexity considerations, and implementation details of AO, GWO, and GA-PSO.
Section 5 describes the case study, the candidate branches, the reliability and cost parameters, and the base-case configuration.
Section 6 presents and discusses the numerical results, including the optimal device locations, reliability improvements, convergence behavior, computational performance, comparative analysis among the algorithms, and practical implementation considerations. Finally,
Section 7 summarizes the main conclusions, highlights the practical implications of the proposed approach, and outlines future research directions.
3. Problem Formulation
This section defines the planning problem addressed in this study: the optimal placement of sectionalizing devices in a radial distribution network for cost-effective reliability improvement. The formulation is conceived as a constrained binary combinatorial optimization problem in which each candidate branch can either receive a sectionalizing device or remain unchanged. The objective is to identify the configuration that minimizes the total expected cost associated with customer interruptions and device installation, while satisfying technical and economic constraints related to candidate-branch eligibility, maximum number of devices, investment budget, and allowable restoration time. The problem statement also establishes the general computational workflow used to compare the Aquila Optimizer (AO), the Grey Wolf Optimizer (GWO), and the hybrid GA-PSO algorithm under equivalent experimental conditions.
3.1. General Structure of the Proposed Problem
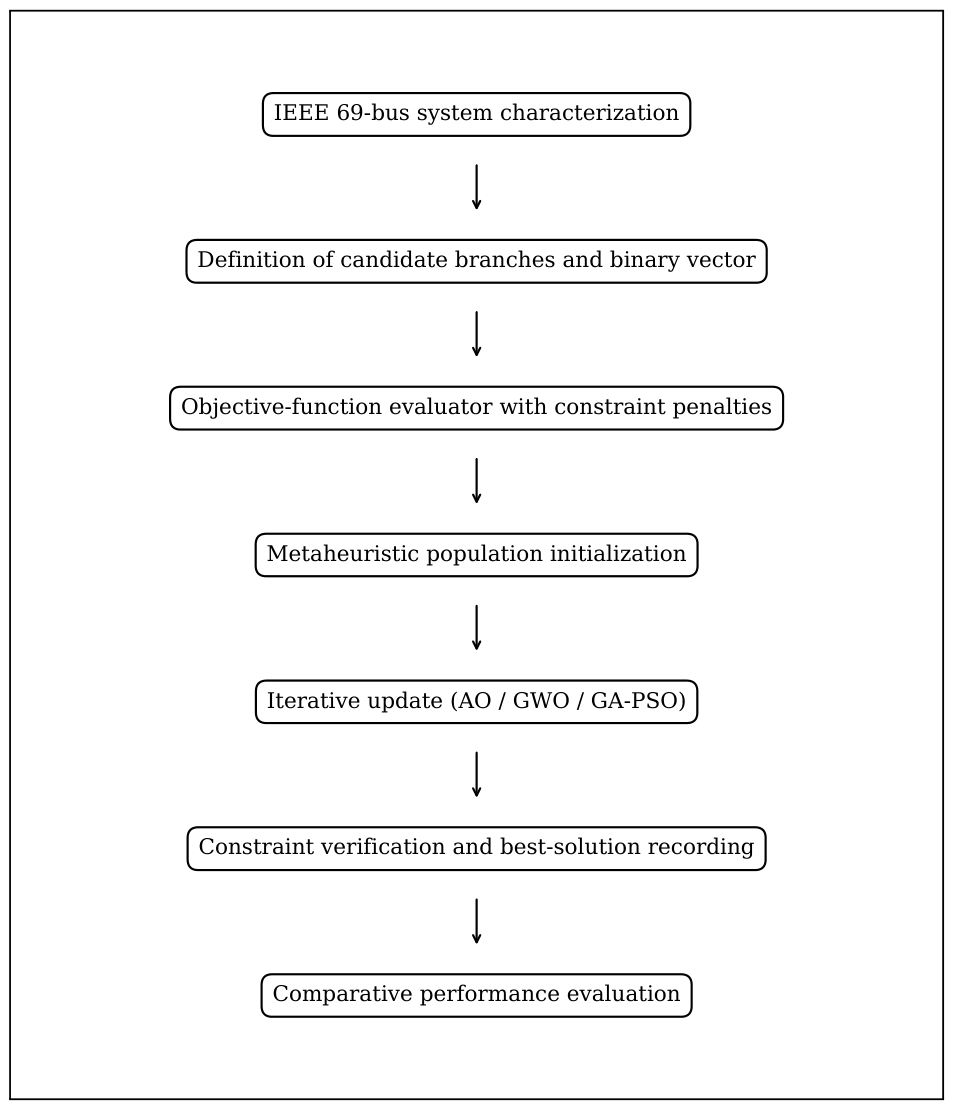
The proposed framework follows a sequential planning structure composed of six main stages. First, the IEEE 69-bus radial distribution system is characterized, and the set of candidate branches for sectionalizing-device installation is defined. Second, the objective-function evaluator is constructed by combining the expected customer interruption cost, the annualized investment cost, and the penalty terms associated with constraint violations. Third, an initial population of candidate binary solutions is generated for each metaheuristic algorithm. Fourth, the iterative search process is executed according to the specific updating rules of AO, GWO, and GA-PSO. Fifth, the feasibility of each candidate solution is assessed through the operational constraints, and the best solution found up to each iteration is recorded. Finally, the algorithms are compared in terms of solution quality, convergence behavior, robustness, computational effort, and reliability improvement. This type of controlled and reproducible workflow is consistent with the validation protocols commonly used for metaheuristic optimization in distribution-system planning [
15].
It is important to emphasize that the sequential structure of the workflow does not imply that every solution generated during the search is feasible. Because population-based metaheuristics explore the solution space stochastically, infeasible configurations may appear during the optimization process. Instead of discarding these solutions, which could reduce population diversity and prematurely restrict the search, constraint violations are incorporated into the fitness function through a penalty mechanism. In this way, infeasible candidates remain available to the algorithm but receive a degraded fitness value, which progressively guides the population toward the feasible region as the iterations advance. This strategy allows the optimization process to remain stable even when early candidate solutions violate one or more operational or economic constraints.
The proposed formulation is therefore structured to preserve a clear separation between the physical system, the optimization model, and the algorithmic comparison. The physical layer is represented by the radial feeder topology, the load points, the branch failure rates, and the restoration characteristics. The optimization layer is represented by the binary decision vector, the total expected cost function, and the feasibility constraints. The algorithmic layer is represented by the three metaheuristic solvers evaluated under identical computational conditions. To make the overall research logic explicit,
Figure 1 presents a systematic flowchart of the proposed framework, linking the characterization of the IEEE 69-bus feeder, the definition of candidate branches, the construction of the penalized objective-function evaluator, the execution of the metaheuristic search, the verification of constraints, and the final comparative performance assessment.
As illustrated in
Figure 1, the optimization process starts from the characterization of the IEEE 69-bus system and the definition of the candidate branches. These inputs are then used to construct the binary search space and the cost-based fitness evaluator with penalty terms for constraint violations. Each metaheuristic algorithm generates and updates candidate configurations, which are subsequently evaluated in terms of constraint satisfaction and objective-function value. The best solution found during the search is stored at each iteration, enabling the comparative assessment of convergence trajectories, computational time, reliability indices, and final total expected cost. This sequence also indicates how the physical feeder data, the mathematical formulation, and the algorithmic comparison are connected within a single reproducible workflow.
3.2. IEEE 69-Bus Test System
The proposed problem is evaluated using the IEEE 69-bus radial distribution system, a 12.66 kV benchmark feeder widely adopted in distribution-network optimization studies [
39]. This test system consists of one supply node, 68 load nodes, and 68 branches arranged in a radial configuration. Its total demand is approximately 3.80 MW and 2.69 MVAr, distributed along a main feeder and several lateral branches. The IEEE 69-bus system is particularly suitable for the present study because it provides an intermediate-scale radial topology that is sufficiently complex to represent realistic planning conditions while remaining fully traceable for comparative and reproducible analysis [
39,
40].
From a reliability-planning perspective, the radial nature of the IEEE 69-bus feeder is especially relevant. Since each load point is supplied through a unique upstream path, a fault in a feeder section may affect all downstream customers until the faulted segment is isolated and healthy portions of the network are restored. Therefore, the location of sectionalizing devices directly influences the number of affected load points, the duration of interruptions, and the expected energy not supplied. In this study, the base radial structure of the feeder is preserved throughout the optimization process. The candidate solutions only determine the placement of sectionalizing devices on eligible branches and do not modify the network topology by adding tie lines, changing feeder connections, or enabling load-transfer alternatives.
Let
denote the radial graph associated with the IEEE 69-bus system, where
represents the set of buses and
represents the set of branches. The subset of eligible branches for sectionalizing-device installation is denoted by
. This candidate set is obtained by excluding terminal branches that already have load-side transformer protection and branches immediately adjacent to the source node, where protection is associated with the general feeder scheme and is not considered relocatable within the scope of this planning problem [
33,
41]. After applying these exclusion criteria to the 68 branches of the IEEE 69-bus feeder, the candidate set contains
eligible branches. Consequently, the binary search space evaluated by the metaheuristic algorithms contains
possible sectionalizing configurations before considering the device-number, budget, and restoration-time constraints.
Table 1 reports the resulting candidate-branch set to support reproducibility of the optimization process.
The exclusion of non-candidate branches is also justified from an optimization standpoint. Branches with negligible contribution to system-level interruption-cost reduction, or branches whose protection function is not compatible with sectionalizing-device relocation, may introduce unnecessary binary variables without improving the quality of the final solution. Removing these branches from
improves computational efficiency and avoids unrealistic installation alternatives. Previous studies on radial distribution feeders have shown that this type of candidate-branch filtering can reduce the search space without compromising the ability to identify high-quality sectionalizing configurations [
2,
8,
41]. Therefore, the candidate set
defines the feasible installation domain used by the metaheuristic algorithms, while the complete branch set
remains necessary for evaluating fault propagation, affected load points, interruption duration, and reliability indices.
3.3. Base-Case Configuration
The base case used as the reference condition corresponds to the original IEEE 69-bus radial feeder without additional sectionalizing devices installed on the candidate branches. In this configuration, the feeder preserves its original radial topology, and no tie lines, load-transfer paths, network reconfiguration actions, or remotely controlled restoration alternatives are introduced. Therefore, when a fault occurs on a feeder section, the affected downstream load points remain interrupted according to the original isolation and restoration logic of the radial system.
This base-case configuration is used only as the reference scenario against which the optimized sectionalizing-device placements are evaluated. The comparison quantifies the reduction in expected energy not supplied, customer interruption cost, total expected cost, System Average Interruption Duration Index, and Customer Average Interruption Duration Index produced by the installation of sectionalizing devices. Because the analyzed feeder does not include load-transfer paths, the placement of sectionalizing devices mainly affects interruption duration and restoration time, whereas the interruption-frequency component represented by the System Average Interruption Frequency Index is not expected to change significantly.
4. Methodology
This section presents the mathematical and computational methodology adopted to solve the optimal placement problem of sectionalizing devices in radial distribution networks. The formulation is based on the mixed-integer reliability-planning framework proposed by Shahbazian et al. [
2], adapted in this study for its solution through population-based metaheuristic algorithms. The methodology defines the binary decision variables, the search space, the total expected cost function, the operational and economic constraints, the reliability-output indices, the constraint-handling strategy, and the implementation of the Aquila Optimizer (AO), Grey Wolf Optimizer (GWO), and hybrid GA-PSO algorithm. The objective is to guarantee a technically consistent, reproducible, and statistically traceable comparison among the three algorithms under identical experimental conditions.
4.1. Decision Variable and Search Space
Let the radial distribution network be represented by the graph
, where
denotes the set of buses or load points and
denotes the set of branches connecting them. Let
be the subset of candidate branches where sectionalizing devices can be installed, with
. For the IEEE 69-bus case study,
, as reported in
Table 1. The decision to install or not install a sectionalizing device on each candidate branch is encoded through the binary vector [
2,
5]
where
indicates that a sectionalizing device is installed on candidate branch
, whereas
indicates that no device is installed on that branch.
Equation (
1) defines a discrete combinatorial search space with
possible configurations. In the IEEE 69-bus case study, the
candidate branches lead to
possible binary configurations before applying the operational and economic constraints. This exponential growth prevents exhaustive enumeration and motivates the use of metaheuristic optimization techniques capable of identifying high-quality solutions within reasonable computational times [
2,
5,
6,
15]. In the proposed formulation, each vector
represents a complete sectionalizing plan for the feeder. Therefore, the quality of a candidate solution depends on its ability to reduce expected interruption costs while satisfying device-number, investment-budget, restoration-time, and network-operating constraints.
4.2. Objective Function
The optimization problem is formulated as the minimization of the total expected cost of the system. This cost is defined as the sum of the expected customer interruption cost and the annualized investment and installation cost of the selected sectionalizing devices. This two-component formulation provides a direct balance between reliability improvement and the economic effort required to implement the solution [
2,
4,
8]. The objective function is expressed as
where
is the total expected cost associated with the sectionalizing configuration
,
is the expected customer interruption cost, and
is the annualized investment cost of the installed devices.
The interruption-cost component is calculated as the product between the expected energy not supplied and the unit interruption cost
, which assigns an economic value to each kilowatt-hour not delivered to customers [
7,
8]:
The expected energy not supplied is obtained by summing, over all load points
, the product between the annual unavailability
and the average demand
of each load point [
5,
8]:
In this expression,
represents the annual unavailability of load point
i, usually expressed in hours per year, and
represents the average active power demand associated with that point. The value of
depends on the sectionalizing configuration because the installed devices modify the set of customers affected by each fault and the time required to isolate the faulted section and restore the healthy portions of the feeder [
3,
5,
6].
The annualized investment component is calculated as the sum of the individual costs of all devices installed in the candidate branches [
2,
4,
6]:
where
is the annualized cost of the sectionalizing device assigned to candidate branch
j, including acquisition, installation, operation, and maintenance costs. The structure of (
2) penalizes two undesirable planning conditions: insufficient sectionalizing, which increases EENS and customer interruption cost, and excessive sectionalizing, which increases capital expenditure without a proportional improvement in reliability [
2,
4,
8].
4.3. Operational and Economic Constraints
The optimal solution must belong to the feasible region of the problem, defined by all binary configurations that satisfy the topological, economic, and operational requirements of the distribution system. The constraints considered in this study ensure that the sectionalizing plan is technically implementable, economically admissible, and consistent with the radial operating structure of the feeder.
4.3.1. Candidate-Branch Eligibility
Because the study is performed on the IEEE 69-bus system in its base radial configuration, the installation of sectionalizing devices does not modify the original connectivity of the feeder and does not introduce new tie lines. Therefore, candidate solutions can only select branches belonging to the predefined candidate set
, while maintaining the radial operation of the system [
2,
5]. This condition is expressed as
4.3.2. Maximum Number of Sectionalizing Devices
To avoid oversized solutions and preserve the economic feasibility of the reliability-improvement project, the total number of installed sectionalizing devices is limited by the maximum admissible value
[
2,
4,
8]:
This constraint prevents the optimization algorithm from selecting configurations that achieve reliability improvements only by installing an excessive number of devices.
4.3.3. Available Investment Budget
The total investment cost of the installed sectionalizing devices must not exceed the available budget
B assigned to the reliability-improvement project [
2,
4,
8]:
This constraint guarantees that the selected configuration remains compatible with the financial limits of the planning problem.
4.3.4. Maximum Allowable Restoration Time
For any load point affected by a fault, the service restoration time must not exceed the maximum allowable threshold
, which is defined as a planning parameter [
5,
6]:
This constraint links the optimization model with the expected operational response of the feeder, since the placement of sectionalizing devices modifies the isolation sequence and the restoration time experienced by downstream load points.
4.3.5. Branch Current Limit
The operating current in each branch must remain below its admissible thermal limit. This condition prevents a candidate configuration from being considered feasible if it produces branch loading beyond the allowable current rating:
where
is the current flowing through branch
, and
is its maximum admissible current.
The feasible region of the optimization problem is defined by the simultaneous satisfaction of (
6)–(
10):
4.4. Load, Customer, and Reliability Parameters
The objective-function evaluation requires the definition of electrical, economic, and reliability parameters associated with each load point and branch. In the implemented workflow, the feeder topology, branch identifiers, branch lengths, nodal active-power demands, and branch-current limits are extracted from the verified PowerFactory model and processed in MATLAB. The average nodal demand
is considered equivalent to the average active power consumed at load point
i during the analysis period [
2,
5,
6]:
When the input demand is available as peak active power, the average demand used in the EENS calculation is obtained as
, where
is the load factor reported in
Table 2. This treatment keeps the reliability-cost calculation consistent with the annual energy-not-supplied formulation while preserving the original nodal load distribution of the IEEE 69-bus benchmark.
In the present formulation, branch failure rates and restoration times are treated as deterministic planning parameters. Therefore, outages caused by extreme weather events are not modeled as a separate stochastic process in the optimization loop. Their effect is only implicitly represented to the extent that the adopted reliability parameters reflect average historical operating conditions. Explicit weather-dependent outage modeling would require time-varying or scenario-dependent failure rates, restoration times, and repair-resource constraints, which are outside the scope of the deterministic benchmark formulation adopted in this study.
The annual failure rate of each branch can be obtained from the product between the failure rate per kilometer-year and the length of the corresponding branch [
2,
5,
6,
28]:
where
is the failure rate per kilometer-year of branch
, and
is the length of that branch. In the case study,
corresponds to the branch length associated with each line element of the IEEE 69-bus feeder, exported from the PowerFactory model using the same branch identifiers reported for the candidate set. The same reference failure rate per kilometer-year is applied to all overhead line sections, as summarized in
Table 2; therefore, the branch-specific annual failure rate differs according to the length of each branch.
The equivalent interruption rate of load point
i depends on the set of branch faults that interrupt its supply under the sectionalizing configuration
. Let
be a binary affectation parameter equal to 1 if a fault on branch
interrupts the supply of load point
i under configuration
, and equal to 0 otherwise [
1,
5,
6]. In the MATLAB implementation, the affectation matrix is constructed from the radial upstream–downstream relationship of the feeder. For each simulated faulted branch
, the algorithm identifies the downstream set of load points and verifies whether the installed sectionalizing devices allow a healthy portion of the feeder to be isolated from the faulted section. Since no tie lines or load-transfer paths are considered, the matrix modifies the duration assigned to affected load points but does not create alternative supply paths that would reduce the branch-failure frequency contribution. The equivalent interruption rate is then expressed as
The annual unavailability of load point
i is calculated by considering the failure rate of each branch, the corresponding restoration time, and the affectation condition of the load point under the sectionalizing configuration [
1,
3,
5]:
where
is the restoration time experienced by load point
i when a fault occurs on branch
under configuration
. This restoration-time matrix is obtained from the fault location and the nearest installed sectionalizing devices that delimit the isolated section. Load points that remain within the isolated faulted section are assigned the repair time
r, whereas load points that can be restored after switching operations are assigned the switching time
. If no sectionalizing device separates a healthy downstream portion from the faulted section, the corresponding load points remain associated with the repair-time condition. The values of
r and
used in the case study are reported in
Table 2. Thus,
changes with the selected device locations and provides the mechanism by which sectionalizing reduces SAIDI, CAIDI, and EENS in the strictly radial feeder.
The equivalent mean restoration time of load point
i is obtained as the ratio between its annual unavailability and its equivalent interruption rate [
1,
3,
5]:
Equations (
14)–(
16) define the reliability model used to quantify how each sectionalizing configuration modifies interruption frequency, interruption duration, and expected energy not supplied across the feeder.
4.5. Reliability Indices as Evaluation Outputs
The reliability indices defined in IEEE Std. 1366 [
1] are calculated as post-optimization evaluation outputs. They are not included directly in the objective function because the optimization model is cost-based and because derived indices, particularly CAIDI, introduce nonlinear relationships that may generate redundancy within the metaheuristic search process [
1,
2,
4]. Instead, SAIFI, SAIDI, and CAIDI are used to interpret the technical reliability effect of the best-identified solution obtained from the total expected cost minimization.
The interpretation of these indices is conditioned by the operating assumptions of the study. The IEEE 69-bus feeder is analyzed as a strictly radial network without tie lines, load-transfer paths, automatic feeder reconfiguration, or distributed restoration alternatives. Under these assumptions, the installation of sectionalizing devices does not create alternative supply paths capable of eliminating the occurrence of customer interruptions caused by upstream faults. Therefore, SAIFI is expected to remain nearly unchanged, whereas SAIDI, CAIDI, and EENS can improve because sectionalizing devices reduce the duration of interruptions by isolating faulted sections and enabling faster restoration of healthy feeder portions.
Let
be the number of customers connected to load point
i, and let
be the total number of customers served by the system. The System Average Interruption Frequency Index is calculated as [
1]
The System Average Interruption Duration Index is calculated as [
1]
The Customer Average Interruption Duration Index is computed as the ratio between SAIDI and SAIFI [
1]:
Equation (
19) shows that CAIDI is a derived metric whose value depends simultaneously on the frequency and duration components of the interruption process. Therefore, its evaluation is reserved for post-optimization interpretation, while SAIFI and SAIDI provide direct information about the interruption frequency and interruption duration experienced by customers [
2,
4,
8]. In the present study, this distinction is important because sectionalizing devices in a strictly radial feeder may primarily reduce interruption duration rather than interruption frequency.
4.6. Compact Statement of the Optimization Problem
Integrating the previous definitions, the optimal placement of sectionalizing devices is formulated as the following constrained binary combinatorial optimization problem:
subject to
The formulation in (
20) and (
21) defines a large-scale discrete optimization problem whose exhaustive solution becomes computationally impractical as the number of candidate branches increases [
15,
41]. This condition justifies the use of the Aquila Optimizer as the main population-based search strategy [
11], compared under identical experimental conditions with the Grey Wolf Optimizer [
12,
30] and the hybrid GA-PSO algorithm [
13,
14]. The comparison is performed using the same population size, iteration budget, number of independent runs, and pseudo-random seeds to guarantee statistical traceability and methodological reproducibility [
13,
15].
4.7. Rationale for Metaheuristic Solution and Exact Benchmarking Scope
For the IEEE 69-bus case study, the candidate-branch set contains
binary decision variables, as reported in
Table 1. Therefore, a complete exhaustive enumeration would require evaluating
possible configurations before applying the operational and economic constraints. Even if each candidate configuration were evaluated rapidly in MATLAB, this number of combinations makes full enumeration computationally impractical for the adopted benchmark system.
An exact mixed-integer linear programming or mixed-integer programming benchmark was also not used as the main solution method because the reliability evaluation adopted in this study depends on topology-dependent affectation and restoration-time matrices, and , which are updated according to the selected sectionalizing-device locations and the radial fault-isolation logic. These matrices determine which load points are affected by each branch fault and whether they are assigned repair time or switching time. Consequently, the resulting evaluator is not a direct linear cost function of the binary placement vector unless additional auxiliary variables and logic constraints are introduced to explicitly encode all radial downstream relationships and restoration states.
For this reason, the present work focuses on a controlled comparison of stochastic metaheuristic algorithms under the same binary encoding, candidate set, fitness function, penalty treatment, population size, iteration budget, and pseudo-random seed set. The reported solution should therefore be interpreted as the best-identified configuration under the adopted comparative protocol rather than as a mathematically certified global optimum. Developing an exact MILP/MIP reformulation or an exhaustive benchmark for reduced candidate sets is a relevant extension for future work.
4.8. Objective-Function Evaluation and Constraint Handling
Population-based metaheuristics generally operate through a fitness function that evaluates the quality of each candidate solution. Since these algorithms do not inherently enforce explicit operational constraints, the objective function is augmented with a penalty term that degrades the fitness of infeasible solutions [
14,
15,
41]. The penalized fitness function adopted in this study is
where
is the total expected cost defined in (
20),
is the
k-th operational or economic constraint expressed in inequality form, and
is the penalty coefficient. The penalty term increases the fitness value of infeasible solutions, reducing their probability of being selected as the search progresses [
14,
15,
41].
To avoid combining constraint violations with different physical units, the violations were normalized before applying the quadratic penalty. In the numerical implementation, the constraint functions associated with the maximum number of devices, budget, restoration time, and branch-current limit were evaluated as
Only positive values of these functions contribute to the penalty term through
. The penalty coefficient was set to
USD/year, which makes infeasible configurations less competitive than feasible configurations while preserving the original total expected cost
for all candidates satisfying the constraints.
A quadratic penalty is adopted because it mildly penalizes small violations near the feasible boundary while strongly penalizing large violations. This behavior is convenient when the best solution may lie close to the boundary of the feasible region [
42]. For each candidate vector
, the evaluation of
requires calculating the annual unavailability
of every load point, the equivalent interruption rates, the restoration times, the expected energy not supplied, and the associated investment cost. These calculations are performed according to the radial topology of the feeder and the location of the sectionalizing devices, which jointly determine the affected customers and the restoration sequence after each fault [
5,
6,
41].
4.9. Implementation of the Aquila Optimizer (AO)
The Aquila Optimizer models the four hunting strategies described in
Section 2.2.1 through differentiated updating rules that alternate between global exploration and local exploitation throughout the iterative process [
11]. These four strategies are high soaring with expanded exploration, contour flight with short gliding attack, low flight with expanded exploitation, and walking and prey capture. Let
be the continuous position vector of an individual at iteration
t,
be the best solution found up to that iteration,
be the mean position of the population, and
T be the maximum number of iterations.
Phase 1: High soaring with expanded exploration. This phase emulates high-altitude flight to identify promising regions of the search space [
11]:
Here,
is a uniformly distributed random number in
. The factor
progressively reduces the exploratory influence as the algorithm approaches the final iterations.
Phase 2: Contour flight with short gliding attack. This phase combines local exploration around promising regions with stochastic perturbations based on Lévy flight [
11]:
In (
25),
is a randomly selected position from the current population,
is a Lévy-flight vector of dimension
d, and
x and
y define the spiral trajectory used by the algorithm. The Lévy distribution introduces occasional long jumps that help reduce the probability of premature convergence to local optima [
11].
Phase 3: Low flight with expanded exploitation. This phase represents the initial descending attack toward the selected prey and intensifies the search around promising regions [
11]:
Here,
and
are the upper and lower bounds of the continuous search space, respectively, while
and
are exploitation parameters set to 0.1 according to the values recommended in the original AO formulation [
11].
Phase 4: Walking and prey capture with intensive exploitation. This final phase represents the definitive attack and concentrates the search around the best candidate solution [
11]:
In (
27),
is the quality function that regulates the search intensity during the final stage,
is a random perturbation factor, and
is a coefficient that decreases with the iterations to concentrate the search progressively around the best solution [
11].
The transition between AO phases is governed by the iteration index. The exploratory phases are activated when
, whereas the exploitative phases are activated when
[
11]. Since the sectionalizing-device placement problem requires binary variables, the continuous positions generated by (
24)–(
27) are mapped into the binary search space through the sigmoid transfer function.
This transformation allows AO to be applied to the proposed binary combinatorial problem without modifying its continuous updating structure [
15]. In the computational implementation, the sigmoid transfer is applied consistently to the continuous-position algorithms, and the binary state is assigned according to the stochastic comparison with
, as described in (
28).
4.10. Implementation of the Grey Wolf Optimizer (GWO)
The Grey Wolf Optimizer models the social hierarchy and collective hunting behavior of grey wolves through four categories of agents: alpha
, beta
, delta
, and omega
. The alpha, beta, and delta wolves represent the three best solutions found during the search and guide the position update of the remaining population [
12]. For each candidate solution, the distances from the leading wolves are calculated as
The candidate movements induced by the three leading wolves are then computed as
The updated position is obtained as the average of these three candidate movements:
The coefficient vectors
and
control the balance between exploration and exploitation and are defined as [
12]
where
and
are uniformly distributed random vectors in
, and
decreases linearly from 2 to 0 during the iterative process. This decreasing behavior enables the algorithm to move gradually from global exploration toward local exploitation [
12]. As in AO, the continuous position vector generated by GWO is converted into a binary configuration using the sigmoid transformation in (
28), which ensures that both algorithms use a consistent binary representation and can therefore be compared under equivalent methodological conditions [
15].
4.11. Implementation of the Hybrid GA-PSO Algorithm
The hybrid GA-PSO algorithm combines the evolutionary operators of the Genetic Algorithm with the social-learning dynamics of Particle Swarm Optimization. The purpose of this hybridization is to integrate the diversification capability of GA with the accelerated convergence behavior of PSO [
13,
14]. In each iteration, the population is updated through a coordinated PSO–GA mechanism: the PSO component guides the search toward the best individual and global experiences, whereas a predefined fraction of the population is renewed through genetic operators, including selection, crossover, and mutation. This structure preserves population diversity while maintaining a directed search toward high-quality regions of the solution space.
PSO component. The velocity and position of each particle are updated according to
and
where
w is the inertia coefficient,
and
are the cognitive and social acceleration coefficients,
and
are random numbers uniformly distributed in
,
is the historical best position of particle
i, and
is the best global position found by the population [
13,
14].
GA component. The genetic operators are applied to the portion of the population selected for renewal through binary tournament selection, uniform crossover with probability
, and bit-flip mutation with probability
. Unlike AO and GWO, this component operates directly on the binary representation of the decision vector and therefore does not require a sigmoid transformation [
13,
14]. The sequential PSO–GA integration adopted in each iteration increases diversity and mitigates premature convergence, which is a common limitation of pure PSO implementations in combinatorial optimization problems [
13,
14].
4.12. General Comparative Algorithm
Table 3 summarizes the general procedure applied to the three metaheuristic methods. The structure is algorithm-independent and uses the specific updating rules of each method: (
24)–(
28) for AO, (
29)–(
32) for GWO, and (
33), (
34) together with the genetic operators for GA-PSO. In algorithms with continuous position updates, the generated positions are transformed into binary configurations using the sigmoid function defined in (
28).
4.13. Computational Complexity and Scalability Considerations
The computational burden of the proposed approach is mainly determined by the number of fitness evaluations required by each metaheuristic algorithm and by the cost of evaluating the reliability and economic performance of each candidate configuration. For a population size P and a maximum number of iterations T, each independent run requires approximately candidate-solution evaluations, in addition to the initial population evaluation. In the case study, and , which results in approximately 6000 fitness evaluations per run and 180,000 evaluations for the 30 independent runs of each algorithm.
The dimensionality of each candidate solution is governed by the number of candidate branches . For the IEEE 69-bus feeder, , which produces a complete binary search space of configurations. The metaheuristic algorithms therefore evaluate only a very small fraction of the complete search space, which is the main reason why they are suitable for this type of combinatorial planning problem. In general, increasing n enlarges the binary search space exponentially, whereas the computational budget of the metaheuristic search grows approximately linearly with P, T, and the number of independent runs selected by the analyst.
The cost of one fitness evaluation also depends on the reliability model. In the present implementation, the evaluator uses the radial topology, the branch-failure data, the affectation matrix, and the restoration-time matrix to compute , EENS, total expected cost, and the reliability indices. Therefore, larger feeders with more branches and load points would increase the cost of each evaluation because more fault-location and load-point combinations must be processed. Nevertheless, the use of preprocessed topology and static electrical data allows the MATLAB-based evaluator to avoid repeated external power-flow simulations during the optimization loop.
From a scalability perspective, the proposed framework is suitable for medium-scale radial benchmark feeders and can be extended to larger feeders if the candidate set is properly screened and the reliability evaluator is efficiently implemented. However, for large real distribution systems with thousands of branches, automated switching devices, tie lines, distributed generation, and network reconfiguration actions, additional computational strategies may be required. These may include candidate-location preselection, feeder partitioning, parallel fitness evaluation, surrogate reliability models, or hybrid exact–metaheuristic approaches. Therefore, the reported computational times should be interpreted as representative of the IEEE 69-bus benchmark and the adopted MATLAB-based evaluator, not as universal runtime guarantees for all distribution systems.
4.14. Experimental Protocol and Reproducibility
The comparative assessment is performed under identical experimental conditions to ensure statistical traceability and methodological validity [
15]. In this study, the population size is set to
, the maximum number of iterations to
, and the number of independent runs to 30 for each algorithm. These settings allow the relative performance of the three methods to be evaluated under equivalent computational budgets [
15]. A population size of 30 individuals provides a practical balance between search diversity and computational cost, while 200 iterations were sufficient for the three algorithms to stabilize their best objective values before the end of the optimization process, as later observed in the convergence curves. The use of 30 independent runs follows standard practice for stochastic algorithm assessment, since it allows the mean behavior and result dispersion to be characterized through statistical indicators such as the mean value and standard deviation [
15,
38].
The configuration parameters are summarized in
Table 4 and
Table 5.
Table 4 reports the parameters common to all three algorithms, which were kept identical to guarantee comparable experimental conditions.
Table 5 reports the algorithm-specific parameters, selected according to the values recommended by the original authors and the reference literature [
11,
12,
13,
14].
The parameters of each algorithm were selected according to the reference literature and the experimental conditions defined for this study. For AO,
was used [
11]. For GWO, the control coefficient
a decreases linearly from 2 to 0 [
12]. For GA-PSO, the inertia coefficient
w decreases linearly from 0.9 to 0.4, the cognitive and social coefficients are fixed as
, the crossover probability is
, the mutation probability is
, and the fraction of the population replaced through genetic operators is 0.3 [
13,
14]. The computational implementation was developed using MATLAB and DIgSILENT PowerFactory 2024. PowerFactory was used to build and verify the IEEE 69-bus feeder model and to extract the static network data required by the optimization process, including feeder topology, branch identifiers, nodal loads, branch thermal limits, and base operating currents. The objective-function evaluation, the execution of the metaheuristic algorithms, and the recording of comparative results were then performed in MATLAB using these preprocessed data.
No full AC power-flow calculation was called from PowerFactory at each candidate-solution evaluation. This is consistent with the adopted planning model because the installation of sectionalizing devices does not add tie lines, modify nodal demands, or change the radial load-flow paths of the base feeder. Therefore, branch-current feasibility was verified using the base radial operating condition and the corresponding thermal limits, while the optimization loop focused on the reliability and cost effects of the sectionalizing locations. The reported computational times consequently correspond to the MATLAB-based reliability and cost evaluations rather than to repeated external PowerFactory simulations.
4.15. Metrics for Algorithm Comparison
The relative performance of AO, GWO, and GA-PSO is evaluated using four complementary metrics that quantify solution quality, convergence behavior, robustness, and computational efficiency, following comparative protocols commonly adopted in the metaheuristic optimization literature [
15,
38].
Solution quality and statistical dispersion. The minimum total cost
, the mean total cost
, the standard deviation
, the coefficient of variation
, and the 95% confidence interval of the mean cost are calculated over the 30 independent runs. These indicators make it possible to distinguish algorithms that consistently reach high-quality solutions from those whose performance is more dispersed across runs [
15,
38]. The coefficient of variation is calculated as
whereas the 95% confidence interval of the mean objective-function value is estimated as
where
is the number of independent runs and
is the Student coefficient for
degrees of freedom. This descriptive statistical assessment is used to strengthen the interpretation of robustness and mean performance without assuming that a single best run is representative of the stochastic behavior of the algorithm.
Convergence speed. The convergence speed is quantified through the average iteration at which each algorithm reaches a solution within 5% of its final best objective value. This metric provides a direct measure of the iterative effort required by each method to enter a high-quality region of the search space in a minimization problem [
15,
38].
Computational time. The average execution time per run is recorded for each algorithm. This metric is relevant in planning applications because utilities and planners require optimization tools that provide reliable solutions within practical computational times [
15,
41].
Reliability-index improvement. After the optimal vector
is identified, SAIFI, SAIDI, and CAIDI are calculated using (
17)–(
19) and compared with the base-case values obtained without additional sectionalizing devices. The improvement is expressed as a percentage reduction with respect to the original system [
1,
2,
5,
6,
34]. This post-optimization verification confirms the technical relevance of the selected solution and translates the cost-based optimization result into reliability metrics that are directly interpretable by distribution utilities and regulatory agencies.
5. Case Study
The proposed formulation is evaluated using the IEEE 69-bus test system, which is a medium-scale radial distribution feeder widely used as a benchmark in distribution-network optimization studies. This system is suitable for assessing the effect of sectionalizing-device placement because it provides a radial topology with sufficient structural complexity to represent practical feeder behavior, while still allowing the traceability required for verifying the optimization results. In this study, the base case is used as the reference operating condition against which the total expected cost, expected energy not supplied, and reliability indices are compared after installing sectionalizing devices at different candidate branches. The selection of this benchmark also facilitates methodological comparison with previous studies in which the IEEE 69-bus system has been used for optimization, loss-reduction, and radial-network operation analyses [
39,
40]. However, the use of a single benchmark feeder means that the reported results should be interpreted as a controlled benchmark-based evaluation rather than as a universal validation of the method for all distribution systems.
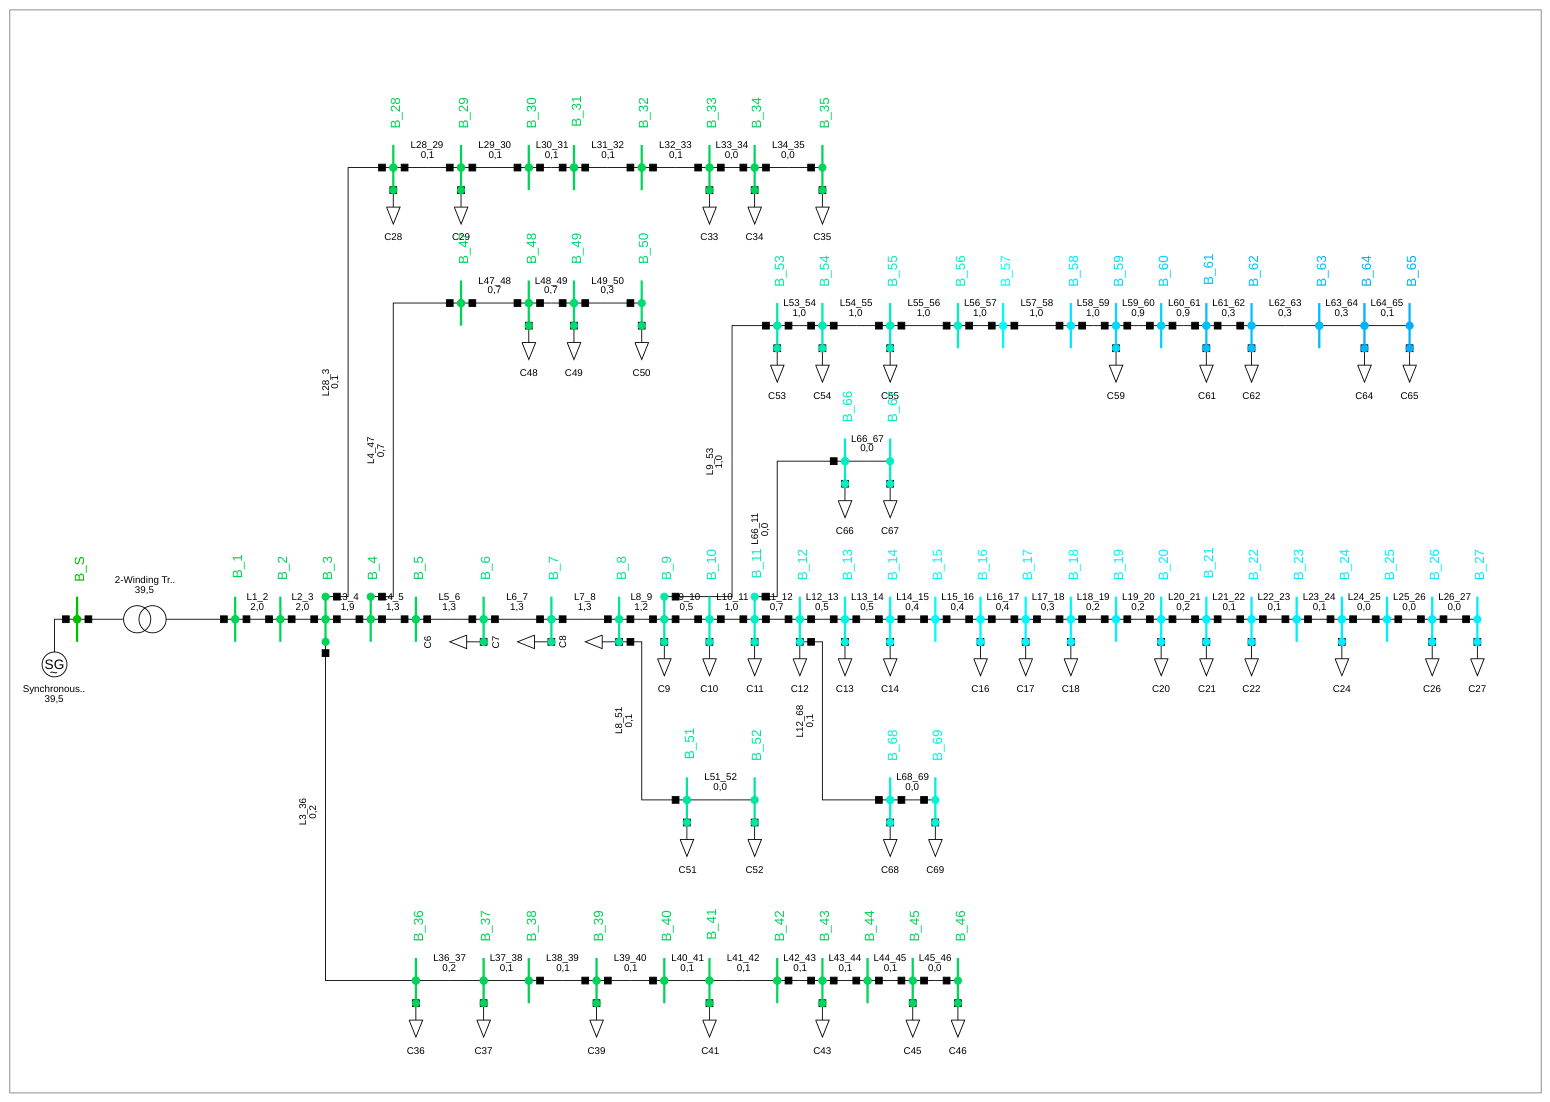
Figure 2 shows the IEEE 69-bus feeder model implemented in DIgSILENT PowerFactory. This model constitutes the electrical and topological basis used to extract the feeder configuration, nodal loads, branch connections, base operating currents, and conductor limits required for evaluating each candidate sectionalizing configuration during the optimization process. The PowerFactory model was used as a verified source of network data, whereas the repeated fitness evaluations of the metaheuristic algorithms were performed in MATLAB using the exported static information.
As shown in
Figure 2, the network preserves a radial configuration supplied through the substation transformer and composed of buses, lines, and loads distributed along the main feeder and several lateral branches. The nomenclature adopted in the PowerFactory model identifies each bus with the prefix B and each line section with the prefix L, for example, L1_2, L2_3, and L9_53. This notation facilitates the correspondence between the graphical feeder representation and the numerical data subsequently processed in MATLAB. Several laterals branch out from the main feeder, including the sections associated with buses 28–35, 36–46, 47–50, 51–52, 53–65, 66–67, and 68–69. Loads are identified with the prefix C and are located at the buses where demand is connected, while the line elements preserve the electrical connection between consecutive buses or between the main feeder and its laterals. This representation is used as the base case for extracting the topology, nodal demands, and conductor operating limits needed to evaluate each candidate solution within the metaheuristic optimization process.
Table 6 summarizes the main input data used in the MATLAB evaluation stage and indicates how each dataset contributes to the reliability and cost calculation.
The reliability and economic parameters adopted for the case study are summarized in
Table 2. These parameters define the fault behavior of the feeder, the restoration assumptions, the economic valuation of unsupplied energy, and the investment limits considered in the optimization model. Together with the topology, branch-length, and load data summarized in
Table 6, these parameters provide the information required to reproduce the reliability and cost evaluation of each candidate sectionalizing configuration.
A uniform annualized sectionalizing-device cost is adopted for all candidate branches because the IEEE 69-bus benchmark does not provide location-dependent installation data such as accessibility, civil-work requirements, terrain conditions, communication infrastructure, or utility-specific labor costs. This assumption allows the optimization process to isolate the effect of electrical location and feeder topology on reliability improvement without introducing site-dependent cost factors that are not available in the benchmark dataset. Therefore, the reported economic results should be interpreted as a standardized planning comparison under homogeneous device-cost assumptions. In practical utility applications, can be replaced by branch-specific annualized costs to reflect installation complexity, accessibility, communication requirements, and maintenance conditions.
The values reported in
Table 2 are consistent with typical ranges used in distribution-system reliability studies. The failure rate of 0.10 failures/km·year is adopted as a representative value for medium-voltage overhead lines, whereas the repair time of 4.0 h and the switching time of 1.0 h are consistent with common operating intervals for manually operated sectionalizing devices [
7]. The value of lost load is set to 3.0 USD/kWh as a representative value for a feeder with a mixed customer composition. Customer interruption-cost models reported in the literature assign differentiated costs depending on customer type and outage duration, ranging from relatively low values for residential users to substantially higher values for industrial customers [
7,
8]. Therefore, the adopted value provides an intermediate reference that avoids biasing the objective function toward a particular customer class. The annualized sectionalizer cost is obtained from a capital cost of 8000 USD distributed through the capital recovery factor, considering a 10% discount rate and a 10-year planning horizon. The maximum number of devices is selected to bound the search space to economically reasonable configurations without predetermining the result, since the optimal solution is located below this limit. The annual budget is defined to restrict oversized configurations while still allowing technically relevant candidate solutions to be explored [
7,
8].
The reliability performance of the system under its initial operating condition, without additional sectionalizing devices, is summarized in
Table 7. This base case represents the feeder operating only with the upstream protection device at the head of the feeder and provides the reference values used to quantify the improvement achieved by the optimized sectionalizing configurations.
The values in
Table 7 establish the initial reliability condition of the IEEE 69-bus feeder before the installation of additional sectionalizing devices. Since the base case considers only the feeder-head interrupting device, faults occurring along the radial feeder may interrupt all downstream customers until the faulted section is isolated and the service restoration process is completed. Consequently, these initial values define the benchmark against which each optimized configuration is evaluated. The reduction in EENS and
, together with the variation of SAIFI, SAIDI, and CAIDI, provides the quantitative basis for assessing the technical and economic benefit of the sectionalizing-device placement obtained by AO, GWO, and GA-PSO.
6. Results and Discussion
The analysis starts from the base case of the IEEE 69-bus feeder operating only with the feeder-head interrupting device and without additional sectionalizing devices. Under this initial condition, the system presents a SAIFI of 6.80 interruptions/customer·year, a SAIDI of 27.20 h/customer·year, and a CAIDI of 4.00 h/interruption. The expected energy not supplied is 43,383 kWh/year. When this unsupplied energy is monetized using the adopted value of lost load, the base case produces an annual interruption cost of 130,150 USD/year. These values constitute the reference condition against which the technical and economic improvements achieved by each optimization algorithm are evaluated.
Starting from this benchmark condition, the three optimization algorithms considered in this study, namely AO, GWO, and GA-PSO, were applied under the same experimental protocol: 30 individuals, 200 iterations, and 30 independent runs. In all cases, the best configurations were obtained with eight sectionalizing devices. Therefore, the number of installed devices was not imposed as the final value of the solution, but emerged from the trade-off between the annualized installation cost and the economic benefit produced by the reduction in expected energy not supplied.
6.1. Aquila Optimizer Results
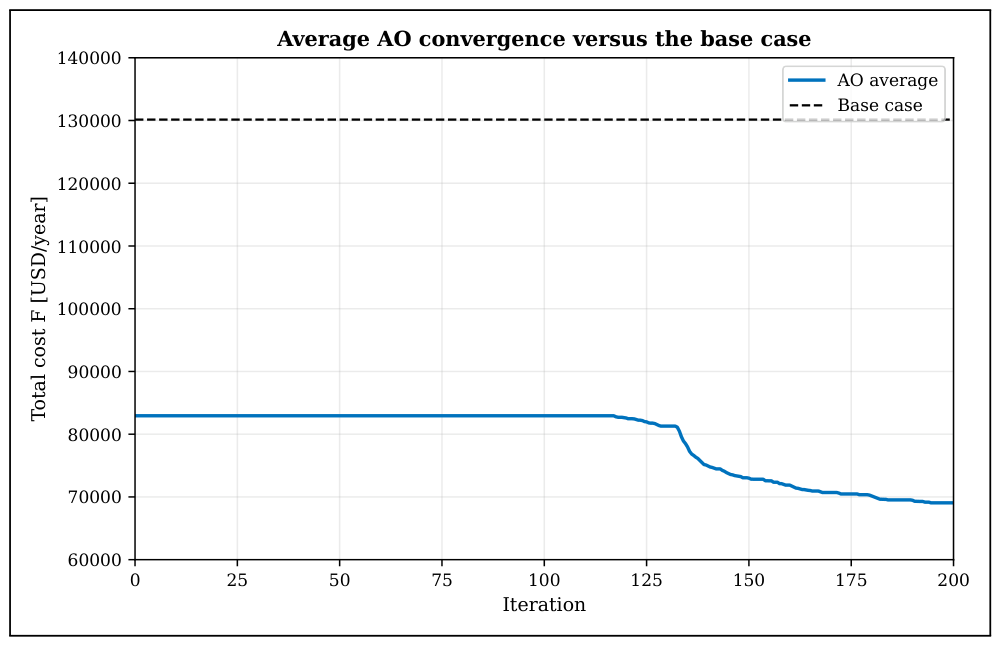
The convergence behavior of the Aquila Optimizer is shown in
Figure 3. This curve reports the evolution of the best objective-function value during the iterative search and allows the stabilization pattern of AO to be examined.
The optimal configuration obtained with AO places the sectionalizing devices on branches L3_36, L4_47, L5_6, L8_51, L9_10, L9_53, L13_14, and L28_3. Several of these locations correspond to the beginning of lateral feeders, such as L3_36 and L4_47, which provide access to the laterals associated with buses 36–46 and 47–50, respectively. Other selected locations are placed along the main feeder upstream of load concentration areas. This spatial distribution is consistent with the operating principle of sectionalizing devices: when installed at lateral-head sections or strategically along the main feeder, they allow the faulted portion of the network to be isolated and reduce the time during which healthy downstream sections remain interrupted.
Table 8 summarizes the reliability and cost improvements achieved by the AO configuration with respect to the base case. The table compares the initial values with the optimized AO results and reports the corresponding percentage improvement.
As shown in
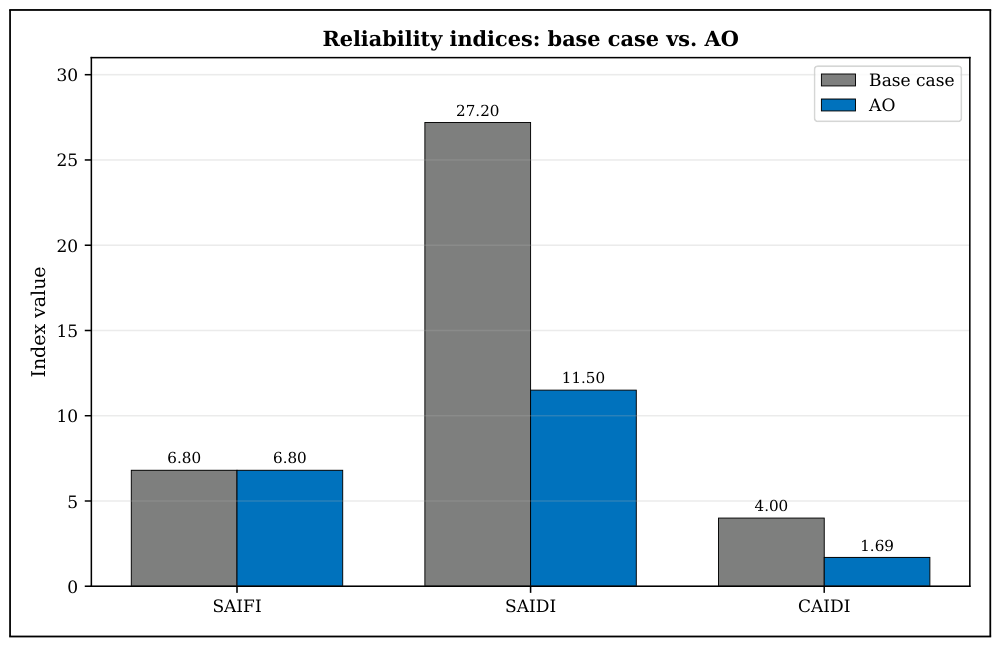
Table 8, the AO solution substantially improves the reliability performance of the feeder. SAIDI decreases from 27.20 to 11.50 h/customer·year, which corresponds to a reduction of 57.7%. CAIDI decreases from 4.00 to 1.69 h/interruption, while EENS decreases from 43,383 to 18,342 kWh/year. As a result, the total expected cost is reduced from 130,150 to 65,443 USD/year, corresponding to a reduction of 49.7%. SAIFI remains unchanged at 6.80 interruptions/customer·year because the considered feeder operates as a strictly radial system without load-transfer paths, automatic feeder reconfiguration, or alternative restoration routes. Under this operating assumption, sectionalizing devices mainly affect the duration of interruptions by accelerating isolation and restoration actions in healthy feeder sections, but they do not modify the branch-failure frequency or create alternative supply paths capable of reducing the number of interruptions experienced by customers. Since SAIFI remains constant, the percentage reduction of CAIDI follows the same proportional trend as SAIDI. In automated or reconfigurable feeders, this behavior could differ because switching actions, tie lines, and service-transfer schemes may reduce not only interruption duration but also the number of customers affected by each fault.
The graphical comparison between the base case and the AO solution is presented in
Figure 4. This figure complements the numerical results of
Table 8 by illustrating the reduction obtained in the reliability and cost indicators after the optimized placement of sectionalizing devices.
6.2. Grey Wolf Optimizer Results
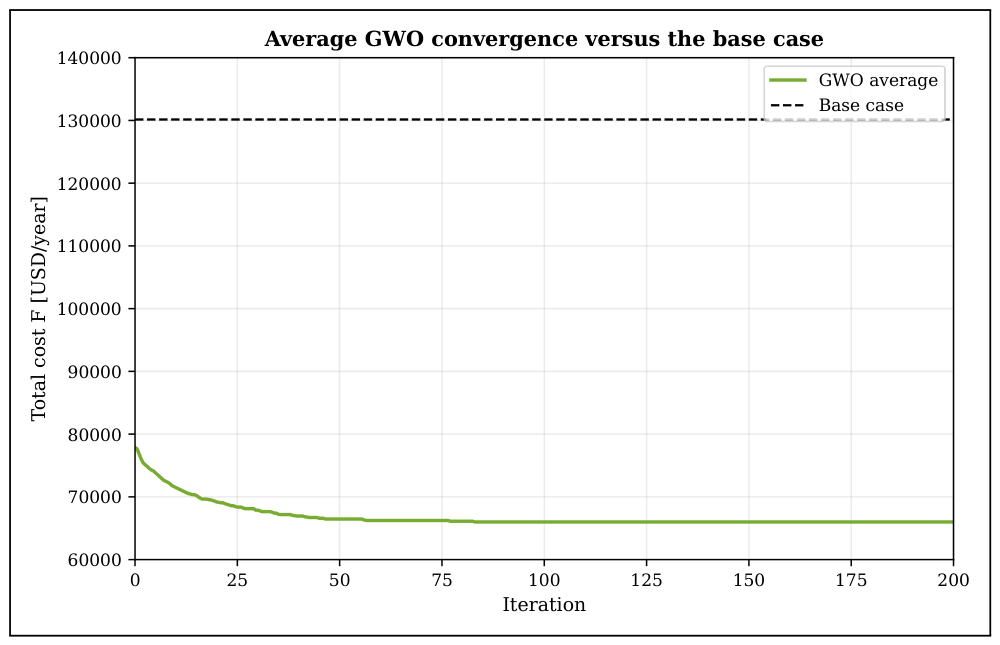
The convergence curve of the Grey Wolf Optimizer is presented in
Figure 5. This curve shows the evolution of the best solution identified by GWO during the optimization process and provides a basis for comparing its convergence behavior with the other algorithms.
The GWO placed the eight sectionalizing devices on branches L3_36, L4_5, L4_47, L8_51, L9_53, L10_11, L12_13, and L28_3. As in the AO solution, the selected locations are concentrated at the heads of lateral feeders and at main-feeder sections upstream of relevant load groups. However, the GWO configuration differs slightly from the AO configuration, indicating the presence of neighboring solutions with very similar cost values around the best identified region of the search space.
The reliability and cost indicators obtained with the GWO configuration are reported in
Table 9. This table compares the base case with the optimized GWO solution and quantifies the corresponding improvement.
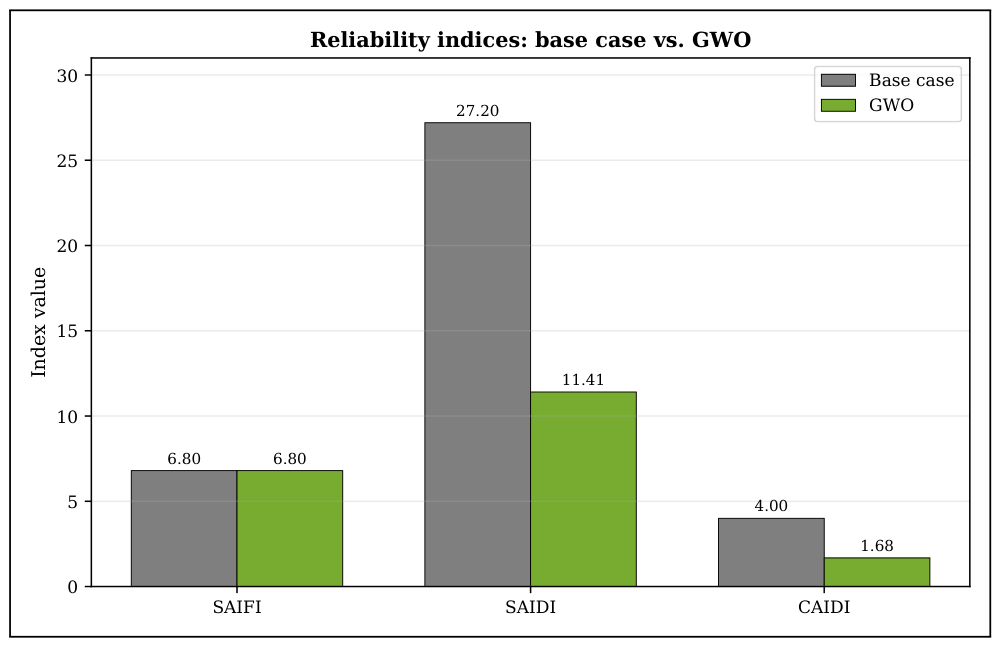
The GWO configuration reduces SAIDI from 27.20 to 11.41 h/customer·year, equivalent to an improvement of 58.1%. EENS decreases from 43,383 to 18,202 kWh/year, and the total expected cost decreases to 65,023 USD/year, which represents a 50.0% reduction with respect to the base case. As with the AO solution, SAIFI remains unchanged at 6.80 interruptions/customer·year because the radial feeder does not include load-transfer paths. Therefore, the sectionalizing devices reduce interruption duration but do not alter the frequency component associated with branch failure occurrence. The best cost reached by GWO is slightly lower than that obtained by AO, namely 65,023 USD/year compared with 65,443 USD/year, which indicates a marginal advantage for GWO in terms of the best objective-function value.
Figure 6 presents the graphical comparison between the base case and the reliability indices obtained with GWO. This figure illustrates the same behavior observed in
Table 9: a substantial reduction in duration-related indicators and interruption cost, with no change in SAIFI.
6.3. Hybrid GA-PSO Results
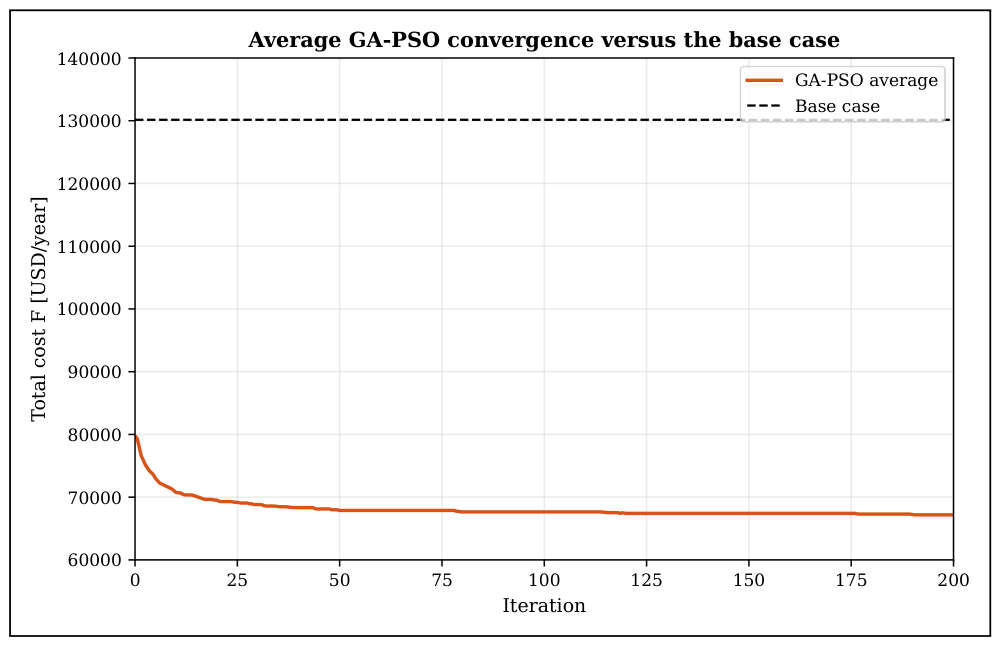
The convergence behavior of the hybrid GA-PSO algorithm is shown in
Figure 7. This curve allows the convergence trajectory of the hybrid strategy to be assessed and compared with those obtained by AO and GWO.
The hybrid GA-PSO algorithm converged to the same best configuration identified by GWO, placing the eight sectionalizing devices on branches L3_36, L4_5, L4_47, L8_51, L9_53, L10_11, L12_13, and L28_3. This result is relevant because two algorithms with different search mechanisms, one based on the social hierarchy of grey wolves and the other on the hybridization of genetic operators with swarm dynamics, independently identified the same best configuration. This coincidence provides strong evidence that the solution is located in the most competitive region of the search space for the proposed formulation.
Table 10 reports the reliability and cost indicators obtained with GA-PSO. Since GA-PSO reached the same best configuration as GWO, the resulting values are identical to those reported for the GWO best solution.
As shown in
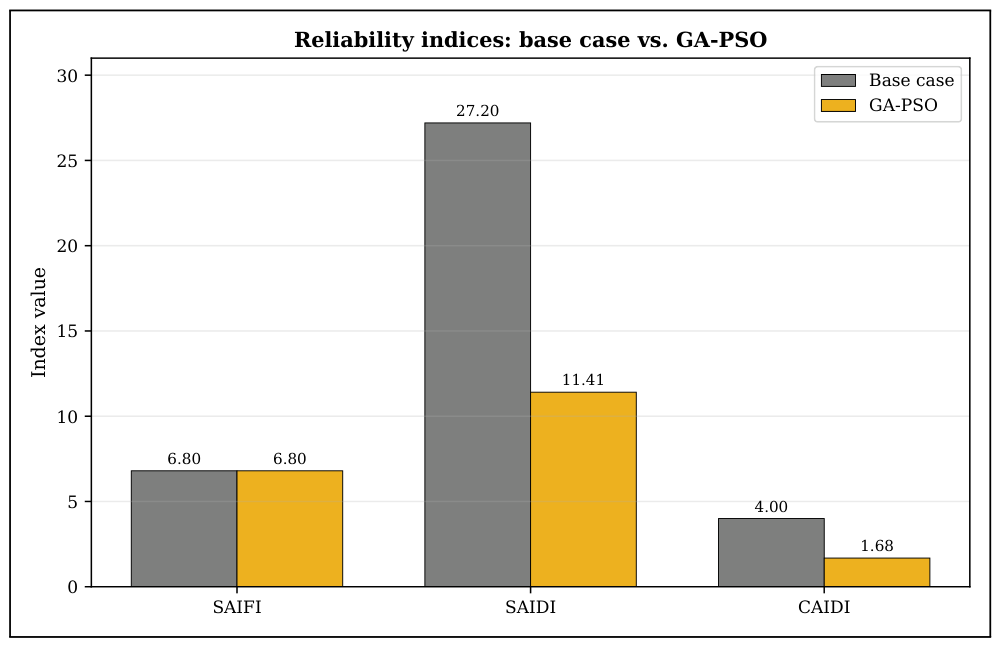
Table 10, the GA-PSO solution produces a SAIDI of 11.41 h/customer·year, corresponding to a 58.1% improvement. EENS decreases to 18,202 kWh/year, and the total expected cost decreases to 65,023 USD/year, equivalent to a 50.0% reduction with respect to the base case. SAIFI remains constant at 6.80 interruptions/customer·year, consistent with the strictly radial operating condition of the feeder. Consequently, the difference between GA-PSO and GWO does not lie in the quality of their best solution, but in their statistical behavior over the 30 independent runs, which is analyzed in the comparative assessment.
Figure 8 illustrates the comparison between the base case and the GA-PSO solution. The figure confirms that the improvement is concentrated in duration-related and cost-related indicators, while the interruption frequency remains unchanged.
6.4. Comparative Assessment of the Algorithms
After evaluating the three algorithms individually, a comparative analysis was performed to examine their convergence behavior, robustness, computational effort, and cost performance across the 30 independent runs.
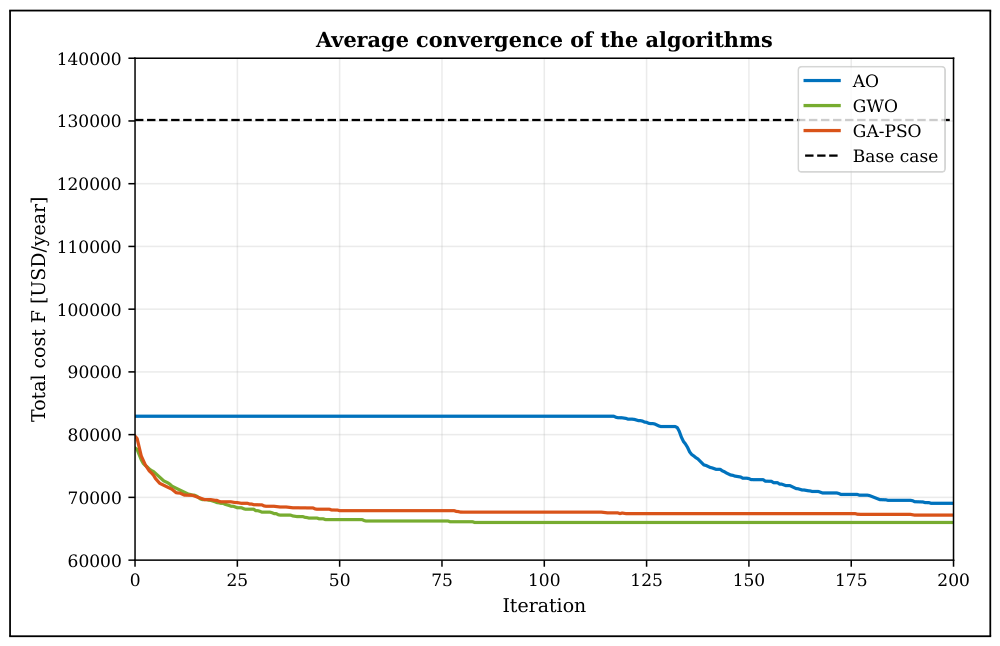
Figure 9 superimposes the average convergence curves of AO, GWO, and GA-PSO, allowing their stabilization patterns and relative convergence speeds to be compared.
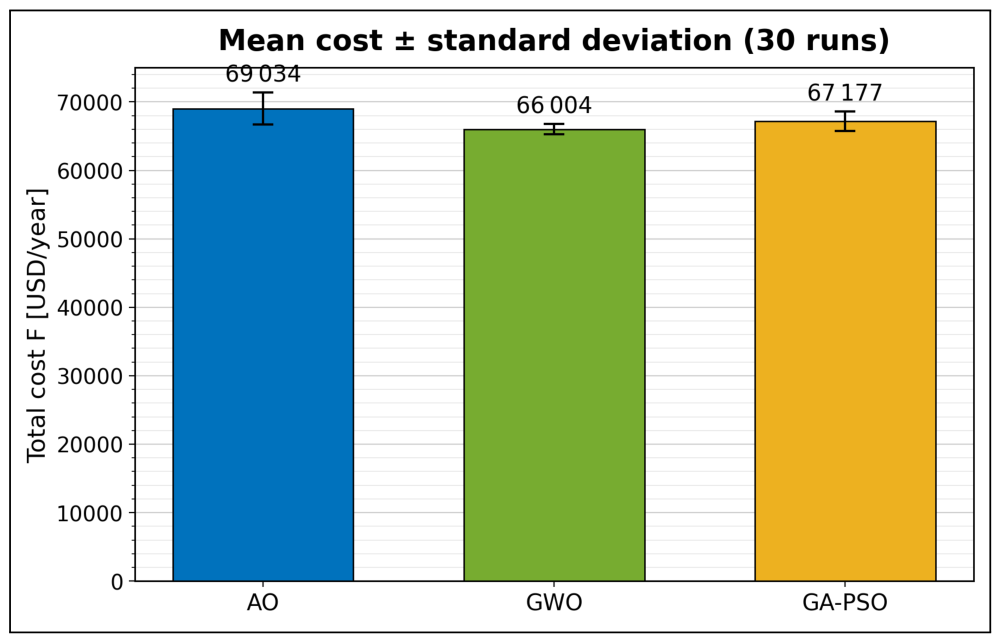
Figure 10 compares the mean cost and standard deviation obtained by each algorithm over the 30 independent runs. This comparison provides a direct graphical interpretation of robustness, since a lower dispersion indicates that the algorithm reaches similar solution quality across repeated stochastic executions.
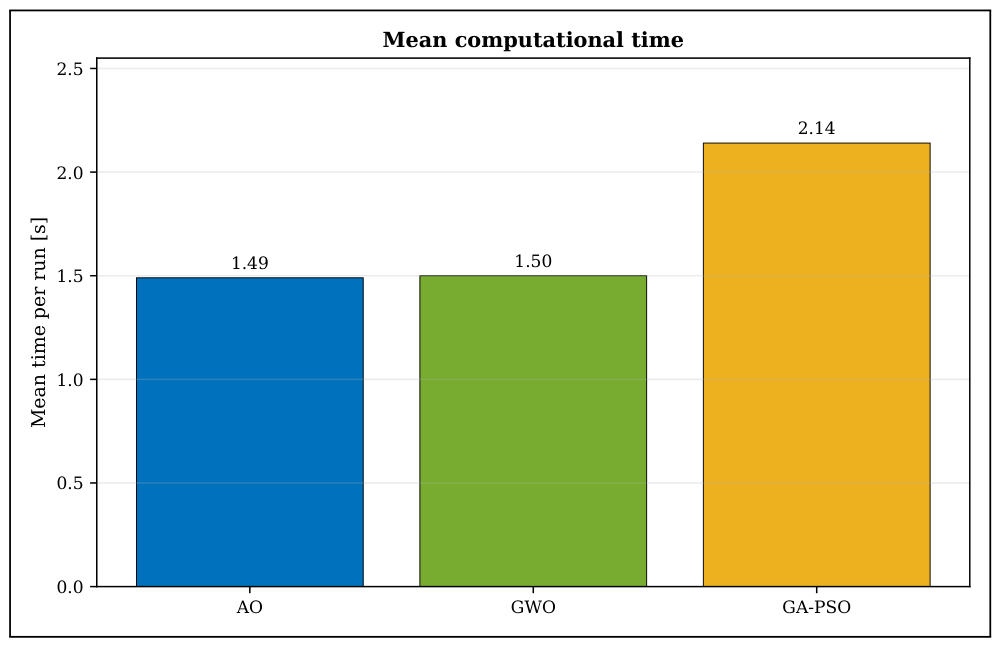
The mean computational time per run is compared in
Figure 11. This metric is relevant because optimization tools for distribution-planning applications must provide high-quality solutions within practical computation times.
Because the full search space contains possible configurations, the comparative analysis is based on the best configurations identified by the stochastic algorithms under the adopted computational protocol. Therefore, the term “best” in the following discussion refers to the best solution found among the 30 independent runs of each algorithm, not to a certified global optimum obtained by exhaustive enumeration.
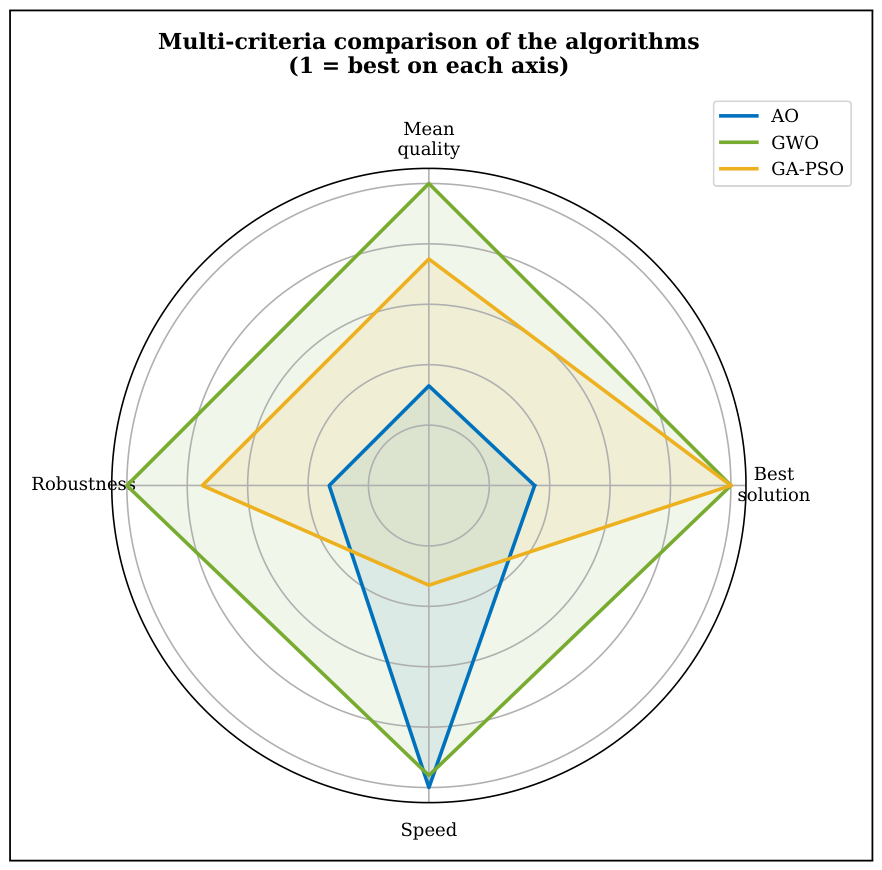
The comparative results show that the three algorithms achieved solutions of equivalent quality in their best runs, with best total costs around 65,000 USD/year. This confirms that the proposed optimization problem has a robust best-performing region that can be reached by different metaheuristic search mechanisms. Nevertheless, relevant differences were observed in statistical performance across the 30 independent runs. GWO achieved the best overall behavior: it reached the lowest best cost, equal to 65,023 USD/year, the lowest mean cost, equal to 66,004 USD/year, and the lowest dispersion among runs, with a standard deviation of 760 USD. These results identify GWO as the most robust and consistent algorithm among the three tested methods. GA-PSO reached the same best solution as GWO but showed higher variability, with a standard deviation of 1389 USD. AO obtained a solution very close to the best identified configuration, with a best cost of 65,443 USD/year, but it presented the highest dispersion, with a standard deviation of 2314 USD. In terms of computational time, AO and GWO showed very similar average execution times, equal to 1.49 s and 1.50 s per run, respectively, whereas GA-PSO required 2.14 s per run.
The statistical cost performance of the three algorithms over the 30 independent runs is summarized in
Table 11. This table reports the best, mean, and worst objective-function values obtained by each method.
Table 11 confirms that GWO provides the most consistent cost performance. Although GA-PSO reaches the same best objective value as GWO, its mean and worst costs are higher, indicating a larger dispersion across independent runs. AO reaches a competitive best solution but exhibits the largest difference between its best and worst values, which reflects lower robustness under the adopted stochastic settings. The coefficient of variation reinforces this interpretation: GWO presents the lowest relative dispersion with
, followed by GA-PSO with
, whereas AO presents the highest relative dispersion with
. The 95% confidence intervals of the mean cost also separate the three average-performance levels under the reported run dispersion, with GWO showing the lowest interval, GA-PSO an intermediate interval, and AO the highest interval. Therefore, the evidence supports the interpretation that GWO is the most robust method in terms of mean objective-function behavior, while AO should be interpreted mainly as a fast near-optimal alternative rather than as the statistically most consistent optimizer.
Table 12 complements the cost comparison by reporting the standard deviation, mean computational time, and number of installed sectionalizing devices for each algorithm.
The results in
Table 12 show that all three algorithms selected eight sectionalizing devices in their best configurations, reinforcing that this number provides the best balance between interruption-cost reduction and investment cost under the adopted assumptions. GWO has the lowest standard deviation and coefficient of variation, which confirms its superior robustness. AO and GWO have nearly identical mean computational times, differing by only 0.01 s per run under the MATLAB-based evaluation. Therefore, the small time advantage of AO over GWO should not be overemphasized from a practical planning perspective. GA-PSO requires a longer mean computational time but remains competitive because it reaches the same best solution as GWO and exhibits intermediate dispersion.
The reported computational times should be interpreted together with the evaluation budget discussed in
Section 4.13. Each run uses approximately 6000 candidate-solution evaluations, and the reported mean times correspond to the MATLAB-based reliability and cost evaluator applied to the IEEE 69-bus benchmark. Therefore, the results demonstrate that the proposed implementation is computationally tractable for the analyzed medium-scale feeder. However, larger feeders, larger candidate sets, or more detailed operational models involving reconfiguration, automated switching, or repeated power-flow calculations would increase the computational burden and may require parallelization or additional screening of candidate locations.
From a methodological perspective, this comparative behavior is relevant because it shows that the planning value of a metaheuristic cannot be inferred only from the best objective-function value. In the present problem, the best identified configuration can be reached by more than one algorithm, but the algorithms differ in robustness, convergence trajectory, and execution time. Therefore, the novelty of the comparative analysis lies in characterizing these differentiated performance profiles under the same sectionalizing-device placement formulation and the same computational budget.
These results indicate that economic efficiency and computational efficiency should be coordinated through a two-level decision criterion rather than by selecting the fastest algorithm alone. In the first level, the best and mean objective-function values should be used to identify the configurations that provide the greatest economic benefit in terms of total expected cost. In the second level, computational time and dispersion across independent runs should be used to assess whether the algorithm can provide sufficiently stable solutions within the available planning time. Under this interpretation, GWO is preferable when the main planning criteria are robustness and minimum expected cost, whereas AO is attractive for rapid screening of candidate configurations because it provides near-optimal cost values with the shortest execution time. Therefore, AO should be interpreted as a computationally efficient alternative for preliminary or repeated planning analyses, while the final investment decision should consider the combined evidence of cost, robustness, and execution time.
The convergence behavior shown in
Figure 9 supports this interpretation. GWO and GA-PSO decrease rapidly during the first iterations and stabilize around iteration 40. AO, by contrast, maintains its best value with nearly no changes during a large portion of the exploratory stage and reduces the objective function more noticeably after approximately iteration 130. This behavior is consistent with the structure of AO, which allocates the first two-thirds of the iterations to exploration and reserves the final stage for intensive exploitation. Consequently, AO requires a larger number of iterations to approach its final solution, although it ultimately reaches a competitive objective value.
Finally,
Figure 12 presents a comparative radar chart that synthesizes the performance of the three algorithms across the evaluated criteria. This representation provides a compact visualization of the trade-offs among solution quality, robustness, computational time, and reliability improvement.
Overall, the results demonstrate that the strategic installation of eight sectionalizing devices can reduce the total expected cost by approximately 50% and improve feeder reliability by nearly 58% in terms of SAIDI and EENS. For the proposed problem, GWO provides the most robust overall performance because it combines the best objective-function value with the lowest dispersion across independent runs. AO stands out as the fastest algorithm in terms of mean computational time, while GA-PSO remains highly competitive because it reaches the same best configuration as GWO. Therefore, each algorithm exhibits a differentiated strength: GWO in consistency and robustness, AO in computational speed, and GA-PSO in its ability to reproduce the best identified solution.
6.5. Reliability-Model Assumptions and Operational Interpretation
The reliability improvements reported in this study must be interpreted according to the operational assumptions of the adopted feeder model. The IEEE 69-bus system is considered in its original radial configuration, without normally open tie lines, load-transfer paths, network reconfiguration actions, distributed generation support, or automated restoration schemes. Consequently, sectionalizing devices do not prevent the initial interruption caused by a fault located upstream of a load point. Their contribution is represented through the reduction of the interruption duration assigned to healthy feeder portions after the faulted section is isolated.
This modeling assumption explains why SAIFI remains unchanged in the optimized configurations, while SAIDI, CAIDI, EENS, and the total expected cost are reduced. In a strictly radial feeder, the frequency component of the interruption process is governed mainly by branch failure rates and the radial exposure of each load point. Since the optimized sectionalizing configurations do not modify branch failure rates or create alternative supply paths, the interruption frequency contribution is not significantly altered. In contrast, the duration component is directly affected by the placement of sectionalizing devices because selected healthy portions of the feeder can be restored after switching actions instead of remaining interrupted for the complete repair time.
These conclusions should not be directly extrapolated to automated or reconfigurable distribution networks. In feeders equipped with remotely controlled switches, tie lines, feeder automation, distributed energy resources, or fault-location, isolation, and service-restoration schemes, sectionalizing devices may also reduce the number of customers interrupted by transferring load to alternative supply paths. Under those conditions, SAIFI may change, and the optimization problem would require additional variables representing switching sequences, communication availability, restoration paths, protection coordination, voltage limits, and post-restoration loading conditions. Therefore, the present results are representative of a deterministic radial planning case and provide a benchmark for manual or simplified sectionalizing behavior, while automated and reconfigurable networks require an extended formulation.
6.6. Practical Implementation Considerations
The practical deployment of sectionalizing devices in distribution feeders requires additional considerations beyond the numerical optimization of device locations. Although the proposed formulation identifies candidate branches that provide the greatest reliability and economic benefit under the adopted benchmark assumptions, an actual utility implementation must also consider field accessibility, installation feasibility, protection coordination, crew-operation procedures, maintenance requirements, and the availability of communication infrastructure.
For manually operated sectionalizing devices, the reliability benefit depends strongly on crew dispatch time, field accessibility, switching procedures, and the ability of operators to identify and isolate the faulted section safely. In this case, the restoration improvement is mainly associated with reducing the portion of the feeder that remains interrupted during repair. For remotely controlled sectionalizing devices, additional benefits may be obtained by reducing switching time and enabling faster isolation and restoration actions. However, these benefits require reliable communication channels, supervisory control and data acquisition integration, cybersecurity provisions, auxiliary power supply, remote-control hardware, and periodic testing of automation functions.
Maintenance and utility deployment constraints can also affect the final placement decision. Locations with difficult access, exposure to environmental stress, high installation complexity, or limited communication coverage may increase the effective annualized cost of the device. Similarly, protection settings and coordination with upstream reclosers, fuses, and feeder breakers must be reviewed before field deployment to avoid undesired miscoordination during fault isolation. Therefore, the optimized locations reported in this benchmark study should be interpreted as technically and economically attractive planning candidates. A final utility deployment would require a field-engineering assessment that incorporates location-dependent costs, communication feasibility, maintenance planning, safety requirements, and protection-coordination verification.
6.7. Economic-Sensitivity Considerations
The economic performance of sectionalizing-device placement depends directly on the relationship between the annualized device cost
, the unit interruption cost
, and the reduction in expected energy not supplied achieved by each candidate configuration. From the objective function in (
20), installing an additional sectionalizing device is economically justified only if the associated reduction in customer interruption cost is greater than the additional annualized investment cost. Therefore, for a candidate configuration
that differs from
by the installation of one additional device, the marginal condition can be expressed as
Equation (
37) shows that higher interruption-cost values increase the economic attractiveness of additional sectionalizing devices, whereas higher annualized device costs reduce the number of economically justified installations. Under the homogeneous-cost assumption adopted in this benchmark study,
is identical for all candidate branches; therefore, the optimization prioritizes locations according to their ability to reduce EENS and interruption duration. In real utility applications, however, branch-specific costs could modify the optimal placement by penalizing locations with difficult access, higher installation complexity, or additional communication requirements.
The results reported in this study should therefore be interpreted as the best identified solution under the adopted cost ratio between interruption cost and annualized sectionalizing-device cost. The selection of eight devices indicates that, for the parameter set summarized in
Table 2, the marginal reduction in interruption cost remains economically attractive up to that device count, while additional installations are limited by the cost–benefit balance and by the operational and budget constraints. A full parametric sensitivity analysis over
,
, restoration time, and investment budget would provide additional utility-specific insight and is identified as a relevant extension of the present benchmark-based evaluation.
6.8. Scope of Validation and Generality
The numerical results reported in this study are based on the IEEE 69-bus radial distribution feeder and on the reliability and economic parameters adopted for the benchmark case. Therefore, the conclusions should be interpreted within this controlled evaluation scope. The IEEE 69-bus system is useful for methodological assessment because it provides a traceable radial topology, a sufficiently large number of branches and load points, and a widely used reference for comparison in distribution-network optimization studies [
39,
40]. However, feeder size, lateral distribution, customer composition, protection philosophy, restoration practices, interruption costs, and available switching infrastructure may differ significantly across real distribution systems.
For this reason, the present results demonstrate the behavior of AO, GWO, and GA-PSO under a common cost-based sectionalizing-device placement formulation, but they should not be interpreted as proof of universal superiority or general applicability in all radial feeders. Additional benchmark feeders and real utility networks would be required to evaluate scalability, robustness under different topologies, and sensitivity to utility-specific operating practices. The present benchmark-based evaluation is therefore intended to provide a reproducible methodological reference and a technically consistent comparison among the algorithms, while broader validation across other feeders is identified as a necessary extension.
7. Conclusions
This study addressed the optimal placement of sectionalizing devices in radial distribution networks using the Aquila Optimizer and compared its performance with two consolidated metaheuristic approaches, namely the Grey Wolf Optimizer and a hybrid GA-PSO algorithm. The analysis was carried out on the IEEE 69-bus test system under a unified technical and economic formulation that minimizes the total expected cost, defined as the sum of the customer interruption cost and the annualized investment cost of the installed sectionalizing devices. The formulation incorporated candidate-branch eligibility, maximum number of devices, available budget, maximum allowable restoration time, and preservation of the radial operating structure of the feeder.
The IEEE 69-bus feeder was modeled in its radial configuration and used as the reference test system for evaluating the proposed methodology. The base case, corresponding to the feeder operating only with the upstream interrupting device and without additional sectionalizing devices, presented a SAIFI of 6.80 interruptions/customer·year, a SAIDI of 27.20 h/customer·year, a CAIDI of 4.00 h/interruption, an EENS of 43,383 kWh/year, and an annual interruption cost of 130,150 USD/year. These values established a consistent benchmark for quantifying the technical and economic impact of the optimized sectionalizing configurations.
The three algorithms were implemented using the same objective-function evaluator and were executed under identical experimental conditions, with 30 individuals, 200 iterations, and 30 independent runs. This protocol ensured that the comparison was based on equivalent computational budgets and reproducible stochastic conditions. The best solutions obtained by the three methods installed eight sectionalizing devices, indicating that this number emerged from the economic balance between interruption-cost reduction and investment cost rather than from a prescribed final configuration. This result confirms the coherence of the proposed total-cost formulation for identifying economically justified reliability improvements.
The optimized placement of sectionalizing devices produced substantial improvements in the duration-related reliability indices. The best configurations reduced SAIDI from 27.20 to approximately 11.4 h/customer·year, corresponding to an improvement close to 58%. EENS was reduced from 43,383 to approximately 18,200 kWh/year, and the total expected cost decreased from 130,150 USD/year to approximately 65,000 USD/year, representing an economic reduction close to 50% with respect to the base case. CAIDI followed the same reduction trend as SAIDI because SAIFI remained unchanged. This behavior is technically consistent with the analyzed system, since the feeder was modeled as a strictly radial network without load-transfer paths. Under this operating condition, sectionalizing devices reduce the duration of interruptions by accelerating fault isolation and service restoration in healthy sections, but they do not modify the frequency of fault occurrence, which is governed by the branch failure rates.
The comparative assessment showed that the three algorithms reached solutions of similar quality, confirming that the best-performing region of the search space is robust and can be approached through different metaheuristic mechanisms. GWO achieved the best overall statistical performance, with the lowest best cost, the lowest mean cost, and the smallest standard deviation across the 30 independent runs. The hybrid GA-PSO algorithm reached the same best identified configuration as GWO, which reinforces the consistency of that configuration under the adopted comparative protocol, although GA-PSO exhibited higher dispersion and longer computational time. AO reached a very competitive solution with a slightly lower mean computational time than GWO under the adopted MATLAB-based evaluator, but it exhibited greater variability among runs. Therefore, the results indicate differentiated strengths rather than absolute dominance of a single method: GWO provides the highest robustness and consistency, AO offers the greatest computational speed for rapid candidate screening, and GA-PSO confirms its competitiveness by reproducing the best solution found by GWO. From a planning perspective, the coordination between economic efficiency and computational efficiency requires that final device-placement decisions be based on the joint interpretation of total expected cost, dispersion among runs, convergence behavior, and execution time.
From a planning perspective, and under the homogeneous-cost assumptions adopted in the IEEE 69-bus benchmark, the results demonstrate that a moderate and strategically located investment in sectionalizing infrastructure can produce a substantial reduction in interruption costs and a significant improvement in reliability performance for radial distribution feeders. Within the benchmark conditions analyzed, the proposed framework provides a quantitative decision-support tool for distribution utilities because it links investment decisions with expected interruption cost, EENS, and standard reliability indices. The results also show that AO is a viable and competitive alternative for sectionalizing-device placement, particularly when computational speed is a relevant criterion. However, its higher dispersion across independent runs suggests that additional mechanisms may be required to improve its robustness when compared with more consolidated metaheuristic approaches. The conclusions should be interpreted within the deterministic reliability and strictly radial operating assumptions adopted in the study, since extreme-weather-driven outages, load-transfer paths, automatic feeder reconfiguration, remotely controlled restoration schemes, and location-dependent device costs were not explicitly modeled as scenario-dependent variables.
Future Work
Future research should extend the proposed formulation by incorporating remotely controlled sectionalizing devices. Unlike manually operated devices, remotely controlled equipment can reduce switching and restoration times, which may further decrease SAIDI, CAIDI, EENS, and interruption cost. This extension would also make it possible to analyze the economic trade-off between higher investment cost, communication infrastructure requirements, maintenance needs, and additional reliability improvement, particularly in feeders where automation schemes are technically and economically feasible.
Another relevant extension is the inclusion of normally open tie lines, load-transfer alternatives, and network reconfiguration actions. In the present study, the feeder was analyzed as a strictly radial system without transfer paths, which explains why sectionalizing devices reduced interruption duration but did not change SAIFI. Incorporating network reconfiguration and service-transfer schemes would allow the assessment of sectionalizing devices under more flexible operating conditions, where the number of customers affected by each fault may also be reduced. Such an extension would require additional decision variables and constraints to represent switching sequences, communication availability, alternative restoration paths, voltage limits, thermal loading limits, and protection-coordination requirements.
The reliability and economic parameters used in this study were adopted from representative values reported in the literature. Future work should calibrate the model using utility data, including real failure rates, repair times, switching times, customer composition, load profiles, interruption-cost estimates, location-dependent device costs, and available investment budgets. This calibration would improve the practical applicability of the methodology and would allow the proposed framework to be validated under the operating conditions of real distribution systems. In the same direction, the analytical reliability evaluation could be complemented with Monte Carlo simulation to represent the stochastic nature of failures, restoration processes, and load variability in greater detail. A particularly relevant extension would be the incorporation of extreme-weather scenarios through weather-dependent failure rates, storm-dependent restoration times, and probabilistic repair-resource availability. This would allow the placement of sectionalizing devices to be evaluated not only under average operating conditions, but also under high-impact low-probability outage conditions.
Future studies should also perform a full sensitivity analysis of , , restoration time, switching time, and budget limits to quantify how economic and operational assumptions affect the optimal number and location of sectionalizing devices. In addition, future comparative studies should retain and report the complete run-level objective-function vectors to enable non-parametric statistical tests, such as Wilcoxon pairwise comparisons or Friedman ranking tests, when comparing stochastic optimization algorithms. Another relevant extension is the development of an exact MILP/MIP reformulation or an exhaustive-search benchmark for reduced candidate sets, which would make it possible to quantify the optimality gap of the metaheuristic solutions when a certified global optimum is computationally attainable.
The methodology should also be tested on additional benchmark feeders, such as the IEEE 33-bus and IEEE 118-bus distribution systems, as well as on real utility networks. This broader validation would make it possible to evaluate scalability, computational performance, and generality across systems with different sizes, topologies, lateral structures, load distributions, protection schemes, and restoration practices. Such extensions are particularly important because the present study uses a single benchmark feeder and deterministic parameter values; therefore, the conclusions should be interpreted as evidence obtained under controlled benchmark conditions rather than as universal performance guarantees. In addition, the formulation could be extended to the coordinated placement of different protection and switching devices, including reclosers, sectionalizers, fuses, remotely controlled switches, and tie switches, leading to an integrated protection and service-restoration planning framework for automated and reconfigurable distribution networks.
Finally, since AO achieved competitive solution quality with low computational time but showed higher variability across independent runs, future research should explore enhanced or hybrid AO variants aimed at improving convergence stability and robustness. These variants could be compared with other recent metaheuristics under the same cost-based formulation, statistical protocol, and reliability-evaluation framework proposed in this study.