Article

Analysis of the Internal Flow Characteristics and Impeller Strength of the Stay Vane Mixed Flow Chemical Pump


1
College of Water Resources and Intelligent Engineering, China Agricultural University, Beijing 100083, China
2
Centre for Industrial Diagnosis and Fluid Dynamics, Universitat Politècnica de Catalunya, 08028 Barcelona, Spain
3
Dongfang Electric Machinery Co., Ltd., Deyang 610036, China
*
Authors to whom correspondence should be addressed.
Energies 2026, 19(15), 3471; https://doi.org/10.3390/en19153471
Submission received: 18 June 2026 / Revised: 2 July 2026 / Accepted: 22 July 2026 / Published: 23 July 2026

Abstract

To improve the energy conversion performance and long-term structural stability of stay vane mixed-flow chemical pumps used for industrial residual pressure recovery, this paper establishes a coupled numerical framework of computational fluid dynamics (CFD) and finite element structural analysis (FEA). The internal flow evolution, radial hydraulic excitation, transient pressure oscillation and impeller mechanical bearing capacity are systematically investigated under three typical flow states: partial load 0.7 Qd, design condition 1.0 Qd and overload 1.2 Qd. The results show that the flow inside the pump is smooth and there is no obvious backflow or separation under the rated working condition, and the energy conversion efficiency is the best. When operating under partial discharge, boundary layer separation and recirculating secondary vortices easily emerge inside the pump passage, which drastically elevates hydraulic energy dissipation. Meanwhile, operating load exerts a remarkable influence on the impeller’s radial hydraulic load and transient pressure oscillation intensity. The radial force and the pressure pulsation amplitude at the impeller outlet are the largest under the small flow condition, and the force is the most stable under the rated working condition. Blade passing frequency dominates the frequency components of transient pressure fluctuations. The maximum von-Mises stress on the impeller concentrates at the filet where blade roots connect with the hub, and this peak value hits 86.3 MPa under partial-load low-flow operating status. Calculated stress values for all three flow rates satisfy the structural safety criteria. The outcomes of this numerical investigation can offer reliable technical support for hydraulic performance optimization and structural dimension design of this type of mixed-flow chemical pump.

1. Introduction

Under the strategic background of global energy structure transformation and industrial energy conservation and emission reduction, the upgrading of energy recovery and efficient fluid conveying equipment has become the core path for achieving low-carbon development in the fields of chemical engineering, metallurgy, thermal power, and water conservancy [1,2]. In chemical processes, industrial circulating water systems, municipal flood control and drainage, and energy power station supporting systems, a large amount of residual pressure energy in pressurized fluids is not fully utilized. Traditional pump equipment has high energy consumption and low energy utilization rate, which significantly deviates from the development requirements of green, low-carbon, and energy-efficient [3]. Mixed-flow pumps, as key equipment connecting low-pressure conveying and high-pressure energy conversion, possess the advantages of high head of centrifugal pumps and large flow rate of axial-flow pumps, and play an irreplaceable role in fluid conveying and residual pressure energy recovery systems. Their hydraulic performance, operational stability, and structural safety directly determine the energy recovery efficiency and overall economy of the system [4,5].
Equipped with stay vanes, the mixed-flow chemical pump realizes efficient mutual transformation between fluid dynamic and static pressure energy relying on the rotating impeller’s work input and the flow straightening function of stay vanes. It has broad application prospects in scenarios such as industrial residual pressure recovery, energy cascade utilization in circulating water systems, and energy optimization in chemical processes [6,7,8,9]. As the equipment develops towards larger size, higher rotational speed, higher efficiency, and long-term reliable operation, the complex three-dimensional turbulent flow inside the pump, pressure pulsation caused by the dynamic interference between the impeller and the stay vanes, and the structural strength and fatigue safety issues of the impeller under the combined action of centrifugal force and fluid load, have become the key bottlenecks restricting the improvement of energy recovery efficiency and the stable operation of the equipment. Flow separation, secondary flow, vortex structure, and unsteady pressure pulsation will cause local hydraulic losses and reduce the efficiency of energy conversion; blade stress concentration and excessive deformation may lead to structural failure and threaten system safety. Plenty of researchers have carried out in-depth explorations into the internal flow mechanisms inside various pump devices. Ye et al. [10] adopted CFD with a 3D transient dynamic mesh to compare the inner flow of single and double helical pumps. Their work proved the double helical pump boasts better volumetric efficiency and sealing performance. Its outlet flow drops with rising pressure difference, while higher medium viscosity can mitigate such flow reduction. Konishi et al. [11] put forward a novel impeller with radial and annular passages for stable wide-range operation. This design outperforms conventional impellers, delivering identical flow parameters at a lower specific speed. The study also verified that pump head declines monotonically with flow rate, as friction-free hydraulic losses inside the impeller grow linearly with discharge. Cai et al. [12] combined numerical simulations and experimental tests to investigate flow pattern variations in an axial-flow nuclear main pump across various flow rates, uncovering the evolution laws of its internal flow structures. Heng et al. [13] investigated gas–liquid two-phase performance of disk pumps. They captured internal two-phase flow structures via high-speed photography and adopted multiple test methods to characterize the pump’s hydraulic behaviors with visualized flow fields. The results show that at the nominal initial condition, at 1500 revolutions per minute, the disc pump reaches 34% (maximum inlet gas void fraction), and at 2000 revolutions per minute, 49%, while the corresponding pump performance drop point’s IGVFc (critical inlet gas void fraction) is close to 9%.
In recent years, the collaborative simulation technology of CFD and FEA has provided a reliable means for accurately revealing the flow field patterns within pumps, optimizing hydraulic structures, and evaluating structural strength. In the numerical calculation of the flow field, the full-channel simulation based on the Reynolds-averaged N-S equations and the SST kω turbulence model can accurately capture the velocity distribution, pressure characteristics, and dynamic interference effects within the pump, providing theoretical support for reducing hydraulic losses and improving energy recovery efficiency; in the structural strength analysis, the finite element method coupled with the flow field pressure load and centrifugal load, and based on the fourth strength theory (von-Mises stress) to evaluate the stress and deformation of the blades, can ensure the structural safety of the impeller under high-energy conditions. Some scholars have analyzed the strength of the impeller. Chen et al. [14] simulated fatigue crack growth by the extended finite element method (XFEM) coupled with the Walker equation, and validated this method on circular tensile specimens under load ratios R = 0.1, 0.5 and 0.85. They also performed crack propagation calculations at two distinct positions of a vertical centrifugal pump-turbine in turbine mode. This XFEM-based numerical approach can effectively predict crack geometries and component fatigue life. Yan et al. [15] adopted FSI finite element simulations to quantify pipeline vibration induced by fluid pressure oscillation, discussing the influences of internal pressure, pipe length, and clamp layout. Their numerical outcomes reveal that structural displacement rises with fluid pressure, yet the growth rate gradually slows down. Lu et al. [16] numerically investigated unsteady flow behaviors and fluid force effects on the rotor system of a vortex-type mixed-flow circulating pump at 0.8 Qd, 1.0 Qd and 1.2 Qd. Simulated flow fields indicate disordered vortex structures and substantial energy losses under partial loads, whereas overload conditions produce steep velocity gradients inside the impeller and aggravate hydraulic dissipation. Zhang et al. [17] adopted a scale-adaptive hybrid RANS-LES model to analyze the flow behaviors of a propulsion pump. They further put forward an indirect acoustic characterization approach relying on Lamb vector divergence to quantify turbulent noise sources. Validated against acoustic finite element predictions and test data, this novel method proves reliable for quantitatively evaluating turbulence-induced acoustic excitation.
Currently, systematic research on the internal flow mechanism, energy loss characteristics, pressure pulsation control, and rotor structure strength of the stay vane type mixed-flow chemical pump for energy recovery requirements is still relatively lacking. Most existing mixed-flow pump FSI studies focus on water supply pumps, nuclear main pumps and circulation pumps; few systematically target stay vane mixed-flow chemical pumps for industrial residual pressure energy recovery. Previous work only separately analyzed internal flow, pressure pulsation or impeller strength, without coupling three working conditions (0.7/1.0/1.2 Qd) to reveal the correlation between flow separation, radial force pulsation, blade stress concentration and energy recovery efficiency. This paper fills this gap. This paper takes a circular pump chamber stay vane type mixed-flow chemical pump as the research object, focusing on the goal of efficient fluid transportation and energy recovery enhancement. It analyzes the pump’s internal flow characteristics, radial force distribution, and pressure pulsation patterns, reveals the stress and deformation characteristics of the blades, aiming to clarify the energy conversion and fluid–solid coupling mechanism within the pump, and providing theoretical basis and technical reference for the hydraulic optimization, structural improvement, and efficient and reliable application of the stay vane type mixed-flow chemical pump in energy recovery systems.

2. Numerical Simulations

2.1. Governing Equations

Full-flow CFD simulations are performed for the pump with 25 °C clean water as the working medium, which is simplified as a single-phase, incompressible Newtonian fluid for single-flow modeling. The incompressible continuity equation and Reynolds-averaged Navier–Stokes (RANS) equations are solved to capture the internal flow field distribution. The following equations are:
u j x j = 0
ρ u j u i x j = ρ F i p x i + μ e f f x j ( u i x j + u j x i )
In the above formulas, ρ denotes fluid density, μeff refers to the effective fluid viscosity, and p* stands for transformed pressure containing turbulent kinetic energy k.
Solving the fundamental flow equations requires addressing two core problems: the coupling of continuity and momentum equations, as well as the proper selection of turbulence models. The fluid inside the pump is incompressible liquid, and the continuity equation does not contain the pressure term. When solving simultaneously, singularities may occur, and some algorithms applicable to compressible flows cannot be directly applied. Therefore, the incompressible N-S equations mainly address the problem of coupling between velocity and pressure. There are many solutions for the N-S equations, and the most widely used method in the calculation of hydraulic mechanical flow fields is the pressure correction method. If this method predicts the pressure field inaccurately, it will violate the continuity equation. Thus, based on the continuity equation, a pressure correction equation is derived to correct the predicted pressure and velocity fields, and this process repeats until a convergent solution for the pressure field and velocity field is obtained.
Numerical prediction of 3D turbulent flow within pumps generally relies on Reynolds-averaged N-S turbulence theories, which fall into two categories: Reynolds stress models and eddy-viscosity models. Existing literature confirms the standard SST kω model delivers reliable pump performance predictions and enjoys extensive engineering adoption. Accordingly, the SST kω model is adopted herein, with transport equations for turbulent kinetic energy k and specific dissipation rate ω presented below [18]:
( ρ k ) t + ( ρ u i k ) x i = P ρ k 3 / 2 l k w + ( ρ k ) x i ( μ + σ k μ i ) k x i
( ρ ω ) t + ( ρ u i ω ) x i = C ω P β ρ ω 2 + x i ( μ l + σ ω μ t ) ω x i + 2 ( 1 F 1 ) ρ σ ω 2 ω k x i ω x i
In these equations, ρ denotes fluid density, P stands for the turbulence production term, μ is dynamic viscosity, μt represents turbulent eddy viscosity, σ refers to a model constant, Cω is the dissipation coefficient, F1 is the blending function, and lkω denotes the turbulence length scale. The turbulence scale lkω within the term ρk3/2/lkω is defined in Equation (5).
l k ω = k 1 / 2 β k ω
The finite element method is utilized to evaluate the structural strength of the impeller in this work. Displacement-based finite element analysis discretizes the solid domain into multiple interconnected elements sharing discrete nodes. Once the element-level force–displacement relation is derived, matrix assembly techniques can be employed to construct the global structural equilibrium relation for numerical solving. For linear steady structural analysis, inertial and damping effects other than steady acceleration fields are neglected, leading to the following global equilibrium equation:
[K]{u} = {F}
where [K] denotes the stiffness matrix, {u} represents nodal displacement, and {F} is the total nodal external load including gravity, impeller-induced centrifugal force and fluid pressure on FSI interfaces. The pressure load data is extracted from full-passage CFD results of the pump.
By solving, the node displacements {u} are obtained, and thus the stresses {σ} at each node can be calculated:
[σ] = [D] [B]{u}
where [B] is the strain matrix derived from element shape functions, and [D] is the elastic matrix determined by the material elastic modulus and Poisson’s ratio. The equivalent von Mises stress is further calculated following the fourth strength criterion as expressed below:
σ e = 1 2 σ x σ y 2 + σ y σ z 2 + σ z σ x 2 + 6 ( σ x y 2 + σ y z 2 + σ x z 2 )

2.2. Geometric Model and Grid Generation

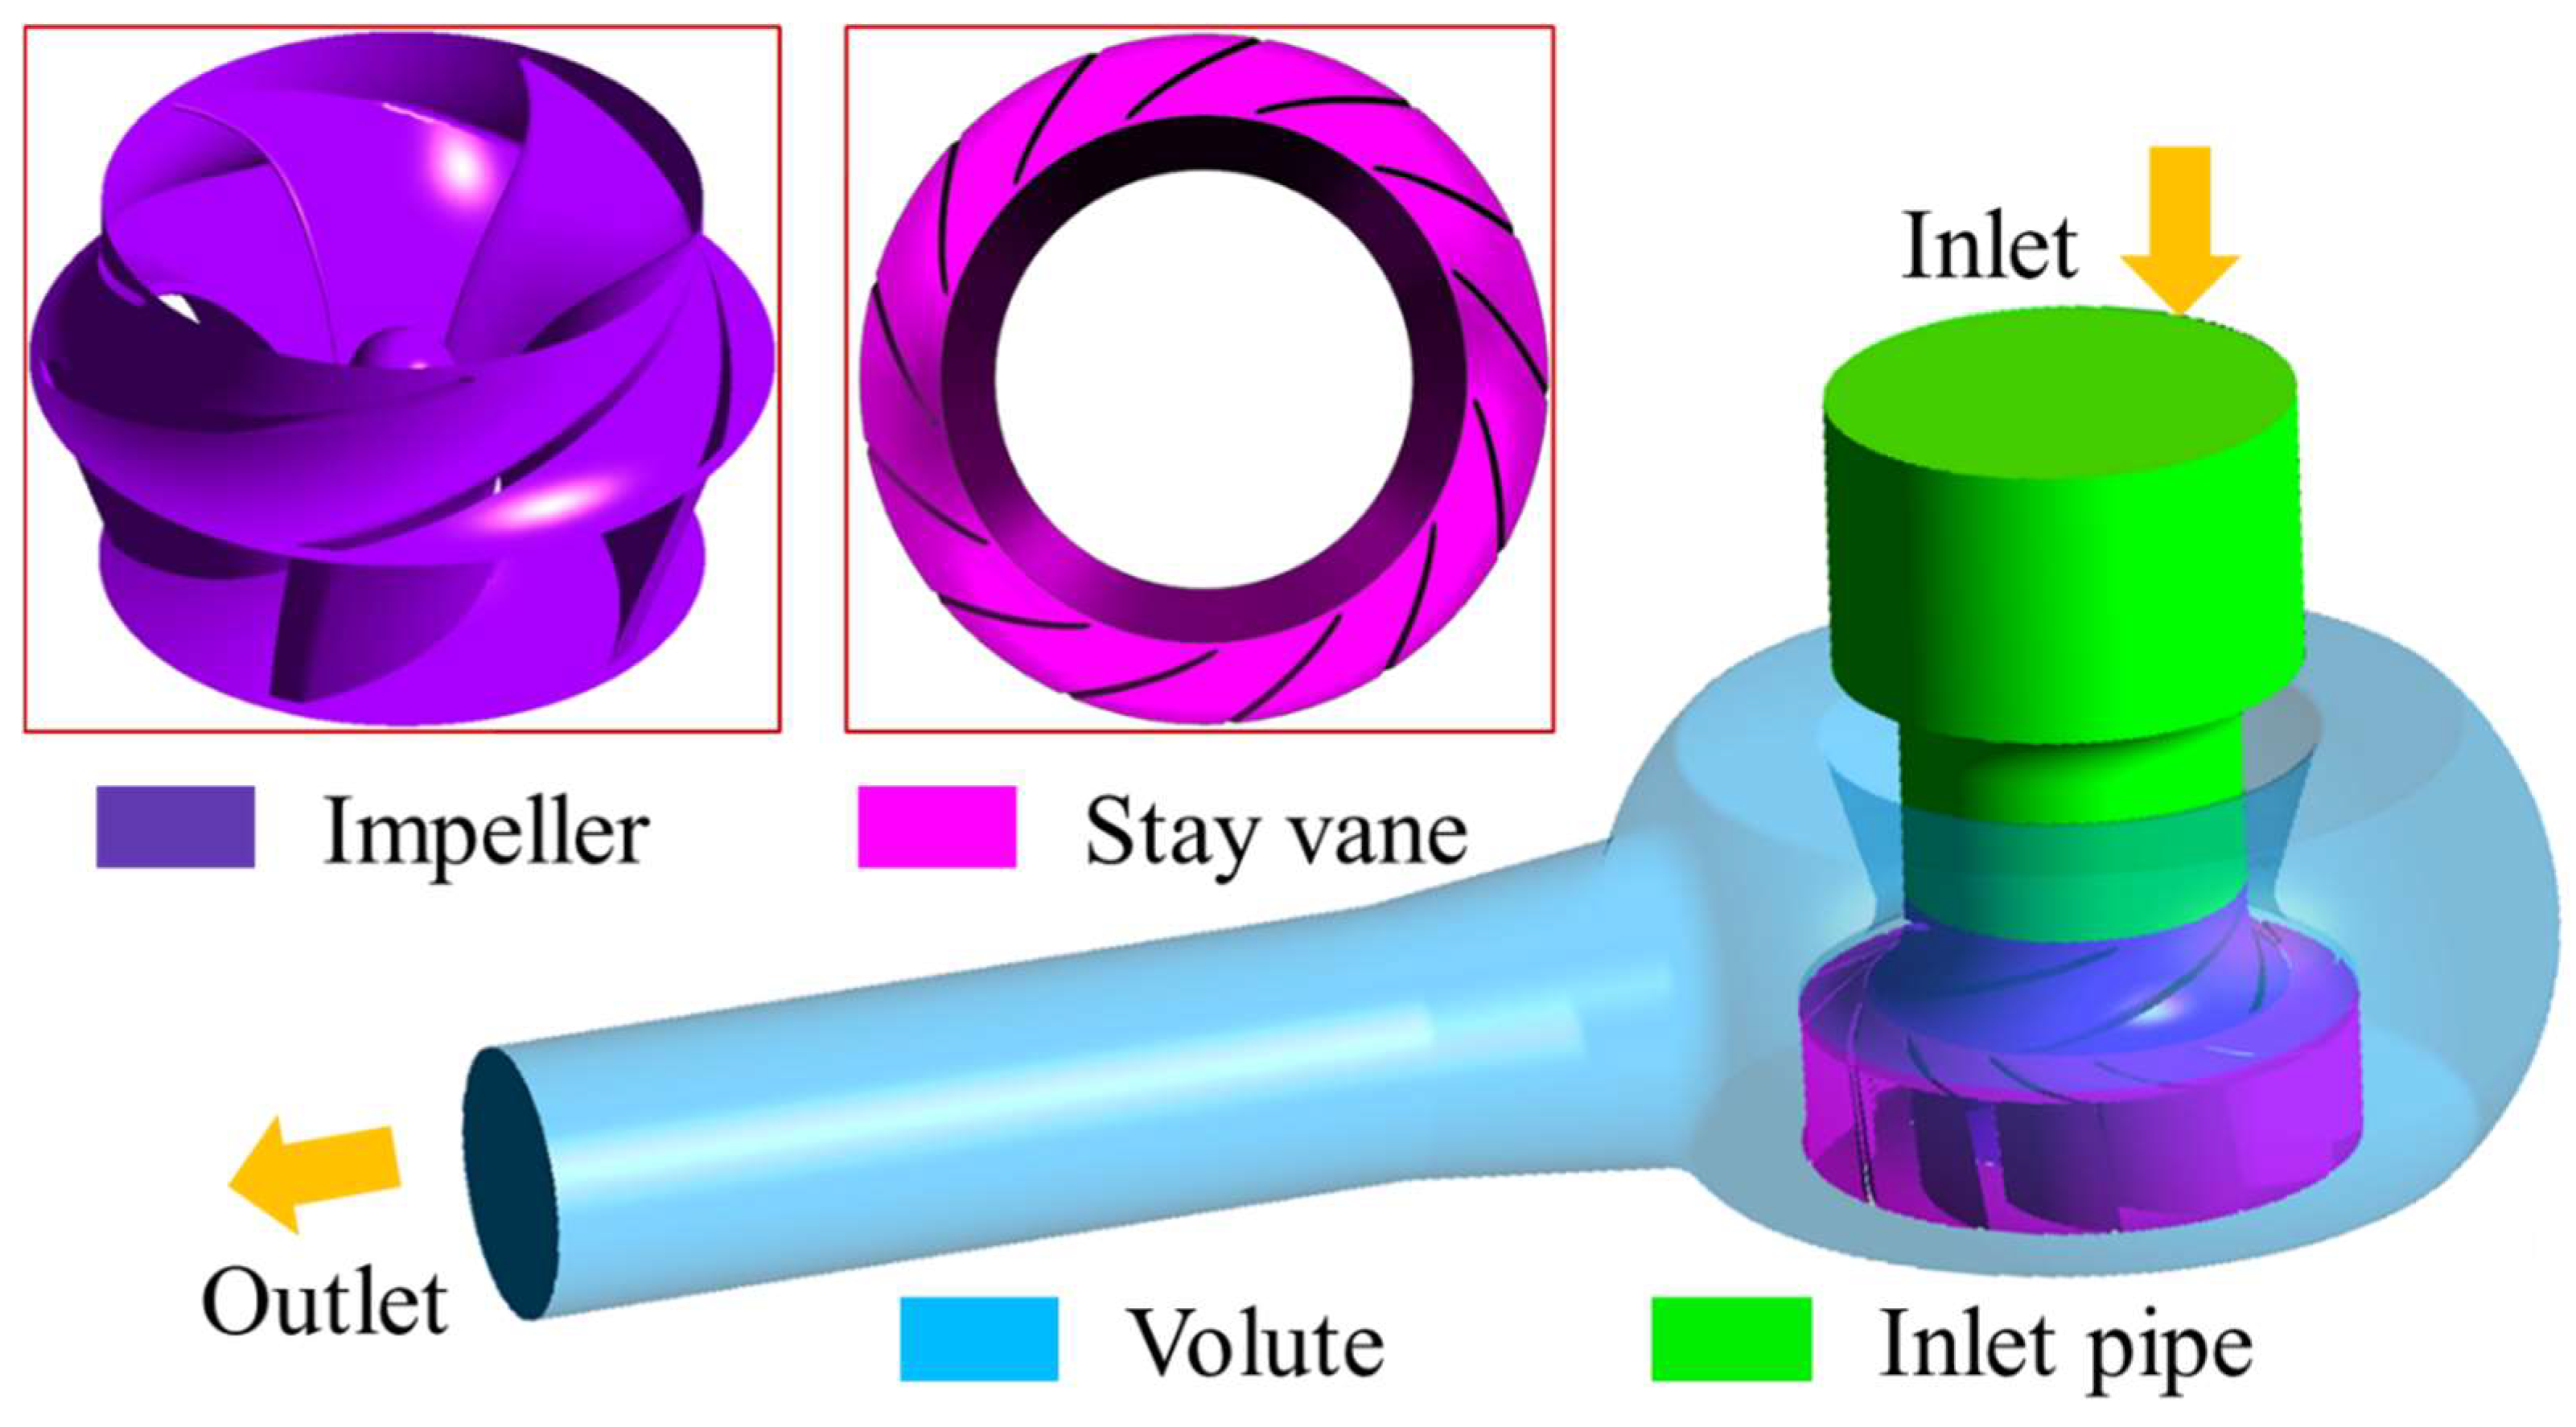
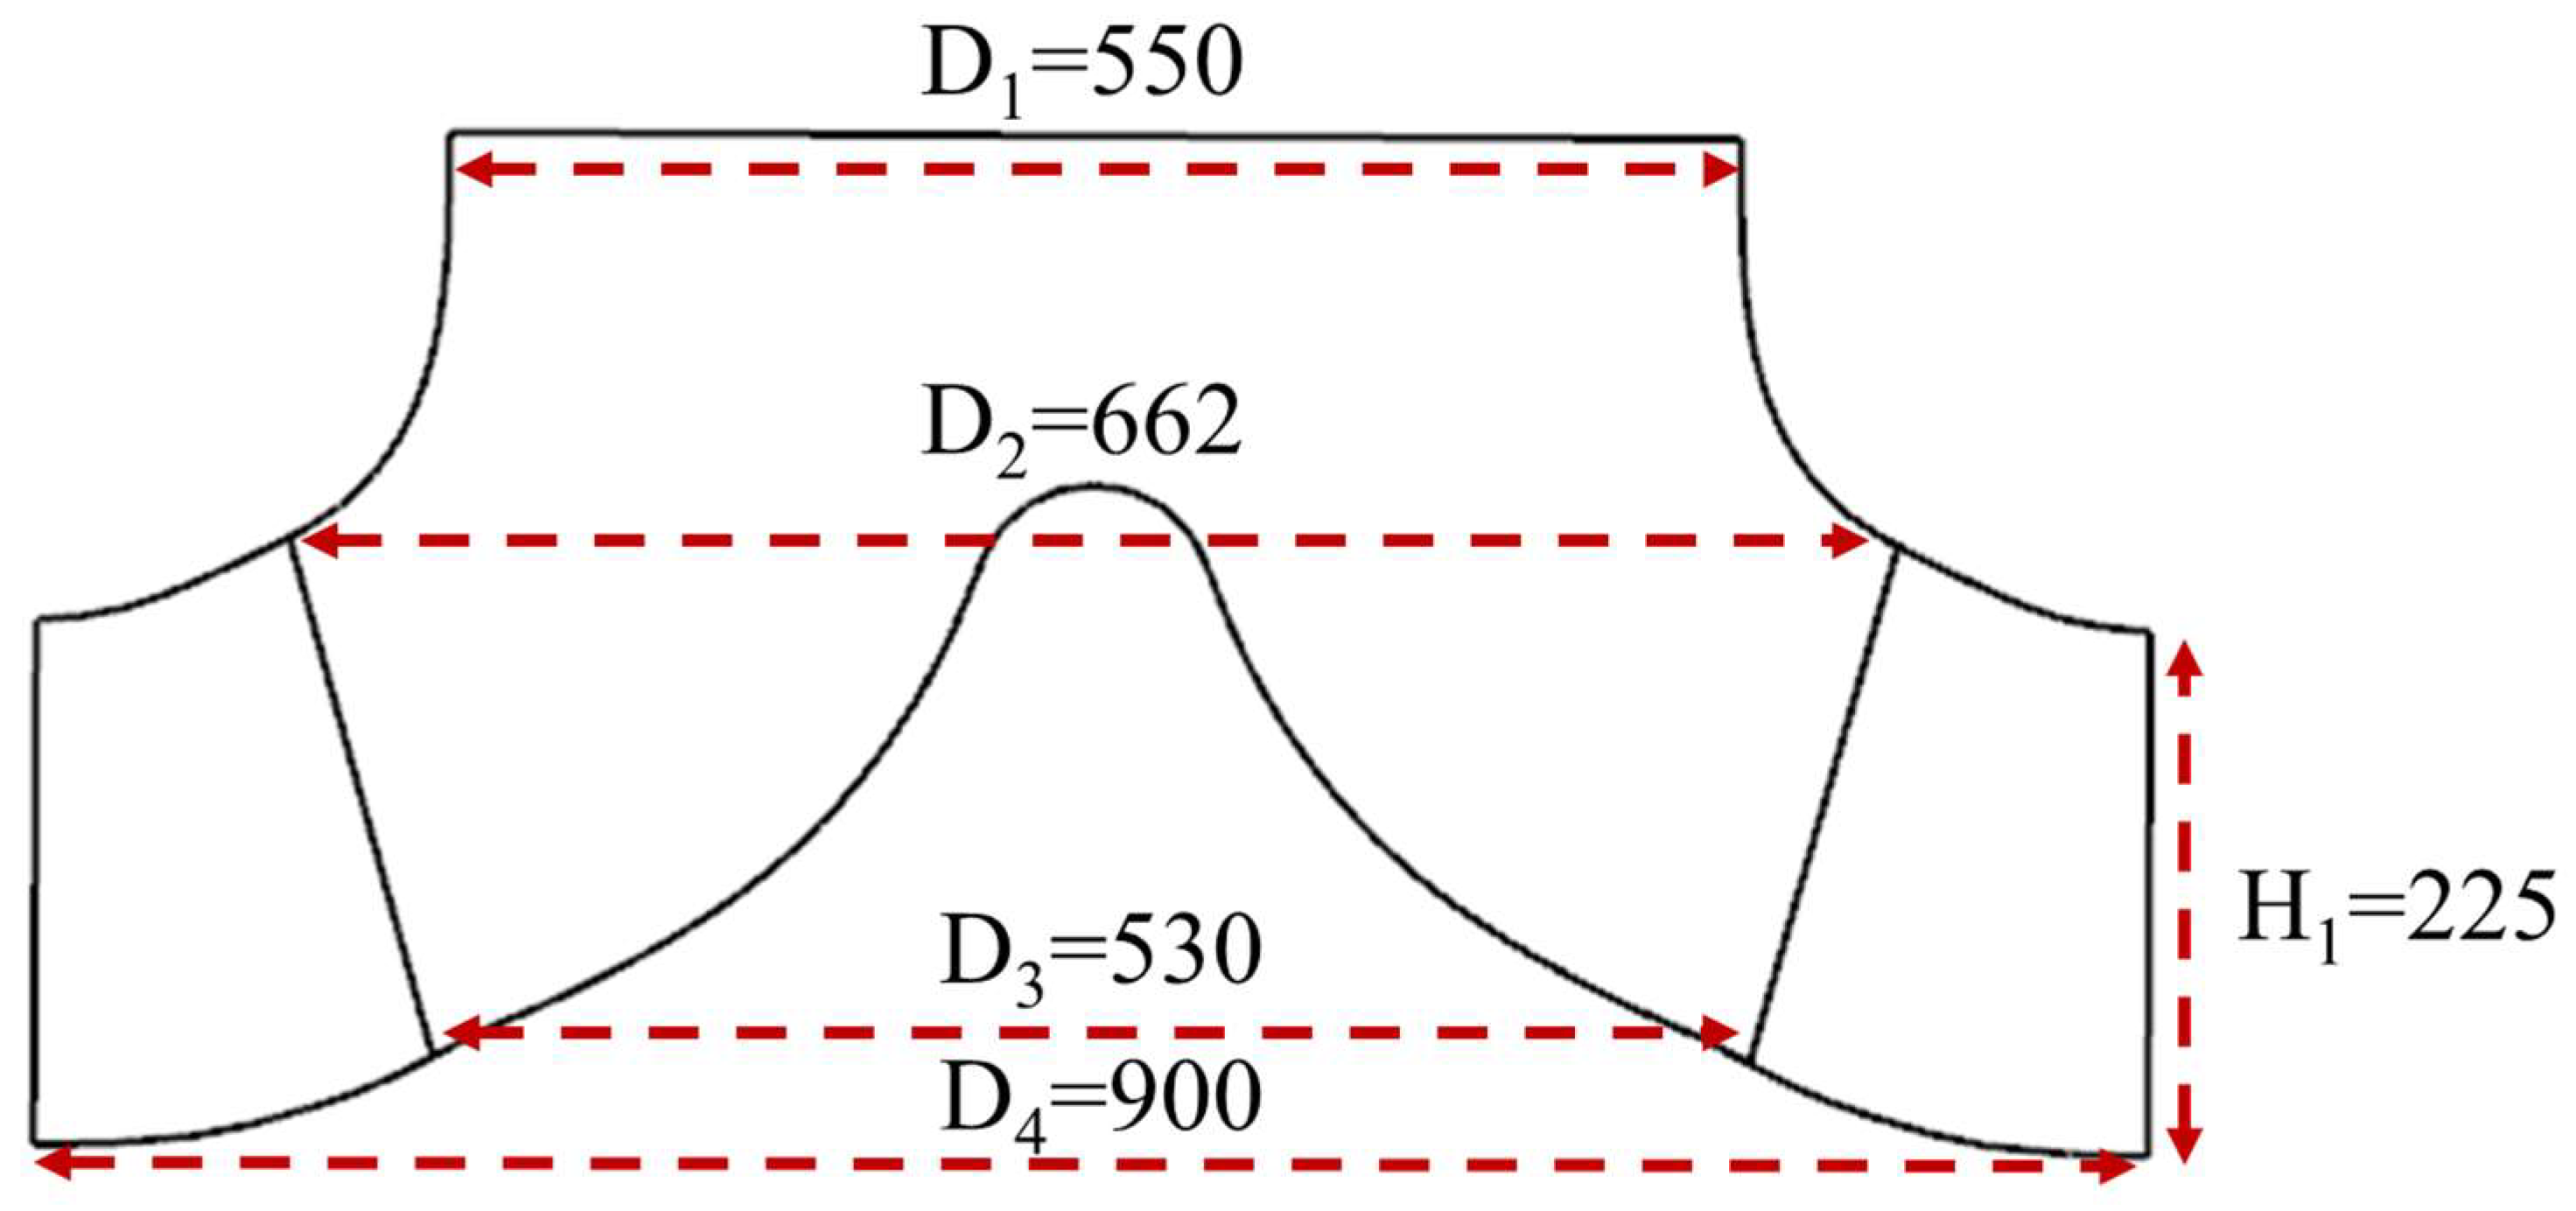
The research object in this paper is a mixed-flow pump with an annular pump chamber. It is widely applied in urban flood control and drainage, as well as circulating water systems for power, water supply, chemical and metallurgical enterprises. The main components of the pump structure include the inlet pipe, impeller, stay vanes, and ring-shaped volute. The detailed three-dimensional model is shown in Figure 1. The inlet diameter of the impeller D1 is 550 mm, the outlet adopts an inclined outlet, the diameter of the outlet close to the rim D2 is 662 mm, the diameter of the outlet close to the hub D3 is 530 mm, and the outlet height of the stay vanes H2 is 225 mm. Specific details can be found in Figure 2. The rated rotational speed of the impeller nr is 1465 rpm, the rated flow rate Qr is 12,000 m3/h, the rated head Hr is 56.3 m, and the rated efficiency is 80%. The number of impeller blades Zimp is 5, and the number of stay vanes Zsv is 13. Detailed information can be found in Table 1.
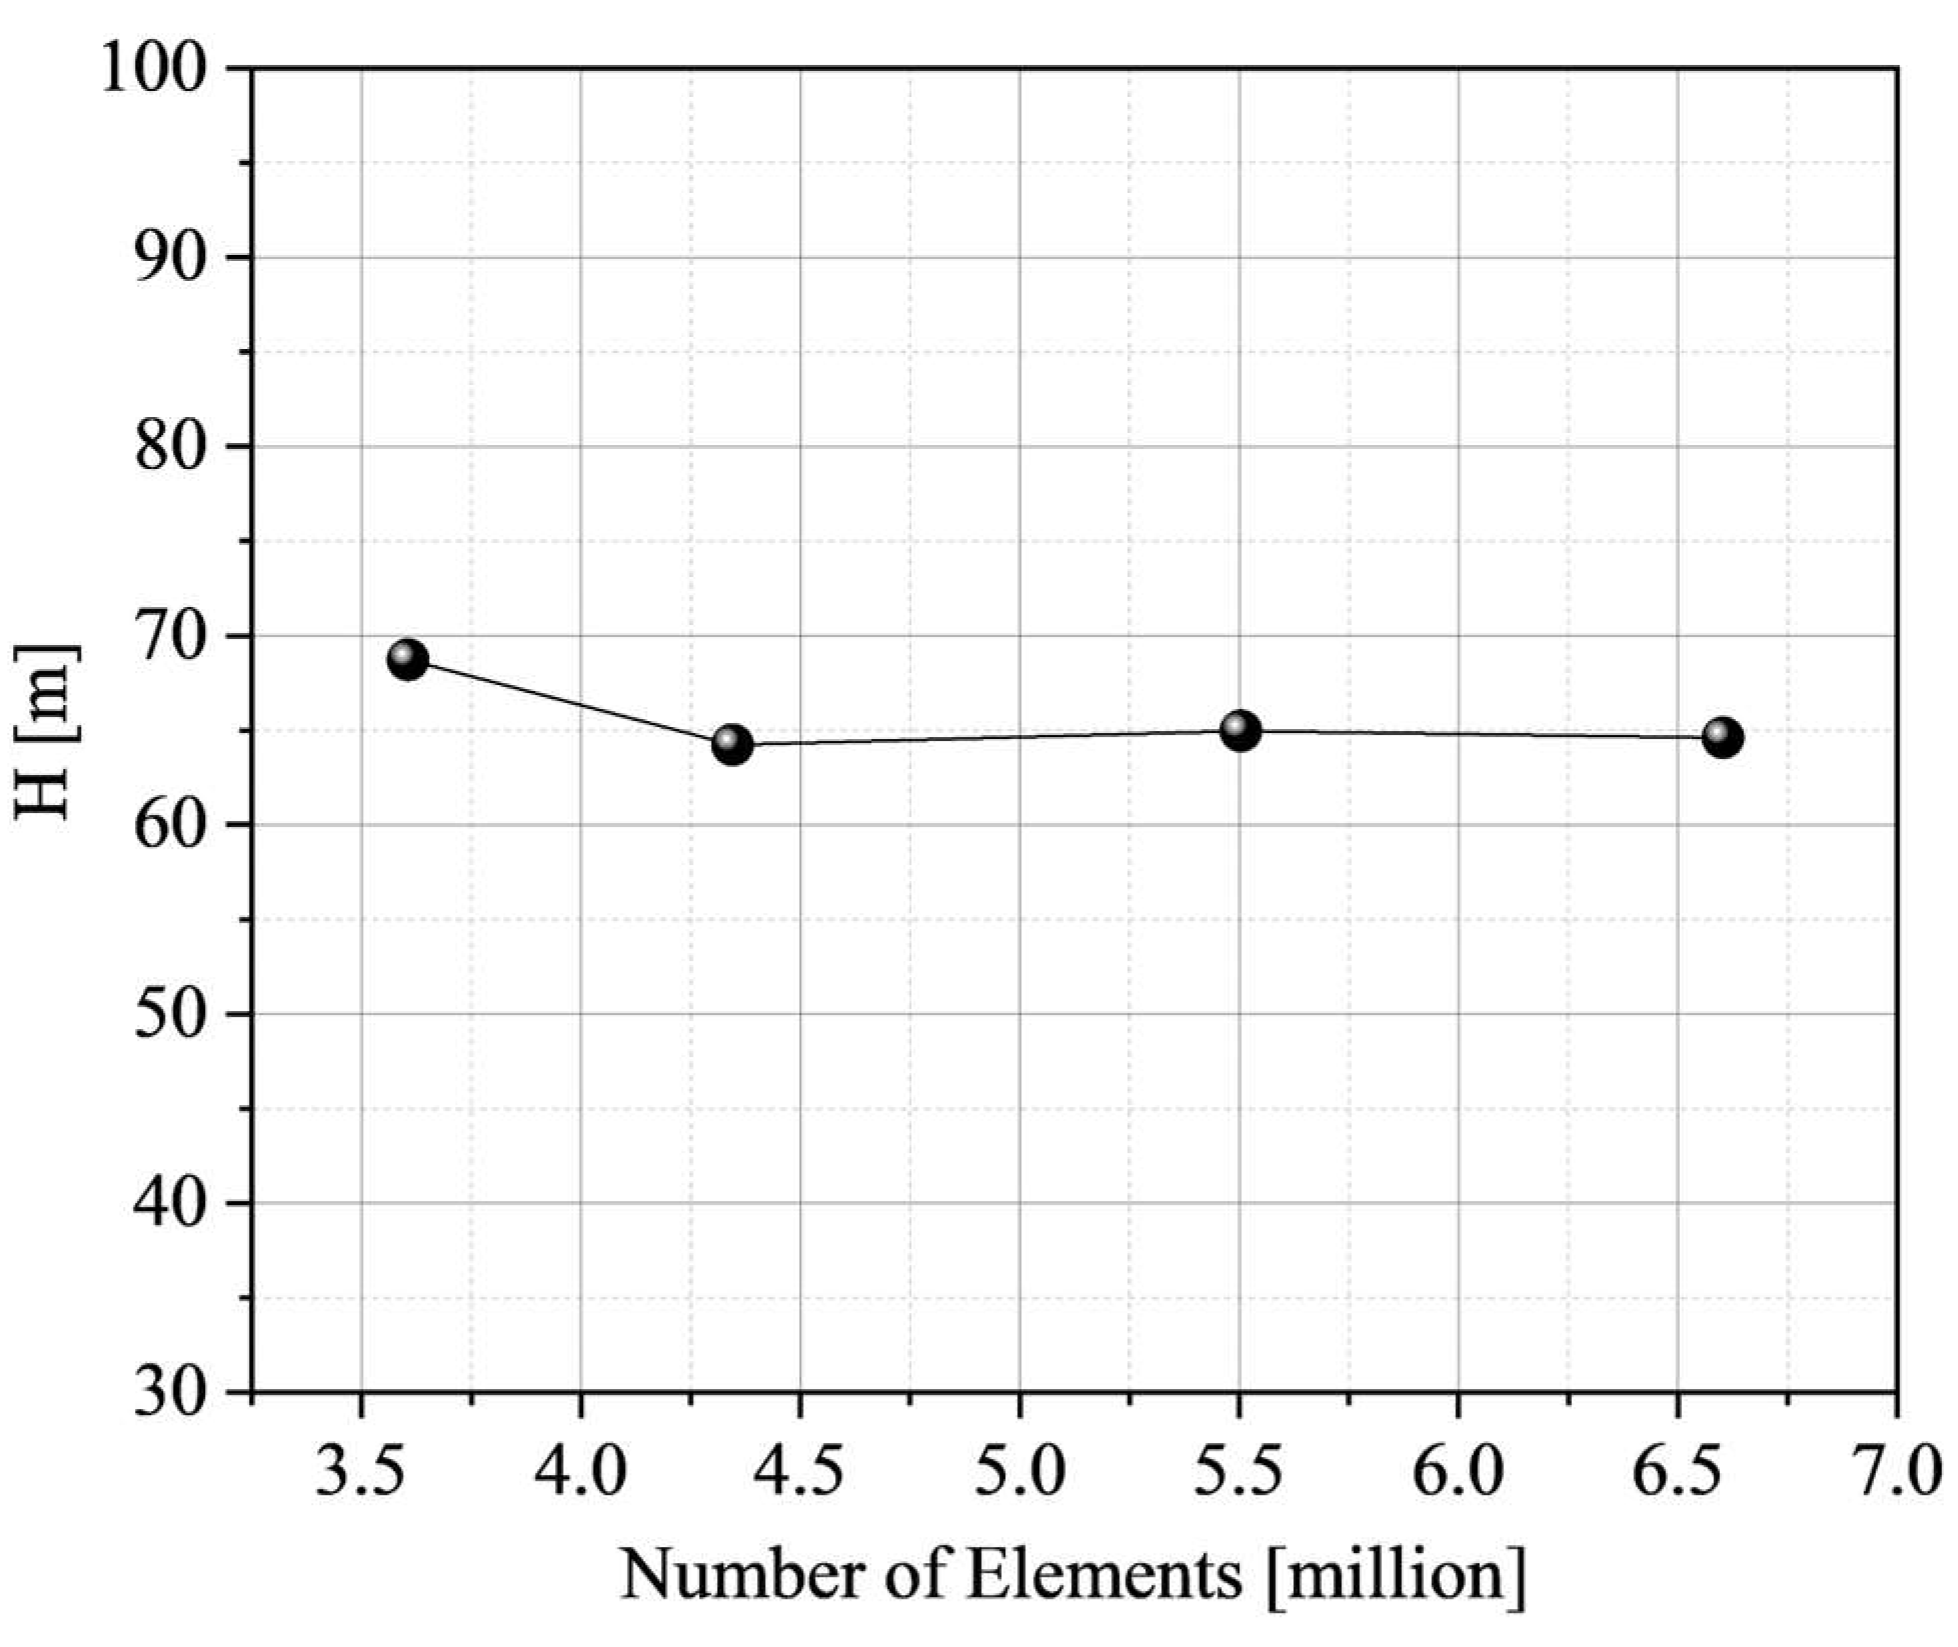
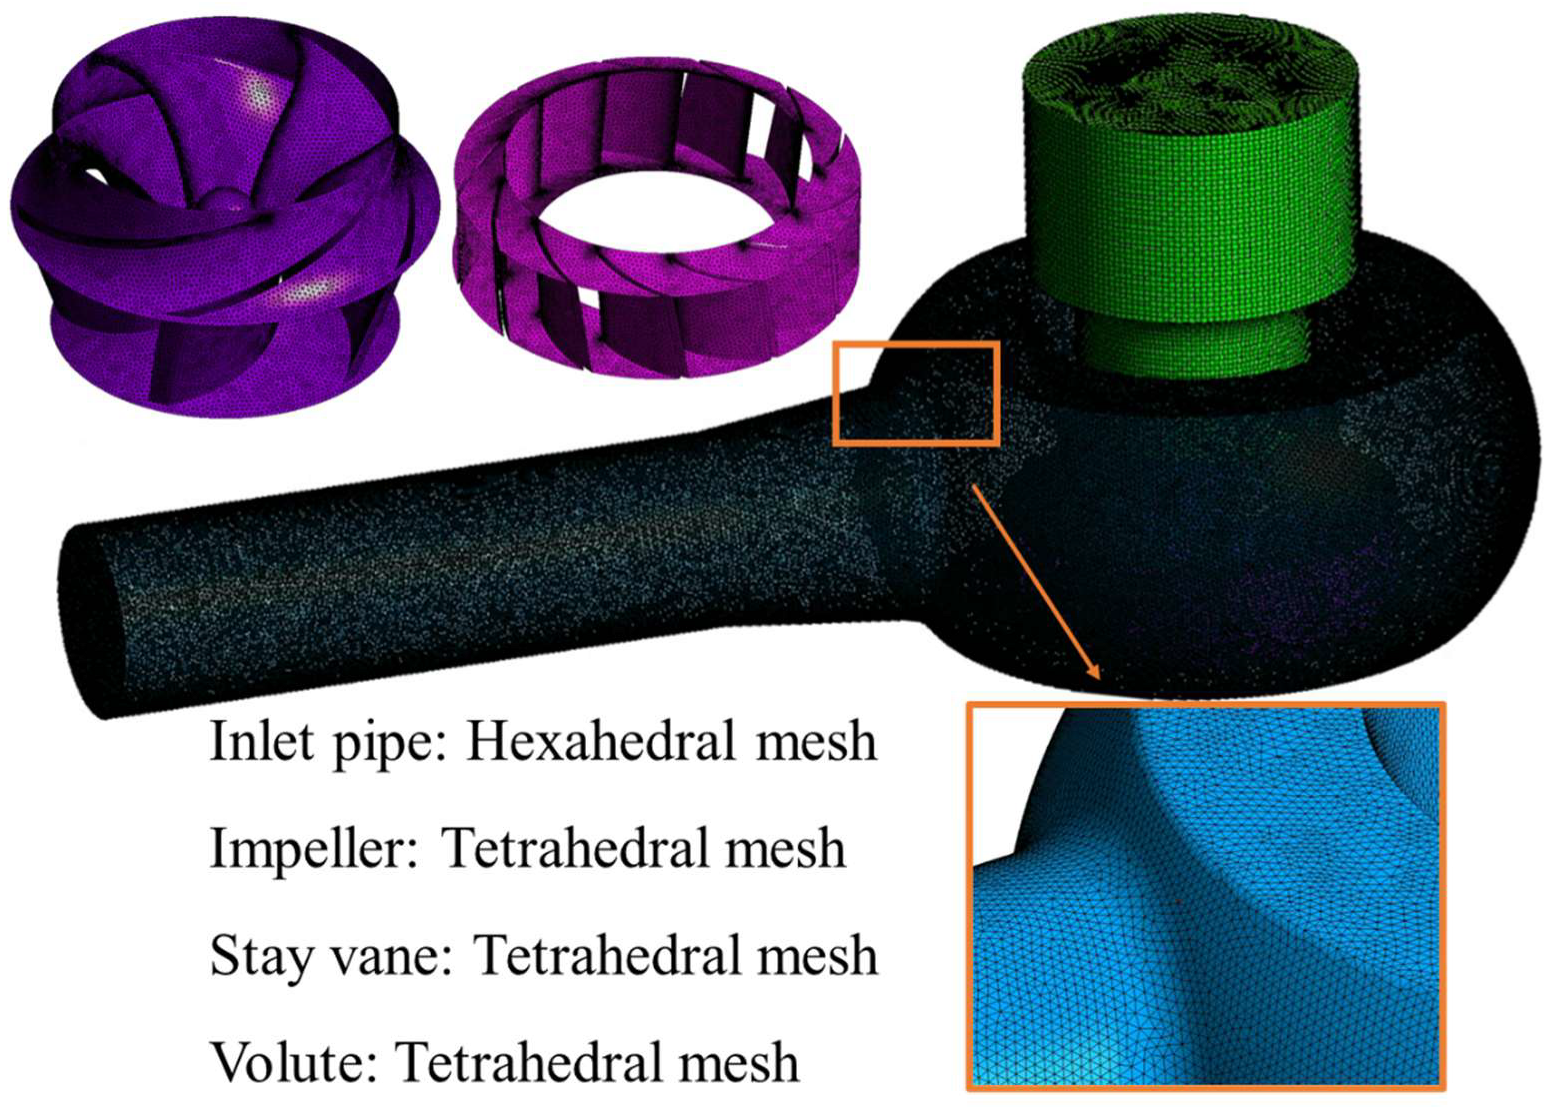
Prior to numerical simulation, mesh generation is required for the established 3D geometric model. In this paper, Ansys mesh is chosen for meshing. The inlet pipe section adopts hexahedral meshes, while the other components use tetrahedral meshes. Regarding the grid sensitivity, this paper selected five grid schemes to calculate the head. As shown in Figure 3, after the number of grids reached 4.3 million, the head remained basically stable with no significant changes. Therefore, considering the calculation cost and accuracy, this study chose the grid scheme of 5.5 million. The total number of meshes is 5,504,111. The detailed mesh diagram is shown in Figure 4, and the number of meshes for each component is presented in Table 2.

2.3. Boundary Conditions and CFD Setup

This study utilized the commercial software Ansys CFX 2024 R2 and the Static Structural module to conduct flow field calculations and rotor strength analysis. Detailed flow field boundary conditions are specified as follows: standard atmospheric pressure (101,325 Pa) is set as the reference pressure. The inlet of the water pipeline is defined as the fluid domain inlet with a mass flow inlet boundary condition. The flow value is set to the corresponding flow rate under the corresponding working conditions. This study focuses on analyzing three working conditions: 0.7 Qd, 1.0 Qd, and 1.2 Qd. The volute outlet acts as the fluid domain outlet with a static pressure boundary condition of 0 Pa. The multi-reference frame (MRF) approach is adopted here, where only the impeller rotor rotates at a speed of 1465 r/min. The other components are all stationary. Interfaces between the inlet and the rotor, between the rotor and the stay vanes, and between other components are all dynamic–static interfaces. Interfaces between different components use the General Grid Interface (GGI) model. All solid surfaces are set as wall boundaries, with no-slip shear conditions applied, and the wall real flow characteristics are simulated using the standard roughness model. Wall functions are adopted to approximate near-wall turbulent flow via empirical correlations, and the SST k − ω turbulence model is selected. Steady-state computations run for 3000 iterations, whose outcomes serve as the initial flow field for subsequent unsteady simulations. Transient calculations cover 10 full rotor revolutions, discretized into 180 time steps per revolution with 10 inner iterations for each step. The time step size is 2.2753 × 10⁻⁴ s, leading to a total simulation duration of 0.409558 s. Calculations are considered converged once the RMS residuals of continuity and momentum equations drop below 10−5 [19,20,21].

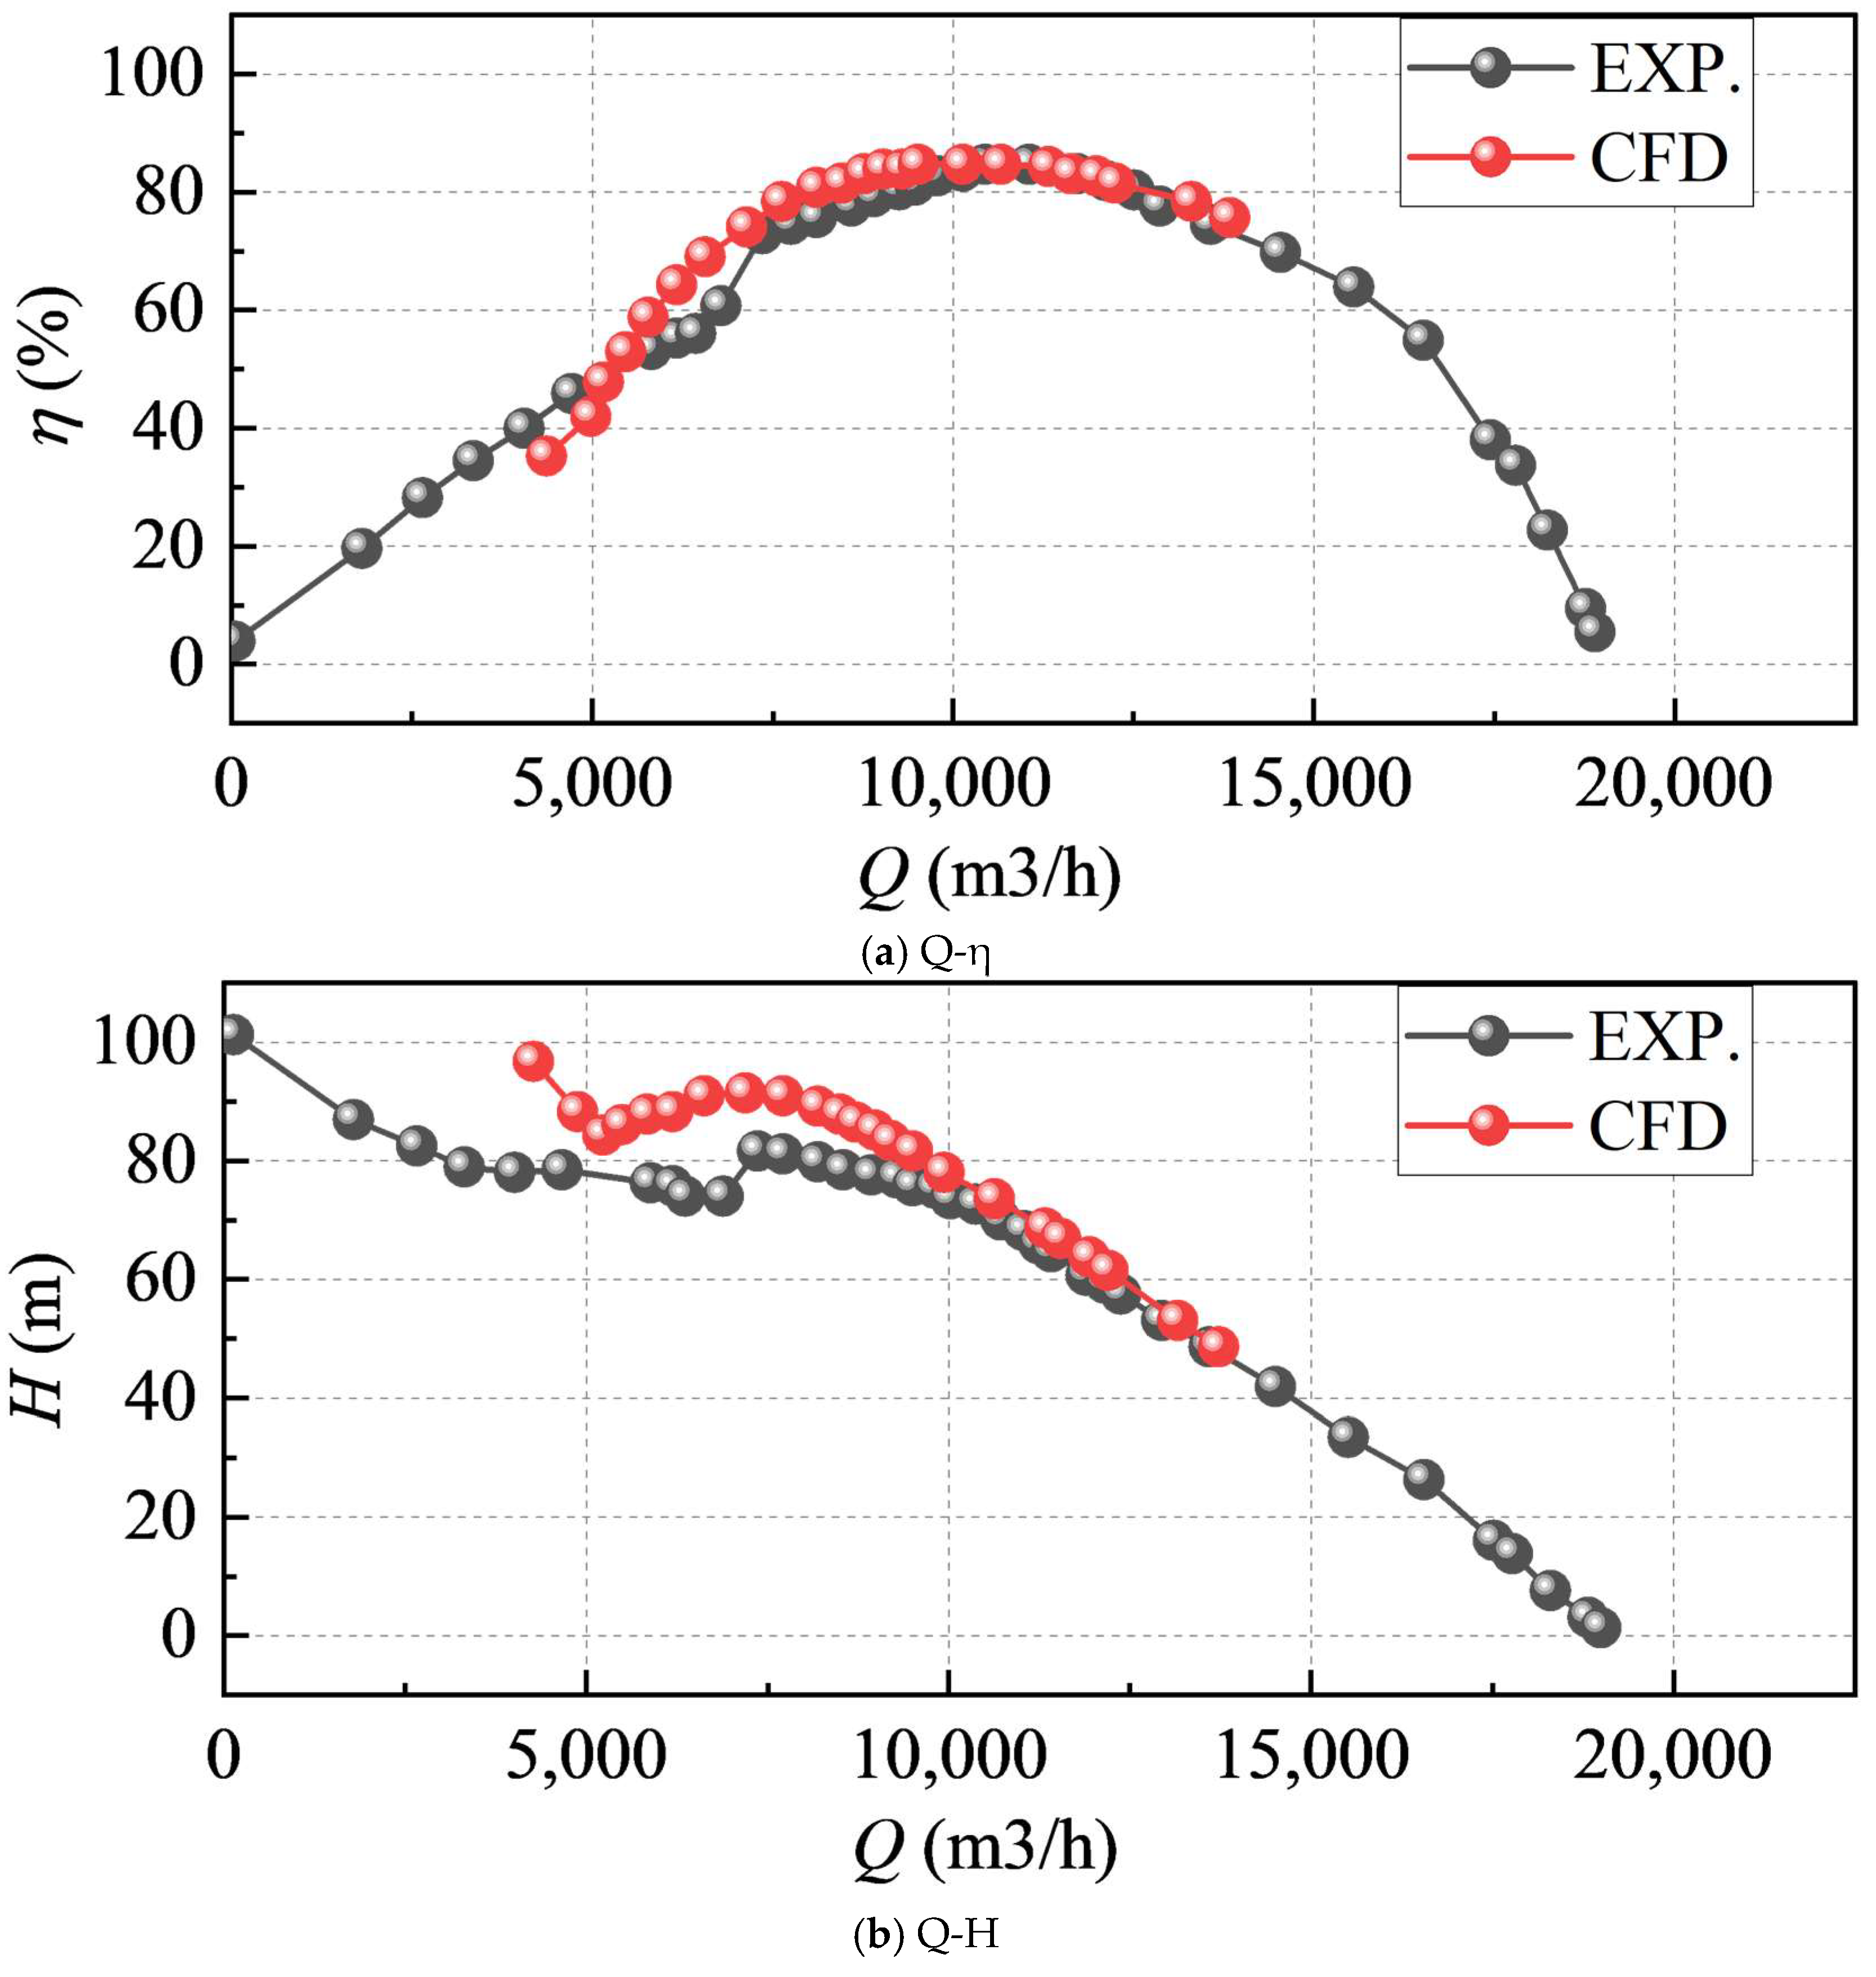
3. Experimental Testing and Validation

This study obtained the hydraulic performance through model tests, as shown in Figure 5. It can be clearly seen from Figure 5a that the overall trend of the efficiency curve is highly consistent. CFD can accurately predict the change pattern of efficiency. Near the peak (8000–12,000 m3/h), the two almost overlap, with extremely small errors, about 5%; there is a slight deviation in the small flow ranges, but it is still within the acceptable range. The maximum error is less than 15%. From Figure 5b, it can be seen that the overall downward trend is consistent. CFD can accurately capture the change pattern of head with flow rate. In the medium flow range (8000–15,000 m3/h), the two are closely matched, and the error is approximately 5%. In the small flow range (<8000 m3/h), CFD is slightly higher than the test value; the maximum error is less than 20%. This indicates that the numerical simulation method is reliable in predicting the efficiency characteristics of the pump, especially near the optimal operating condition, with higher accuracy.

4. Results and Discussion

4.1. Flow Field Characteristics

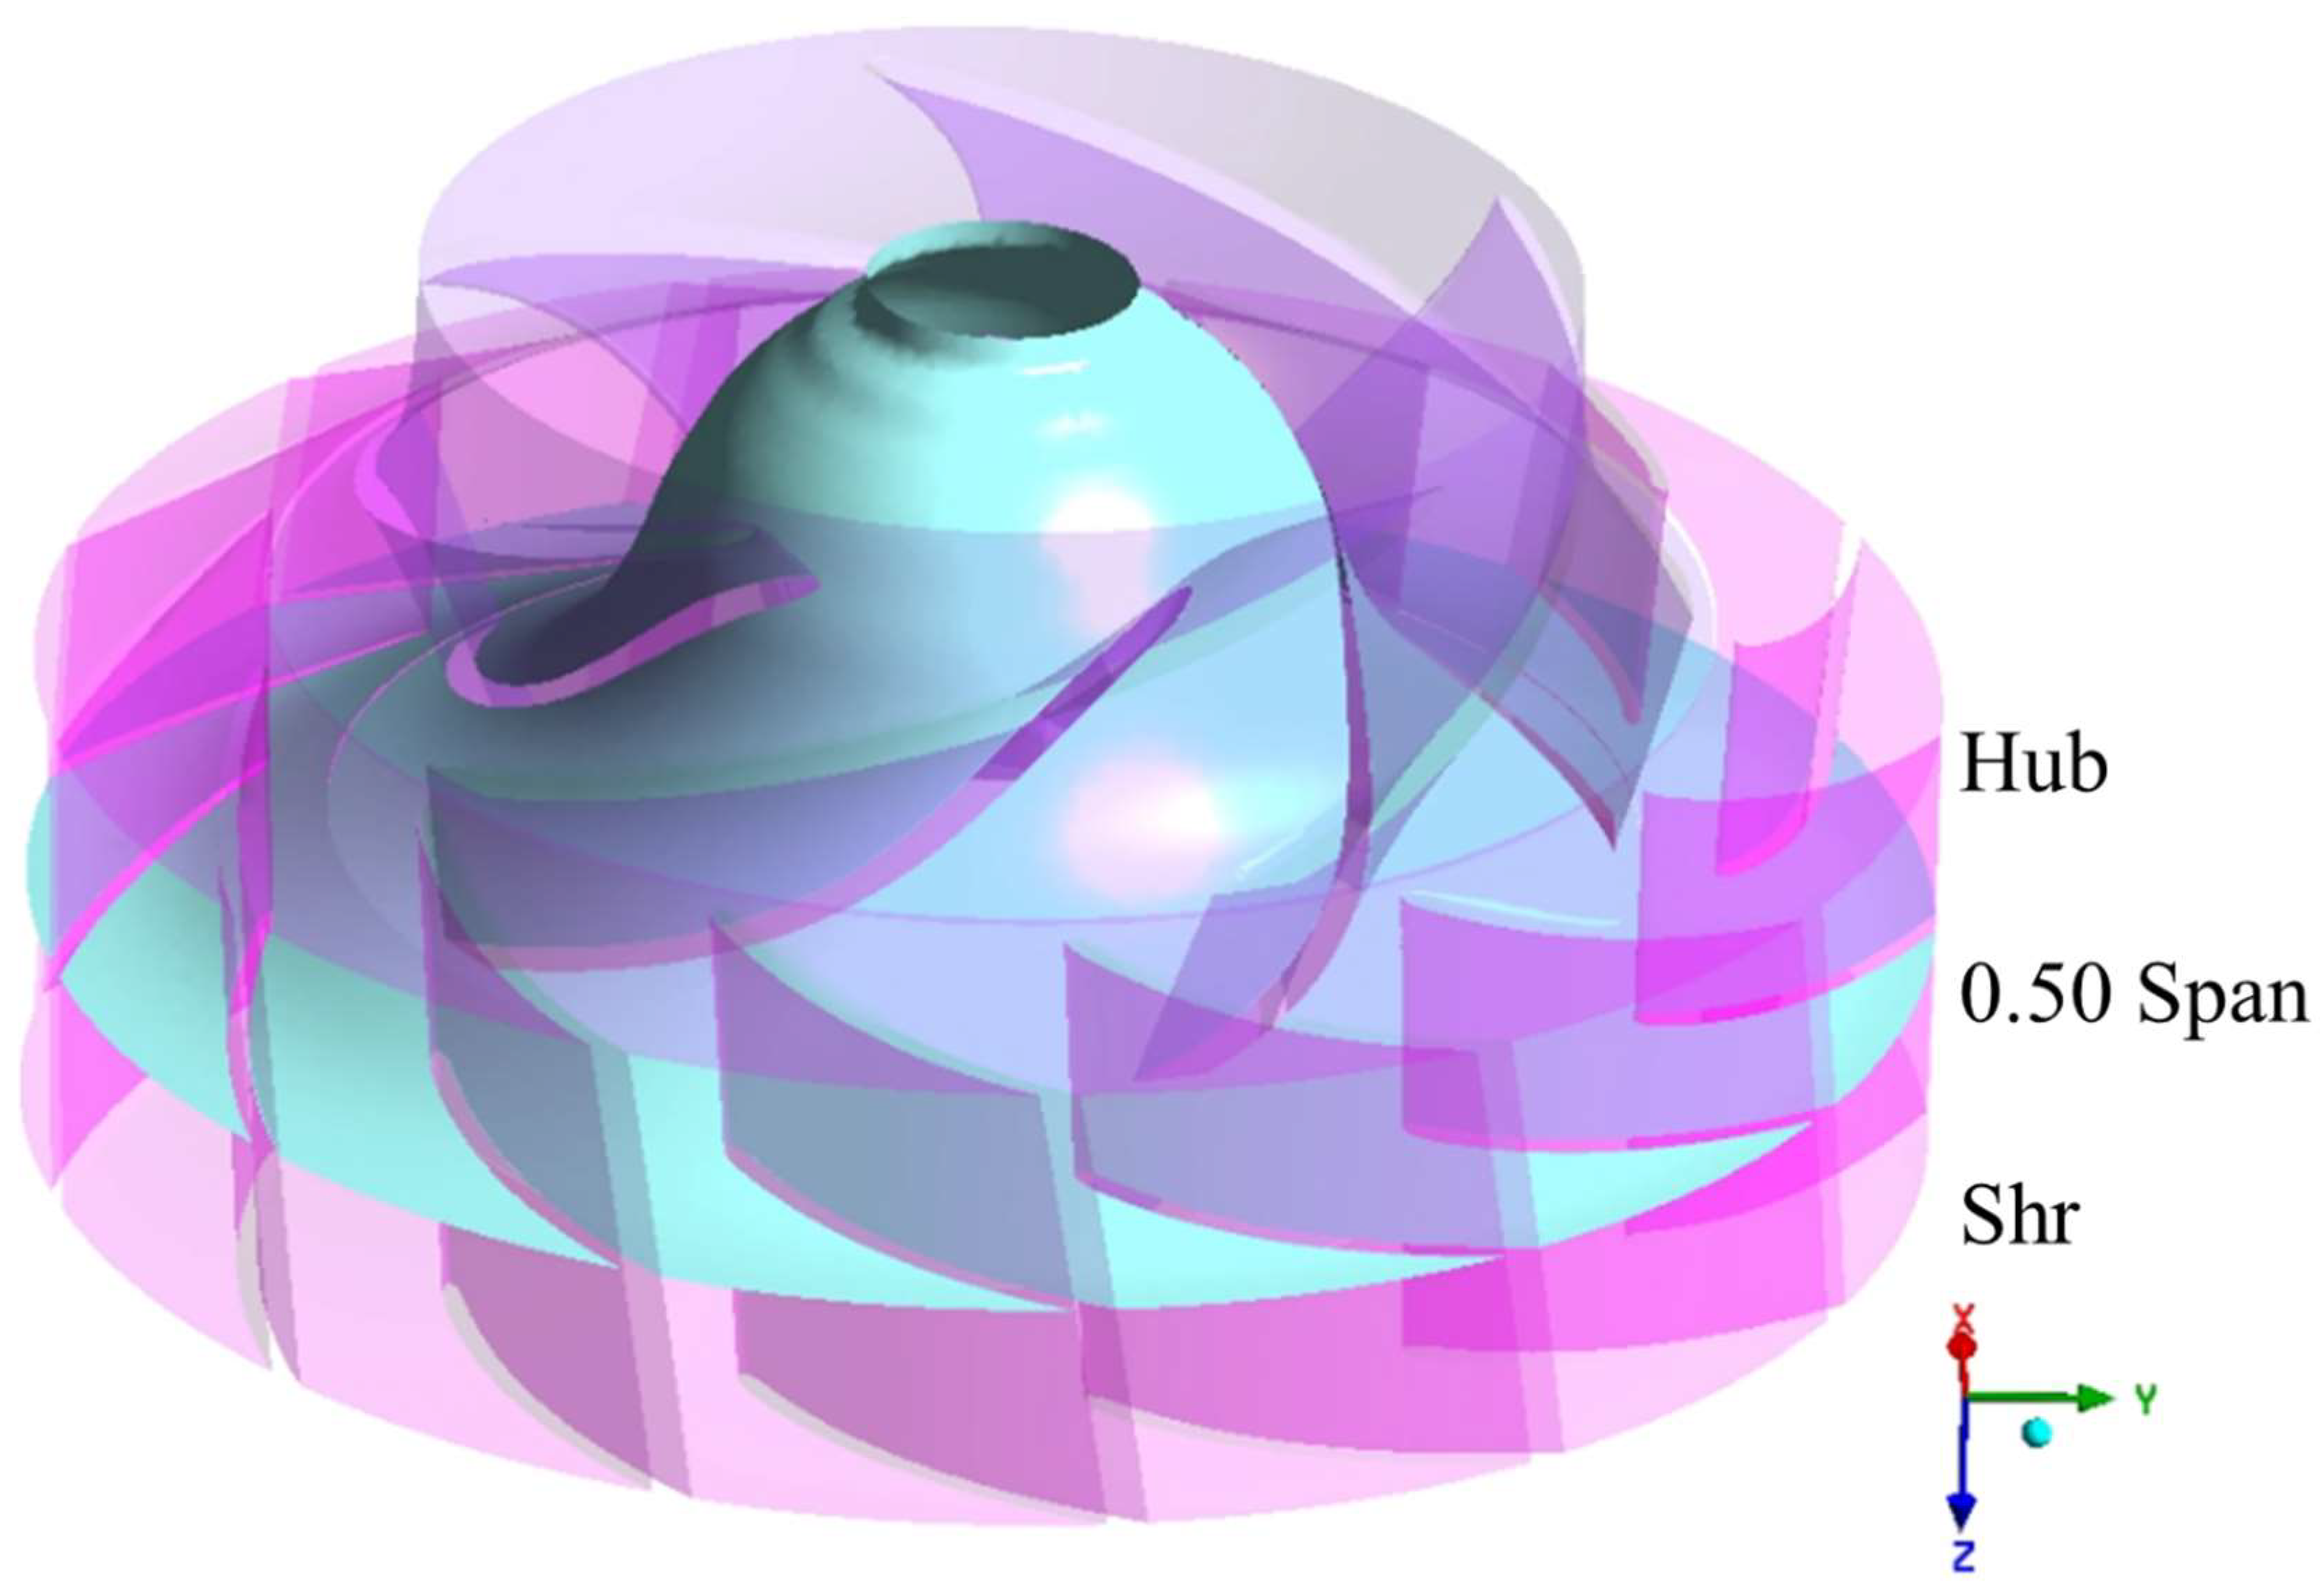
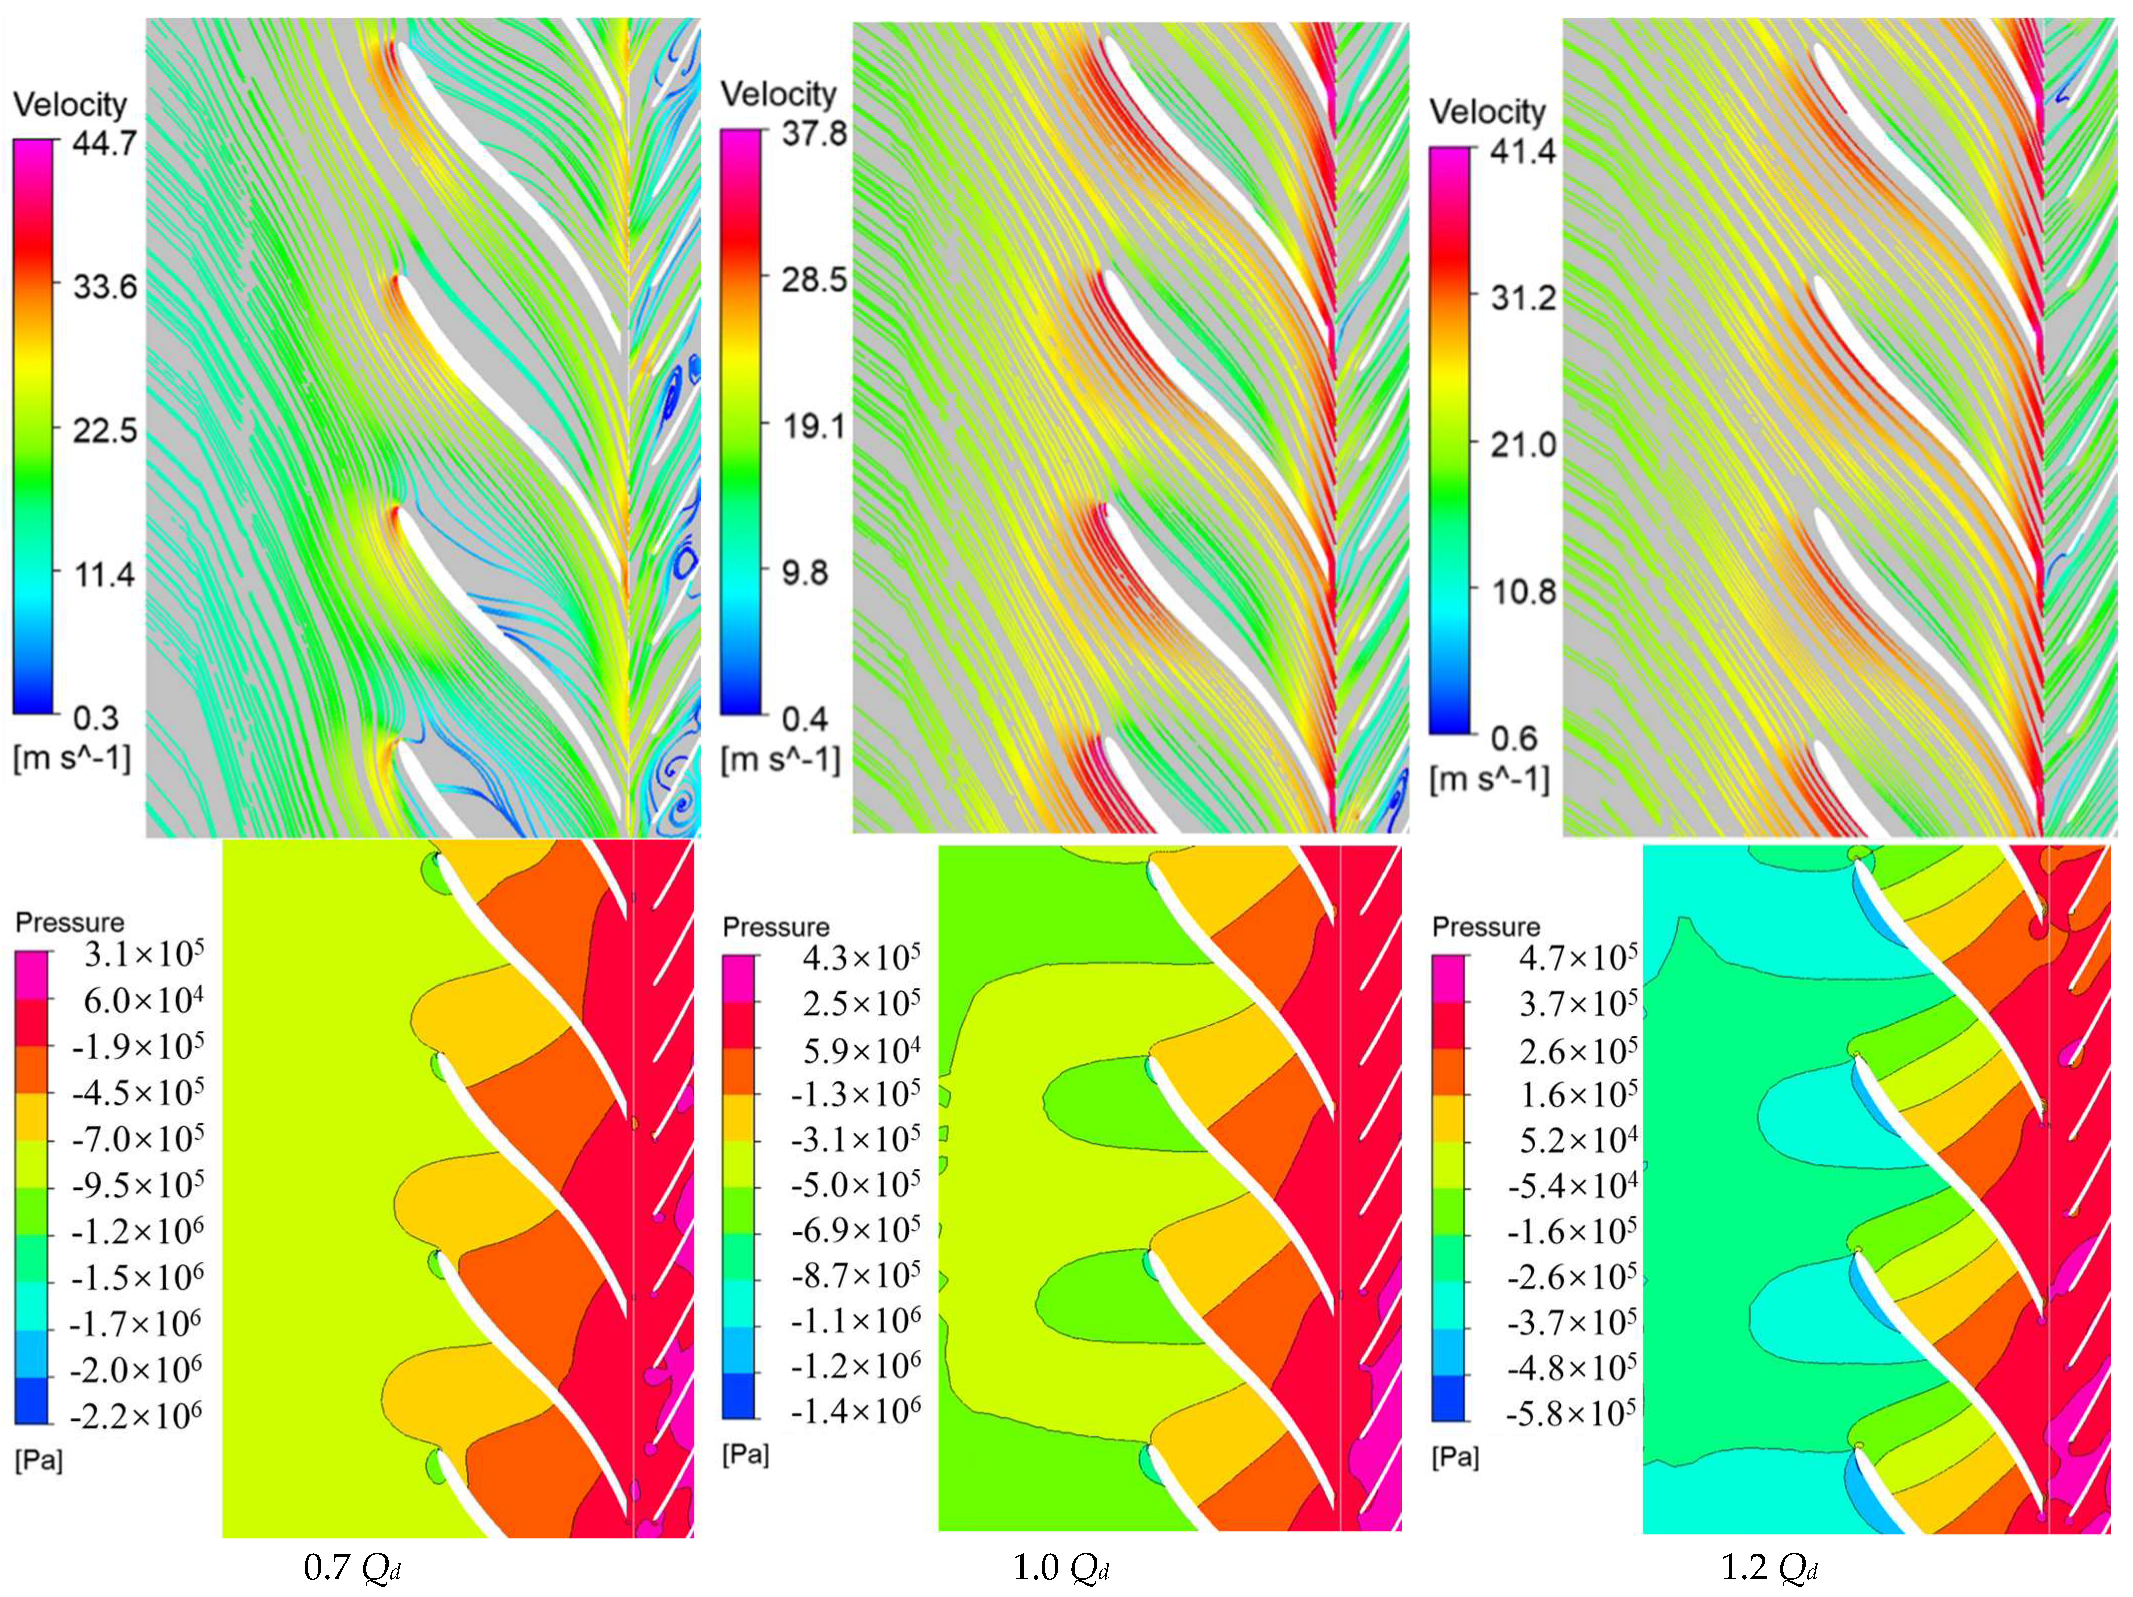
The internal flow behaviors of the impeller and guide vanes at 0.5 span are analyzed in this paper, with the corresponding cross-section illustrated in Figure 6. Three operating points, namely partial flow, design and overload conditions, are discussed in terms of velocity and pressure distributions. The internal flow lines and velocity distribution within the stay vane type mixed-flow chemical pump under different conditions are shown in Figure 7. From the perspective of Blade to Blade, at the small flow condition of 0.7 Qd, there are obvious low-speed zones and local recirculation in the flow channel of the impeller outlet and stay vanes, and flow separation occurs near the blade wall, with enhanced secondary flow. At the rated condition of 1.0 Qd, the internal flow of the impeller and stay vanes is smooth, without obvious recirculation or separation, and the velocity distribution in the main flow area is uniform, with a higher energy conversion efficiency. Under the overload condition of 1.2 Qd, the flow velocity rises throughout the flow passage, accompanied by localized high-speed regions at the impeller outlet and within the volute. The velocity gradient increases, and local turbulence dissipation enhances, resulting in a decrease in flow stability. For all three operating conditions, fluid pressure gradually increases from the impeller inlet to the impeller outlet and the stay vane passage as fluid flows through the rotating impeller. There are obvious high-pressure areas at the rotor outlet and stay vanes region, but there are some uneven pressure phenomena in the stay vanes’ flow channels [22,23,24,25,26].

4.2. Radial Force Analysis

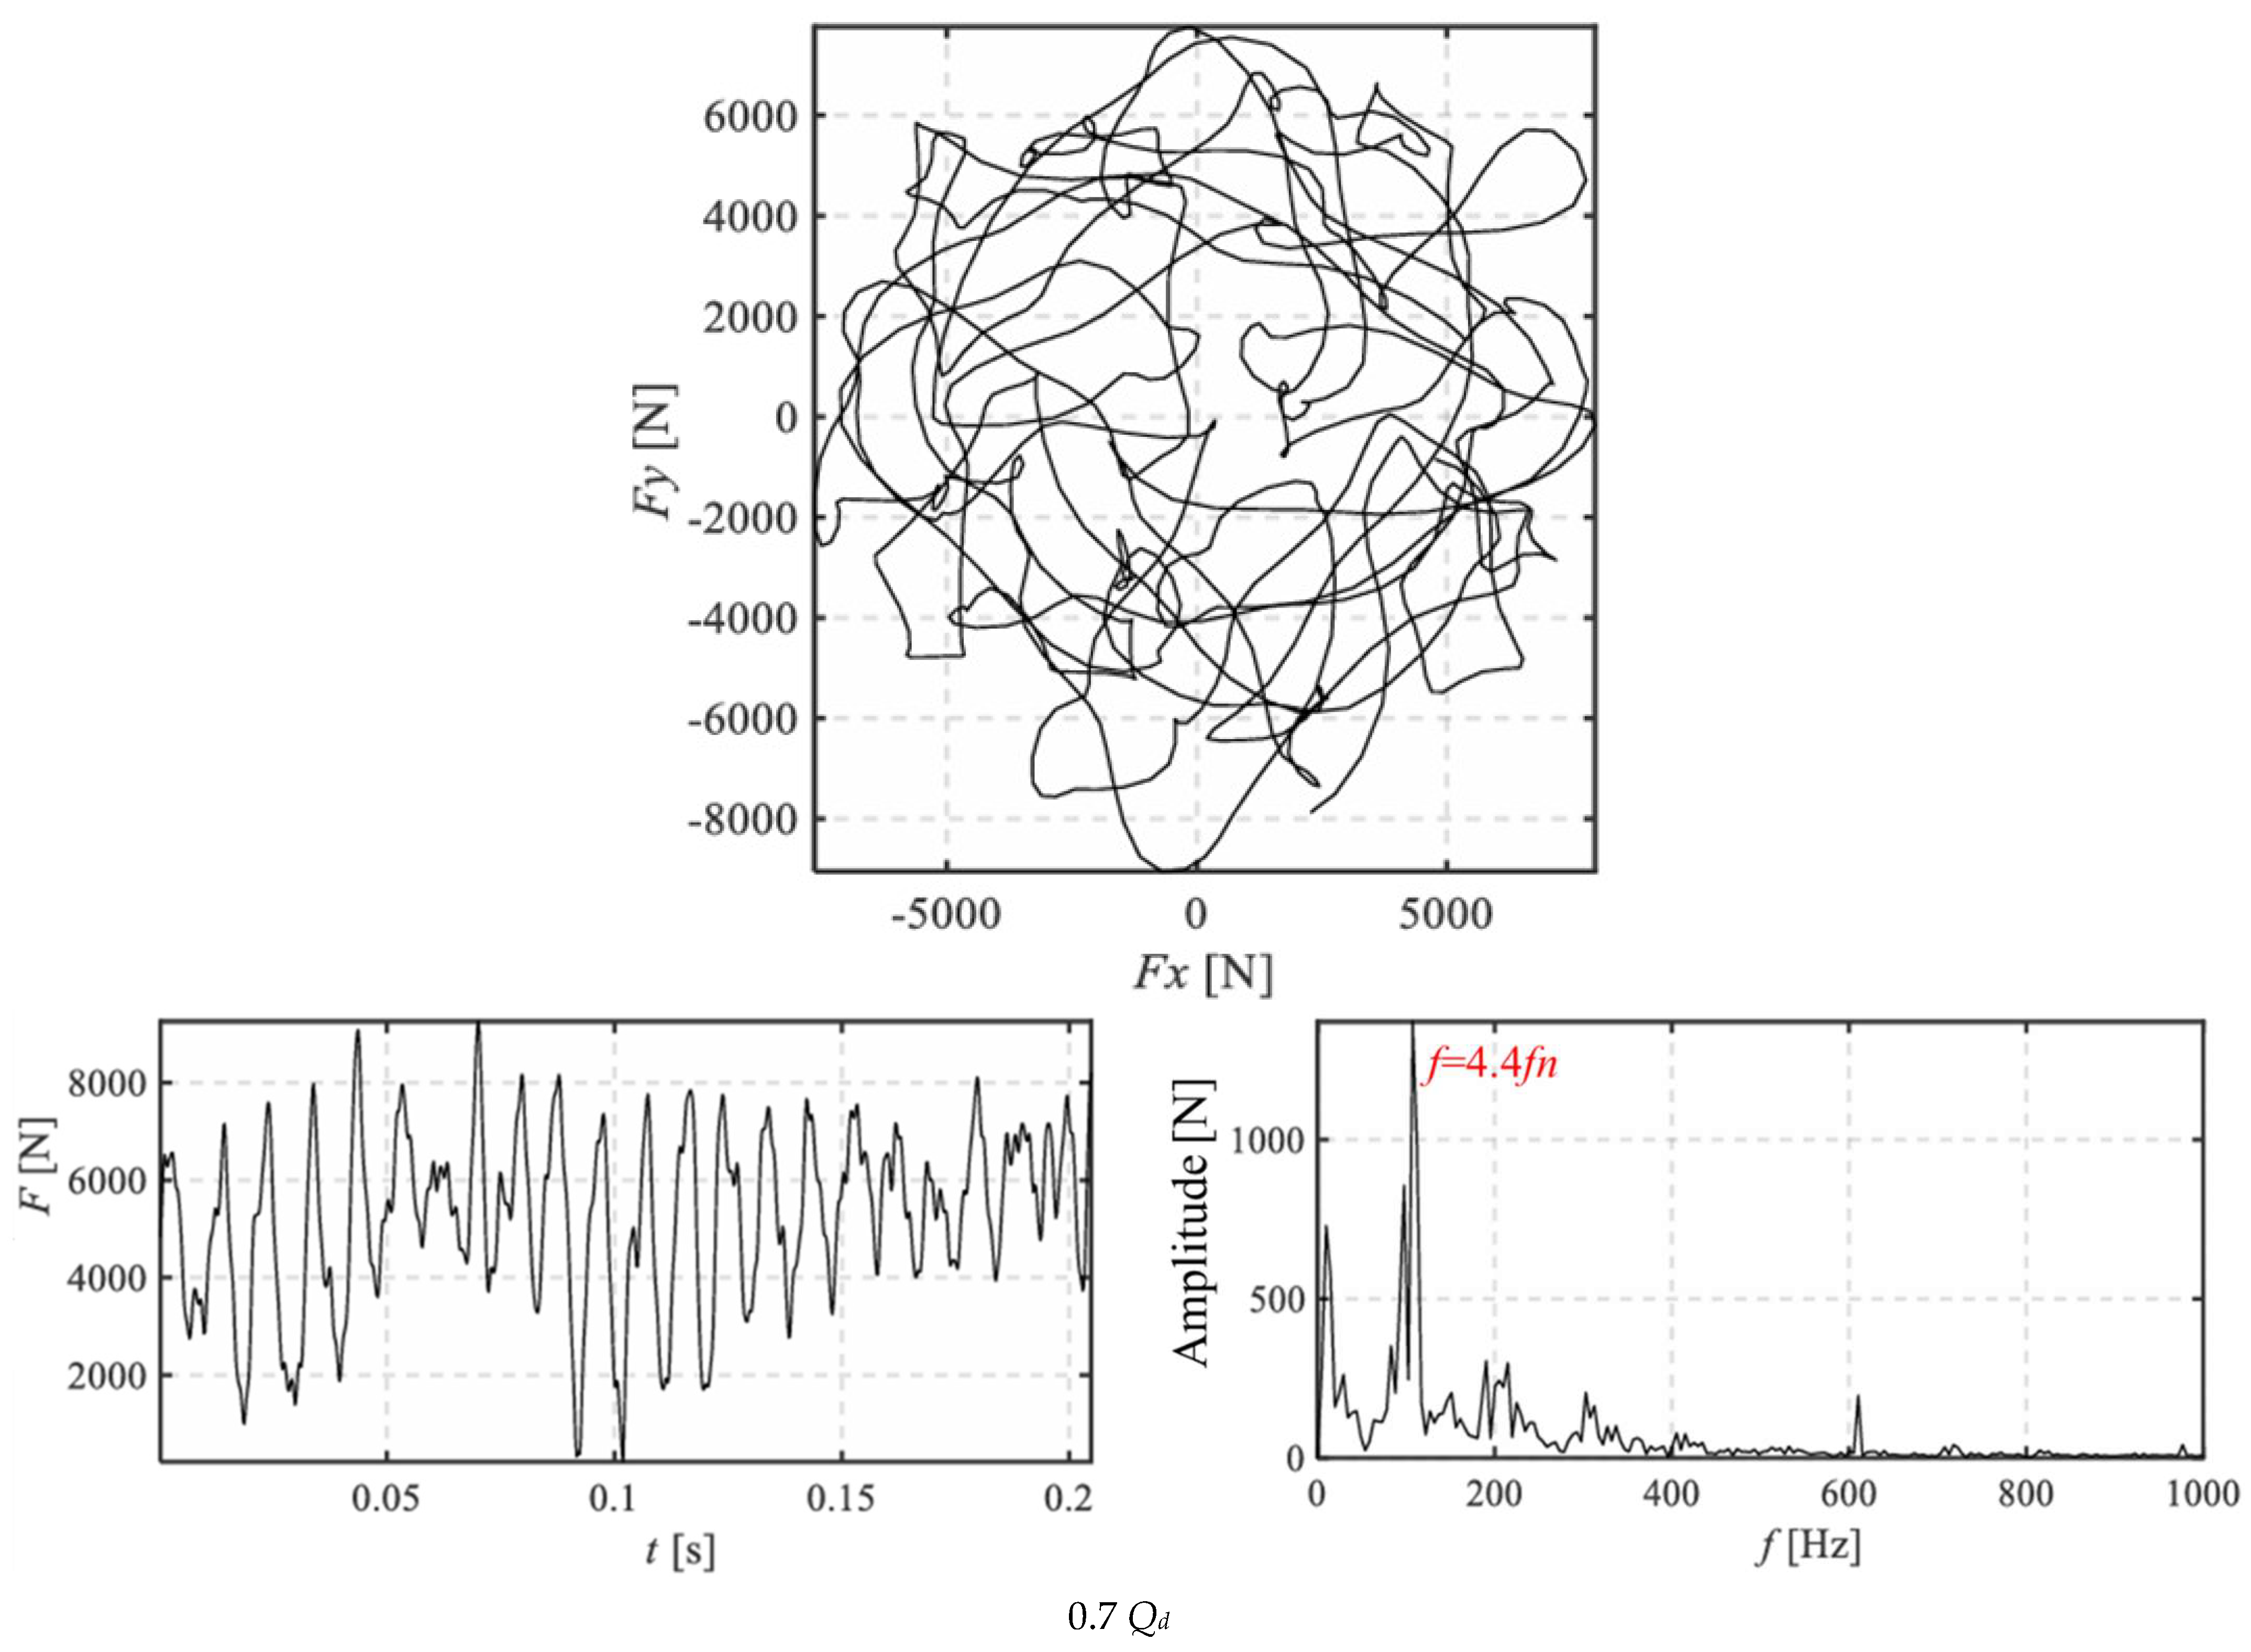
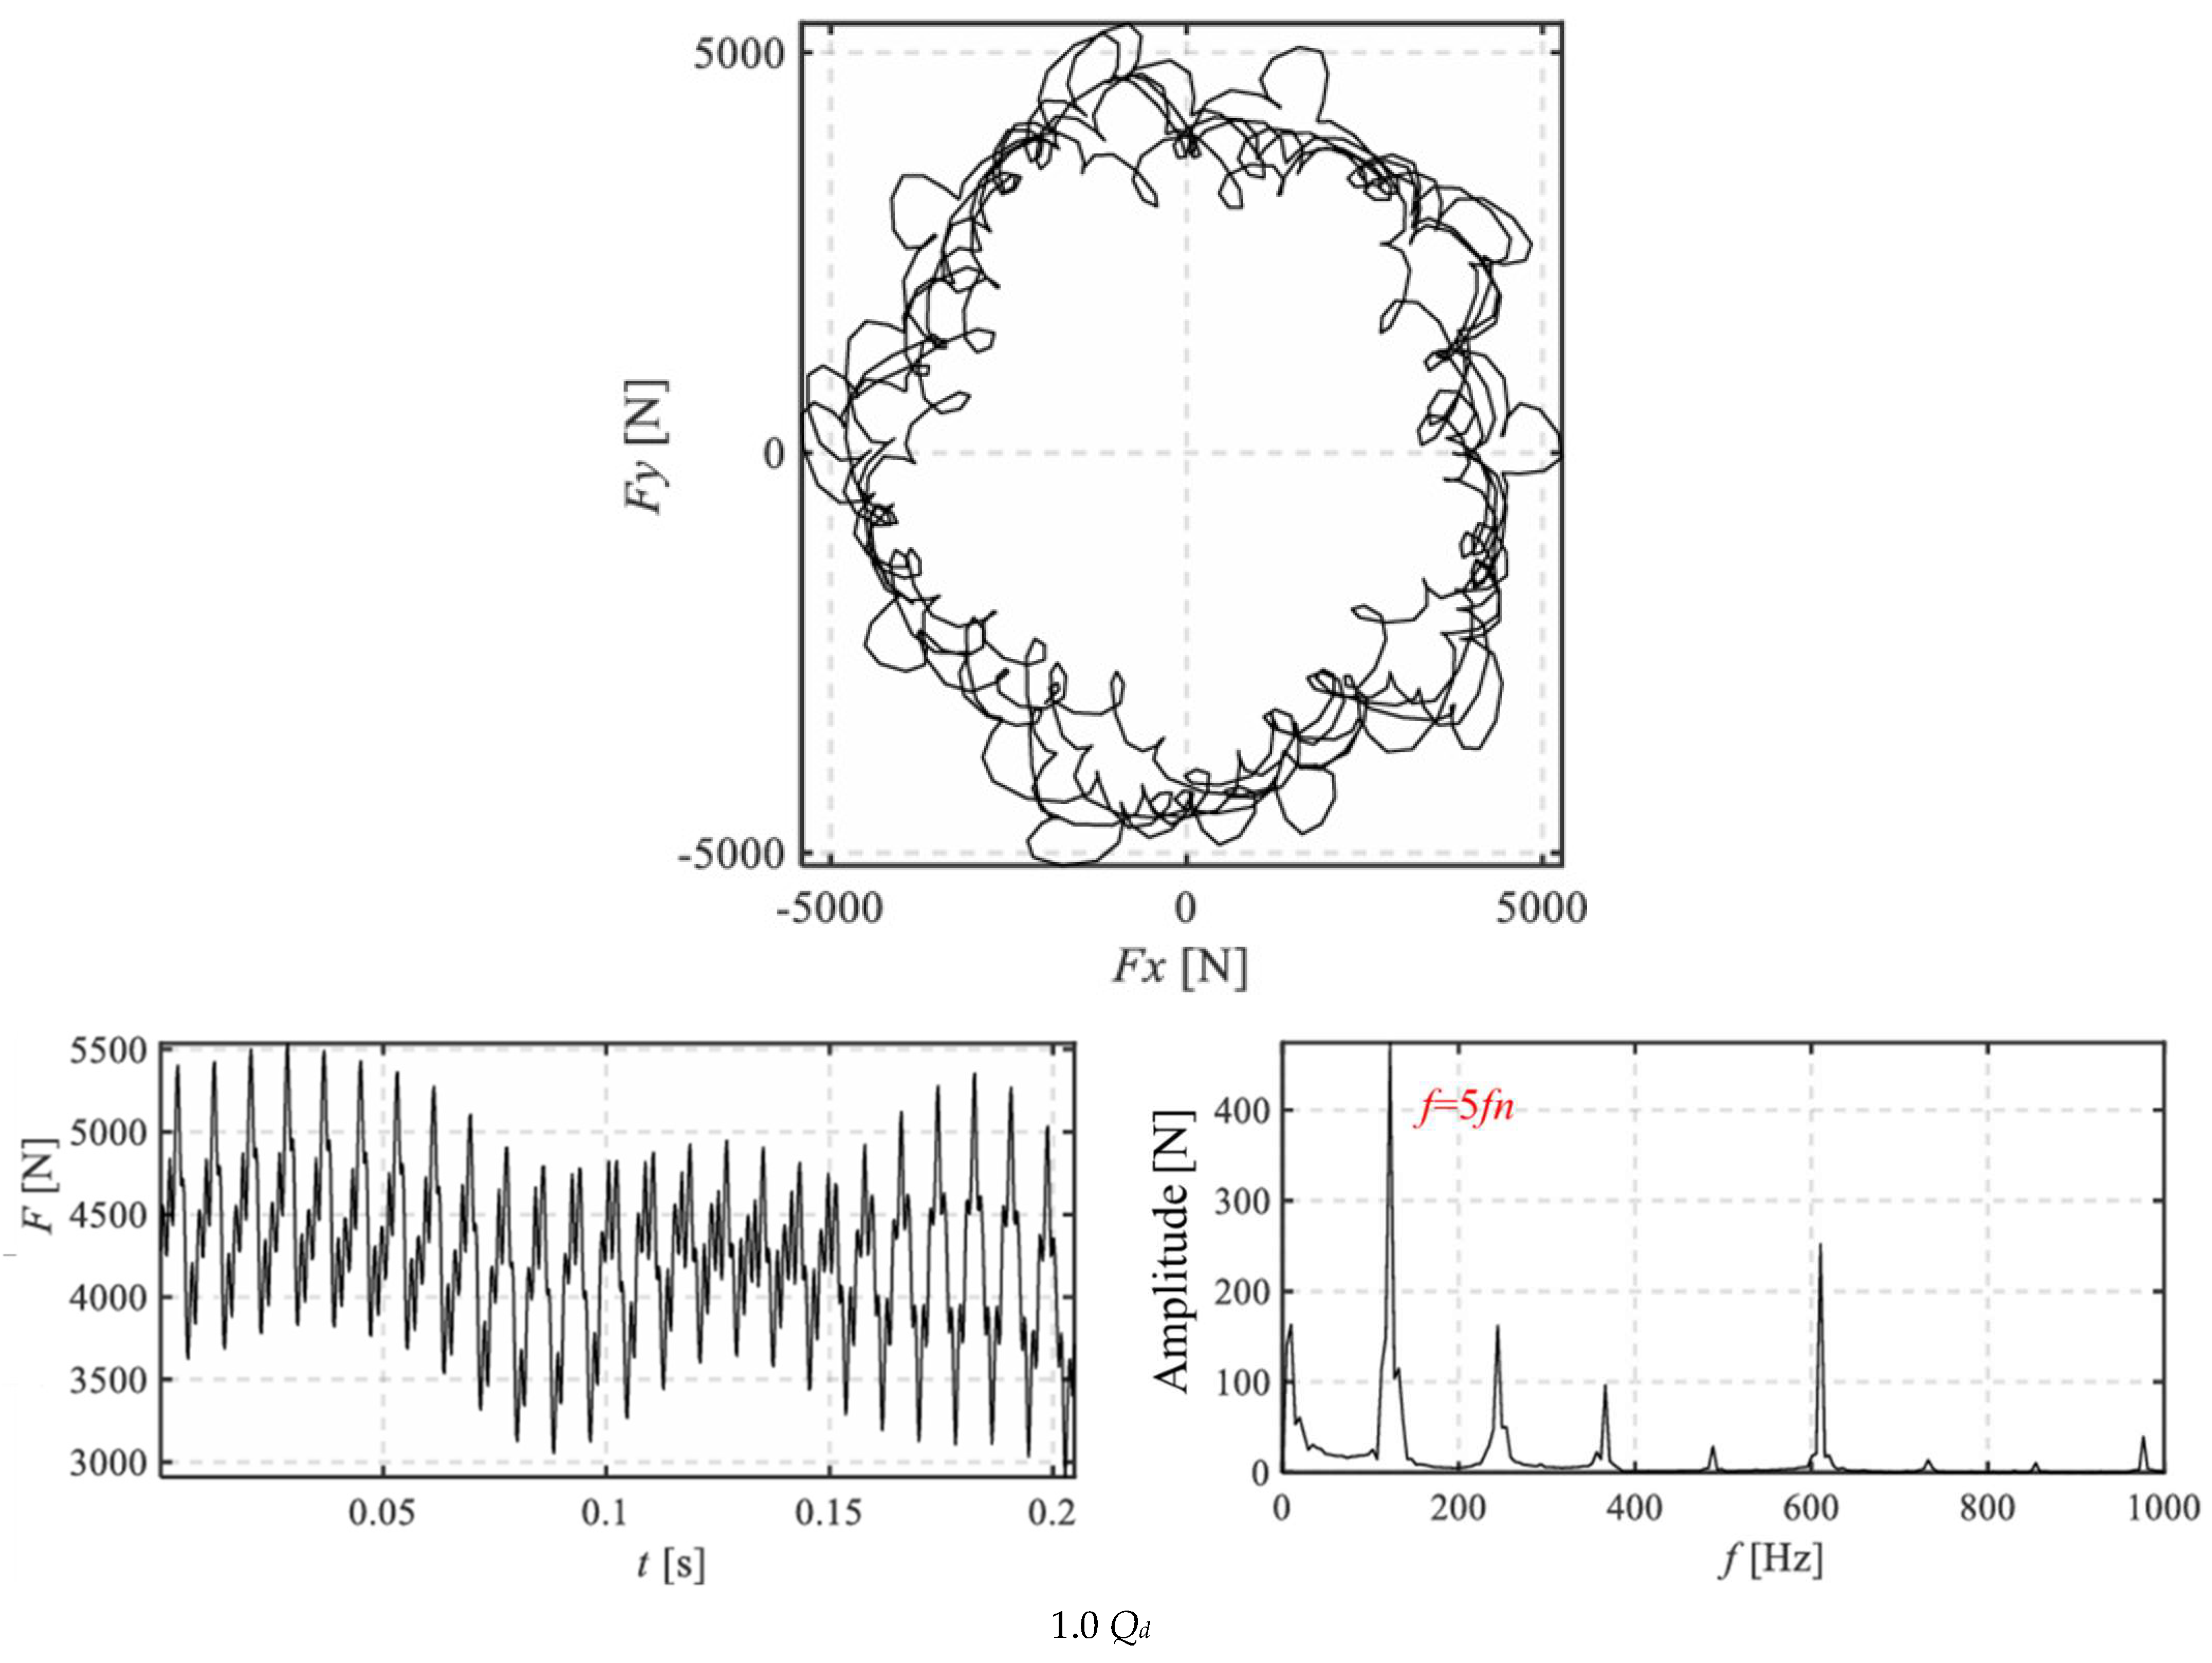
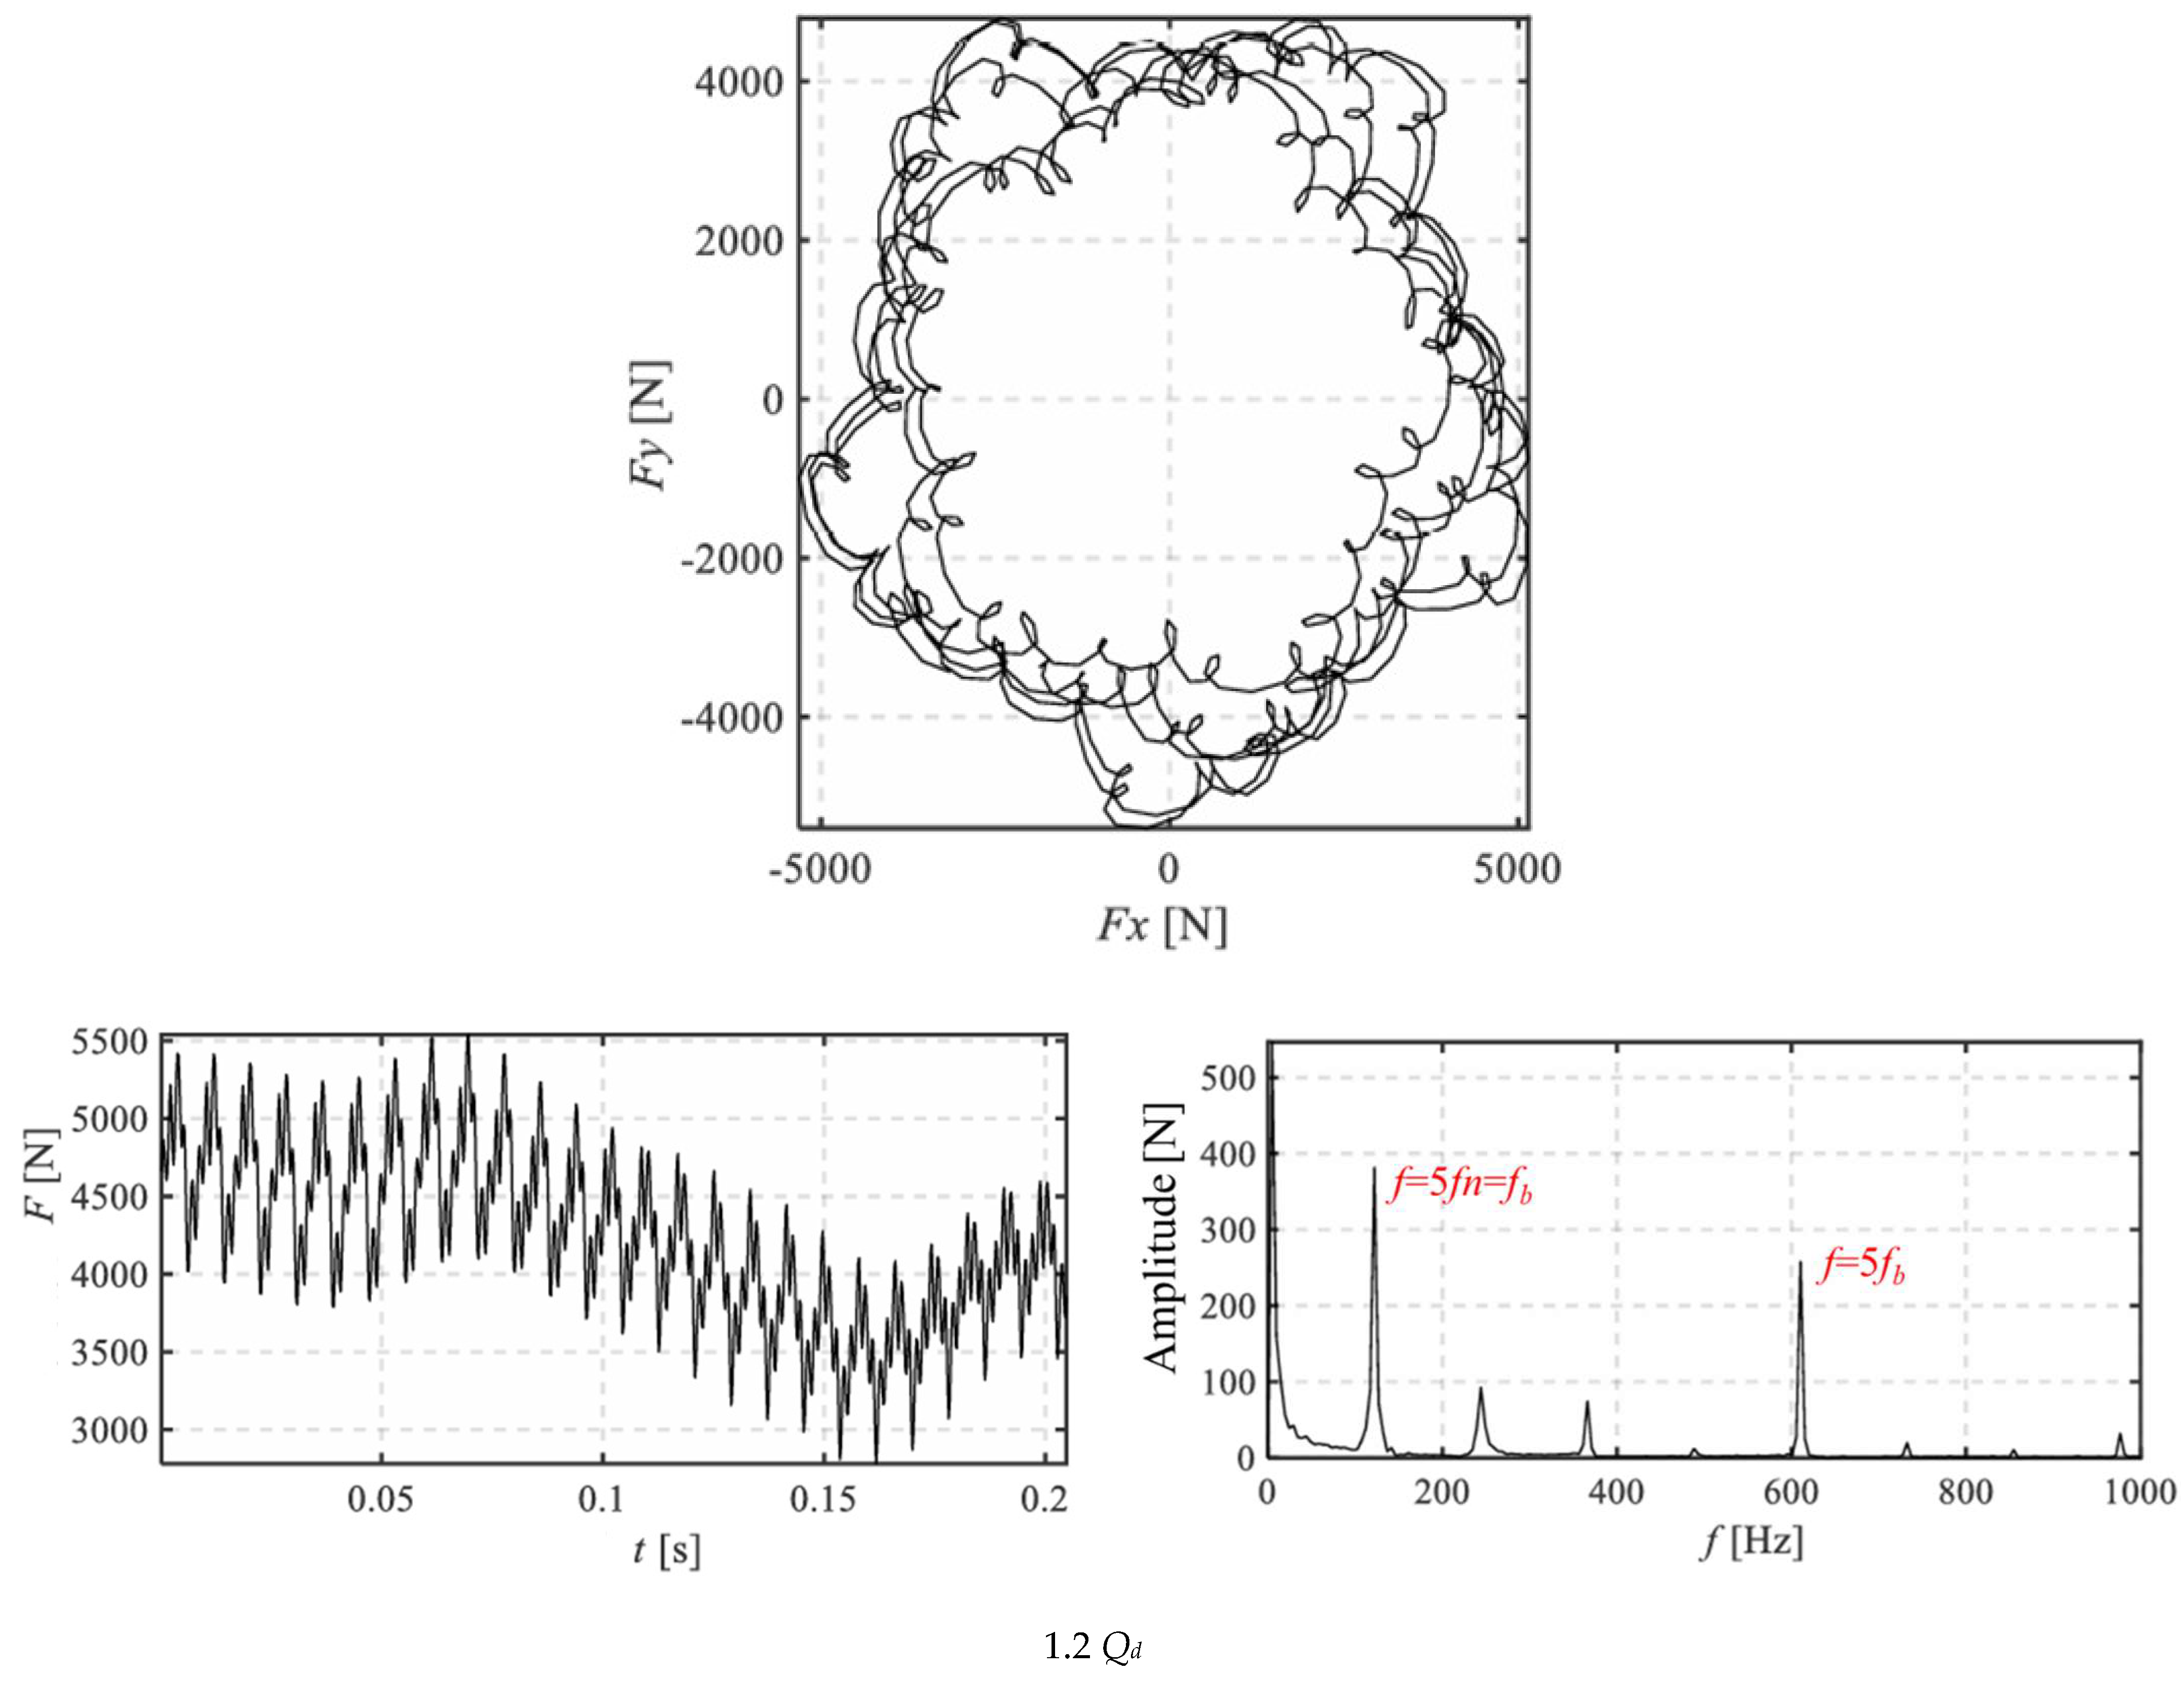
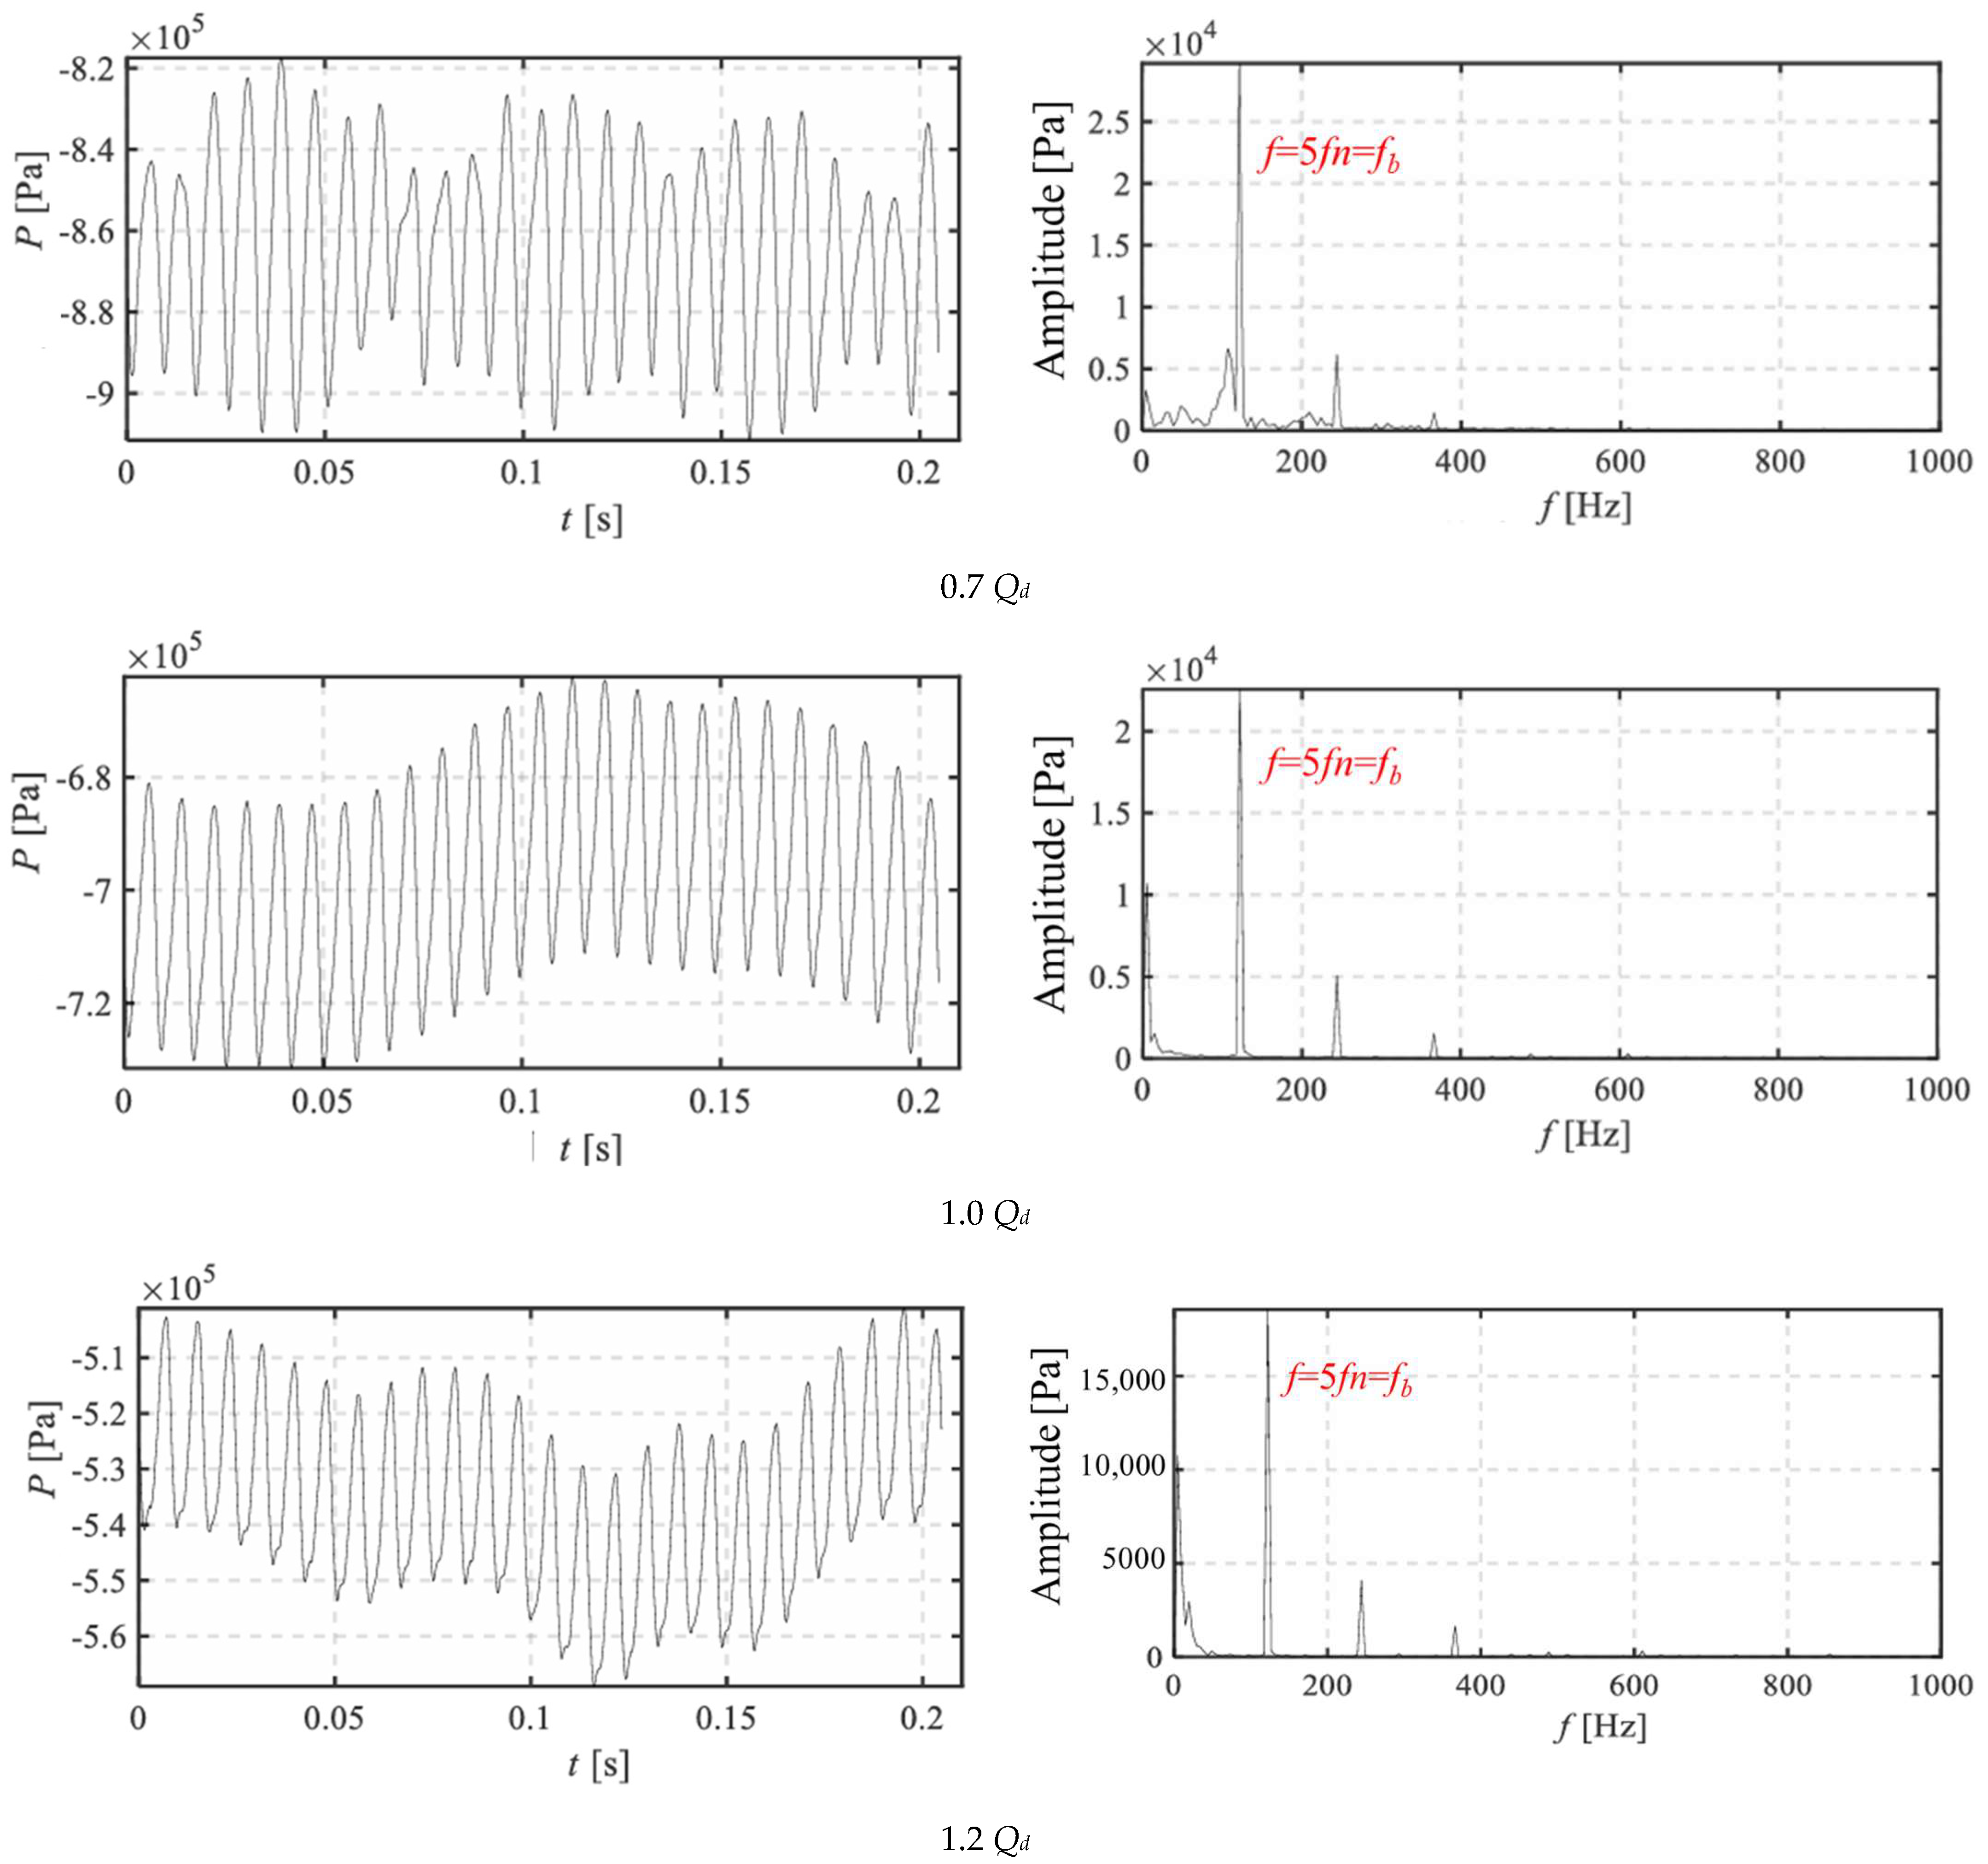
Figure 8 presents the time-domain radial force curves of the impeller under various working conditions, and fast Fourier transform (FFT) is implemented to derive the corresponding frequency-domain spectra. Only the stable 0–0.2 s (five full rotations) segment of the full 0.4096 s simulation (10 full rotations) is displayed for clear observation of periodic signals. The first five revolutions are discarded to eliminate transient startup effects. For the 0.7 Qd low-flow condition, the amplitude of the radial force of the impeller is the largest, with intense fluctuations. The dominant frequency of the resultant radial force is 4.4 times the rotational frequency fn, and the average radial force is approximately 5500 N, while the radial force pulsation amplitude is around 9000 N, which is greater than the average radial force; for the 1.0 Qd rated condition, the amplitude of the radial force is the smallest, with stable fluctuations. The main frequency of the radial resultant force is 5 fn, and the average radial force is approximately 4200 N, while the radial force pulsation amplitude is around 2300 N; for the 1.2 Qd high-flow condition, the amplitude of the radial force is between the low-flow and rated conditions, with a fluctuation amplitude slightly higher than that of the rated condition. The main frequencies of the radial resultant force are 5 fn (fn = n/60) and 5 fb (fb = fn × Zimp), and the average radial force is approximately 4500 N, while the radial force pulsation amplitude is around 2500 N. The resultant radial force F is shown in Equation (9).
F = F x 2 + F y 2

4.3. Pressure Pulsation Signal Analysis

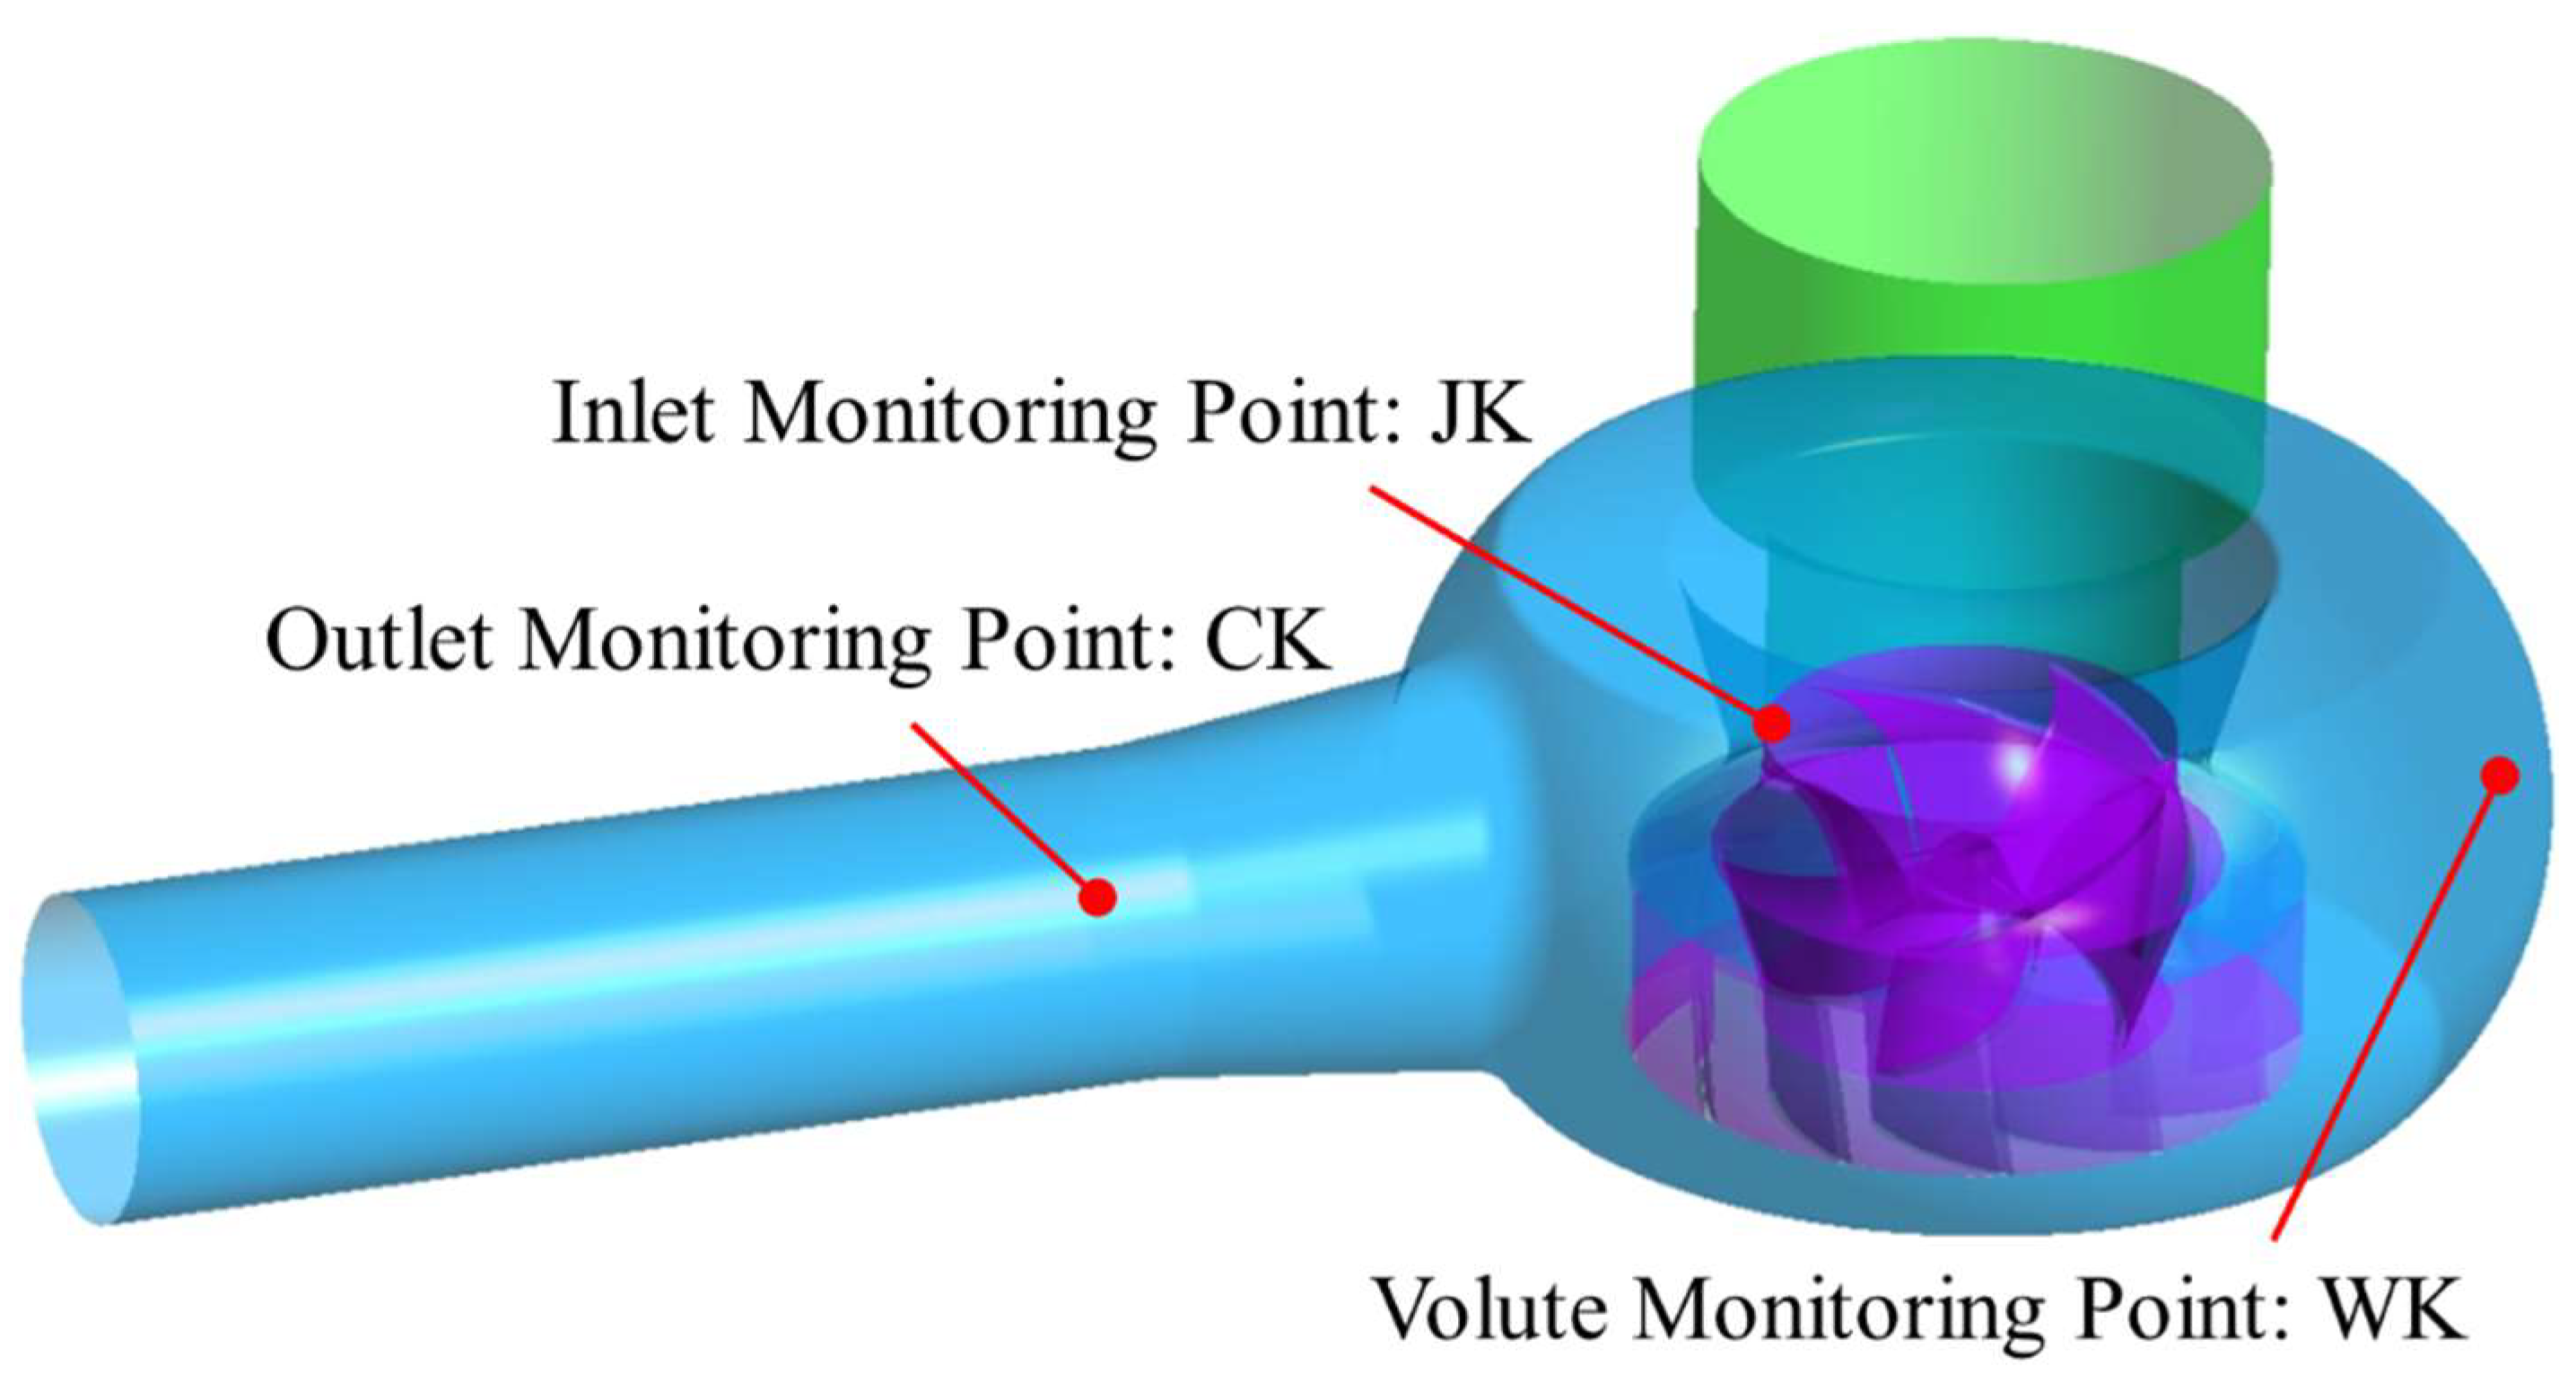
Figure 9 illustrates the layout of pressure fluctuation monitoring points for analyzing pressure pulsation inside the pump. Three measuring points are arranged separately at the impeller inlet, volute and volute outlet, and numerical simulations are carried out under three flow rates: 0.7 Qd, 1.0 Qd, and 1.2 Qd. The formula for calculating pressure pulsation is as follows:
Δ H = ( P max P min ) / ρ g
where Pmax represents the maximum pressure value, Pa; Pmin represents the minimum pressure value, Pa.
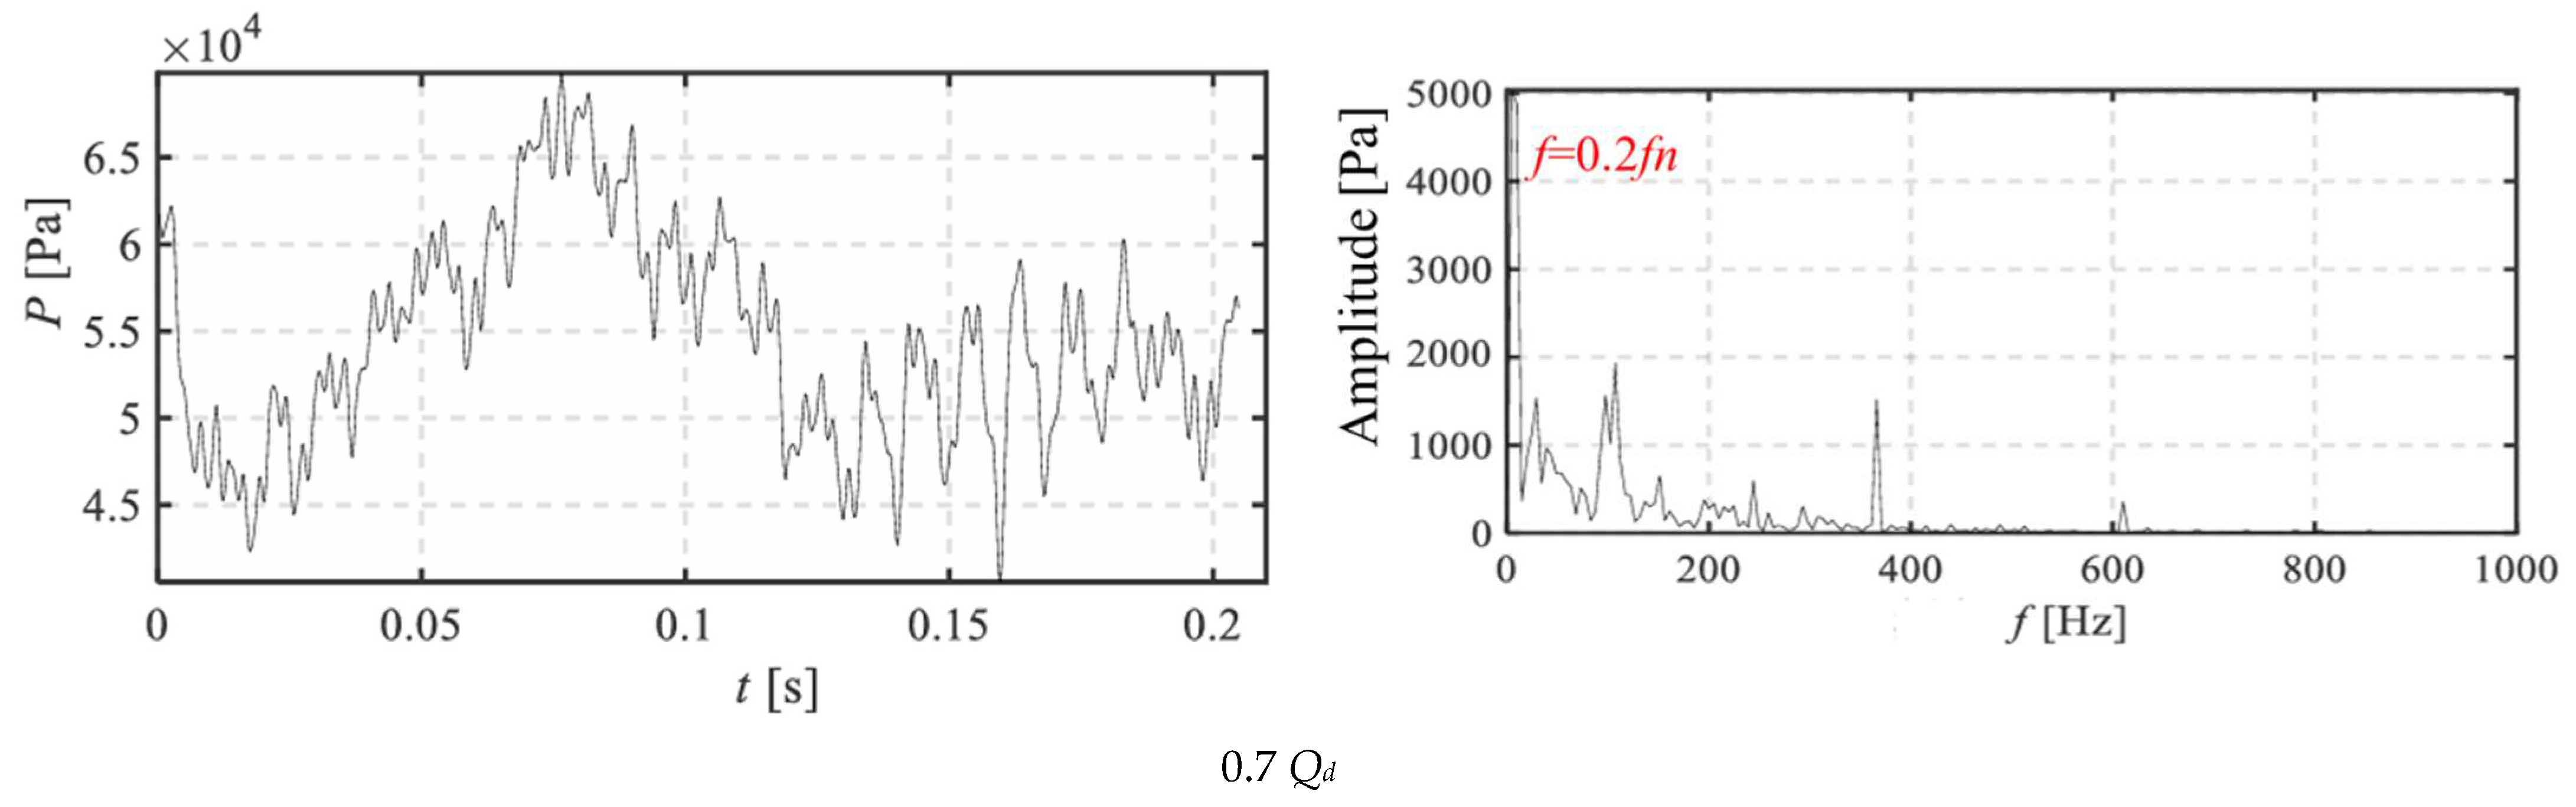
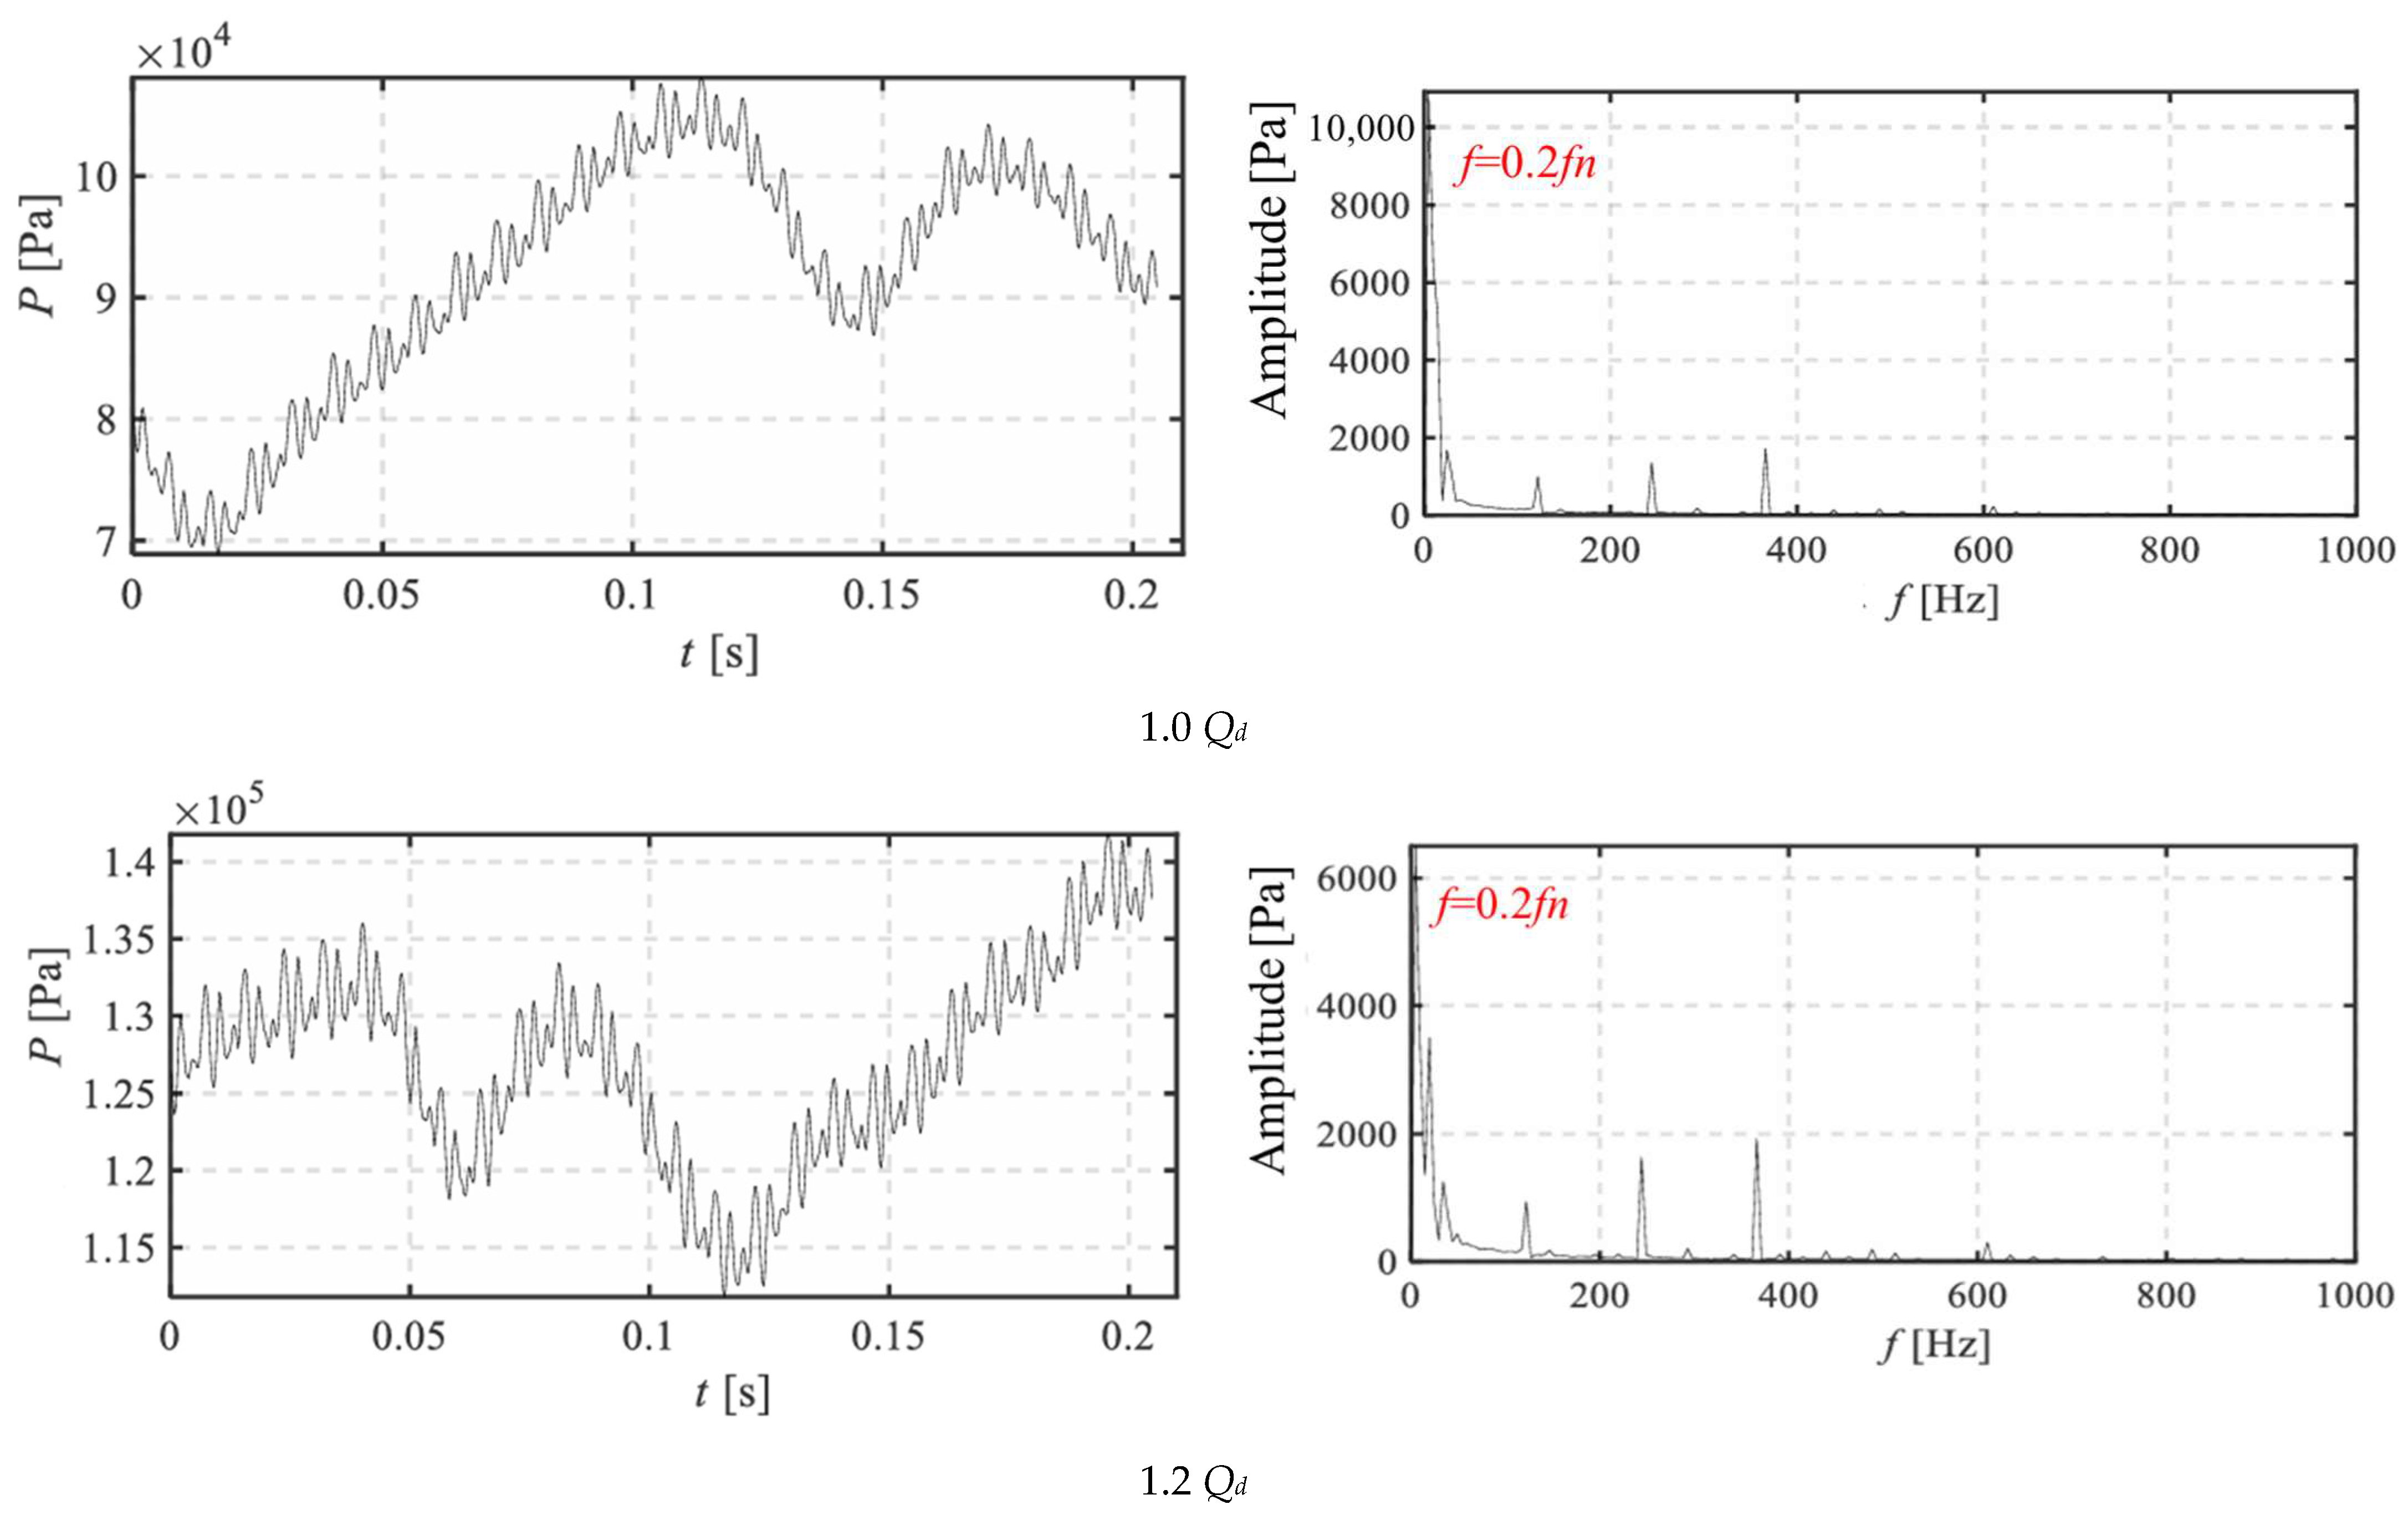
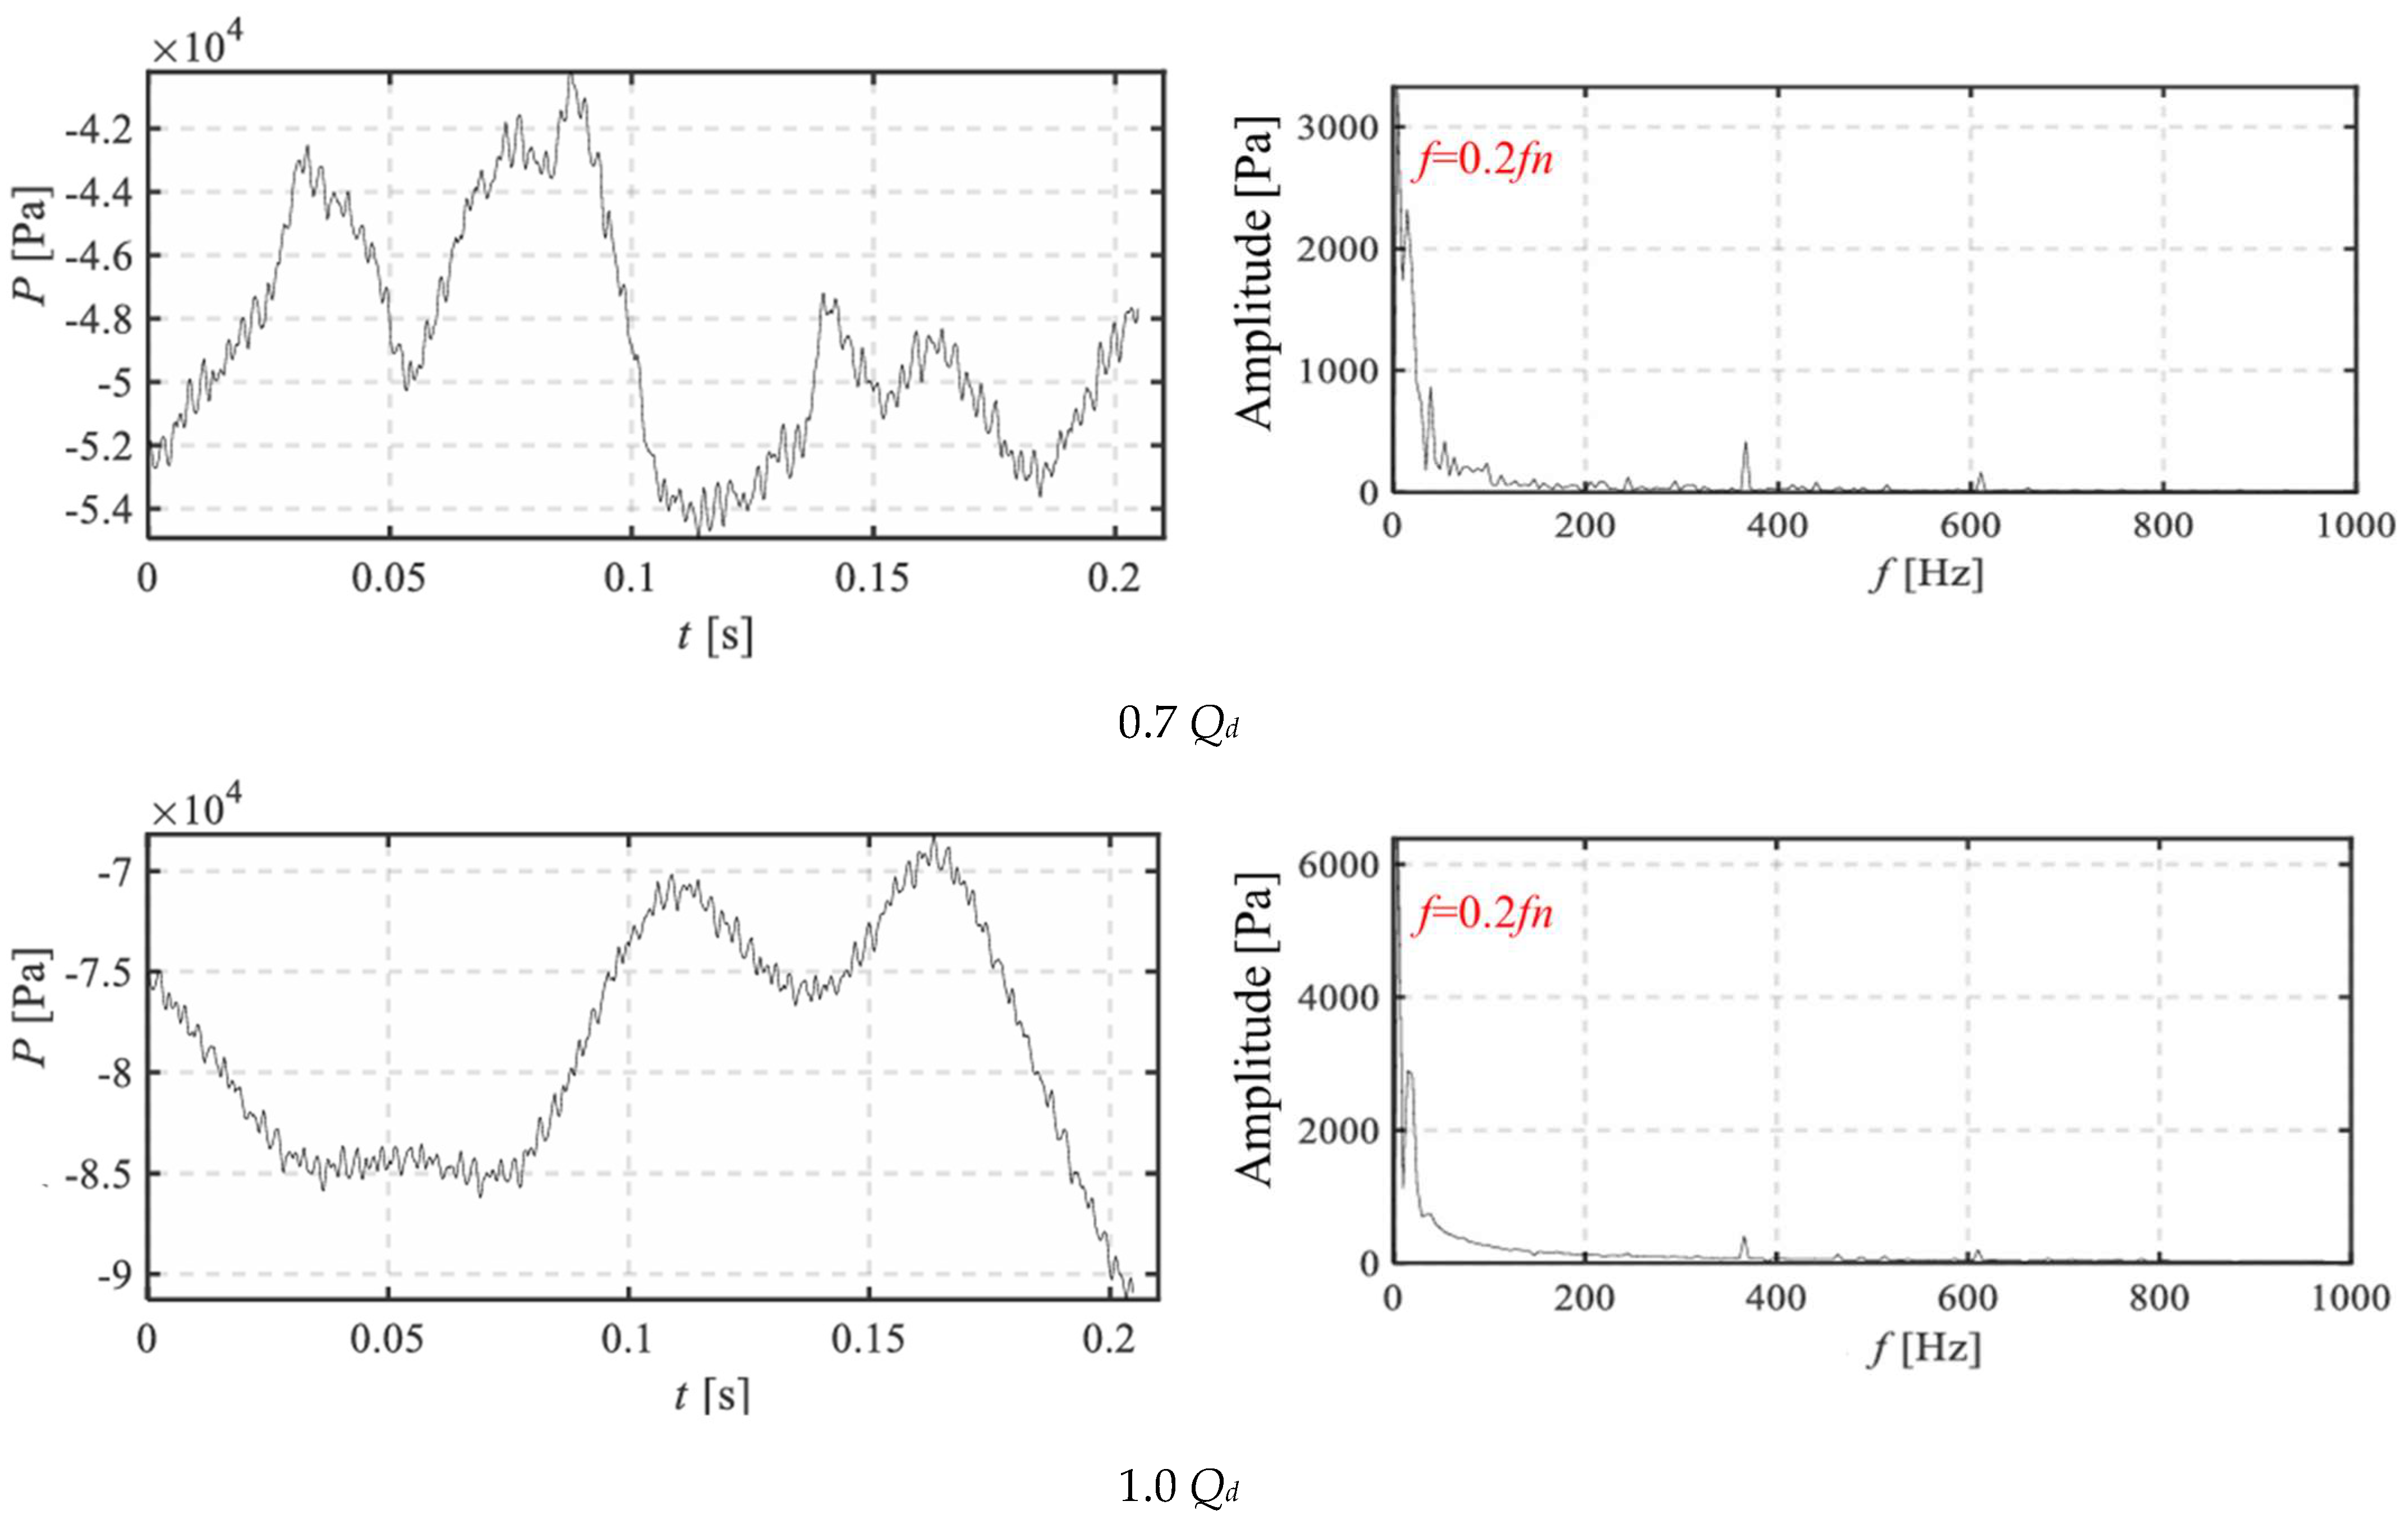
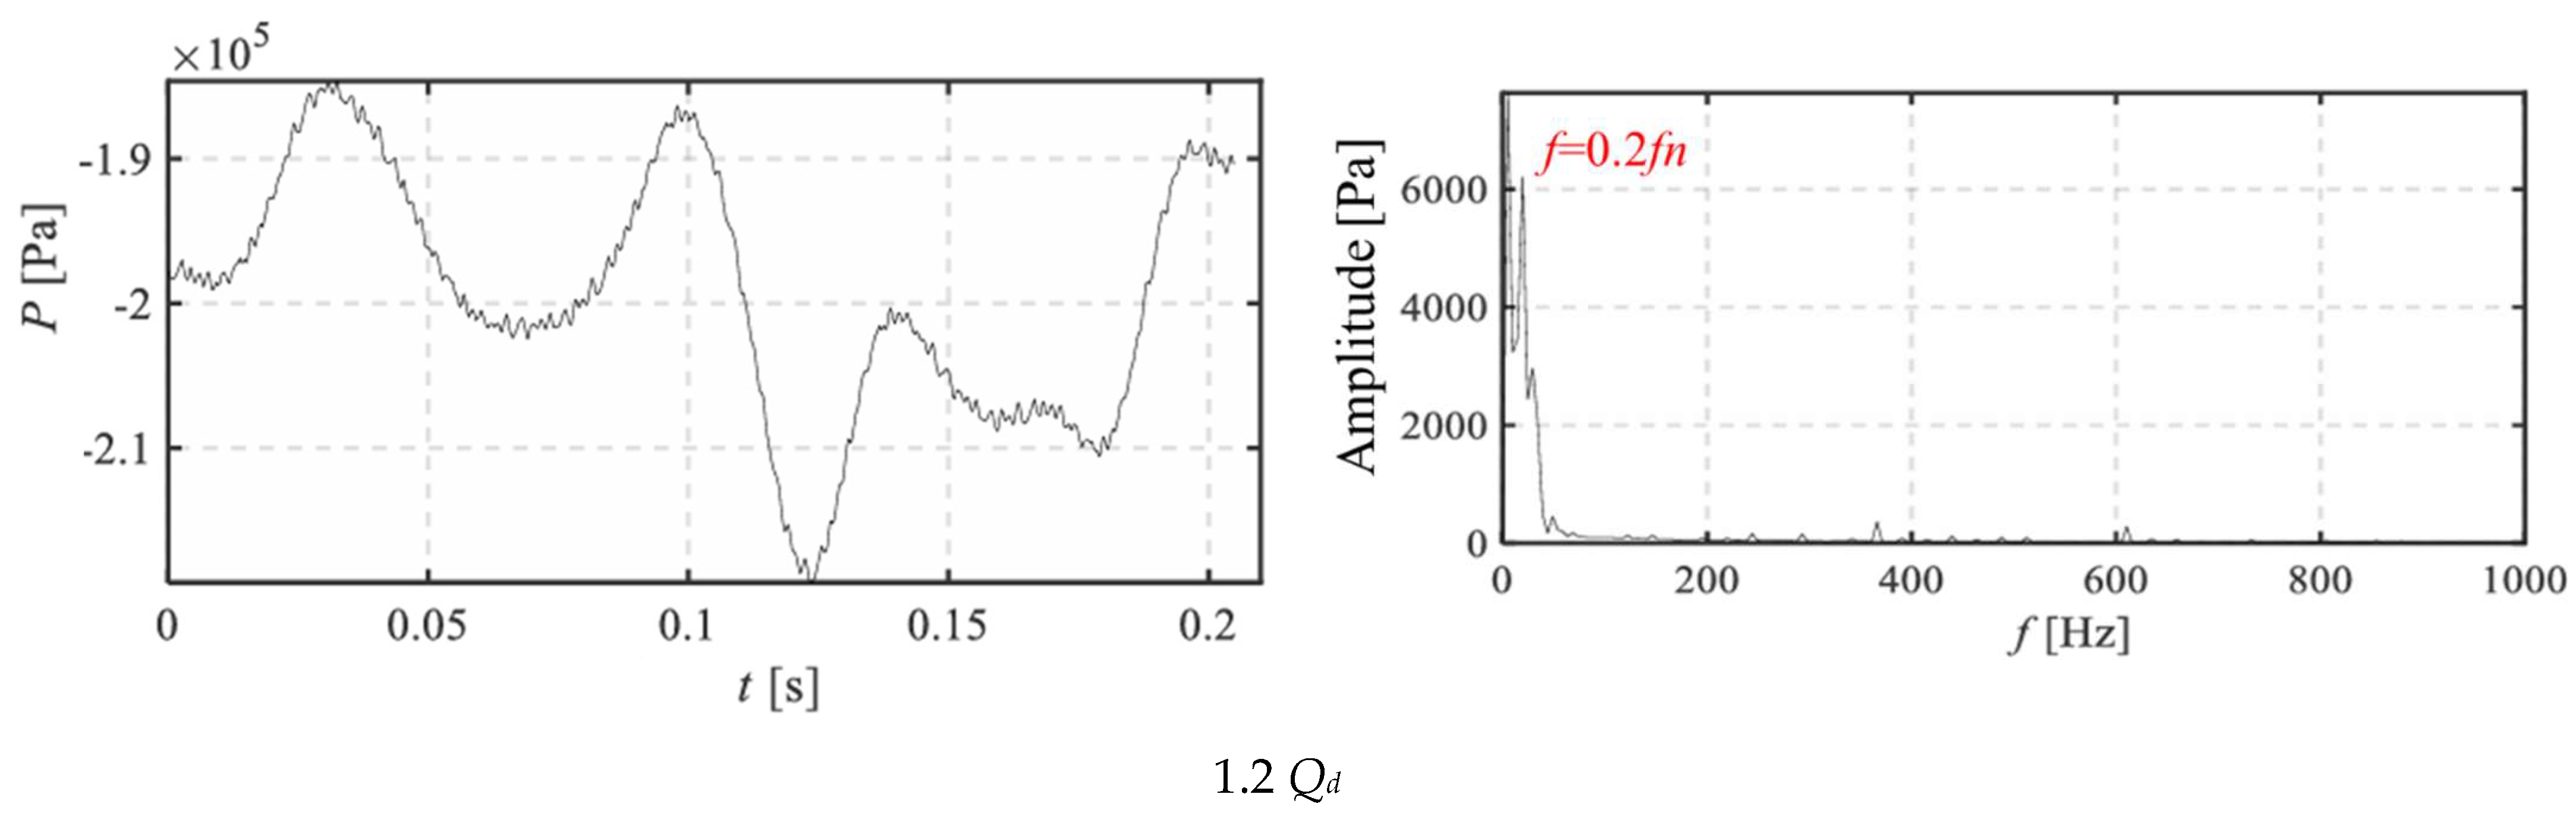
As Figure 10, Figure 11 and Figure 12 show, for the monitoring point JK at the inlet of the impeller, the maximum pulsation amplitude is 0.7 Qd, with a relative pulsation value of △H/Hd = 7.62%; 1.0 Qd has the minimum value, at 4.83%; 1.2 Qd has a value of 6.49%, and the dynamic and static interference is the strongest at low flow rates. From the monitoring point WK in the volute area, the pulsation amplitude of 1.0 Qd is the largest, at 7.09%; 0.7 Qd and 1.2 Qd are 5.13% and 5.42%, respectively, and the stay vane’s rectification effect is more significant in the rated condition, with more prominent pressure fluctuations. For the monitoring point CK in the volute outlet area, the overall pressure pulsation amplitude is the lowest, and it increases with the increase in flow rate. 0.7 Qd is only 1.88%, 1.0 Qd is 3.13%, and 1.2 Qd reaches 6.27%. The pressure pulsation in the volute is most significantly affected by the flow rate. The detailed results are shown in Table 3. From the frequency domain results, the main frequencies of the inlet and volute pressure pulsations are both the blade passage frequency (fb), and there are low-frequency pressure pulsation components. In addition, the volute also has harmonic components; The dominant frequency of pressure pulsation at the outlet is a low frequency of 0.2 fn.
Under 1.0 Qd, the inflow angle of the impeller outlet perfectly matches the stay vane inlet angle; the mainstream flow is concentrated through the stay vane channel without separation, and the rotor–stator interference effect between five blades and 13 stay vanes is fully excited without flow separation damping, leading to the maximum pressure fluctuation amplitude at the stay vane monitoring point. Under off-design conditions, flow separation forms a low-speed wake to suppress partial pulsation amplitude.
Low-frequency dominant component at impeller outlet 0.2 fn: This low frequency originates from the periodic asymmetric vortex shedding at the impeller outlet shroud under rotating action, which is a large-scale vortex unsteady characteristic frequency, independent of blade passing frequency. A detailed vortex evolution nephogram is supplemented to support this explanation.

4.4. Analysis of the Strength of the Impeller

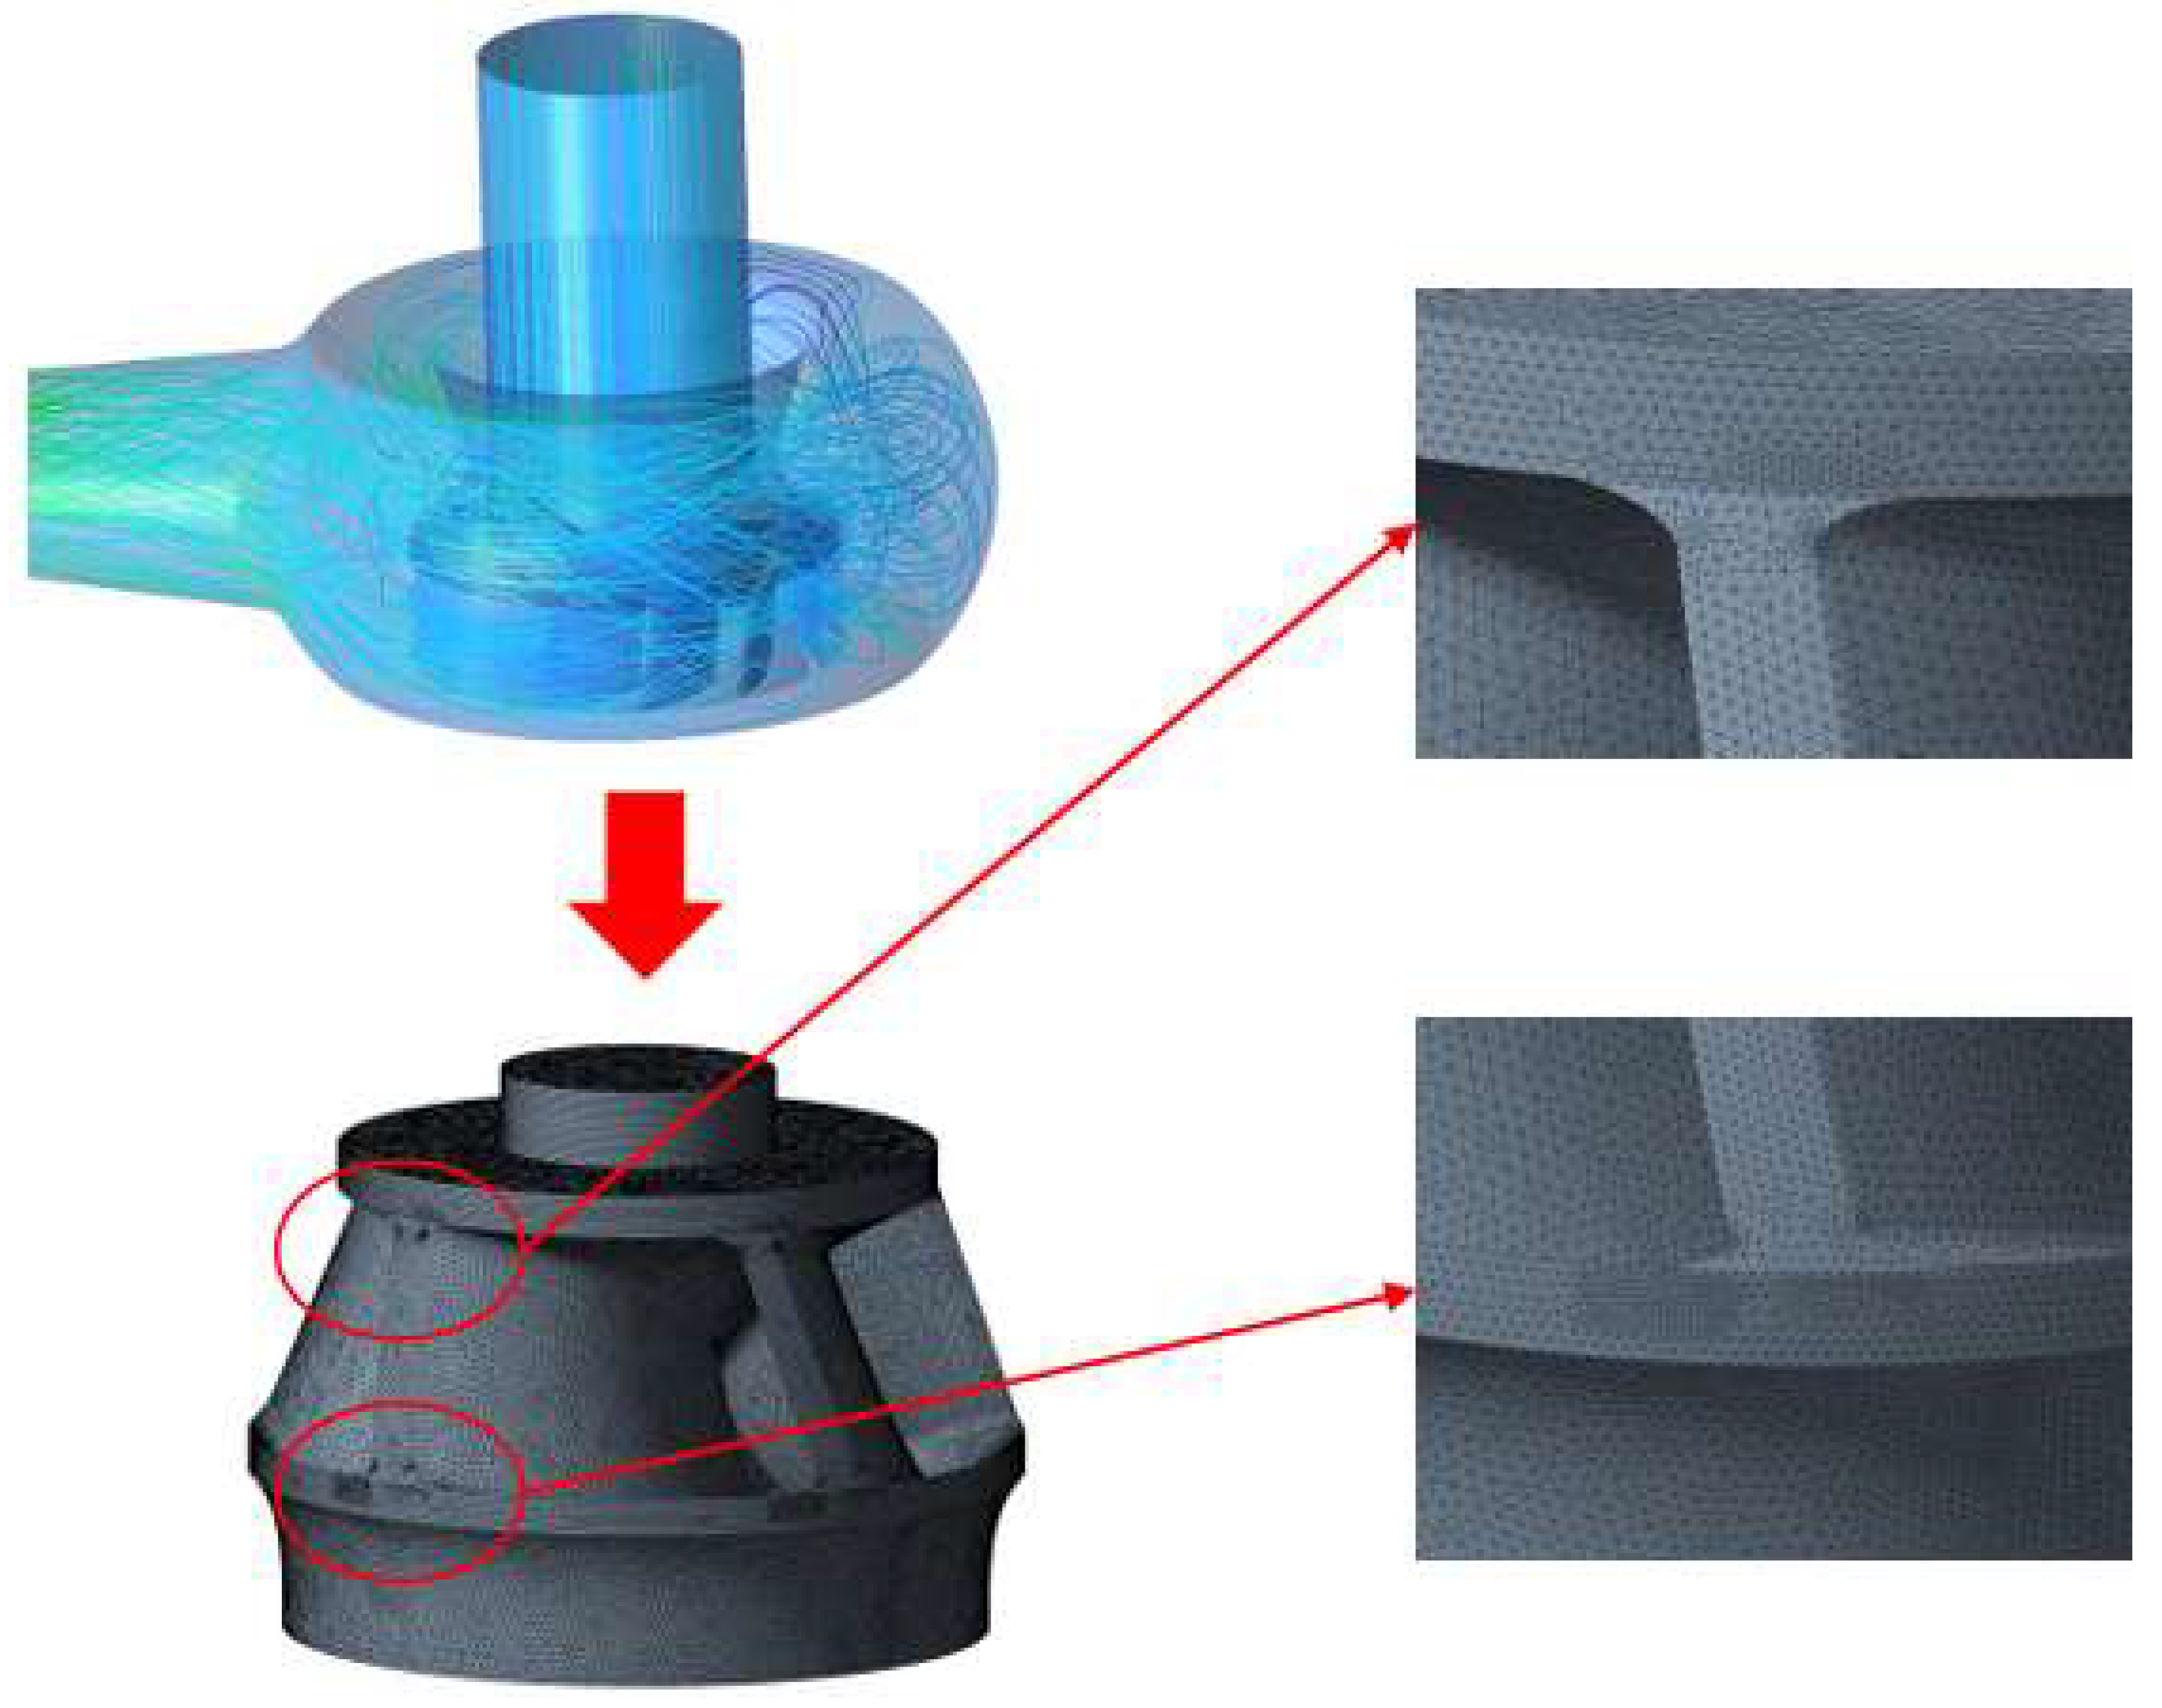
Separate three-dimensional geometric models are constructed for the flow field and impeller structural field calculations in this work. The computational domains for the impeller body structure field and the internal flow field of the impeller are simultaneously meshed, ensuring that the grid nodes at the interface between fluid and solid correspond one-to-one, thereby guaranteeing the accurate transfer of pressure loads at the fluid–solid interface. The meshes and computational domains for flow field calculation and structure field calculation are shown in Figure 13.
The fluid–structure interaction setup for impeller strength evaluation is detailed as follows. The structural domain model consists solely of the pump impeller. A fixed constraint is imposed on the hub-shaft joint surface as the structural boundary condition. Two types of loads are applied to the impeller: inertial loads and surface loads. Inertial loads include impeller self-weight and rotational inertial effects corresponding to a rotational speed of 1465 rpm. Surface loads refer to fluid pressure distributed on FSI interfaces, which are extracted and mapped from preceding CFD flow field solutions.
In the calculation of the impeller structure field, the material property of the impeller is set as steel, and its impeller material parameters are as shown in Table 4.
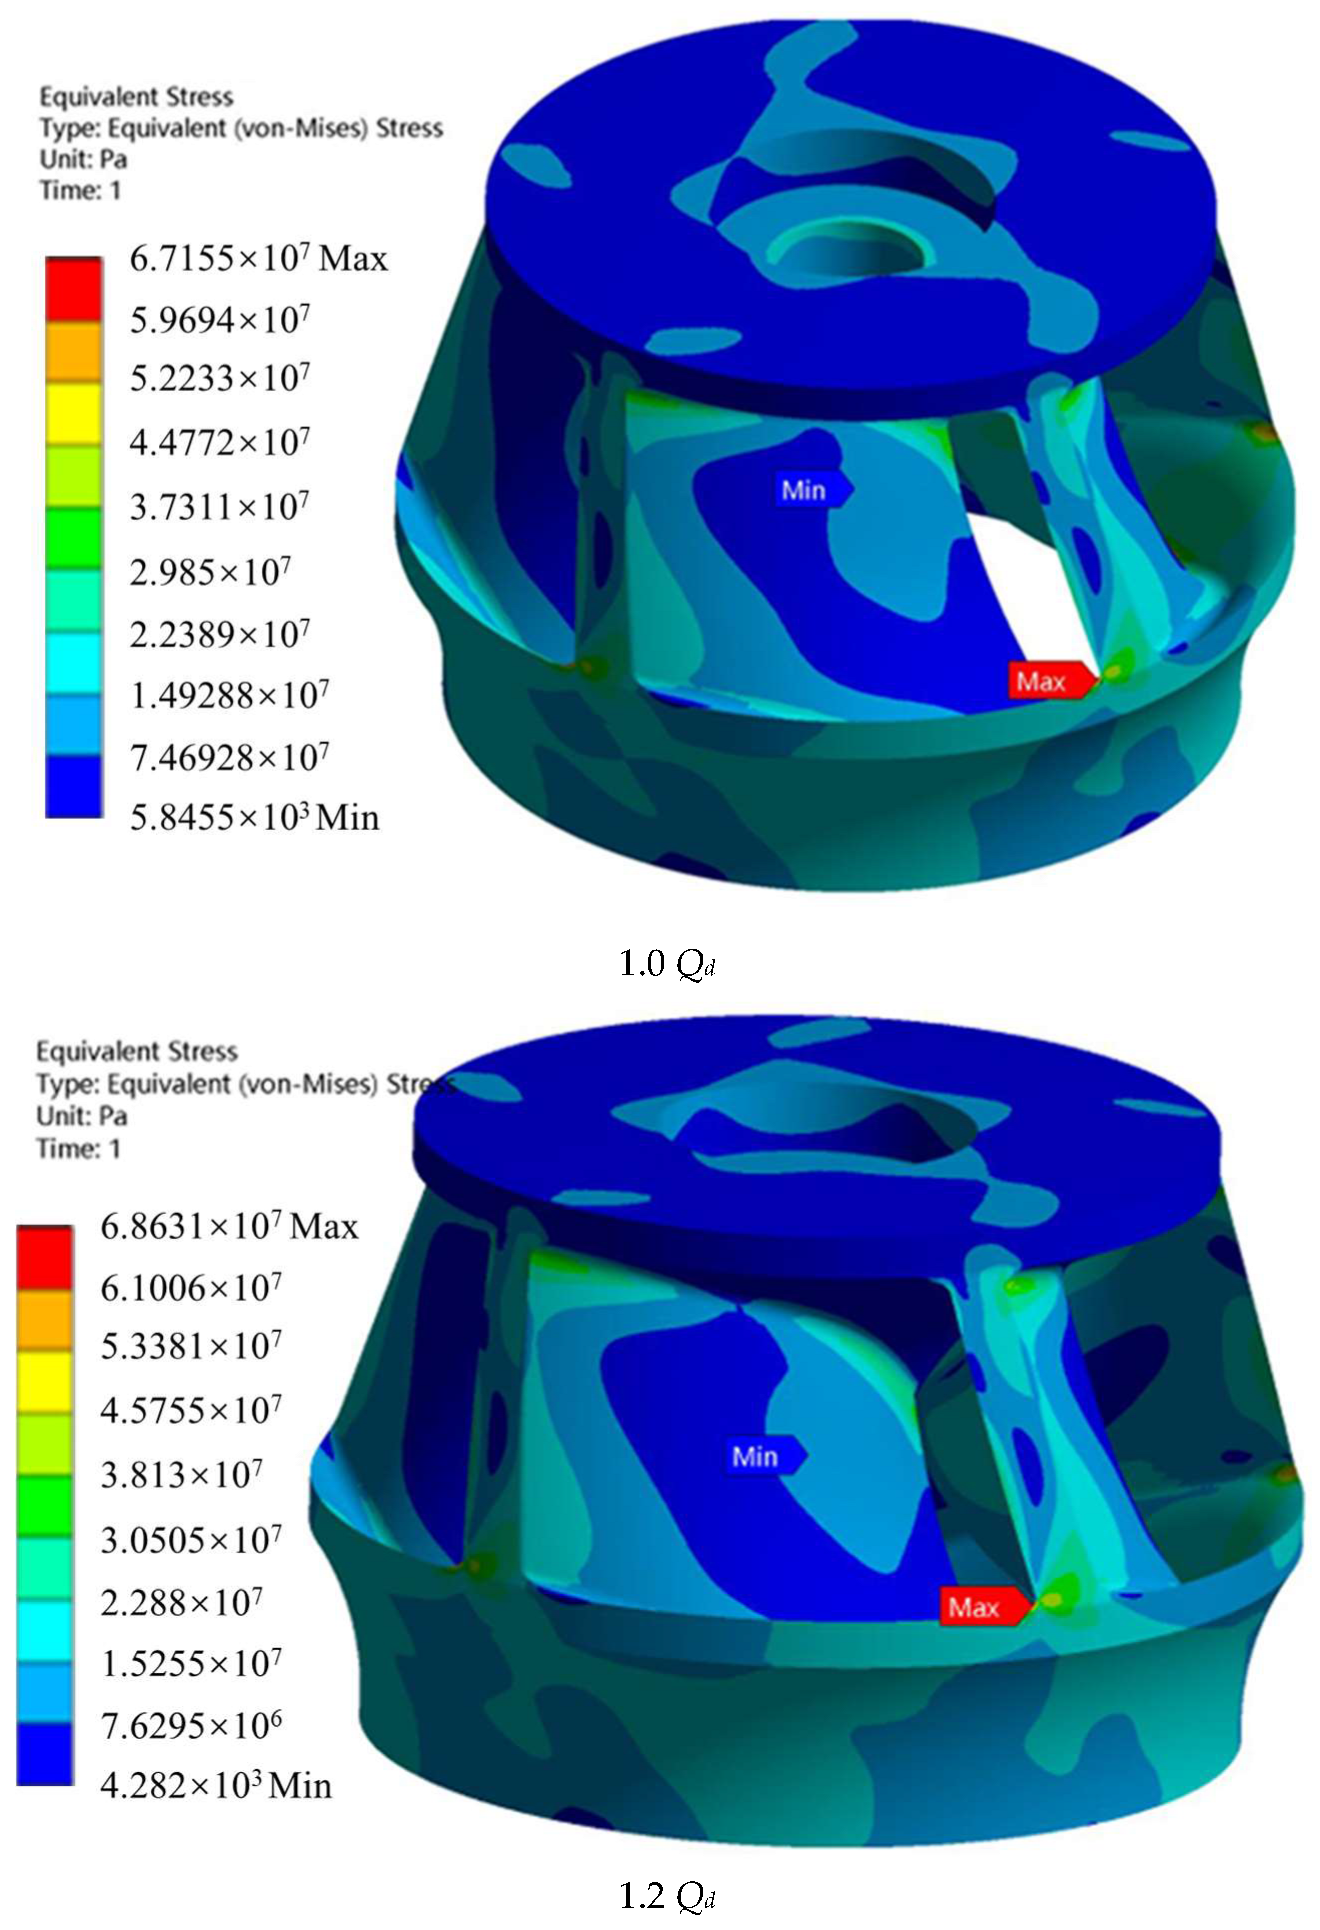
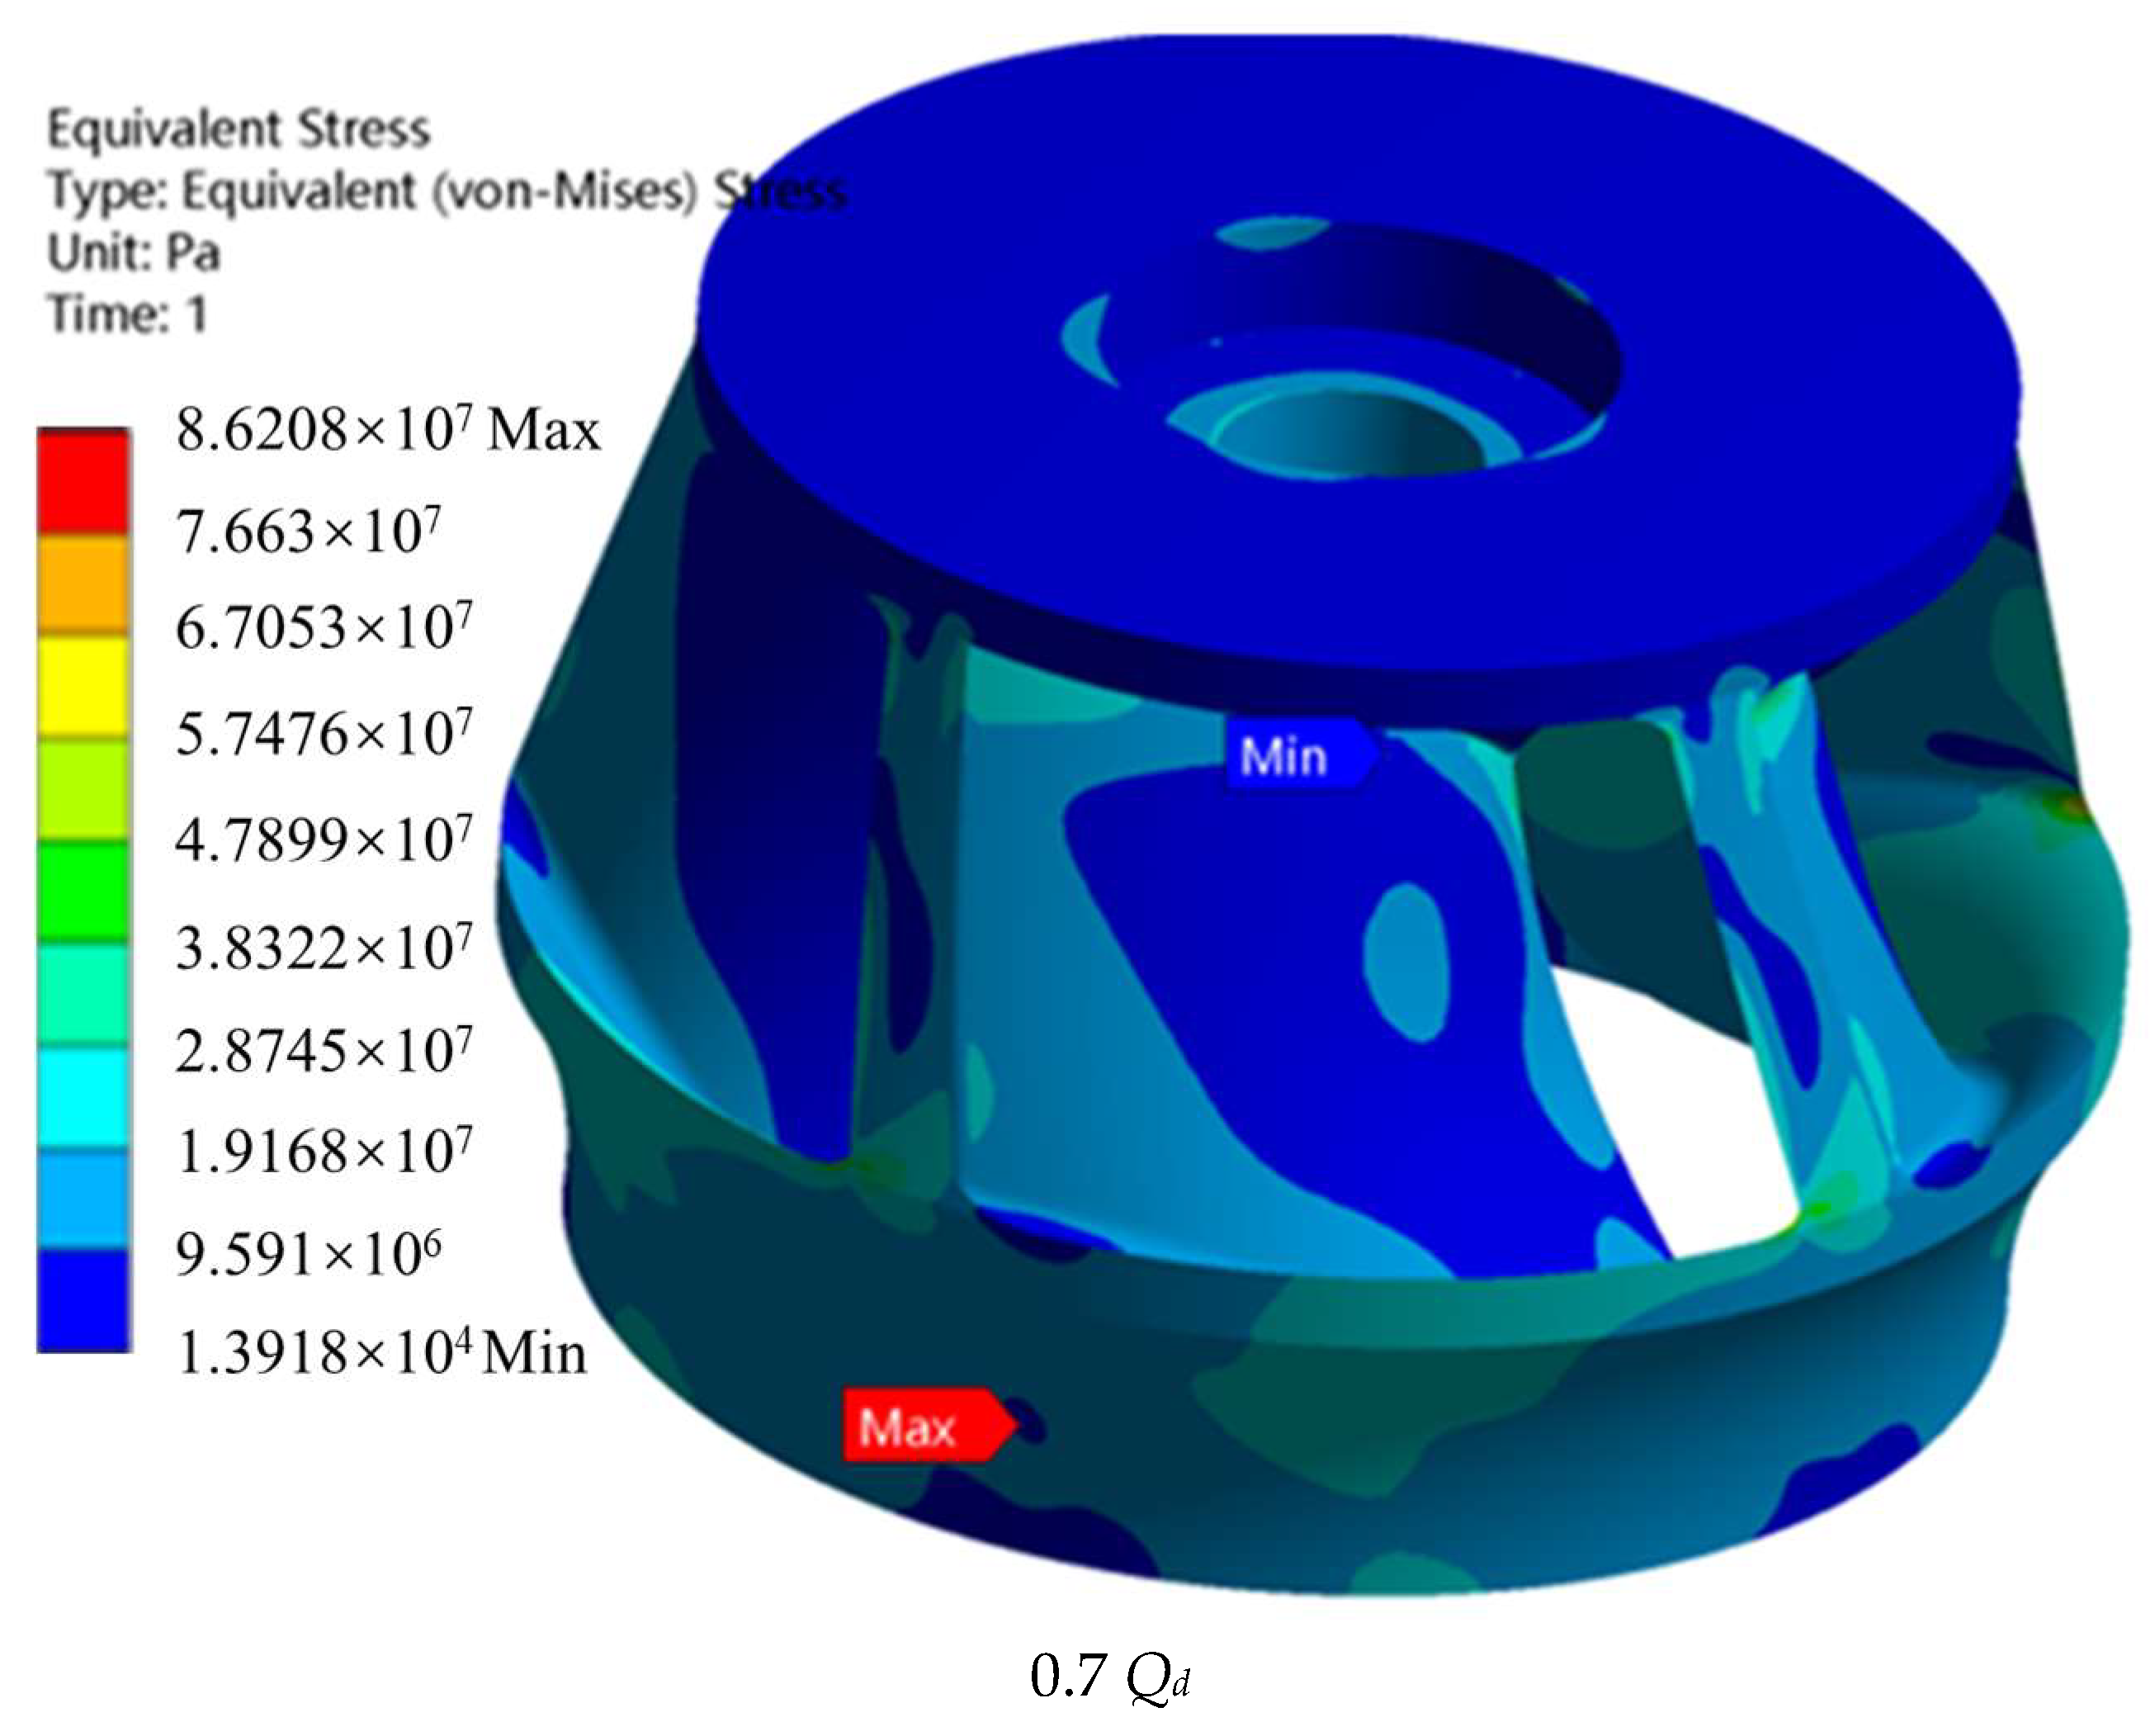
The strength of the impeller was evaluated through fluid–solid coupling, and the result is shown in Figure 14. It can be observed from the figure that the maximum equivalent stress reaches 86.3 MPa under the low-flow condition, emerging at the junction of blade roots and the hub where severe stress concentration occurs. Under the design flow condition, the maximum equivalent stress decreases to 67.1 MPa, accompanied by uniform stress distribution without prominent high-stress regions, which corresponds to the optimal structural safety performance. At the high flow rate condition, the maximum equivalent stress is 68.6 MPa, slightly higher than the rated condition, and the range of high-stress areas expands slightly. Overall, the maximum stress of the impeller is all less than 100 MPa, meeting the requirements of engineering applications. Detailed data can be found in Table 5.
The material yield strength of steel is supplemented (σs = 235 MPa); the safety factor under each working condition is calculated (n0.7 Qd = 2.72, n1.0 Qd = 3.50, n1.2 Qd = 3.43). The formula for calculating the safety factor is as follows:
n = σ s / S max
where σs is the material yield strength of steel, Smax is the maximum equivalent stress.
All safety factors exceed the minimum allowable value of 1.5 for pump impellers. The maximum stress occurs at the blade root; the low-flow condition has the highest stress and pulsation amplitude, which is the critical fatigue control condition for long-term operation;
This paper adopts one-way fluid–structure coupling, i.e., CFD flow field pressure load is transmitted to the structural solver, and structural deformation feedback to the flow field is ignored. From a large number of studies on unidirectional and bidirectional fluid–solid coupling, it can be known that the deformation of the structural steel impeller blades has a very weak impact on the flow field. Therefore, using unidirectional fluid–solid coupling can meet the engineering requirements.

5. Conclusions

This paper mainly investigates the internal flow characteristics of a mixed-flow chemical pump equipped with guide vanes and conducts strength analysis on its impeller. The three main conclusions are summarized as follows:
  • Under the rated operating condition of 1.0 Qd, the internal flow presents uniform streamlines without flow separation or backflow. The velocity and pressure distribution are uniform, and the energy conversion efficiency is the highest. At a low flow rate of 0.7 Qd, backflow, flow separation and secondary flow are prone to occur, resulting in a significant increase in hydraulic loss. At a high flow rate of 1.2 Qd, the flow velocity is too high and local turbulence dissipation is enhanced. The rated operating condition is the optimal operating range for this pump.
  • Flow rate exerts a remarkable impact on impeller radial force and pressure pulsation. The impeller radial force and outlet pressure fluctuation reach the maximum under low-flow conditions, while the force remains the most stable with minimal pulsation at the design operating point. The dominant frequency of pressure pulsation is primarily governed by the blade passing frequency. Pressure fluctuation intensity peaks at the impeller outlet and attains the minimum within the volute. The amplitude of pressure pulsation in the volute rises considerably under large-flow conditions.
  • The maximum equivalent stress of the blade appears at the junction of the blade root and hub. The stress is the highest under the low-flow condition (86.3 MPa) and the lowest under the rated condition (67.1 MPa). The maximum stress in all three conditions is less than the allowable stress, meeting the structural safety requirements. The low-flow condition is the key control condition for the strength and fatigue design of the impeller.
Some suggestions are proposed for the design of the energy recovery vane-type chemical pump to avoid long-term operation at low flow rates, and to reduce stress concentration at the root of the blades and pressure pulsation. Reasonably match the number of impeller blades and stay vanes to suppress the vibration caused by dynamic-static interference. Optimize the round corners at the root of the blades to reduce the stress concentration coefficient.

Author Contributions

Conceptualization, B.X.; Methodology, B.X.; Investigation, S.L.; Resources, S.L.; Data curation, G.W.; Writing—original draft, J.L.; Writing—review and editing, R.X. and K.L.; Project administration, G.W. and K.L.; Funding acquisition, R.X. and K.L. All authors have read and agreed to the published version of the manuscript.

Funding

National Natural Science Foundation of China, grant number U24B20109.

Data Availability Statement

The raw data supporting the conclusions of this article will be made available by the authors on request.

Acknowledgments

The authors would like to acknowledge the financial support of the National Natural Science Foundation of China, grant number U24B20109.

Conflicts of Interest

Authors Baiyang Xiao, Shaobin Li, Guangyan Wu, and Kun Lin were employed by the company Dongfang Electric Machinery Co., Ltd. The remaining authors declare that the research was conducted in the absence of any commercial or financial relationships that could be construed as a potential conflict of interest.

References

  1. Wang, R.; Wang, L.; Cai, J.; Du, S.; Hu, B.; Pan, Q.W.; Jiang, L.; Xu, Z. Research Status and Trends on Industrial Heat Pump and Network Utilization of Waste Heat. J. Refrig. 2017, 38, 1–10. [Google Scholar]
  2. Falter, C.; Pitz-Paal, R. Energy analysis of solar thermochemical fuel production pathway with a focus on waste heat recuperation and vacuum generation. Sol. Energy 2019, 176, 230–240. [Google Scholar]
  3. Wang, X.; Li, T.; Yu, Y.Y.; Mao, Q.; Liu, X.; Xu, C.; Li, G. Comprehensive analysis of a novel sustainable photovoltaic/thermal assisted ground source heat pump system with energy storage. J. Energy Storage 2024, 102, 14161. [Google Scholar] [CrossRef] [Scilit]
  4. Pellegrini, C.; Pedrera-Yanes, J.; Llanes-Santiago, O.; Vilalta-Alonso, G. A preliminary investigation on the operational efficiency of centrifugal pumps operating in single-branch, single-pump systems. J. Braz. Soc. Mech. Sci. Eng. 2024, 43, 151. [Google Scholar]
  5. Su, Y.; Chen, L.; Ge, Y.; Feng, H. Efficient ecological function optimization for endoreversible Carnot heat pumps. J. Non-Equilib. Thermodyn. 2025, 50, 231–239. [Google Scholar] [CrossRef] [Scilit]
  6. Bai, T.; Yao, Y.; Hu, B.; Feng, J.; Jin, Z. Thermodynamic analysis of exhaust waste heat recovery in a compound open absorption heat pump system. Appl. Therm. Eng. 2024, 257, 124387. [Google Scholar] [CrossRef] [Scilit]
  7. Zhou, T.; Zhu, Y.; Tang, S.N. Scale effect for hydraulic model of a mixed flow nuclear main pump. Nucl. Eng. Technol. 2025, 57, 103137. [Google Scholar] [CrossRef] [Scilit]
  8. Radosavljević, M.; Petrović, R.; Žeželj, B.; Belović, D.; Cvejić, S. Mathematical Modeling and Experimental Tests of Working Parameters of Piston-Radial Pumps in Hydraulic Systems of Mobile Machines. Appl. Sci. 2024, 14, 9979. [Google Scholar] [CrossRef] [Scilit]
  9. Yu, B.; Chen, G.; Liu, K.; Yan, G.; Zhang, Y.; Liu, Y. Research on the Maximum Regenerative Energy Commutation Control Strategy of a Dual-Mode Synergistic Energy Recovery Pump-Controlled Grinder. Energies 2025, 18, 2622. [Google Scholar] [CrossRef] [Scilit]
  10. Ye, Z.; Zeng, Z.; Lei, C.; Zhao, Y.; Pang, Y. Analysis of Operating Performance Parameters of the Internal Twin Screw Pump. Iran. J. Sci. Technol.-Trans. Mech. Eng. 2024, 48, 957–970. [Google Scholar]
  11. Konishi, T.; Hirano, Y.; Nishi, Y. Hydraulic Loss and Internal Flow of a Pump Equipped with an Impeller with Radial and Annular Flow Channels. Int. J. Fluid Mach. Syst. 2023, 16, 53–72. [Google Scholar] [CrossRef] [Scilit]
  12. Cai, L.; Xu, Y.; Long, Y.; Zhou, Z.; Zhu, R.; Yuan, S. Numerical simulation and experiment on internal flow characteristics of axial-flow nuclear reactor coolant pump. J. Drain. Irrig. Mach. Eng. 2024, 42, 1189–1195. [Google Scholar]
  13. Heng, Y.; Chen, Z.; Jiang, Q.; Bois, G.; Zhang, W. Internal flow visualization and performance characteristics of a disc pump under gas-liquid two-phase flow conditions. Energy 2025, 333, 137480. [Google Scholar] [CrossRef] [Scilit]
  14. Chen, X.; Cui, Y.; Zheng, Y.; Zhang, Y. Fatigue crack propagation simulation of vertical centrifugal pump runner using the extended finite element method. Mech. Adv. Mater. Struct. 2023, 31, 4586–4600. [Google Scholar] [CrossRef] [Scilit]
  15. Yan, D.; Zhang, C.; Wang, C.; Zhang, T.; Sun, F. Vibrational Analysis and Optimization of a Water Injection Pipeline in a High-pressure Plunger Pump. J. Appl. Fluid Mech. 2024, 17, 487–496. [Google Scholar] [CrossRef] [Scilit]
  16. Lu, J.; Yao, X.; Zheng, H.; Yan, X.; Liu, H.; Wu, T. Analysis of Unsteady Internal Flow and Its Induced Structural Response in a Circulating Water Pump. Water 2024, 16, 1294. [Google Scholar] [CrossRef] [Scilit]
  17. Zhang, Z.; Gong, B.; Chen, T.; Li, N.; Jin, Y.; Jiang, H.; Zhao, J.; Li, K. Flow induced acoustic characteristics analysis of propulsion pump by indirect acoustic variable method and FEM. Ocean Eng. 2024, 312, 119478. [Google Scholar] [CrossRef] [Scilit]
  18. Mathieu, J. An Introduction to Turbulent Flow; Cambridge University Press: Cambridge, UK, 2000. [Google Scholar]
  19. Zhao, H.; Zhu, B.; Jiang, B. Comprehensive assessment and analysis of cavitation scale effects on energy conversion and stability in pumped hydro energy storage units. Energy Convers. Manag. 2024, 325, 119370. [Google Scholar] [CrossRef] [Scilit]
  20. Zhao, H.; Zhu, B.; Wang, C.; Han, Y. A prospective assessment of vortex evolution mechanisms and pressure fluctuation coupling in novel low-head pumped hydro energy storage units. Energy Convers. Manag. 2025, 342, 120136. [Google Scholar] [CrossRef] [Scilit]
  21. Zhao, H.; Zhu, B.; Xu, R.; Tan, L.; Zhang, H.; Chen, L.; Liu, Z.; Yang, J.; Deng, F. Evaluating the predictive potential of modeling frameworks for Pelton turbine energy performance and guiding engineering modeling in hydroelectric applications. Energy 2025, 330, 136861. [Google Scholar] [CrossRef] [Scilit]
  22. Lu, J.; Li, F.; Tao, R.; Yao, Z.; Xiao, R.; Liang, Q.; Liu, W. Nonlinear stability analysis of the transient startup process of the turbine mode of pumped storage unit under different control strategies. Energy Convers. Manag. 2026, 359, 121546. [Google Scholar] [CrossRef] [Scilit]
  23. Lu, J.; Tang, Y.; Tao, R.; Zhu, D.; Yao, Z.; Xiao, R.; Wang, F.; Liang, Q.; Liu, W. Research on the dynamic evolution law of the transient process of pump mode shutdown in pump-turbine. J. Energy Storage 2026, 156, 121615. [Google Scholar] [CrossRef] [Scilit]
  24. Lu, J.; Tao, R.; Yao, Z.; Xiao, R.; Liu, W. Transient simulation energy study of fast opening of guide vane during start-up of pump turbine in energy storage mode. Energy 2025, 324, 135964. [Google Scholar] [CrossRef] [Scilit]
  25. Lu, J.; Han, X.; Tao, R.; Xiao, R.; Liang, Q. Research on transient performance changes during the non-simultaneous opening process of guide vanes in reversible pump-turbine units in pump mode. Energy 2025, 335, 138331. [Google Scholar] [CrossRef] [Scilit]
  26. Stanojević, M.; Milojević, S.; Marić, D.; Stojanović, B. Influence of Gears and Oil Levels Upon Efficiency of Ravigneaux Gearset. Teh. Vjesn. 2025, 32, 2048–2055. [Google Scholar] [CrossRef] [Scilit]
Figure 1. Overall model diagram of the pump unit.
Energies 19 03471 g001
Figure 2. Impeller stay vane flow channel diagram and its dimensions.
Energies 19 03471 g002
Figure 3. Grid independence check.
Energies 19 03471 g003
Figure 4. Pump unit grid diagram.
Energies 19 03471 g004
Figure 5. Comparison of experimental and numerical simulation performance.
Energies 19 03471 g005
Figure 6. Schematic diagram of flow field analysis position.
Energies 19 03471 g006
Figure 7. Pressure and Velocity contour maps of the pump unit under different operating conditions.
Energies 19 03471 g007
Figure 8. Time–frequency domain diagrams of radial forces under different working conditions.
Energies 19 03471 g008aEnergies 19 03471 g008bEnergies 19 03471 g008c
Figure 9. Pressure pulsation monitoring point location diagram.
Energies 19 03471 g009
Figure 10. Time–frequency domain diagrams of JK pressure pulsation signals under different working conditions.
Energies 19 03471 g010
Figure 11. Time–frequency domain diagrams of WK pressure pulsation signals under different working conditions.
Energies 19 03471 g011aEnergies 19 03471 g011b
Figure 12. Time–frequency spectra of pressure fluctuation signals at monitoring point CK under various operating conditions.
Energies 19 03471 g012aEnergies 19 03471 g012b
Figure 13. Flow–solid coupling process and schematic diagram of impeller structure grid.
Energies 19 03471 g013
Figure 14. Equivalent stress diagrams of the impeller under different operating conditions.
Energies 19 03471 g014aEnergies 19 03471 g014b
Table 1. Pump unit detailed parameter table.
ComponentsValueUnit
The diameter of Inlet D1550[mm]
The diameter near the shroud outlet edge D2662[mm]
The diameter near the hub outlet edge D3530[mm]
The height of the stay vanes outlet H2225[mm]
Rated impeller speed nr1465[rpm]
Design flow Qd12,000[m3/h]
Rated head Hr56.3[m]
Number of impeller blades Zimp5[−]
Number of stay vane blades Zsv13[−]
Table 2. Grid detailed parameter table.
ComponentMesh TypeElement Count
Inlet pipeHexahedral281,088
ImpellerTetrahedral1,965,011
Stay vaneTetrahedral1,376,869
VoluteTetrahedral1,881,143
Total 5,504,111
Table 3. Table of pressure fluctuation amplitudes at monitoring points for different operating conditions.
Monitoring PointsConditionHH/Hd
JK0.7 Qd4.2977.62
1.0 Qd2.7254.83
1.2 Qd3.6616.49
WK0.7 Qd2.8915.13
1.0 Qd3.9987.09
1.2 Qd3.0585.42
CK0.7 Qd1.0621.88
1.0 Qd1.7623.13
1.2 Qd3.5356.27
Table 4. Impeller material parameter table.
NameMaterialsElasticity Modulus
(N/mm2)
Density
(kg/m3)
Poisson Ratio
ShroudSteel2.1 × 1057.85 × 10−60.3
BladeSteel2.1 × 1057.85 × 10−60.3
HubSteel2.1 × 1057.85 × 10−60.3
Table 5. Impeller strength result parameters table.
ConditionsFlowrate (m3/h)Maximum Equivalent Stress (Mpa)
0.7 Qd840086.3
1.0 Qd12,00067.1
1.2 Qd14,40068.6
Disclaimer/Publisher’s Note: The statements, opinions and data contained in all publications are solely those of the individual author(s) and contributor(s) and not of MDPI and/or the editor(s). MDPI and/or the editor(s) disclaim responsibility for any injury to people or property resulting from any ideas, methods, instructions or products referred to in the content.