1. Introduction
Energy security is a core priority for policymakers, industrial stakeholders, and the general public [
1], and safeguarding a stable energy supply serves as a pivotal target for economies pursuing sustainable development [
2]. Historically, energy security has been closely linked to stable crude oil supply, as the global oil market remains susceptible to geopolitical risks originating from major oil-exporting economies [
3]. Three landmark crises, namely the 1973 Middle East conflict, the 1979 Iranian Islamic Revolution, and the 1990 Gulf War, all triggered sharp declines in crude output and severe global energy shortages. The late-2021 European energy crisis, by contrast, was driven mainly by surging coal prices; such a difference reveals that climate change and the global energy transition have evolved into core contributors to modern energy crises. Climate change has remained high on global policy agendas for decades and developed into one of the world’s most intricate systemic challenges [
4], whose far-reaching adverse outcomes impose tangible risks to global social systems, economies, and ecological environments [
5]. Fossil fuels account for more than 80% of global primary energy consumption, so extreme weather events may spark sudden spikes in global fossil fuel demand. Meanwhile, the global transition toward renewable energy has intensified uncertainty regarding future energy market prospects. Such market volatility weakens investor confidence, curbs expected returns on conventional fossil fuel investment, and raises the risk of supply disruptions caused by unforeseen shocks. Coal and oil remain indispensable foundational fuels supporting global economic operations [
6], accounting for 31.6% and 26.7% of worldwide energy consumption in 2022 as the two most widely consumed fossil fuels globally. Noticeable divergence exists in their trade layouts: coal trade concentrates within regional markets, while oil trade depends heavily on transoceanic maritime transportation. Nevertheless, geopolitical conflicts, decarbonization policies, and global business cycles jointly shape the evolution of both commodities. In this context, integrated analysis of coal and oil value networks can respond to the practical needs of contemporary global energy security governance amid intertwined geopolitical tensions, climate hazards, and low-carbon transitions, which makes targeted research on such value networks essential to safeguarding global energy security and macroeconomic stability.
Numerous existing studies have explored coal and oil trade networks against the backdrop of energy security. Network-based approaches provide robust evidence to unpack the evolutionary features of global commodity trade, rendering network investigation an indispensable tool for mapping the overall architecture of international trade systems [
7,
8]. A large body of research focuses on the dynamic evolution of global coal trade networks [
9], confirming the network’s scale-free property alongside growing competition among trading participants [
10,
11]. Related studies on crude oil trade networks identify inherent features, including structural stability, high integration, and evident hierarchical distribution [
12,
13], as well as typical small-world and scale-free topological attributes [
14]. Empirical findings further reveal that global oil trade activities are highly concentrated across ten core economies, where dominant importers and exporters substantially shape the trading behaviors of peripheral nations [
15,
16]. In summary, prior studies predominantly center on topological characteristics of coal and oil trade networks and the heterogeneous contributions of key trading economies to worldwide energy security.
Against deepening global value chain (GVC) fragmentation, cross-border value flows and bilateral trade linkages grow increasingly sophisticated and mutually interdependent [
17], which facilitates the development of value-added trade networks. Distinct from conventional gross trade networks, value-added statistics track income generated at segmented production stages; concretely, it quantifies domestic value contributed by indigenous production factors within exported goods instead of relying on total final shipment values. As documented in [
18], coal and oil value-added networks deliver more refined insights into global industrial layouts and cross-country competitiveness compared with traditional trade frameworks. Some economies seemingly occupying dominant export positions may actually generate minimal domestic value in their outbound shipments [
19]. Using value-added trade metrics eliminates pervasive double-counting biases in official trade statistics and objectively reflects each economy’s real production contribution within global energy value chains. Accordingly, this study focuses on constructing global value networks for coal and oil. The existing literature has explored value-added network evolution [
17,
20], concluding that most developing economies need to upgrade their trade standings and that a nation’s positional tier in value chains better proxies its core influence than its status in gross trade networks. Nevertheless, systematic empirical research targeting global coal and oil value networks remains scarce.
Unlike conventional energy security studies, which primarily address the safety and stability of the energy supply chain, energy resilience focuses on the system’s capacity to efficiently absorb, buffer, and recover rapidly from hazards. Therefore, the analysis of energy resilience is more closely aligned with the need for secure management after energy supply disruptions during the energy transition. Previous studies have primarily focused on evaluating the resilience of energy trading networks, with Folke et al. [
21] highlighting the importance of diversity in measuring resilience from the perspective of static resilience. Currently, more scholars are utilizing dynamic resilience measurement methods. For example, Ding et al. [
22] evaluated the resilience of China’s natural gas imports under both random and deliberate node failure modes using three indicators: accessibility, connectivity, and effectiveness. Using system dynamics (SD), Chen et al. [
23] established a resilience model for China’s energy system under 17 scenarios of long-term oil import shortages and concluded that this model is relatively resilient and more adept at managing prolonged oil import shortages. Yu et al. [
24] constructed a Data Envelopment Analysis (DEA) model using the three dimensions of absorption capacity, buffering capacity, and recovery capacity after attacking the nickel trade network to assess the resilience of the network.
The continuous extension of global energy value chains renders conventional gross trade accounting incapable of capturing real cross-border value flows and economic benefits accrued from energy transactions, which necessitates value-added decomposition under the global value chain (GVC) framework [
25]. Accordingly, value-added trade statistics have become a preferred analytical perspective to re-examine bilateral trade linkages across economies [
17]. Conventional trade statistics suffer from pervasive double-counting bias; consequently, resilience simulation based on gross trade volumes tends to identify critical network nodes merely from the perspective of transaction scale. Such practice fails to accurately characterize individual node competitiveness and systemic influence, which may bias empirical findings of energy resilience away from real-world situations. By contrast, value-added networks rely on domestic value creation data to quantify genuine gains generated by each economy in corresponding industrial sectors. This advantage enables value networks to depict industrial layouts more holistically and pinpoint core countries’ competitive edges and network influence with higher precision. Existing research highlights that unpacking evolutionary regularities of global value-added trade networks and simulating exogenous risk shocks are essential for improving developing economies’ positions in the global labor division and mitigating systemic network risks [
17]. Against such a backdrop, this study quantifies network resilience via targeted in silico node attacks. Different from traditional trade-based resilience, which focuses on the restoration of physical trade ties after risk disruptions, value network resilience tracks the recovery of domestic value-added creation capacity. Hence, value-based resilience better mirrors the post-shock recovery performance of national energy sectors, offering a refined measurement of energy resilience with stronger practical implications for global energy security governance.
In light of the global division of labour in coal and oil, it is essential to examine the following question: How has the network pattern of global coal and oil value networks evolved over the past 24 years? Which countries are the most competitive and influential in the global coal and oil value networks? Are there significant differences in the resilience levels of the global coal and oil value networks across different time periods? This study presents a directed, weighted global coal and oil value network to assess evolutionary characteristics at macro, meso, and micro levels over the past 24 years and evaluate the network’s resilience through simulated attacks. The influence of key countries is subsequently examined. Policy recommendations are then proposed to enhance the resilience of global value networks. Existing studies focus on value networks of other energy sources or commodities (e.g., natural gas, nickel) or only analyze the coal and oil trade network. This study focuses on coal and oil and is the first systematic resilience study of their value network. It better reflects the actual competitive landscape of the global fossil energy industry chain.
This study makes four major contributions to the existing literature. First, this paper innovatively puts forward the definition of energy value networks and shifts relevant energy economic research from conventional trade-based analysis to the value-added network dimension. This improvement remedies the research gap of the prior value-network literature, which predominantly targets general bulk goods or standalone single fuels and cannot capture the unique dual attributes of coal and oil as core primary energy commodities. Visual topology analysis further reveals that several economies occupying pivotal hub positions within crude oil and coal gross-trade networks, including Saudi Arabia, Israel, and Australia, fail to retain comparable dominant status in corresponding value-based networks. Second, this work explores the long-term dynamic evolution of global coal-oil value network metrics across two decades. Empirical results show growing cross-border value circulation and intensifying bilateral economic linkages, alongside a typical dependency pattern where small economies lean heavily on major hub nations. Third, the present study introduces the resilience analytical paradigm into value-added network research and systematically evaluates the systemic resilience of global coal and oil value networks; relevant results confirm an overall positive evolutionary trend for such value networks. Fourth, targeted single-node disruption simulations demonstrate that amid ongoing globalization and surging geopolitical frictions, network vulnerability triggered by shocks against the United States and Russia follows a U-shaped trend: dropping initially before rising gradually in the later stage.
The remainder of this paper is structured as follows.
Section 2 elaborates the calculation framework of value-network indicators and the resilience assessment methodology.
Section 3 reports core empirical outcomes, including topological features and evolutionary trajectories of the value network, structural and comprehensive network resilience, as well as shock effects induced by targeted elimination of pivotal economies.
Section 4 summarizes major conclusions and proposes relevant policy recommendations.
2. Data and Method
This paper investigates cross-border coal and oil value flows across 80 economies from 1999 to 2022 (the full list of these 80 countries (regions) can be retrieved from the official TiVA database). Domestic value added (DVA) statistics covering coal and oil sectors are adopted to construct the corresponding global value network, where individual countries or regions serve as network nodes and bilateral value flows are defined as edge weights. All relevant DVA data are extracted from the 2025 edition of the OECD Trade in Value Added (TiVA) database (the OECD TiVA database is a mainstream authoritative dataset for GVC-related value-added accounting, with its latest complete statistical data updated to 2022). The value-added accounting rules embedded in TiVA follow the classic calculation framework proposed by [
26]. Detailed names and codes of the 80 sampled economies are listed in
Table A1.
Coal and crude oil belong to core primary fossil fuels with tightly connected upstream and downstream industrial chains, and global energy regulatory and security policies for both fuels are highly coordinated. Accordingly, they are combined into one integrated network in this research. Their evident gaps in pricing mechanisms and geopolitical trade features are explained in the research limitations, and separate network construction will be carried out in future follow-up studies.
Following network visualization via chord diagrams, this study explores the evolutionary properties of value networks from macro, meso, and micro dimensions. Four macro topological metrics are selected, namely network density, average clustering coefficient, network efficiency, and average shortest path length. Three meso-level indicators include modularity, assortativity, and reciprocity, while five micro centrality indicators cover in/out-degree centrality, closeness centrality, betweenness centrality, and eigenvector centrality. The entropy weighting method is further applied to assign weights to the five centrality indicators for quantifying individual node importance. Random and targeted node deletion simulations are implemented to evaluate network resilience, which captures the network’s capability to absorb external disturbances, buffer adverse shocks, and restore normal operational status. Ultimately, targeted elimination of core economies is performed to quantify how pivotal nations shape the overall dynamic evolution of coal and oil value networks.
2.1. Network Characteristic Indicators
2.1.1. Macro-Level Indicators
- (1)
Network Density
Network density measures the tightness of the nodes in a network. A higher density indicates closer connections between network nodes. It calculates the size of the network and indicates the scale of value flows.
where
N represents the total number of economies in the sample and
E refers to the total amount of directed weighted edges reflecting bilateral value-added flows rather than simple binary undirected connections. It should be clarified that not all country pairs establish value trade linkages, so full connectivity does not exist within this network.
- (2)
Average Clustering Coefficient
The average clustering coefficient measures the average ratio of actual adjacent ties against theoretically maximum feasible connections for each node, characterizing the agglomeration degree of local value-based cross-country linkages.
where
refers to all adjacent nodes that have direct value flow connections with node
i; adjacency is defined by the existence of bilateral value trade linkages.
represents the total number of edges among all neighboring nodes of node
i and
is numerically different from
.
Consistent with existing findings, this indicator is widely adopted to depict regional agglomeration and local value cooperation [
24].
- (3)
Network Efficiency
Network efficiency is defined as the average reciprocal shortest path length across all node pairs [
27], measuring the efficiency of cross-network resource and information transmission. Higher network efficiency enables faster resource circulation between nodes, with its computational specification referring to Alves et al. [
28].
This metric is selected to represent the absorptive capacity of the network against external shocks, which has been fully verified in existing energy resilience research.
where
stands for the shortest path distance between node
i and node
j. Equation (
3) contains double summations over all pairs
with
; this distance metric is constructed based on bilateral value flow weights instead of physical geographical distance or time cost. For weighted networks, edge weights are converted into path length values; stronger value linkages correspond to shorter path distances.
From a theoretical perspective, network efficiency is inherently linked to the absorptive capacity of the whole system. A higher efficiency level means the network can rapidly receive, digest, and utilize external value elements. Conversely, low efficiency restricts the absorption and diffusion of cross-national value flows and further weakens the network’s ability to cope with external disturbances.
- (4)
Average Path Length
Average path length equals the mean shortest path across all node pairs within the network; a larger value implies slower cross-node resource and information dissemination.
Here,
denotes weighted path distance converted from bilateral value flow weights instead of geographical distance or time cost, consistent with the definition in Equation (
3).
2.1.2. Micro-Level Indicators
- (1)
Weighted In-degree centrality
In-degree and out-degree centrality separately quantify the intensity of value inflow and outflow for individual economies.
- (2)
Weighted Out-degree centrality
and denote the weighted in-degree centrality and weighted out-degree centrality of node i, respectively. indicates the weight of value flow from node i to node j. Correspondingly, represents the value flow weight transmitted from node j to node i. The two weights are generally unequal due to asymmetric bilateral value trade volumes between two economies.
- (3)
Closeness centrality
Closeness centrality evaluates how closely a single node connects to all other nodes in the network. It is calculated as the average distance from a target node to all remaining nodes; nodes with higher closeness centrality rely less on other economies and show weaker sensitivity to external shocks from partner nations.
where
represents the average distance from node
i to all other nodes in the network. It should be distinguished from the APL defined in Equation (
4):
is a node-specific local average distance, while APL reflects the global average path length of the entire network covering all node pairs.
Average closeness centrality is adopted to measure the post-shock recovery capacity of the network, which conforms to the classic three-dimensional resilience framework [
24].
- (4)
Betweenness centrality
Betweenness centrality identifies nodal importance by counting the share of all-pair shortest paths passing through the target node, reflecting its bridging function across separated network components. Economically, economies with high betweenness serve as critical transit hubs for cross-border value flows and dominate the linkage of different regional value chain clusters.
The double summation in the formula traverses all independent node pairs j and k that exclude the target node i, covering every possible combination of origin and destination nodes. Crucially, refers exclusively to the total number of shortest paths connecting node j and node k, rather than all arbitrary paths between the two nodes, where counts paths from j to k passing via node i. For weighted directed networks, path weights are transformed into path length for consistent betweenness calculation.
- (5)
Eigenvector centrality
Eigenvector centrality measures nodal influence based on the importance of its adjacent partners: nodes with high eigenvector centrality maintain connections to other influential economies and therefore occupy core network positions. The calculation formula follows the specification from [
18]. High eigenvector centrality implies close ties to other core economies and stable control over regional value circulation [
24].
where
A is an n × n adjacency matrix composed of
,
is the value of the eigenvector,
represents the impact of node
i to the position of node
j, and
is the eigenvector centrality of node
i.
2.1.3. Meso-Level Indicators
- (1)
Modularity
Modularity quantifies the degree of community clustering within the network. Higher modularity indicates clearer regional grouping: economies inside identical communities maintain intensive value linkages, while cross-community cooperation remains limited.
where
and
are weighted degrees of node
i and
j, equal to the aggregated weight of all edges connected to each node. Weighted degree is calculated by summing the weights of all directed value flow edges connected to the corresponding node, which differs from unweighted degree that only counts the quantity of connections.
W sums all edge weights across the whole network.
is a binary dummy variable equaling 1 if
i and
j belong to the same community and 0 otherwise.
- (2)
Assortativity
Assortativity (AS) captures the matching pattern of partner quantities across economies and depicts the connection characteristics of value flow networks.
where
stands for the average weighted node degree of the full sample. An AS value above zero means high-degree nodes tend to interconnect with peers (network polarization), whereas a negative AS implies that high-core economies establish value cooperation with small peripheral nations, forming a trickle-down development pattern.
- (3)
Reciprocity
Reciprocity calculates the probability of bidirectional value cooperation between paired economies.
where
is the average weight of all edges in the network.
2.2. Illustrative Calculation Example Based on a 4-Node Value Flow Network
To facilitate readers’ intuitive understanding of the above macro, meso and micro topological indicators, this subsection constructs a miniature directed weighted value network containing four virtual economies (A, B, C, D) to complete step-by-step indicator calculation and corresponding economic interpretation. The weight of each directed edge represents the scale of bilateral energy domestic value-added flows. The weighted adjacency matrix of the network is shown below:
In this matrix, row elements represent value outflow from the corresponding economy and column elements represent value inflow. Economies A and B are industrialized core players with large-scale value creation capacity, while C and D are resource-dependent peripheral economies that mainly export low-value raw energy products.
2.2.1. Calculation of Macro-Level Indicators
The total number of nodes . By counting all non-zero directional entries in the adjacency matrix, the actual valid directed weighted edges equal 8, so we correct the previous wrong value to .
- (1)
The density value is relatively high, indicating tight bilateral value linkages and close industrial chain interdependence among the four economies.
- (2)
Average Clustering Coefficient
Take node A as an example: its adjacent nodes are B and C, and there exists no direct value flow between B and C. We distinguish the number of adjacent nodes
and the number of edges among neighbors
as defined in
Section 2.1.1. After calculating the clustering coefficient of each node separately and taking the average value, the average clustering coefficient of the miniature network is approximately 0.417.
This moderate agglomeration degree implies that most value cooperation occurs between peripheral countries and core hubs, rather than among small peripheral economies.
- (3)
Network Efficiency and Average Shortest Path Length
After converting bilateral value weights into path distance , we traverse all node pairs to solve the shortest path. The network efficiency and the average path length . The small average path length means that cross-border value transmission only requires 1–2 intermediate economies, showing smooth value circulation within the system.
2.2.2. Calculation of Micro-Level Centrality Indicators
- (1)
Weighted out-degree centrality (total value outflow)
Economy B has the largest total value outflow and acts as the primary net value exporter in the miniature network.
- (2)
Weighted in-degree centrality (total value inflow)
Economy B maintains balanced two-way value flows and occupies the core hub position of the whole network.
- (3)
Closeness centrality
The average distance of economy A is the smallest, with optimal network accessibility and stronger resistance to external supply shocks.
- (4)
Betweenness centrality
The betweenness and eigenvector centrality values are calculated via standard weighted network algorithms based on the adjacency matrix above. Economy B bears the largest share of all-pair shortest paths, functioning as the critical transit bridge connecting different regional value chains.
- (5)
Eigenvector centrality
Economy B maintains value linkages with other high-influence nodes, so its eigenvector centrality ranks first, representing the highest comprehensive network influence.
2.2.3. Calculation of Meso-Level Indicators
- (1)
Weighted degree
The weighted degree of each node equals the sum of all incoming and outgoing edge weights, which fully reflects the total scale of value flow related to each economy, differing from unweighted degree that only counts connection quantities.
- (2)
Modularity
The four economies naturally form two community clusters: core group and peripheral resource group , with modularity , which proves obvious segmentation between industrialized core and resource exporting peripheral economies.
- (3)
Assortativity
The assortativity coefficient is negative, presenting a typical disassortative structure: high-value core economies establish value cooperation with small peripheral resource countries.
- (4)
Reciprocity
The reciprocity index , showing highly balanced two-way value cooperation between paired economies in this miniature network.
2.2.4. Economic Interpretation Summary
This 4-node simplified case visually clarifies the practical economic meaning of all three categories of network indicators. Macro indicators characterize the overall connectivity and circulation efficiency of the entire energy value chain system; five micro centrality indicators identify differentiated functional roles of individual economies (value exporter, importer, transit hub); meso indicators reflect community grouping features and the symmetry of bilateral trade relations.
Consistent with the full-sample empirical results of this paper, resource-based peripheral economies (C and D) have considerable raw material export volume but weak comprehensive nodal competitiveness in value networks, while industrialized core economies (A and B) dominate network core status relying on high value-added industrial links.
2.3. Network Resilience Measurement
2.3.1. Identify Key Nodes
This study adopts the entropy weighting approach to synthesize five centrality indicators and compute composite annual node scores for global coal and oil value networks to rank nodal importance and identify core network nodes.
As an objective weighting tool, entropy weighting allocates indicator weights according to information content reflected by data volatility: lower entropy represents richer information and a larger assigned weight, and vice versa. Detailed calculation steps are presented as follows.
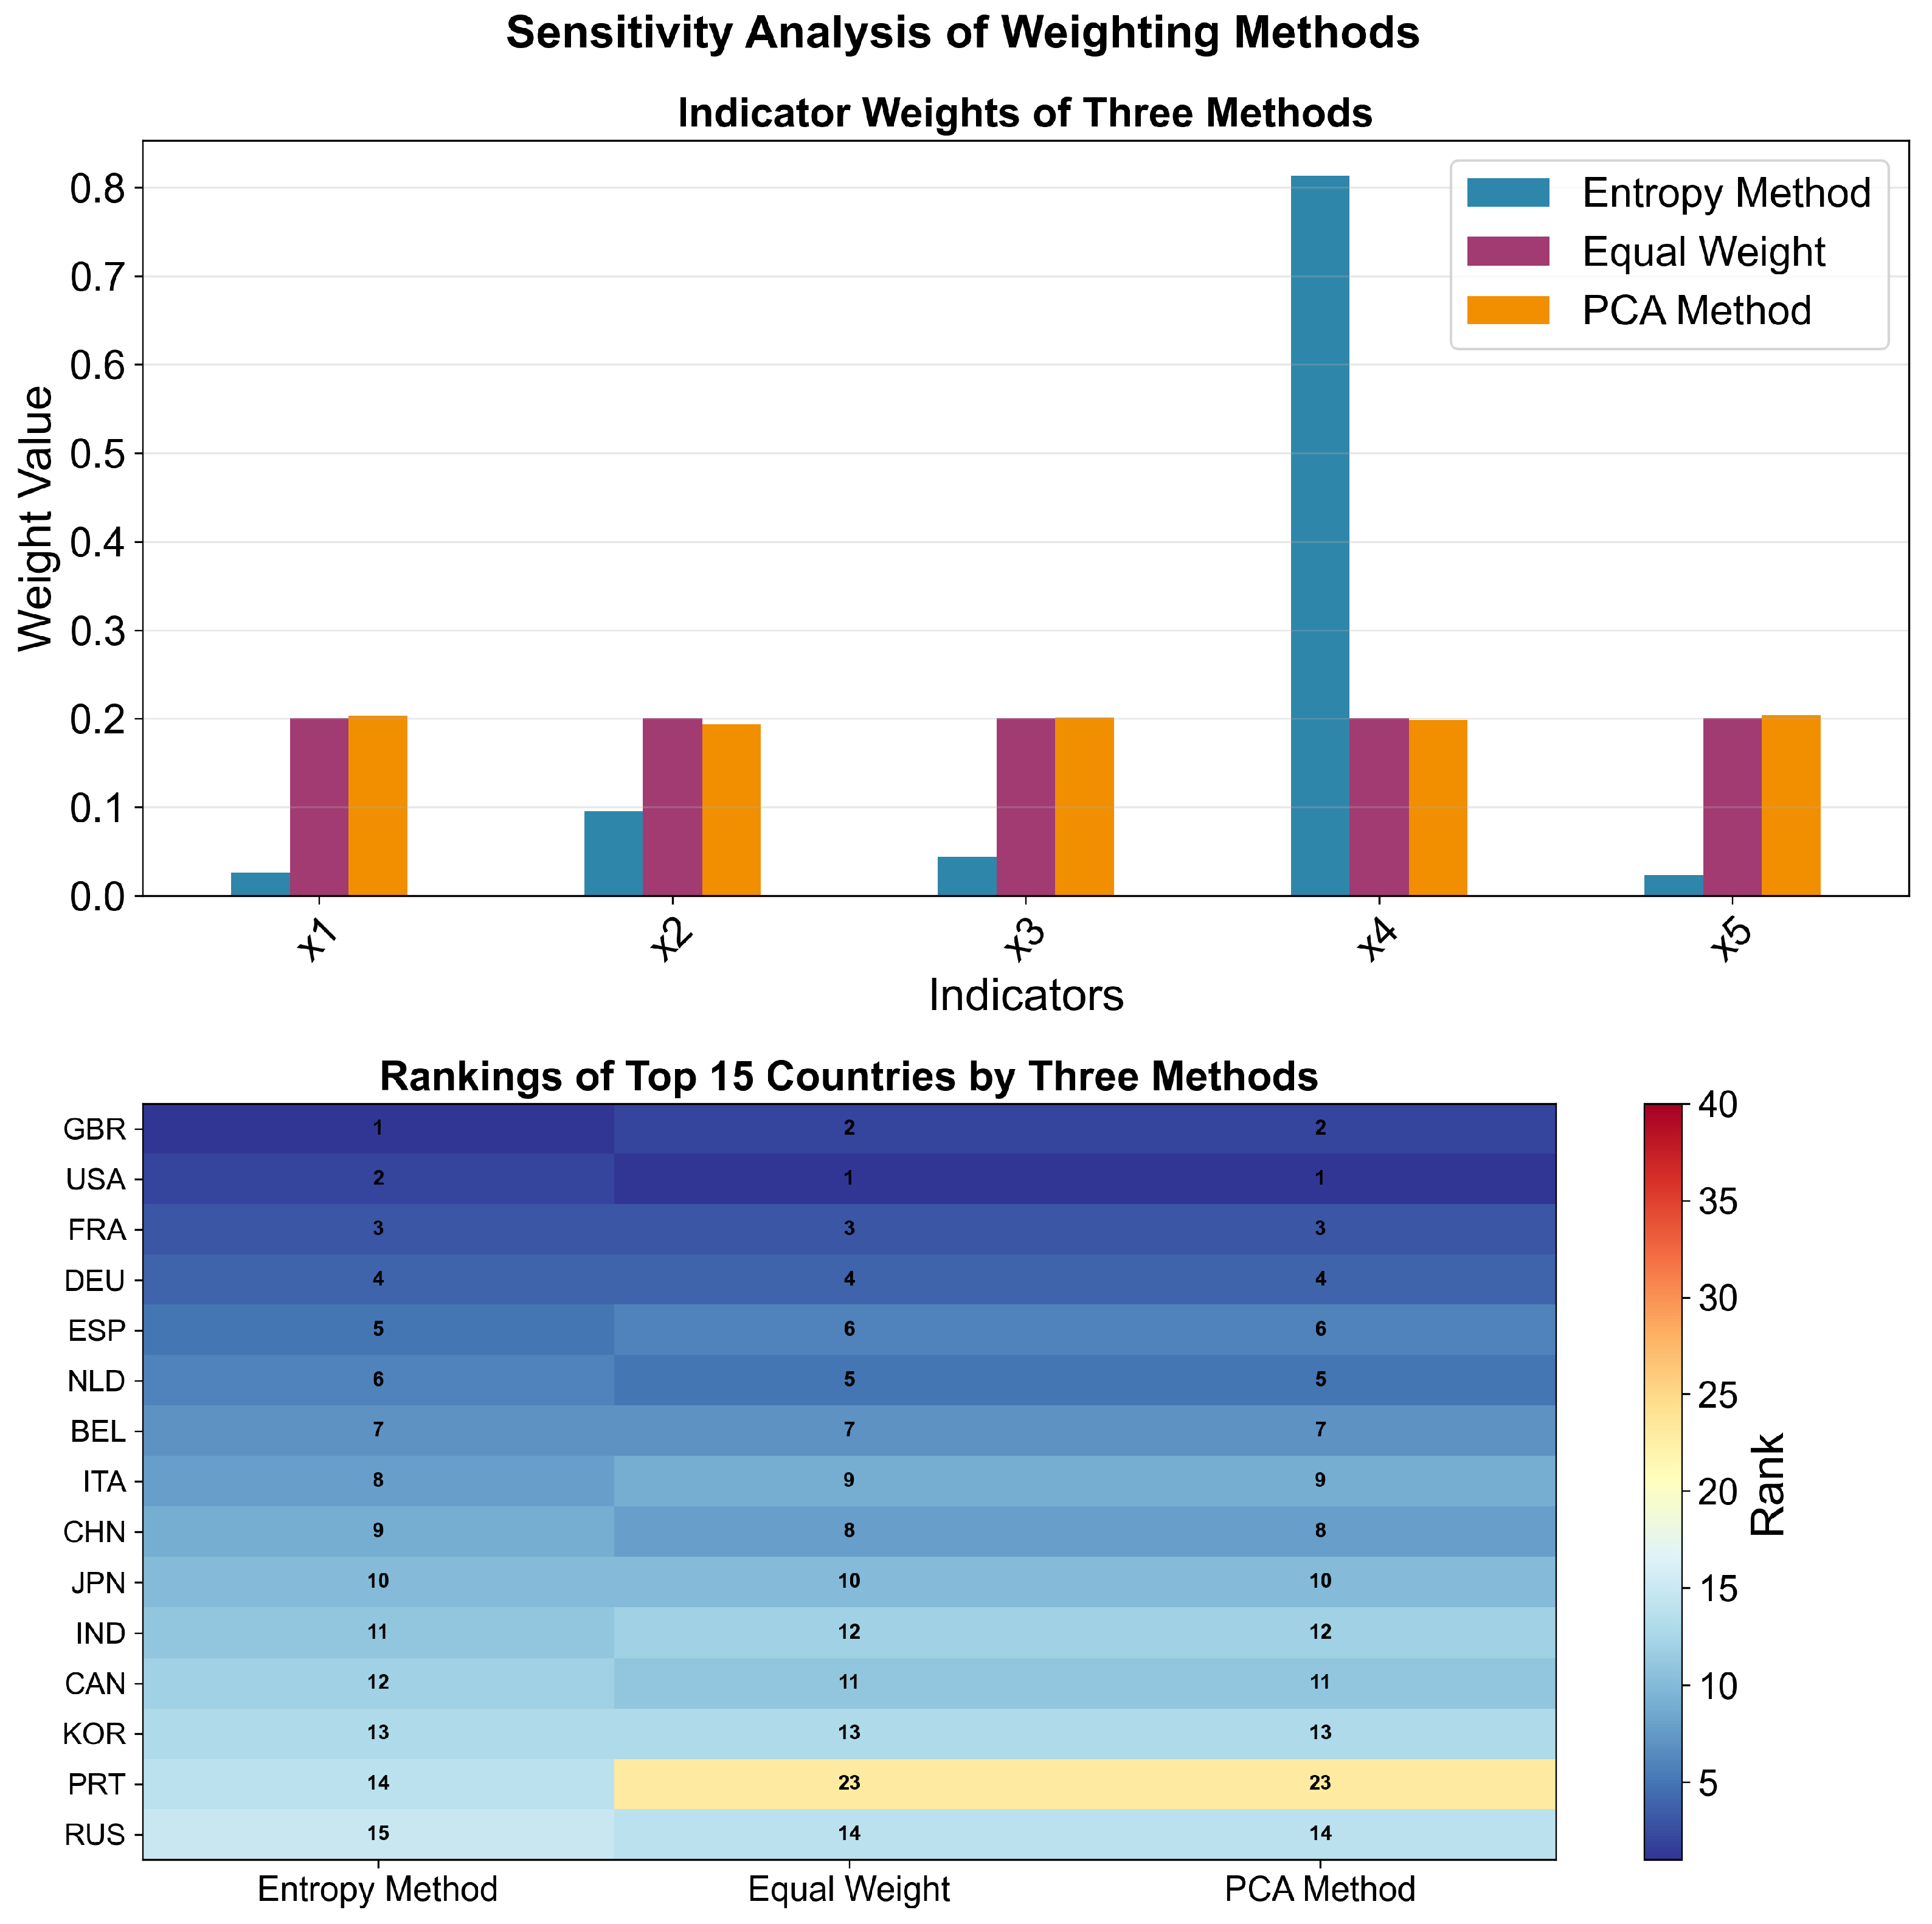
The entropy weight method is chosen for objective weighting without the need to set an arbitrary subjective coefficient, thereby avoiding the arbitrary parameter assumption of equal weighting. Nevertheless, this approach relies solely on data dispersion features and fails to incorporate practical energy policy and geopolitical factors into the allocation of weights.
For further robustness verification, the CRITIC weighting method is adopted to recalculate comprehensive resilience, and corresponding comparative outcomes are reserved for supplementary testing.
- (1)
Data Normalization
Original indicator data are first normalized. All five centrality metrics are positive variables; the following formula is applied for standardization.
where
represents the value of the v-th centrality indicator in the u-th year,
is the minimum value of
and
is the maximum value of
.
- (2)
Dimensionless Processing
Normalized data are further processed to eliminate dimensional discrepancies across different indicators.
where
represents the value of the indicator data after dimensionless processing.
- (3)
Entropy calculation
Upon the dimensionless processing of the data, we compute the entropy value for
.
This double summation form is mathematically valid. M denotes the total number of centrality indicators. N in Equation (
22) stands for all panel economies, while n in Equation (
24) refers to single-year economies.
- (4)
Disparity coefficient calculation
The disparity coefficient
is defined as the difference between unity and the calculated entropy.
- (5)
Weight calculation
Next, the weights of the five centrality indicators, denoted as
, are determined.
- (6)
Score calculation
The final comprehensive node importance score is obtained by multiplying standardized indicators by corresponding weights and summing up the products.
2.3.2. Three Dimensions of Network Resilience
Following the empirical framework proposed by Yu et al. [
24], this paper evaluates network resilience from three dimensions: absorptive capacity, buffering capacity, and recovery capacity. Network performance fluctuates after targeted node removal, and the simulation terminates once the network hits systemic collapse thresholds.
- (1)
Absorptive capacity
Absorptive capacity reflects a network’s inherent risk resistance and is measured by network efficiency. Within energy value networks, higher efficiency shortens value transmission paths and cuts trade frictions. When facing external shocks such as geopolitical conflicts and trade sanctions, streamlined linkages help divert risk; residual nodes with high connectivity strengthen overall risk resistance after partial node failure, and the computational formula refers to Equation (3).
- (2)
Buffering capacity
Buffering capacity denotes the ability to sustain structural stability amid external disturbances and is measured via the average clustering coefficient. High clustering means that each economy is surrounded by dense cooperative partners; when one node suffers shocks, adjacent cluster members can substitute its value production to maintain local network stability, with the calculation specified in Equation (2).
- (3)
Recovery capacity
Recovery capacity describes the extent and speed of network restoration post-adverse shocks and is proxied by average closeness centrality. Economies with high closeness centrality can rapidly rebuild cross-border value partnerships; such core nodes shorten collaborative distances and enrich alternative trade routes to facilitate post-shock network recovery.
2.3.3. Integrated Resilience Calculation
After acquiring absorptive, buffering, and recovery capacity under random and targeted node attacks, entropy weighting is reused to assign weights to three resilience dimensions and compute the composite resilience score of global coal and oil value networks.
2.3.4. Calculating the Resilience of the Network After Removing Crucial Nodes
To quantify nodal influence, this study separately deletes the United States and Russia from the network and calculates consequent changes in three resilience dimensions; stacked bar charts are plotted to compare their long-term evolutionary impacts spanning 24 years. Furthermore, combined with the entropy weighting results of node comprehensive importance, we divide all nodes into high-, medium- and low-importance groups and conduct hierarchical node removal simulations to further explore the heterogeneous effects of nodes at different levels on network resilience.
3. Results
3.1. Analysis of Network Visualization Results
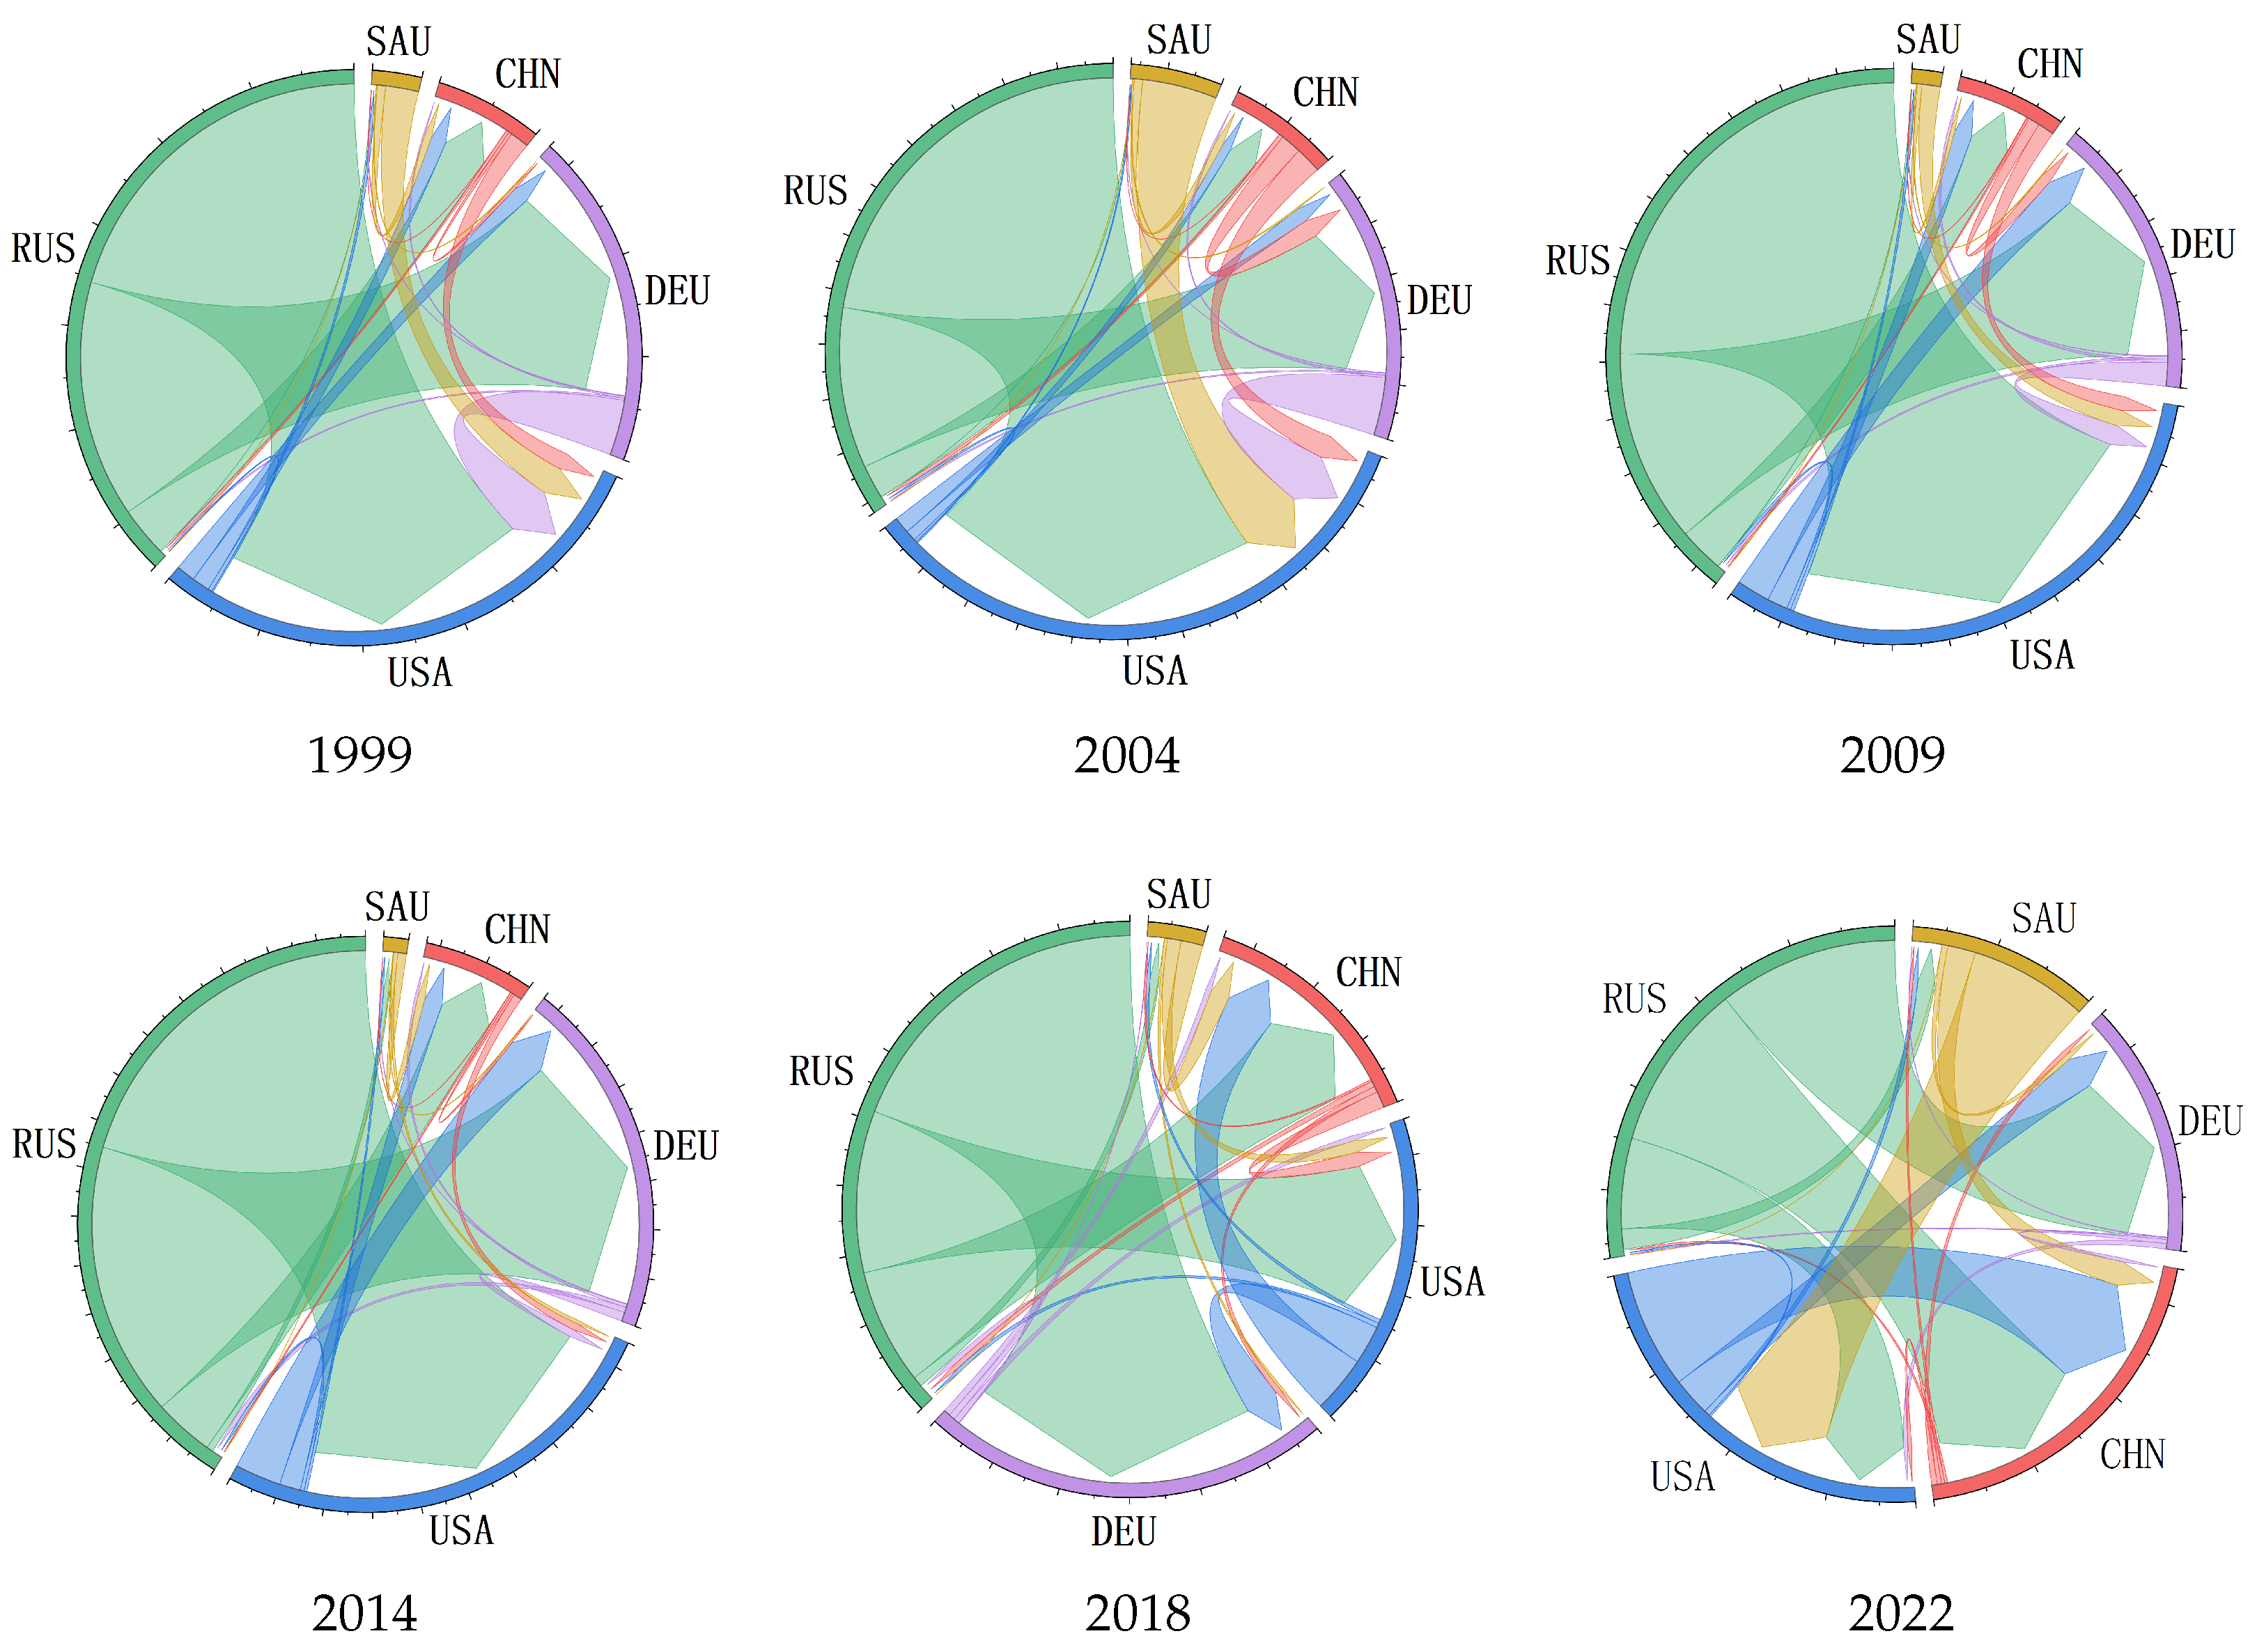
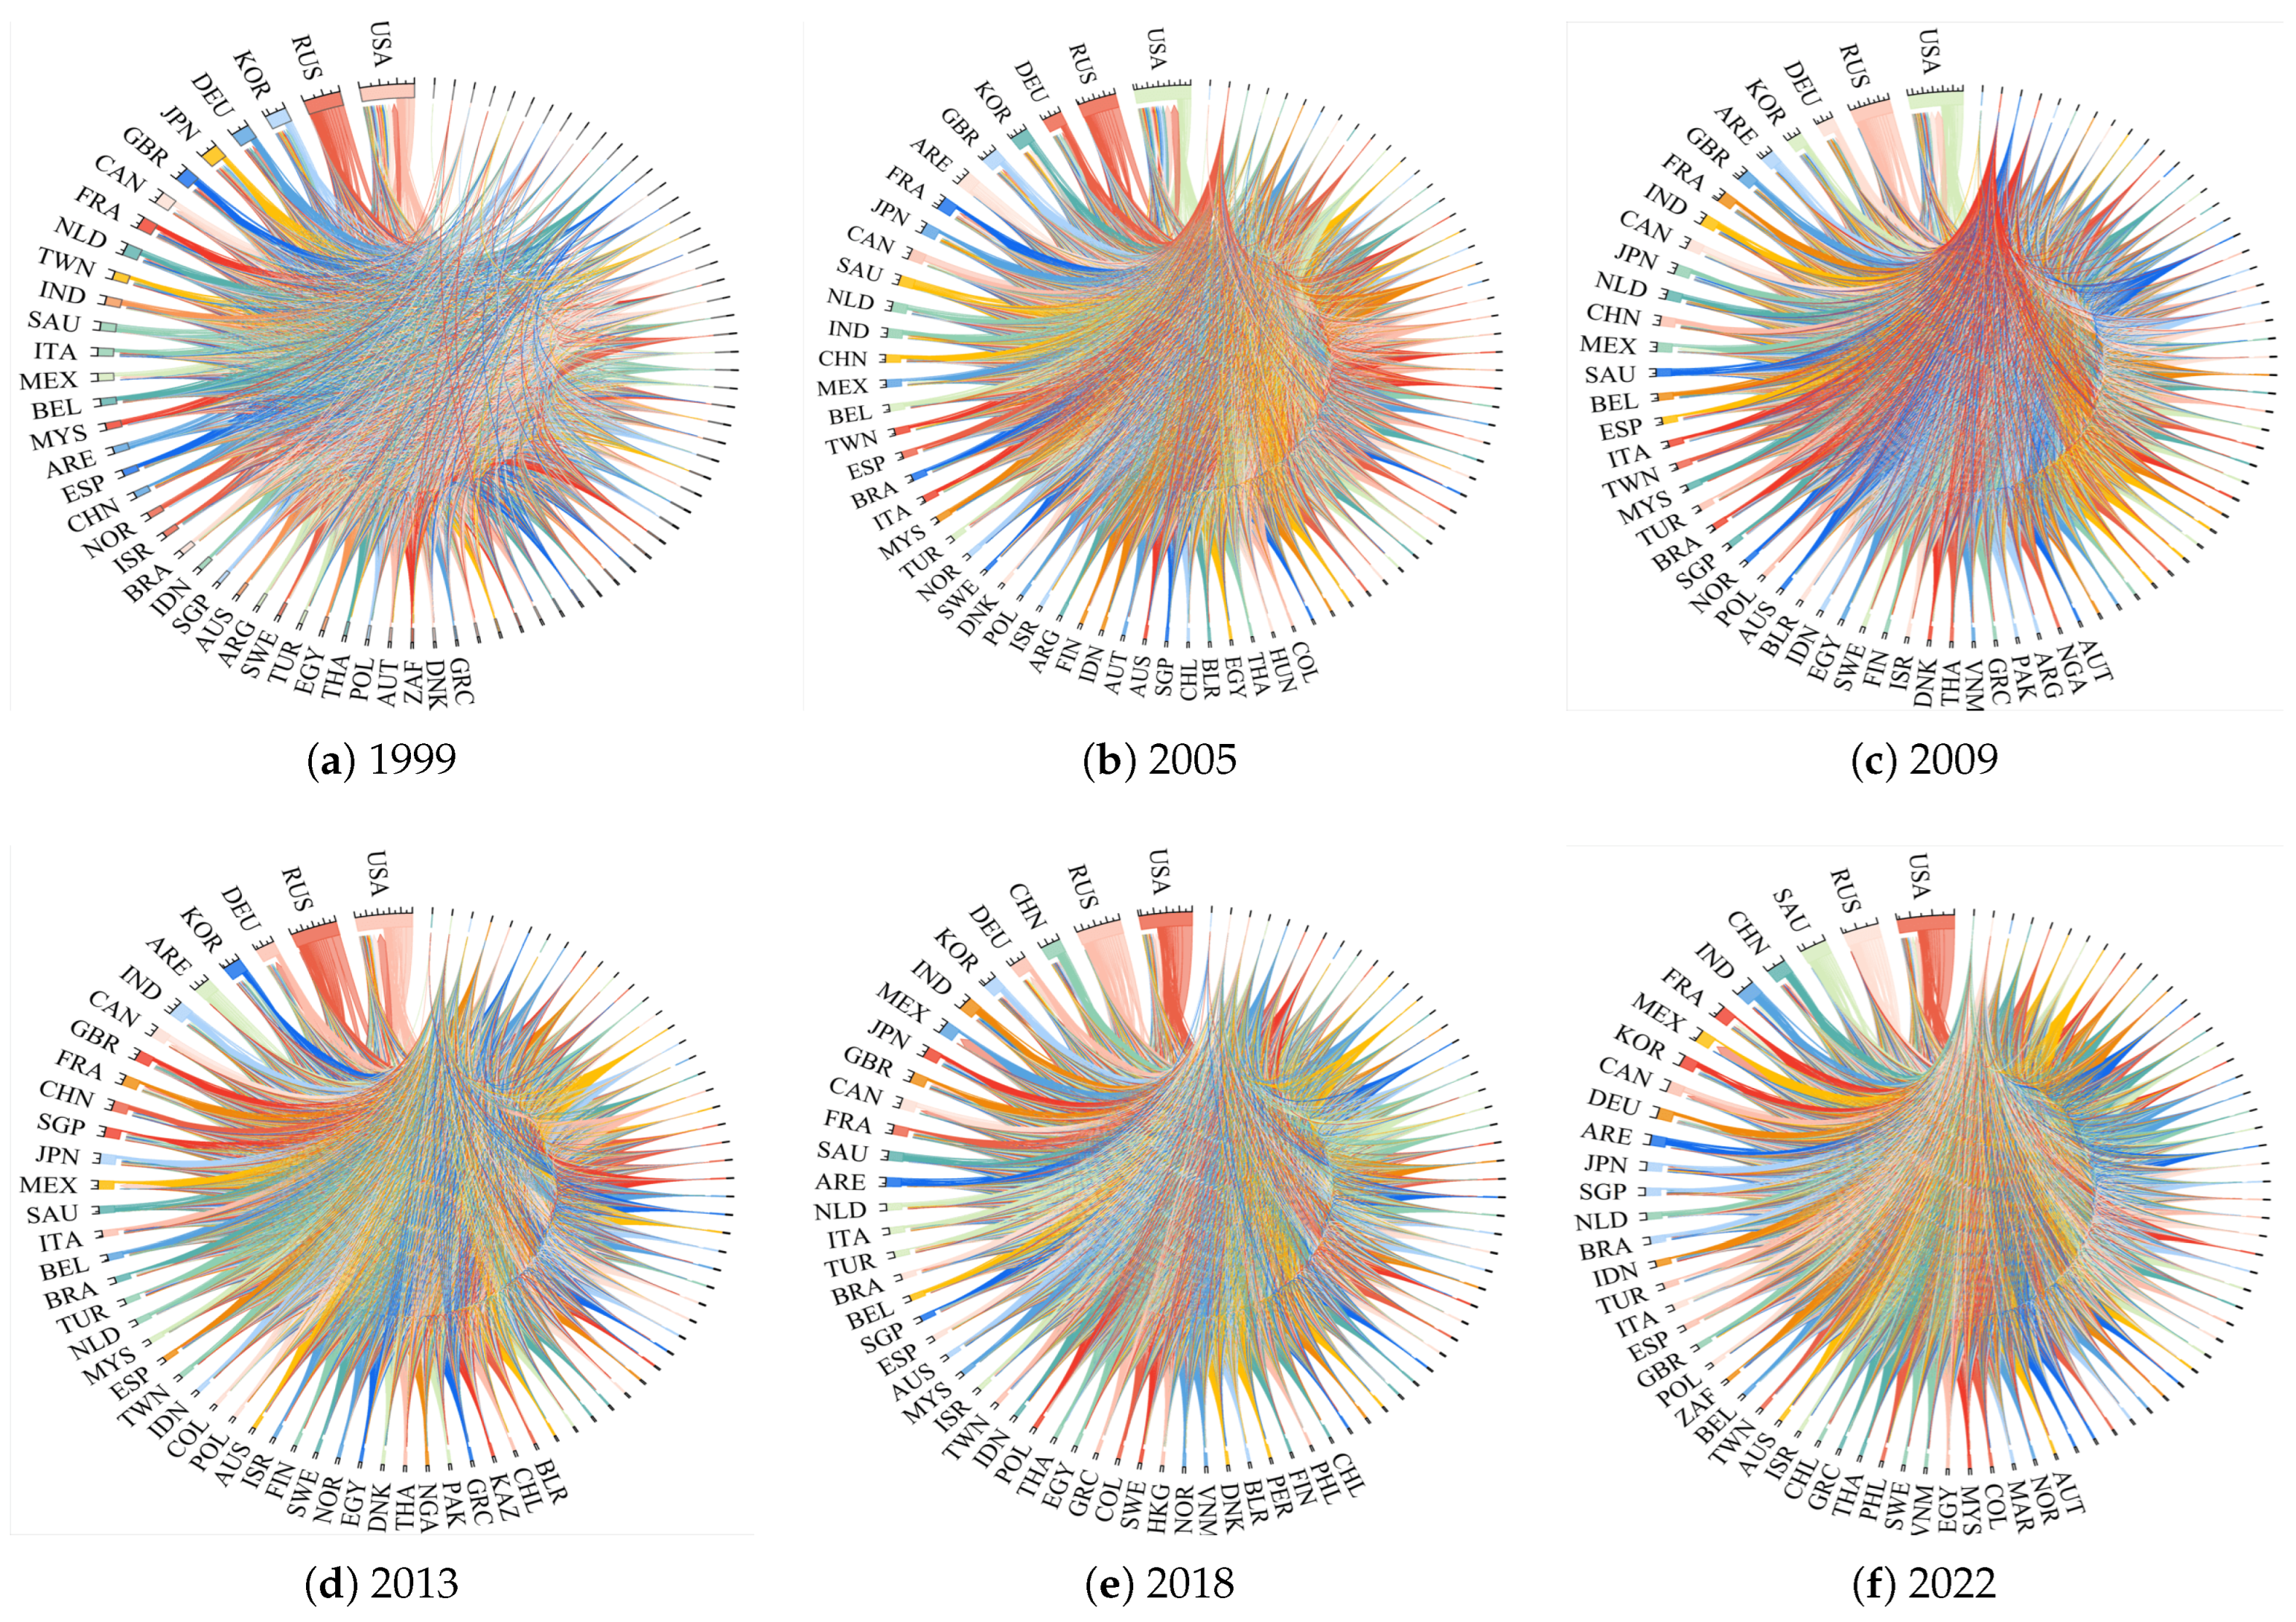
Chord diagrams are adopted to visualize network connectivity across six representative years: 1999, 2005, 2009, 2013, 2018, and 2022. To improve readability, only five core economies are presented in the main text, while chord diagrams covering all 80 sampled economies are placed in the appendix. These graphs intuitively reflect the structural characteristics and evolutionary trajectories of global coal and oil value networks. In the figures, economies are arranged counterclockwise in descending order of total bilateral value flows. The arc length represents the total cross-border value volume of a given economy, the line width indicates the scale of bilateral value flows, and arrow directions distinguish value inflows from outflows.
As shown in
Figure 1, cross-border value-added flows and bilateral connections among key oil and coal trading economies expanded steadily throughout the sample period. The network exhibits a clear hierarchical architecture: the United States acts as the dominant hub of the global energy value chain, with Russia, Germany, and Saudi Arabia functioning as pivotal nodal players. The growing density of bilateral ties reveals deepening interdependence across the international energy industrial chain.
Full visualizations containing all 80 sampled economies for each year are presented in
Figure A1 of
Appendix A.
It should be noted that the subsequent ranking analysis relies on the full sample of 80 economies, while
Figure 1 only visualizes five representative core economies to avoid visual clutter and streamline graphical interpretation.
In 1999, the top five economies, measured by aggregate value-flow volume, were the United States, Russia, South Korea, Germany, and Japan. The US sustained large-scale two-way value circulation, whereas Russia functioned primarily as a net value exporter. As advanced industrialized economies, South Korea, Germany, and Japan exhibited strong demand for energy-intensive manufactures alongside solid value-adding capacity, sustaining roughly balanced value inflows and outflows. From 2005 to 2018, the United Kingdom displaced Japan within the top five rankings. Relative to the 1999 network configuration, network polarization deepened in 2005: core economies consolidated their competitive edges via high-value industrial linkages, whereas peripheral economies were largely confined to exporting low-value primary energy commodities, enlarging cross-economy development disparities. In 2009, the overall network topology stayed stable amid a contraction in aggregate value flows. Despite fluctuations in network metrics post-2013, the fundamental structural framework persisted. Structural shifts observed between 2018 and 2022 are tightly associated with European energy restructuring triggered by the Russia–Ukraine conflict, during which the United States, China, Germany, and Russia retained their status as the network’s core nodal players.
China’s aggregate value flows have expanded consistently since 1999, with value inflows persistently exceeding outflows. This pattern aligns with China’s domestic energy endowments and its relative scarcity of crude oil. Canada’s value inflows and export markets are overwhelmingly concentrated on the United States, a pattern driven by geographic adjacency and the North American Free Trade Agreement (NAFTA). This evidence confirms that the topological architecture of value networks closely mirrors real-world economic linkages.
Fossil fuel-abundant economies, including Saudi Arabia, Israel, and Australia, fail to secure dominant positions within the value network. Israel only acts as a regional energy exporter and exerts marginal influence over global energy value chains. For instance, Saudi Arabia records an average ranking of approximately 12th and only broke into the top five in 2022, while Australia’s average ranking hovers around 25th and slipped to 32nd in 2005. Such outcomes diverge from conclusions drawn from conventional gross trade network analyses [
14,
15]. Resource-dependent exporters predominantly ship low-value raw coal and crude oil, limiting their capacity to capture domestic value. By contrast, Russia attains substantial aggregate trade volumes supported by its integrated industrial chain spanning crude extraction and high-value refined petroleum manufacturing.
Despite scarce domestic fossil fuel reserves, the United States and Germany possess sophisticated high-end industrial systems that underpin robust value generation capacity. This result demonstrates that aggregate gross trade volumes cannot fully capture an economy’s actual standing within the global division of labor. Economies boasting comparative advantages in primary commodity exports do not automatically occupy core nodal positions in value networks. Metrics constructed from cross-border value-added flows offer a more precise gauge of national competitiveness under global production fragmentation, marking a critical departure from conventional scholarship focused solely on gross trade statistics.
Comprehensive network visualizations for the full 80-economy sample are provided in
Appendix A, and the main text prioritizes the discussion of five representative core economies for concise exposition.
3.2. Analysis of Characteristic Indicators of the Global Coal and Oil Value Network
3.2.1. Analysis of Macro-Level Network Indicators
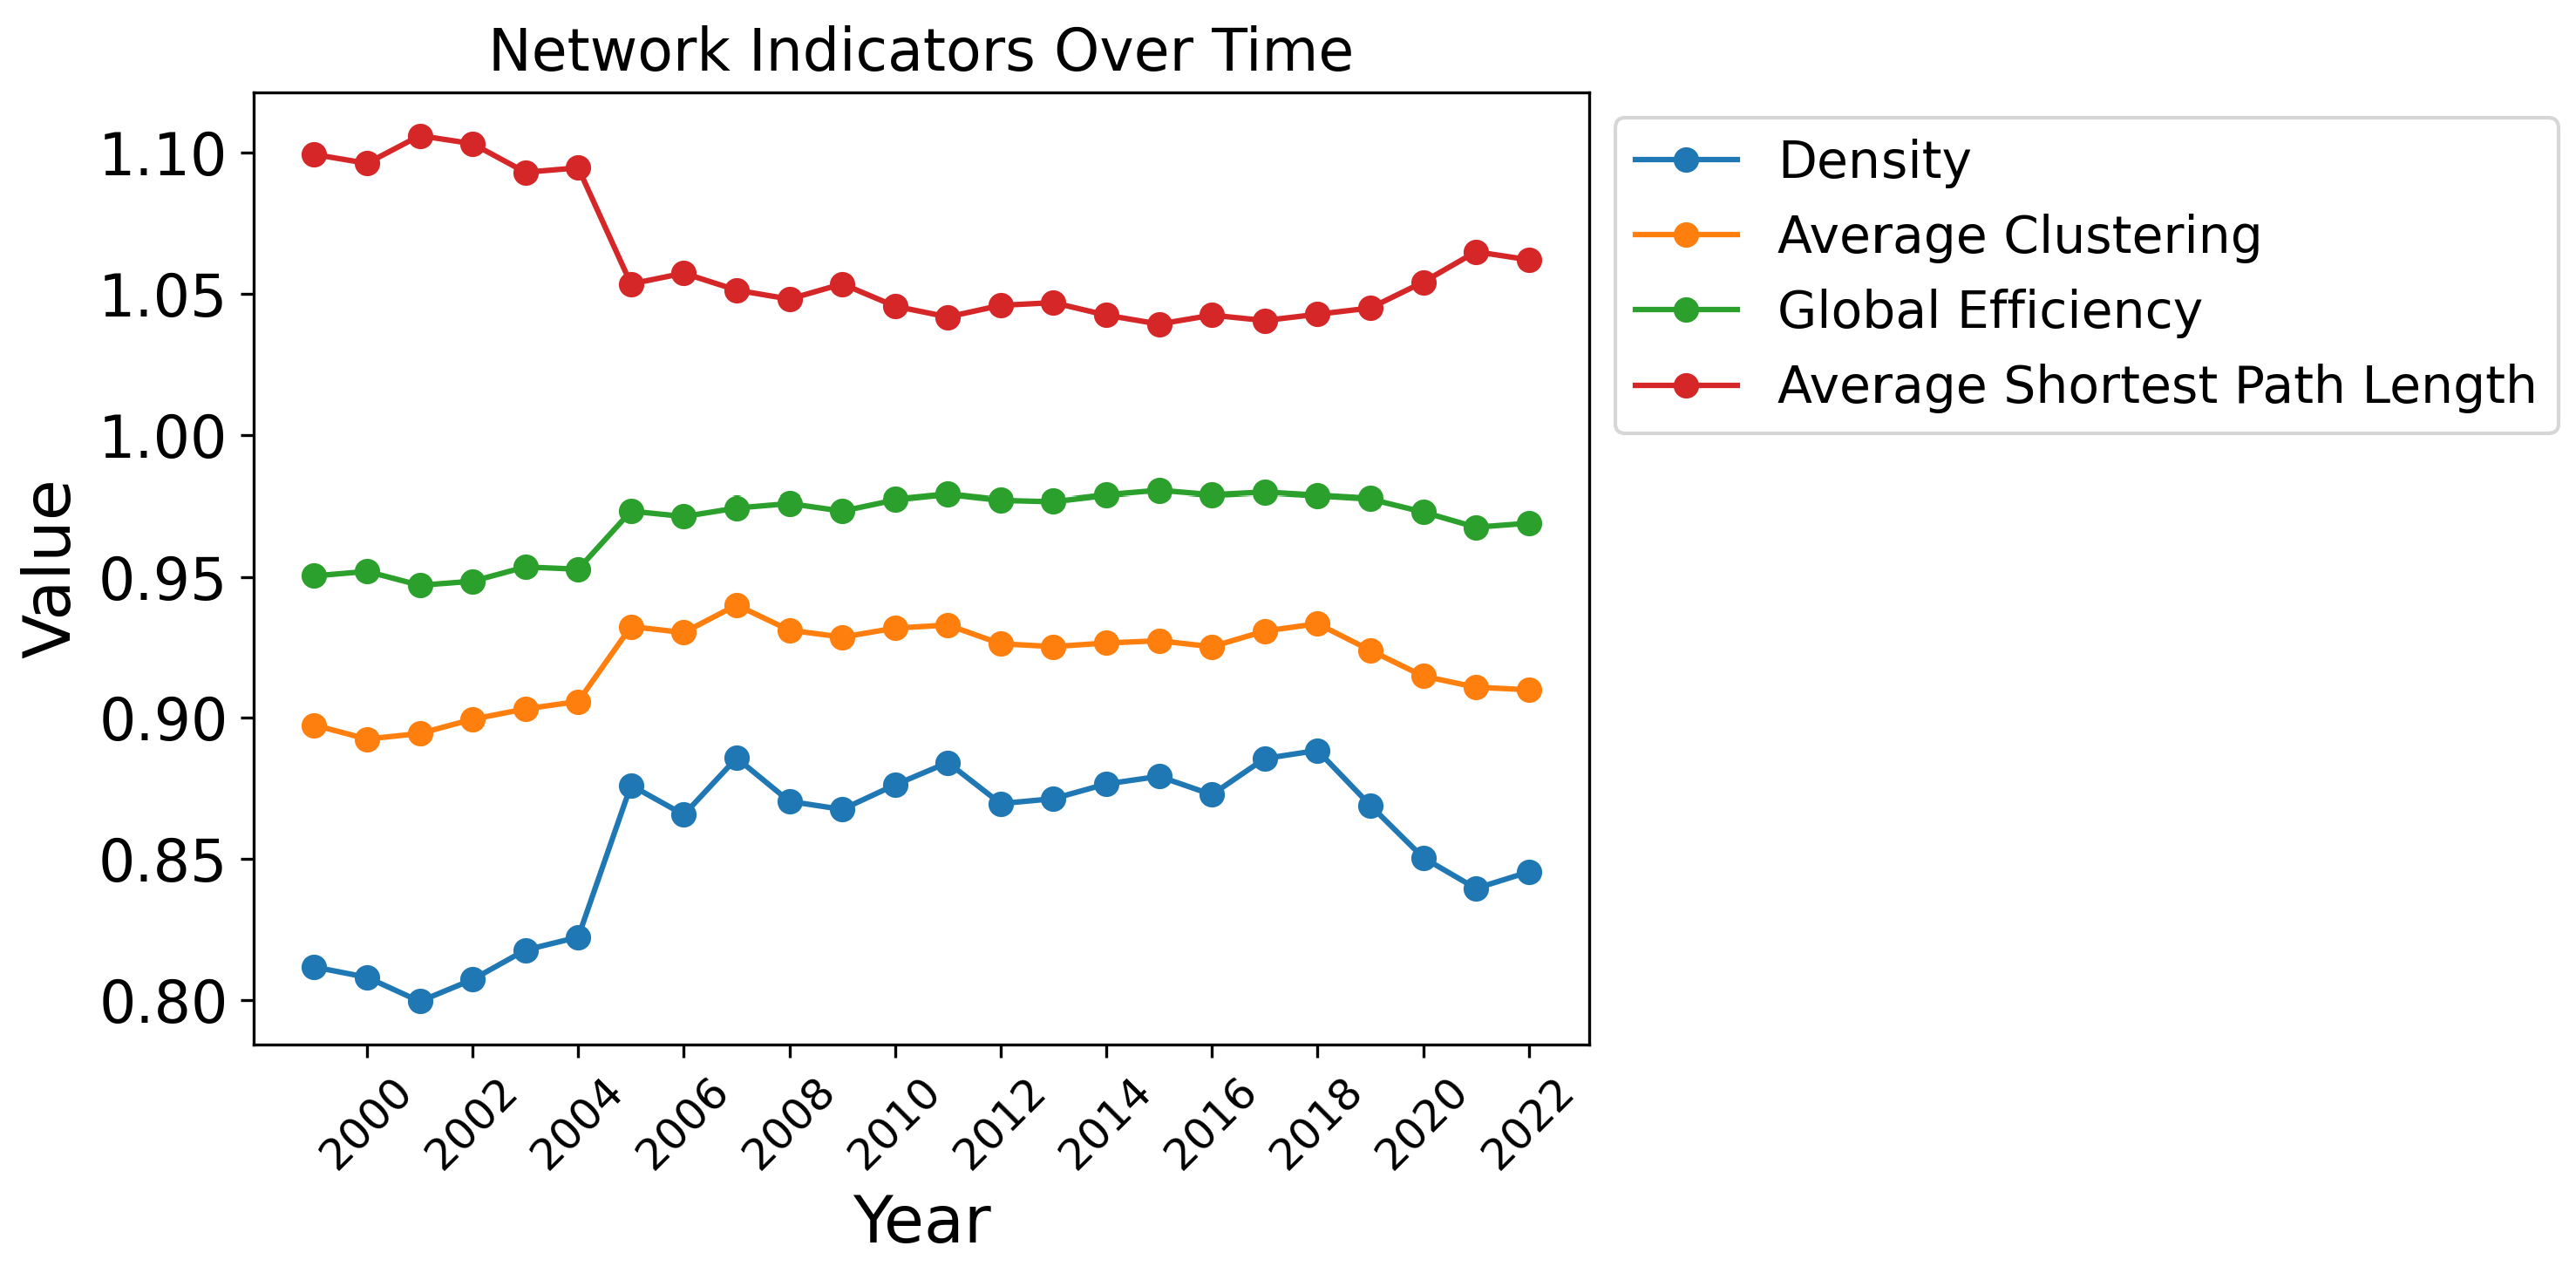
Figure 2 tracks long-term variations of four macro network indicators between 1999
and 2022. The average shortest path length declined from 1.10 to 1.06, alongside a rise in global network efficiency from 0.95 to 0.97, indicating improved connectivity, as cross-border value transfers often require only one or two intermediate nodes. Network density rose moderately from 0.82 to 0.85 and remained high amid periodic external shocks. The 0.03-point rise in density is a mild but meaningful improvement, indicating the gradual elimination of cross-border barriers to value trade and increasingly close overall industrial linkages across the global fossil value network.
The average clustering coefficient fluctuated within the range of 0.89 to 0.93, revealing persistent tight agglomeration and stable value transmission channels.
Collectively, the global coal and oil value network achieved steady efficiency improvement and tighter bilateral economic linkages over the studied 24 years.
Further observation shows the average shortest path climbed in 2001, accompanied by falling density and efficiency. Network connectivity weakened temporarily during 2009–2010, consistent with empirical evidence from Wu et al. [
25]. Fluctuations of indicators from 2010 to 2018 are correlated with multiple exogenous uncertainties, such as the Libyan War and frequent cross-border energy trade disputes. Changes after the 2021 Russia-Ukraine conflict reflect dual effects: strengthened bilateral ties among allied economies and extended value transmission paths across fragmented regional supply chains.
3.2.2. Analysis of Meso-Level Network Indicators
- (1)
Modularity
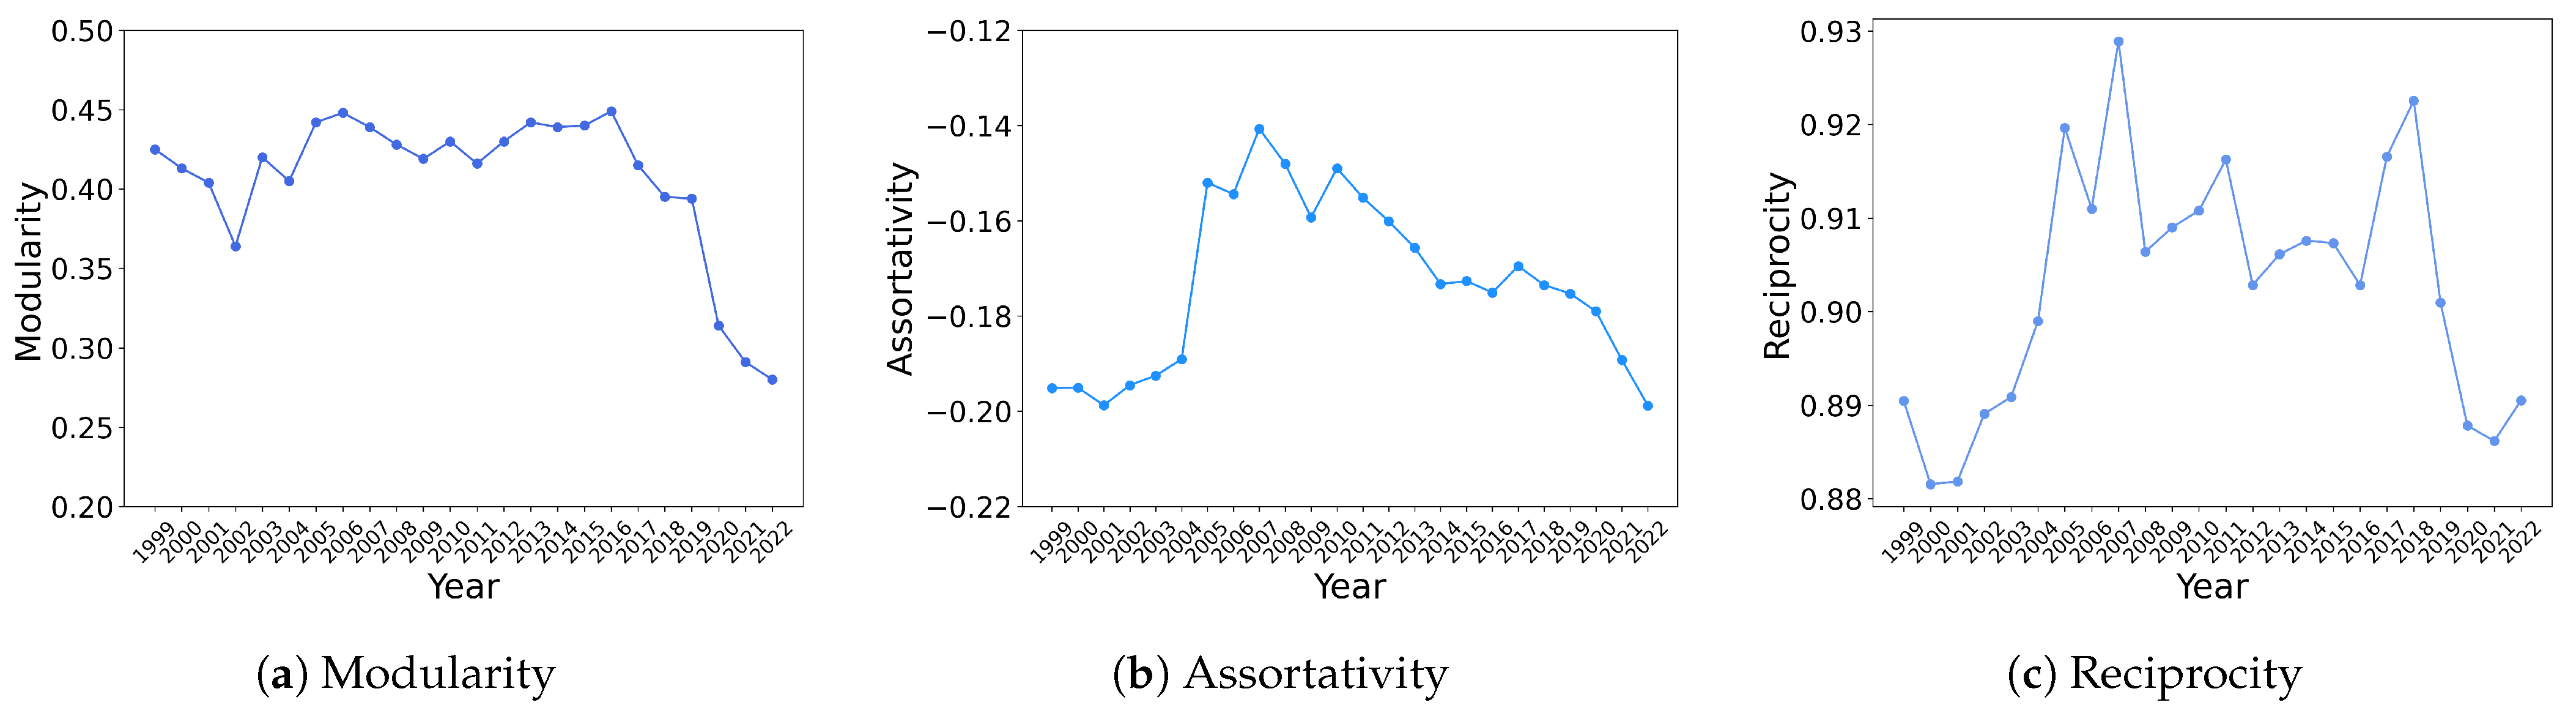
Figure 3 depicts modularity evolution from 1999 to 2022. To better visualize subtle annual changes in modularity, the vertical axis is set to 0.20–0.50, a range that fully contains all sample observations and helps reduce visual flatness caused by overly broad theoretical bounds. The indicator fluctuated mildly within the 0.35–0.45 range from 1999 to 2018, indicating stable community segmentation and relatively independent value flows across different network subgroups. Transient adjustments occurred around 2001 and 2010–2018. However, modularity slumped sharply from roughly 0.4 to 0.27 during 2019–2022.
This variation is correlated with global supply chain restructuring amid the COVID-19 pandemic and the Russia-Ukraine conflict, presenting blurred community boundaries and eased cross-group value barriers.
- (2)
Assortativity
Assortativity remained persistently negative between −0.20 and −0.14 throughout the sample period. The vertical axis is confined to −0.22–−0.12 to match the empirical value range of assortativity in our dataset; this localized scale facilitates observation of minor yearly structural shifts, without intentional overstatement of trend volatility. The long-term negative value demonstrates a typical disassortative structure where high-centrality hubs build value through cooperation with small peripheral economies and create obvious hub-dependent features rooted in uneven cross-country fossil resource endowments. Assortativity ranged from −0.20 to −0.14 during 1999–2006, with weakened disassortativity toward balanced bilateral matching, before gradually falling to around −0.20 from 2006 to 2022 and reinforcing the disassortative pattern.
Such long-run structural change is correlated with globalization-driven value diversification and supply chain reshuffling around the 2008 financial crisis, COVID-19, and the Russia-Ukraine conflict.
Nevertheless, deepening global energy cooperation is gradually alleviating excessive reliance on core hub nations.
- (3)
Reciprocity
As illustrated in
Figure 3, reciprocity has a theoretical effective interval concentrated between 0 and 1, yet the empirical values of this sample all fall within 0.88–0.93. We limit the vertical axis to 0.88–0.93 to reveal modest yet economically relevant annual shifts in bilateral energy reciprocity. The range below 0.88 contains no observed data points and is excluded to avoid a large empty visual space within the plot. Reciprocity remained high across all years, reflecting sustained intensive two-way energy value cooperation worldwide. The indicator climbed from approximately 0.89 to its peak of 0.93 during 1999–2007 amid deepening bilateral energy ties, followed by volatile adjustment above 0.90 after 2007 with short-term drops in 2000–2001 and post-2020.
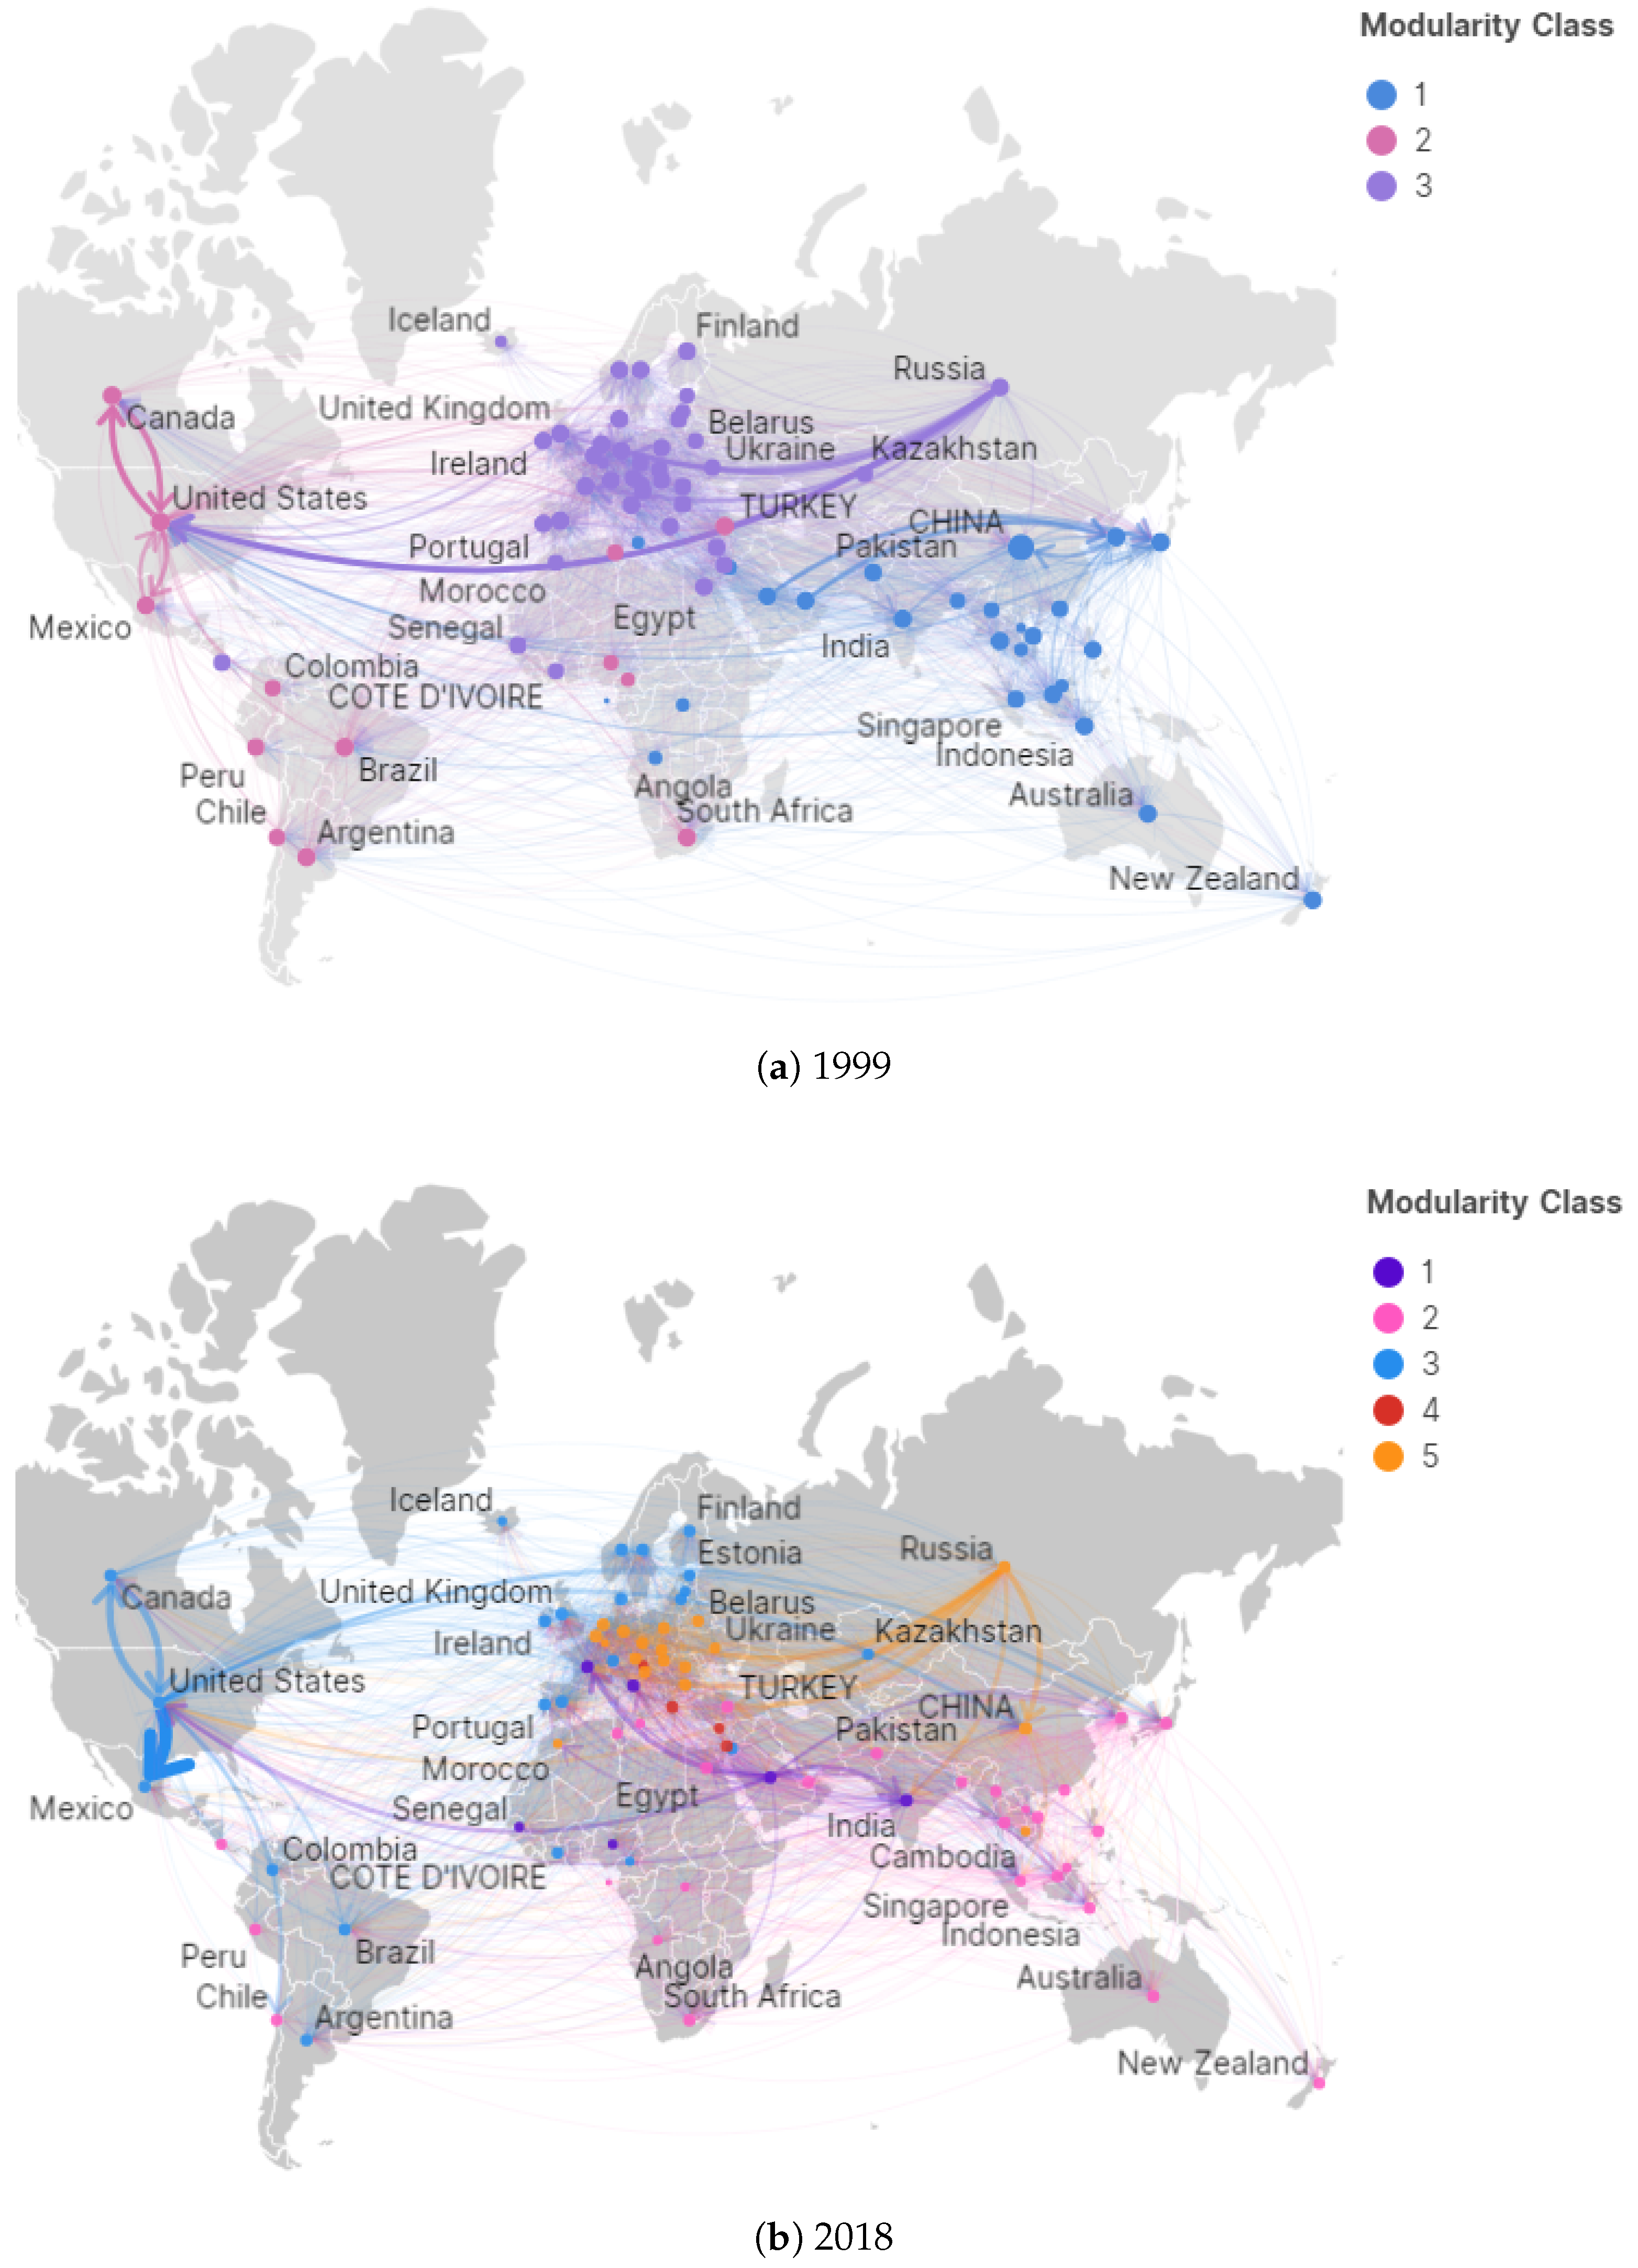
Figure 4 contrasts community partitions in 1999 and 2022 and reveals a transition
from geographically regionalized grouping toward cross-continental integration. All node coordinates in the two snapshots are output automatically by the community detection algorithm without manual adjustment. Three geographically separated clusters existed in 1999: a European-led community dominated by Germany and the UK covering most European, North African, and West Asian nations; an Asia-centered cluster headed by China, including East Asia, Southeast Asia, and Oceania; and an American community anchored by the US and Canada spanning North and partial South America, featuring geographically bounded intra-group value flows and isolated cross-community cooperation.
By 2022, community boundaries shifted toward cross-continental functional grouping. China, Russia, Germany, and Belgium formed an integrated Eurasian energy cluster alongside expanding China–Europe trade and Russia’s pivotal energy supply role. This change is correlated with Europe’s diversified import channels after the Russia-Ukraine conflict. Brazil, Argentina, the US, Canada, Finland, and the UK built a transatlantic community, while Southeast Asia, South Asia, Australia, Chile, and other Latin American states constituted another cross-continental cluster. These structural changes are correlated with rising Asian emerging-market energy demand and complementary resource supplies. Cyprus, Greece, Slovenia, and Israel formed a small independent niche community.
3.3. Analysis of Node Importance
This subsection first characterizes nodal properties from five centrality dimensions (weighted in/out-degree, closeness, betweenness, and eigenvector centrality) and tracks cross-country performance differences.
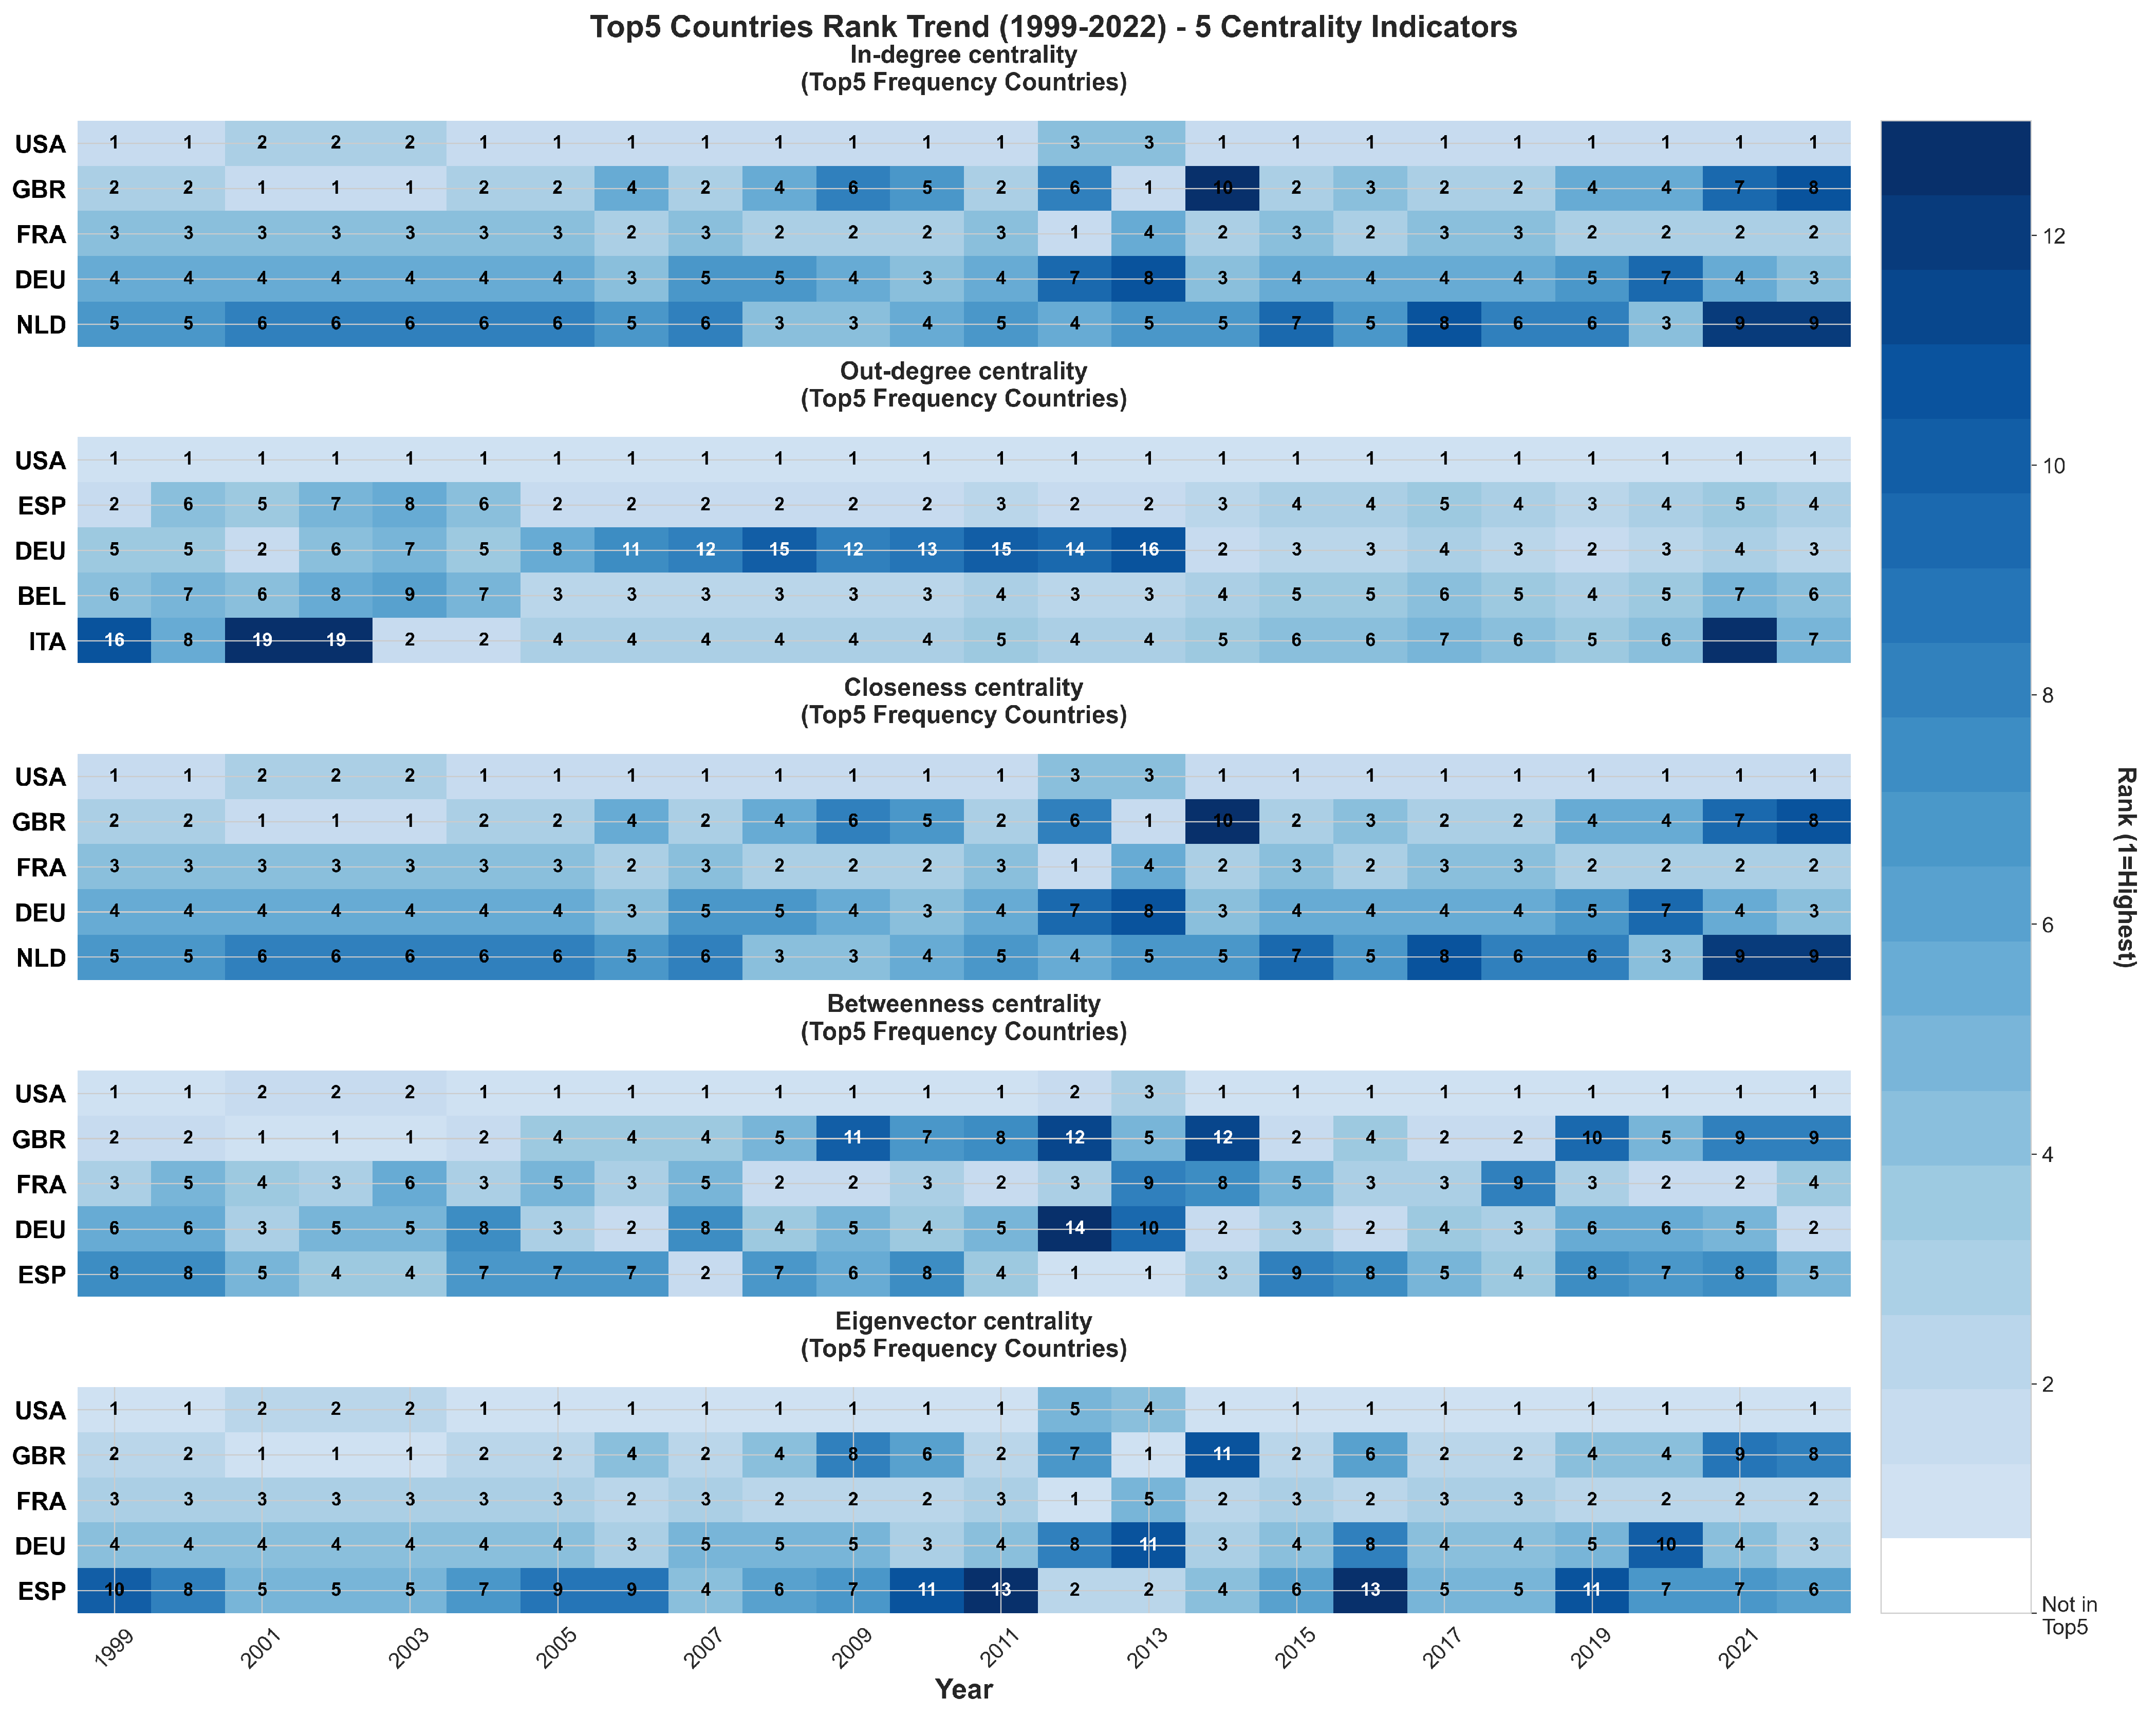
Figure 5 plots annual ranking shifts of top-five economies for each centrality indicator from 1999 to 2022 to uncover core-node functional differentiation. The US and France consistently occupy the top two positions for in-degree centrality as major recipients of energy value inflows, with China’s continuous ranking improvement reflecting its growing domestic energy consumption. The US retains leading out-degree centrality alongside periodic top-five appearances by Spain, Germany, and Russia. The US, Germany, UK, and France secure optimal value accessibility via superior closeness centrality and act as core transmission hubs, while the US, UK, and Germany function as critical bridging nodes measured by betweenness centrality. High eigenvector centrality of the US, UK, and France suggests that their trade partners also possess strong network influence.
Since separate centrality metrics capture distinct nodal features, the entropy weighting method is adopted to synthesize five indicators for comprehensive nodal ranking. All composite scores presented in
Table 1 represent time-averaged values covering the full research period 1999–2022.
Table 1 lists the top 15 economies by composite importance score.
The United States and the United Kingdom remain the two most influential nodes over the full sample period. France and Germany witness yearly growth in bilateral value flows and tighter cross-border economic linkages. In contrast, prominent fossil exporters such as Saudi Arabia fail to enter the top-15 importance list.
These outcomes confirm that pure trade volumes cannot fully reflect industrial positioning. Despite modest domestic coal and crude export volumes, Germany, France, and Spain gain core network status driven by massive industrial energy demand and high-value-added processing capacity. Notably, Russia ranks second globally by total trade volume yet only 15th in composite nodal importance due to lopsided net value outflow and limited inbound value creation, a unique finding unavailable via conventional trade-volume-based network analysis. In short, composite ranking incorporating five centrality dimensions delivers a more robust evaluation of national competitiveness within value chains.
3.4. Analysis of Network Resilience Measurement
Targeted and random node removal experiments are conducted based on the comprehensive importance ranking of nodes. In this simulation framework, node removal serves as a stylized scenario to mimic real-world disruptions, including geopolitical conflicts, unilateral energy sanctions, sudden production outages, and trade interruption of major energy economies.
We further categorize all nodes into three tiers using entropy-weighted comprehensive scores: high-importance nodes (top 20%), medium-importance nodes (middle 60%), and low-importance nodes (bottom 20%). Corresponding grouped attack simulations are then carried out. Specifically, random node elimination represents widespread, unanticipated minor disturbances across the network; overall targeted attacks simulate deliberate shocks toward core energy players; and hierarchical targeted attacks reflect differentiated risks facing core, transitional, and peripheral economies.
Three core indicators are adopted to quantify network responses to shocks: network efficiency for absorptive capacity, average clustering coefficient for buffering capacity, and average closeness centrality for recovery capacity.
3.4.1. Absorptive Capacity-Network Efficiency
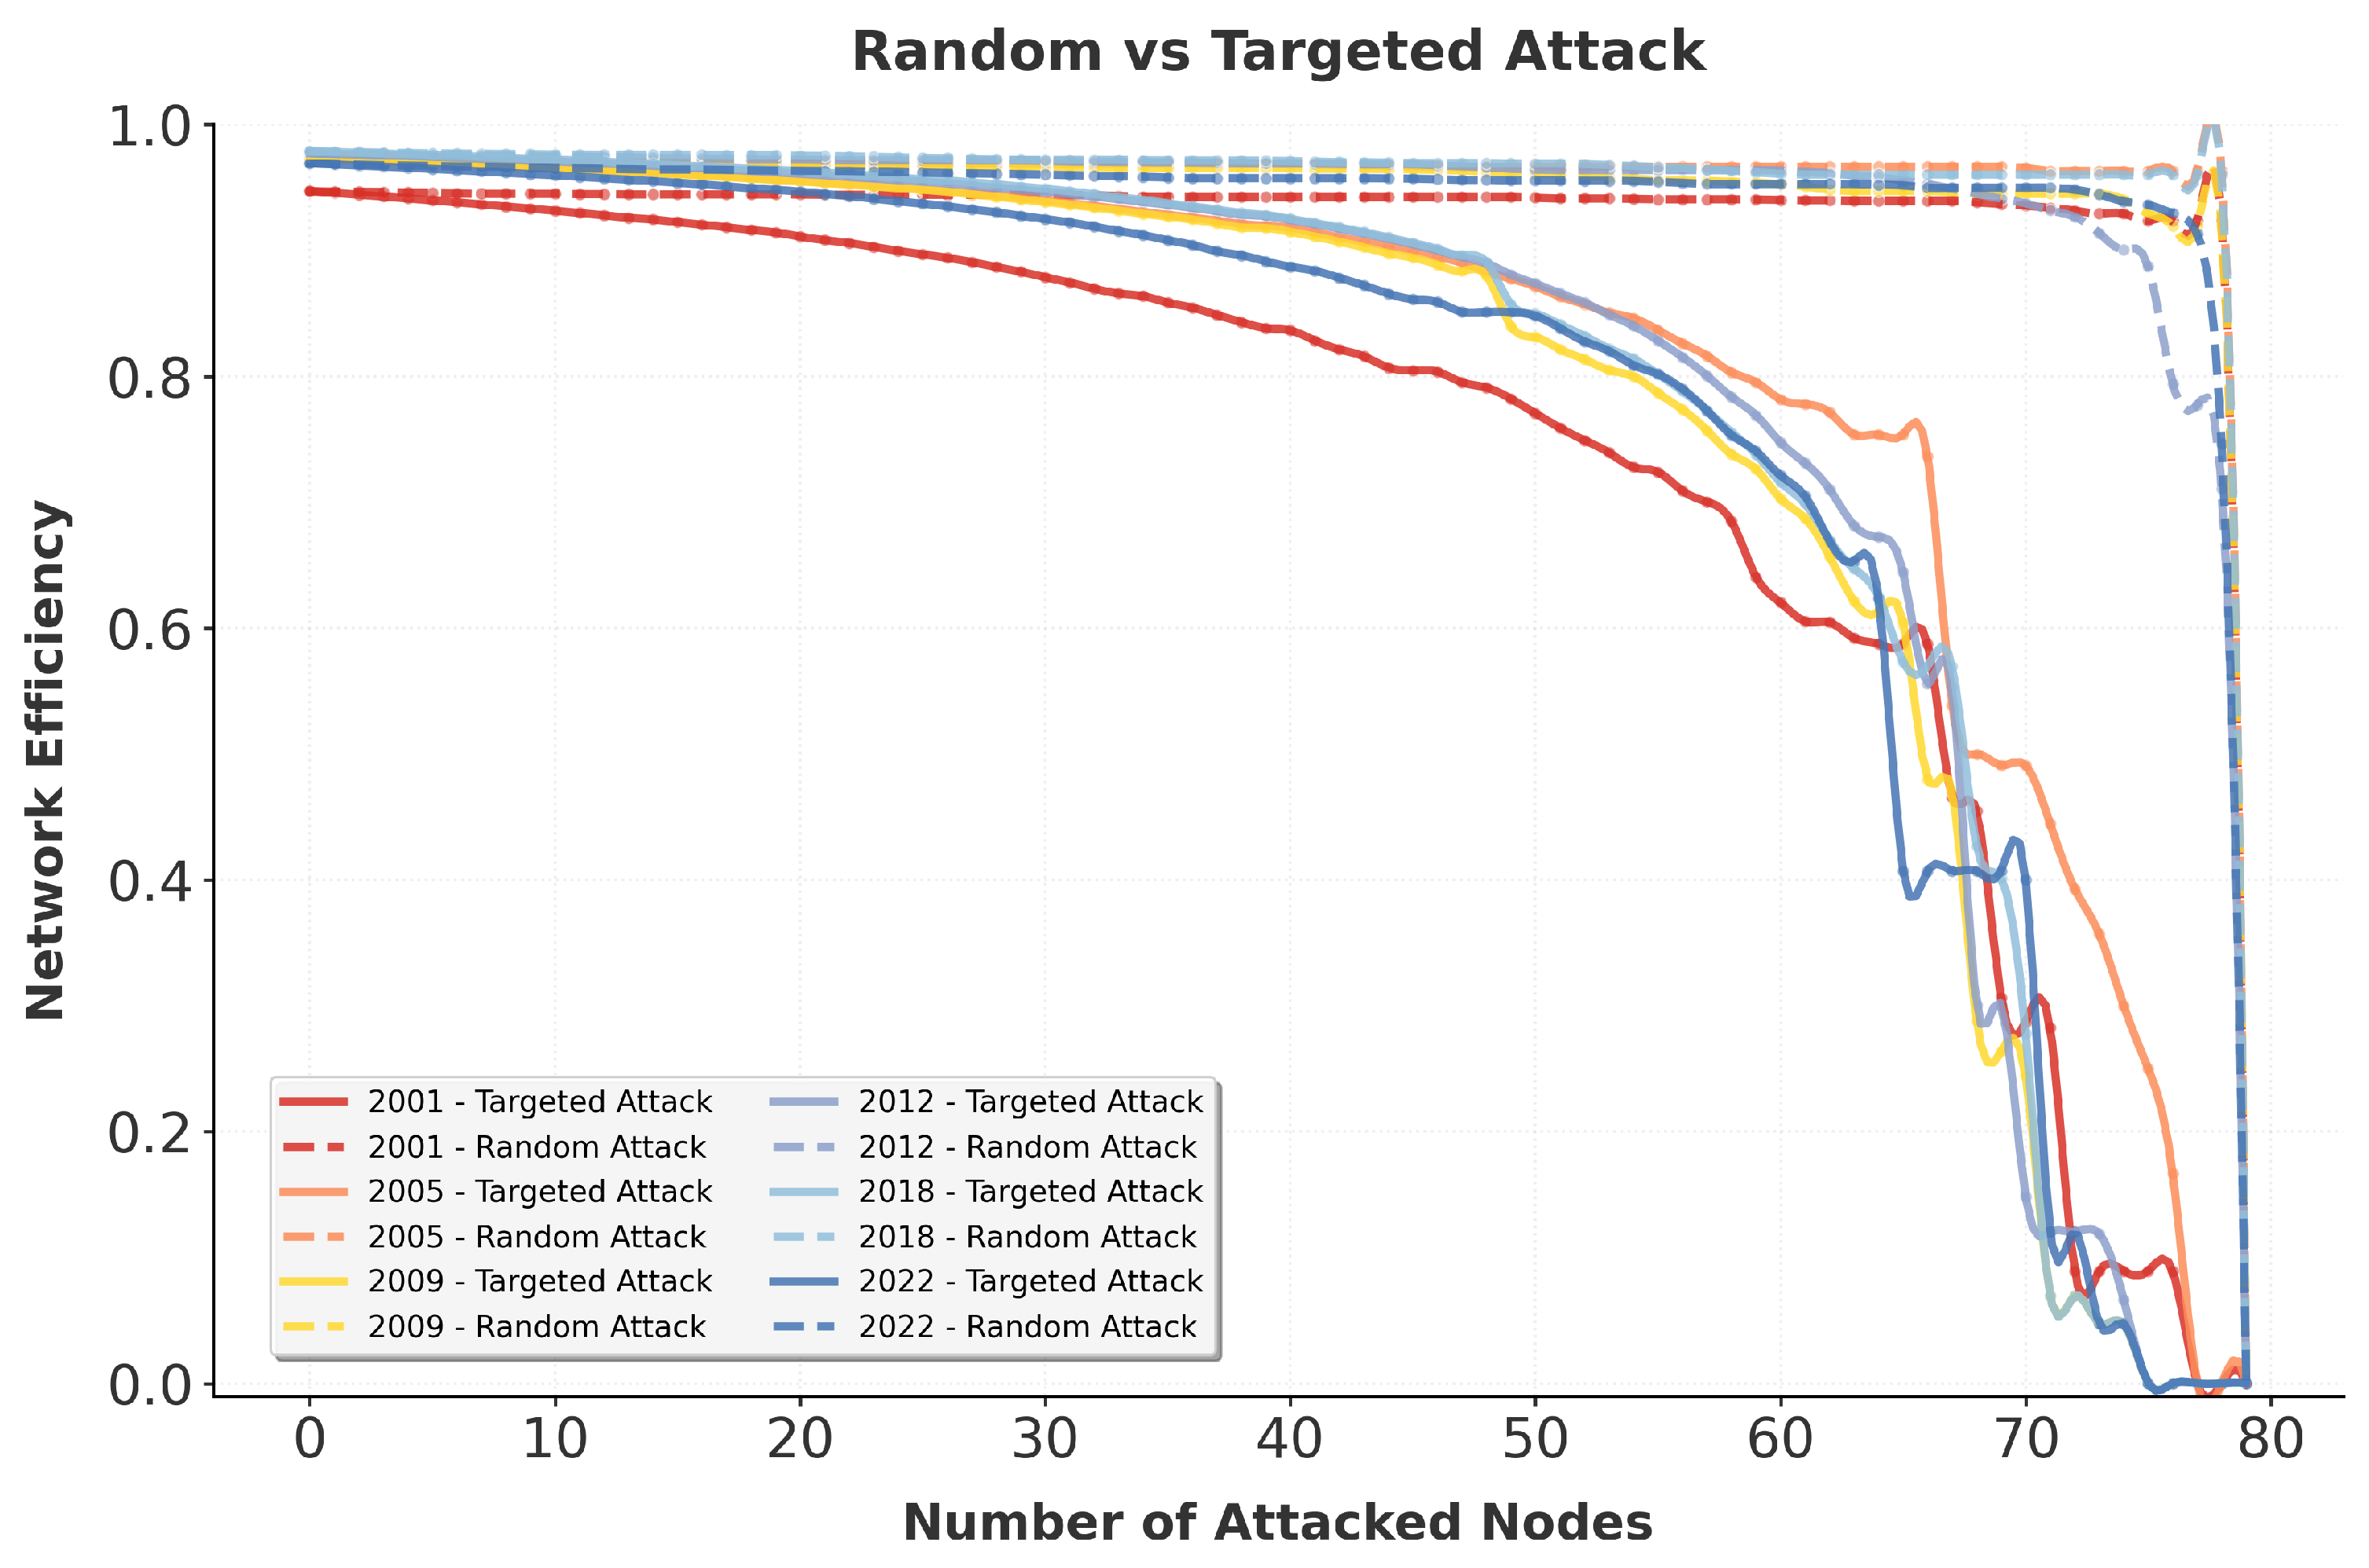
Figure 6 illustrates heterogeneous efficiency evolution under random versus targeted
node elimination. The network maintains efficiency above 0.9 with fewer than 60 randomly removed nodes and collapses only after over 75 nodes are deleted, revealing strong anti-shock absorptive capacity against stochastic disruptions. By contrast, targeted attacks trigger a two-stage efficiency change: a mild and gradual decline within the first 50 removed nodes, followed by an abrupt and sharp collapse beyond the 60-node threshold, with varying inflection points across sample years.
The network exhibited the weakest initial anti-risk performance and an earlier collapse threshold in 2001, while its resilience improved gradually by 2005. Temporal changes in network performance are correlated with the 2009 financial crisis, the 2011 Libyan conflict, and 2012 Iranian oil sanctions. A temporary recovery in network resilience was observed between 2013 and 2018. Afterwards, the combined impacts of the COVID-19 pandemic and regional geopolitical tensions are correlated with a notable drop in efficiency in 2022. Overall, the extended stable phase before abrupt collapse indicates a continuous improvement in the network’s long-run absorptive capacity.
From a practical perspective, the distinct performance between random and targeted attacks implies that global oil and coal value flows can withstand scattered minor disruptions but remain highly vulnerable to intentional shocks targeting major energy economies. For energy importers and relevant policymakers, diversifying supply sources and establishing emergency energy reserves are essential to enhance the absorptive capacity of the energy value chain.
3.4.2. Buffering Capacity—Average Clustering Coefficient
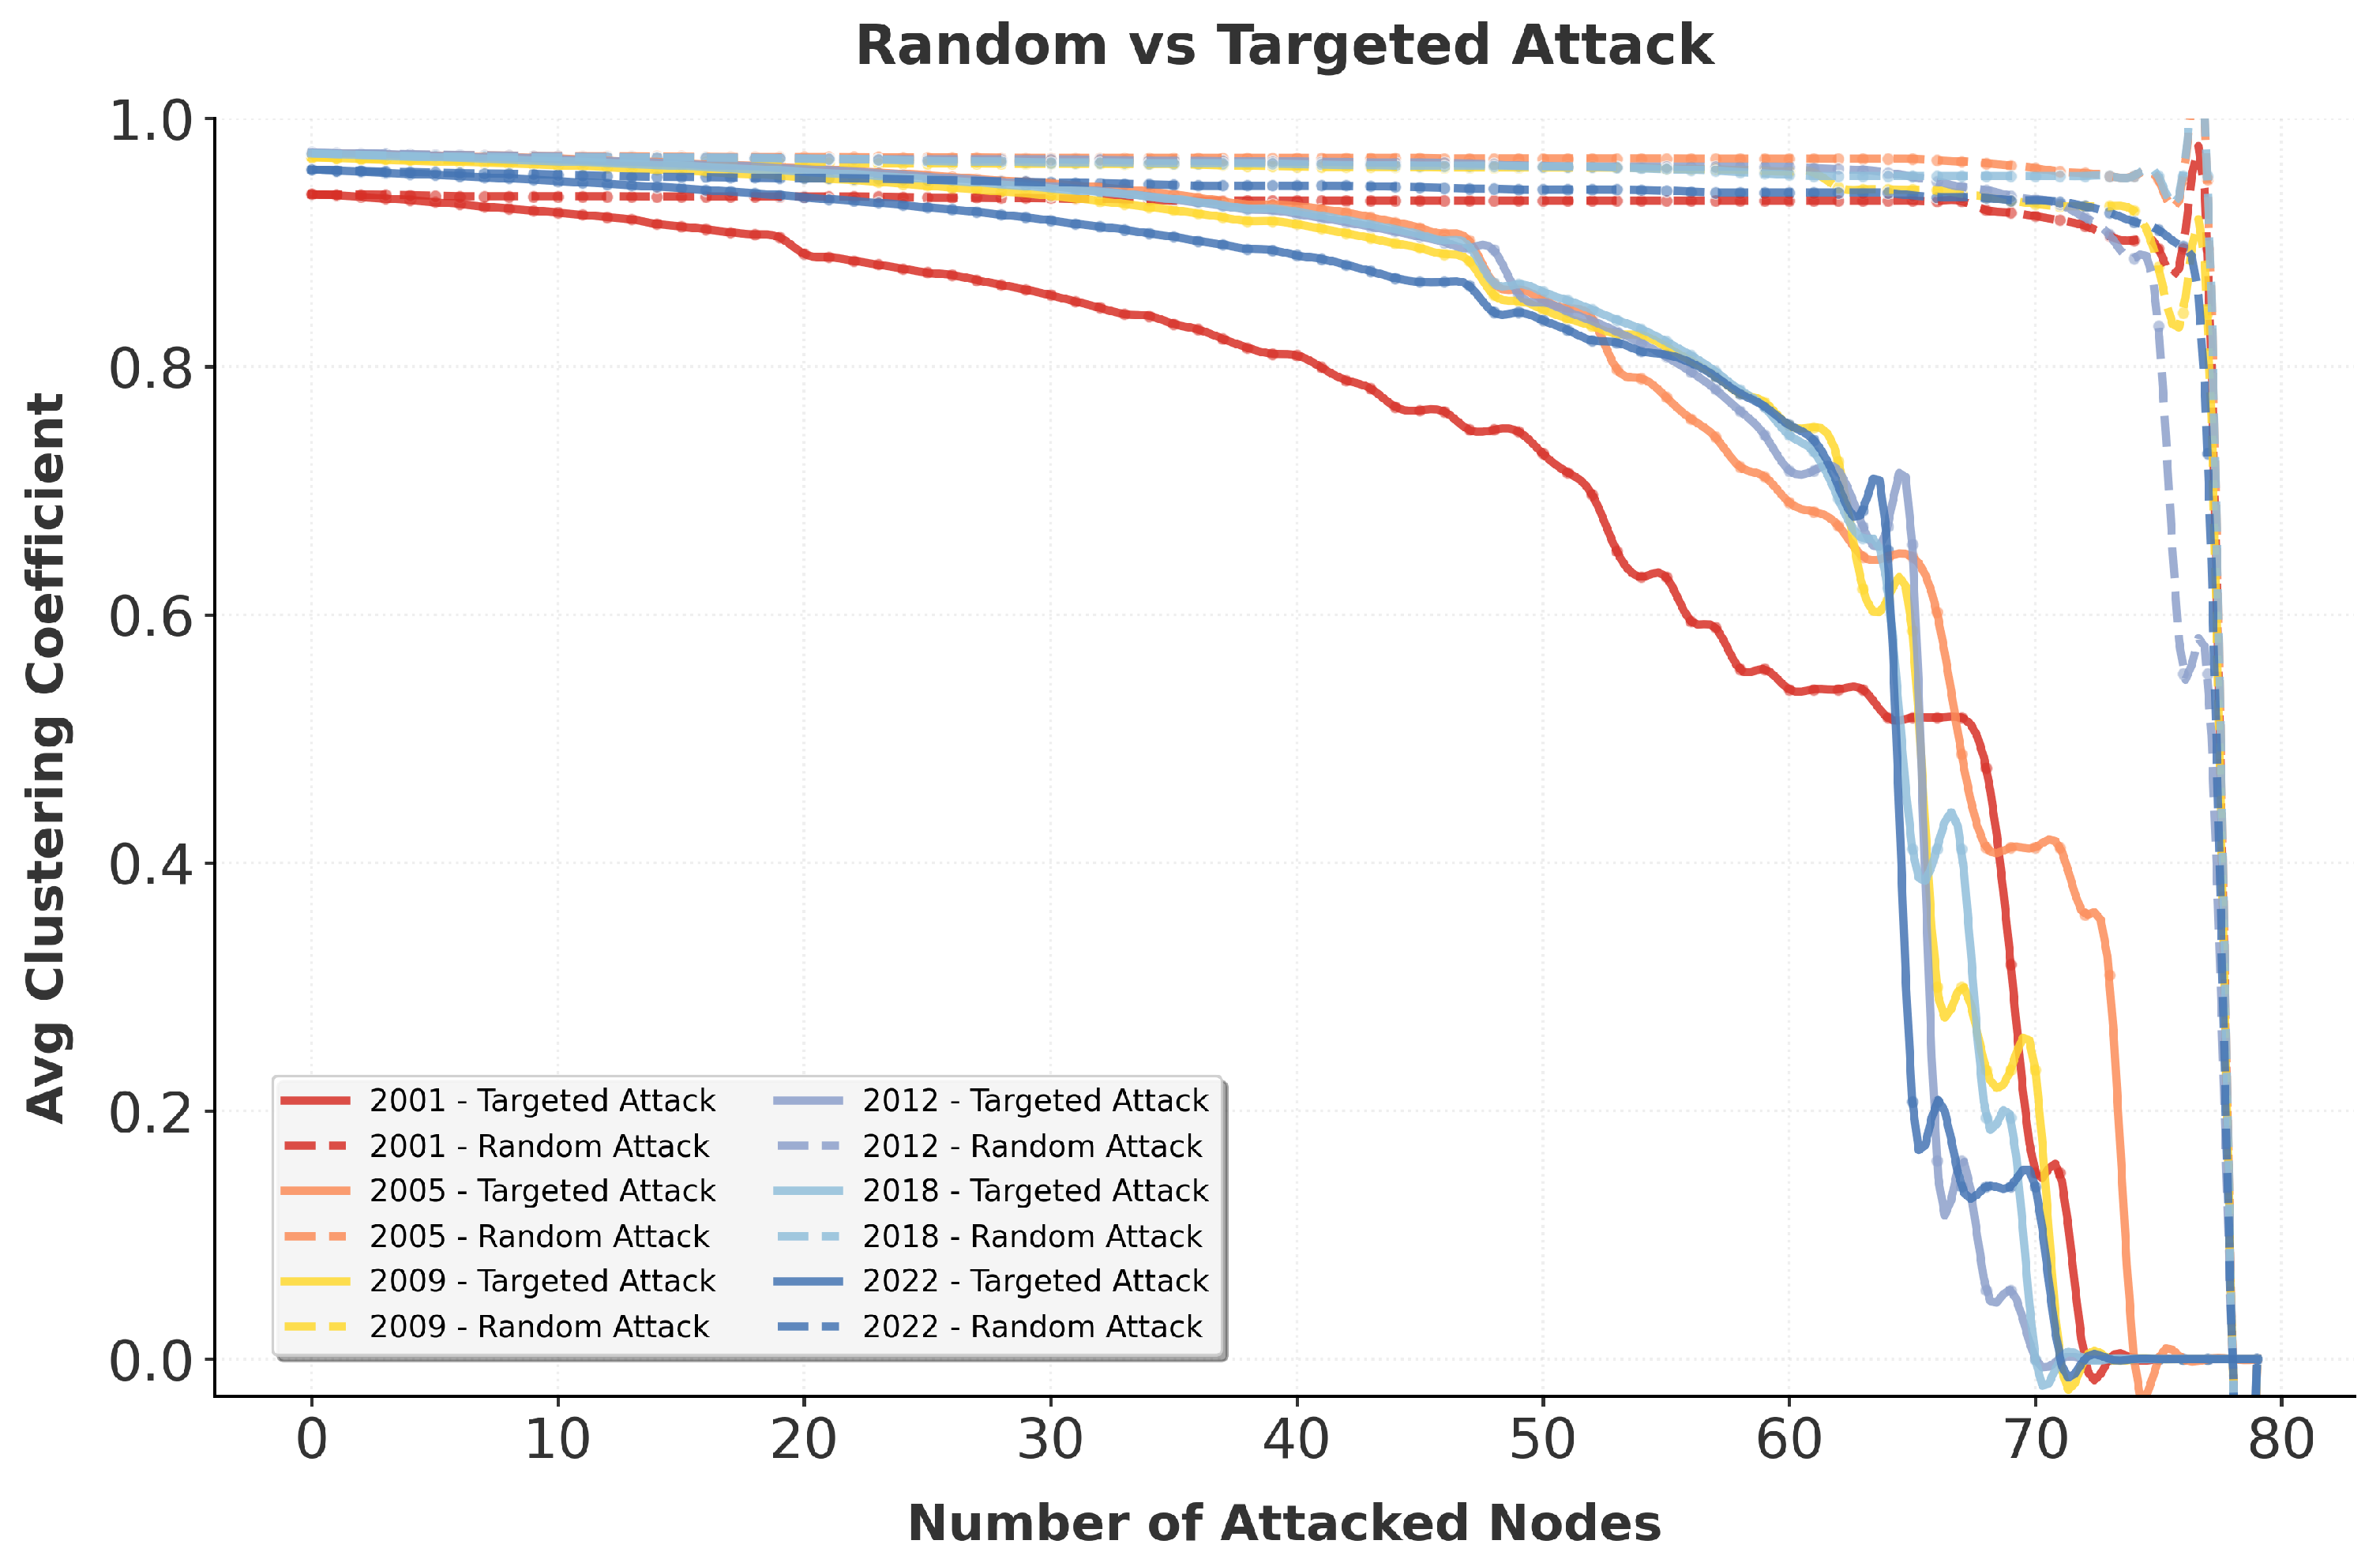
Figure 7 presents clustering coefficient dynamics consistent with network efficiency
trends. The network showed relatively higher structural vulnerability in 2001, 2005, 2009, 2011–2013, and 2022. Random attacks lead to greater short-term volatility in clustering coefficients, while targeted node removal causes a progressive decline. This is attributed to tight local agglomeration within the network: deleting core nodes will disconnect adjacent participants. Such stepwise declines are often accompanied by the simultaneous loss of multiple nodes with comparable importance [
29].
The above results reflect the local connection characteristics of the global energy value network. Dense regional linkages enhance short-term collaboration but also reduce the network’s buffering ability when core regional players face disruptions. To improve regional anti-risk performance, economies within closely connected clusters need to build alternative cooperative partnerships and avoid over-reliance on a single regional core.
3.4.3. Recovery Capability—Average Closeness Centrality
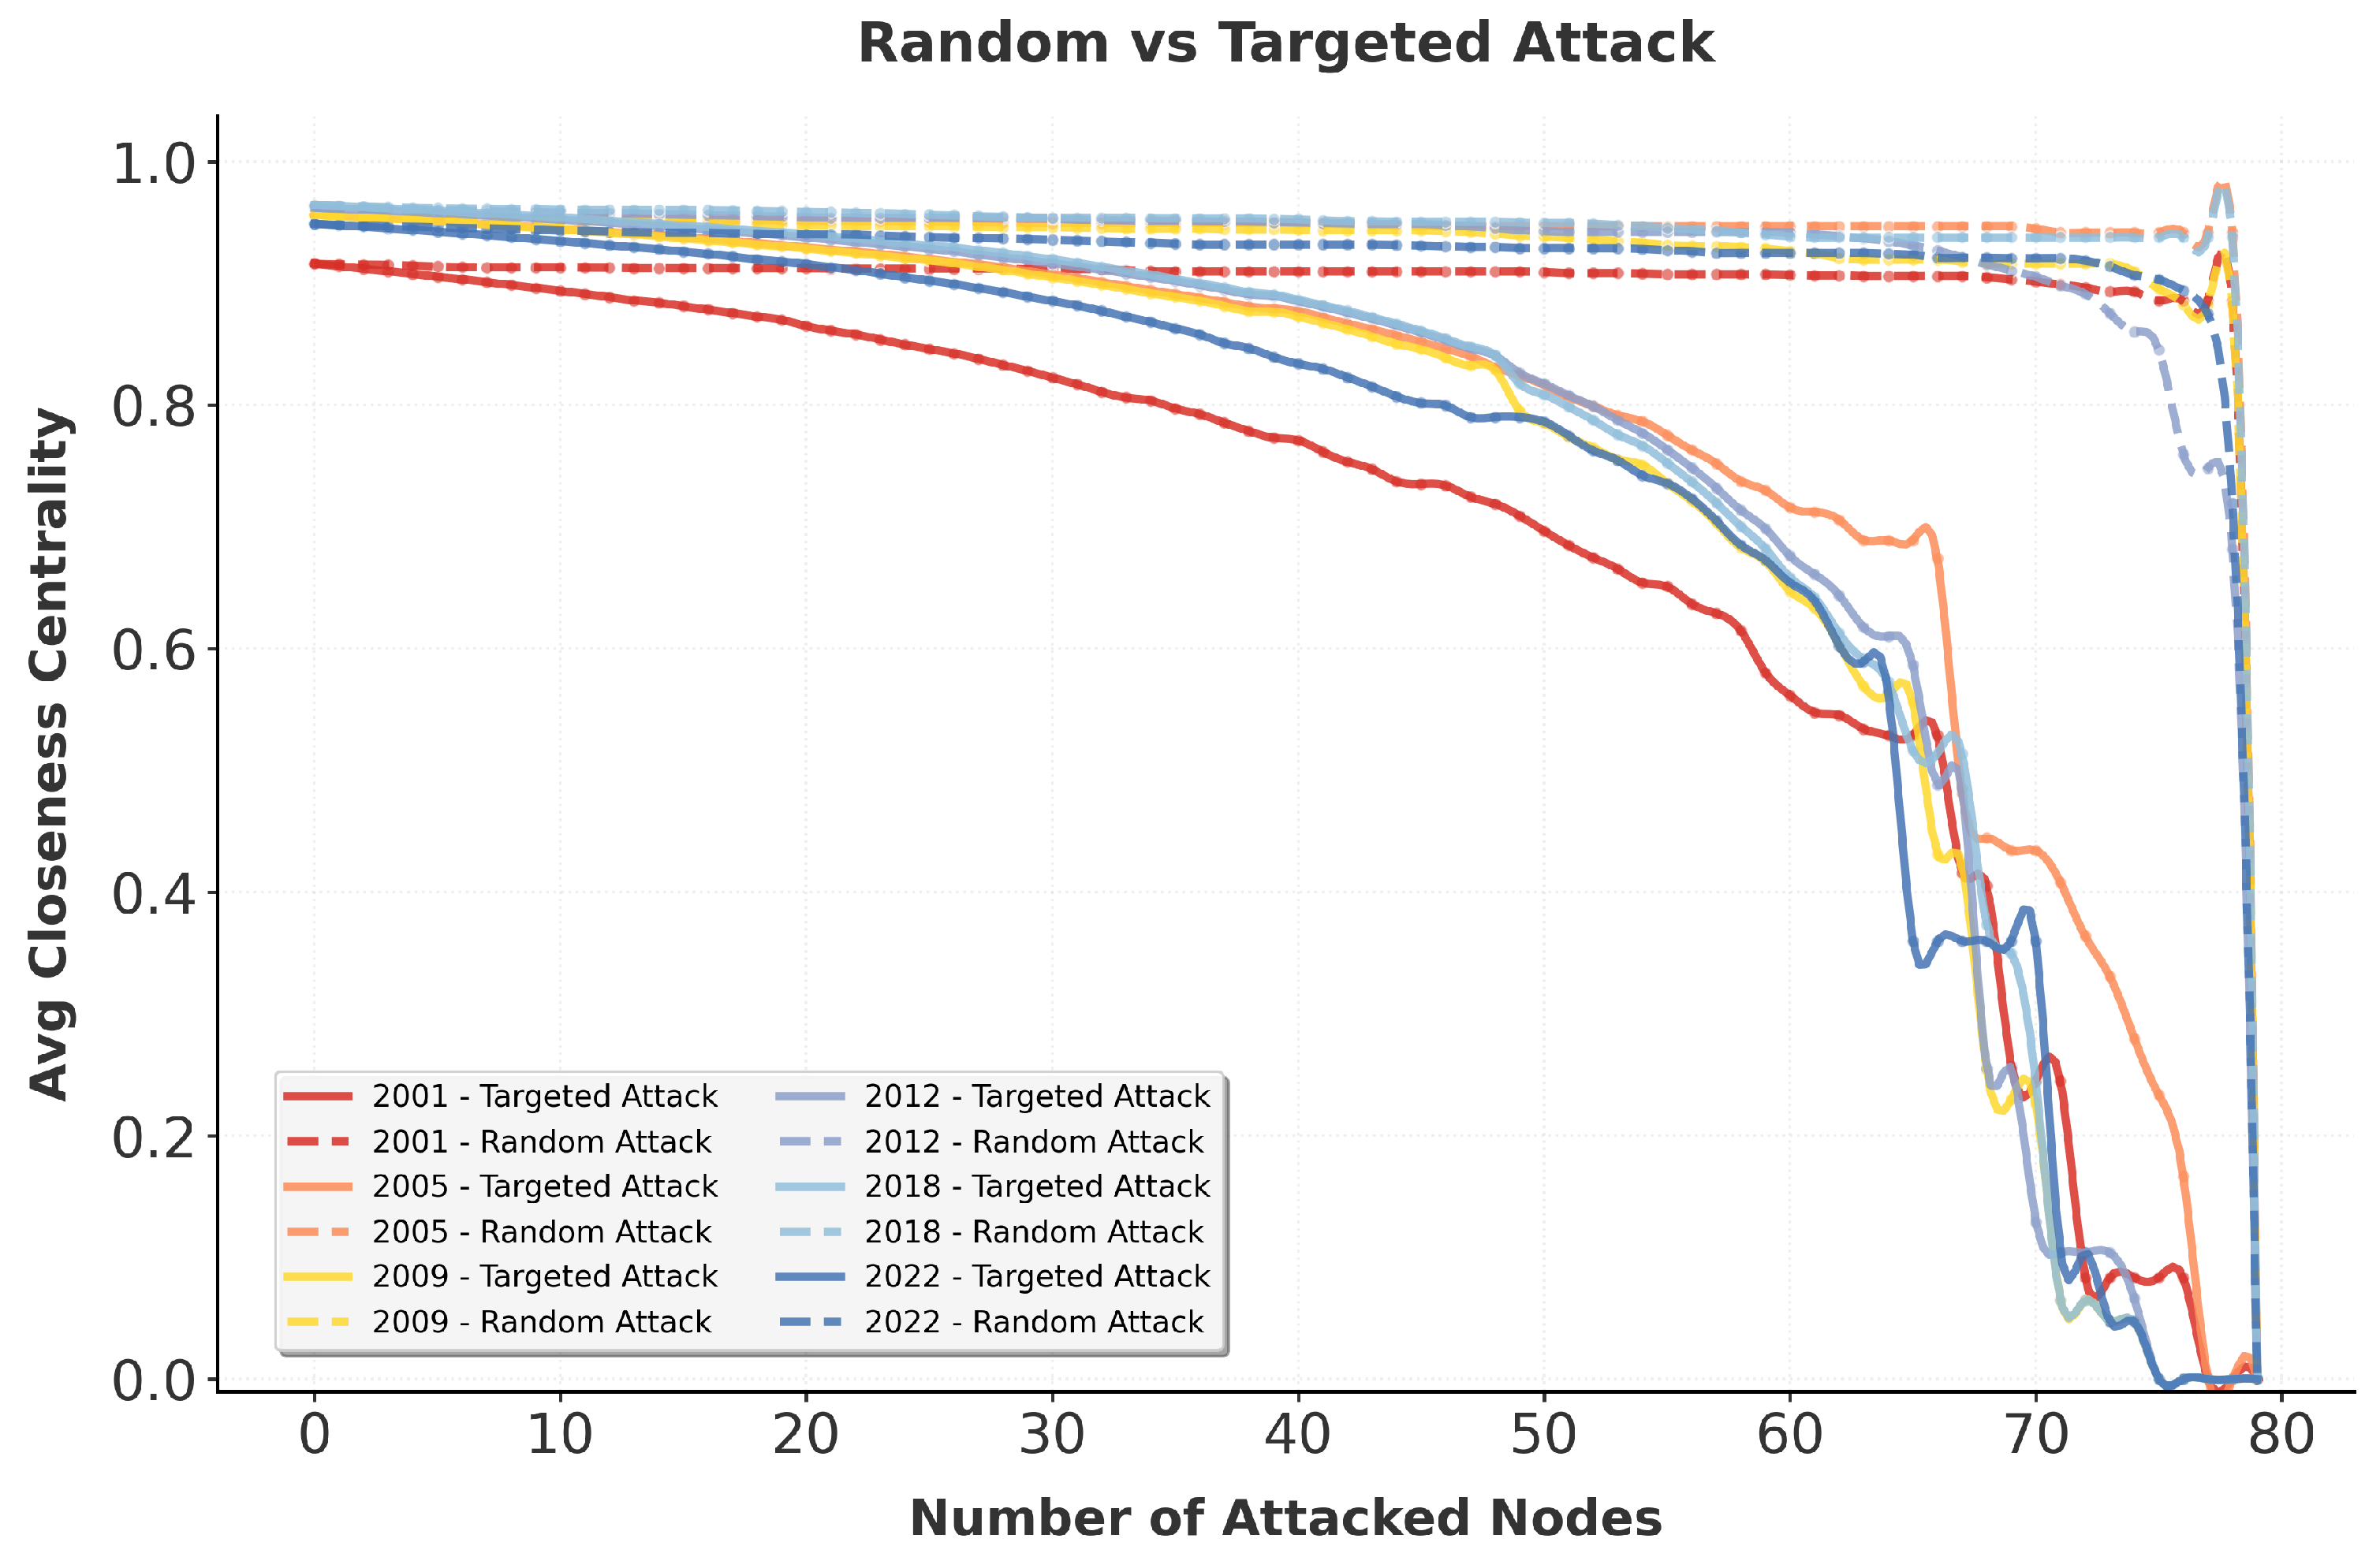
Figure 8 shows highly consistent closeness centrality curves across all years under random attacks. A decentralized node distribution provides abundant alternative transmission paths, sustaining overall connectivity amid stochastic damage. Under targeted elimination, the 2001 curve fell below 0.6 when fewer than 60 nodes were removed due to excessive concentration of core nodes and insufficient alternative connectivity routes in the early stage.
Continuous structural optimization by 2005 is correlated with richer alternative value flow channels and boosted the network’s recovery potential. A series of adverse events occurring from 2009 to 2022 are correlated with weakened functions of core hubs and a continuous forward shift of the critical collapse threshold.
In practice, sufficient alternative transmission paths are the core guarantee for post-shock recovery. The findings suggest that all participants should actively expand multi-party energy trade partnerships to diversify value flow routes and strengthen the network’s post-disruption recovery capability.
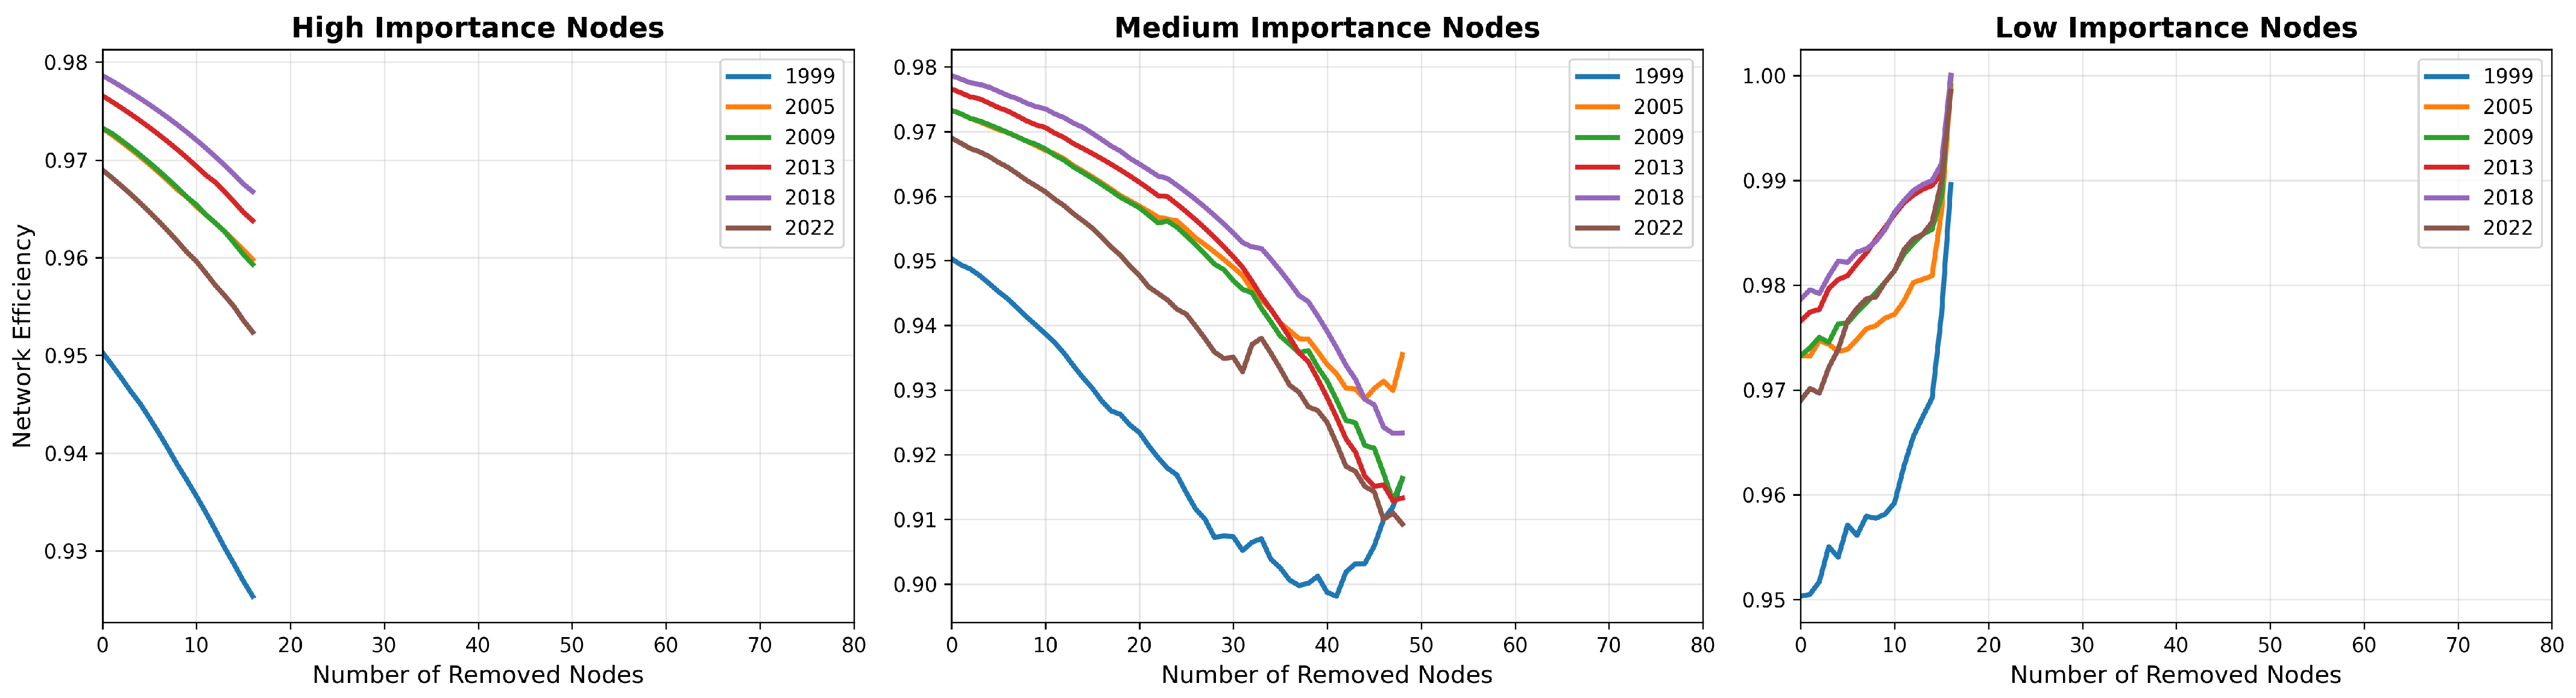
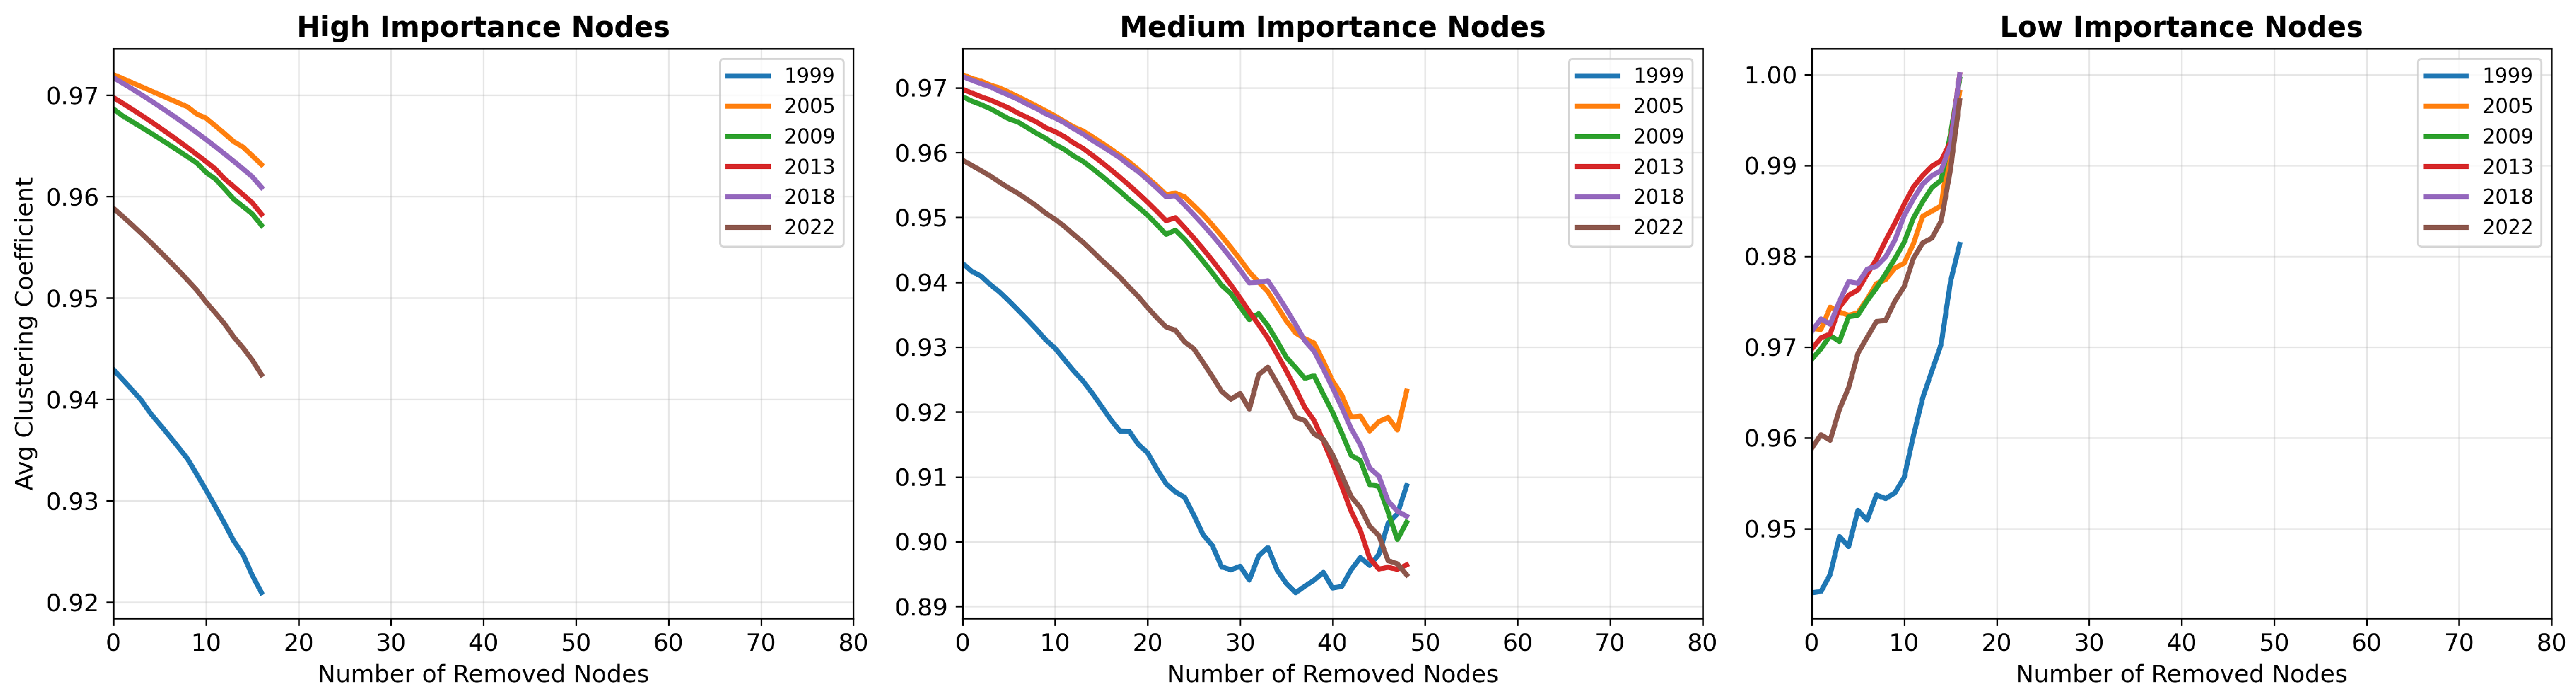
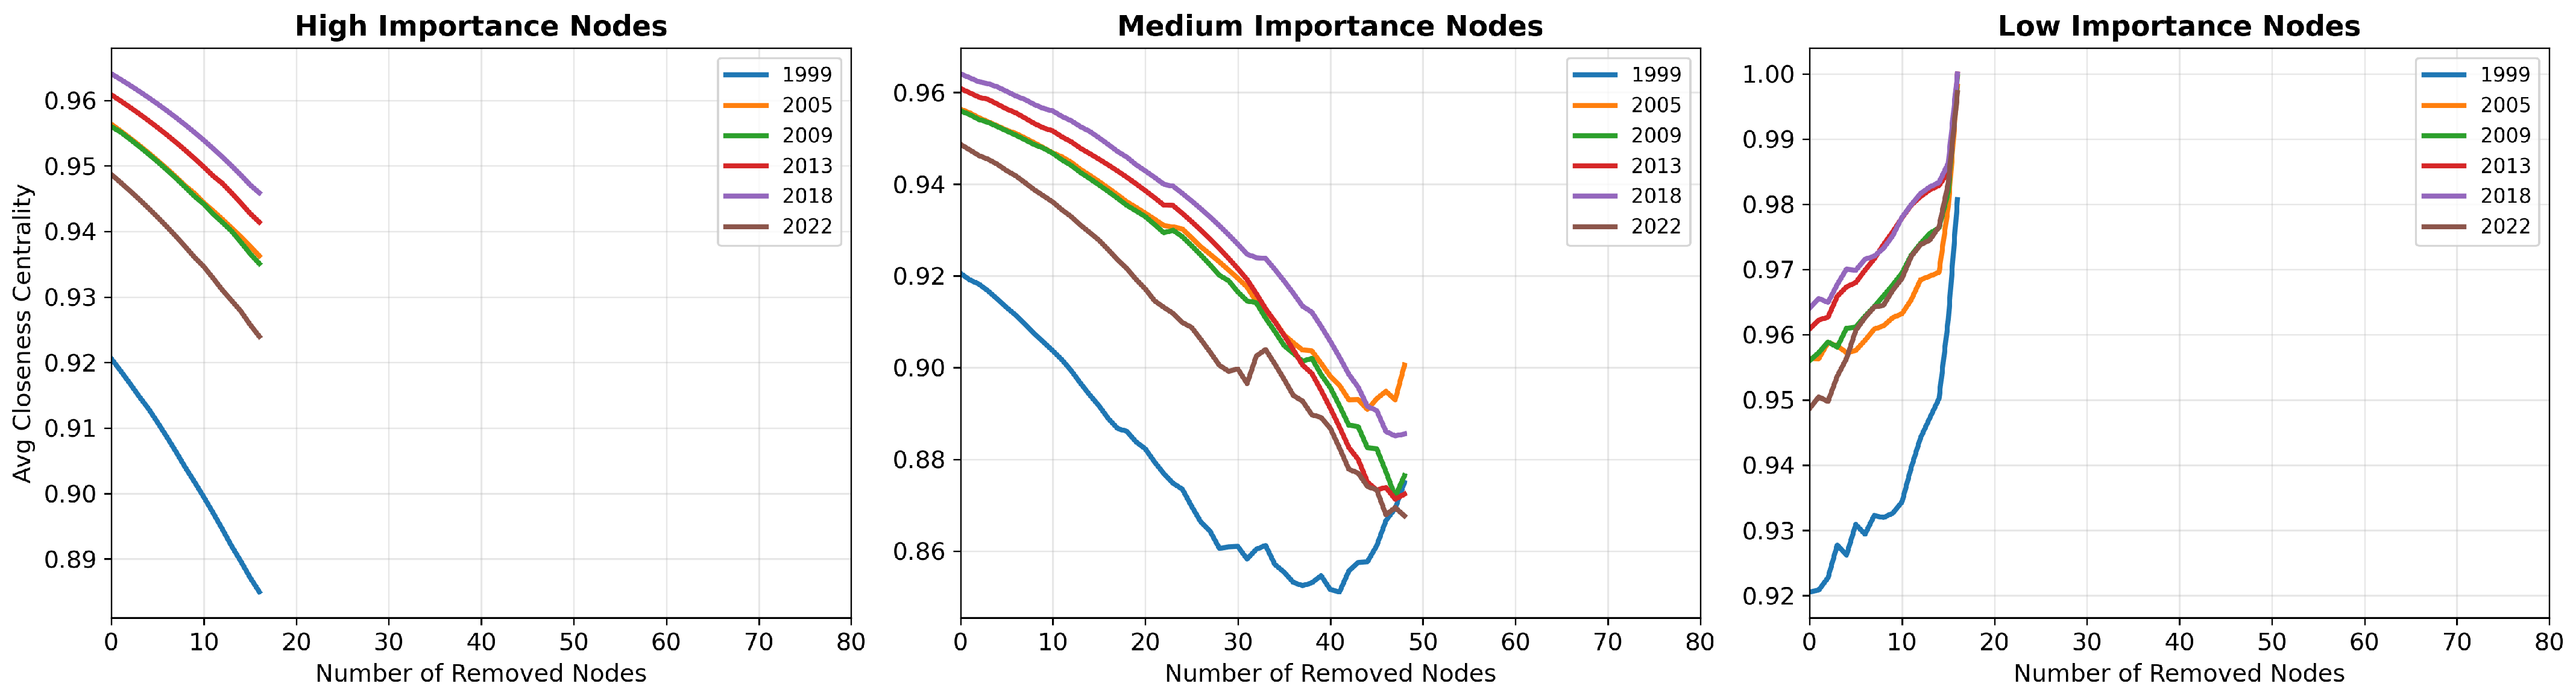
3.4.4. Resilience Under Hierarchical Targeted Attacks
To further distinguish the heterogeneous impacts of nodes with different importance levels on network resilience, hierarchical node removal simulations are conducted for high-, medium-, and low-importance node groups classified by entropy-weighted comprehensive scores. Consistent with other analyses in this study, results for six representative years (1999, 2005, 2009, 2013, 2018, and 2022) are presented in
Figure 9,
Figure 10 and
Figure 11. The three core resilience indicators—network efficiency (absorptive capacity), average clustering coefficient (buffering capacity), and average closeness centrality (recovery capacity)—are adopted to quantify the network’s response to shocks.
Across all three indicators, significant hierarchical differences are observed, revealing a stable core-periphery structure of the global coal and oil value network.
First, attacks on high-importance nodes lead to the most severe and rapid degradation of network resilience. As shown in the left panels of all three figures, even the removal of only 10–20 high-importance nodes triggers a clear and continuous decline in network efficiency, clustering coefficient, and closeness centrality. These core economies dominate cross-border value transmission, structural connectivity, and local agglomeration. Their functional failure directly undermines the network’s absorptive, buffering, and recovery capabilities, indicating that the network is highly vulnerable to shocks targeting central hubs. The decline rate varies slightly across years, with 1999 seeing the steepest drop, reflecting a less diversified network structure at that time.
Policy implication: High-importance nodes represent major energy producers, exporters, and pivotal trade powers. Protecting the stable operation and normal trade of these core economies is the top priority for maintaining the overall stability of the global coal and oil value network. Relevant international bodies and national governments should strengthen multilateral communication to avoid excessive sanctions or conflicts involving core energy players.
Second, attacks on medium-importance nodes cause a moderate and gradual erosion of network resilience. In the middle panels, all indicators exhibit a steady downward trend as nodes are removed, with a slower rate of decline compared to attacks on high-importance nodes. These nodes act as transitional bridges between core and peripheral economies and facilitate cross-group value flows. Their gradual removal weakens network connectivity and efficiency over time but does not trigger an immediate collapse, reflecting their supportive rather than foundational role in the network. Notably, some years show minor fluctuations in the curves, likely due to redundant connections that temporarily offset the impact of node removal.
Policy implication: As transitional hubs, medium-importance economies undertake key transit and re-export functions. Maintaining smooth trade cooperation with these countries helps form a buffer zone between core and peripheral markets and slows down the spread of regional risks.
Third, attacks on low-importance nodes have negligible adverse effects on network resilience. The right panels show that all three indicators remain stable or even fluctuate slightly upward during the removal of low-importance nodes. Peripheral economies have limited influence on the overall value chain, and their connections are often redundant or easily replaceable. The network thus exhibits strong fault tolerance against shocks to these marginal participants. The upward fluctuations, particularly visible in later years, may stem from minor structural readjustments that optimize connectivity after removing redundant or poorly connected peripheral nodes.
Policy implication: Peripheral energy participants have limited systemic influence. For major importers, adjusting trade structure by properly replacing peripheral suppliers will not bring large-scale systemic risks, which provides more flexible space for supply chain optimization.
Across all three node groups, the hierarchical pattern remains consistent across all selected years, confirming the persistence of the core-periphery structure from 1999 to 2022. The results also explain why the network collapses rapidly under full targeted attacks, as such attacks prioritize the removal of high-importance nodes first. These findings highlight the importance of classifying risk prevention targets: differentiated risk warning and protection mechanisms should be formulated for core, transitional, and peripheral economies according to their nodal status.
3.5. Analysis of the Overall Resilience Level of the Network
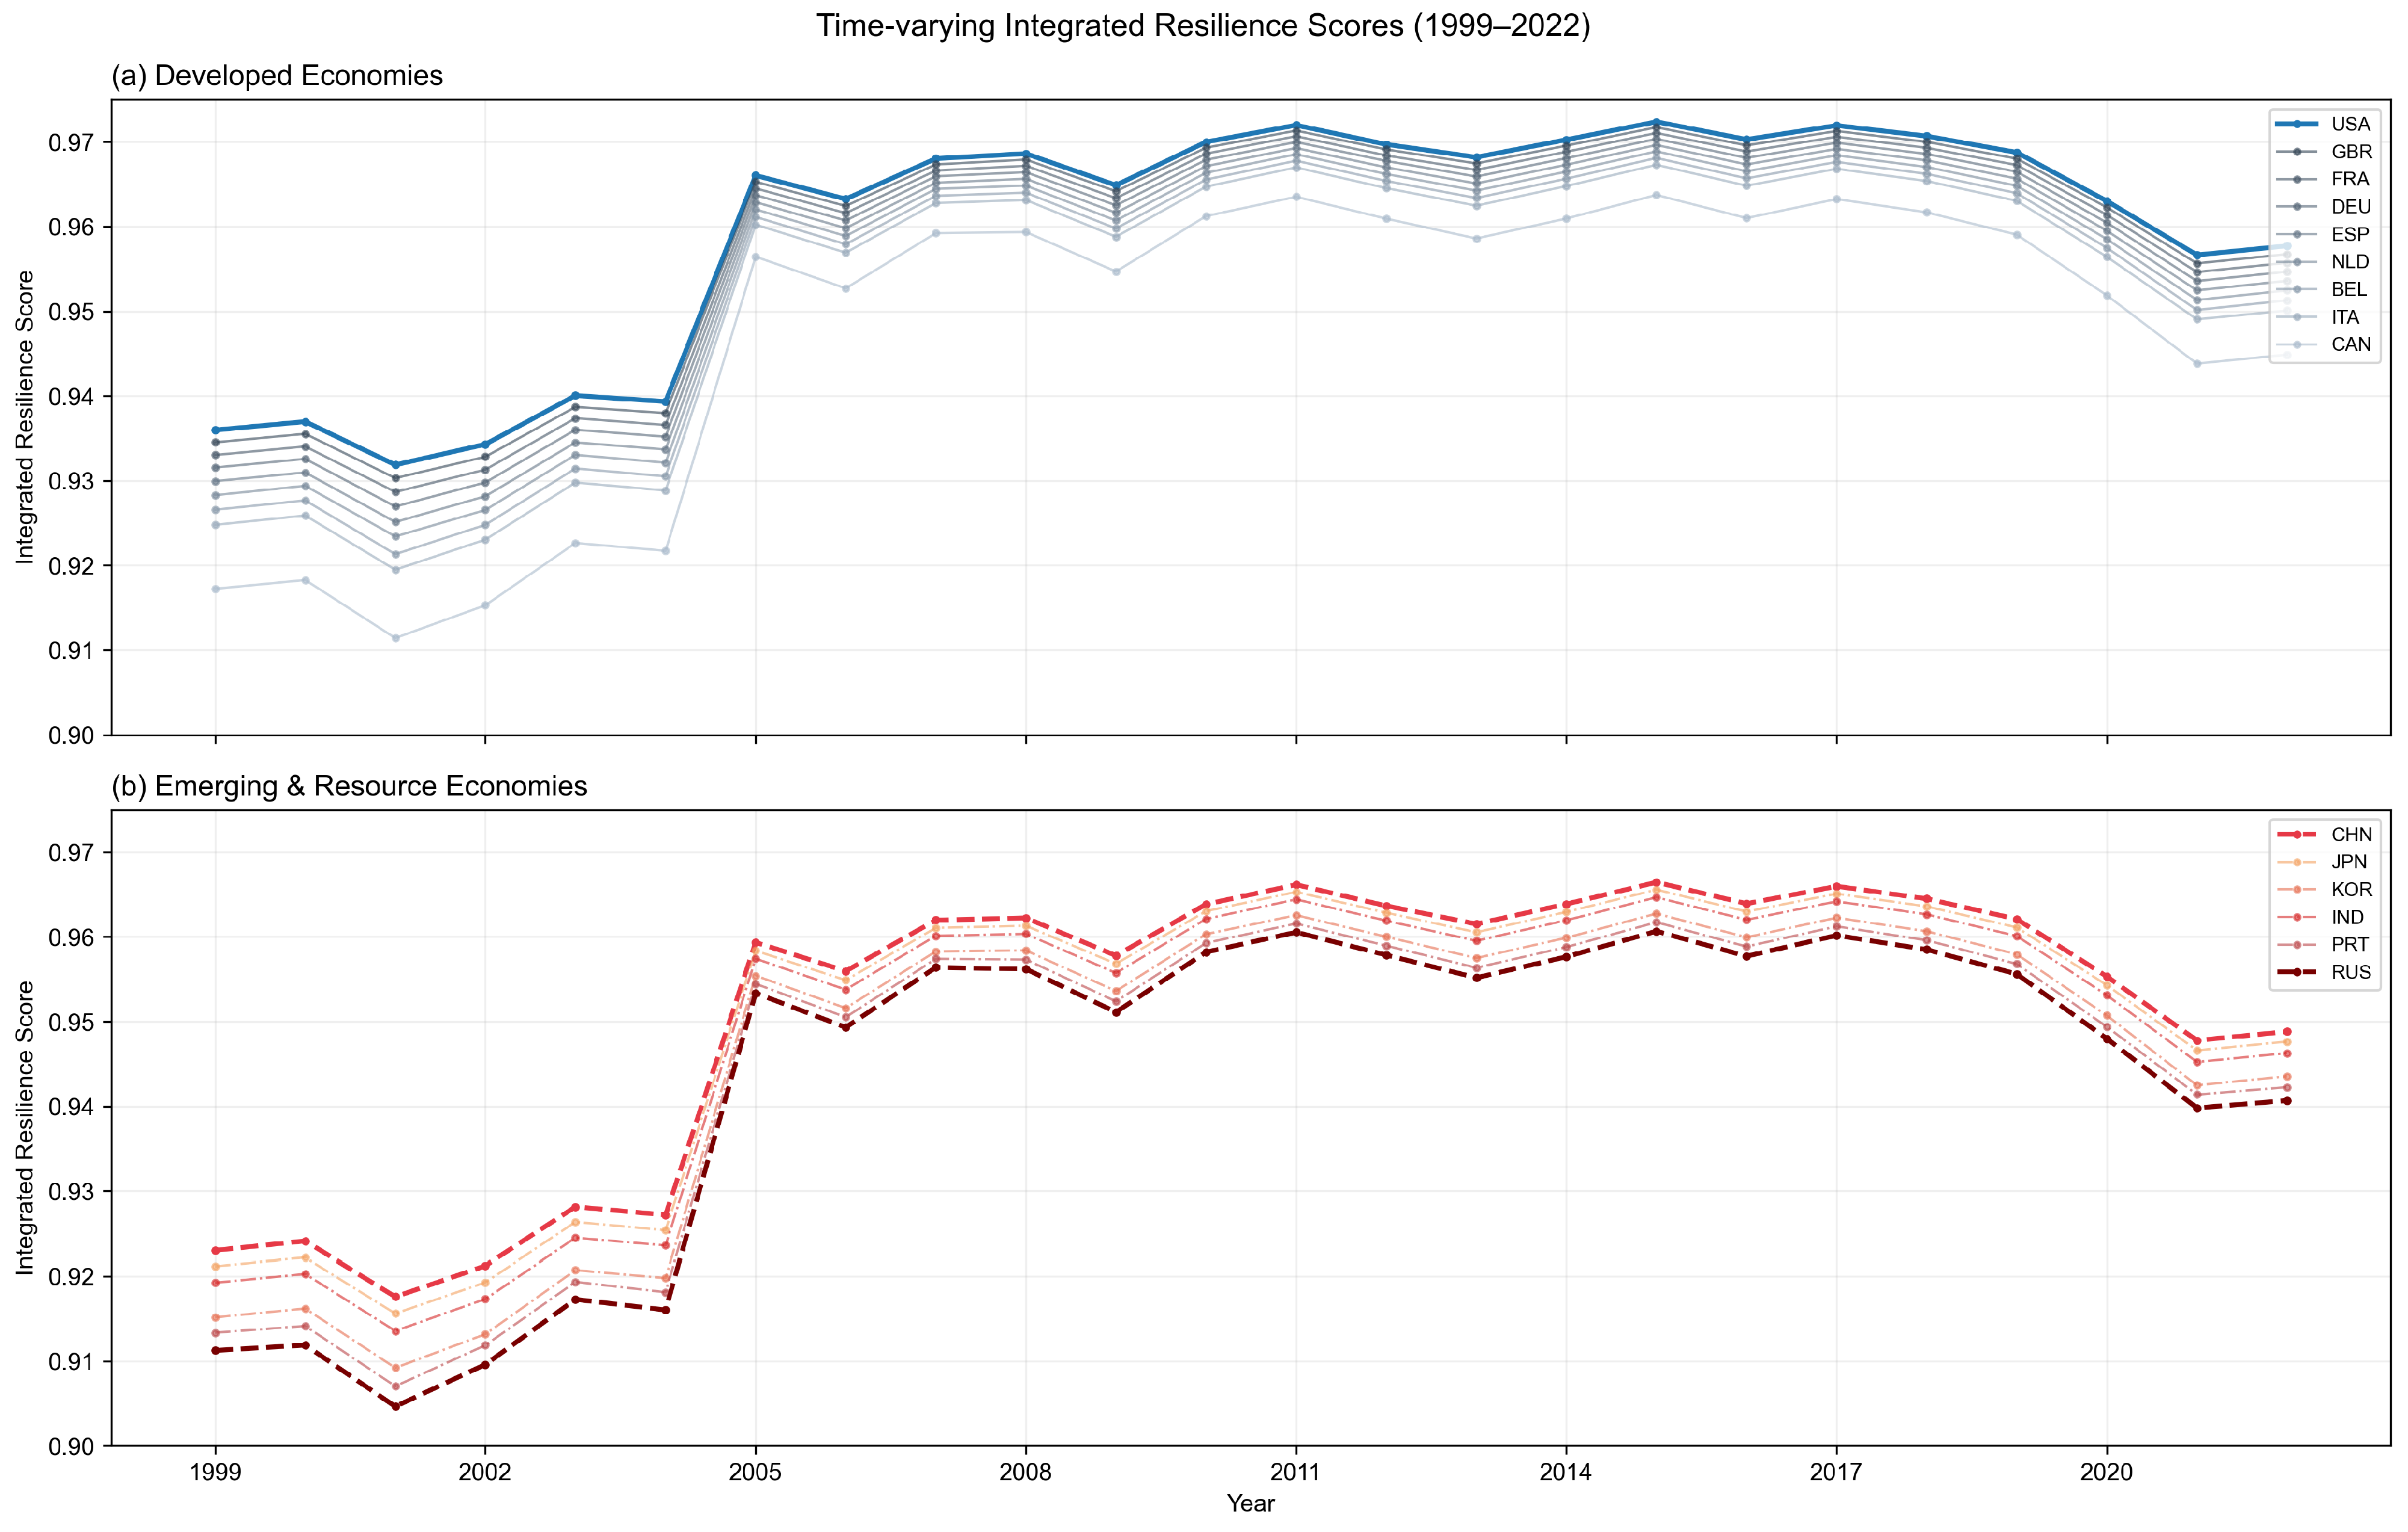
The entropy weighting framework (Equations (20)–(25)) is reused to aggregate three resilience dimensions into comprehensive composite scores, which are displayed through two grouped line subplots to separately illustrate the resilience evolution of developed and emerging resource-related economies.
Figure 12 depicts the time-varying integrated resilience of the top 15 sample economies. All composite resilience scores are aggregated via the entropy weighting method illustrated in Equations (20)–(25). For clearer trend comparison, the sample economies are categorized into two subgroups according to their development stage and roles in global energy trade: mature developed economies and emerging and resource-dependent economies, and grouped line graphs are applied to distinguish the long-term resilience evolution of the two economic groups. On the whole, the integrated resilience of most sample economies rose gradually from 1999 to 2022, driven by improved value transmission efficiency, tighter cross-border energy linkages and expanding bilateral trade flows. Better network connectivity helps the system absorb external shocks, mitigate short-term disturbances and recover rapidly after disruptions. Obvious downward dips in resilience can be observed in 2001, 2009, 2013, 2016 and 2021 across most economies, which align with successive global adverse shocks. These crises cover global economic recessions, international financial turbulence, Iranian oil export restrictions, regional armed conflicts and cross-border geopolitical frictions. Specifically, the widespread resilience slump in 2009 was triggered by OPEC’s joint production cuts that suppressed cross-border energy trade, whereas the sustained decline during 2021–2022 stemmed from disrupted supply from major energy exporters. The removal or supply disruption of core trade nodes would block critical energy transmission channels and drag down the overall network resilience significantly. From this perspective, continuous tracking and supervision of core economies are essential. Timely policy arrangements can effectively prevent systemic risks and sharp falls in network resilience caused by sudden supply shortages or trade disputes.
3.6. Analysis of the Impact of Key Countries on the Network
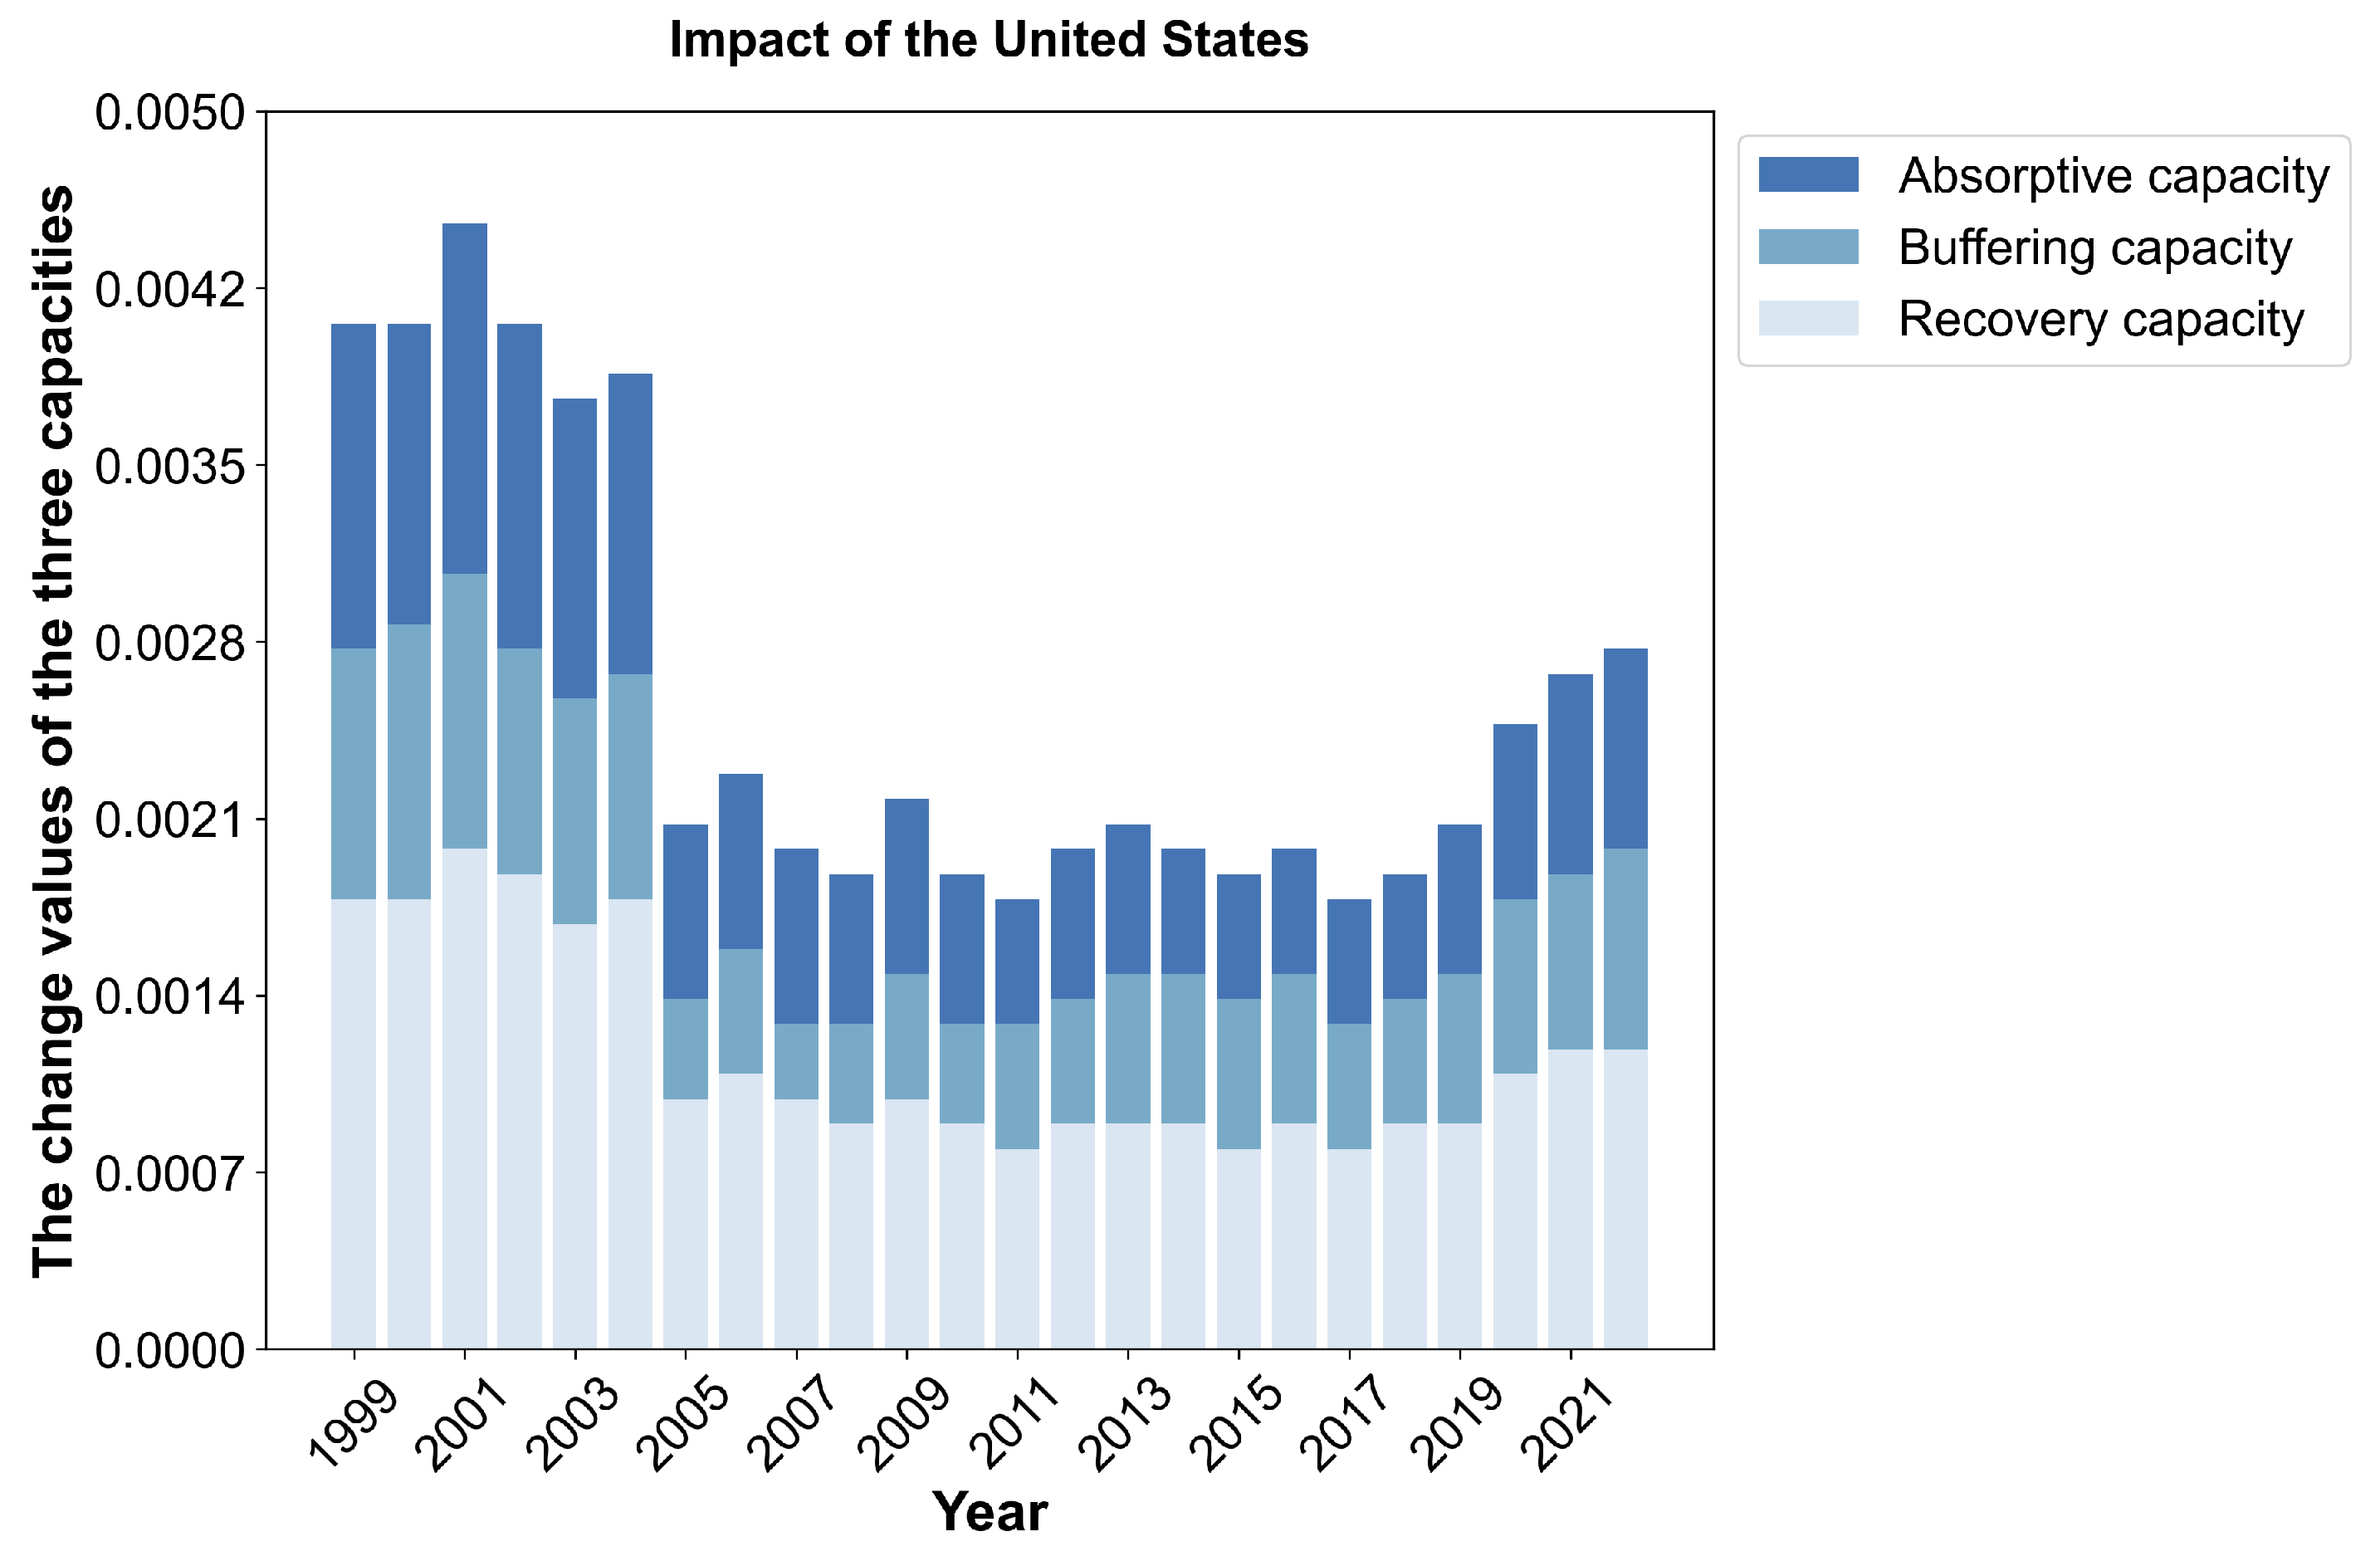
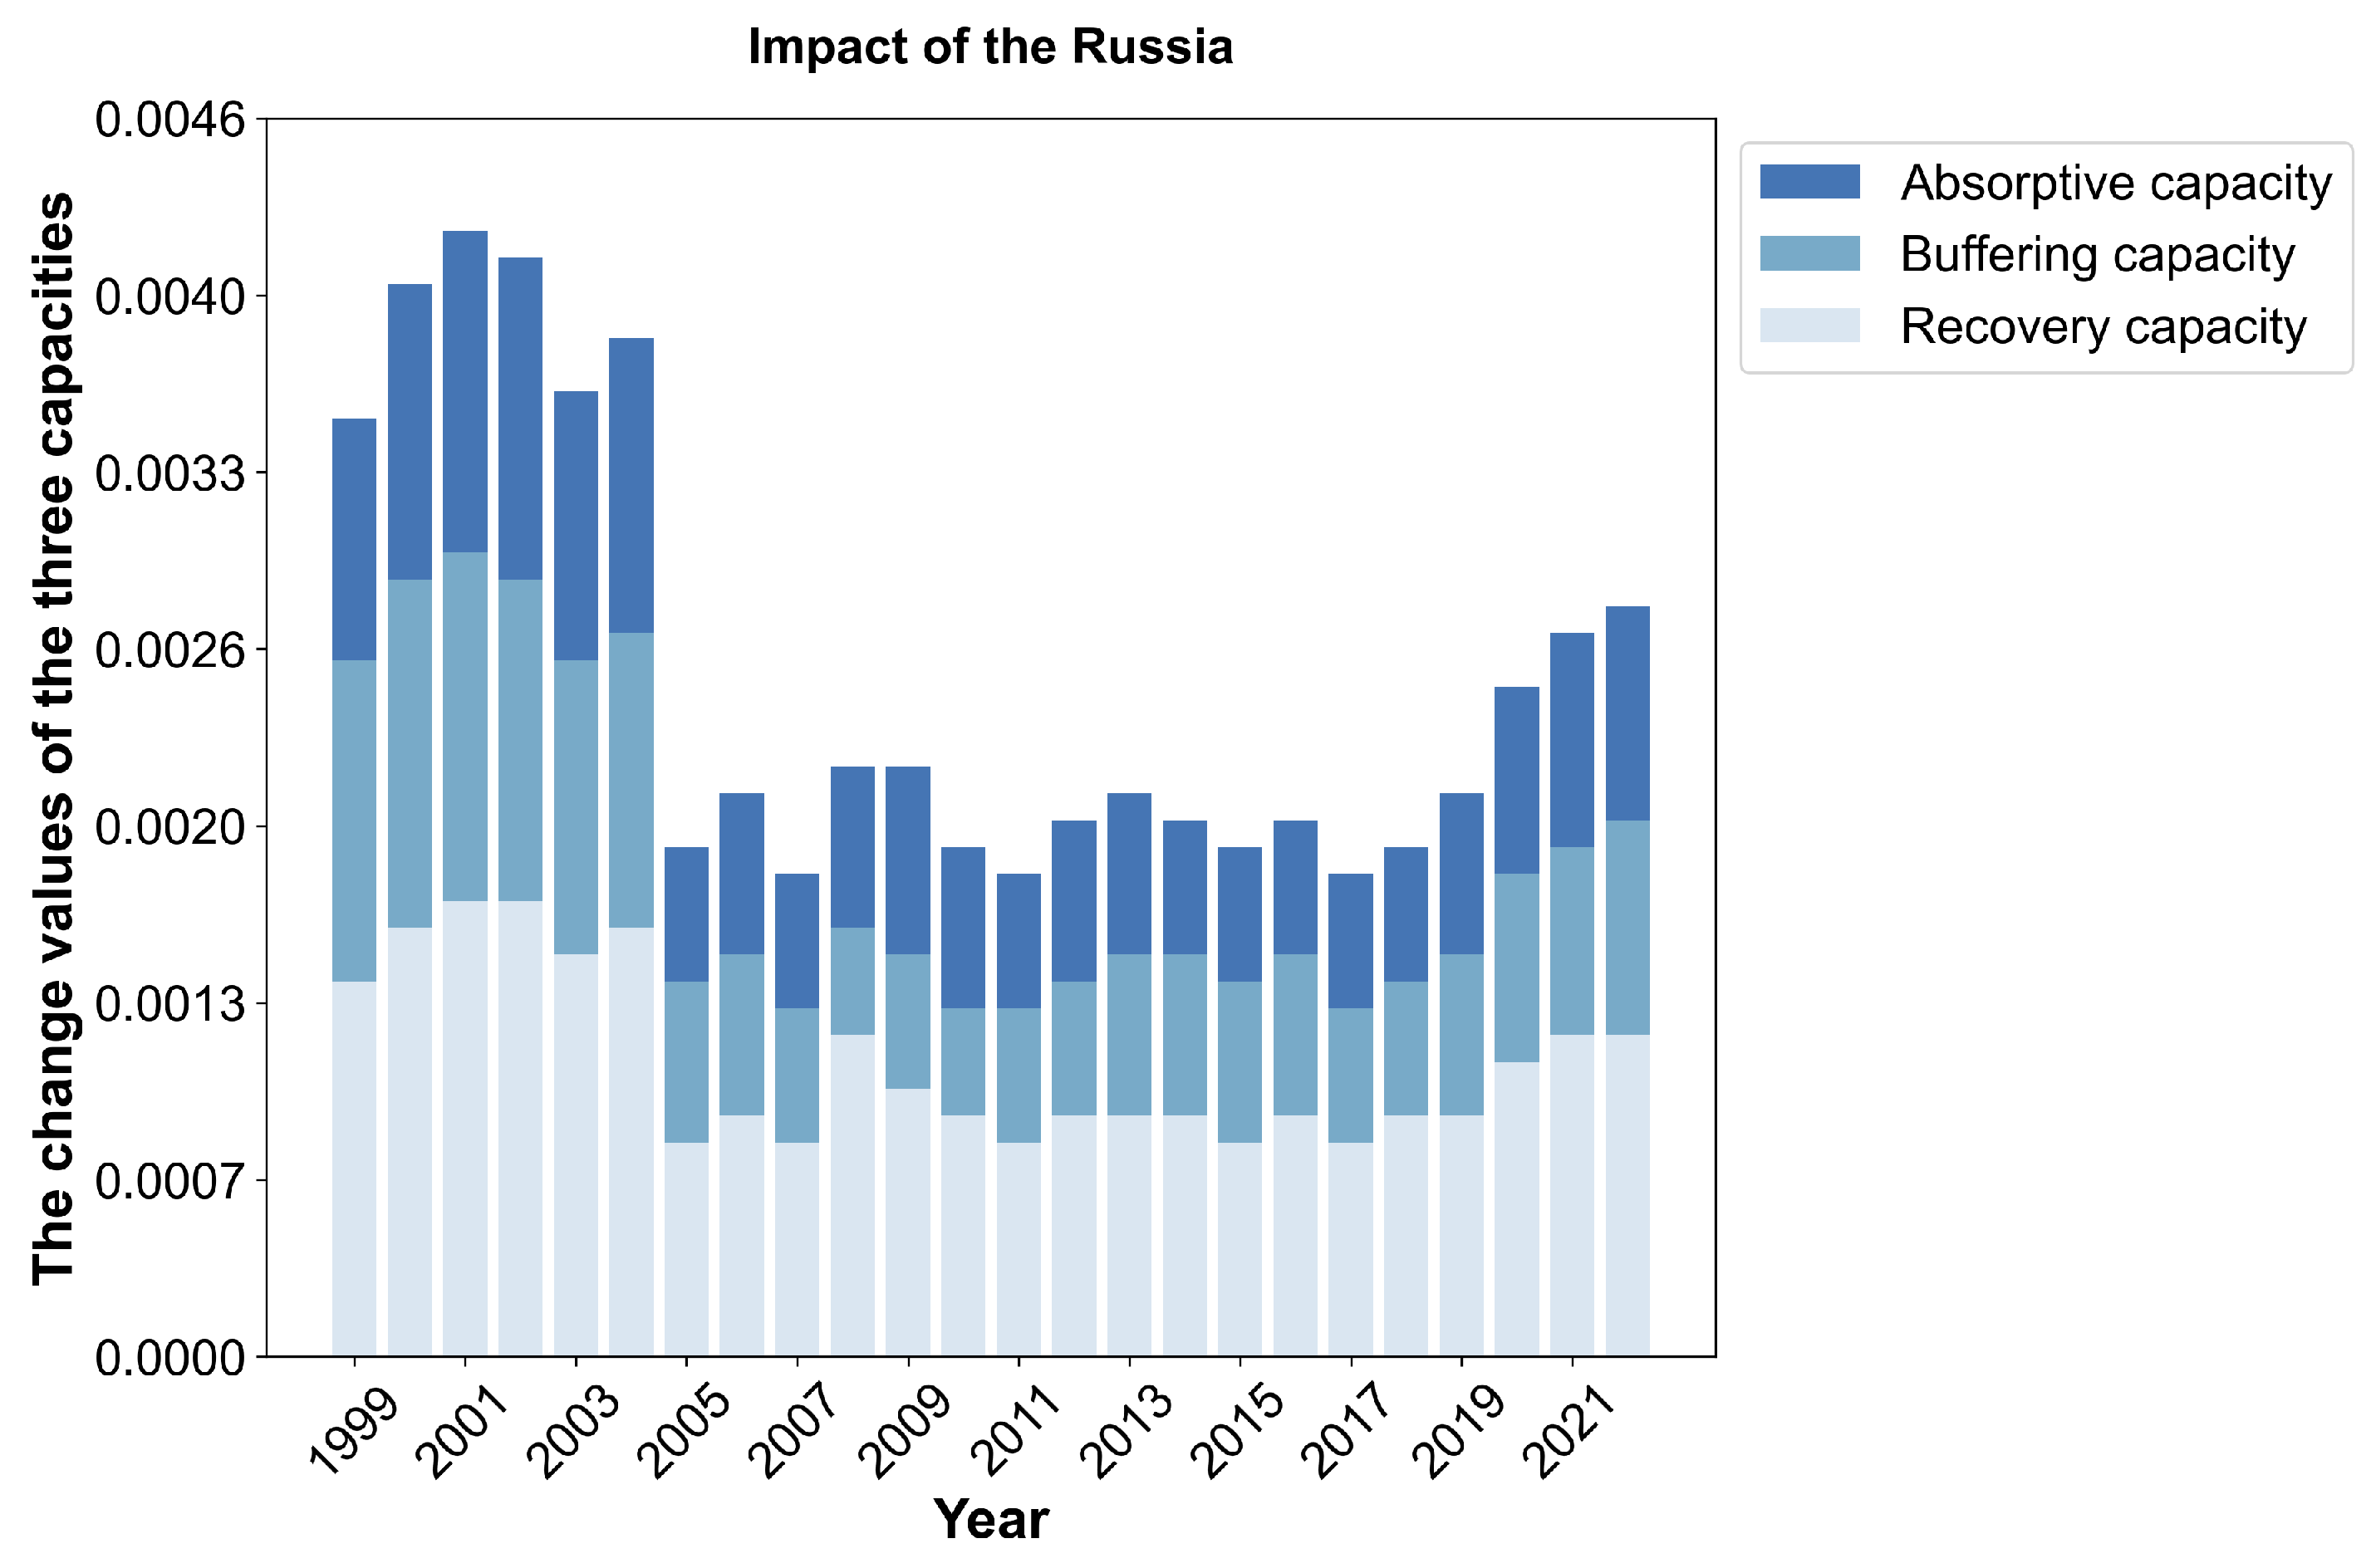
Two representative high-ranking economies (the United States and Russia) are selected for independent node deletion simulation: the US owns the largest aggregate value volume, and Russia records the highest net outbound value flows. Comparative resilience changes across three dimensions are quantified to evaluate their individual systemic influence.
3.6.1. United States
As displayed in
Figure 13, deepening globalization and diversified distribution of global coal and oil value activities have enabled more economies to participate in the value chain, which has gradually diluted the overall dominant position of the United States in the network.
The US exerted its strongest multi-dimensional network influence during 1999–2003 under a unipolar geopolitical landscape. Its influence declined markedly from 2004 to 2008, a period with continuous unrest in major oil-producing economies such as Iraq, Nigeria, and Venezuela that shifted global energy focus elsewhere. The 2008 subprime crisis is correlated with a cyclical trough in its systemic influence.
US influence recovered steadily after 2009 but never returned to the early peak level. Adjustments in domestic energy policies and economic recovery lifted its contributions to network buffering and recovery capacity. From 2020 to 2022, rising shale energy output in the US and global energy restructuring driven by regional tensions are correlated with strengthened capacity to absorb and offset systemic network risks.
Practical insight: As a top energy consumer and trading power, changes in US energy policies and market conditions produce nationwide spillover effects. All participants need to fully assess the externalities of the US energy strategy when arranging cross-border energy trade.
3.6.2. Russia
Figure 14 reveals a long-term declining and gradually flattening trend in Russia’s network influence, which remains lower than that of the United States, consistent with the preceding nodal ranking results. Periodic dips in influence for both countries occurred in 2002, 2005, 2008, 2011, 2014, 2017, and 2018. These time points are correlated with major events, including Hurricane Katrina, the global financial crisis, the Libyan conflict, domestic turbulence in Venezuela, OPEC supply adjustments, Iranian oil sanctions, and Sino-US trade frictions. Large-scale global systemic shocks weaken the marginal impact caused by the removal of a single country. Among all indicators, network closeness centrality is most sensitive to the removal of the US or Russia.
Practical insight: As a major energy exporter with large net outward value flows, Russia plays an irreplaceable role in global coal and oil value networks. Maintaining stable trade relations with key energy-exporting countries is a vital approach to securing a diversified and sustainable energy supply for importers.
4. Discussion
4.1. Theoretical Implications and Empirical Findings
The existing literature has extensively investigated the structural characteristics and resilience of global fossil fuel trade networks using aggregate bilateral trade volume data [
14,
15]. Most existing studies identify core economies and assess systemic risk resistance based on total trade volumes. This approach inevitably overstates the industrial weight of resource-rich countries with large-scale raw fuel exports, while ignoring the actual value creation capacity of industrialized importing nations [
24]. Furthermore, mainstream resilience assessments mainly measure the recovery of pure physical trade flows under simulated shocks, with little attention paid to the restoration of domestic value-added capacity embedded in cross-border energy cooperation [
17]. To fill these research gaps, this paper constructs an integrated coal-oil value-added network based on OECD-TiVA input-output tables. From a value creation perspective, it distinguishes three dimensions of network resilience: absorption capacity, buffering capacity and recovery capacity. Targeted node attack simulations are further conducted to quantify heterogeneous systemic impacts of individual economies, complementing the existing analytical framework for energy network resilience.
This paper tracks the long-term evolutionary patterns of global coal and oil value networks over 24 years and quantifies network-wide resilience and country-specific systemic impacts via node removal simulations. The findings provide targeted policy implications for safeguarding energy security amid intensifying geopolitical tensions, climate governance initiatives and the global energy transition. The core conclusions are elaborated upon as follows.
Network visualizations reveal that major resource exporters including Saudi Arabia and Israel occupy prominent positions in conventional gross trade networks yet hold limited core status within value-added networks. For resource-exporting economies, this implies an urgent need to transform primary export-oriented industrial layouts and upgrade coal and oil industrial chains during the energy transition. Targeted investment in high-value refining, processing technologies and full-industry innovation can effectively expand domestic value creation potential, elevate their hierarchical status in global value chains, and align development with low-carbon transition goals. In contrast, advanced economies such as the United States, the United Kingdom and Germany rely on mature industrial systems to maintain core hub positions and generate massive cross-border value flows. Faced with recurring geopolitical frictions and accelerated energy decarbonization, these developed economies should optimize medium- and long-term fossil energy strategic reserves, diversify energy types and import sources, and build resilient, multi-source energy supply chains. Russia ranks second in total gross trade volume but only 15th in comprehensive nodal importance, reflecting severe imbalance in its inbound and outbound value composition. Against the reshaping of global energy patterns driven by geopolitical conflicts, Russia needs to diversify export destinations and refined product portfolios to mitigate volatility in cross-border value flows. From a global value chain upgrading perspective, differentiated policy paths should be formulated for resource exporters and industrialized advanced economies.
Overall, the systemic resilience of the global coal and oil value network shows an upward long-term trend, interrupted by periodic declines triggered by adverse global shocks. Ongoing risk disturbances may further tighten the global supply-demand balance of fossil fuels. All economies should therefore establish strategic energy reserves to boost self-sufficiency and reduce overreliance on single suppliers or transport corridors. Against the backdrop of global energy transition, governments should avoid drastic cuts to fossil energy investment and supply; instead, differentiated, phased transition roadmaps should be designed according to each economy’s position in global value networks. In addition, cross-border collaboration on renewable energy technologies and large-scale commercialization of alternative fuels such as hydrogen can reconcile the dual goals of stable energy supply and low-carbon transformation.
Shock simulations targeting the United States and Russia demonstrate that their marginal influence on the whole network gradually declines over time. Deepening global economic interdependence weakens single-country systemic dominance, though the Russia–Ukraine conflict and subsequent global energy restructuring temporarily lifted their systemic importance. Methodologically, this study innovatively adopts a value-added network framework to address the limitations of traditional trade-volume-based network analysis. It delivers differentiated policy references for global fossil energy security governance and provides a replicable empirical paradigm for follow-up research on other primary energy value chains.
4.2. Research Limitations and Future Research Directions
It is critical to acknowledge several limitations of this study, as suggested by the reviewer. First, our resilience evaluation system relies solely on structural proxy indicators derived from value-added trade networks, and the model outputs have not been empirically validated against observed real-world post-crisis energy recovery trajectories. In addition, node deletion simulation is only a numerical experiment and cannot fully replicate the complex multi-dimensional geopolitical shocks observed in reality. Second, constrained by the industrial classification standard of the OECD-TiVA database, coal and oil sectors cannot be separated to build independent networks for comparative analysis, which prevents us from capturing heterogeneous structural evolution, resilience dynamics and risk spillover mechanisms of the two fossil fuel sub-industries. Third, this paper does not incorporate landmark historical crisis events such as the 2011 Arab Spring and 2022 Russia-related energy sanctions into empirical calibration, leaving the model’s ability to reproduce real crisis responses untested.
Correspondingly, we outline three directions for future research. First, we will combine UN Comtrade bilateral trade statistics with TiVA value-added data to construct separate coal and oil value accounting systems, allowing comparative analysis of cross-sector gaps in nodal influence and network resilience. Second, high-frequency trade data and detailed policy archives will be integrated to embed major historical shock episodes into empirical tests, improving the model’s explanatory and predictive power for real economic disruptions and generating more precise risk-mitigation policies. Third, subsequent research will focus on the complete post-shock recovery phase of resilience curves, disentangling heterogeneous national risk response strategies and further enriching decision-making support for global energy security governance.