Article

Real-Time Sedimentation and Operational Technology Integration to Enhance Hydropower Operational Reliability: Case Study of the Chivor Hydropower Plant in Colombia

by
Aldemar Leguizamon-Perilla
1,2,
Johann A. Caballero
1,2,
Leonardo Rojas
1,2,
Francisco E. López-Cely
2,
Nhora Cecilia Parra-Rodriguez
1,2,
Laidi Morales-Cruz
1,2,
César Nieto-Londoño
3,*,
Wilber Silva-López
3 and
Rafael E. Vásquez
3
1
South America Strategic Business Unit, AES Corporation, Santiago de Chile 7550000, Chile
2
AES Colombia, Calle 100 No 19-54 of 901, Bogotá 110111, Colombia
3
School of Engineering, Universidad Pontificia Bolivariana, Medellín 050031, Colombia
*
Author to whom correspondence should be addressed.
Energies 2026, 19(10), 2481; https://doi.org/10.3390/en19102481
Submission received: 12 February 2026 / Revised: 5 May 2026 / Accepted: 18 May 2026 / Published: 21 May 2026

Abstract

This study addresses the critical challenge of sediment-driven degradation in aging hydropower infrastructure by implementing a novel Digital Operational Technology modernization framework at the AES Chivor Hydropower Plant in Colombia. While conventional sediment monitoring relies on sporadic manual campaigns, this research introduces a continuous, real-time sensing architecture that integrates hybrid acoustic–optical sensors, covering a range of 10 to 6000 mg/L, directly into the plant’s SCADA (Supervisory Control and Data Acquisition) system. The novelty of this approach lies in the seamless coupling of high-frequency physical data (15 min sampling) with an Operational Decision Support Module, enabling adaptive turbine management. Statistical validation against laboratory gravimetric standards yielded a robust correlation of 0.93, confirming the system’s precision in quantifying suspended sediment concentrations. By identifying critical fine particle fractions in real time, the proposed model enables a precision-based maintenance strategy that significantly reduces unscheduled production downtime and mitigates accelerated wear in Pelton turbines. These findings provide a scalable benchmark for extending the operational life of large-scale hydropower facilities facing advanced sedimentation risks through digital transformation.

1. Introduction

The United Nations [1] defined Sustainable Development Goal 7 (SDG 7) as, “Ensure access to affordable, reliable, sustainable and modern energy for all”, and reported that global electricity access increased from 84% in 2010 to 92% in 2023. This aligns with the accelerated implementation of strategies to increase the share of renewable sources in energy generation systems [2], driven by the continuous growth of the world population [3] and the corresponding increase in energy demand [4]. Hence, the world requires not only the development of new renewable-based facilities, but also adaptation and upgrading of existing infrastructure, aligned with SDG 9, “Build resilient infrastructure, promote sustainable industrialization and foster innovation” [1]. In hydropower generation, many facilities are approaching or have exceeded their original design service life, as reported over the last decade [5]. Therefore, modernizing conventional hydropower plants has become necessary for the global energy transition [6].
Hydropower facilities are among the most mature, reliable, and large-scale sources of low-carbon electricity [7,8], and their operational flexibility makes them indispensable for stabilizing grids with high shares of intermittent renewable resources, such as wind and photovoltaic generation [9]. Updating these plants through structural rehabilitation, turbine repowering, enhanced control systems, and digitalization not only prolongs their operational lifetime but also improves overall efficiency and reduces maintenance costs [10]. These upgrades ensure that hydropower continues to serve as a foundational technology within evolving electrical systems while meeting increasingly stringent environmental and operational standards [11] and business-optimization requirements [12].
The role of hydropower plants becomes even more critical when considering the integration of emerging storage technologies [13], such as hydrogen-based systems and next-generation batteries. Hence, the energy transition is not limited to deploying renewable generation; it also encompasses coupling energy production with robust storage solutions that mitigate variability [14]. In this context, modernized hydropower plants serve as dynamic assets that can rapidly modulate their output to balance fluctuations from intermittent sources [15]. By incorporating digital monitoring platforms, predictive maintenance algorithms, and real-time data analytics, these plants enhance grid responsiveness and facilitate optimal coordination with storage units [16,17]. This integration enables hydropower to serve as both a generator and a stabilizing mechanism within complex multi-source energy systems.
Furthermore, upgrading existing plants offers significant environmental and socioeconomic advantages [18]. Constructing new large-scale hydropower infrastructure often involves substantial ecological disturbance and long permitting processes. In contrast, extending the lifetime and performance of conventional plants maximizes the use of already-developed water conveyance systems, minimizes habitat disruption, and reduces lifecycle emissions associated with new construction [19]. This approach aligns with international sustainability commitments and long-term decarbonization strategies by leveraging existing assets while avoiding the environmental costs of entirely new installations. Modernization also strengthens energy security by ensuring a stable and predictable supply of dispatchable renewable electricity [20], which is essential for countries seeking to reduce dependence on fossil fuels and accelerate progress toward net-zero emission targets.
A critical yet often under-emphasized element in the modernization of hydropower facilities is upgrading sediment monitoring systems [21]. Sediment dynamics directly influence the health and longevity of key components, including turbines, penstocks, gates, and reservoirs [22,23,24]. Inadequate sediment management accelerates abrasion, reduces hydraulic efficiency, diminishes reservoir storage capacity, and increases the frequency of unplanned outages [25]. Advanced monitoring technologies, such as high-resolution bathymetry [26], real-time turbidity sensing [27], and automated sediment load forecasting [28], enable operators to anticipate sediment-related impacts and implement adaptive management strategies [29]. By enhancing the precision and reliability of sediment monitoring, hydropower plants can better preserve the structural integrity of their hydraulic systems, optimize maintenance schedules, and ensure long-term operational sustainability [30]. Thus, sediment monitoring modernization is not merely a support activity but a crucial determinant of the overall health and resilience of hydropower infrastructure within the renewable energy transition [31,32].
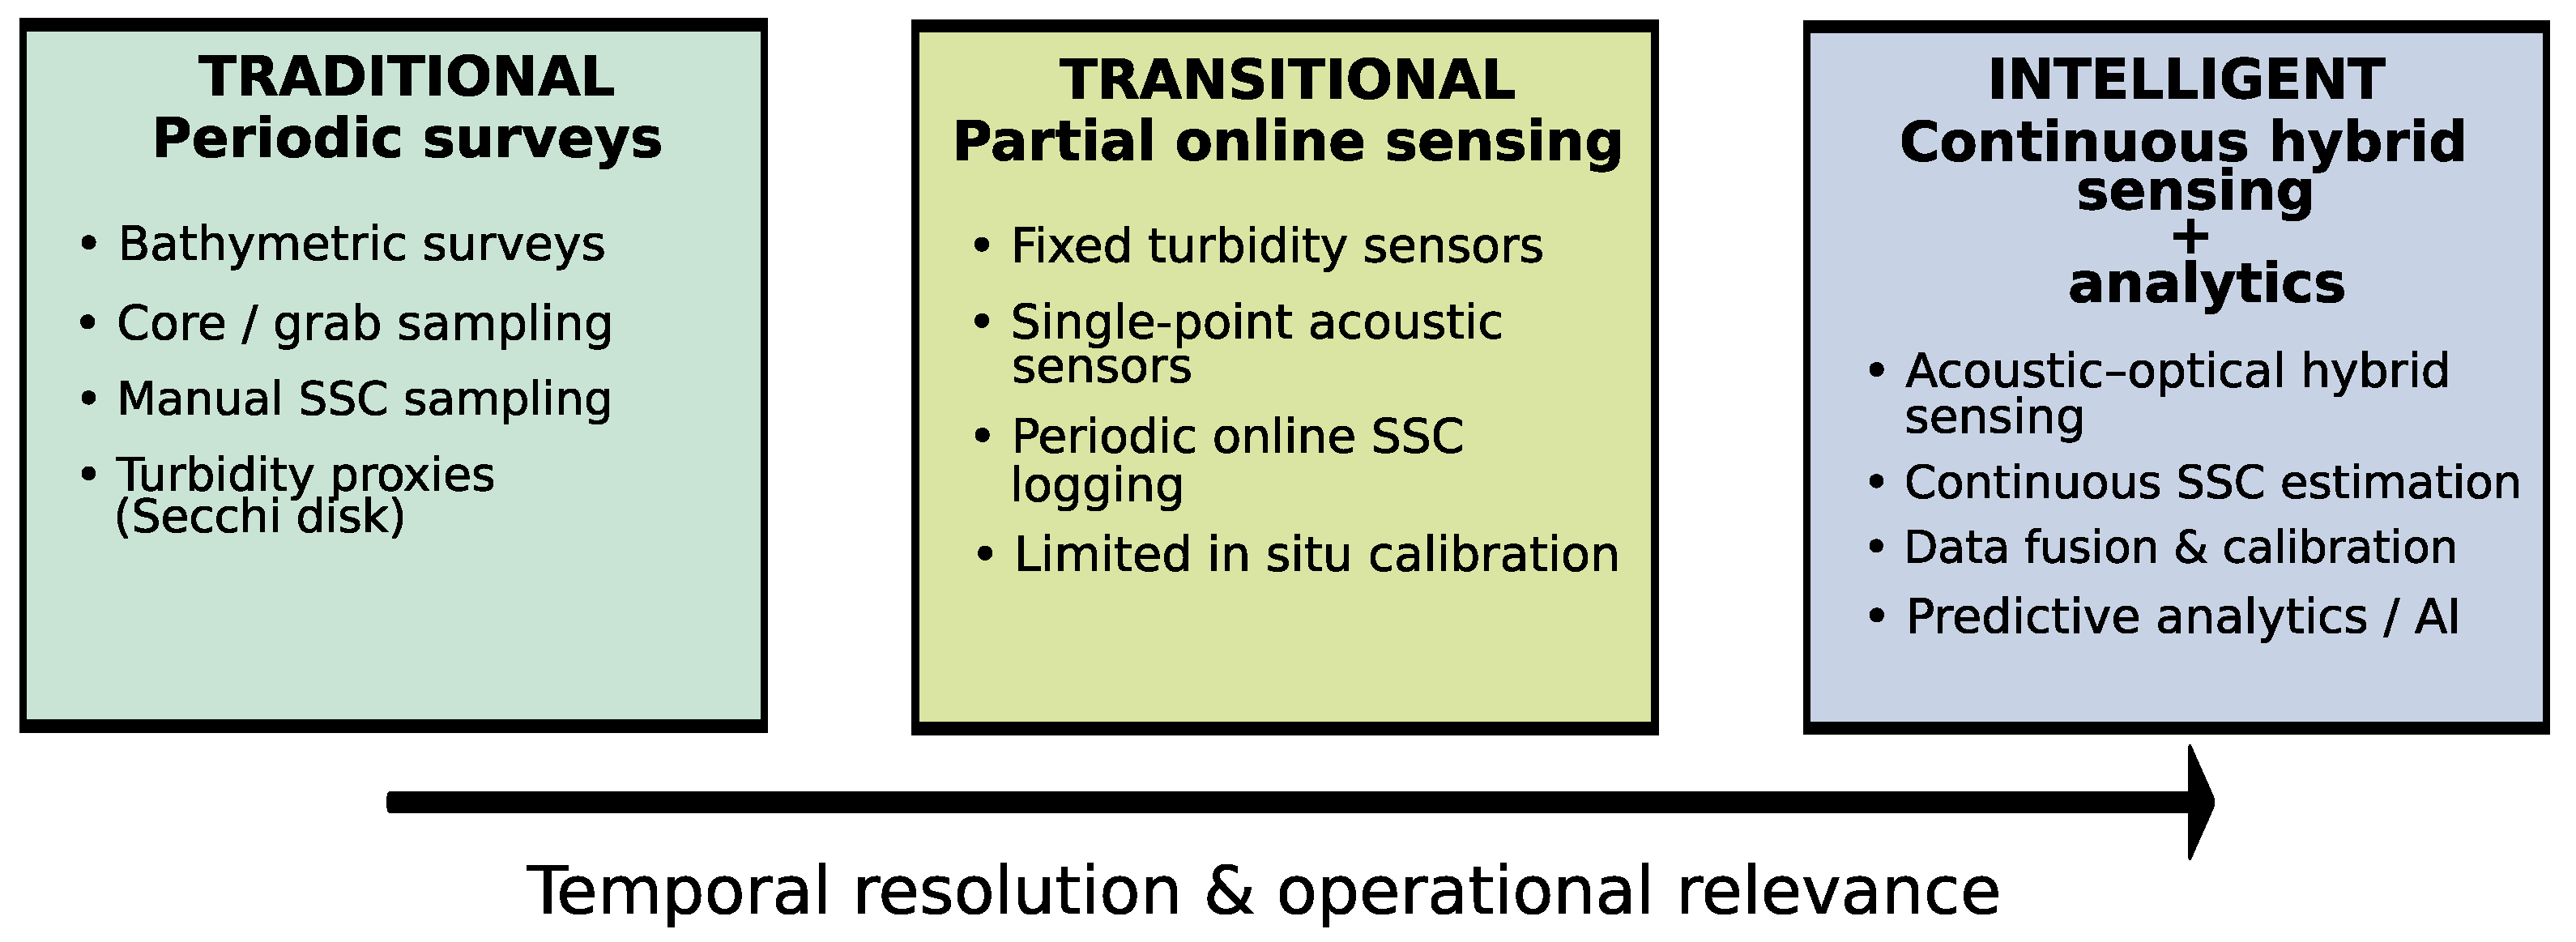
Reservoirs associated with hydropower plants generally pose a global problem due to sediment accumulation [33,34,35,36], particularly in countries such as Colombia that are rich in clays, plant material, and other organic matter that accumulate over time. This directly affects the efficiency, reliability, and sustainability of hydropower, water supply, and irrigation systems. Some studies document the magnification of sedimentation’s impact on reductions in useful reservoir volume, loss of regulation capacity, and increases in operation and maintenance costs [37]. Figure 1 summarizes the evolution of sediment management approaches in hydropower reservoirs as a function of temporal resolution and operational relevance.
Traditional approaches for assessing sediment accumulation in hydropower systems rely on periodic, campaign-based methodologies that provide valuable long-term information but lack real-time capability. Among the most widely used techniques are bathymetric surveys using single-beam echo sounders [38] and physical sampling methods based on sediment cores and traps [39]. These approaches enable characterization of accumulated sediment volumes and basic material properties; however, they require predefined sampling locations, which may introduce spatial bias and limit representativeness. To complement these methods, indirect measurements, such as turbidity monitoring or Secchi disc visibility, are often used to estimate sludge levels [40,41]. While transitional approaches that incorporate fixed turbidity or acoustic sensors enable partial online sensing, they typically remain spatially limited and poorly integrated into operational decision-making processes, thereby lacking the precision and system-wide coverage required for real-time, large-scale reservoir management.
Intelligent sediment management represents a paradigm shift toward continuous hybrid sensing, integrating acoustic and optical measurements with advanced data analytics and data fusion techniques. This approach can be further enhanced by incorporating Artificial Intelligence (AI) methods, enabling improved pattern recognition, anomaly detection, and predictive capabilities for sediment transport dynamics, thereby supporting more efficient and proactive operational decision-making [42]. This evolution enables robust, real-time estimation of sediment dynamics and supports predictive, sediment-aware hydropower operation. In recent years, there has been a shift from one-off campaigns (bathymetric and manual sampling) to hybrid approaches that combine real-time sensor data, advanced acoustics, autonomous AI-based platforms, and modeling and big-data techniques [43]. Acoustic methods have become one of the most widely used due to their versatility and ease of implementation [44]. The process consists of recording currents and acoustic backscatter signals, which enable estimation of vertical profiles of solid sedimentation and thus the detection of structures such as density currents. Some reports indicate its usefulness for continuous monitoring and quantification in rivers and estuaries [45]. However, the conversion of backscatter to solids requires, in the first instance, local site calibrations and adjustments for granulometry and attenuation. A variant of this methodology is the use of multibeam echo sounders [46], which allow mapping of morphology and classifying the bed (texture, soft mud vs. consolidated deposits), essential information for determining deposit areas and planning dredging. However, these methods and techniques are sensitive to particle size, prone to signal loss at very high concentrations, and require simultaneous physical samples for calibration and recalibration.
On the other hand, optical methods based on lasers and turbidity meters, among others, rely on the interaction of light with suspended solids, which generate dispersion or loss of intensity that can be associated with suspended solids or sludge deposits [47,48,49]. Commercial turbidity meters and devices provide continuous measurements of turbidity, transmittance, and particle-size distribution, which are used as measures of suspended solids [41]. The modern approach is to combine optical measurements with gravimetric sampling to construct site-specific SSC-versus-turbidity curves. Recent benchmarking shows that instruments such as Laser In Situ Scattering and Transmissometry (LISST) and well-calibrated optical sensors can provide robust estimates over wide concentration ranges [50,51,52]. A promising approach gaining increasing use in reservoirs is the integration of optical and acoustic methods. The recent literature reports highlight significant improvements in combining acoustic and optical signals [53]: studies show that fusion improves the estimation of solids, especially under variable conditions of granulometry and concentration, reducing biases when a method alone fails [54] (e.g., saturated optics at very high turbidity; acoustics affected by attenuation). This is an actively developing field, with works proposing fusion algorithms and statistical and Machine Learning (ML) models for joint estimation [55].
Developments in sediment monitoring in the last decade started by focusing on optical and laser-based techniques to enable continuous estimation of turbidity and particle-size distributions [56]. In parallel, extensive monitoring frameworks were implemented in systems such as the Shihmen Reservoir (Taiwan), where distributed sensing and surrogate measurements enabled the capture of sediment transport during high-flow events. However, they were still constrained by indirect measurements [57]. Field studies in sediment-intensive environments, including hydropower plants in the Himalayas (India), demonstrated the need to combine acoustic monitoring with laboratory validation [58]. Subsequent applications in reservoirs such as those in Malaysia highlighted the operational importance of integrating sediment monitoring into management strategies to prevent storage loss and operational disruptions [59]. More recent implementations in operational plants, such as installations in the Chilean Andes, have incorporated optical sensing into supervisory systems for online monitoring [18]. At a broader level, studies on hydropower sustainability and modernization, including cases such as the Rogun plant (Tajikistan) and European initiatives, recognize the role of digitalization but treat sediment monitoring as a secondary component without full operational integration [60,61]. Additionally, recent analyses of river systems, such as the Vjosa River (Albania), highlight persistent challenges in data interpretation, spatial coverage, and the transferability of monitoring methodologies [21]. Finally, recent assessments in Himalayan river basins emphasize the importance of characterizing suspended sediment properties and defining permissible particle-load thresholds for turbine operation, reinforcing the need to couple sediment monitoring with operational criteria for erosion control and optimal plant performance [62]. Overall, despite these advances, there remains a gap in fully integrated Digital Operational Technology (Digital-OT) architectures that combine multi-sensor acquisition, real-time analytics, and direct coupling with operational control systems, particularly under highly variable sediment regimes.
In the context of the AES Chivor Hydropower Project in Colombia, the updating and modernization of control and monitoring systems for environmental variables, together with electrical and communication infrastructures, are essential to ensure safe and reliable operation [16]. AES Chivor Hydropower Project, commissioned in the 1970s and currently contributing approximately 6% of the Colombian electricity generation mix, represents a critical legacy infrastructure whose long-term sustainability depends on effective modernization strategies. These modernization components are unified under a (Digital-OT) architecture that provides interoperability, real-time monitoring, and secure data management across the operational layers [63]. Within a step-by-step digital transformation strategy for this energy industry, priority is given to monitoring environmental variables, particularly sediment measurements, as sediment loads in Colombia exhibit high temporal variability, intensified in recent years by global warming, and can damage turbines and water conveyance systems. While previous studies have demonstrated the value of optical and acoustic sensing [45,48], distributed monitoring systems [57], and site-specific calibration procedures [44,54], they remain largely limited to isolated measurement deployments or partially integrated supervisory frameworks, lacking direct coupling with plant-wide operational decision-making. In this framework, this case study contributes by demonstrating the modernization of online sediment monitoring as a practical dimension of digital transformation, evaluating its integration into the plant monitoring architecture, and assessing its impact on hydropower plant stability and operation. Specifically, this work advances the state of the art by implementing a fully integrated Digital-OT approach that combines multi-sensor data acquisition, real-time analytics, and direct interaction with operational control systems, enabling adaptive, sediment-aware operation in a high-variability environment. This contribution addresses the identified gap between monitoring-oriented approaches and fully operational, data-driven sediment management strategies in hydropower plants.
The paper is organized as follows. Section 2 describes the hydropower plant and the existing and modernized sediment measurement systems. Section 3 presents the results obtained from the sediment measurement modernization compared to the off-line method. Section 4 discusses these results, highlighting the benefits of the online measurement system and its impact on hydropower plant operation. Finally, the conclusions are presented in Section 5.

2. Materials and Methods

2.1. Hydropower’s Study Area

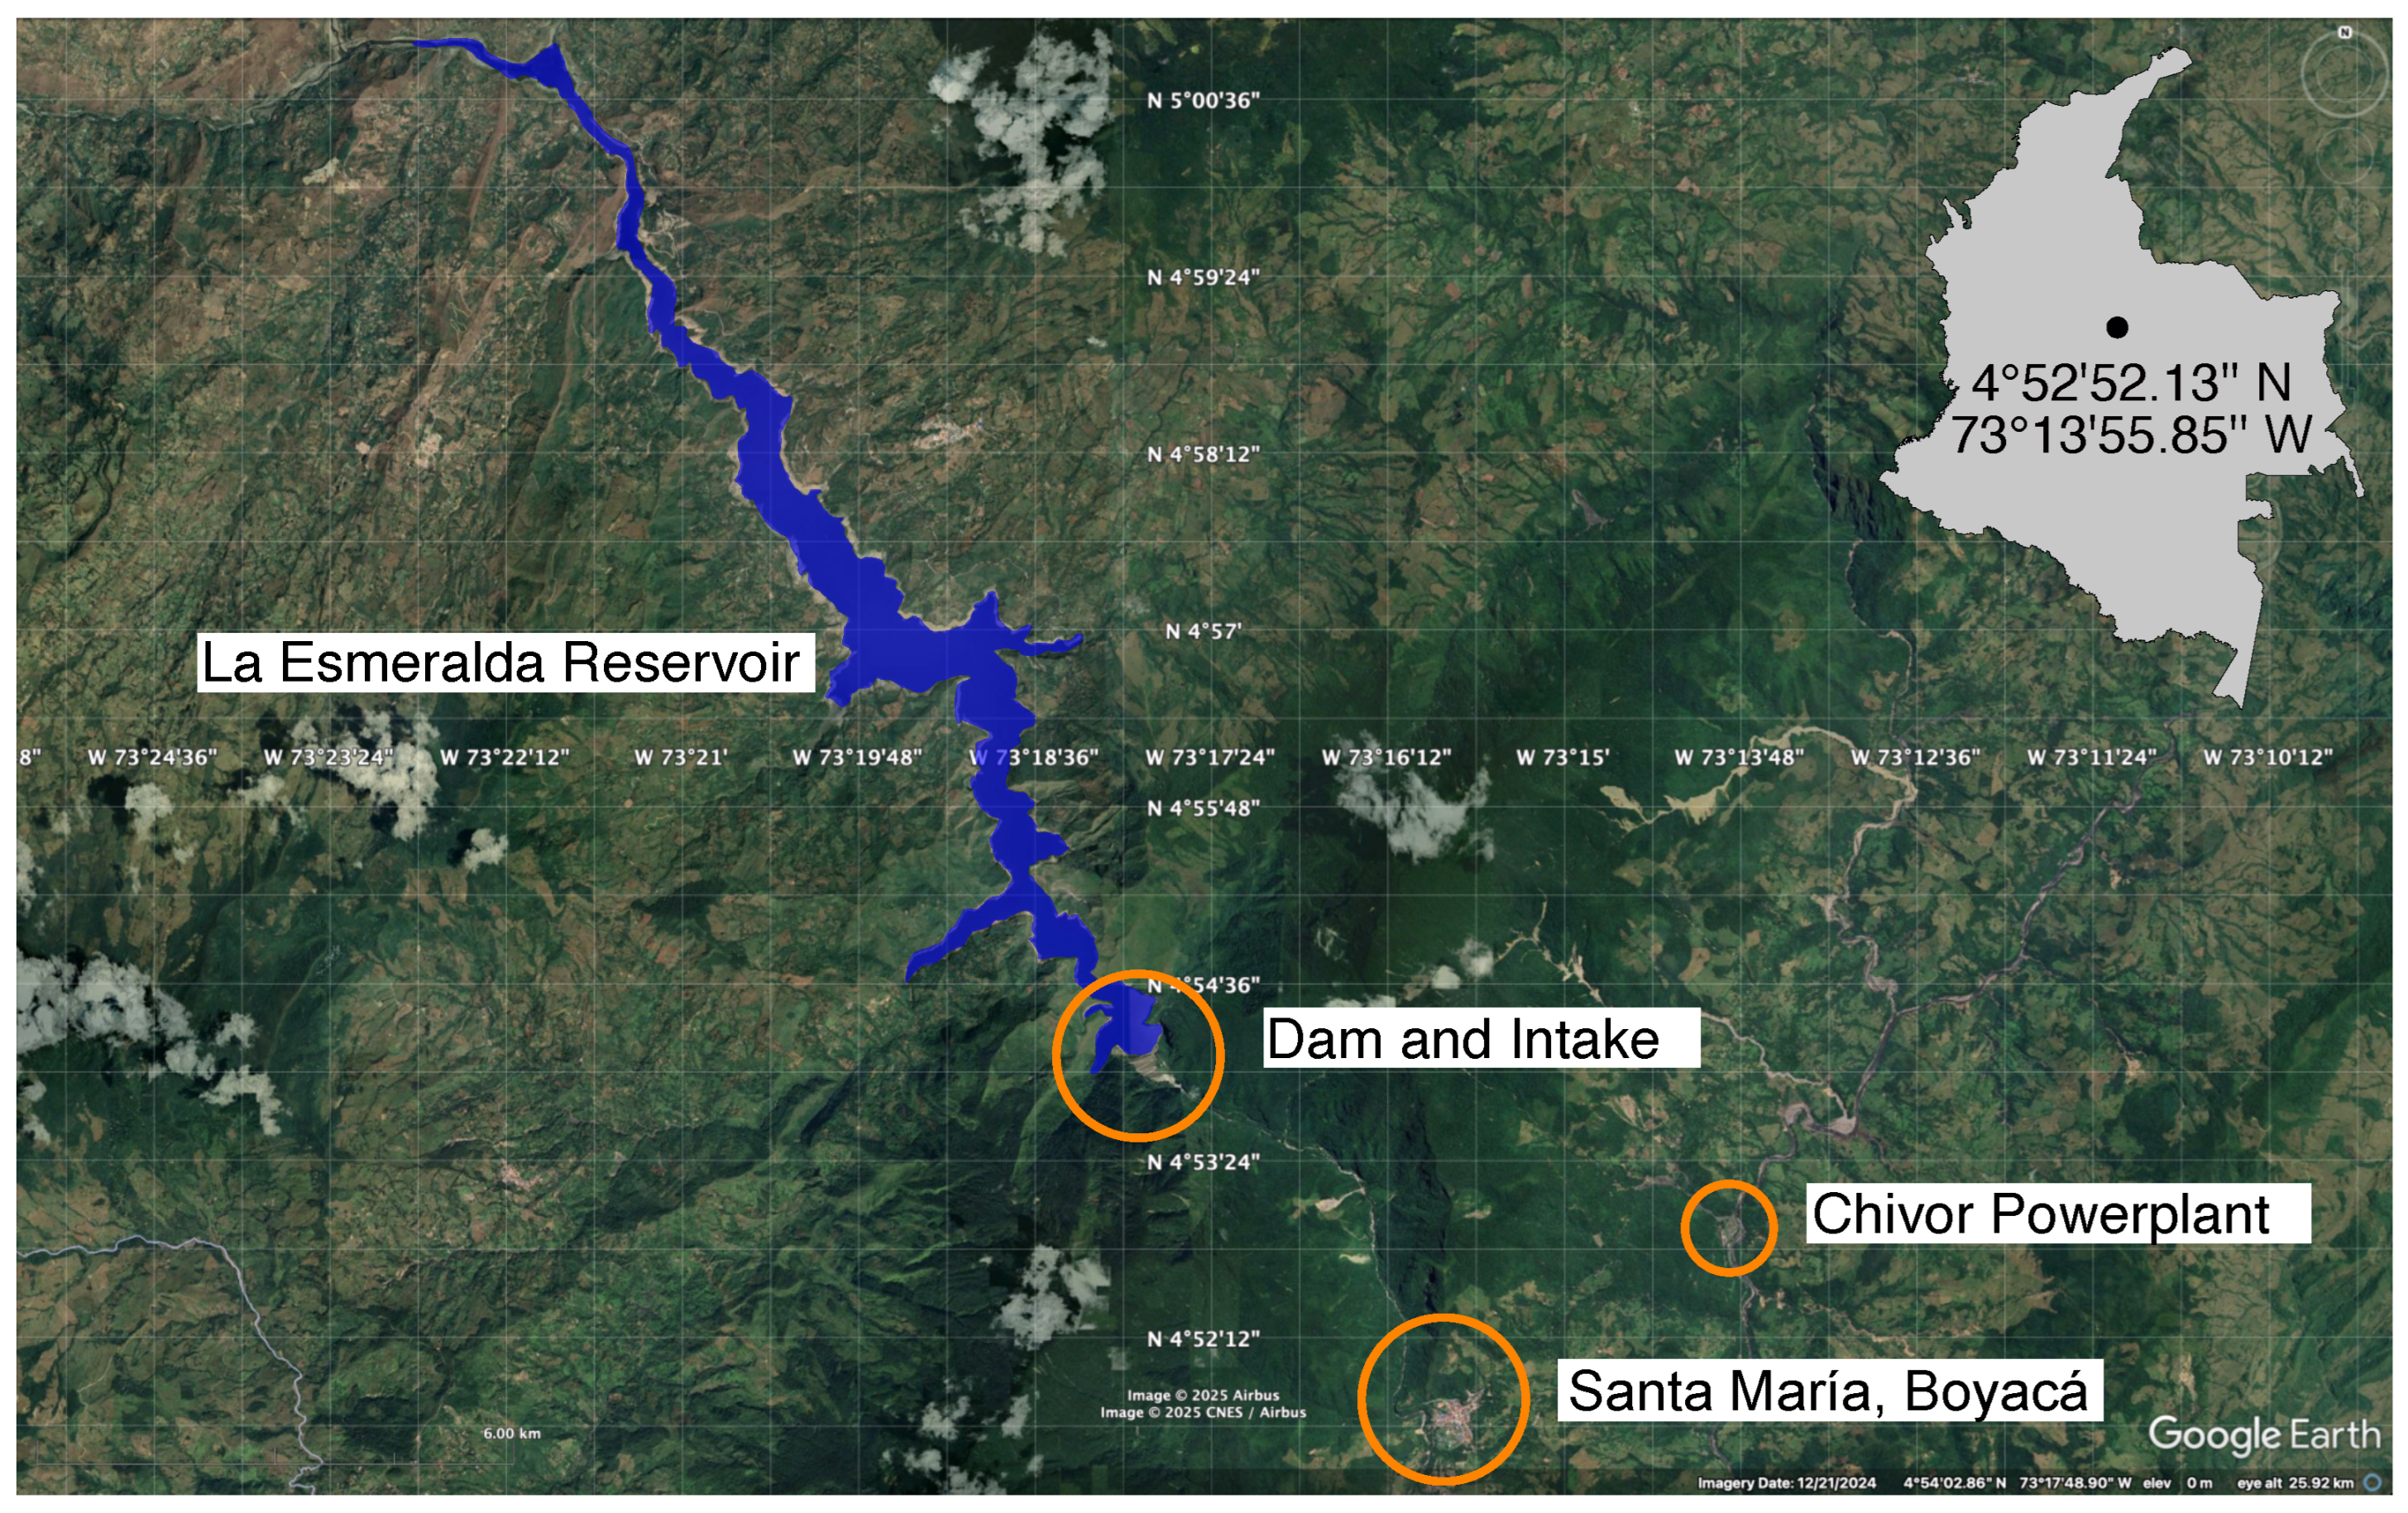
The AES Chivor Hydropower Project is located in the municipality of Santa María, in the department of Boyacá, approximately 160 km northeast of Bogotá, Colombia. It has been in continuous operation since 1977, serving as one of the country’s most important large-scale hydropower facilities (Figure 2). La Esmeralda Reservoir supplies the project and has a total installed capacity of 1000 MW, generated by eight Pelton turbines with a nominal capacity of 125 MW each, with a gross hydraulic head of approximately 762 m. The plant is equipped with eight Pelton turbines. Under nominal operating conditions, the flow rate per turbine is approximately 10 m3/s, assuming a uniform distribution of discharge among the units. Initially designed for a service life of 50 years, the plant has entered a long-term modernization and life-extension program to ensure safe and reliable operation beyond 2025, in response to aging infrastructure and evolving operational requirements [19]. The hydraulic system comprises one intake located next to the dam (Figure 2) and two headrace tunnels, Chivor I (7.985 km) and Chivor II (8.009 km), which together convey an average flow of approximately 160 m3/s from La Esmeralda Reservoir to Chivor Powerplant [64].
The AES Chivor Hydropower Plant operates as a high-head facility utilizing multiple Pelton turbines. Under standard operating conditions, water flow is evenly distributed across these units to maintain consistent performance. These conditions define the hydraulic operating regime and are relevant for assessing the interaction between sediment transport and turbine performance.

2.2. Sediment Situation in AES Chivor

Sedimentation dynamics at the AES Chivor Hydropower Project are characterized by a long-term and progressive loss of storage capacity and the upstream advance of a sediment delta within La Esmeralda Reservoir. Periodic bathymetric surveys conducted since 1975 showed a sustained increase in accumulated sediment volume from negligible values to more than 140 Mm3, corresponding to a reduction in total reservoir volume from approximately 769 Mm3 to about 630 Mm3, equivalent to a loss exceeding 20% of the initial storage capacity [19].
The mean sedimentation rate over the period 1975–2015 was estimated at approximately 3.1 Mm3/yr. Longitudinal bathymetric profiles revealed a non-uniform spatial distribution of deposits, with a well-defined accumulation zone extending from the reservoir head toward the dam and a stabilization zone closer to the intake area, which led to the construction of a new intake system [65] to extend the life of La Esmeralda Reservoir. Model projections based on historical hydrological records and digitized reservoir geometry indicate that by the period 2019 to 2027, the sediment surface approaches the elevation of the existing intakes (approximately 1195 m a.s.l.), while future scenarios suggest potential interaction with higher-elevation projected intakes (approximately 1206–1226 m a.s.l.) under continued sediment inflow [19]. These conditions are associated with a marked increase in suspended sediment concentrations (SSC), rising from historical average values on the order of 200–300 mg/L to projected values approaching 1600 mg/L during discharge events [65]. Field evidence further indicates that elevated sediment loads have caused accelerated wear of turbine needle valves and other hydraulic components, with severe surface degradation observed after short operating periods under high-sediment conditions [65]. More recent assessments emphasize that, without continuous monitoring and adaptive sediment management strategies, ongoing delta advance and increasing sediment concentrations will continue to compromise intake performance, wear of the penstocks, increase maintenance costs, and reduce long-term reservoir operability [64].

2.3. Digital Modernization of Sediment Monitoring

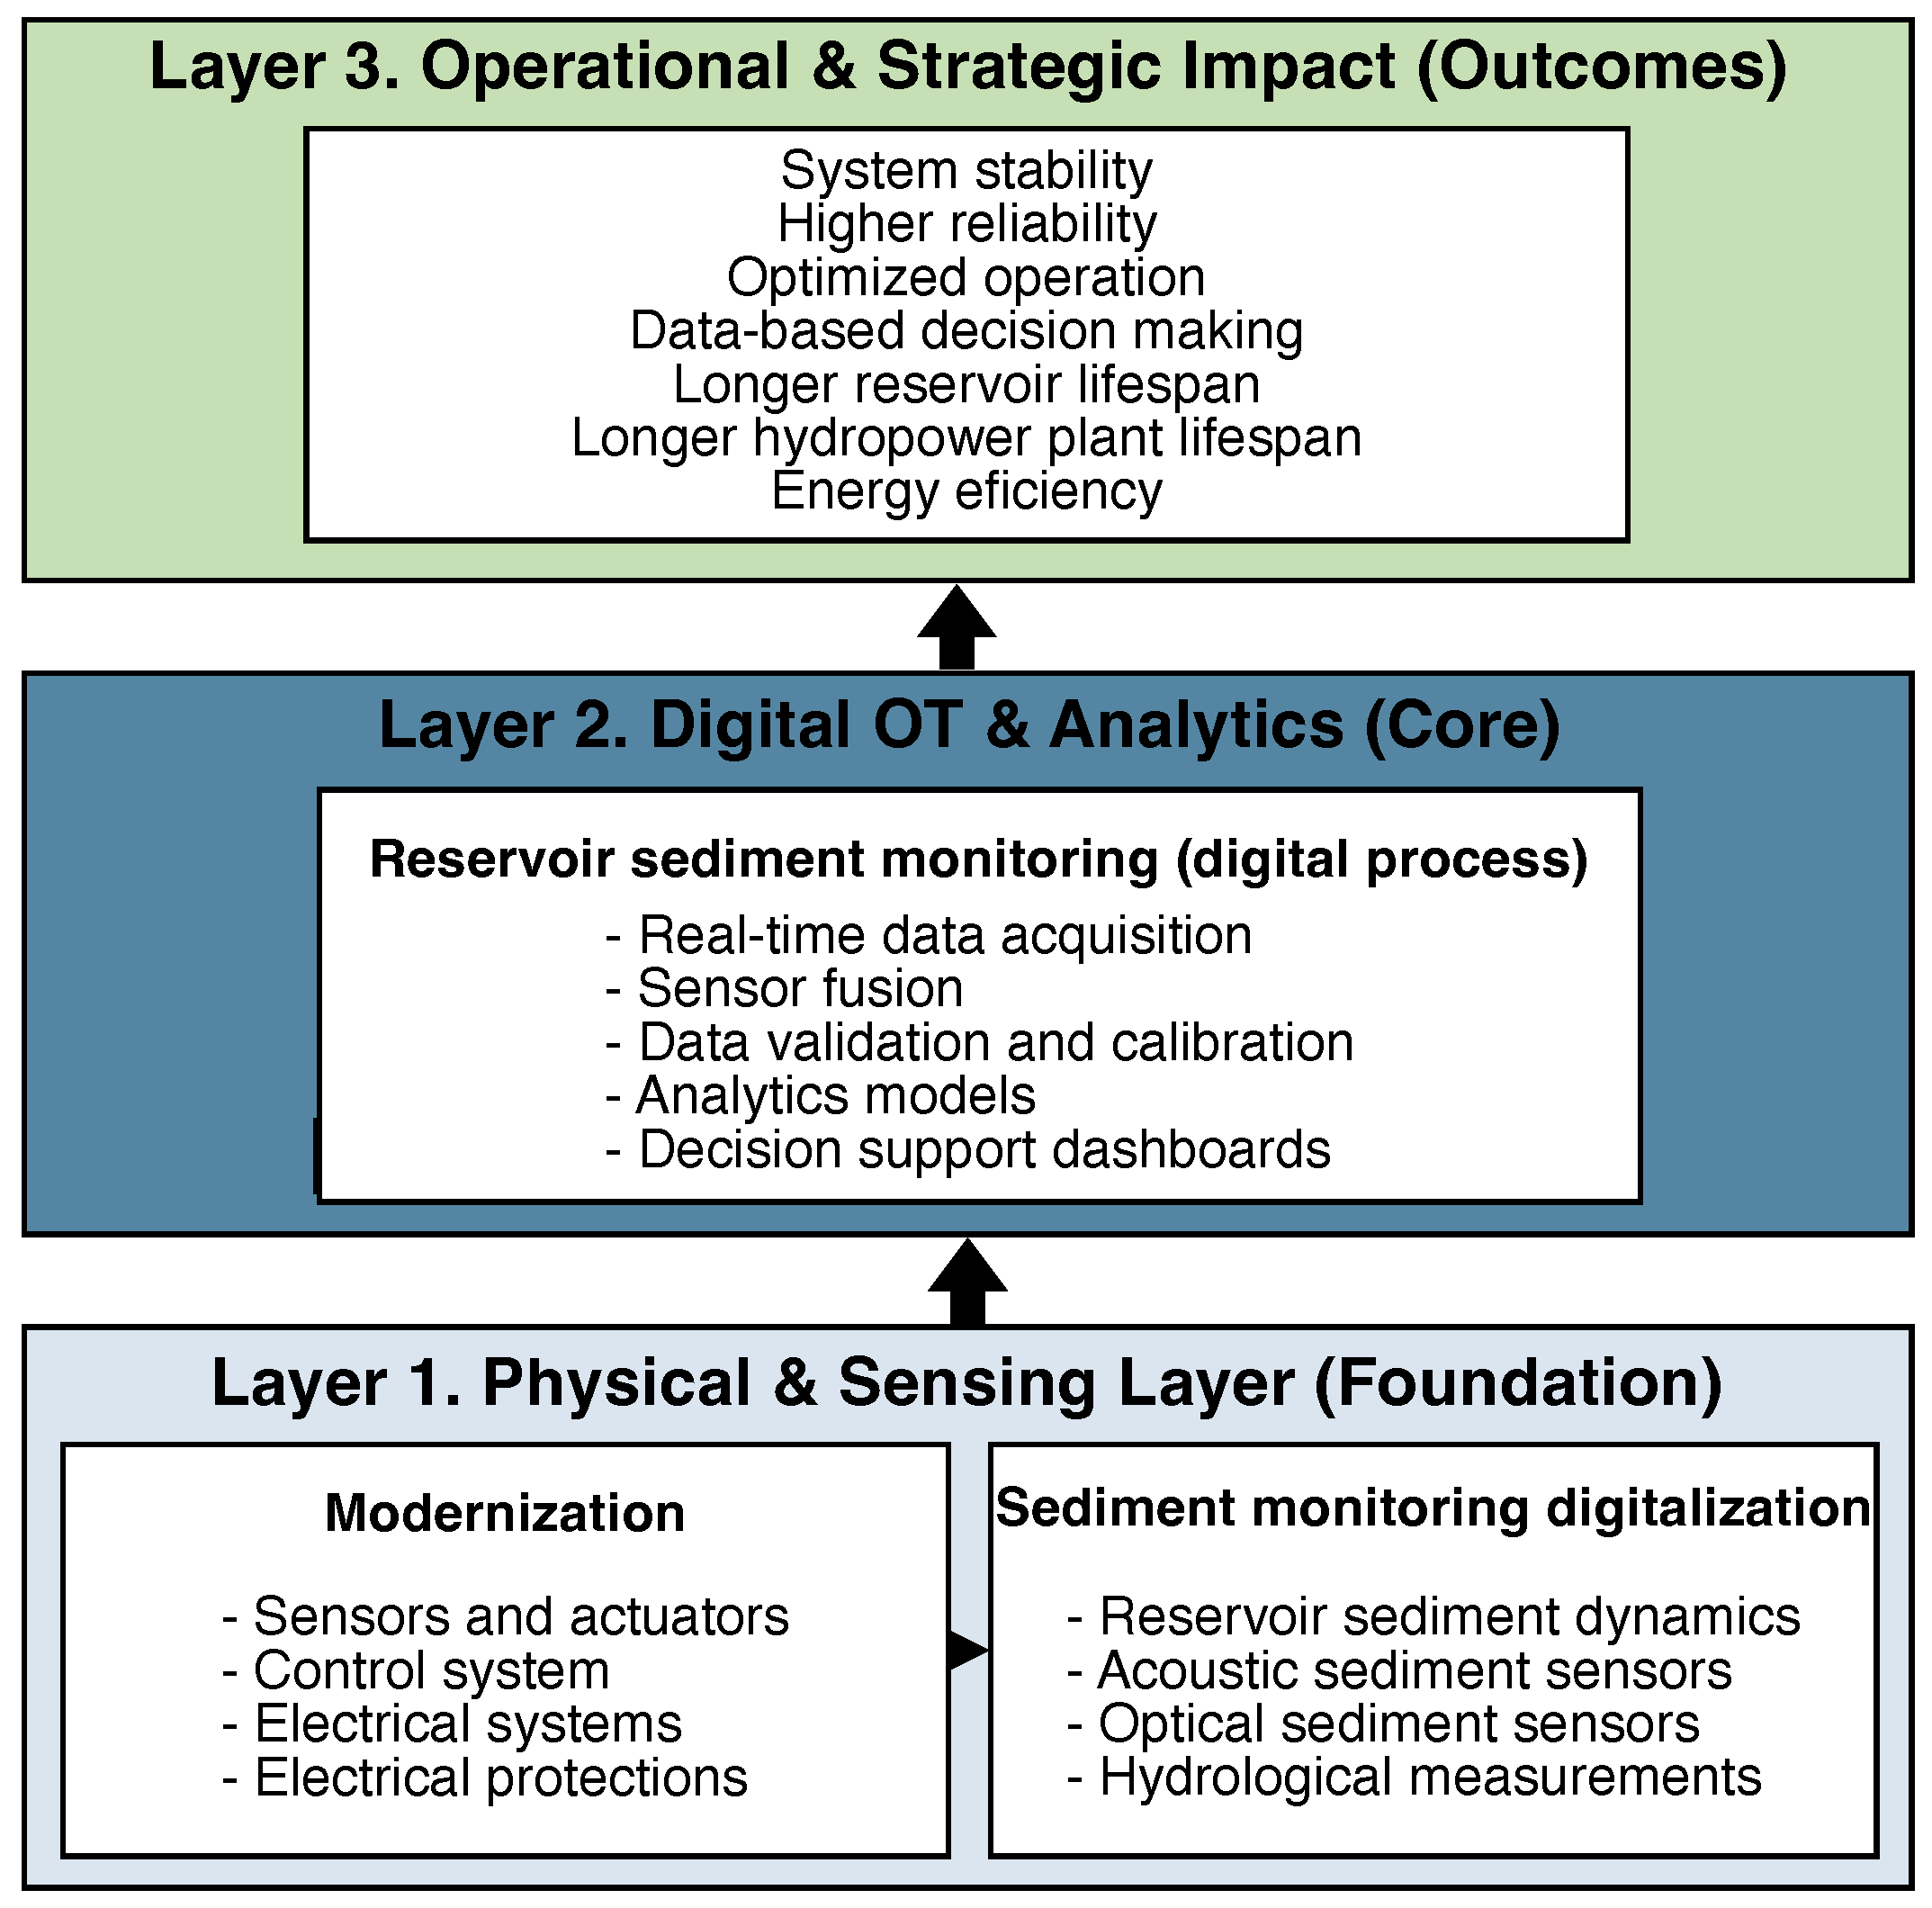
To address sedimentation dynamics and operational risks, a digital modernization of the sediment-monitoring process was designed and implemented at the AES Chivor Hydropower Project in Colombia. The observed sediment accumulation rates, the projected interaction between deposits and intake elevations, and the increases in SSC highlighted the limitations of conventional, campaign-based monitoring for operational decision support. To address these challenges, sediment monitoring has been implemented as a continuous digital process integrated into the plant’s Operational Technology environment. The proposed Digital-OT-based model, which links physical sensing, real-time data acquisition, validation, analytics, and decision-support functions, is shown in Figure 3.
The sediment and sludge monitoring system was developed as part of the modernization framework to support environmental and operational decision-making. The methodology combines in situ pilot measurements with laboratory validation, as detailed in the comparative analysis of the pilot and laboratory sediment data.
  • Pilot Sensors: Multiparametric probes equipped with ultrasonic and optical turbidity sensors were deployed near the intake and the reservoir’s sedimentation zones.
  • Sampling Frequency: Measurements were recorded every 15 min to capture short-term variations linked to rainfall and inflow conditions.
  • Data Validation: Laboratory gravimetric analyses were conducted on water–sediment samples to calibrate sensor readings, achieving an R2 correlation of 0.93 between in situ and laboratory results.
The measurement process was supported by the Digital-OT system, which automatically collected and processed data via the SCADA interface. The processed data were used to generate sediment-concentration maps and predict deposition zones near critical hydraulic structures. Sediment monitoring data were integrated into the Operational Decision Support Module (ODSM) of the Digital-OT system. This integration enabled the control system to adjust turbine operating modes and flushing-gate sequences based on sediment-concentration thresholds. The result is an adaptive management approach that optimizes efficiency and mitigates wear in turbines and penstocks. Implementation followed a structured execution model inspired by Endress Hauser’s PR-S-24 Project Execution Procedure, emphasizing traceability, quality control, and communication management. Each modernization phase (engineering, procurement, installation, and commissioning) was documented and verified through quality assurance gates, supported by the following tools:
  • Project Tracking System (SAP-based) for resource planning and milestone control.
  • Risk Management Matrix for identifying and mitigating technical and operational risks.
  • Communication Plan defining reporting frequency and stakeholder responsibilities.
  • Site Acceptance Tests (SAT) and Factory Acceptance Tests (FAT) performed according to IEC 60034 [66] and IEEE 421 [67] standards.
The monitoring system evaluated in this study is based on a hybrid architecture combining acoustic (ultrasonic) and optical sensing principles, integrated within a controlled sampling and measurement unit. The system includes the following key components:
  • Sampling and conditioning unit: A controlled flow circuit consisting of a stainless-steel sampling tank or flow-through chamber, valves (ball and diaphragm type), and inlet/outlet connections to ensure representative and continuous water sampling. This configuration minimizes sedimentation and ensures stable hydraulic conditions for measurement.
  • Acoustic (ultrasonic) sensor module: The acoustic component (e.g., NivuParQ-type sensor) operates based on multi-frequency ultrasonic backscatter, allowing: continuous measurement of suspended solids concentration, detection of particle size distribution (multiple classes, including fine particles <63 μm), and measurement range typically between 10 and 6000 mg/L. This technology is particularly suitable for environments with high turbidity and variable particle-size distributions, such as hydropower reservoirs during sediment transport events.
  • Optical sensor module: The optical component (e.g., turbidity or suspended solids sensor such as Turbimax-type) operates based on light scattering/absorption, providing: continuous turbidity-based estimation of suspended solids and measurement ranges up to 5 g/L, with resolution between 1–5% of the measured value. The optical sensor complements the acoustic measurement by improving sensitivity in low-to-medium concentration regimes and providing redundancy.
  • Signal processing and data acquisition system: The system incorporates transmitters (e.g., Liquiline CM444 or Nivuflow-type), dataloggers, and industrial communication modules (Modbus TCP/IP), enabling: real-time data acquisition and transmission, integration with SCADA systems, and local buffering and remote diagnostics.
  • Mechanical and structural integration: The sensing system is mounted on a panel-based flow-through structure, designed for: operation under pressures between 10–30 bar, corrosion resistance (e.g., stainless steel AISI 316L), protection ratings up to IP65–IP68 depending on component location, and continuous operation in high humidity and variable temperature environments.
The selection of the hybrid sensing configuration and its parameters was based on the following technical considerations:
1.
Measurement range and resolution: The system was designed to cover sediment concentrations from low background levels to extreme hydrological events (>6000 mg/L), ensuring adequate sensitivity and dynamic range.
2.
Particle size sensitivity: The use of multi-frequency ultrasonic sensing enables characterization of heterogeneous sediment mixtures, which is critical in reservoir sediment dynamics.
3.
Hydraulic representativeness: A controlled sampling flow (typically between 0.02 and 10 L/s, depending on configuration) ensures that measurements reflect actual flow conditions while avoiding particle settling.
4.
Environmental robustness: All components were selected to withstand: high pressures (up to 30 bar), high humidity (>95%), and variable temperatures (5–45 °C). These conditions are representative of submerged or pressurized hydraulic infrastructure.
5.
Redundancy and reliability: The hybrid (acoustic–optical) approach reduces uncertainty by combining two independent measurement principles, improving robustness under varying sediment conditions.
6.
Integration and scalability: The system supports industrial communication protocols and SCADA integration, enabling continuous monitoring and future scalability.

3. Results

To evaluate the system’s effectiveness, we present the sediment monitoring data validated through multiple statistical metrics. This approach aims to achieve faster, more precise monitoring, providing the foundation for a reliable maintenance strategy that minimizes operational interruptions and optimizes production cycles.

3.1. Sediment Quantification System Location

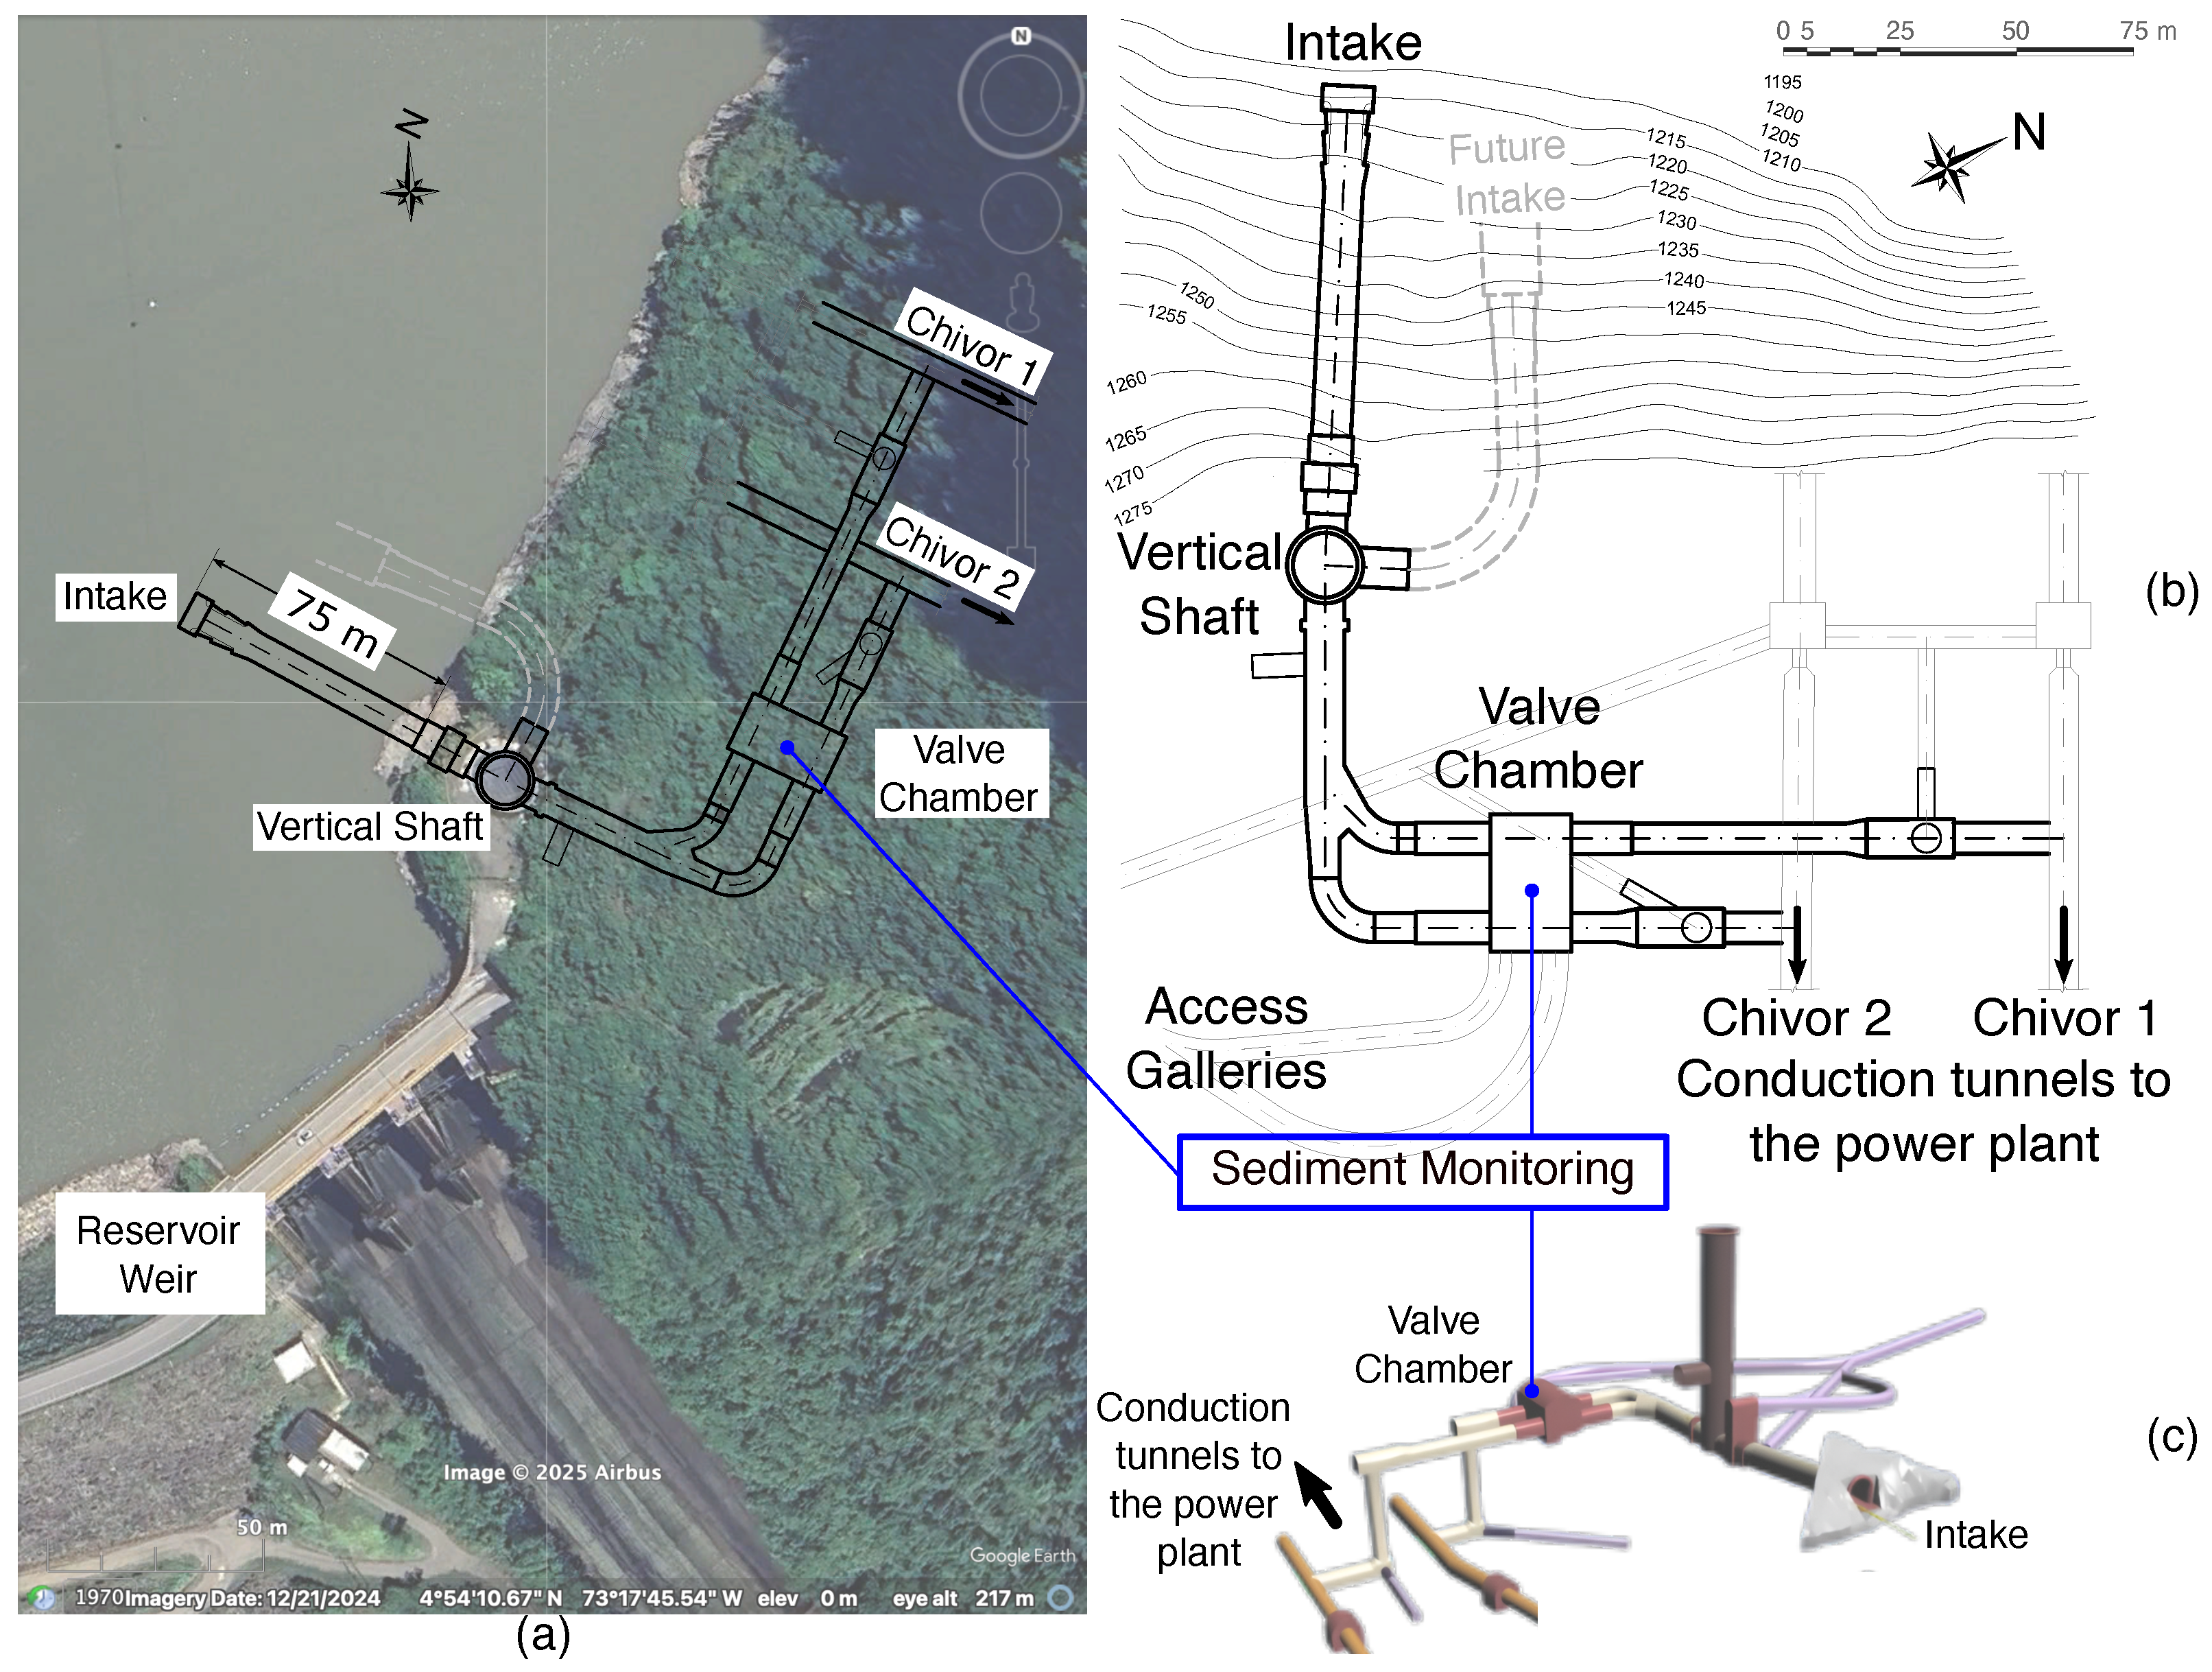
The system aims to monitor suspended solids (sediment) at one point within the 4 m diameter penstock pipes in the valve chamber, see Figure 4.
The current measurement system at the facility comprises an operations hut, a pumping and sampling system, and an analysis laboratory. In the operations hut, an operator manually samples and processes the collected water and oversees the associated pumping units. The sampling is conducted using a lift that supports two pencil-type pumps, each with a capacity of 1.262 × 10 2 m3/s, installed at approximate depths of 50 m and 80 m, depending on the reservoir level.
Water samples are extracted using a hose supported by buoys that are manually collected and subsequently oven-dried before analysis. This procedure presents several operational and technical limitations, including reliance on human operators, low sampling frequency, long processing times, and increased measurement uncertainty.
The new system, in contrast, operates continuously in demanding hydraulic environments, withstanding hydrostatic pressures between 10 and 30 bar (equivalent to water columns of 100 to 300 m) without compromising either structural integrity or sensor accuracy. It is resistant to corrosion caused by prolonged exposure to raw water, featuring a housing made of AISI 316L stainless steel or equivalent alloys, and provides a minimum IP68 protection rating. The system includes automatic temperature and pressure compensation and can operate over a temperature range of 5 °C to 45 °C and under high relative humidity (>95%). It ensures a minimum resolution of 1 mg/L and an accuracy of ±5% for suspended solids concentration measurements, even under conditions of high turbulence and variable fine- and coarse-particle content.
The system incorporates a robust communications architecture that enables reliable, continuous, real-time data transmission to the hydro plant’s central supervisory and control system (SCADA). It uses interfaces compatible with standard industrial protocols (Modbus RTU/TCP, Profibus, or Ethernet/IP), allowing direct integration with the existing SCADA system or through communication gateways. The design includes redundancy mechanisms—such as dual communication channels and backup via fiber-optic and radio-frequency links—to mitigate data loss in the event of network failures. Additionally, it ensures an uninterrupted power supply via an industrial UPS or redundant power sources, guaranteeing operational continuity even during power outages.

3.2. Validation of the New Method with the Traditional One

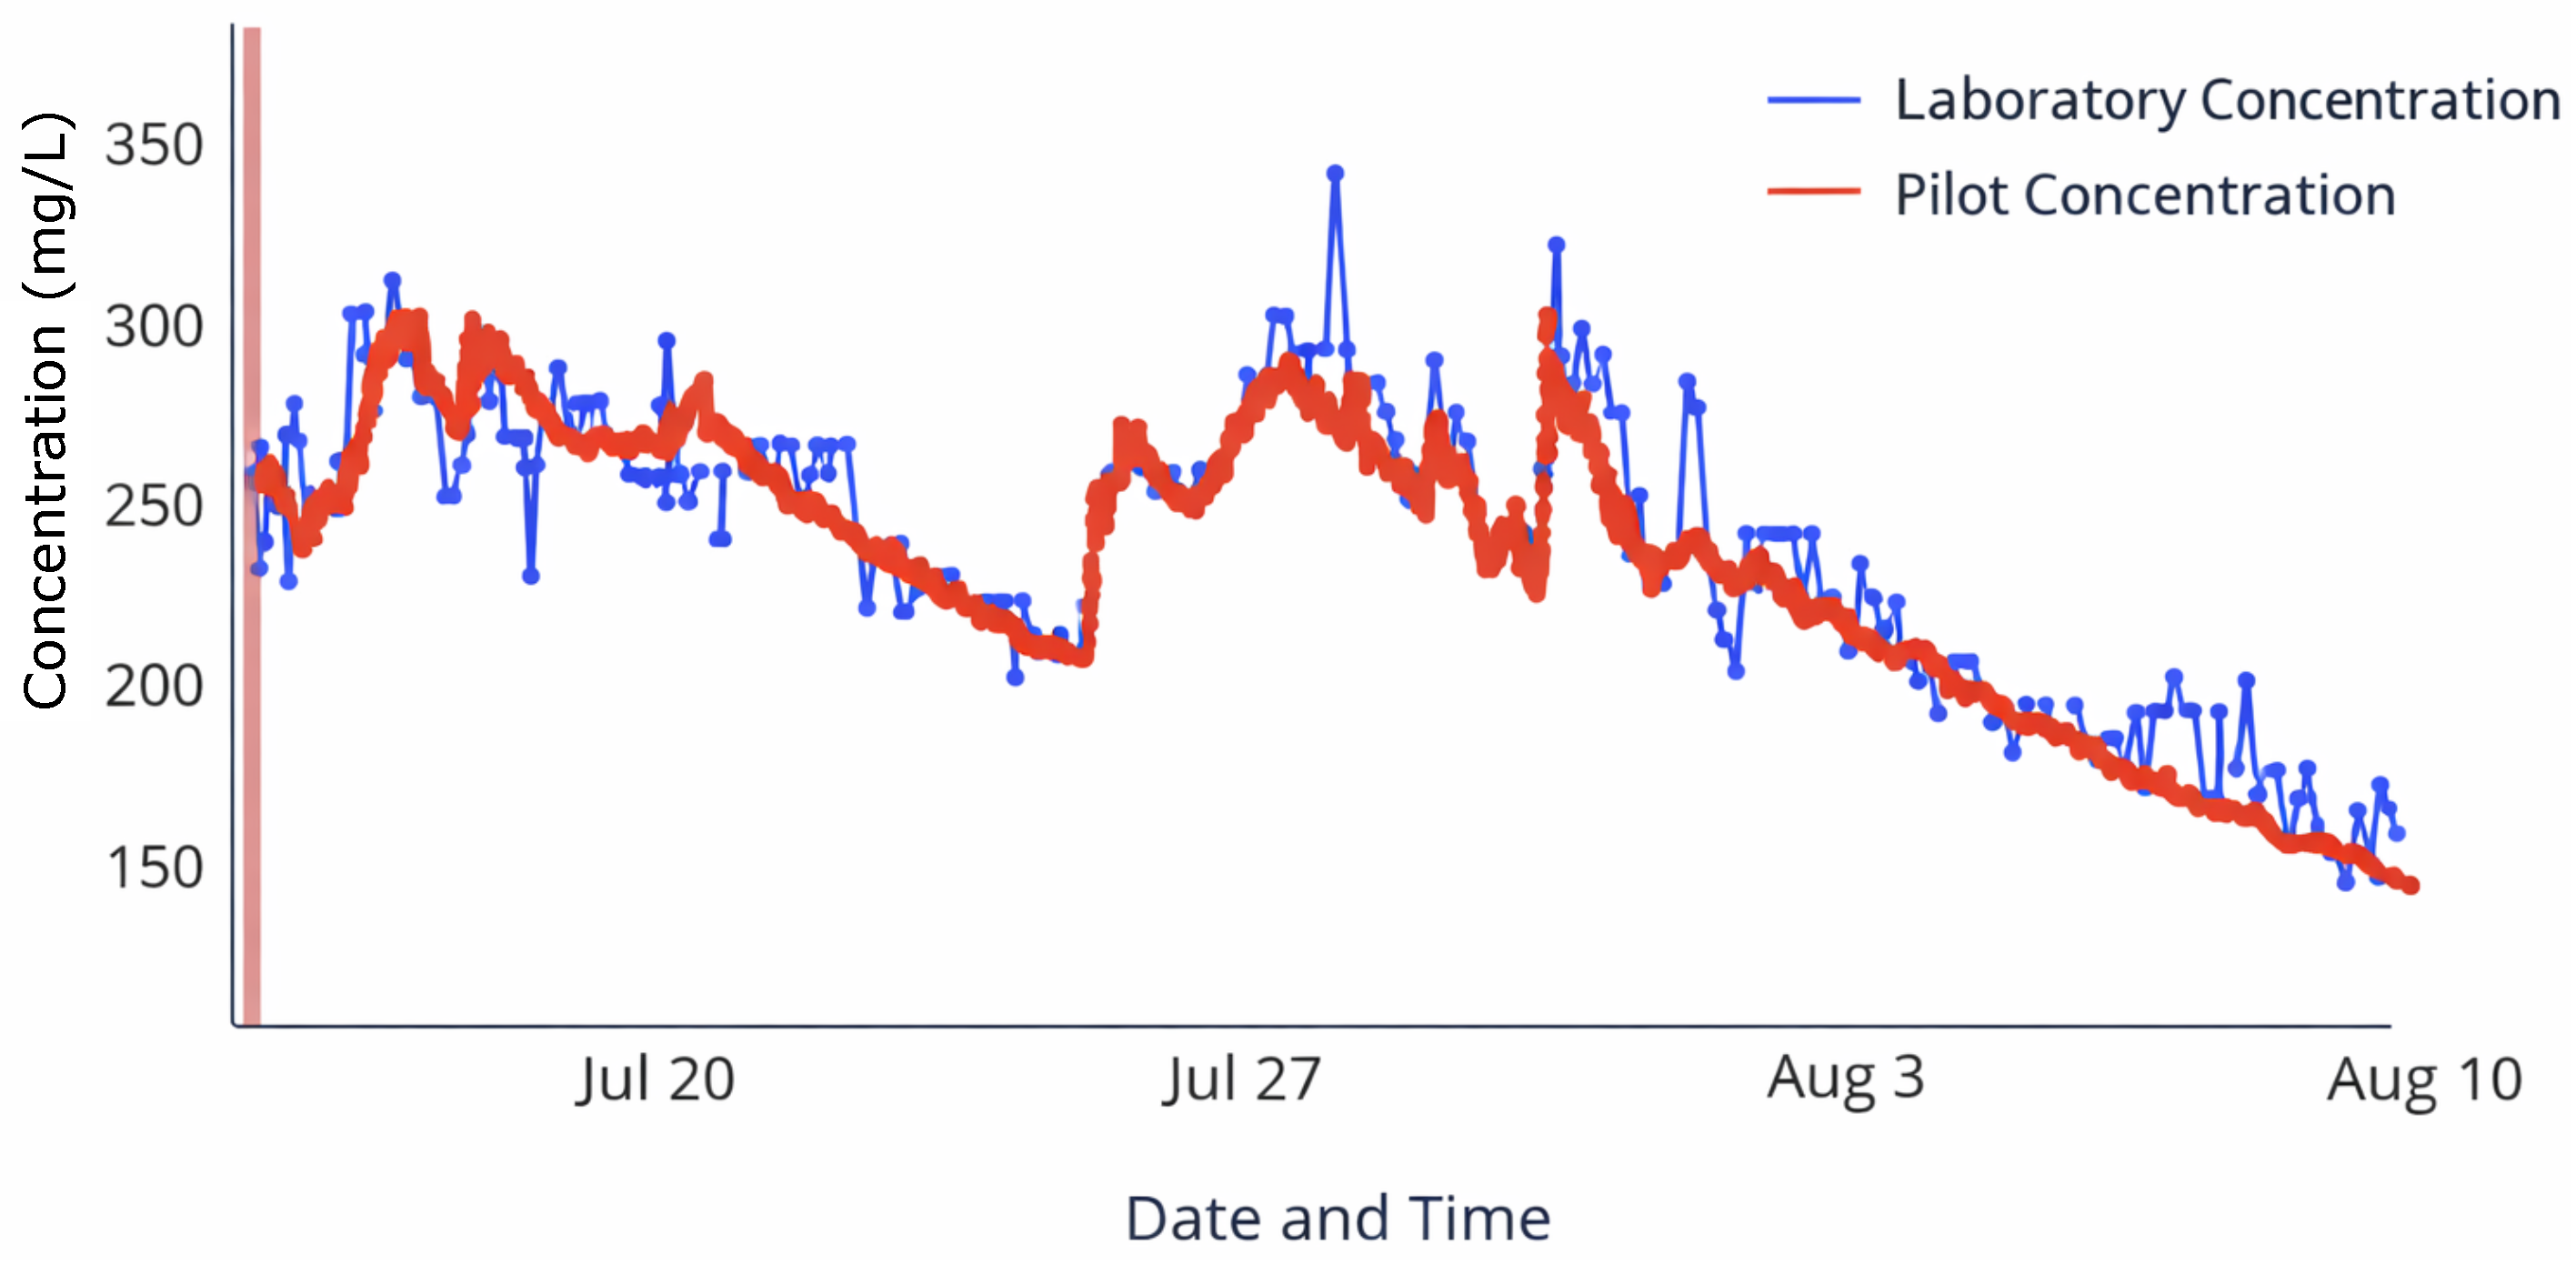
The comparison between pilot field measurements and laboratory validation revealed high consistency after sensor calibration and algorithmic adjustment within the Digital-OT system. The pilot monitoring campaign spanned three months during the wet season, covering turbidity levels of 40–400 NTUs (Nephelometric Turbidity Units) and sediment concentrations of 50–850 mg/L. Figure 5 shows the correlation curve between pilot sensor readings and laboratory analyses. R2 = 0.93 (p < 0.05) indicated strong agreement between both data sources, confirming the reliability of the in situ instrumentation system for continuous operation.
In addition, the monitoring system detected cyclical increases in sediment load following precipitation events, which correlated with reductions in turbine hydraulic efficiency of up to 2.1%. This correlation provided valuable insights for optimizing turbine gate regulation and sediment-flushing operations, thereby reducing unnecessary downtime and preventing excessive wear.
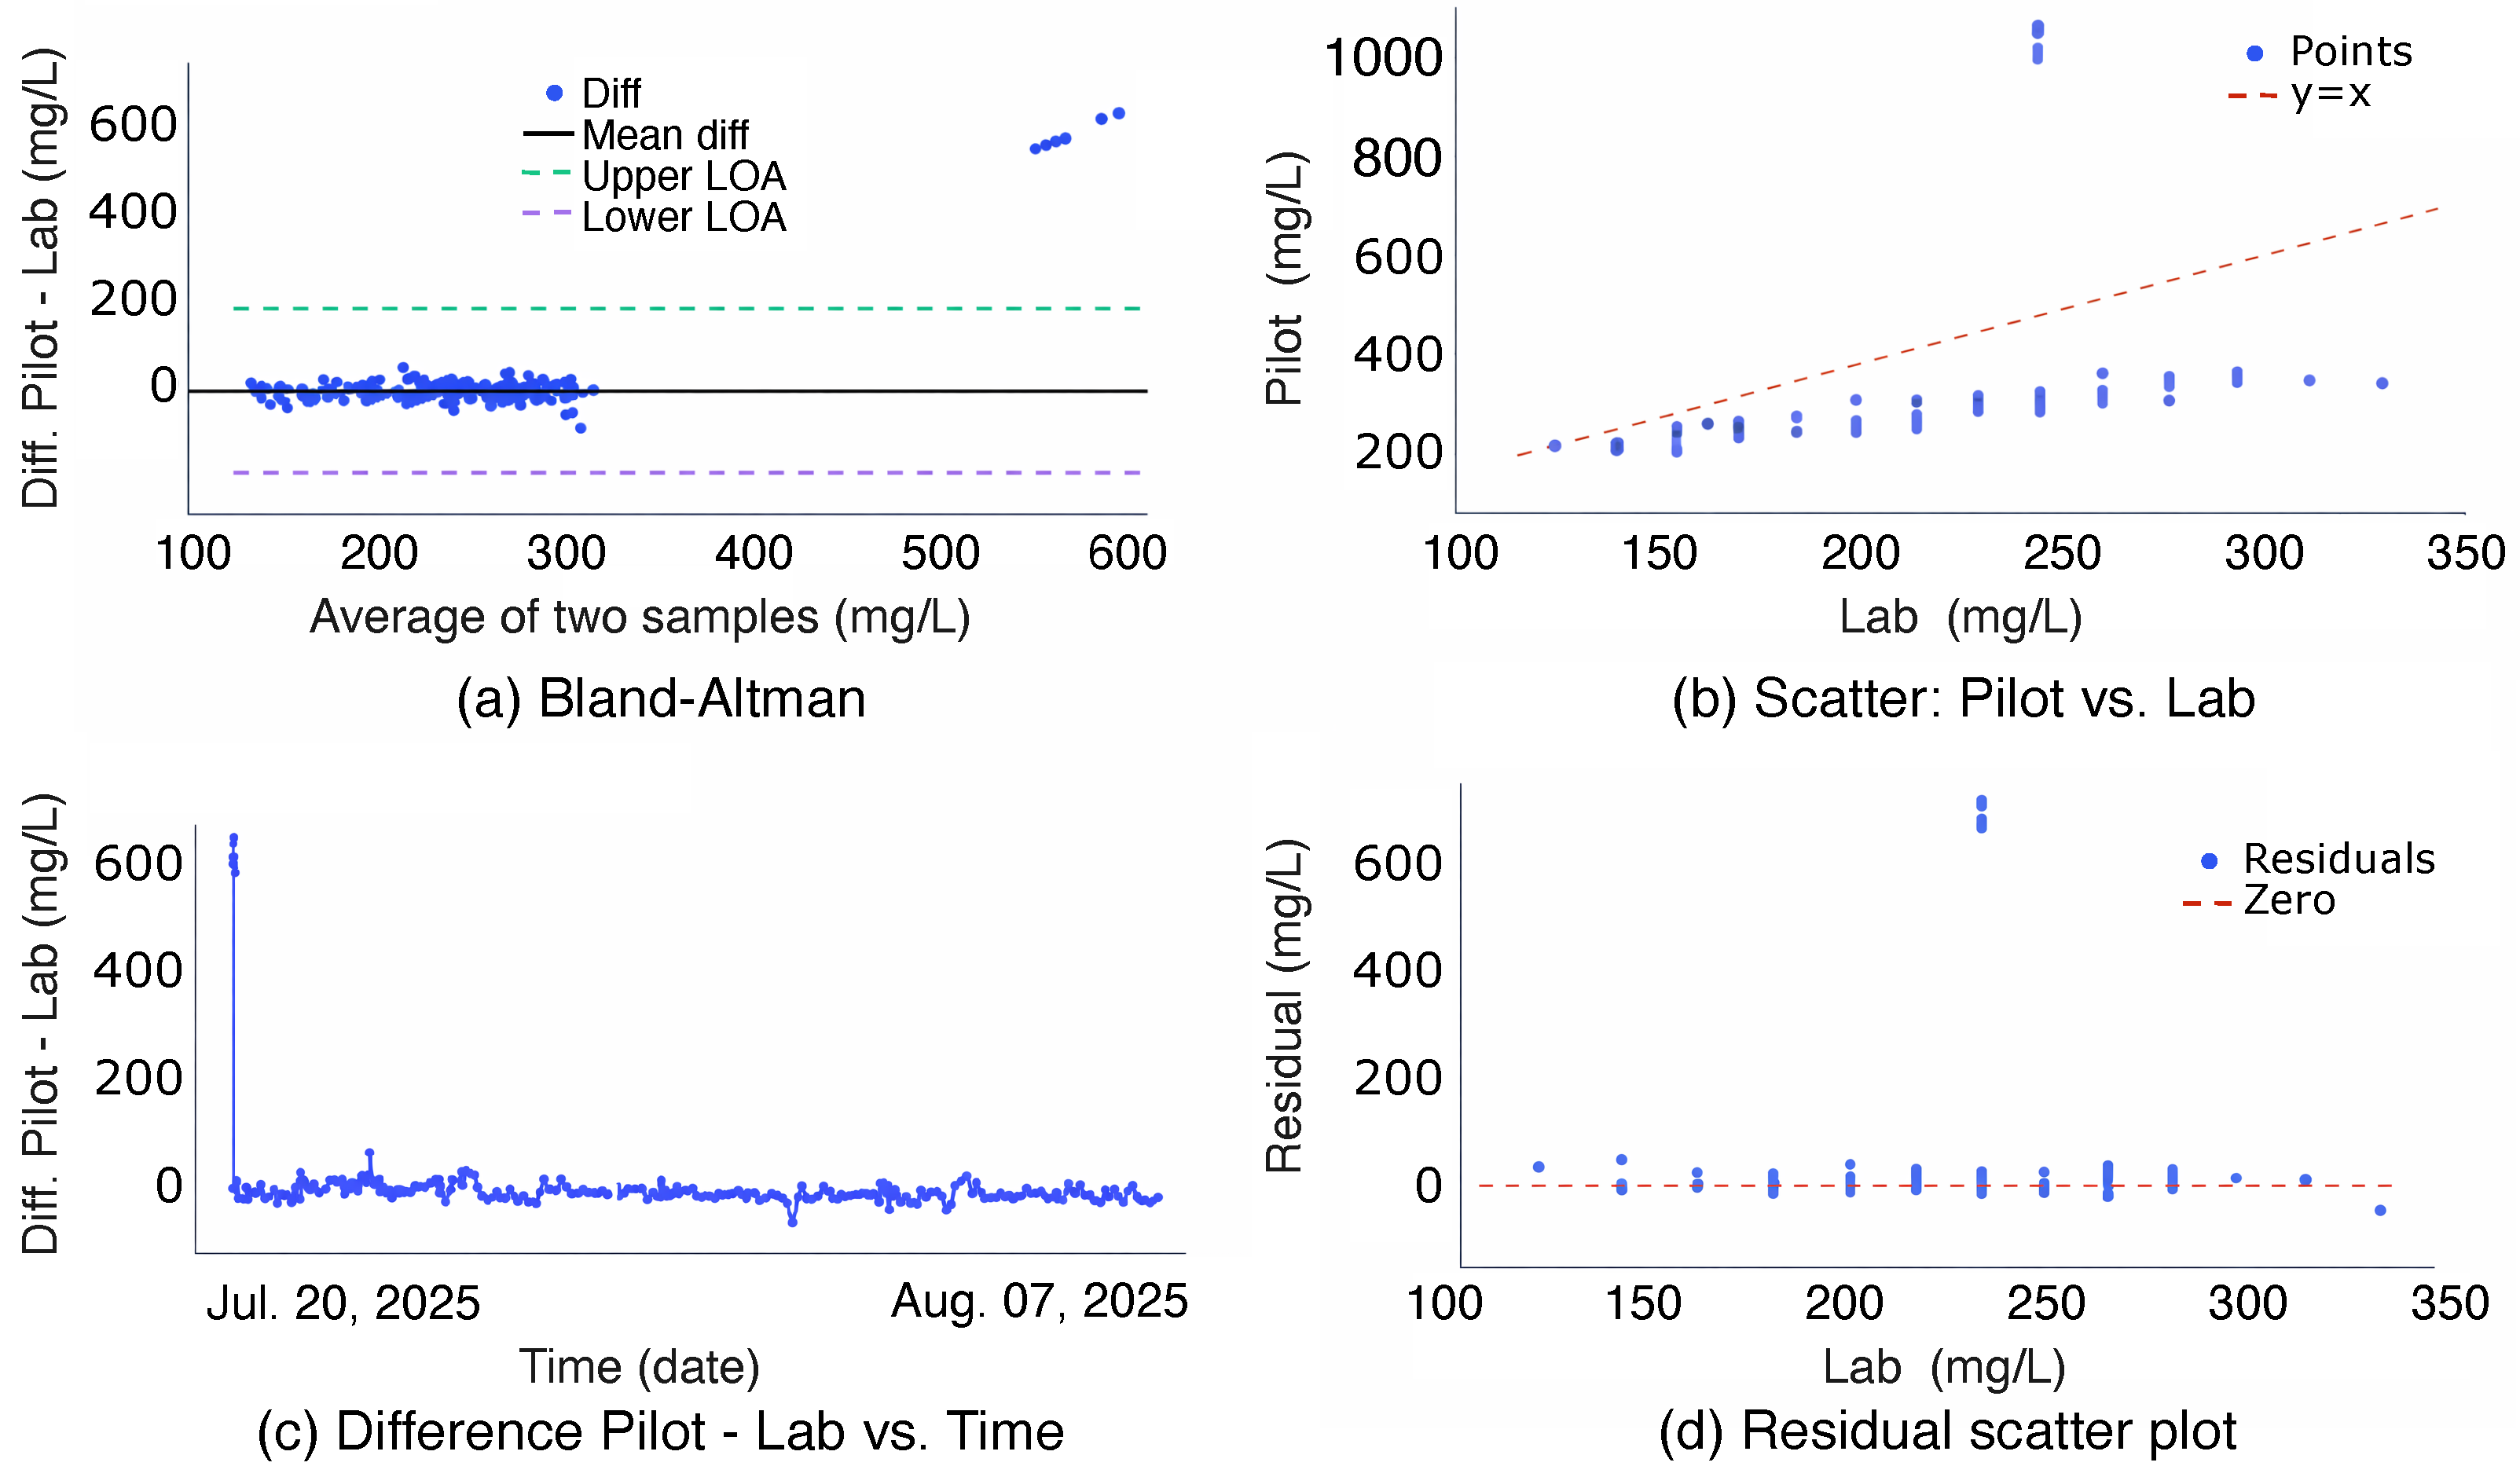
Figure 6a illustrates the difference between the pilot system measurements and the laboratory measurements against their mean. The data points are distributed homogeneously around the zero-difference line, indicating the absence of a significant systematic bias. Moreover, most measurements fall within the established limits of agreement, indicating good accuracy and consistency between the two methods. Figure 6b shows a linear relationship between the pilot system results and those obtained in the laboratory. The high degree of alignment between the data points and the trend line suggests a strong positive correlation, consistent with the statistical indicators. This behavior confirms that the pilot system can reliably reproduce the laboratory results. Figure 6c shows the temporal evolution of the difference between the pilot system measurements and the laboratory results. The variations remain within a stable range throughout the analyzed period, without exhibiting increasing trends or significant periodic patterns. This temporal stability suggests that the pilot system performs consistently under different operating conditions, reinforcing its reliability for continuous monitoring applications. Figure 6d assesses the distribution of residuals (differences between measured and estimated values). The absence of defined patterns and the random dispersion around the zero line indicate that no systematic errors are present and that the comparison model is valid.
As presented in Table 1, the correlation between pilot and laboratory measurements is high, with values of 0.91 for turbidity and 0.93 for sediment concentration, indicating strong agreement between both measurement approaches. These results are further supported by the statistical indicators summarized in Table 2. The coefficient of determination (R2 = 0.9106) confirms the model’s strong explanatory power, while the Pearson correlation coefficient (r = 0.9542) indicates a robust, consistent positive relationship. Error metrics such as MAE (10.9896) and RMSE (13.4389) demonstrate good predictive accuracy and low dispersion. Additionally, the bias (−1.7294) is close to zero, indicating only a slight underestimation tendency, and the relatively low standard deviation (13.3385) confirms the stability of the measurements.
These quantitative results provide statistical evidence that the pilot monitoring system reliably captures sediment dynamics and reproduces laboratory trends with high fidelity. Consequently, the analysis has been strengthened by moving beyond a qualitative description toward a quantitatively validated relationship, supported by correlation and error metrics. While a direct functional model linking sediment concentration to turbine efficiency loss remains limited by the current availability of long-term operational efficiency data, the strong agreement between pilot and laboratory measurements provides a robust foundation for future development of such models.
Beyond measurement accuracy, the integration of real-time sediment data into the SCADA interface significantly enhances operational decision-making. The system enables continuous visualization and analysis of sediment dynamics, allowing operators to generate spatial sediment accumulation maps and identify zones of increased deposition, particularly near the intake structures. This capability supports more efficient and targeted dredging strategies and improved water-intake management. As a result, the implementation of the monitoring system contributes not only to measurement reliability but also to operational optimization, with an estimated extension of the effective reservoir lifespan of approximately 6–8 years under current hydrological conditions.
The Digital-OT architecture follows a structured data workflow that includes acquisition, preprocessing, calibration, validation, and integration into the SCADA system. Sensor data are continuously collected and synchronized with operational variables, enabling real-time monitoring. Basic filtering and data quality checks are applied to ensure consistency. Calibration is performed by comparing with laboratory measurements, using empirical adjustments and statistical validation, supported by high correlation and low error metrics. The system integrates measurements from acoustic and optical sensors, leveraging their complementary capabilities, although a formal data fusion algorithm is not explicitly implemented at this stage. Validation is conducted through statistical indicators and temporal consistency analysis. The processed data are then used for real-time visualization and operational decision support.

3.3. Operational Plan Following Implementation of Sediment Monitoring System

With the monitoring system fully installed, the hydropower facility must adopt a structured operational plan to ensure effective long-term use of the new instrumentation and its integration into routine plant management. This plan focuses on maintaining data quality, ensuring system reliability, and maximizing the value of sediment intelligence for operational and strategic decision-making.

3.3.1. Real-Time Responses

Implementing an online sediment monitoring system enables a comprehensive operational strategy centered on real-time detection, evaluation, and response to sediment dynamics within the hydraulic circuit of a hydropower facility. By continuously capturing high-resolution data on suspended sediment concentration (SSC), particle size distribution, and temporal variability, the system provides operators with immediate situational awareness, thereby reducing latency between the onset of a sediment-related event and the corresponding corrective action. This capability forms the foundation for a real-time response protocol in which automated alerts—triggered when sediment thresholds exceed predefined operational or safety limits—activate decision pathways integrated into the plant’s supervisory control and data acquisition (SCADA) platform. These pathways may include dynamic adjustments of discharge valves, bypass operation, selective flow routing, or activation of bottom-outlet flushing mechanisms. The real-time data stream also enables the identification of sediment pulses associated with extreme hydrological events such as intense rainfall, upstream landslides, or dam flushing in cascade systems. Incorporating predictive logic and trend analysis further enhances the system’s capabilities by enabling short-term forecasting of sediment inflow and improving anticipation of hazardous operational conditions. Additionally, training programs for control-room personnel ensure the proper interpretation of digital sediment signatures, fostering consistent response times and reducing human-factor uncertainty. Through this integrated framework, real-time sediment monitoring transforms operational decision-making from reactive to proactive, data-driven, thereby strengthening the resilience, reliability, and safety of hydropower facility operations.

3.3.2. Minimizing Risks from Pipe and Valve Blockage

The deployment of an online sediment monitoring system is pivotal to establishing a preventive strategy to mitigate blockage risks in penstocks, conduits, and high-pressure valve assemblies—components whose operational integrity is essential for hydraulic continuity and plant safety. Continuous sediment characterization allows engineers to detect anomalous increases in deposition rates or particle load that could compromise flow efficiency or induce localized obstructions. This information is used to implement predictive, threshold-based maintenance actions, such as controlled flow reduction, valve cycling, or the strategic activation of purging sequences designed to remobilize accumulated material before it reaches critical levels. The system also enables spatial and temporal mapping of sediment behavior, thereby supporting hydraulic modeling efforts to identify zones of preferential deposition, typically occurring in low-velocity regions, at curvature transitions, or within mechanically complex valve housings. By correlating monitoring data with model outputs, operators can determine optimal operational regimes that minimize sediment settlement while preserving energy production efficiency. Moreover, integrating continuous monitoring into maintenance planning enables targeted inspections using internal cameras, acoustic devices, or robotic crawler systems, thereby reducing downtime and avoiding unnecessary full-system shutdowns. The accumulation of long-term sediment data helps refine engineering designs, improve valve geometries, and develop more effective sediment evacuation techniques. Collectively, this strategy significantly reduces the frequency and severity of obstructions, enhances hydraulic reliability, and prolongs the operational lifespan of conduits and valve systems critical to hydropower generation.

3.3.3. Minimizing Risks in Turbines and Generators

Online sediment monitoring is a fundamental element of a risk-mitigation framework for hydromechanical components, particularly turbines and generators, which are highly vulnerable to erosion, abrasion, and mechanical degradation caused by sediment-rich flows. Real-time measurement of sediment concentration and granulometry enables precise assessment of abrasive potential before the water enters the turbine stages, allowing operators to adjust loading conditions, redistribute flow across multiple units, or temporarily curtail generation during extreme sediment events. This operational flexibility reduces direct impacts on runner blades, wicket gates, guide vanes, and bearings—components that can degrade, leading to severe efficiency losses and unplanned outages. The monitoring system also uses empirical measurements to enable more accurate quantification of risks associated with sediment-driven degradation, and to adopt curves and thermographic signatures of generator assemblies. Such correlations strengthen the predictive maintenance model, enabling earlier detection of anomalous wear patterns and supporting condition-based intervention strategies. Advanced data analytics, including machine-learning algorithms trained on sediment and mechanical datasets, can further refine predictions of component wear rates and remaining useful life, thereby supporting asset-management decisions and long-term refurbishment planning. In addition, integrating sediment monitoring into the electromechanical performance assessment enables validation of erosion-resistant coatings, improved alloys, and optimized turbine geometries designed to withstand abrasive environments. The resulting reduction in wear-induced failures significantly enhances plant availability, safeguards equipment investment, and maintains optimal power-generation efficiency across variable sedimentary regimes.

3.3.4. Decreased Repair Frequency

By enabling continuous surveillance of sediment dynamics, an online monitoring system supports a transition from conventional time-based maintenance to an evidence-driven, predictive maintenance paradigm, substantially reducing the frequency of repairs across hydraulic and electromechanical assets. Sediment data, captured at an acceptable temporal resolution, provides actionable insights into cumulative abrasive exposure, facilitating accurate estimation of component degradation trajectories. This information enables maintenance engineers to adjust operating strategies to minimize mechanical stress, such as optimizing unit dispatch, modulating flow velocities, or scheduling sediment-flushing operations at hydrologically favorable times. The integration of sediment monitoring with historical maintenance records enables statistical modeling of failure modes, supporting root-cause analysis and the development of updated maintenance intervals tailored to actual operating conditions rather than fixed schedules. Equipment downtime is further reduced by implementing targeted inspections triggered by sediment anomalies, thereby avoiding costly premature interventions. Predictive models, including Bayesian networks and degradation-state estimation algorithms, enhance the ability to forecast wear progression and prioritize maintenance actions based on risk and criticality. The accumulation of long-term sediment data also guides improvements in spare-part procurement, enabling more precise inventory management for critical components such as turbine seals, guide vanes, and valve seats. Collectively, this strategy reduces corrective maintenance events, improves budget allocation efficiency, and extends the operational lifespan of key assets, ultimately lowering total lifecycle costs and improving plant operational stability.

3.3.5. Increased Reliability in Operation

The integration of a real-time sediment monitoring system significantly enhances the operational reliability of a hydropower facility by providing a comprehensive understanding of sediment-related risks that traditionally contribute to performance variability, equipment degradation, and unplanned outages. By enabling early detection of hazardous sediment conditions, the system allows operators to implement timely flow adjustments, optimize unit dispatch strategies, and activate sediment-management mechanisms that preserve hydraulic stability. This continuous monitoring supports the development of reliability-centered operational strategies that incorporate probabilistic risk assessments, which quantify the impact of sediment events on overall system performance and enable more accurate planning for both short-term generation targets and long-term resource management. Reliability is further enhanced by integrating sediment data into SCADA and digital twin platforms, enabling simulations of operational scenarios, predictive evaluation of system resilience, and validation of contingency protocols during extreme hydrological events. The availability of long-term sediment datasets also improves forecasting accuracy for seasonal and event-driven variability, thereby enhancing water-resource planning and coordination with upstream reservoirs or cascading hydropower systems. Moreover, the system provides empirical evidence supporting infrastructure upgrades, operational optimization, and regulatory compliance in sediment-sensitive basins. Through continuous operator training and institutional learning, sediment monitoring fosters a culture of data-driven decision-making, ultimately reinforcing the reliability, safety, and sustainability of hydropower operations in sediment-rich environments.

4. Discussion

Reservoir-based hydropower plants have only recently begun to incorporate advanced sediment-monitoring systems in response to the increasingly extreme hydrological conditions observed in the last decade [30,42,43]. Unusually high inflows, driven by intensified rainfall regimes and altered watershed dynamics, have transported unprecedented volumes of sediment into reservoirs and hydraulic conveyance structures [24,25]. This phenomenon has accelerated abrasive wear on hydromechanical equipment at rates exceeding those observed over the past 20 years [56,58], resulting in reduced reservoir lifespan, increased operational disruptions, and a higher incidence of unplanned shutdowns. By incorporating empirical measurements, the implementation of the comprehensive decision-support matrix for operational management now allows for a precise quantification of sediment-induced degradation. This shift ensures that preventive strategies are informed by real-time operational intelligence instead of subjective assessments [28,29].
Following the deployment of the monitoring system, which includes high-frequency turbidity sensors, acoustic Doppler technologies, SSC meters, and continuous bathymetric profiling, the plant has improved its understanding of the temporal and spatial dynamics of sediment transport. Pre-implementation monitoring relied almost exclusively on periodic manual sampling and infrequent reservoir surveys, which were insufficient for capturing rapid sediment pulses during high-inflow periods [38,39]. Post-implementation datasets reveal fine-scale variability in sediment concentrations, particularly during peak-flow events, enabling early identification of hazardous conditions that pose a direct threat to turbines, injectors, penstocks, spherical valves, and other hydraulic components. Comparisons between pre- and post-implementation performance data indicate that turbidity peaks correlate strongly with efficiency losses and accelerated abrasive wear—correlations that were previously unobservable with low-frequency measurement methods [56,58].
One of the most important outcomes of the system is the enhancement of predictive analytics for asset degradation. Real-time sediment concentration data, in combination with hydrological forecasting models, have enabled operators to anticipate when abrasive loads are likely to exceed critical thresholds [28,29]. These insights are crucial for informed decision-making, particularly regarding the timing of controlled shutdowns. The previously developed decision matrix for operational management has been strengthened with empirical measurements that specify when protective actions must be taken. For example, during high-inflow events associated with extreme rainfall, the system can detect abrupt increases in sediment concentration hours before abrasive effects become significant in the turbine environment. This early-warning capability directly protects high-value components and prevents irreversible damage that would otherwise result in prolonged outages and costly repairs [18].
The implementation has also improved reservoir sedimentation management. High-resolution bathymetric data now provide continuous or near-continuous tracking of deposition patterns, enabling accurate estimation of storage loss and enhanced planning of dredging or flushing operations [26]. Before the upgrade, reservoir volume surveys were conducted annually or biannually, often revealing cumulative sedimentation only after intake performance had already been compromised. The new system enables evaluation of sediment deposition trends in near-real time, facilitating targeted sediment evacuation during periods of low energy demand and reducing unnecessary interventions. This optimization not only reduces operational costs but also extends the reservoir’s overall functional lifespan. From an environmental standpoint, the system strengthens compliance with the sediment continuity requirements [61]. Many regulatory frameworks require hydropower plants to maintain downstream sediment flows, thereby preventing ecological degradation, promoting channel stability, and sustaining riverine habitats. With real-time sediment concentration data, operators can modulate flushing operations to preserve downstream sediment balance while minimizing impacts on aquatic ecosystems. This capacity is particularly relevant during periods of extreme hydrological variability, when sediment trapping and sudden releases can significantly perturb downstream environments [21].
Economically, the benefits are clear. By transitioning from fixed-interval maintenance to condition-based maintenance informed by real sediment measurements, the plant has reduced unnecessary equipment downtime and avoided premature failures [30]. Early evaluations indicate a 20–30% reduction in abrasion-related maintenance costs, accompanied by improved turbine availability and greater operational continuity during non-critical periods. In addition, improved forecasting of sediment events allows the plant to optimize generation during safe windows, thus maintaining revenue streams without compromising asset health. Finally, integrating the sediment monitoring system facility’s supervisory control and data acquisition (SCADA) platform has improved operational resilience [16]. Automated alarms triggered by sediment thresholds now enable rapid operational responses to potential hazards. During extreme events, operators are equipped with quantitative metrics (such as sediment concentration rate of change, turbidity gradients, and predictive thresholds) that facilitate quick decisions, including switching intakes, reducing load, or initiating protective shutdowns. These advancements ensure the plant remains operationally robust amid increasingly variable hydrological regimes [17].
Despite the clear operational benefits, the new digital sediment monitoring system has limitations related to sensor calibration, sensitivity to sediment grain size, and the need for reliable data transmission during extreme events [44,54]. Moreover, the effectiveness of the digitalization process is strongly influenced by the human factor. The transition to continuous, data-driven operation requires targeted training, clear operational protocols, and the development of new competencies in data interpretation and decision-making for AES Colombia personnel [16,17]. Without adequate capacity building, the availability of real-time sediment data alone does not guarantee improved operational performance. Sediment dynamics represent a fundamental operational challenge for large hydropower plants, directly affecting reservoir lifespan, hydraulic efficiency, and the integrity of critical components [22,23]. Long-term operation, thereby directly affecting performance, extends beyond gradual storage loss and can significantly influence plant availability through abrasive wear, intake vulnerability, and increased maintenance requirements. Addressing these challenges requires a shift from traditional, campaign-based sediment assessment toward continuous, operationally integrated monitoring strategies [42,43]. Additionally, although it is well established that suspended sediments can negatively affect turbine efficiency through erosion and increased hydraulic losses, quantifying this effect directly requires synchronized measurements of sediment concentration and turbine operating parameters over extended periods. Nevertheless, the implementation of the sediment monitoring system provides a reliable framework for continuous data acquisition, which is a prerequisite for future analysis. Preliminary observations indicate that higher sediment concentrations tend to coincide with operating conditions that may influence turbine performance; however, a statistically robust correlation will be addressed in future work by integrating long-term operational and sediment datasets.
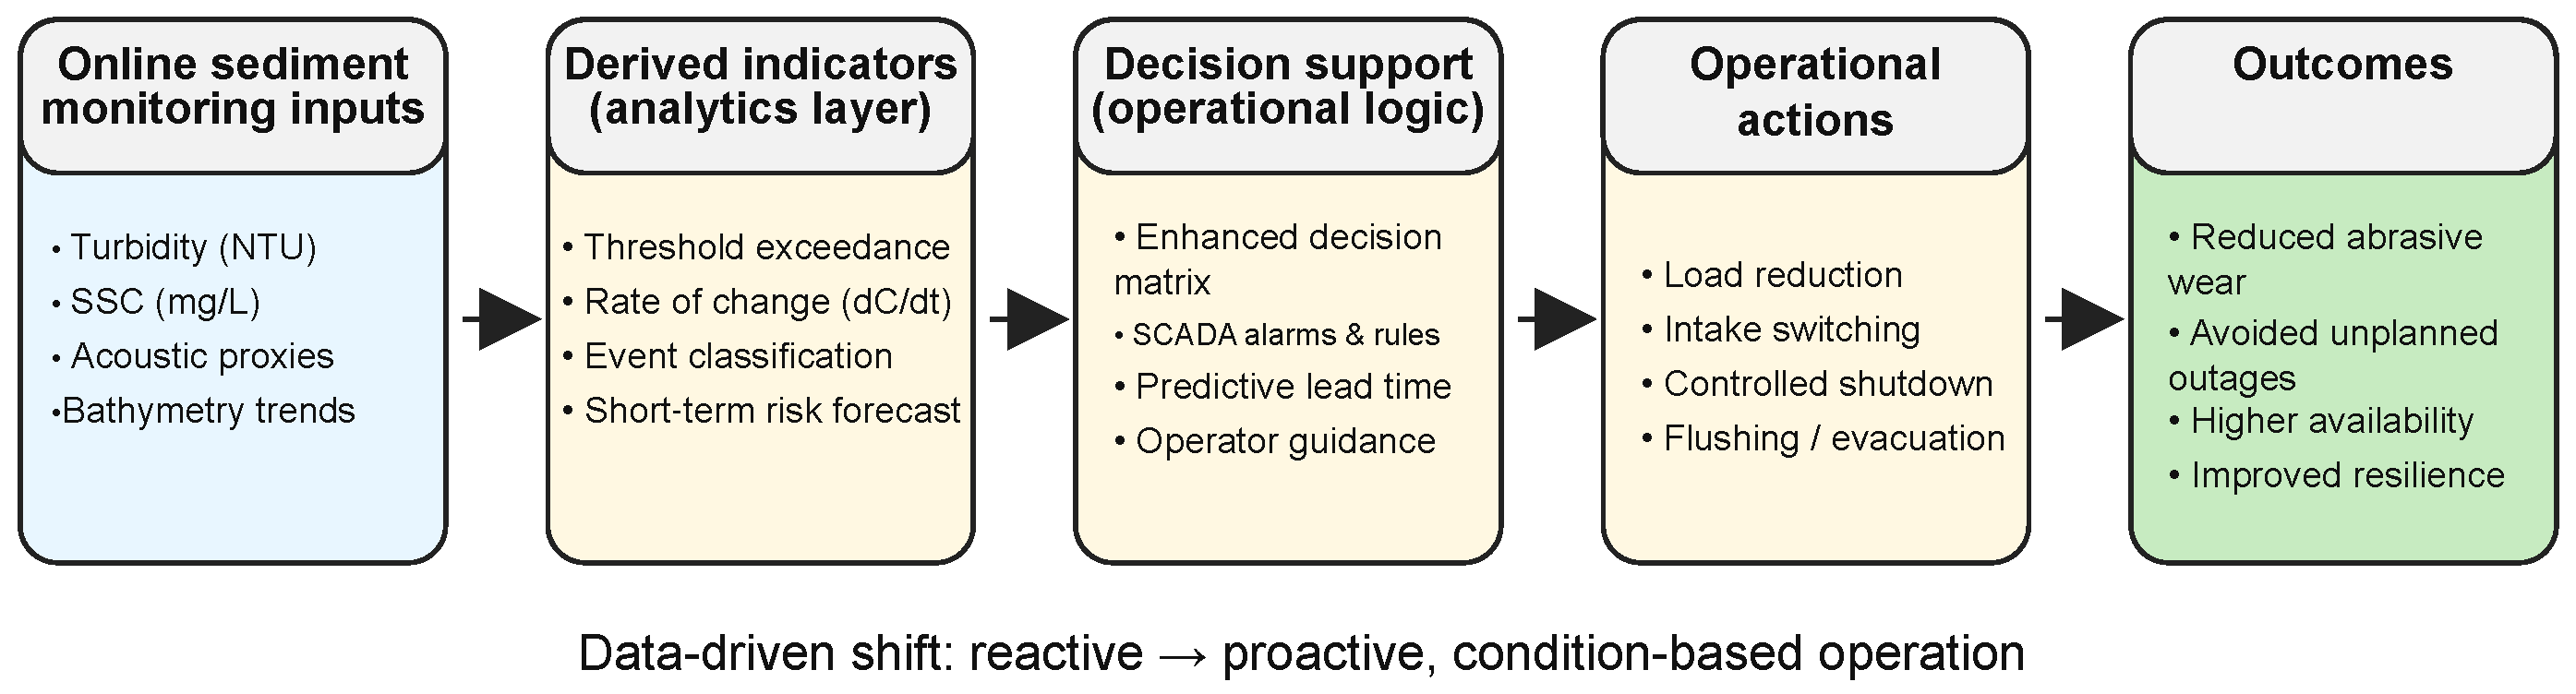
To summarize how real-time sediment information is translated into actionable operational decisions, Figure 7 summarizes the decision logic enabled by the digital sediment monitoring system. Continuous measurements of turbidity, suspended sediment concentration, and acoustic indicators are processed to derive dynamic risk metrics, including concentration thresholds, rate-of-change metrics, and short-term abrasive load forecasts. These indicators directly reinforce the previously developed operational decision matrix, allowing operators to anticipate hazardous conditions and initiate protective actions before irreversible damage occurs within the turbine environment. Unlike traditional monitoring approaches based on delayed or low-frequency observations, this framework enables proactive, condition-based operation, thereby reducing unplanned shutdowns, limiting abrasive wear, and improving overall plant resilience during extreme inflow events [28,29].

5. Conclusions

The implementation of a continuous digital monitoring system under a Digital-OT architecture is fundamental to ensuring the long-term operability of the AES Chivor Hydropower Plant, particularly as it faces a loss of reservoir storage capacity exceeding 20%. This system transcends the limitations of conventional campaign-based monitoring by enabling the real-time integration of physical and operational parameters, which is vital for informed decision-making. By digitizing the supervision process through multiparametric probes integrated into the SCADA environment, a solid empirical foundation is established. This allows for a strategic transition from reactive management to an adaptive maintenance framework, optimizing responses to the advancement of the sediment delta and ensuring the stability of the hydraulic system within the context of aging infrastructure.
The technical robustness of this solution is based on a hybrid sensing architecture that combines multi-frequency ultrasonic backscatter and optical light-scattering principles, covering a dynamic measurement range of 10–6000 mg/L. This technological configuration can identify particle size distributions, including critical fine fractions, which are essential for characterizing the abrasive potential affecting the eight Pelton turbines. The statistical validation of this deployment, which achieves a correlation coefficient of 0.93 with laboratory gravimetric analyses with a sampling frequency of 15 min, ensures that the data used for asset management possess the necessary precision to detect sudden increases in suspended sediment concentrations, which are projected to reach up to 1600 mg/L during specific discharge events.
At the time of manuscript preparation, the monitoring system is in the deployment and commissioning phase; therefore, long-term operational datasets and validation under extreme hydro-sedimentological conditions are not yet fully available. The operational plan was developed to establish a framework for real-time monitoring and early warning, supported by defined performance indicators and integration with the SCADA system for operational decision-making. To enhance the study’s practical contribution, preliminary results from early system operation have been incorporated, demonstrating continuous sediment data acquisition, stable communication, and the ability to capture temporal variability consistent with plant conditions. Key performance aspects such as data availability, sensor stability, and responsiveness to early warning thresholds are also discussed. Additionally, annual energy generation in hydropower plants can be affected by sediment dynamics, leading to efficiency losses, increased maintenance, and operational constraints during high-sediment events. Although plant-level generation data exist, a direct quantitative correlation with sediment concentration has not yet been established due to the ongoing deployment of the monitoring system and the lack of long-term synchronized datasets. Nevertheless, the system provides a solid foundation for future integration of sediment and operational data to evaluate the impact on energy production.
A long-term validation strategy is proposed, based on at least one year of continuous monitoring, including wet and dry seasons, periodic trend analysis, and cross-validation with laboratory measurements. System performance during high-sediment-load events will also be assessed. Finally, the current lack of long-term data is acknowledged as a limitation. Future work will focus on multi-season validation, the relationship between sediment concentration and turbine performance, and the development of statistical models to evaluate sediment-related impacts.
Finally, from an economic perspective, the implementation of sediment monitoring systems involves costs associated with instrumentation, installation, system integration, and maintenance. Although detailed cost data cannot be disclosed due to commercial constraints, the proposed solution is based on commercially available technologies, which support its scalability and practical implementation. The main benefit of the system lies in its ability to reduce operational risks by enabling early detection of high sediment loads, improving maintenance planning, and minimizing unplanned outages. These factors can translate into significant economic savings, particularly in high-capacity hydropower plants, where downtime and equipment degradation represent substantial costs. A comprehensive techno-economic analysis will be addressed in future work once sufficient operational and financial data become available.

Author Contributions

Conceptualization, A.L.-P., J.A.C., L.R., F.E.L.-C., C.N.-L., R.E.V. and W.S.-L.; methodology, A.L.-P., J.A.C., F.E.L.-C. and L.R.; validation, A.L.-P., J.A.C., L.R., F.E.L.-C., C.N.-L., R.E.V. and W.S.-L.; formal analysis, W.S.-L., C.N.-L. and R.E.V.; investigation, A.L.-P., J.A.C., L.R., F.E.L.-C., N.C.P.-R., L.M.-C., C.N.-L., R.E.V. and W.S.-L.; writing—original draft preparation, C.N.-L., R.E.V. and W.S.-L.; writing—review and editing, C.N.-L., R.E.V. and W.S.-L.; supervision, N.C.P.-R., C.N.-L., R.E.V. and W.S.-L. All authors have read and agreed to the published version of the manuscript.

Funding

This work was developed with the funding of AES Colombia and is partially registered in the Colombian Ministry of Science, Technology, and Innovation (Minciencias) as a process innovation project “Innovación y Transformación Tecnológica de Sistemas de Control y Supervisión para la Disminución de Riesgos Operacionales y la Optimización de la Eficiencia, Confiabilidad y Sostenibilidad en la Central Hidroeléctrica Chivor de AES Colombia”, as allowed by the National Tax Benefits Council, Project 117178.

Data Availability Statement

The original contributions presented in this study are included in the article. Further inquiries can be directed to the corresponding author.

Conflicts of Interest

Authors Aldemar Leguizamón-Perilla, Johann A. Caballero, Leonardo Rojas, Francisco E. López-Cely, Nhora Cecilia Parra-Rodriguez, and Laidi Morales-Cruz were employed by the company AES Corporation and AES Colombia. The remaining authors declare that the research was conducted in the absence of any commercial or financial relationships that could be construed as a potential conflict of interest.

Abbreviations

The following abbreviations are used in this manuscript:
AIArtificial Intelligence
FATFactory Acceptance Test
IEAInternational Energy Agency
LISSTLaser In Situ Scattering and Transmissometry
MLMachine Learning
ODSMOperational Decision Support Module
OTOperational Technology
SCADASupervisory Control and Data Acquisition
SATSite Acceptance Test
SDGSustainable Development Goal
SSCSuspended Sediment Concentration

References

  1. United Nations Department of Economic and Social Affairs. The Sustainable Development Goals Report 2025; United Nations: New York, NY, USA, 2025. [Google Scholar]
  2. IEA; World Bank. Sustainable Energy for All 2017—Progress toward Sustainable Energy (Summary); Technical Report; World Bank: Washington, DC, USA, 2017. [Google Scholar]
  3. United Nations. World Population Prospects 2024: Summary of Results; Techreport desa/pop/2024/tr/no. 9; United Nations Population Fund: New York, NY, USA, 2024. [Google Scholar]
  4. IEA. World Energy Outlook 2024; Technical Report WEO-2024; International Energy Agency: Paris, France, 2024. [Google Scholar]
  5. Su, H.; Hu, J.; Yang, M.; Wen, Z. Assessment and prediction for service life of water resources and hydropower engineering. Nat. Hazards 2015, 75, 3005–3019. [Google Scholar] [CrossRef] [Scilit]
  6. Fry, J.J.; Morris, M.; Schleiss, A. Hydropower, a catalyst for energy transition in Europe. LHB Hydrosci. J. 2022, 108. [Google Scholar] [CrossRef] [Scilit]
  7. Zhang, Y.; Ma, H.; Zhao, S. Assessment of hydropower sustainability: Review and modeling. J. Clean. Prod. 2021, 321, 128898. [Google Scholar] [CrossRef] [Scilit]
  8. Tefera, W.M.; Kasiviswanathan, K. A global-scale hydropower potential assessment and feasibility evaluations. Water Resour. Econ. 2022, 38, 100198. [Google Scholar] [CrossRef] [Scilit]
  9. De Silva, T.; Jorgenson, J.; Macknick, J.; Keohan, N.; Miara, A.; Jager, H.; Pracheil, B. Hydropower operation in future power grid with various renewable power integration. Renew. Energy Focus 2022, 43, 329–339. [Google Scholar] [CrossRef] [Scilit]
  10. Vagnoni, E.; Gezer, D.; Anagnostopoulos, I.; Cavazzini, G.; Doujak, E.; Hočevar, M.; Rudolf, P. The new role of sustainable hydropower in flexible energy systems and its technical evolution through innovation and digitalization. Renew. Energy 2024, 230, 120832. [Google Scholar] [CrossRef] [Scilit]
  11. Ascher, W. Rescuing responsible hydropower projects. Energy Policy 2021, 150, 112092. [Google Scholar] [CrossRef] [Scilit]
  12. Sishi, M.; Telukdarie, A. Adoption of Data-Driven Automation Techniques to Create Smart Key Performance Indicators for Business Optimization. Appl. Syst. Innov. 2025, 8, 10. [Google Scholar] [CrossRef] [Scilit]
  13. Malik, F.H.; Hussain, G.A.; Alsmadi, Y.M.S.; Haider, Z.M.; Mansoor, W.; Lehtonen, M. Integrating Energy Storage Technologies with Renewable Energy Sources: A Pathway Toward Sustainable Power Grids. Sustainability 2025, 17, 4097. [Google Scholar] [CrossRef] [Scilit]
  14. Gitelman, L.; Kozhevnikov, M.; Visotskaya, Y. Diversification as a Method of Ensuring the Sustainability of Energy Supply within the Energy Transition. Resources 2023, 12, 19. [Google Scholar] [CrossRef] [Scilit]
  15. Karekezi, Y.C.; Maurer, F.; Robles, D.J.T.; Øyvang, T.; Nøland, J.K. Transforming Classical Hydropower Generation for Flexibility in the Global Energy Transition: Challenges, Requirements, and Prospects. IEEE Access 2025, 13, 74762–74780. [Google Scholar] [CrossRef] [Scilit]
  16. Leguizamon-Perilla, A.; Rodriguez-Bernal, J.; Moralez-Cruz, L.; Farfán-Martinez, N.; Nieto-Londoño, C.; Vásquez, R.; Escudero-Atehortua, A. Digitalisation and Modernisation of Hydropower Operating Facilities to Support the Colombian Energy Mix Flexibility. Energies 2023, 16, 3161. [Google Scholar] [CrossRef] [Scilit]
  17. Pepe, C.; Zanoli, S.M. Digitalization, Industry 4.0, Data, KPIs, Modelization and Forecast for Energy Production in Hydroelectric Power Plants: A Review. Energies 2024, 17, 941. [Google Scholar] [CrossRef] [Scilit]
  18. Almeida, R.M.; Schmitt, R.J.; Castelletti, A.; Flecker, A.S.; Harou, J.J.; Heilpern, S.A.; Kittner, N.; Mathias Kondolf, G.; Opperman, J.J.; Shi, Q.; et al. Strategic planning of hydropower development: Balancing benefits and socioenvironmental costs. Curr. Opin. Environ. Sustain. 2022, 56, 101175. [Google Scholar] [CrossRef] [Scilit]
  19. del Río, D.A.; Moffett, H.; Nieto-Londoño, C.; Vásquez, R.E.; Escudero-Atehortúa, A. Chivor’s Life Extension Project (CLEP): From Sediment Management to Development of a New Intake System. Water 2020, 12, 2743. [Google Scholar] [CrossRef] [Scilit]
  20. Ertugrul, N. Reinventing the Power Grid: Renewable Energy, Storage, and Grid Modernization; CRC Press: Boca Raton, FL, USA, 2024. [Google Scholar] [CrossRef] [Scilit]
  21. Pessenlehner, S.; Liedermann, M.; Holzapfel, P.; Skrame, K.; Habersack, H.; Hauer, C. Evaluation of Hydropower Projects in Balkan Rivers Based on Direct Sediment Transport Measurements: Challenges, Limits and Possible Data Interpretation—Case study Vjosa River/Albania. River Res. Appl. 2022, 38, 1014–1030. [Google Scholar] [CrossRef] [Scilit]
  22. Schleiss, A.J.; Franca, M.J.; Juez, C.; De Cesare, G. Reservoir sedimentation. J. Hydraul. Res. 2016, 54, 595–614. [Google Scholar] [CrossRef] [Scilit]
  23. Gabl, R.; Gems, B.; Birkner, F.; Hofer, B.; Aufleger, M. Adaptation of an Existing Intake Structure Caused by Increased Sediment Level. Water 2018, 10, 1066. [Google Scholar] [CrossRef] [Scilit]
  24. Othman, M.E.F.; Sidek, L.M.; Basri, H.; El-Shafie, A.; Ahmed, A.N. Climate challenges for sustainable hydropower development and operational resilience: A review. Renew. Sustain. Energy Rev. 2025, 209, 115108. [Google Scholar] [CrossRef] [Scilit]
  25. Patro, E.R.; De Michele, C.; Granata, G.; Biagini, C. Assessment of current reservoir sedimentation rate and storage capacity loss: An Italian overview. J. Environ. Manag. 2022, 320, 115826. [Google Scholar] [CrossRef] [Scilit] [PubMed]
  26. Bacalhau, J.R.; Ribeiro Neto, A.; Crétaux, J.F.; Bergé-Nguyen, M.; Moreira, D.M. Bathymetry of reservoirs using altimetric data associated to optical images. Adv. Space Res. 2022, 69, 4098–4110. [Google Scholar] [CrossRef] [Scilit]
  27. Jian, X.; Chen, J. Real-time monitoring and early warning system for hydropower safety based on the internet of things. Intell. Decis. Technol. 2025, 19, 2295–2309. [Google Scholar] [CrossRef] [Scilit]
  28. Prado, L.; Fonseca, M.; Bernardes, J.V.; Santos, M.G.; Bortoni, E.C.; Bastos, G.S. Forecast of Operational Downtime of the Generating Units for Sediment Cleaning in the Water Intakes: A Case of the Jirau Hydropower Plant. Energies 2023, 16, 6354. [Google Scholar] [CrossRef] [Scilit]
  29. Gacu, J.G.; Kantoush, S.A.; Nguyen, B.Q.; Solidum, R.U.; Balderama, O.F. Challenges and approaches in sediment management in the Philippines: A review of current research, practices, and proposed countermeasures. Nat. Hazards 2025, 121, 19527–19563. [Google Scholar] [CrossRef] [Scilit]
  30. Faraco, R.L.; Barino, F.; Campos, D.; Sampaio, G.; Honório, L.; Marcato, A.; Bessa dos Santos, A.; dos Santos, C.C.; Hamaji, F. Hydroelectric Plant Safety: Real-Time Monitoring Utilizing Fiber-Optic Sensors. Sensors 2024, 24, 4601. [Google Scholar] [CrossRef] [Scilit]
  31. Ramião, J.P.; Carvalho-Santos, C.; Pinto, R.; Pascoal, C. Hydropower Contribution to the Renewable Energy Transition Under Climate Change. Water Resour. Manag. 2022, 37, 175–191. [Google Scholar] [CrossRef] [Scilit]
  32. Tangi, M.; Bizzi, S.; Schmitt, R.; Castelletti, A. Balancing Sediment Connectivity and Energy Production via Optimized Reservoir Sediment Management Strategies. Water Resour. Res. 2023, 59, e2022WR034033. [Google Scholar] [CrossRef] [Scilit]
  33. Amasi, A.; Wynants, M.; Blake, W.; Mtei, K. Drivers, Impacts and Mitigation of Increased Sedimentation in the Hydropower Reservoirs of East Africa. Land 2021, 10, 638. [Google Scholar] [CrossRef] [Scilit]
  34. Castro, P.W.; Mantilla, C.A. Implementation of Strategies for the Management of Dams with Sedimented Reservoirs. Water Resour. Manag. 2021, 35, 4399–4413. [Google Scholar] [CrossRef] [Scilit]
  35. Castro, P.W. Sediment management at the water intake of hydropower plants. Arab. J. Geosci. 2022, 15, 1118. [Google Scholar] [CrossRef] [Scilit]
  36. Wahab, N.A.; Kamarudin, M.K.A.; Toriman, M.E.; Juahir, H.; Samah, M.A.A.; Azinuddin, M.; Saudi, A.S.M.; Hoe, L.I.; Saad, M.H.M.; Sunardi, S. The Assessment of Sedimentation Problems in Kenyir Hydropower Reservoir, Malaysia. Water 2023, 15, 2375. [Google Scholar] [CrossRef] [Scilit]
  37. Morris, G. Classification of Management Alternatives to Combat Reservoir Sedimentation. Water 2020, 12, 861. [Google Scholar] [CrossRef] [Scilit]
  38. Hilgert, S.; Sotiri, K.; Fuchs, S. Review of methods of sediment detection in reservoirs. Int. J. Sediment Res. 2023, 39, 28–43. [Google Scholar] [CrossRef] [Scilit]
  39. Sedláček, J.; Bábek, O.; Grygar, T.M.; Lenďáková, Z.; Pacina, J.; Štojdl, J.; Hošek, M.; Elznicová, J. A closer look at sedimentation processes in two dam reservoirs. J. Hydrol. 2022, 605, 127397. [Google Scholar] [CrossRef] [Scilit]
  40. Golubkov, M.S.; Golubkov, S.M. Secchi Disk Depth or Turbidity, Which Is Better for Assessing Environmental Quality in Eutrophic Waters? A Case Study in a Shallow Hypereutrophic Reservoir. Water 2023, 16, 18. [Google Scholar] [CrossRef] [Scilit]
  41. Matos, T.; Martins, M.; Henriques, R.; Goncalves, L. A review of methods and instruments to monitor turbidity and suspended sediment concentration. J. Water Process Eng. 2024, 64, 105624. [Google Scholar] [CrossRef] [Scilit]
  42. Gacu, J.; Monjardin, C.; Mangulabnan, R.; Pugat, G.; Solmerin, J. Artificial Intelligence (AI) in Surface Water Management: A Comprehensive Review of Methods, Applications, and Challenges. Water 2025, 17, 1707. [Google Scholar] [CrossRef] [Scilit]
  43. Chauhan, B.V.S.; Vedrtnam, A.; Wyche, K.P.; Verma, S. Review on Artificial Intelligence in the Environmental Monitoring. In Prospects of Artificial Intelligence in the Environment; Springer Nature: Singapore, 2025; pp. 29–60. [Google Scholar] [CrossRef] [Scilit]
  44. Sotiri, K.; Hilgert, S.; Mannich, M.; Bleninger, T.; Fuchs, S. Implementation of comparative detection approaches for the accurate assessment of sediment thickness and sediment volume in the Passaúna Reservoir. J. Environ. Manag. 2021, 287, 112298. [Google Scholar] [CrossRef] [Scilit]
  45. Sirabahenda, Z.; St-Hilaire, A.; Courtenay, S.C.; van den Heuvel, M.R. Comparison of Acoustic to Optical Backscatter Continuous Measurements of Suspended Sediment Concentrations and Their Characterization in an Agriculturally Impacted River. Water 2019, 11, 981. [Google Scholar] [CrossRef] [Scilit]
  46. Gaida, T.C.; Mohammadloo, T.H.; Snellen, M.; Simons, D.G. Mapping the Seabed and Shallow Subsurface with Multi-Frequency Multibeam Echosounders. Remote Sens. 2019, 12, 52. [Google Scholar] [CrossRef] [Scilit]
  47. Santos, B.B.D.; Miranda, R.B.D.; Estigoni, M.V.; Villela, J.M.; Mauad, F.F. Evaluation of the laser diffraction method for the measurement of suspended sediment concentration in Mogi-Guaçu reservoir (São Paulo, Brazil). Int. J. River Basin Manag. 2018, 17, 89–99. [Google Scholar] [CrossRef] [Scilit]
  48. Saranga, B.K.S.; Premarathne, U.S.; Atapattu, B.C.L. Stream Sediment Rate Estimation using Optical Sensing. In Proceedings of the 2021 IEEE Industrial Electronics and Applications Conference (IEACon); IEEE: Piscataway, NJ, USA, 2021; pp. 175–180. [Google Scholar] [CrossRef] [Scilit]
  49. Duan, G.; Peng, Y. Flow and sediment measurement for the Three Gorges Project. River 2024, 3, 69–77. [Google Scholar] [CrossRef] [Scilit]
  50. Wang, Y.; Gao, L. Sources and dynamics of suspended particulate matter in a large-river dominated marine system: Contributions from terrestrial sediments, biological particles, and flocculation. J. Mar. Syst. 2022, 225, 103648. [Google Scholar] [CrossRef] [Scilit]
  51. Liu, Y.; Xu, J.; Li, G.; Sun, H.; Liu, S.; Qiao, L.; Ma, Y.; Ding, D.; Wang, C. Evolution of Suspended Particles in the Autumnal North Yellow Sea: Grain-Size Distributions Measured by Laser In Situ Scattering and Transmissometry. IEEE Trans. Geosci. Remote Sens. 2024, 62, 1–13. [Google Scholar] [CrossRef] [Scilit]
  52. Huang, Z.C.; Hsu, T.J.; Nguyen Ly, T. Field Observations on Flocculation of Suspended Sediment in Coastal Algal Reef Environments. In Proceedings of the European Geosciences Union General Assembly 2025, Vienna, Austria, 27 April–2 May 2025. EGU General Assembly 2025, Abstract EGU25-2995. [Google Scholar] [CrossRef] [Scilit]
  53. Weit, A.; Mourier, B.; Fretaud, T.; Winiarski, T. Combined usage of geophysical methods in continental water bodies, their benefits and challenging issues: A special focus on sediment deposits in dam reservoirs. J. Appl. Geophys. 2023, 213, 105036. [Google Scholar] [CrossRef] [Scilit]
  54. Skarbøvik, E.; Gyritia Madsen van’t Veen, S.; Lannergård, E.E.; Wenng, H.; Stutter, M.; Bieroza, M.; Atcheson, K.; Jordan, P.; Fölster, J.; Mellander, P.E.; et al. Comparing in situ turbidity sensor measurements as a proxy for suspended sediments in North-Western European streams. CATENA 2023, 225, 107006. [Google Scholar] [CrossRef] [Scilit]
  55. Drogkoula, M.; Kokkinos, K.; Samaras, N. A Comprehensive Survey of Machine Learning Methodologies with Emphasis in Water Resources Management. Appl. Sci. 2023, 13, 12147. [Google Scholar] [CrossRef] [Scilit]
  56. Agrawal, Y.; Slade, W.; Pottsmith, C.; Dana, D. Technologies and Experience with Monitoring Sediments for Protecting Turbines from Abrasion. IOP Conf. Ser. Earth Environ. Sci. 2016, 49, 122005. [Google Scholar] [CrossRef] [Scilit]
  57. Lin, C.P.; Chung, C.C.; Wu, I.L.; Wu, P.L.; Lin, C.H.; Wu, C.H. Extensive Monitoring System of Sediment Transport for Reservoir Sediment Management. In Handbook of Environmental Engineering; Springer: Berlin/Heidelberg, Germany, 2016; Volume 17. [Google Scholar]
  58. Rai, A.K.; Kumar, A. Sediment Monitoring for Hydro-Abrasive Erosion: A Field Study from Himalayas, India. Int. J. Fluid Mach. Syst. 2017, 10, 146–153. [Google Scholar] [CrossRef] [Scilit]
  59. Jansen, L. Sediment Management Strategies: Case Study on Hydropower Reservoirs in Malaysia. In Proceedings of the International Conference on Dam Safety Management and Engineering; Water Resources Development and Management; Springer: Berlin/Heidelberg, Germany, 2019. [Google Scholar]
  60. Xu, Z.; Niu, Y.; Liang, Y.; Li, Z.; Iftikhor, A. The Integrated Hydropower Sustainability Assessment in Tajikistan: A Case Study of Rogun Hydropower Plant. Adv. Civ. Eng. 2020, 2020, 8894072. [Google Scholar] [CrossRef] [Scilit]
  61. Quaranta, E.; Bonjean, M.; Cuvato, D.; Nicolet, C.; Dreyer, M.; Gaspoz, A.; Rey-Mermet, S.; Bouillaut, B.; Pratalata, L.; Pinelli, M.; et al. Ecologically Improved Turbines, Hydropower in Existing Infrastructures, Hydropeaking Reduction, Digitalization and Governing Systems. Sustainability 2020, 12, 8873. [Google Scholar] [CrossRef] [Scilit]
  62. Arora, N.; Kumar, A.; Singal, S.K. Assessment of Suspended Sediment Properties and Particle Load for Optimal Operation of Hydropower Plants in the Himalayan Region. In Recent Advances in Hydropower Engineering; Wiley: New York, NY, USA, 2025. [Google Scholar] [CrossRef] [Scilit]
  63. Giraldo, S.; la Rotta, D.; Nieto-Londoño, C.; Vásquez, R.E.; Escudero-Atehortúa, A. Digital Transformation of Energy Companies: A Colombian Case Study. Energies 2021, 14, 2523. [Google Scholar] [CrossRef] [Scilit]
  64. del Río, D.A.; Caballero, J.A.; Muñoz, J.T.; Parra-Rodriguez, N.C.; Nieto-Londoño, C.; Vásquez, R.E.; Escudero-Atehortua, A. Design of a Self-Supporting Liner for the Renovation of a Headrace Tunnel at Chivor Hydropower Project. Water 2023, 15, 409. [Google Scholar] [CrossRef] [Scilit]
  65. del Río, D.A.; Moffett, H.; Nieto-Londoño, C.; Vásquez, R.E.; Escudero-Atehortúa, A. Extending Life Expectancy of La Esmeralda Reservoir: A Bet to Support Colombia’s Future Energy Demand. In Proceedings of the ASME 2020 Power Conference (POWER2020); American Society of Mechanical Engineers: New York, NY, USA, 2020. [Google Scholar] [CrossRef] [Scilit]
  66. IEC 60034 Series; Rotating Electrical Machines. International Electrotechnical Commission (IEC): Geneva, Switzerland, 2025.
  67. IEEE 421.1; Standard Definitions for Excitation Systems for Synchronous Machines. Institute of Electrical and Electronics Engineers (IEEE): Piscataway, NJ, USA, 2020.
Figure 1. Evolution of sediment management approaches in hydropower reservoirs.
Energies 19 02481 g001
Figure 2. AES Chivor Hydropower project location. Adapted from Google Earth mapping service.
Energies 19 02481 g002
Figure 3. Digital-OT-based sediment monitoring architecture for the AES Chivor Hydropower Project, illustrating the integration of physical sensing, data fusion, and analytics, and their contribution to stable and efficient hydropower operation.
Energies 19 02481 g003
Figure 4. AES Chivor Hydropower sediment quantification system location. (a) Intake location in the reservoir. (b) Intake system configuration. (c) Simplified 3D model.
Energies 19 02481 g004
Figure 5. Sediment concentration results of laboratory test and new quantification system.
Energies 19 02481 g005
Figure 6. Statistical comparison between pilot and laboratory results. (a) Bland–Altman analysis. (b) Scatter: Pilot vs. Lab. (c) Difference Pilot–Lab. vs. Time. (d) Residual scatter plot.
Energies 19 02481 g006
Figure 7. Conceptual representation of the role of online sediment monitoring data in operational decision-making for reservoir-based hydropower plants.
Energies 19 02481 g007
Table 1. Statistical parameters comparison between Lab results and Pilot.
ParameterAverage ValueMax. ValueStandard DeviationCorrelation (Pilot vs. Lab)
Turbidity (NTU)180400620.91
Sediment Concentration (mg/L)4208501300.93
Temperature (°C)19.822.40.7-
Table 2. Statistical evaluation of the pilot monitoring system’s accuracy using laboratory results as reference.
IndicatorValueInterpretation
R20.9106High correlation; indicates that the pilot reproduces laboratory trends well
MAE10.9896Reduced mean absolute error, showing good accuracy
RMSE13.4389Low root mean square error, indicating good agreement
Bias−1.7294Near-zero bias, with slight underestimation by the pilot
Standard deviation13.3385Low dispersion in errors, indicating stability
Pearson r0.9542Strong and consistent positive correlation
Disclaimer/Publisher’s Note: The statements, opinions and data contained in all publications are solely those of the individual author(s) and contributor(s) and not of MDPI and/or the editor(s). MDPI and/or the editor(s) disclaim responsibility for any injury to people or property resulting from any ideas, methods, instructions or products referred to in the content.