1. Introduction
The increasing concentration of atmospheric carbon dioxide (CO
2) resulting from fossil fuel combustion, industrial activities, and energy-intensive development has become one of the principal drivers of global climate change. Reducing anthropogenic CO
2 emissions is therefore essential for achieving long-term climate targets and net-zero emission pathways. Among available mitigation technologies, carbon capture and storage (CCS) has received considerable attention because it provides a technically feasible and scalable approach to reducing emissions from large stationary sources, including power generation, cement production, steel manufacturing, and other energy-intensive industries. In geological CO
2 sequestration, captured CO
2 is compressed and injected into deep subsurface formations, such as saline aquifers, depleted oil and gas reservoirs, and unmineable coal seams, where it is expected to remain securely stored over geological timescales [
1].
The long-term safety and effectiveness of geological CO2 storage depend fundamentally on the integrity of the overlying caprock. Caprock formations act as low-permeability sealing barriers that prevent the upward migration of injected CO2 from the storage reservoir into shallower formations or the atmosphere. These sealing units are commonly composed of fine-grained formations such as shale, mudstone, claystone, or evaporites. Their containment capacity is governed by a combination of petrophysical, geological, geochemical, and geo-mechanical properties. During CO2 injection, increasing pore pressure may alter the in situ stress state, capillary sealing behavior, and fluid–rock interactions within the storage system. Consequently, caprock integrity should not be treated only as a static geological property, but as a coupled response to changing pressure, temperature, stress, and pore-structure conditions.
Permeability and breakthrough pressure are two of the most important parameters used to evaluate caprock sealing performance. Permeability describes the ability of fluids to flow through the rock matrix and is commonly used to assess potential leakage through connected pore networks, fractures, or defects. Lower permeability generally indicates better sealing capacity. However, permeability is highly sensitive to geological heterogeneity, pore structure, clay content, bedding, fractures, and effective stress conditions, making it difficult to generalize across different caprock formations. Breakthrough pressure, in contrast, represents the minimum pressure required for a non-wetting fluid such as CO
2 to overcome capillary resistance and penetrate the water-saturated pore network of the caprock. It is therefore a more direct measure of capillary sealing capacity and is particularly important for defining safe injection pressure limits in geological CO
2 storage projects [
2].
Several geological and mechanical variables influence permeability and breakthrough pressure. Porosity affects pore volume and pore connectivity, thereby controlling both fluid flow potential and capillary resistance. Depth influences in situ stress conditions and is closely related to confining pressure and formation temperature. Temperature affects CO2 density, brine properties, interfacial tension, and possible fluid–rock reactions, while confining pressure controls pore-throat closure and effective stress-dependent changes in sealing behavior. These variables are strongly interrelated, and their combined influence on caprock sealing performance may be nonlinear. As a result, conventional single-parameter correlations are often insufficient for predicting caprock behavior under realistic reservoir conditions, and multi-variable analytical frameworks are required to capture the coupled nature of these interactions.
Field-scale CCS projects have demonstrated both the feasibility and the geo-mechanical sensitivity of geological CO
2 storage. Projects such as Sleipner and Weyburn have demonstrated the feasibility of secure storage within relatively undeformed, matrix-dominated caprocks [
3,
4]. However, observations from the In Salah project, where injection-induced pressure reactivated pre-existing fault zones and fracture networks, highlight the limitations of matrix-only sealing assumptions [
5]. These field experiences emphasize that reliable caprock integrity assessment requires predictive frameworks that ultimately account for local tectonic and diagenetic discontinuities, in addition to coupled pressure, temperature, stress, and pore-structure effects.
Despite extensive research on caprock behavior, several limitations remain in the existing literature. Many studies focus on isolated relationships between individual parameters, such as porosity–permeability relationships or the influence of confining pressure on breakthrough pressure. Although such investigations provide valuable insights, their findings are often formation-specific and difficult to generalize to different geological settings. In addition, experimental datasets are frequently incomplete because published studies do not consistently report the same variables. Some studies provide permeability and porosity data but omit breakthrough pressure, confining pressure, or temperature, while others report breakthrough pressure without sufficient information on depth or pore-structure characteristics. This fragmented reporting limits the development of robust predictive models and reduces confidence in applying empirical correlations to new storage sites [
6,
7].
Missing and inconsistent data represent an additional challenge in caprock integrity research. Conventional approaches, such as complete-case deletion, reduce the available sample size and may introduce selection bias, particularly when datasets are already limited. Simple imputation methods, such as mean substitution, may also distort the statistical relationships among variables. Multiple Imputation by Chained Equations (MICE) provides a more rigorous approach by estimating missing values based on the conditional relationships among all available variables [
8]. This makes MICE particularly suitable for meta-analysis studies that integrate heterogeneous data from multiple published sources while attempting to preserve inter-variable dependencies.
Recent advances in data-driven modeling offer new opportunities for improving caprock integrity assessment. Ordinary least squares regression and polynomial regression provide interpretable baseline relationships, but their performance may be limited when predictor variables are strongly correlated or when the underlying behavior is nonlinear. Neural networks can capture complex patterns, but their generalization ability is often constrained when datasets are small, as is common in geo-mechanical and petrophysical studies. Physics-informed and hybrid residual models provide a useful alternative by combining domain knowledge with data-driven correction terms, thereby improving predictive accuracy while retaining a stronger connection to the physical behavior of caprock systems. Regularized regression methods, such as Least Absolute Shrinkage and Selection Operator (LASSO) regression, can further improve model stability, reduce overfitting, and support the development of interpretable empirical equations for engineering use [
9].
Although previous studies have examined permeability and breakthrough pressure separately, there remains a clear need for an integrated data-driven study that evaluates both sealing indicators within a common analytical framework. Permeability reflects the potential for fluid flow through the caprock matrix, whereas breakthrough pressure defines the threshold pressure required for CO2 entry. Assessing both parameters together allows a more complete characterization of caprock sealing performance and provides a stronger basis for preliminary site screening and safe injection pressure design.
To address these limitations, this study presents an integrated data-driven meta-analysis of caprock permeability and breakthrough pressure using datasets compiled from the published literature. Porosity, depth, temperature, and confining pressure are considered as the primary governing variables, while missing values are treated using MICE to improve dataset completeness and preserve inter-variable relationships. A progressive modeling framework is applied, including ordinary least squares regression, polynomial regression, neural network models, physics-informed hybrid residual modeling, and LASSO regression with polynomial feature expansion. The novelty of this study lies in evaluating permeability and breakthrough pressure within a common analytical framework while combining missing-data treatment, multicollinearity assessment, machine learning, physics-informed modeling, and interpretable empirical equation development. The outcomes are intended to identify the dominant controls on caprock sealing behavior and support safe CO2 injection pressure design, preliminary site screening, and long-term storage integrity assessment in geological CO2 sequestration systems.
2. Materials and Methods
2.1. Data Collection and Dataset Preparation
This study was conducted using a data-driven meta-analysis approach based on quantitative data compiled from published literature on caprock integrity in geological CO
2 sequestration. The collected sources included laboratory experiments, field-based investigations, numerical studies, and technical reports that presented caprock properties under defined geological, experimental, or reservoir conditions. Permeability-related data and supporting information, including permeability, porosity, lithological characteristics, depth, and caprock flow behavior, were extracted from studies focusing on caprock hydraulic properties, leakage potential, and multiscale caprock integrity assessment [
2,
10,
11,
12,
13,
14], with additional background support from caprock review studies [
3]. Breakthrough-pressure-related data, including breakthrough pressure, confining pressure, temperature, depth, and porosity, were obtained mainly from experimental studies addressing capillary entry pressure, CO
2 breakthrough behavior, and sealing efficiency [
7,
15,
16,
17]. Additional studies on thermal, mechanical, numerical, wettability, risk-assessment, and field-scale caprock responses were used to support interpretation of the controlling mechanisms and storage behavior [
5,
6,
18,
19,
20,
21,
22,
23,
24,
25].
Studies were included if they reported at least one of the selected sealing-performance indicators (i.e., permeability or breakthrough pressure), together with one or more governing variables. The primary input variables considered were porosity (%), depth (m), temperature (°C), and confining pressure (MPa). Permeability (mD) and breakthrough pressure (MPa) were selected as output variables because they represent two complementary aspects of caprock sealing performance.
Because the compiled data were obtained from multiple independent studies, unit systems, reporting formats, and experimental conditions were first standardized. Permeability values were converted to millidarcies (mD), pressure values to megapascals (MPa), depth values to meters (m), and temperature values to degrees Celsius (°C). Duplicate entries, incomplete records with no usable output variable, and data points without clearly defined experimental or field conditions were excluded. The final compiled dataset covered a broad range of reservoir and caprock conditions, as summarized in
Table 1.
2.2. Treatment of Missing Data
A major challenge in the compiled dataset was the presence of missing values, as most published studies did not report all selected variables simultaneously. Removing incomplete records would have reduced the dataset size and may have introduced selection bias. Therefore, MICE was used to estimate missing values while preserving statistical relationships among variables.
Prior to imputation, the missing data ratios were as follows: confining pressure (), temperature (), depth (), and porosity (). The application of MICE relies on the assumption that the data are Missing at Random (MAR), meaning the probability of a value being missing is related to the observed variables rather than the unobserved data itself. While MICE effectively preserves inter-variable dependencies, it inherently introduces a degree of imputation uncertainty which propagates into the final predictive models.
MICE is an iterative imputation technique in which each incomplete variable is modeled conditionally using the remaining available variables in the dataset. The imputation procedure was performed over 100 iterations to improve convergence and stability of the estimated values. Following imputation, the number of complete usable records increased from 42 to 62 for breakthrough pressure modeling and from 58 to 90 for permeability modeling, representing improvements of 47.6% and 55.2%, respectively. This allowed a larger proportion of the available literature data to be retained while avoiding the information loss associated with complete-case deletion.
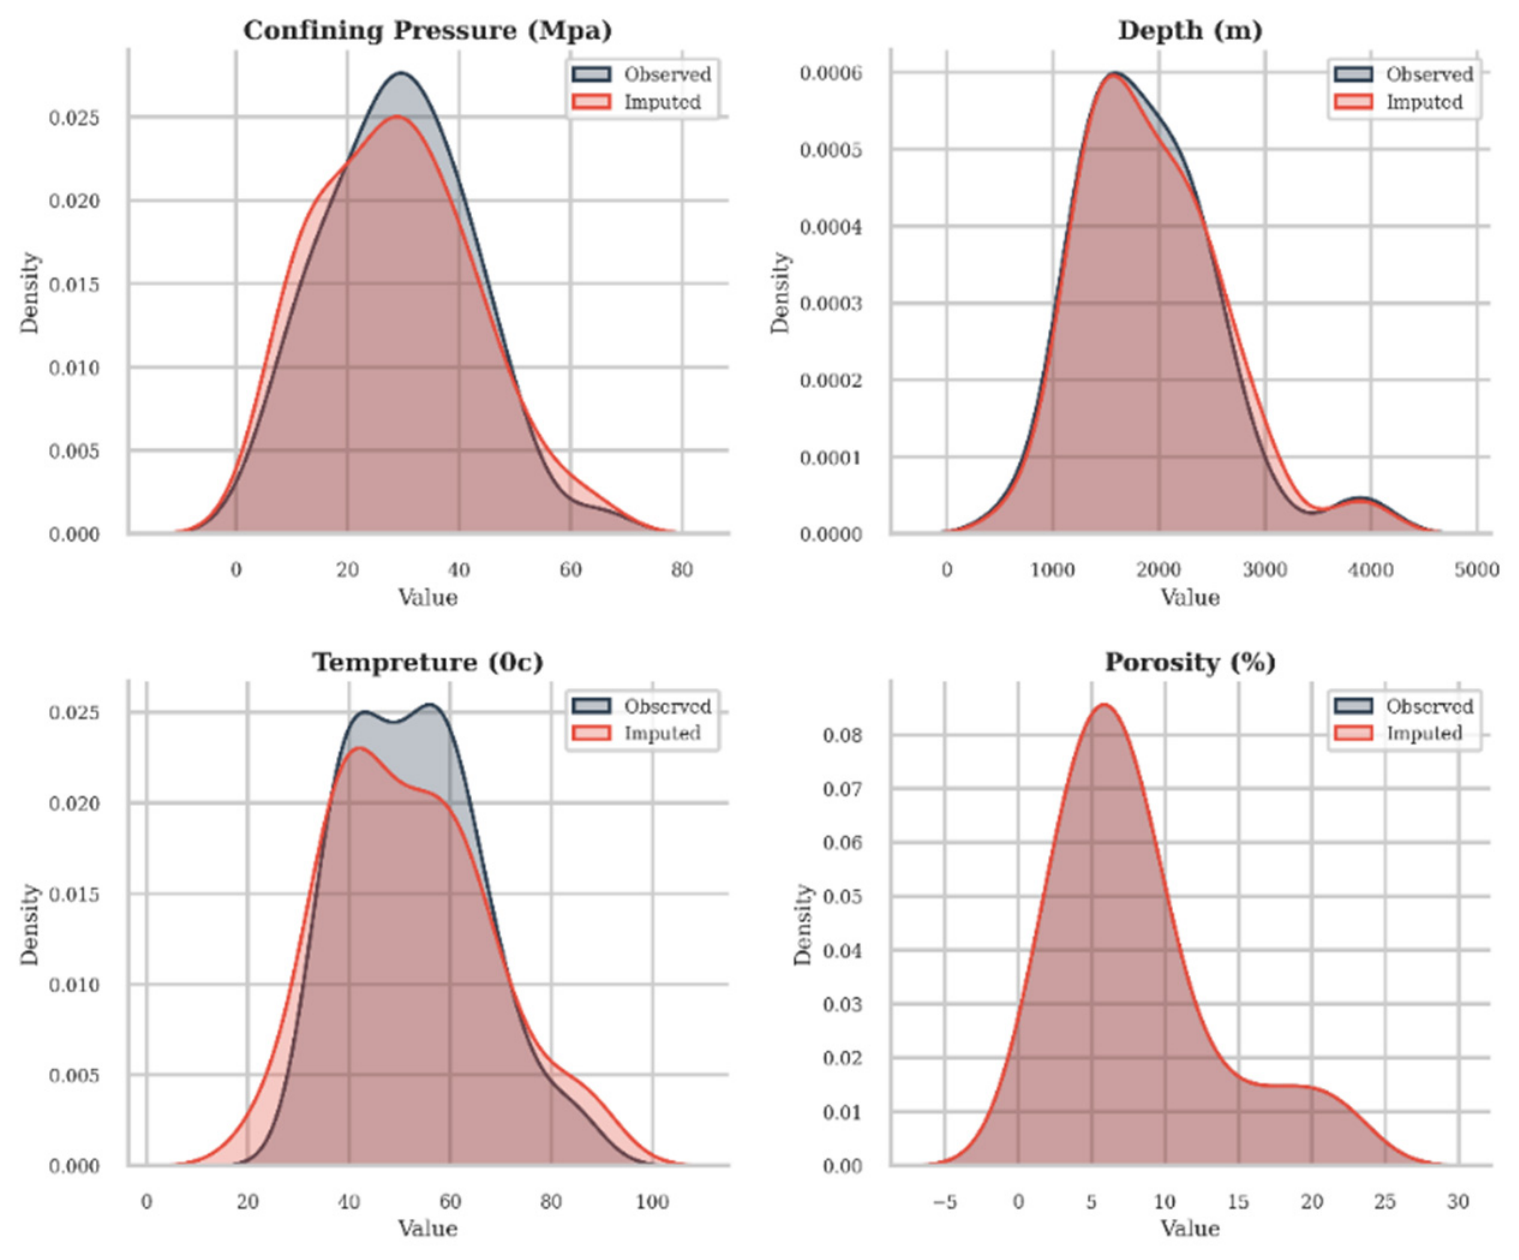
The quality of the MICE imputation was verified by comparing the density distributions of observed and imputed values for key variables, as shown in
Figure 1, confirming that the imputed data maintains the statistical characteristics of the observed dataset.
2.3. Permeability Analysis
Permeability analysis was carried out to evaluate the factors controlling fluid-flow potential through caprock formations. Because permeability values spanned several orders of magnitude, a logarithmic transformation was applied before statistical analysis. This transformation reduced the effect of extreme values and improved the suitability of the data for regression-based modeling. Both Pearson and Spearman correlation analyses were performed to examine relationships between log-transformed permeability and the selected input variables. Pearson correlation was used to identify linear associations, while Spearman correlation was used to evaluate monotonic relationships that may not be strictly linear. Spearman’s correlation was prioritized for interpretation because caprock permeability is commonly influenced by nonlinear effects related to pore structure, stress history, lithological heterogeneity, and fracture development. Therefore, the permeability analysis focused on identifying both direct and nonlinear trends between permeability and porosity, depth, and temperature.
2.4. Breakthrough Pressure Analysis
Breakthrough pressure analysis was conducted to evaluate the caprock sealing capacity against CO2 entry. Breakthrough pressure was treated as a direct indicator of capillary sealing resistance because it represents the minimum pressure required for CO2 to penetrate the water-saturated pore network of the caprock. The analysis considered confining pressure, temperature, depth, and porosity as the primary influencing variables.
Pearson and Spearman correlation analyses were used to quantify the strength and direction of relationships between breakthrough pressure and the selected input variables. Attention was given to confining pressure and temperature because these variables are closely related to reservoir stress conditions, pore throat closure, interfacial properties, and pressure-dependent sealing behavior. A comparative analysis was then performed to evaluate the relative influence of each variable on breakthrough pressure and to determine whether breakthrough pressure provides a more systematic sealing indicator than permeability.
2.5. Predictive Modeling Framework
Following the statistical analyses, predictive models were developed for both permeability and breakthrough pressure using a multi-model framework. Four modeling approaches were employed and compared: (1) Linear Regression as a baseline model, (2) Nonlinear regression models to capture nonlinear relationships and parameter interactions, (3) a basic Neural Network (NN) to explore deep pattern recognition within the dataset, and (4) a Physics-Informed Residual Model that integrates domain knowledge of caprock behavior with data-driven residual corrections to improve physical consistency of predictions. The multi-model framework was adopted to enable a structured comparison between conventional statistical approaches and more advanced hybrid techniques, ensuring that the relative advantages and limitations of each modeling strategy could be assessed within a unified analytical context. Model performance was evaluated using the coefficient of determination (R
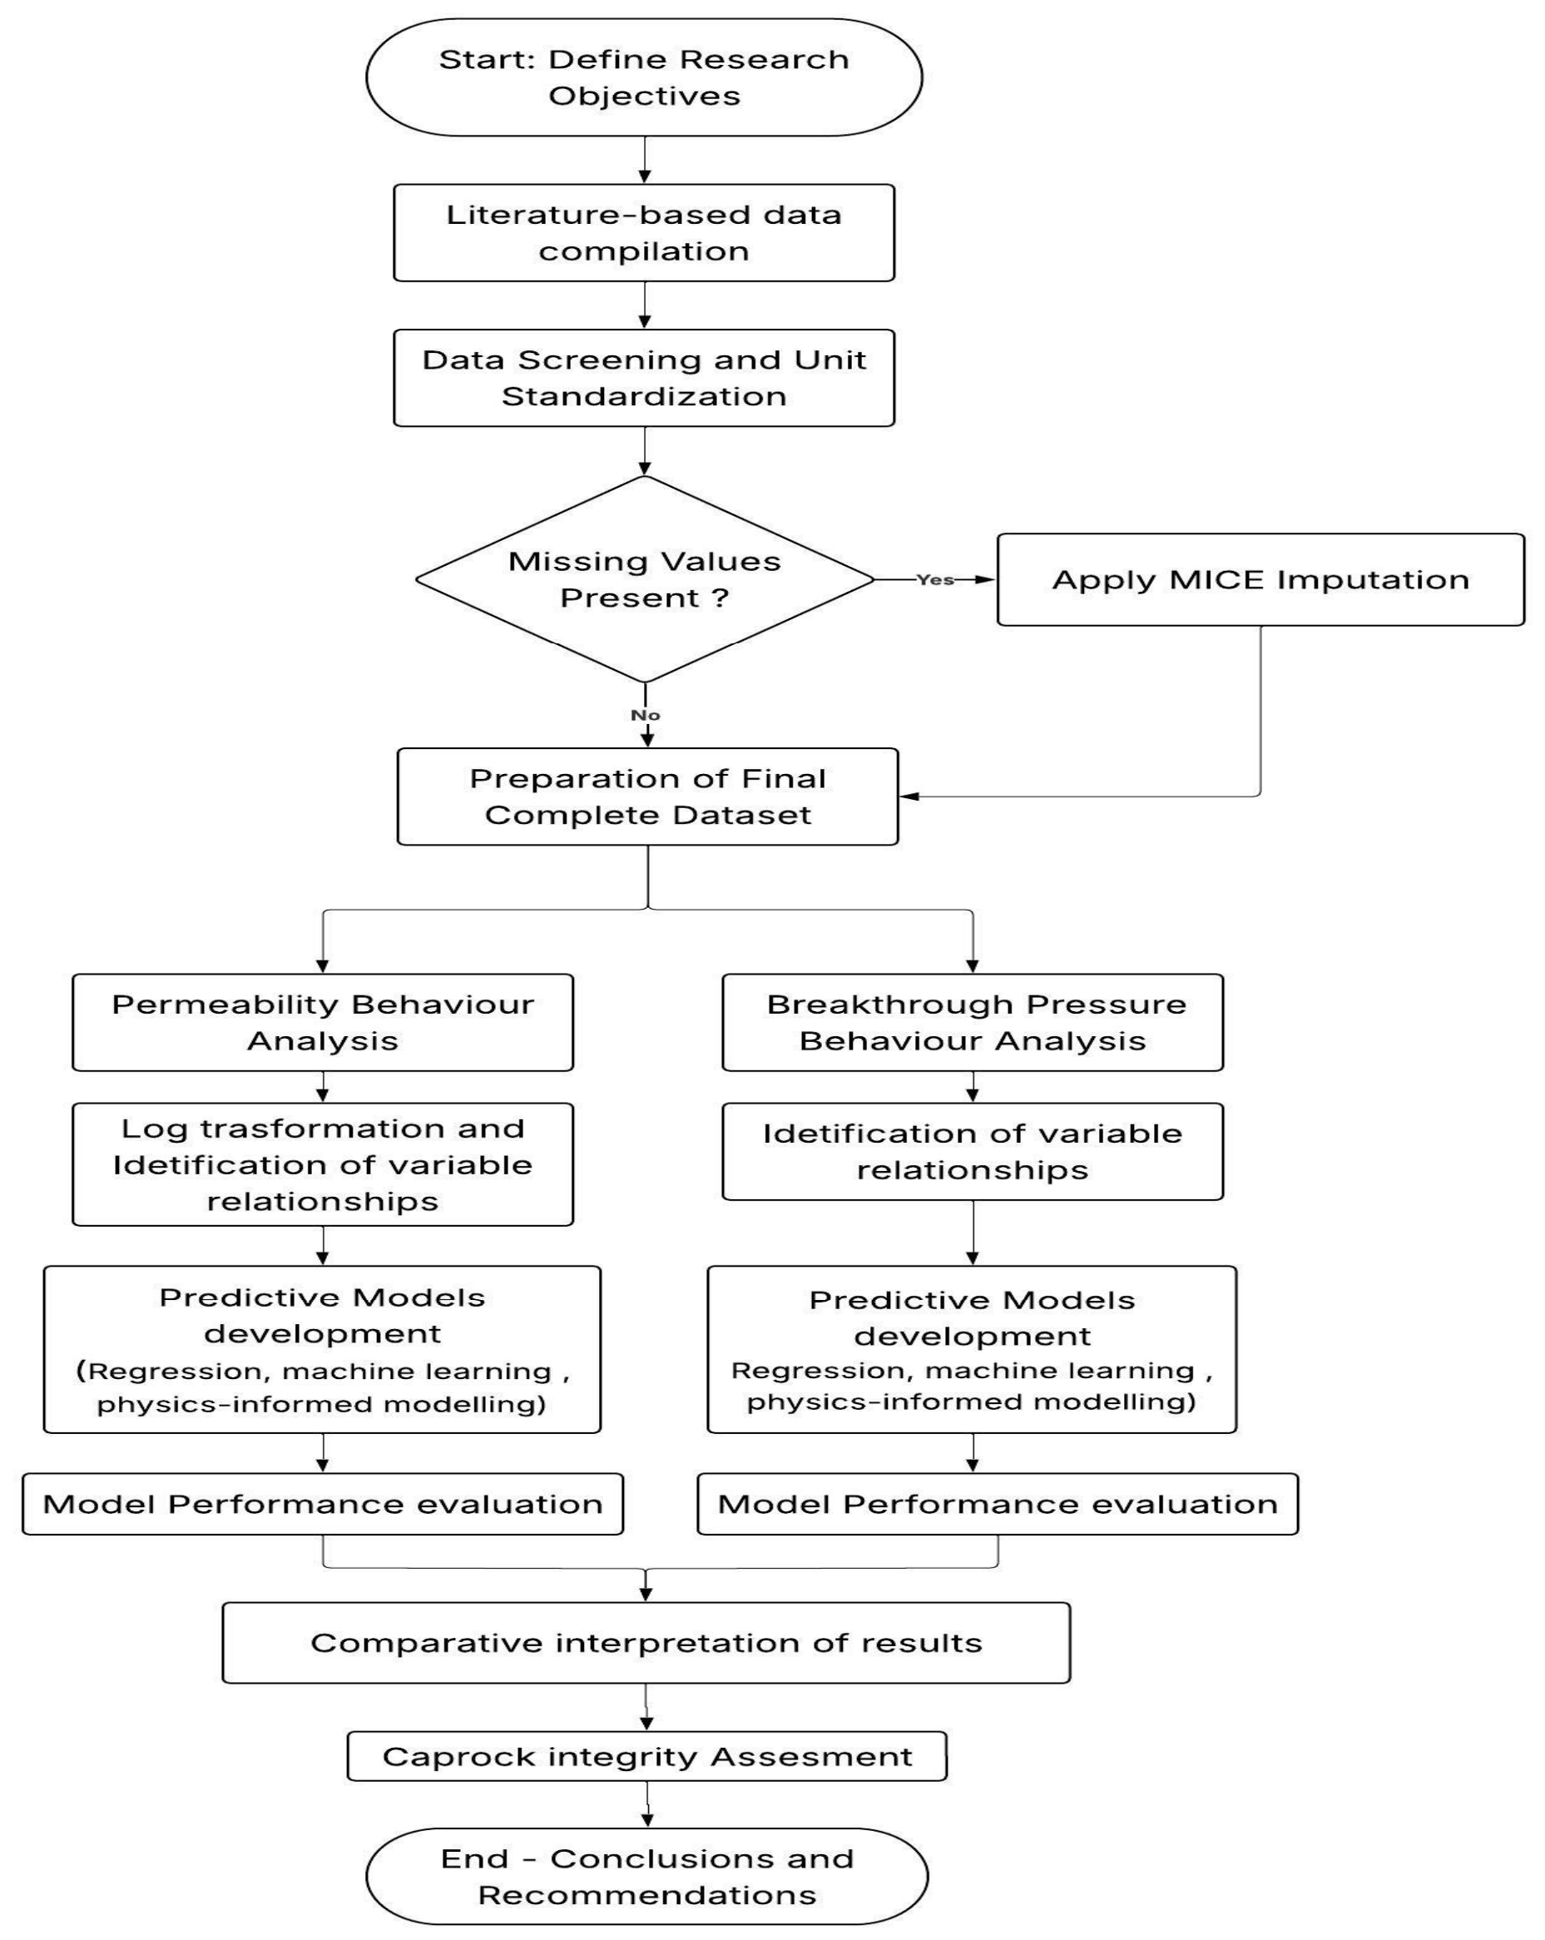
2) and mean absolute error (MAE) to assess predictive accuracy and compare modeling approaches across both analyses. The methodological framework is illustrated in
Figure 2.
To prevent severe information leakage, data preprocessing, including logarithmic transformations and feature scaling, was independently fitted on the training set and subsequently applied to the test set. However, due to the constrained sample size of the meta-analysis, MICE imputation was applied to the entire dataset prior to splitting to ensure convergence of the chained equations. This represents a standard and necessary methodological compromise in small-sample geo-mechanical studies to maintain statistical stability during missing-data estimation.
3. Results and Discussion
3.1. Permeability Analysis
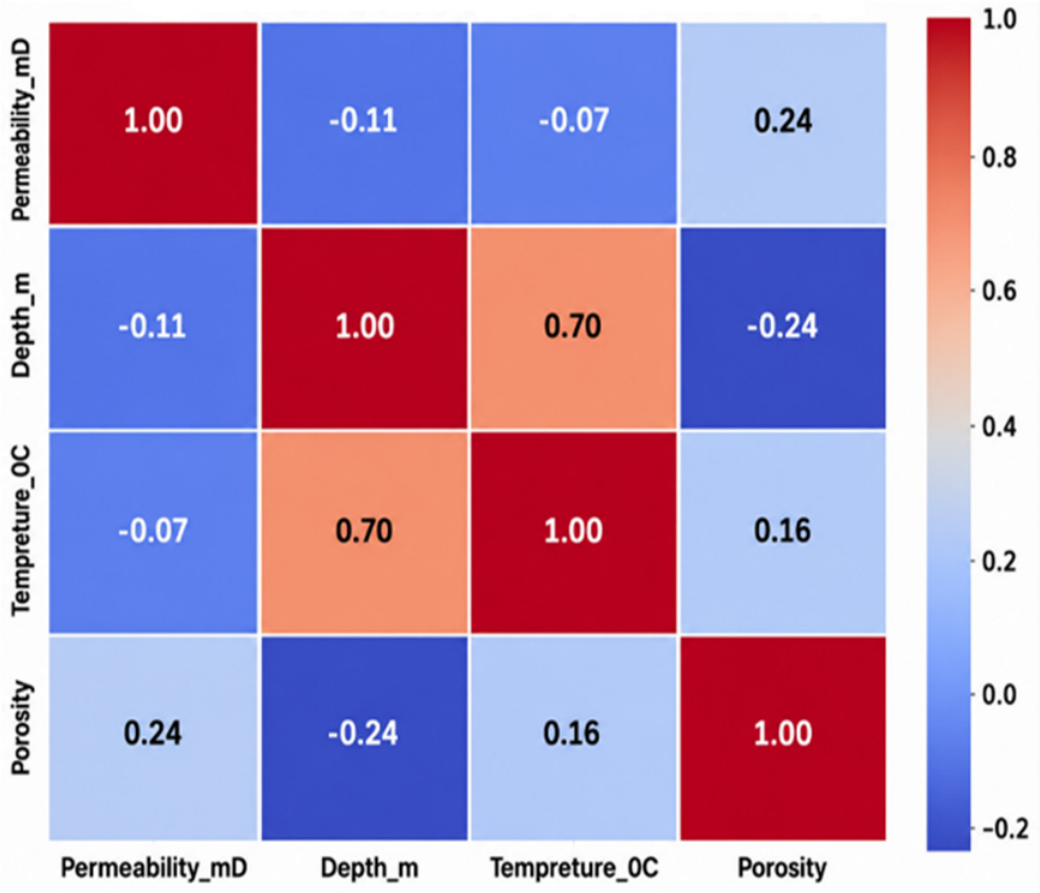
Permeability analysis was conducted to evaluate fluid flow behavior within caprock formations using a dataset compiled from multiple literature sources. Due to the wide variation in permeability values spanning several orders of magnitude, a logarithmic transformation was applied prior to analysis to normalize the distribution. To examine variable relationships, both Pearson and Spearman correlation analyses were performed. Spearman correlation was prioritized given the non-linear nature of the data and is presented in
Figure 3.
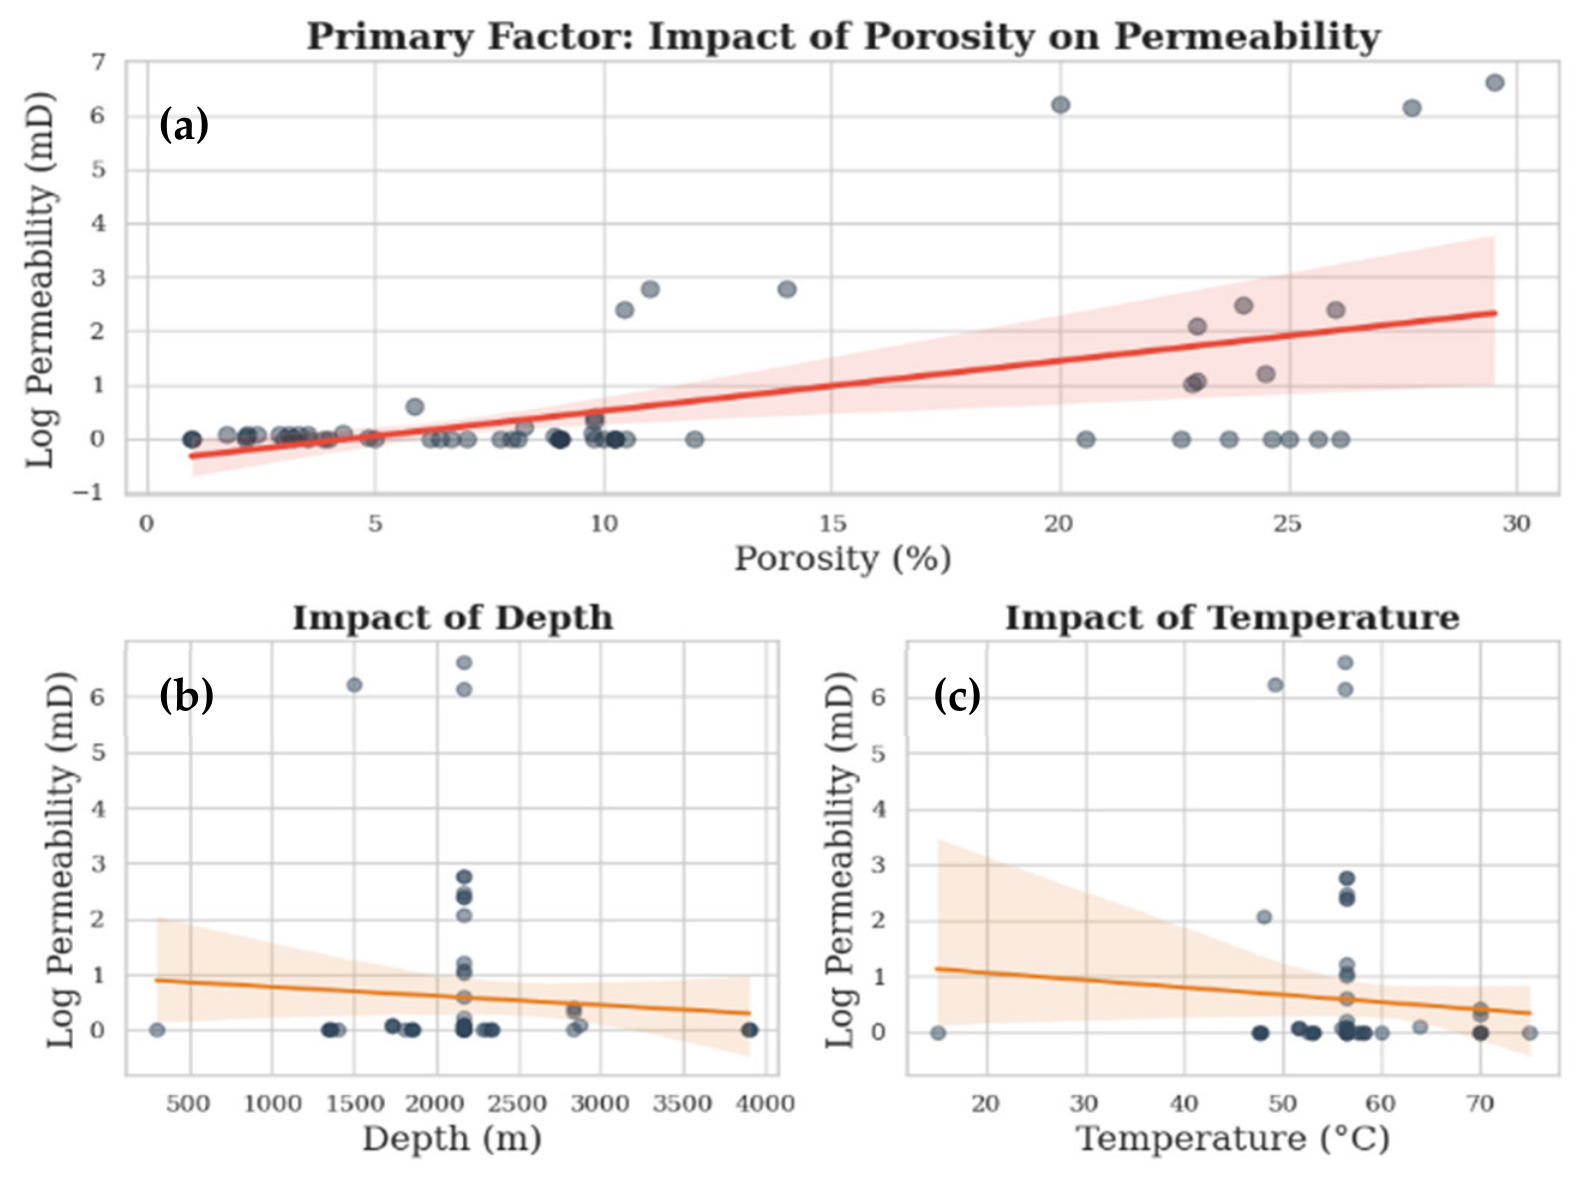
The results indicate weak to moderate relationships overall. Porosity shows a moderate positive association with log-transformed permeability (ρ ≈ 0.24), where ρ represents the Spearman correlation coefficient, which measures the strength and direction between variables. Depth and temperature exhibit weak correlations (ρ ≈ −0.11 and −0.07, respectively), suggesting limited direct linear influence within the dataset. These relationships are further illustrated through pairwise scatter plots in
Figure 4.
The pairwise scatter plots show considerable dispersion, with no strong linear relationship between log-transformed permeability and the selected input parameters. This reflects the heterogeneous nature of caprock formations, where permeability is influenced not only by porosity, depth, and temperature, but also by lithology, pore connectivity, fracture networks, and stress history. Ordinary Least Squares (OLS) regression was first applied using porosity, depth, and temperature as predictors of log-transformed permeability. The model produced limited explanatory power, with R2 ≈ 0.29, confirming that permeability could not be reliably predicted using a simple linear relationship. Among the selected predictors, porosity showed the most meaningful statistical contribution, supporting its role in controlling pore volume and flow capacity.
Depth and temperature showed strong multicollinearity, as indicated by high Variance Inflation Factor (VIF) values. This suggests that their individual regression coefficients should be interpreted cautiously because both variables are related to burial and thermal conditions. Polynomial regression did not improve model performance, indicating that the observed permeability variation is controlled by complex geological heterogeneity rather than by simple nonlinear trends alone. This weak predictive performance is consistent with previous caprock studies showing that permeability is highly site-specific and commonly governed by pore connectivity, lithological variation, fracture networks, and stress-dependent flow pathways [
10,
11]. SHapley Additive exPlanations (SHAP)-based sensitivity analysis using the Gradient Boosting model further indicated that depth and porosity were influential variables in permeability prediction. However, these effects should be interpreted as model-based sensitivity trends rather than universal physical relationships because permeability anomalies are highly site-specific and dependent on local geological conditions.
The Physics-Informed Residual Model provided the strongest predictive performance among all approaches applied to the permeability dataset. This model operates in two stages: a base physical model constructed using porosity as the primary input variable, grounded in the established relationship between pore volume and fluid flow capacity in fine-grained caprocks, followed by a data-driven residual correction that models the systematic deviations between base model predictions and observed permeability values as a function of depth and temperature. As shown in
Figure 5, the base physical model achieved R
2 = 0.28, capturing the primary porosity-driven trend but leaving substantial variance unexplained due to the heterogeneous nature of the compiled dataset. The addition of the depth-temperature residual correction improved overall model performance to R
2 = 0.77, representing a 48.7% gain and confirming that the unexplained variance was systematic and physically meaningful rather than random noise. A neural network model achieved an intermediate R
2 of 0.424, with limited performance attributable to the small dataset size, which constrains the generalization capacity of purely data-driven approaches.
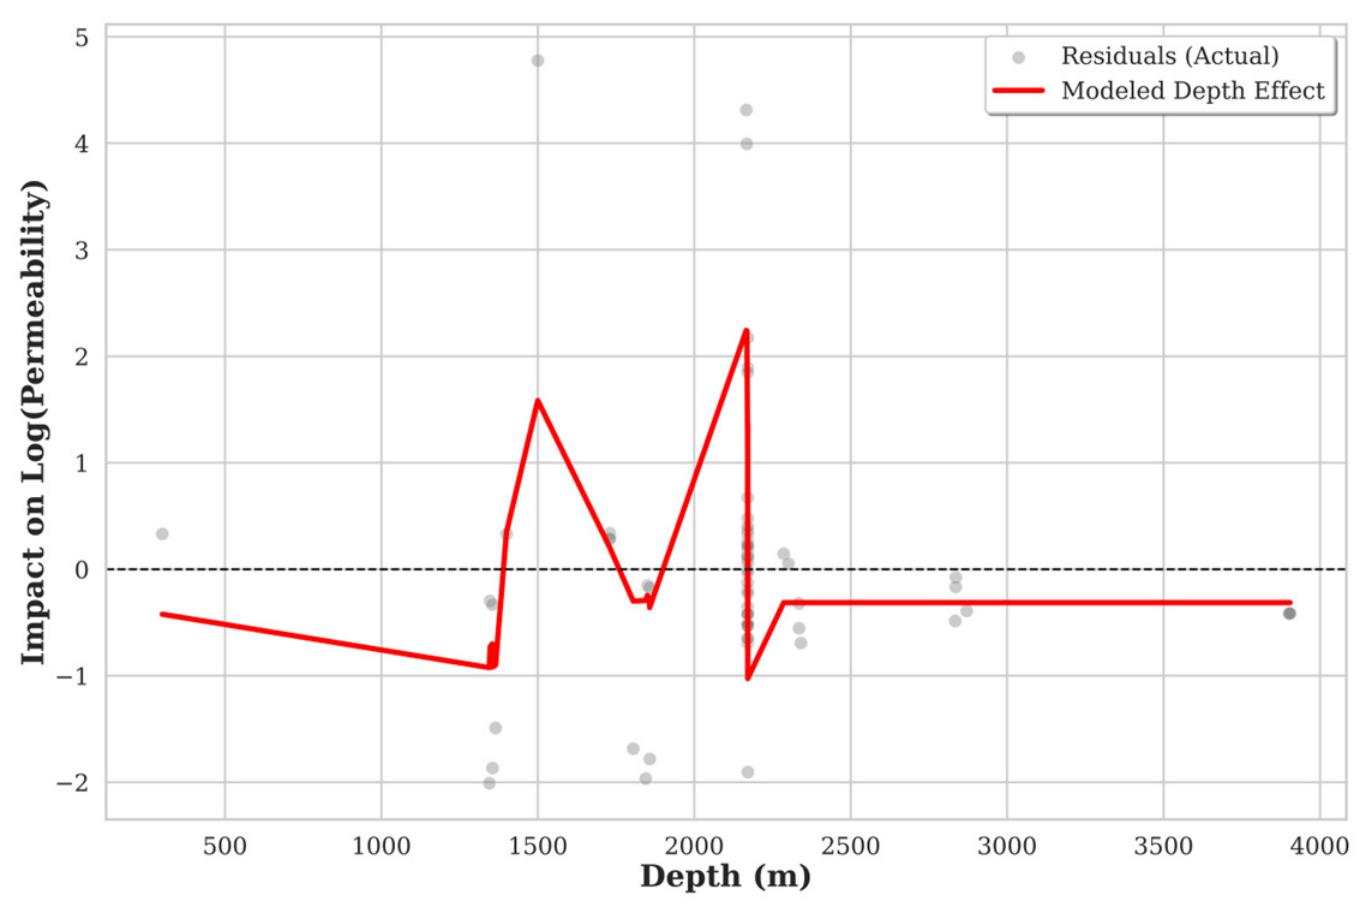
Residual analysis further identified two depth intervals, approximately 1400–1600 m and 2100–2300 m, that exhibited elevated permeability responses within the compiled dataset. To describe these localized deviations, a dataset-specific depth-zone residual correction model was introduced by combining the background porosity-controlled trend with correction factors for the two identified depth intervals:
where (Log k) is the log-transformed permeability response, ϕ is porosity (%),
is an indicator variable for the depth interval 2100–2300 m,
and
is an indicator variable for the depth interval 1400–1600 m,
where
denotes depth.
The correction factors indicate that the elevated permeability responses are not fully explained by porosity alone and may reflect localized fracture networks, lithological transitions, or site-specific stress and diagenetic histories represented in the source studies. Similar localized permeability deviations have been reported in caprock and fault-sealing studies, where fracture development, lithological transitions, and fault-related flow pathways can produce permeability responses that deviate from simple burial-compaction trends [
11,
13]. Because this depth-zone residual correction is heavily over-fitted to the anomalies of the compiled dataset, it cannot be presented as a generally applicable predictive model. Its robustness must be subjected to rigorous cross-validation against independent, external datasets before broader application. Overall, the results confirm that permeability does not follow a simple burial-compaction trend across heterogeneous caprock systems. Therefore, although porosity remains an important controlling parameter, permeability should be assessed together with complementary sealing indicators such as breakthrough pressure.
3.2. Breakthrough Pressure Analysis
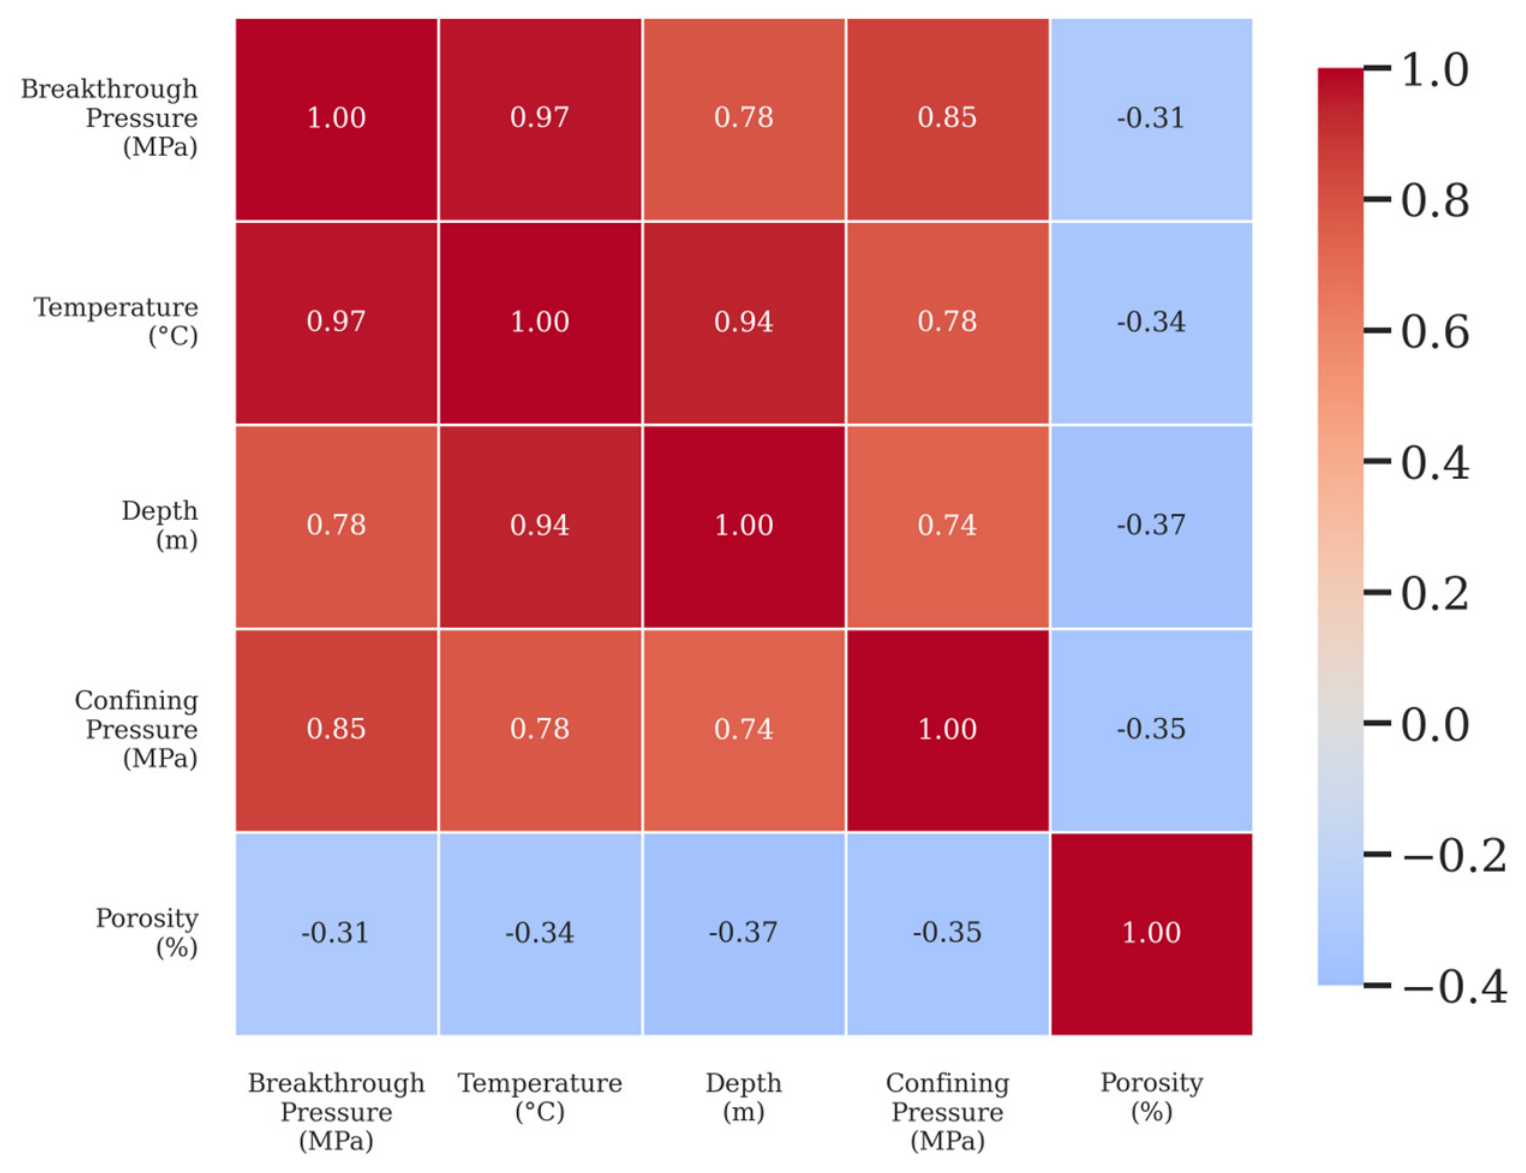
Breakthrough pressure analysis was conducted as a direct measure of caprock sealing capacity. Compared to the permeability dataset, breakthrough pressure values were fully observed across all records, with only minor missing values, all of which were addressed using MICE prior to analysis. To examine relationships between variables, both Pearson and Spearman correlation analyses were performed, with Spearman’s correlation presented in
Figure 6 due to the non-linear characteristics of the dataset.
The results indicate stronger relationships compared to the permeability analysis. Temperature shows a strong positive correlation with breakthrough pressure (ρ = 0.97), followed by confining pressure (ρ = 0.85) and depth (ρ = 0.78), highlighting the dominant role of thermomechanical subsurface conditions in controlling sealing capacity. In contrast, porosity exhibits a moderate negative relationship (ρ = −0.31), suggesting that increased pore space reduces resistance to CO
2 penetration, consistent with capillary sealing theory. This behavior agrees with capillary-sealing studies showing that higher confining pressure can reduce pore-throat aperture and increase CO
2 entry pressure, whereas greater porosity can reduce capillary resistance [
15,
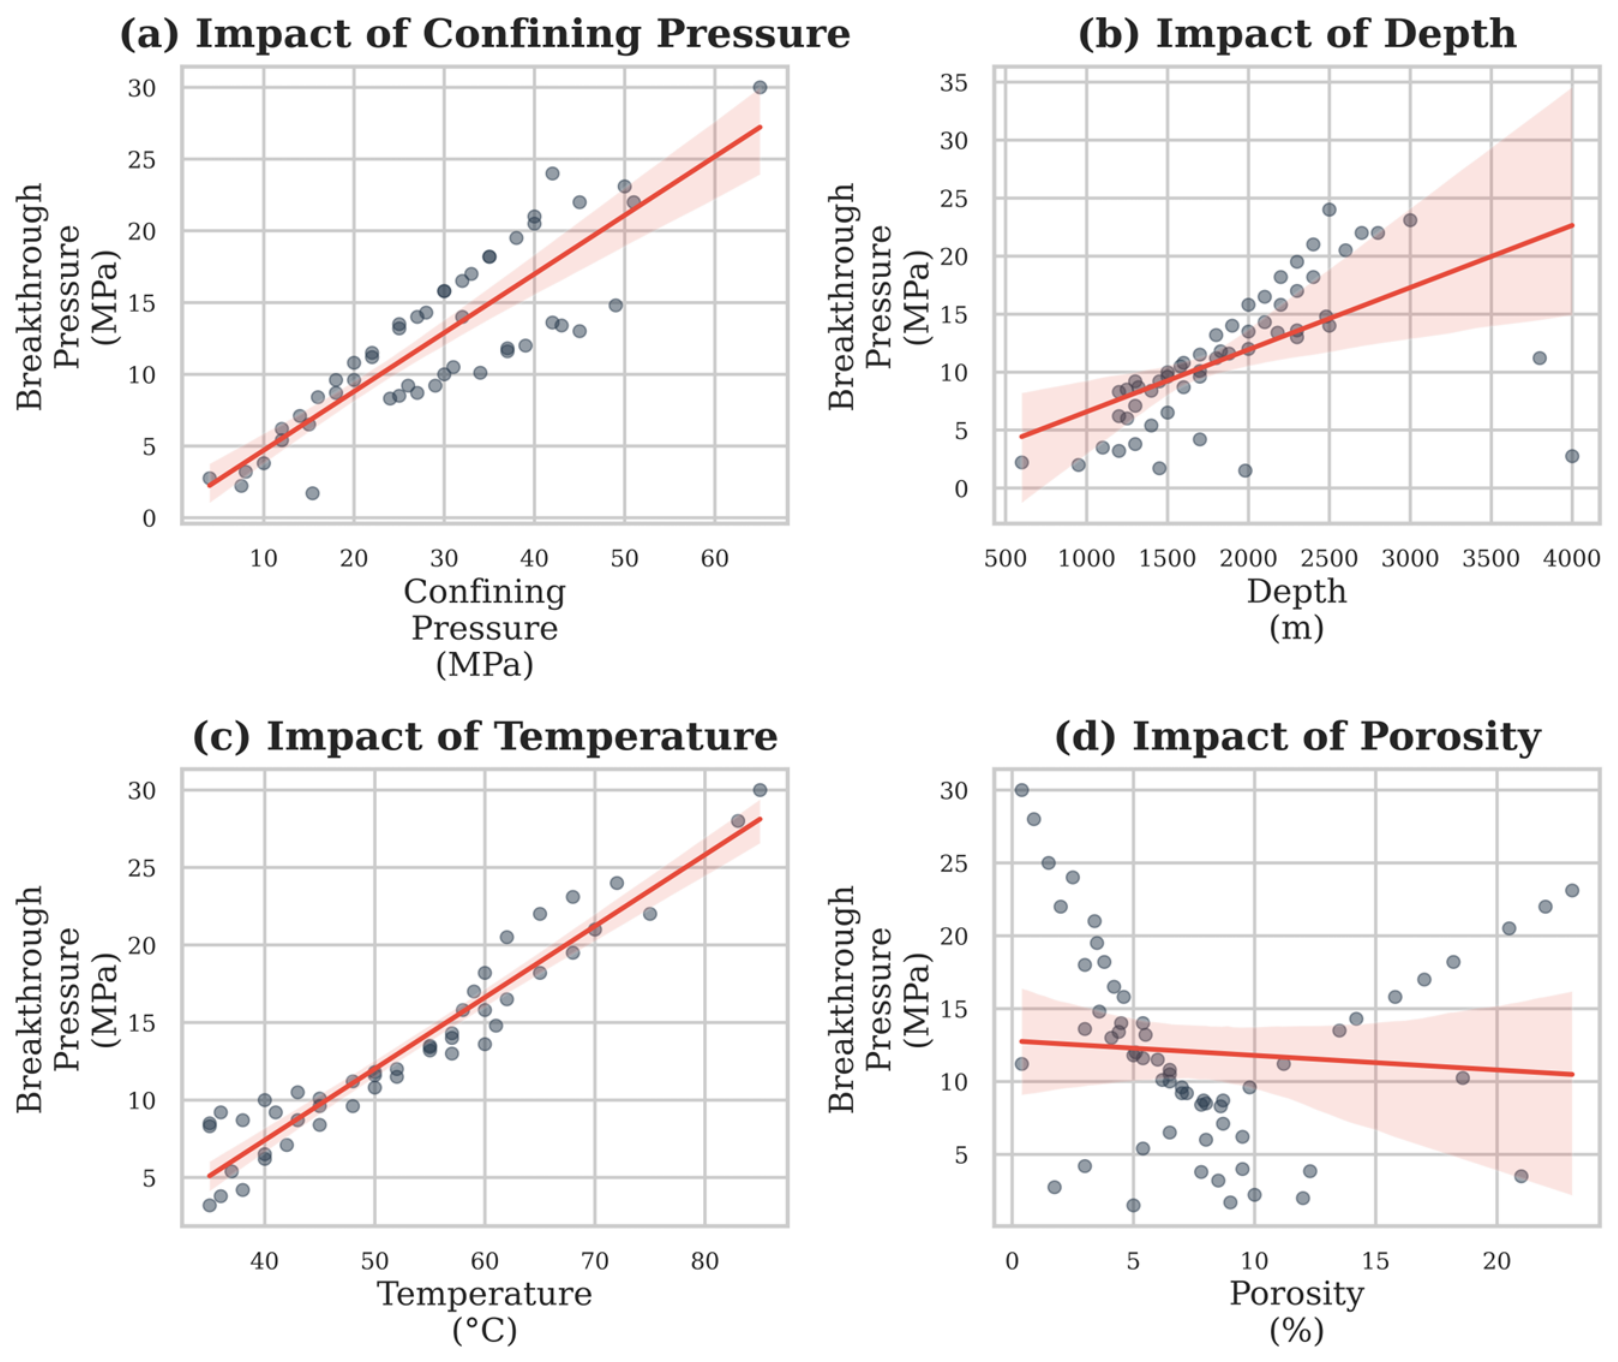
17]. These trends are further illustrated in the pairwise plots shown in
Figure 7.
The scatter plots in
Figure 7 confirm clear and consistent positive trends between breakthrough pressure and confining pressure, temperature, and depth, with significantly less dispersion compared to the permeability analysis. This indicates that breakthrough pressure is more systematically governed by the selected parameters. The negative relationship with porosity is also visible, though with greater scatter reflecting natural geological heterogeneity.
Regression analysis further supports these observations. OLS regression using all predictors achieved high explanatory power (R
2 = 0.975), indicating that the selected variables capture most of the variability in breakthrough pressure. Confining pressure and temperature were the dominant predictors, while depth had an indirect influence due to its strong correlation with subsurface stress conditions (VIF > 100). Polynomial regression using confining pressure achieved R
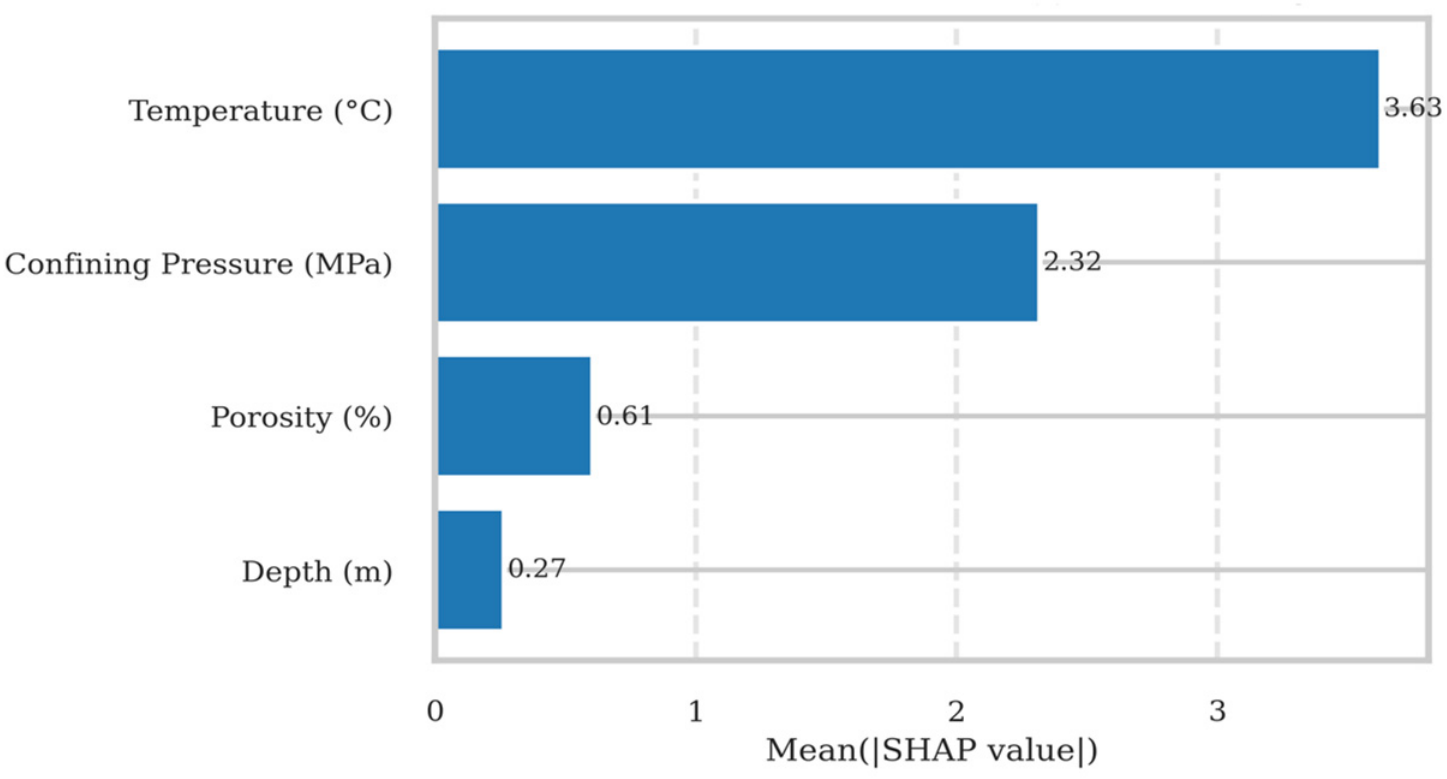
2 = 0.818; however, higher-order terms were not statistically significant, confirming that the relationship between confining pressure and breakthrough pressure is predominantly linear within the observed range. SHAP-based feature importance analysis using the trained Gradient Boosting model was conducted to interpret the relative contribution of each input variable to breakthrough pressure prediction, as shown in
Figure 8. Temperature produced the highest mean absolute SHAP value, followed by confining pressure, indicating that these two variables had the strongest influence on the model prediction. Porosity and depth showed comparatively lower mean absolute SHAP values, suggesting smaller individual contributions within the trained model. The dominant role of temperature is physically reasonable because reservoir temperature can influence CO
2 density, brine properties, interfacial behavior, and thermo-mechanical caprock response [
5,
22]. From a petrophysical perspective, elevated reservoir temperatures directly reduce CO
2 density and alter brine viscosity, which subsequently modifies the interfacial tension between the CO
2 and formation fluids, critically governing capillary entry resistance.
The severe multicollinearity between depth and temperature (VIF > 100) complicates strict feature importance interpretation. In tree-based models, correlated features can share importance, meaning the high SHAP value for temperature likely absorbs some of the physical variance inherently driven by burial depth. Therefore, temperature and depth should be interpreted as a coupled thermo-mechanical driver rather than entirely independent variables.
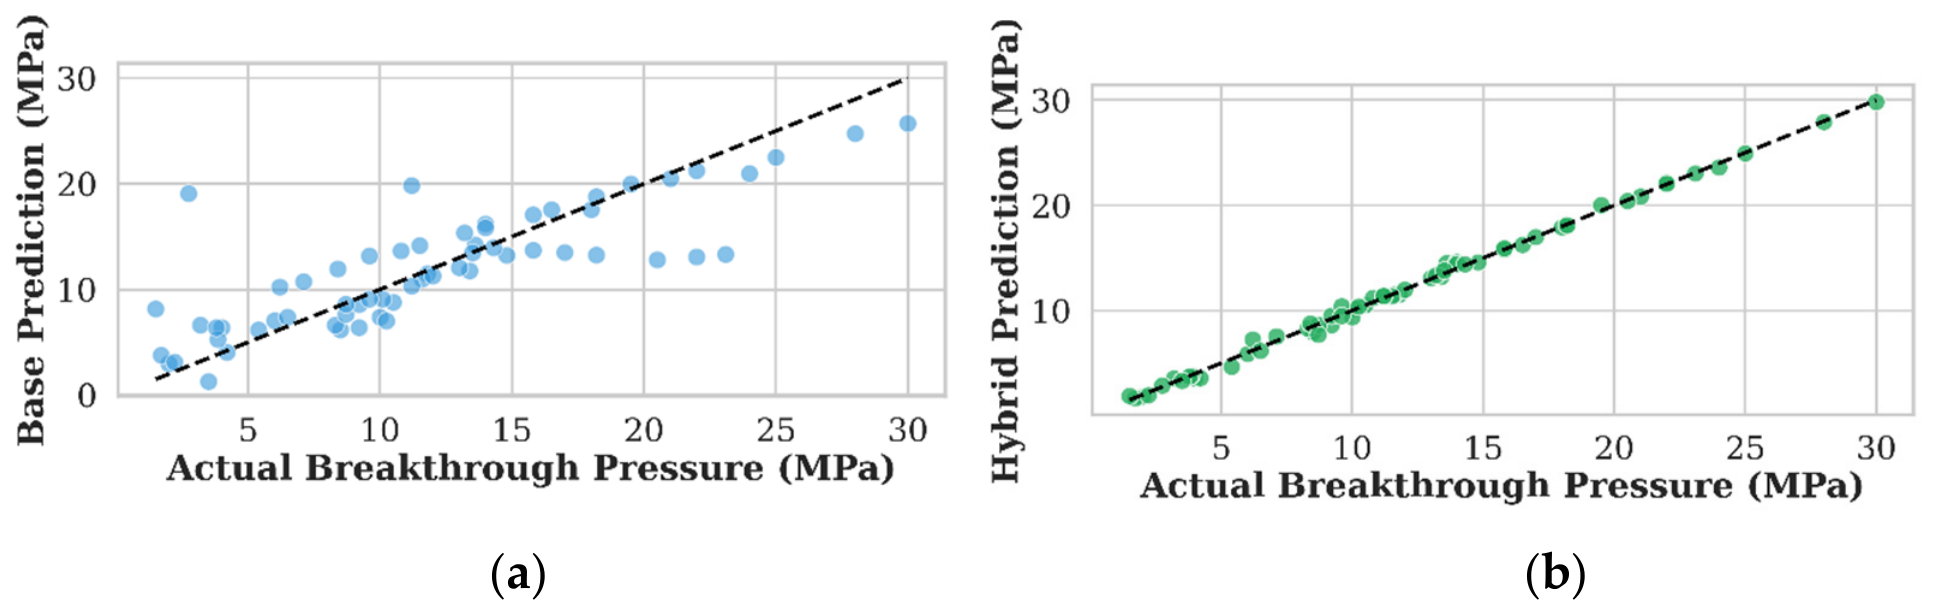
The Physics-Informed Hybrid Model produced the strongest predictive performance, as illustrated in
Figure 9. This model operates in two stages: a base physical model driven by depth and temperature as macro-scale geological drivers, followed by a data-driven residual correction incorporating confining pressure and porosity as pore-scale mechanical parameters. The base physical model achieved moderate performance of R
2 = 0.688, capturing the broad depth and temperature-driven trends in breakthrough pressure but leaving residual variance attributable to stress and pore-structure effects. The addition of the residual correction significantly improved predictive accuracy to R
2 = 0.997, demonstrating that combining macro-scale geological drivers with pore-scale mechanical parameters effectively captures the underlying behavior of breakthrough pressure within the compiled dataset. It is critical to note that the R
2 of 0.997 achieved by the hybrid model represents training performance only. Given the limited dataset size, this near-perfect fit may indicate overfitting. Therefore, this hybrid model serves primarily to demonstrate the theoretical alignment of physical and statistical parameters, rather than acting as a highly generalizable predictive tool.
Given the limited dataset size and the poor generalization capacity observed with the neural network approach, LASSO-based polynomial regression was adopted as a more stable and interpretable alternative for deriving an empirical predictive equation for breakthrough pressure. The LASSO model incorporated all four input variables: confining pressure (C), temperature (T), depth (D), and porosity (φ), and selected the most influential polynomial terms through regularization, producing the following empirical equation:
where P
b is the breakthrough pressure (MPa); C is the confining pressure (MPa); T is the temperature (°C); D is depth (m); and φ is porosity (%). The model achieved a training R
2 of 0.78, a test R
2 of 0.71, and a MAE of 2.3087 MPa, demonstrating acceptable predictive accuracy and reasonable generalizability relative to the training performance. The moderate gap between training and test R
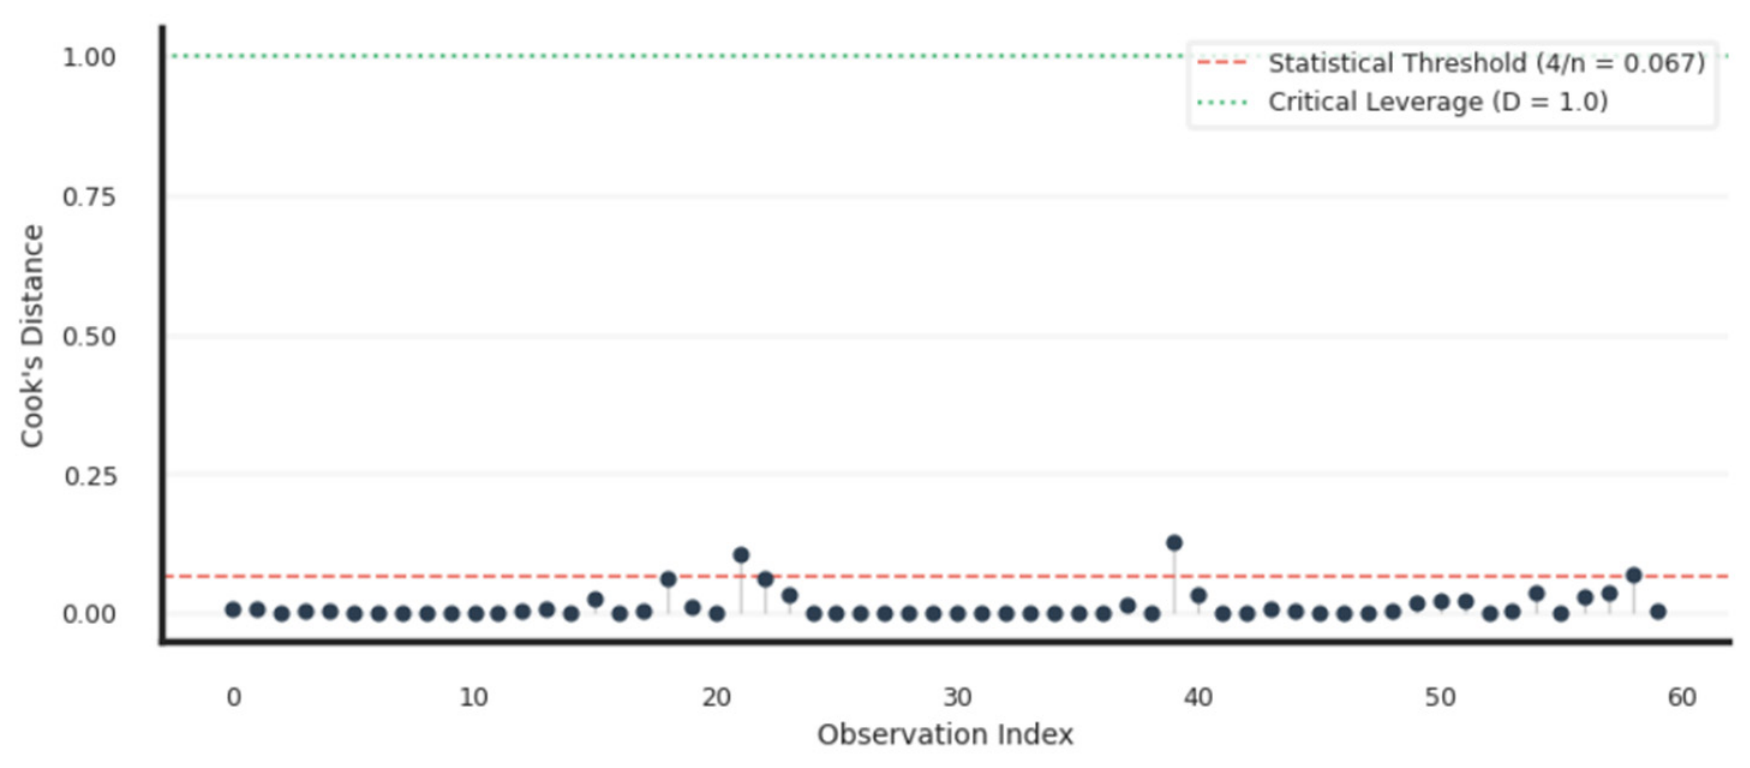
2 confirms that the model generalizes adequately without significant overfitting, making it more suitable for the limited dataset size than the neural network approach. To ensure the safe application of this empirical equation for preliminary site screening, it must strictly be applied within the parameter ranges of the training dataset: Porosity (0.5–25%), Depth (500–4000 m), Temperature (15–90 °C), and Confining Pressure (5–60 MPa). Extrapolating beyond these bounds removes the statistical validity of the correlation. This equation provides a practical and interpretable tool for preliminary breakthrough pressure estimation based on measurable subsurface parameters. Furthermore, a leverage analysis using Cook’s Distance was conducted to ensure model stability (
Figure 10), confirming that the empirical coefficients were not disproportionately driven by isolated high-leverage observations in the compiled dataset.
Overall, the breakthrough pressure analysis demonstrates that caprock sealing capacity is strongly and consistently governed by confining pressure and temperature, with depth playing a secondary but meaningful role. Compared to permeability, breakthrough pressure exhibits more predictable and systematic relationships with the selected variables, confirming its reliability as a primary indicator of caprock sealing performance in geological CO2 sequestration systems.
3.3. Comparative Analysis
The comparative analysis shows a clear difference between the predictability of permeability and breakthrough pressure. Permeability exhibited weak performance in OLS and polynomial regression, with R2 values of approximately 0.29, reflecting the influence of lithological heterogeneity, fracture networks, and local pore-structure variability. In contrast, breakthrough pressure showed substantially stronger regression performance, with OLS achieving R2 = 0.975, indicating that the selected variables captured the major controls on capillary sealing resistance.
The neural network models did not outperform the simpler approaches for either parameter, suggesting that the available dataset was insufficient for purely data-driven deep learning models. This limitation was more evident for breakthrough pressure, where the neural network produced lower performance than the physics-informed and regularized regression approaches.
The physics-informed models provided the strongest overall performance for both parameters. For permeability, the residual model improved R2 from 0.281 to 0.768, indicating that depth- and temperature-dependent residual corrections captured systematic geological effects not explained by porosity alone. For breakthrough pressure, the physics-informed hybrid model improved R2 from 0.688 to 0.997, demonstrating that combining macro-scale geological drivers with pore-scale mechanical parameters provides an effective representation of sealing behavior.
Overall, breakthrough pressure was more predictable than permeability because it directly represents capillary entry resistance, whereas permeability is more strongly affected by local heterogeneity and fracture-controlled flow paths. This interpretation is consistent with previous caprock integrity studies, which emphasize that permeability represents potential leakage through connected flow paths, while breakthrough pressure provides a more direct measure of capillary entry resistance and sealing efficiency [
15,
21].
A consolidated summary of the key quantitative outcomes across both analyses, including model performance and physical interpretation, is presented in
Table 2.
3.4. Uncertainty Analysis and Model Limitations
While the proposed data-driven framework offers strong predictive capabilities for preliminary site screening, it relies on macroscopic variables that necessitate physical simplifications. A primary limitation is the absence of microscopic pore structure parameters in the compiled literature, which restricts a complete mechanistic interpretation of capillary resistance and contributes to observed data dispersion. Furthermore, the dataset integrates various fine-grained caprocks without explicit mineralogical classification, introducing systematic predictive bias since varying clay and carbonate contents fundamentally alter rock wettability and interfacial tension. The models also omit sedimentary facies constraints, representing an additional source of unquantified uncertainty. Finally, substituting simple burial depth and temperature for complex diagenetic and tectonic evolution, which can induce matrix-bypassing fractures, means the applicability of these empirical equations must be strictly constrained to matrix-dominated, fracture-free systems. Ultimately, applying these models beyond the current parameter ranges carries unvalidated extrapolation risks, necessitating rigorous, localized characterizations of mineralogy and diagenetic history for future site-specific engineering applications.
4. Conclusions
This study evaluated the role of caprock integrity in geological CO2 sequestration using a data-driven meta-analysis of permeability and breakthrough pressure as the two main indicators of sealing performance. The findings show that caprock behavior cannot be fully understood using a single parameter, as sealing capacity is controlled by a combination of geological, hydraulic, thermal, and mechanical factors.
Permeability analysis showed weak linear predictability, with the OLS model producing an R2 of 0.29. This indicates that permeability is highly sensitive to geological heterogeneity, fracture condition, lithological variation, and pore connectivity, making it difficult to predict using simple linear relationships. Although porosity was identified as the most consistent controlling parameter for permeability, it alone was insufficient to explain the full variation observed in the compiled dataset. The application of a Physics-Informed Residual Model improved permeability prediction to R2 = 0.77, demonstrating that combining a porosity-based physical trend with depth-related residual correction can better represent complex permeability behavior.
In contrast, breakthrough pressure showed stronger and more systematic relationships with the selected variables. It was positively associated with temperature, confining pressure, and depth, whereas porosity showed a negative relationship consistent with capillary-sealing theory. The OLS model achieved high training performance (R2 = 0.975), suggesting that the selected variables explain most of the observed variation. However, the presence of multicollinearity among depth, temperature, and confining pressure means that individual regression coefficients should be interpreted carefully. The Physics-Informed Hybrid Model achieved the highest training performance (R2 = 0.997), confirming that integrating broad subsurface conditions with caprock-specific properties can significantly improve model fit. A LASSO-derived empirical equation subsequently achieved a validated test R2 of 0.78 with a mean absolute error of 2.31 MPa on a held-out test set, providing the most generalizable predictive correlation for practical application.
The use of MICE imputation improved dataset usability by enabling retention of 90 permeability records and 62 breakthrough pressure records despite incomplete reporting across literature sources. Overall, breakthrough pressure is a more reliable primary indicator of caprock sealing capacity than permeability, because it directly represents the pressure required for CO2 to penetrate the caprock seal. Permeability remains important as a complementary hydraulic leakage-risk indicator but should not be used alone for caprock integrity assessment.
From an engineering perspective, the predicted breakthrough pressure can be utilized to establish operational safety margins for CO2 injection. Specifically, the maximum allowable injection pressure at the storage site must be strictly maintained below the predicted capillary entry pressure, typically incorporating a conservative safety factor to account for geological uncertainties and localized matrix heterogeneity. Similarly, the predicted permeability serves as a threshold indicator for site screening; caprock systems exceeding permeability targets should trigger intensified seismic and pressure monitoring protocols to ensure long-term containment integrity.
From a practical perspective, preliminary CO2 storage site screening should prioritize the measurement of breakthrough pressure, confining pressure, porosity, caprock continuity, lithology, and fracture conditions. The study also demonstrates that physics-informed modeling provides a useful framework for combining geological understanding with data-driven correction; however, independent validation is required before applying the models in operational storage projects.
While the random partitioning of the compiled dataset successfully establishes internal model consistency, it does not fully substitute for independent external validation. We acknowledge the inherent risk of latent biases within aggregated literature sources as a recognized constraint of meta-analytical frameworks. Consequently, the proposed predictive models are most appropriately deployed as foundational screening tools, intended to complement rather than replace rigorous, site-specific petrophysical investigations. To systematically isolate and quantify the impact of source-specific biases, future research should prioritize a ‘leave-one-source-out’ cross-validation methodology, alongside validation against field data from active injection operations.
Future research should focus on developing lithology-specific datasets by separating shale, mudstone, claystone, evaporites, and carbonate seals, allowing the influence of each rock type on permeability, breakthrough pressure, and mechanical strength to be assessed more accurately. Additional parameters such as clay mineral content, fracture density, bedding orientation, pore-throat size, and injection pressure should also be incorporated. Finally, the proposed modeling framework should be validated using independent laboratory datasets and field data from active CO2 storage projects to improve its reliability for long-term containment assessment.